the Creative Commons Attribution 4.0 License.
the Creative Commons Attribution 4.0 License.
 | 19 Jun 2026
Global methane emission estimates from a dual-isotope inversion: new constraints from δD-CH4
Bibhasvata Dasgupta
Sudhanshu Pandey
Sander Houweling
Malika Menoud
Carina van der Veen
John Miller
Ben Riddell-Young
Sylvia Englund Michel
Peter Sperlich
Shinji Morimoto
Ryo Fujita
Stephen Platt
Christine Groot Zwaaftink
Ingeborg Levin
Cordelia Veidt
Cathrine Lund Myhre
Ceres Woolley Maisch
Rebecca Fisher
Euan G. Nisbet
James France
Rowena Moss
Nicola Warwick
Thomas Röckmann
Methane (CH4) is a potent greenhouse gas; however, the causes of its growth since 2006 are a subject of debate. While measurements of CH4 mole fraction and carbon isotopic composition (δ13C-CH4) have been extensively used to investigate the global CH4 budget, the hydrogen isotopic composition (δD-CH4) remains underutilised despite its unique sensitivity to source types and oxidation processes. Here, we assimilate a newly harmonised 35-year dataset of dual isotope measurements from high-latitude monitoring stations in both hemispheres within a two-box Bayesian inversion to quantify global CH4 sources and sinks. The model integrates prior emissions from five source categories based on global bottom-up inventories. Methane removal processes are represented by sink-specific kinetic isotope effects as tropospheric and stratospheric loss, and soil uptake.
We find that the inclusion of δD-CH4 improves the model's ability to constrain emission apportionment between biogenic and thermogenic sources, particularly for fossil fuel emissions during the late 1990s and early 2000s, which affects CH4 lifetime estimate. CH4 increase post-2006 is driven mainly by rising wetland emissions, while fossil-fuel growth is modest, biomass burning declines, and agriculture and waste make smaller, regionalised contributions. The optimised inversion results favour a strong 13C kinetic isotope effect in total tropospheric CH4 removal and a net shortening of the NH lifetime of CH4 by 0.2 years. This study demonstrates the added value of incorporating δD-CH4 into inverse modelling frameworks and underscores the importance of long-term δD-CH4 measurements for advancing our understanding of CH4 biogeochemistry and its role in the global carbon cycle.
- Article
(4345 KB) - Full-text XML
-
Supplement
(2555 KB) - BibTeX
- EndNote


Quantification of methane (CH4) emissions from various source categories is critical for understanding the drivers of the ongoing climate change and identifying opportunities for mitigation. Two complementary approaches are commonly employed: bottom-up emission inventories, which aggregate source-specific activity data and emission factors, and top-down inverse modelling, which infers emissions from atmospheric mole fraction and increasingly includes isotopic measurements. Over the past decade, concerted efforts to reconcile these methods have considerably reduced overall uncertainty in the CH4 budget (Kirschke et al., 2013; Saunois et al., 2016, 2020, 2025). Nevertheless, the drivers of the observed variations in atmospheric CH4 remain a topic of scientific debate. Global atmospheric CH4 mole fractions stabilised during 2000–2006, a period attributed to a balance between emissions and atmospheric removal processes (Bousquet et al., 2011; Basu et al., 2022). However, since 2007, atmospheric CH4 concentrations have risen markedly, with multiple hypotheses proposed to explain this renewed growth. These include increased biogenic emissions from wetlands and agriculture, enhanced fossil fuel extraction and usage, and changes in atmospheric removal processes – most notably variations in the abundance of tropospheric hydroxyl radicals (OH) (Schwietzke et al., 2016; Worden et al., 2017; Houweling et al., 2017; Turner et al., 2017; Nisbet et al., 2019; Lan et al., 2021; Michel et al., 2024). However, the relative contributions of these factors and their change with time remain poorly constrained.
Measurements of the carbon isotopic composition of methane, δ13C-CH4, have long been incorporated into top-down models to distinguish between biogenic and thermogenic sources (Mikaloff Fletcher et al., 2004; Bousquet et al., 2006; 2011; Monteil et al., 2011; Rigby et al., 2012; Schaefer et al., 2016; Nisbet et al., 2016). δ13C-CH4 is sensitive to variations in organic substrate type (e.g., C3 vs. C4 vegetation) and formation pathways (e.g., biogenic vs. thermogenic vs. pyrogenic), providing distinct isotopic signatures for different source categories (Bellisario et al., 1999; Hornibrook and Bowes, 2007; Hornibrook, 2009). More recently, hydrogen isotopes (δD-CH4) have shown promise as an additional constraint due to their sensitivity to both source water isotopic composition and kinetic isotope effects (KIEs) during oxidation (Tyler et al., 2007; Warwick et al., 2016; Douglas et al., 2021; Riddell-Young et al., 2025). Studies incorporating δD-CH4 reveal that carbon and hydrogen isotope tracers can yield divergent source apportionments, underscoring the need for a dual-isotope approach. This finding is based on source characterisation studies that produce isotopic signatures (Fujita et al., 2020, 2025) and attribution studies that use dual-isotope constraints to partition emissions (Riddell-Young et al., 2025).
We employ a two-box Bayesian inversion model (Fig. 1) coupled with a discrete parameter tuning (DPT) strategy to a 35-year-long global CH4 isotope dataset that was recently synthesised from measurements at high northern and southern latitude stations (Dasgupta et al., 2025a), to evaluate the added value of δD-CH4 in constraining the global CH4 budget. Specifically, we investigate whether using both δ13C-CH4 and δD-CH4 improves the separation of fossil versus biogenic CH4 sources more than using either single-isotope or CH4 mole-fraction-only inversions. In addition, we explore how uncertainties in source isotopic signatures, sink lifetimes, and KIEs influence inversion outcomes. Lastly, we evaluate the additional constraints that δD-CH4 provides on temporal variations in the global CH4 sink.
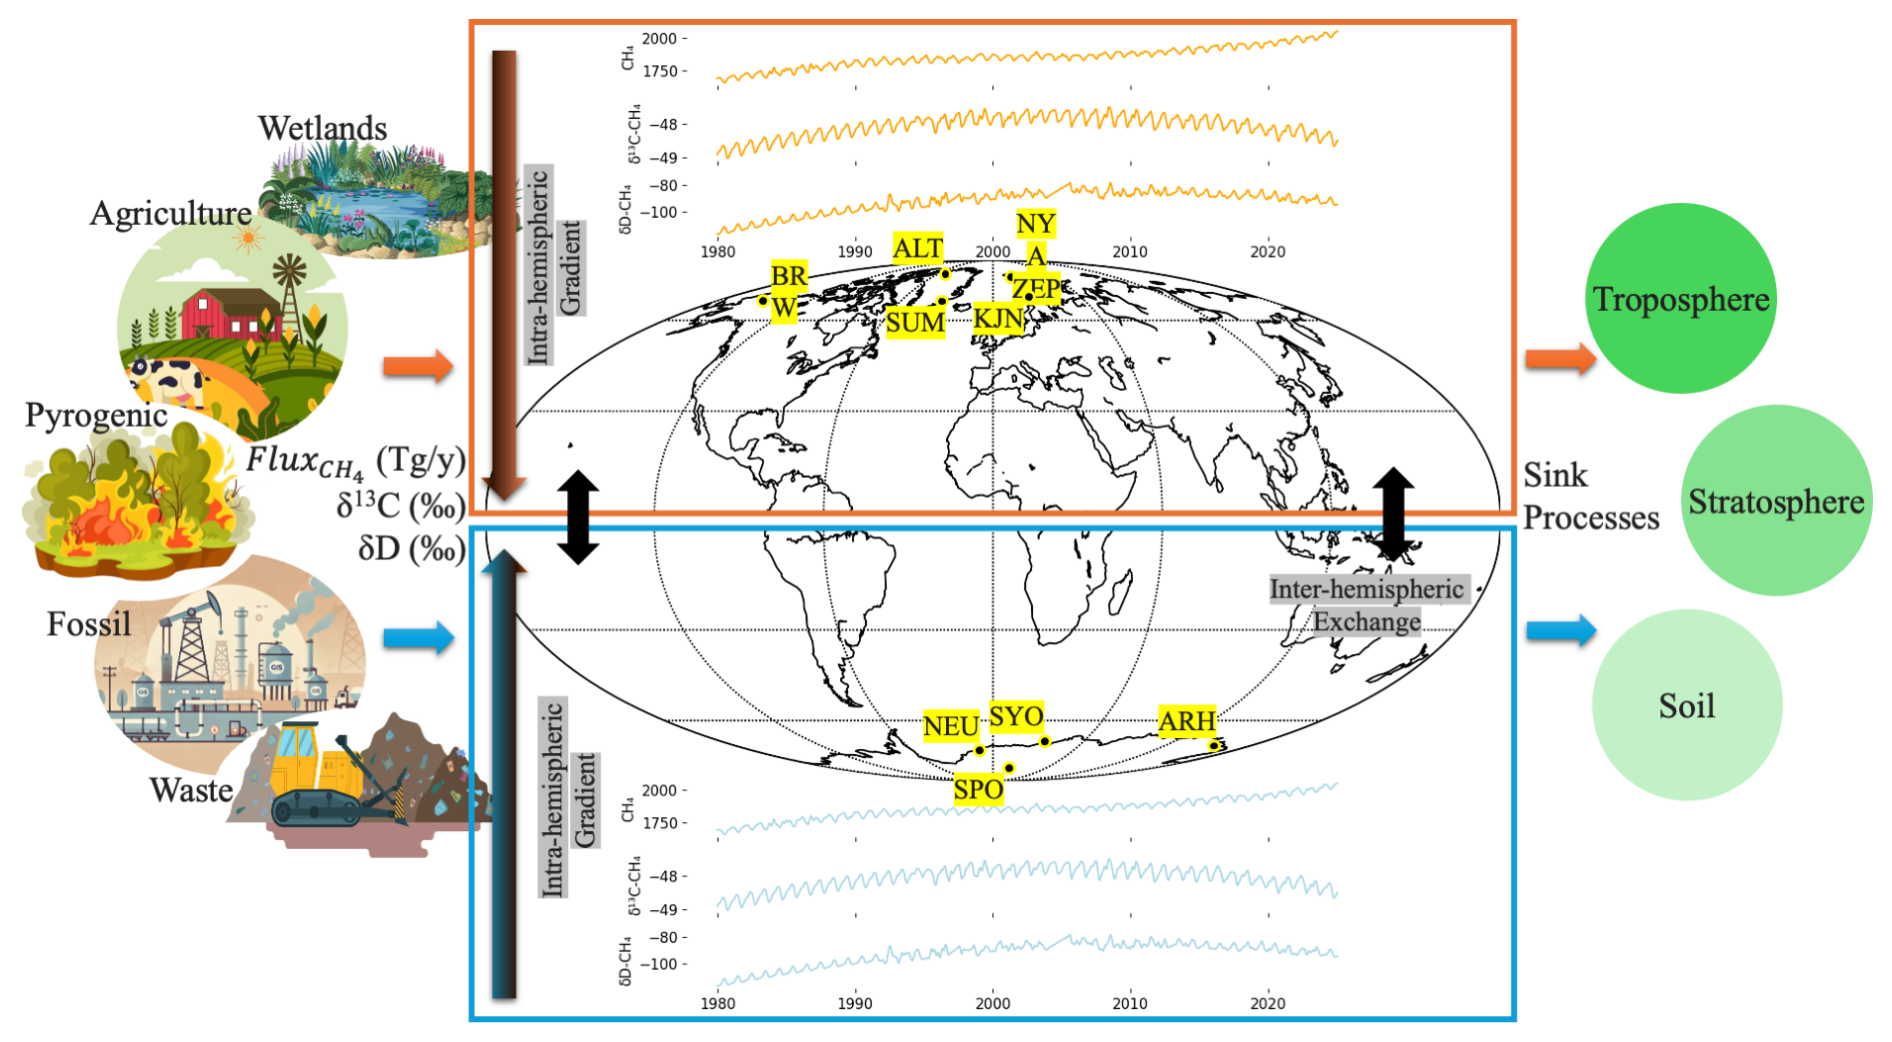
Figure 1Schematic of the two-box inversion framework used to simulate and optimise atmospheric methane (χ(CH4)), δ13C-CH4, and δD-CH4. Methane is emitted as three isotopologues (12CH4, 13CH4, 12CH3D) from five source categories (wetlands, agriculture, biomass burning, fossil fuels, and waste), each with characteristic emission rates (Tg yr−1) and isotopic signatures (δ13C, δD). These emissions are partitioned between the northern and southern hemispheres and corrected for intra-hemispheric gradients and interhemispheric exchange. Methane is removed by three sink processes (tropospheric loss, stratospheric loss, and soil uptake), each parameterised by isotopologue- and process-specific lifetimes. The resulting atmospheric tracer fields are compared with measurements from 10 high-latitude monitoring stations (yellow labels) spanning both hemispheres, following the network described by Dasgupta et al. (2025a). The model is inverted to optimise source strengths and hemisphere-specific sink lifetimes weighted with prior uncertainties, yielding posterior emissions and lifetime estimates that best reproduce observed mole fractions and isotopic trends.
2.1 Two-box model setup
The mole fraction and isotopic composition of CH4 are modelled using a two-box model with the boxes representing the Northern Hemisphere (NH) and Southern Hemisphere (SH) (Fig. 1). Hemisphere-specific source fluxes are compiled from six bottom-up inventories and aggregated into five source categories: agriculture, wetlands, pyrogenic, fossil fuels, and waste (Table S1 and Fig. S1 in the Supplement). Please note, “fossil fuel” and “thermogenic” emissions are used interchangeably to refer to CH4 from fuel exploration, oil refineries, chemical processes, and power generation as compiled from EDGAR (Table S1). Pyrogenic emissions are treated as a separate category. CH4 sinks are parameterised by sink-specific lifetimes for removal by troposphere, stratosphere, and deposition to soils, respectively. We set the inter-hemispheric exchange time to τ = 0.75 year, determined from SF6 inversion and τ-sensitivity tests (see Fig. S5). The intra-hemispheric latitudinal gradients in CH4, δ13C-CH4, and δD-CH4 are corrected for using measurement stations at different latitudes provided by the NOAA network (Fig. S4). This correction accounts for the spatial variability within each hemisphere that cannot be explicitly resolved in the two-box framework, ensuring that model outputs are comparable to observations from individual atmospheric stations. Given the 2-box setup, global-scale source totals and growth trends are expected to be robust, whereas hemispheric attribution is more sensitive to structural assumptions, including interhemispheric exchange time and prior uncertainty weighting (see Sect. 4.4).
2.2 Harmonised long-term atmospheric timeseries
Our atmospheric dataset comprises time series data for 6 CH4 tracers: mole fraction (χ(CH4); NH and SH: 1983–2024), carbon isotopic composition (δ13C-CH4; NH: 1994–2024; SH: 1988–2024), and hydrogen isotopic composition (δD-CH4; NH: 1992–2024; SH: 1988–2024) of CH4, each of them being a merged dataset from stations at high northern and southern latitudes (Dasgupta et al., 2025b). We extrapolate the time series back to 1980 and forward to 2025 (Fig. S2). A 13-year spin-up is applied to ensure that inversion results are independent of initial conditions, and a 3-year spin-down allows smooth convergence back to priors (Fig. S3). Therefore, the effective “analysis period” ranges from 1994 to 2022.
2.3 Source and Sink Isotopic Signatures
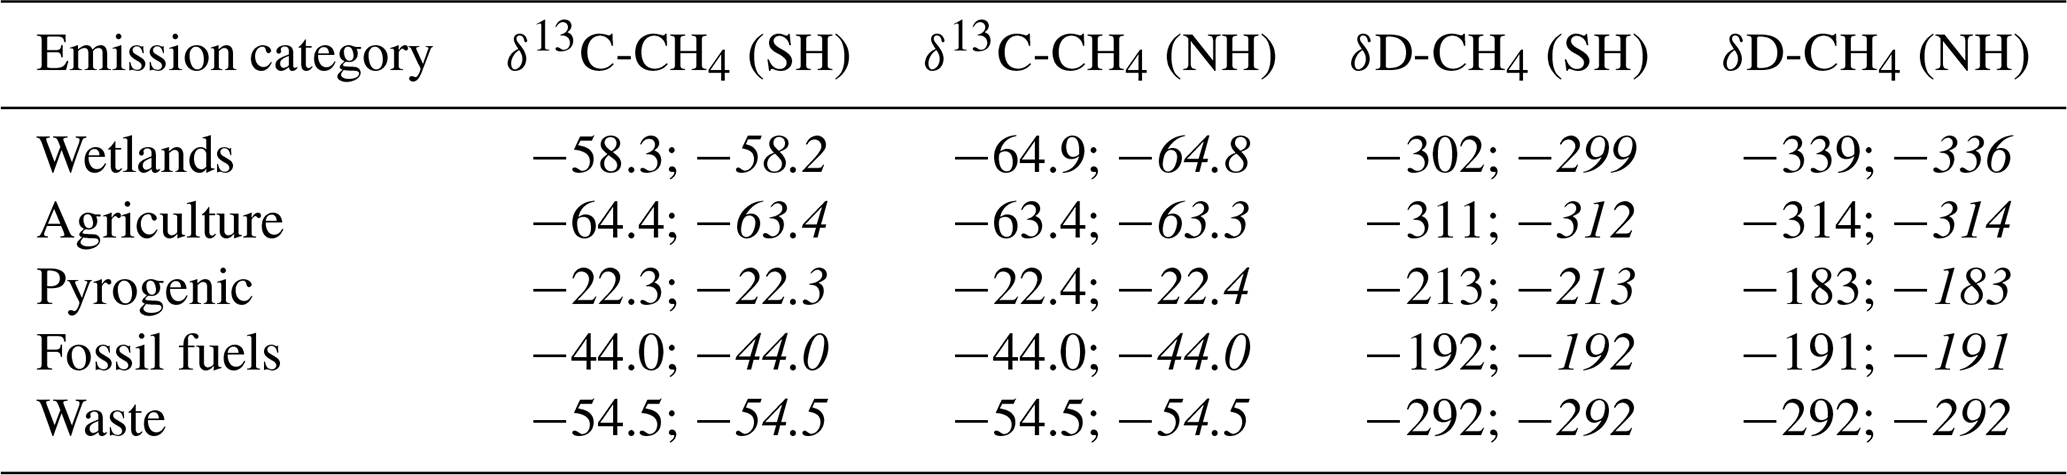
Source isotopic signatures for the 5 categories are averages from the global isotope database (Sherwood et al., 2017; Menoud et al., 2022) and weighted by emission rates (Table S2). CH4 sinks include tropospheric OH Cl, a combined stratospheric sink including OH O Cl, and soil uptake. Each sink is assigned a kinetic isotope effect (KIE) based on Cantrell et al. (1990), Saueressig et al. (1995, 1996, 2001), Röckmann et al. (2011), and Fujita et al. (2020). We use their reported fractionation factors to set effective KIEs for the model's three sink categories: tropospheric (KIE 13C ≈ 1.0066; D ≈ 1.317), stratospheric (KIE 13C ≈ 1.0144; D ≈ 1.133), and soil (KIE 13C ≈ 1.0201; D ≈ 1.0825) sinks.
Sensitivity tests were performed where prior flux uncertainties (±10 %–50 %) and observational error bounds (χ(CH4): 1 ppb 13CH4: 0.1–0.01 ppb; CH3D: 0.005–0.001 ppb) were systematically varied. Reducing the prior error below 30 % increased interannual variability in posterior fluxes but degraded isotopic fits, as the inversion over-relied on the priors (Lan et al., 2021). Lowering 13CH4 observational error to 0.001 ppb produced near-perfect δ13C-CH4 fits but worsened δD-CH4 agreement, whereas balancing errors at 1, 0.01, and 0.001 ppb yielded improved simultaneous fits. These findings highlight the trade-off between prior confidence and observational weighing in multivariate inversions and are further explored in “error-scaled” inversion scenarios (Sect. 3.3).
2.4 Bayesian Inversion System
The prior hemisphere-specific emissions for 1980–2025 (Sect. 2.3) are optimised using a Bayesian inversion system, as described in Sect. S7 in the Supplement. The inversion algorithm modifies monthly source fluxes and sink losses so that 6 modelled tracers evolve toward the observations while still remaining constrained by priors. For all results presented in Sect. 3.2–3.3, we use a fixed prior lifetime (Prather et al., 2012; Myhre et al., 2014), but we also test time-varying CH4 lifetime scenarios derived from CAMS TM5 inversions (Fig. S6). The inversion is performed in two sequential steps. First, we perform a CH4-only inversion to estimate the emissions and the aggregate sink that match the observed hemispheric CH4 mole fraction, providing a consistent starting state for the isotopologue ratio calculations. Second, we run an iterative Gauss–Newton inversion jointly constrained by CH4, δ13C-CH4 and δD-CH4 to refine the total budget and its allocation across source categories (see Sect. S7). The two-box model is adjusted to run with different combinations of the three tracers by selecting which isotopologues to include in the second inversion step and their associated observational uncertainties (Figs. 2, 3).
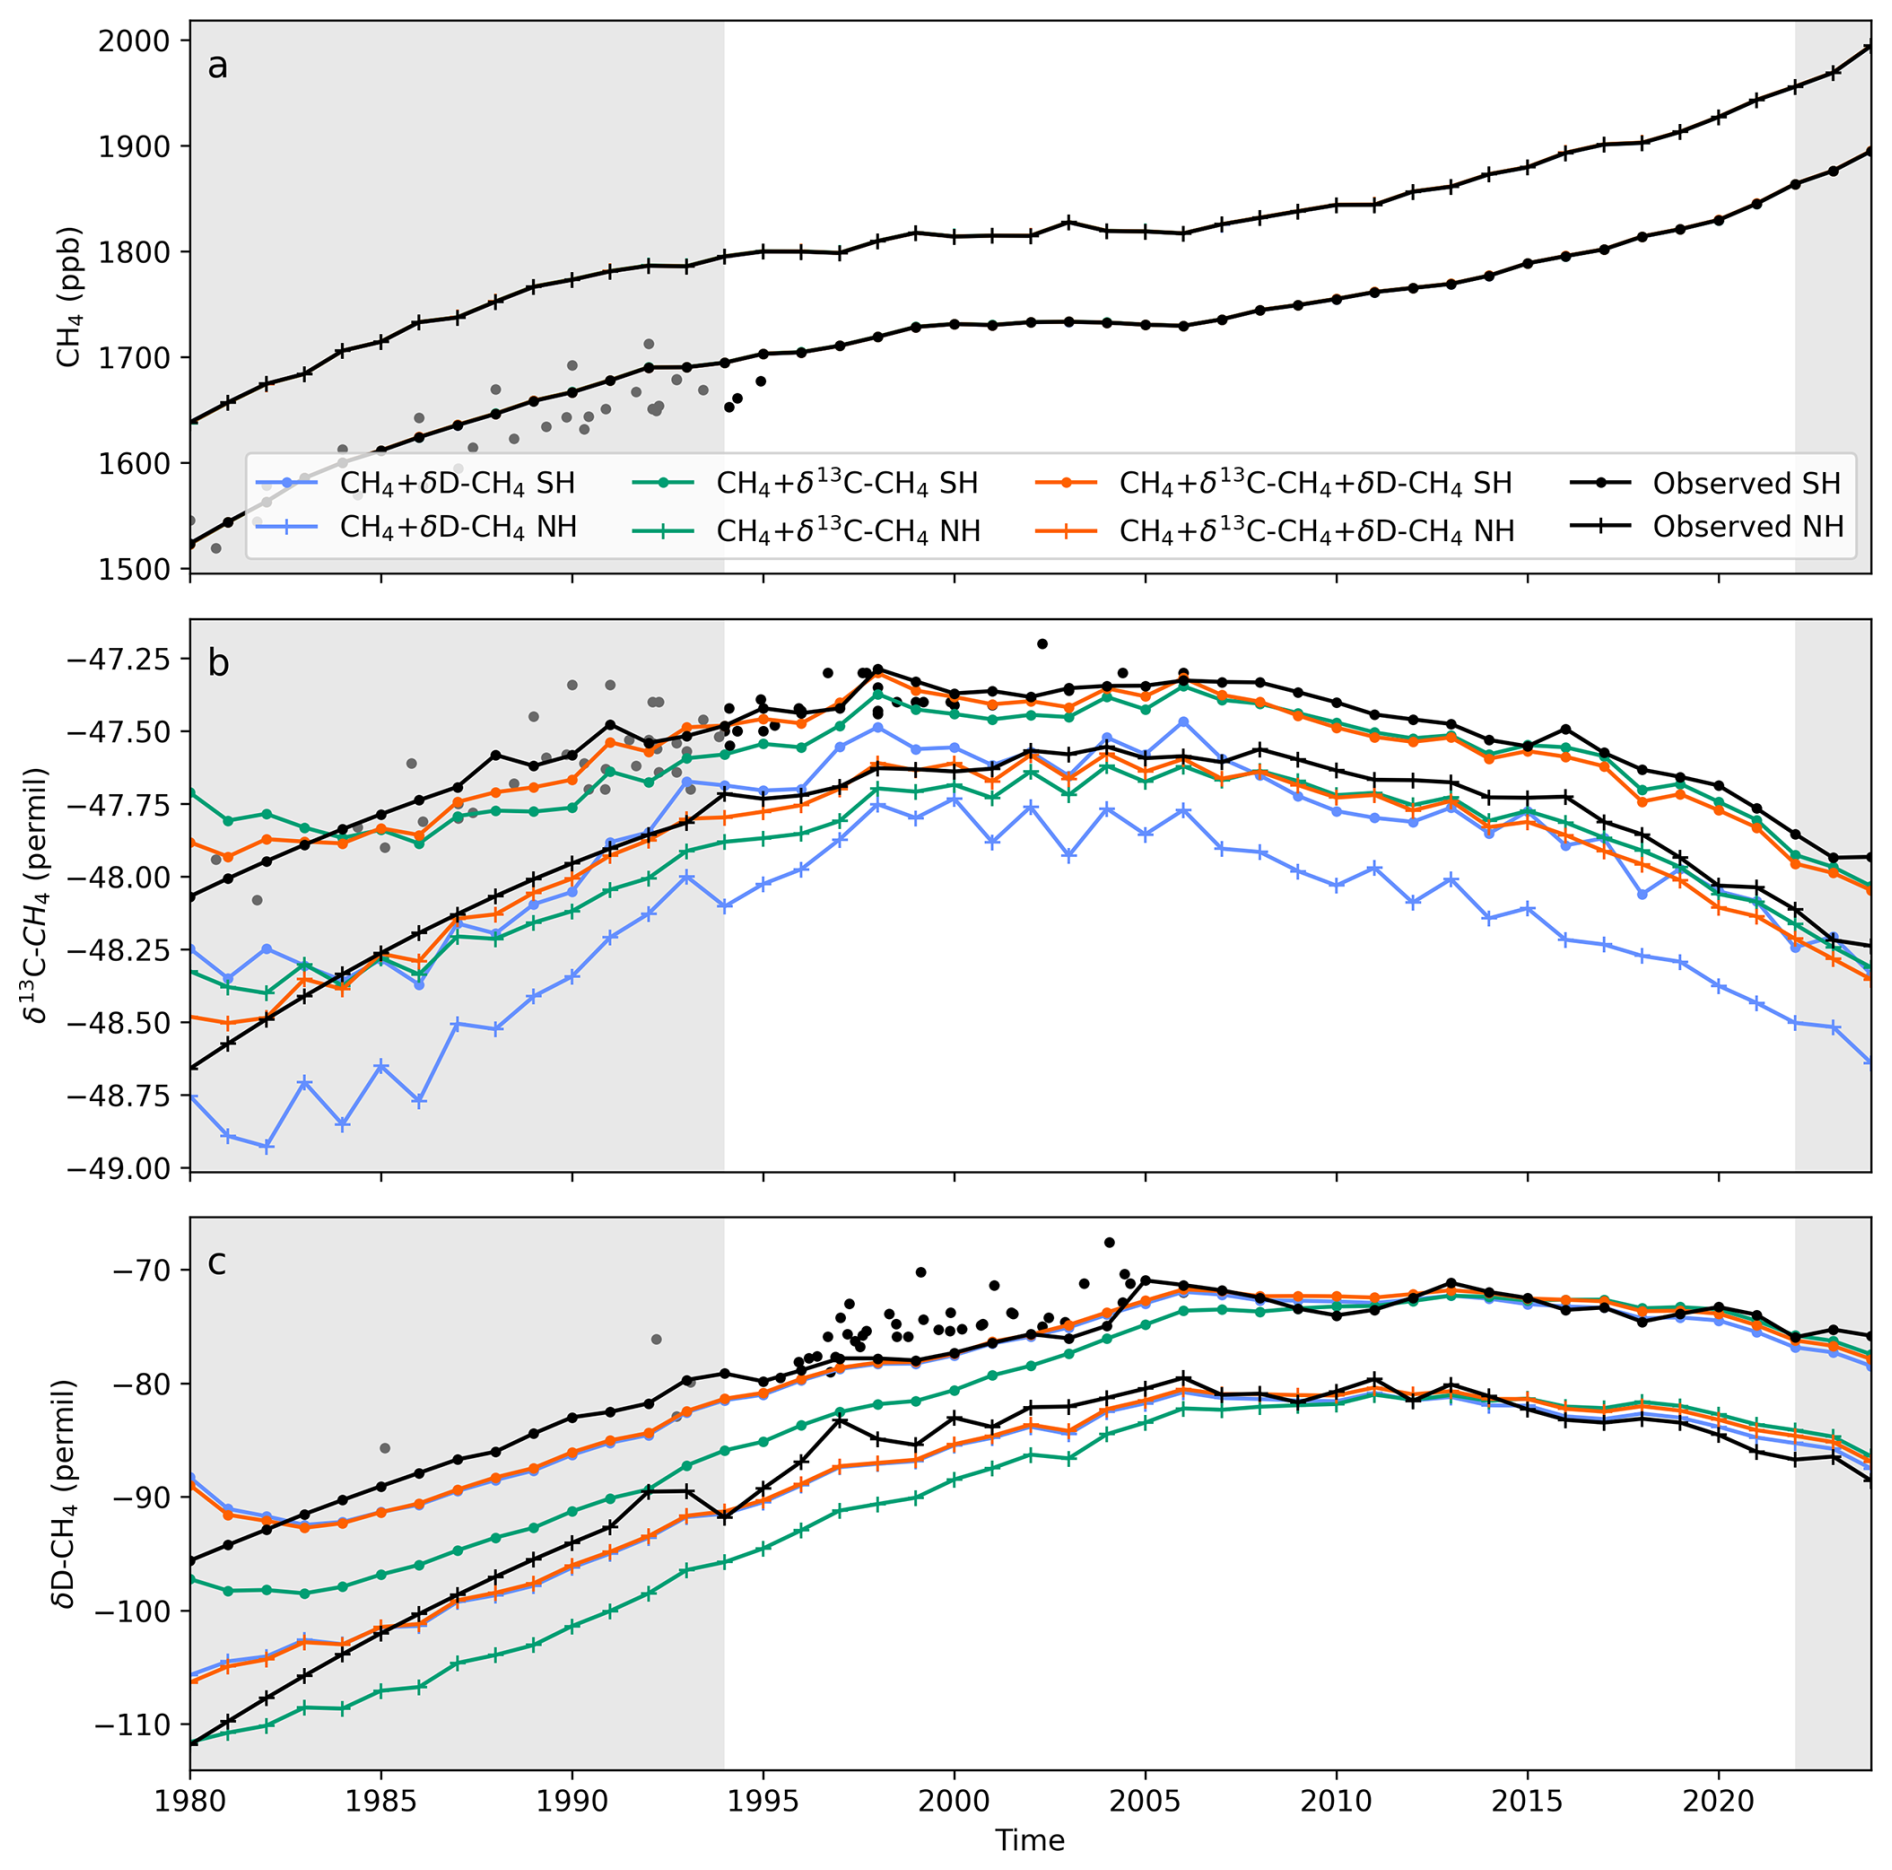
Figure 2Observed (black) and posterior (coloured) time series of CH4 mole fraction (a), δ13C-CH4 (b) and δD-CH4 (c) in NH (circle) and SH (cross) for 3 inversion scenarios: (i) Dual Isotope, (ii) Carbon only, and (iii) Hydrogen only. Black circles represent the observed tracer values measured at SH firn air (Sapart et al., 2013). Grey shading indicates spin-up (1980–1993) and spin-down (2023–2024) periods; the unshaded region (1994–2022) is the analysis period.
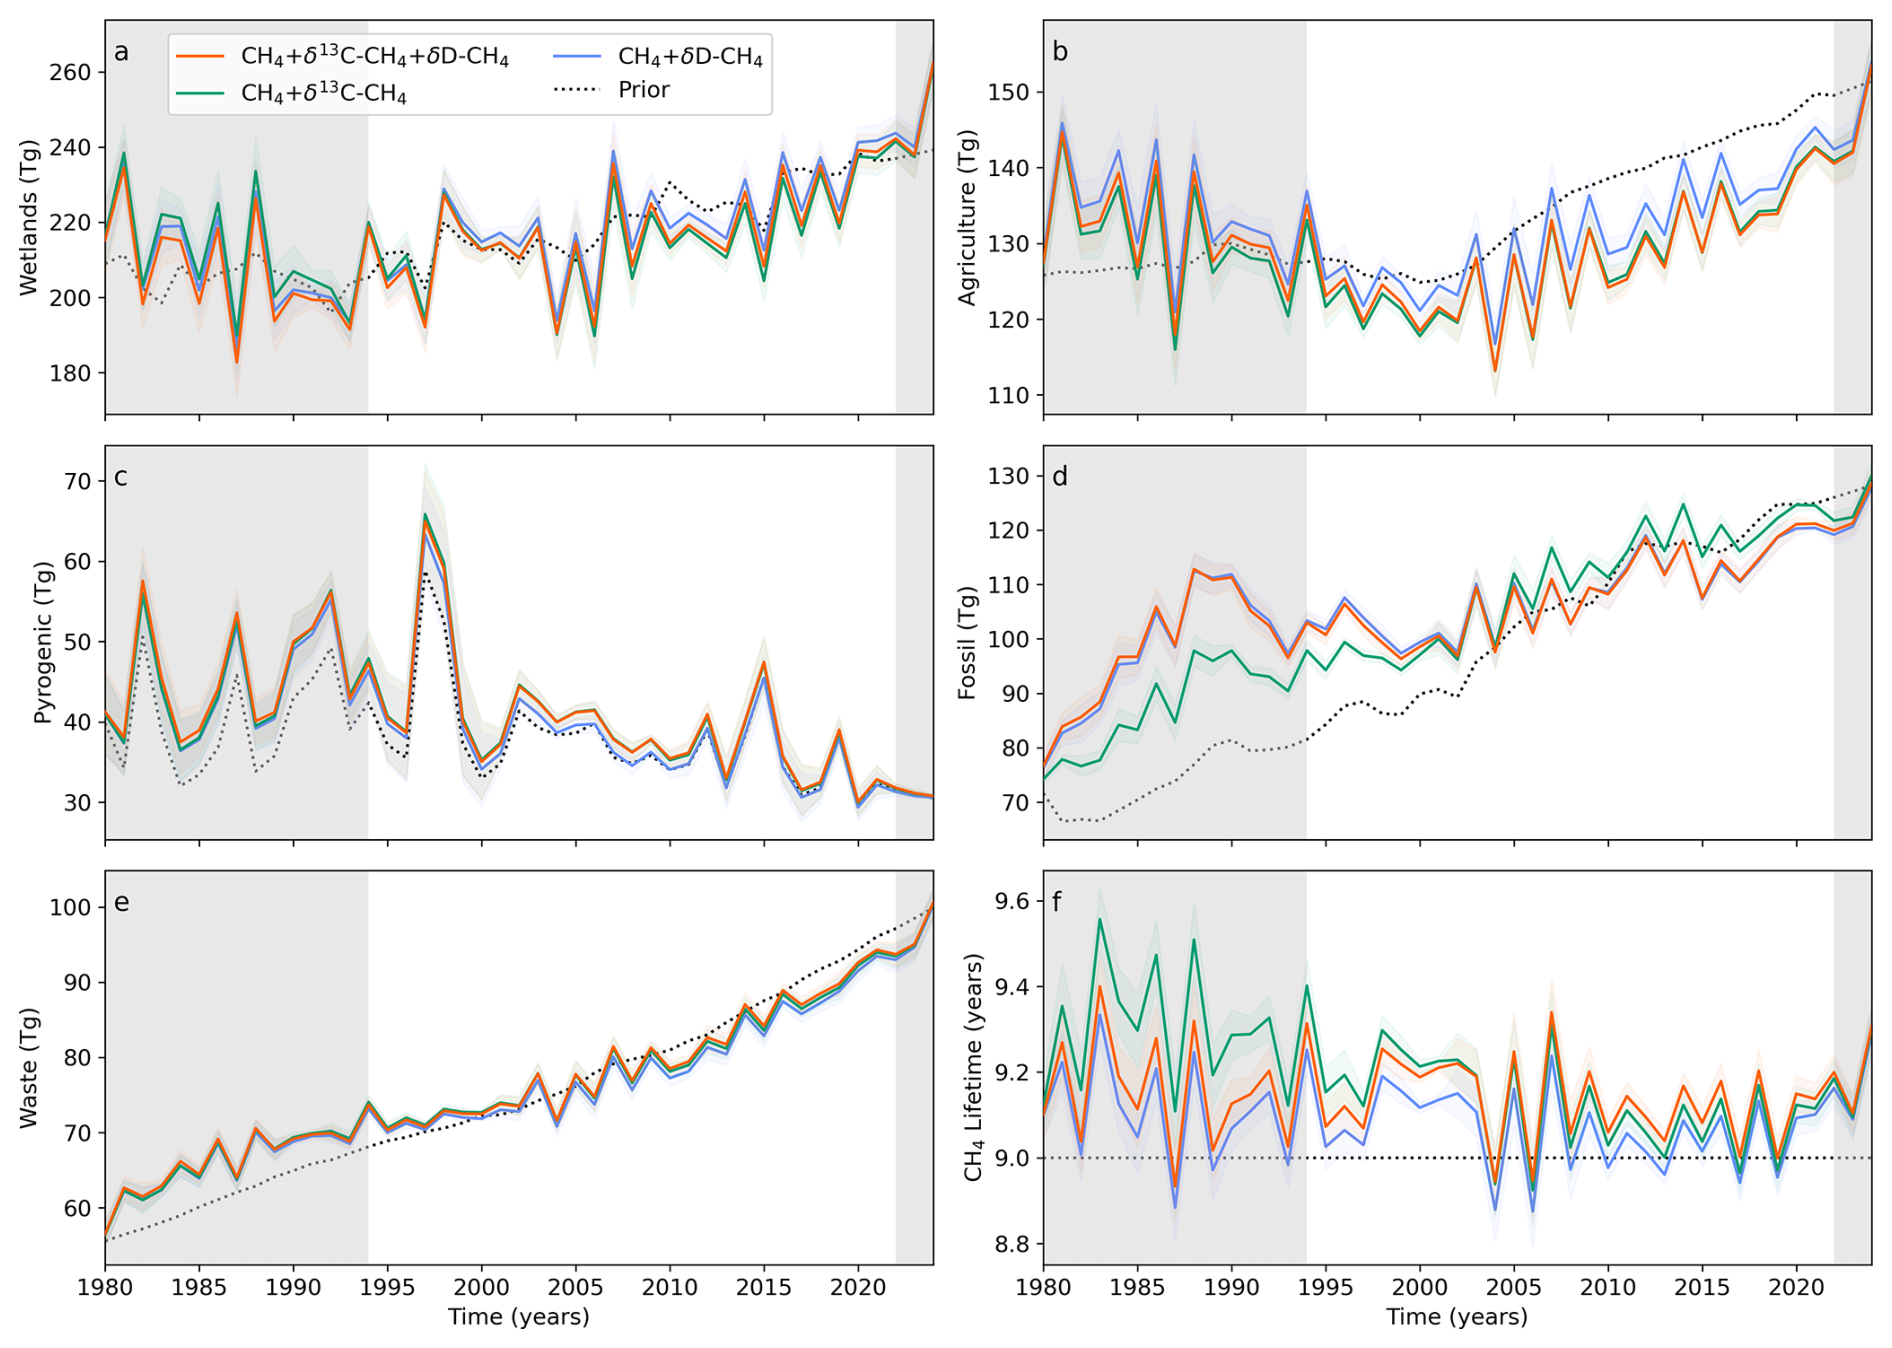
Figure 3Prior (black, dotted) and posterior (coloured) total global emissions (Tg) for five emission categories (a–e) and total sink lifetime (f) values simulated by the two-box inversion for 3 inversion scenarios: (i) Dual Isotope, (ii) Carbon only, and (iii) Hydrogen only. Coloured bands corresponding to each inversion represent the 1σ error calculated from a 6-month moving window. Grey shading indicates spin-up (1980–1993) and spin-down (2023–2024) periods; the unshaded region (1994–2022) is the analysis period. The hemisphere-specific version of Fig. 3 is available in Sect. S12.
2.5 Discrete Parameter Tuning (DPT)
To optimise model inputs, including source isotopic signatures, sink KIEs, lifetimes, and observational-error estimates, we perform over 13 million individual inversions with perturbed prior parameter values (Table S3). Each run generates posterior source fluxes for which the 6 modelled tracers, i.e. χ(CH4)(NH, SH), δ13C-CH4 (NH, SH), and δD-CH4(NH, SH) are then compared to the observations via a tracer-weighted RMSE (root mean square error; see Sect. S8). We only retain scenarios where the mean normalised RMSE between modelled and observed tracers is less than 0.1 (Fig. S7) and identify the most frequently occurring prior values among these “successful” runs (Figs. S8, S9). These modal values constitute our DPT-optimised parameter set, and the aggregated posterior results represent the DPT ensemble run (Fig. 4).
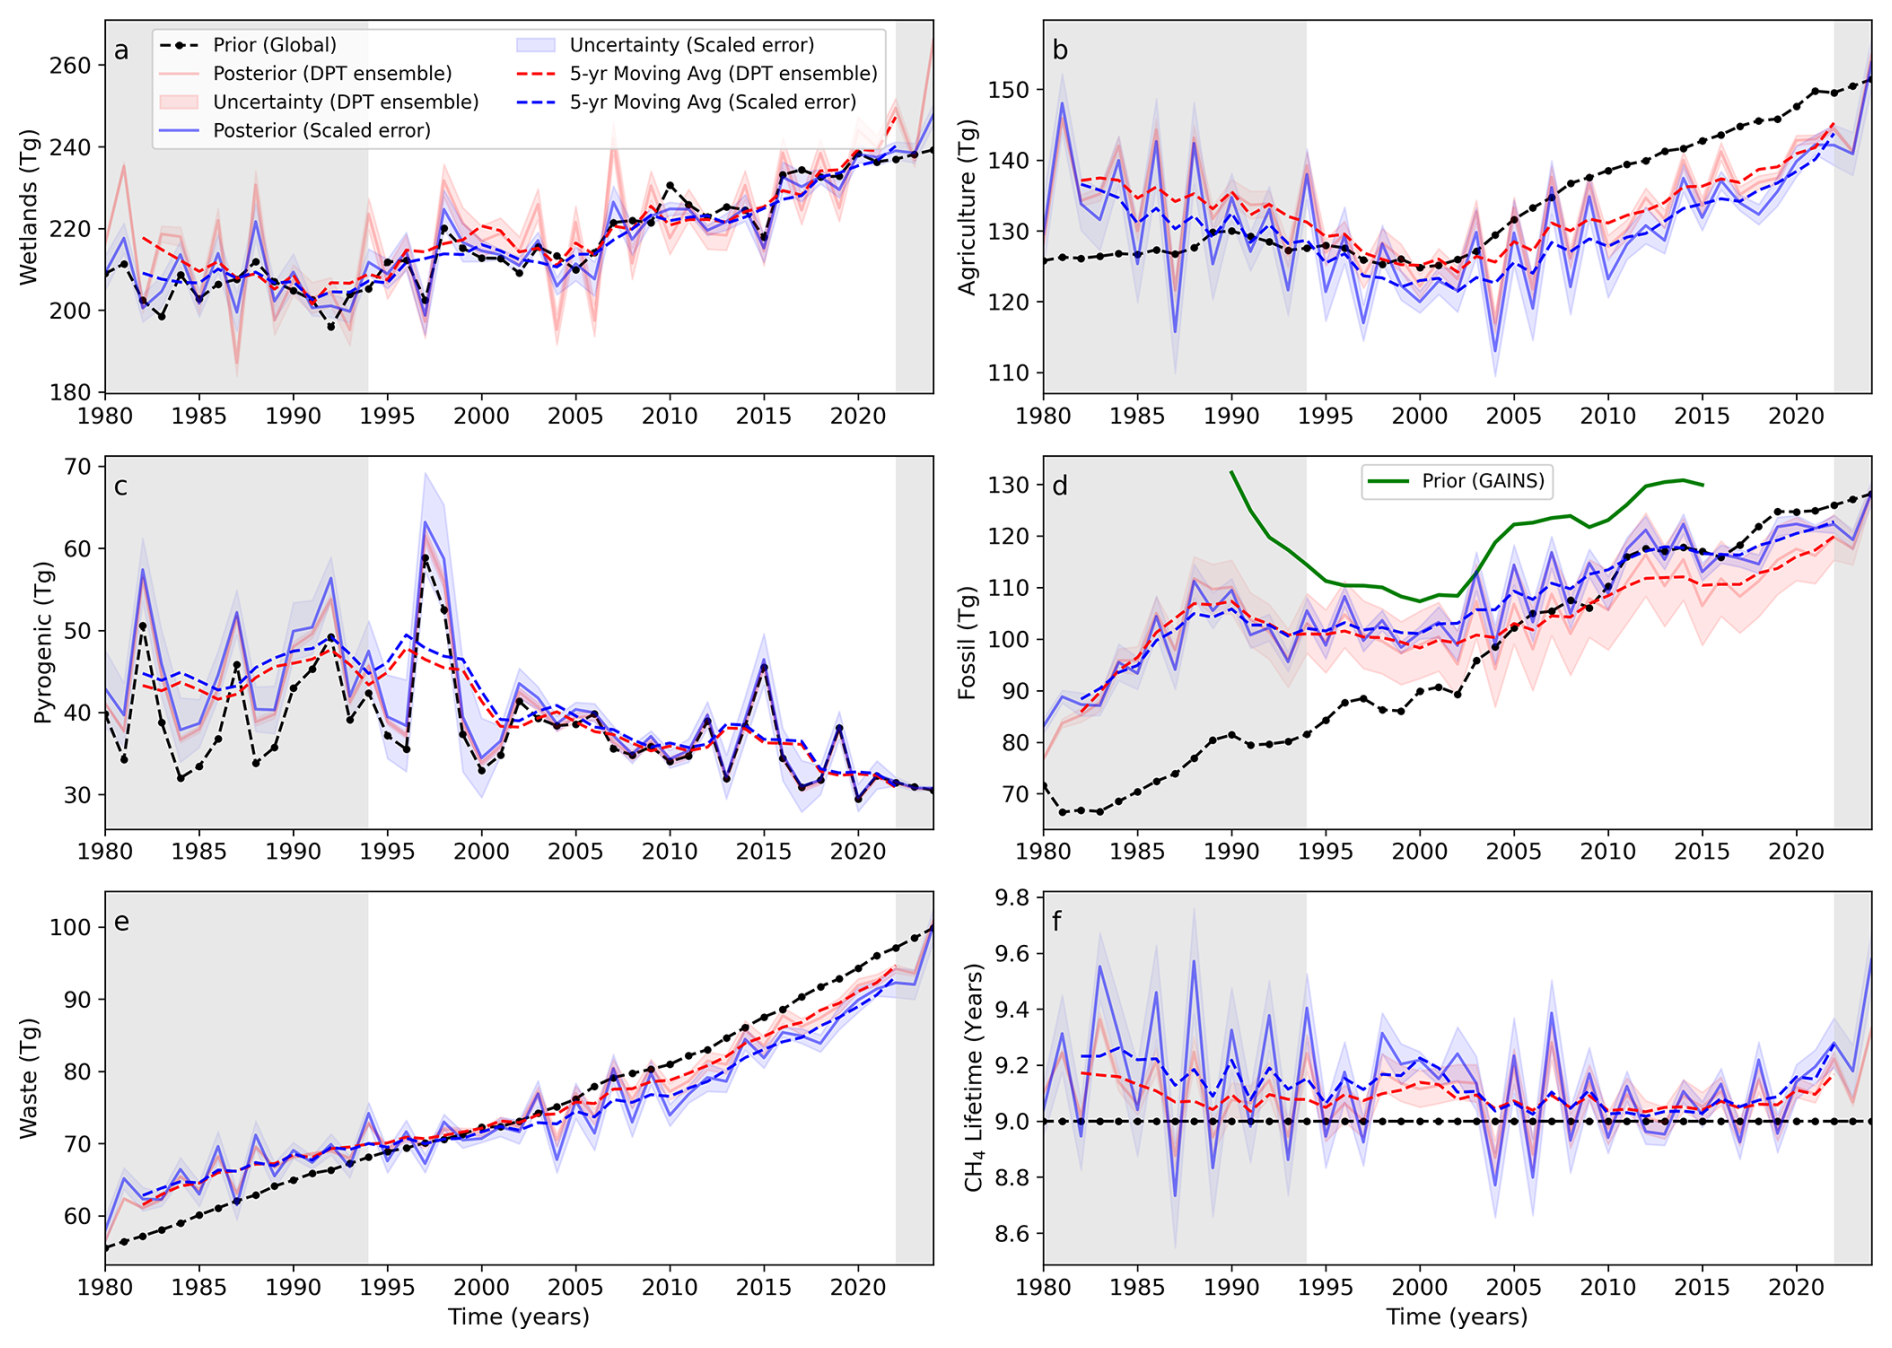
Figure 4Prior (black, dotted) and posterior (coloured; raw, 5-year moving average and uncertainty) emission rates for 5 source categories (a–e) and lifetime (f) computed from (i) ensemble mean of the DPT optimised runs filtered from sensitivity tests (< 0.1 RMSE) and (ii) error-scaled inversion for source and lifetime. Posterior fossil emissions are also compared with GAINS (green) emissions alongside the priors (EDGAR). Grey shading indicates spin-up (1980–1993) and spin-down (2023–2024) periods; the unshaded region (1994–2022) is the analysis period. The hemisphere-specific version of Fig. 4 is available in Sect. S12.
The threshold of mean normalised RMSE < 0.1 is empirically motivated: as shown in Fig. S7b, over 92 % of all posterior-observation pairs across the six tracers fall below this value, confirming that retained runs reproduce the observations within their combined measurement and model uncertainty. In absolute terms, this corresponds to residuals of ∼ 0.05 ‰–0.07 ‰ for δ13C-CH4 and ∼ 0.2 ‰ for δD-CH4. Sensitivity tests with stricter or looser thresholds produce near-identical ensemble medians for global source trends.
3.1 Optimised Source Signatures and Sink Fractionations
By selecting the parameter combinations that minimise the mean normalised RMSE for all six tracers, we obtained robust, data-driven refinements to the input parameters. As shown in Table 1 and Fig. S8, most source signatures remained close to their priors. For δ13C-CH4, DPT-optimisation resulted in minor revisions to the wetland and agricultural source signatures in both hemispheres. A relatively larger adjustment was made to agricultural emission δ13C-CH4 in SH and to a lesser extent to agricultural and wetlands δD-CH4. Both biogenic source signatures shifted toward the heavier end of the DPT-tested range, suggesting that the δD-CH4 data can be better matched by more enriched source signatures.
Table 1Assigned δ13C-CH4 and δD-CH4 values (‰) for each source category in the two-box model. Optimised values (‰) from DPT-ensemble. Optimised values (‰) from DPT-ensemble are in italics.
The same DPT framework was applied to optimise the tropospheric KIEs (Table 2; Fig. S9). Tropospheric KIEs for OH + Cl oxidation were slightly revised from literature values (13C 1.0066 and D 1.317; Saunois et al., 2020) to 1.0068 (13C) and 1.313 (D). These optimised KIEs yield the best simultaneous fit to the trends in χ(CH4)(NH, SH), δ13C-CH4(NH, SH) and δD-CH.
Table 2Fractionation factors used for different sink processes, based on previous literature, and using an average global temperature of 3.973 ± 0.122 °C. Optimised values from DPT-ensemble. Optimised values (‰) from DPT-ensemble are in italics.
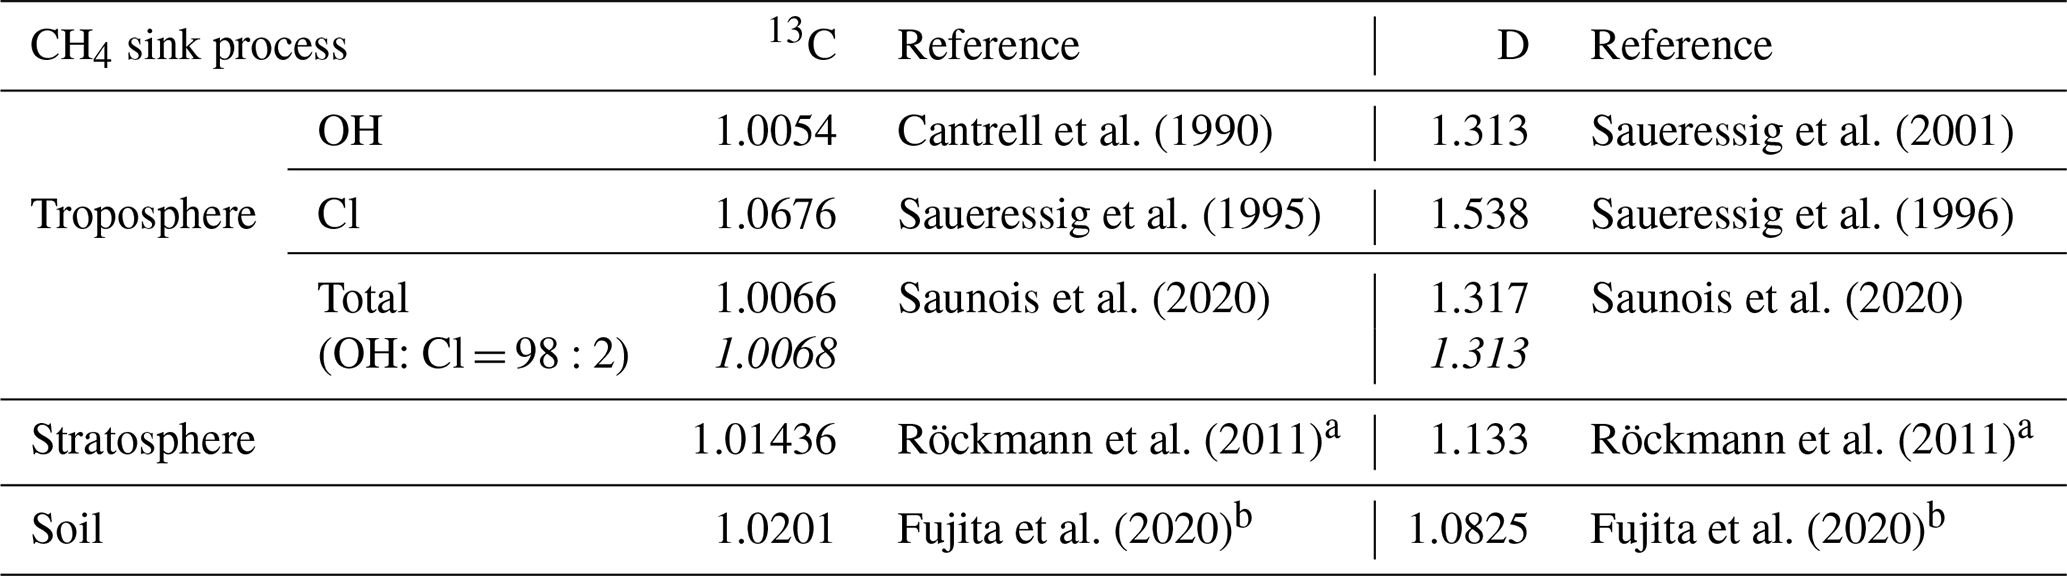
a Pseudo-KIE that account for the fractionation in the stratospheric sinks on atmospheric CH4 in the box model. See Sect. S9 for detailed calculations.
b Based on Snover and Quay (2000), Tyler et al. (1994), and Reeburgh et al. (1997).
These fine-tuned (within physically realistic bounds) source fingerprints and sink kinetics improve the model's ability to reproduce observed isotopic trajectories.
3.2 Isotopic Constraints on the Inversion
Figures 2 and 3 compare the modelled and observed isotopic time series, along with their corresponding emission scenarios, highlighting the performance of the three inversion setups: dual-isotope (CH4 + δ13C-CH4 + δD), carbon-only (CH4 + δ13C), and hydrogen-only (CH4 + δD).
Figure 3 reveals marked differences in sectoral emission trajectories across the three isotopic inversion setups over the analysis period. Wetlands (Fig. 3a) exhibit relatively stable emissions from 1994 to 2007 across all three inversions, followed by a sustained increase through 2022. Mean emissions are 217.8 ± 13.9 Tg CH4 (dual-isotope), 216.8 ± 13.3 Tg CH4 (carbon-only), and 220.7 ± 13.7 Tg CH4 (hydrogen-only), with a total growth of +35.3, +32.6, and +35.8 Tg across the analysis period, respectively (Table S4). Agricultural emissions (Fig. 3b) exhibit gradual increases throughout the analysis period, with mean values of 128.1 ± 7.5 Tg CH4 (dual-isotope), 128.0 ± 7.8 Tg CH4 (carbon-only), and 131.5 ± 7.6 Tg CH4 (hydrogen-only), corresponding to growth of +14.8, +16.9, and +14.8 Tg. Pyrogenic emissions (Fig. 3c) display high interannual variability but a general declining trend, decreasing from ∼ 45 Tg CH4 in the early 1990s to ∼ 32 Tg CH4 by 2022. Mean emissions are 39.7 ± 7.6 Tg CH4 (dual-isotope), 39.7 ± 7.9 Tg CH4 (carbon-only), and 38.4 ± 7.4 Tg CH4 (hydrogen-only), with reductions of −11.6, −12.1, and −11.3 Tg. Fossil fuel emissions (Fig. 3d) show the most pronounced divergence between inversion scenarios with and without δ13C-CH4. The carbon-only inversion (110.1 ± 10.7 Tg CH4, +28.7 Tg growth) displays steady increases throughout the period. The dual-isotope (108.4 ± 7.9 Tg CH4, +20.7 Tg) and hydrogen-only (108.6 ± 7.4 Tg CH4, +19.2 Tg) inversions show elevated emissions in the early 1990s, a decrease through the late 1990s, and renewed growth from 2000 onward. Waste emissions (Fig. 3e) increase steadily with excellent agreement in temporal variation across all inversions: 80.1 ± 7.5 Tg CH4 (dual-isotope, +23.4 Tg), 79.9 ± 7.3 Tg CH4 (carbon-only, +22.8 Tg), and 79.1 ± 7.3 Tg CH4 (hydrogen-only, +23.1 Tg). Atmospheric lifetime (Fig. 3f) remains consistent at 9.1 ± 0.1 years across all inversions, with higher temporal variations at the hemispheric scale than at the global scale.
The dual-isotope inversion achieves the best overall fit for both δ13C-CH4 and δD-CH4 (Fig. S10). For δ13C, it shows a mean residual of −0.05 ‰ and a median of −0.06 ‰, slightly better than the carbon-only run (mean −0.07 ‰, median −0.06 ‰). By contrast, the hydrogen-only inversion has larger residuals (mean −0.29 ‰, median −0.30 ‰), indicating a poorer fit. For δD-CH4, the dual-isotope inversion again performs best (mean −0.18 ‰, median −0.09 ‰), followed by the hydrogen-only setup (mean −0.55 ‰, median −0.47 ‰). The primary constraint from δD-CH4 operates on the early-period fossil baseline rather than on tracer fit in the later period; by ∼ 2005, all inversions converge on a similar trajectory consistent with both isotopic records. The carbon-only inversion, lacking δD-CH4 data, has the largest residuals (mean −1.74 ‰, median −1.18 ‰), confirming that δ13C-CH4 alone cannot capture deuterium dynamics. These results demonstrate that the dual-isotope approach is the only setup capable of accurately matching both isotopic records, whereas the single-isotope inversions necessarily compromise the fit for the unconstrained tracer. Following this, we run 2 additional scenarios with both isotopes, i.e. DPT ensemble and error-scaled inversions, to fully gauge the implications of a dual isotopic constraint on the model.
3.3 Revised estimates of emissions and lifetime
We compare prior estimates with five inversion scenarios over 1994–2022 to assess how isotopic constraints re-estimate the methane budget (Table S4, Figs. 3–4).
-
Prior: bottom-up inventories with fixed 9-year lifetimes (Fig. 3; black).
-
Carbon-only: CH4 + δ13C-CH4 inversion using DPT-optimised parameters but omitting δD-CH4 (Fig. 3; green).
-
Hydrogen-only: CH4 + δD-CH4 inversion using DPT-optimised parameters but omitting δ13C-CH4 (Fig. 3; blue).
-
Dual-isotope CH4 + δ13C-CH4 + δD-CH4 inversion, using a fixed set of source signatures, sink KIEs, lifetimes, and observational-error estimates optimised a priori by our DPT framework. In other words, it is a single inversion run that employs the best-guess parameter values from discrete parameter tuning (Fig. 3; red).
-
DPT ensemble represents the mean of all inversion runs (over 13 million) whose posterior results achieve a mean normalised RMSE < 0.1 against the six observed tracers. Rather than using only the modal parameter set, this scenario aggregates across the distribution of “successful” runs, thereby capturing the uncertainty and variability inherent in the parameter tuning process (Fig. 4; red).
-
Error-scaled: dual-isotope inversion using DPT-optimised parameters with emission uncertainties weighted by each source's contribution and tropospheric lifetime error tightened from 10 % to 9 % following sensitivity tests (Fig. 4; blue). Specifically, each source's prior uncertainty is scaled by (1−fi), where fi is that source's fractional contribution to total global emissions. This prevents large sources (e.g., wetlands contributing ∼ 40 % of total) from dominating the inversion solution space while allowing smaller sources (e.g., pyrogenic ∼ 7 %) proportionally more flexibility.
Figure 4 compares prior emissions with two refined dual-isotope inversions: the DPT-ensemble and error-scaled scenarios. Wetlands (Fig. 4a) show temporal patterns similar to Fig. 3, with relatively stable emissions until ∼ 007, followed by sustained increases. The DPT-ensemble estimates mean emissions of 222.6 ± 13.8 Tg CH4 with growth of +33.5 Tg, while the error-scaled inversion yields 220.4 ± 10.3 Tg CH4 with growth of +31.5 Tg, both lower than the prior growth (+30.1 Tg). Agricultural emissions (Fig. 4b) increase in both inversions. The DPT-ensemble (132.0 ± 7.2 Tg CH4, +12.0 Tg growth) and error-scaled (129.3 ± 7.8 Tg CH4, +14.7 Tg growth) scenarios both estimate lower growth than the prior (+22.3 Tg). Pyrogenic emissions (Fig. 4c) decline from ∼ 43 Tg CH4 in 1994 to ∼ 31 Tg CH4 by 2022, with high interannual variability. Mean emissions are 38.2 ± 7.0 Tg CH4 (DPT-ensemble, −10.5 Tg) and 38.9 ± 7.5 Tg CH4 (error-scaled, −11.4 Tg), both showing stronger reductions than the prior (−8.0 Tg). Fossil fuel emissions (Fig. 4d) display temporal patterns distinct from the prior, with elevated early-period emissions, a decrease through the late 1990s, and renewed growth from 2000 onward. The DPT-ensemble (106.5 ± 7.2 Tg CH4, +18.2 Tg) and error-scaled (110.9 ± 8.4 Tg CH4, +21.1 Tg) inversions both estimate lower growth in fossil fuel emissions than the prior (+44.0 Tg). Figure 4d also includes GAINS inventory estimates (green line) for comparison. The GAINS model estimates emissions bottom-up, i.e., quantifications of human activities contributing to emissions are multiplied by an emission factor representing the average emissions per unit of activity (Höglund-Isaksson et al., 2020). Waste emissions (Fig. 4e) increase steadily: 79.1 ± 7.6 Tg CH4 (DPT-ensemble, +23.5 Tg) and 77.7 ± 7.3 Tg CH4 (error-scaled, +22.4 Tg), both lower than prior growth (+29.1 Tg). Atmospheric lifetime (Fig. 4f) exhibits minimal variation, with higher temporal variations at the hemispheric scale compared to the global scale.
Figure 5 summarises the revisions to emission growth (top panel) and lifetime (bottom panel) across all inversion scenarios relative to the prior. The single-isotope inversions (carbon-only and hydrogen-only) show moderate adjustments across most sectors. In contrast, the dual-isotope, DPT-ensemble, and error-scaled inversions – all of which assimilate both δ13C-CH4 and δD-CH4 – consistently re-estimate wetland growth toward the SH (red shading indicates prior underestimation, with revisions of +8 to +10 Tg) while reducing NH fossil fuel growth (blue shading indicates prior overestimation, with revisions of −15 to −26 Tg). Agricultural and waste revisions are more modest across all scenarios (±5 Tg), while pyrogenic reductions are consistent (−3 to −4 Tg additional decline beyond prior). The lifetime heatmap (bottom panel) reveals hemispheric divergence: SH lifetime increases by +0.3 years across all isotope-constrained inversions, while NH lifetime decreases by −0.2 to −0.5 years depending on the scenario. Global mean lifetime remains nearly constant at 9.1 years, with deviations of ±0.1 years or less.
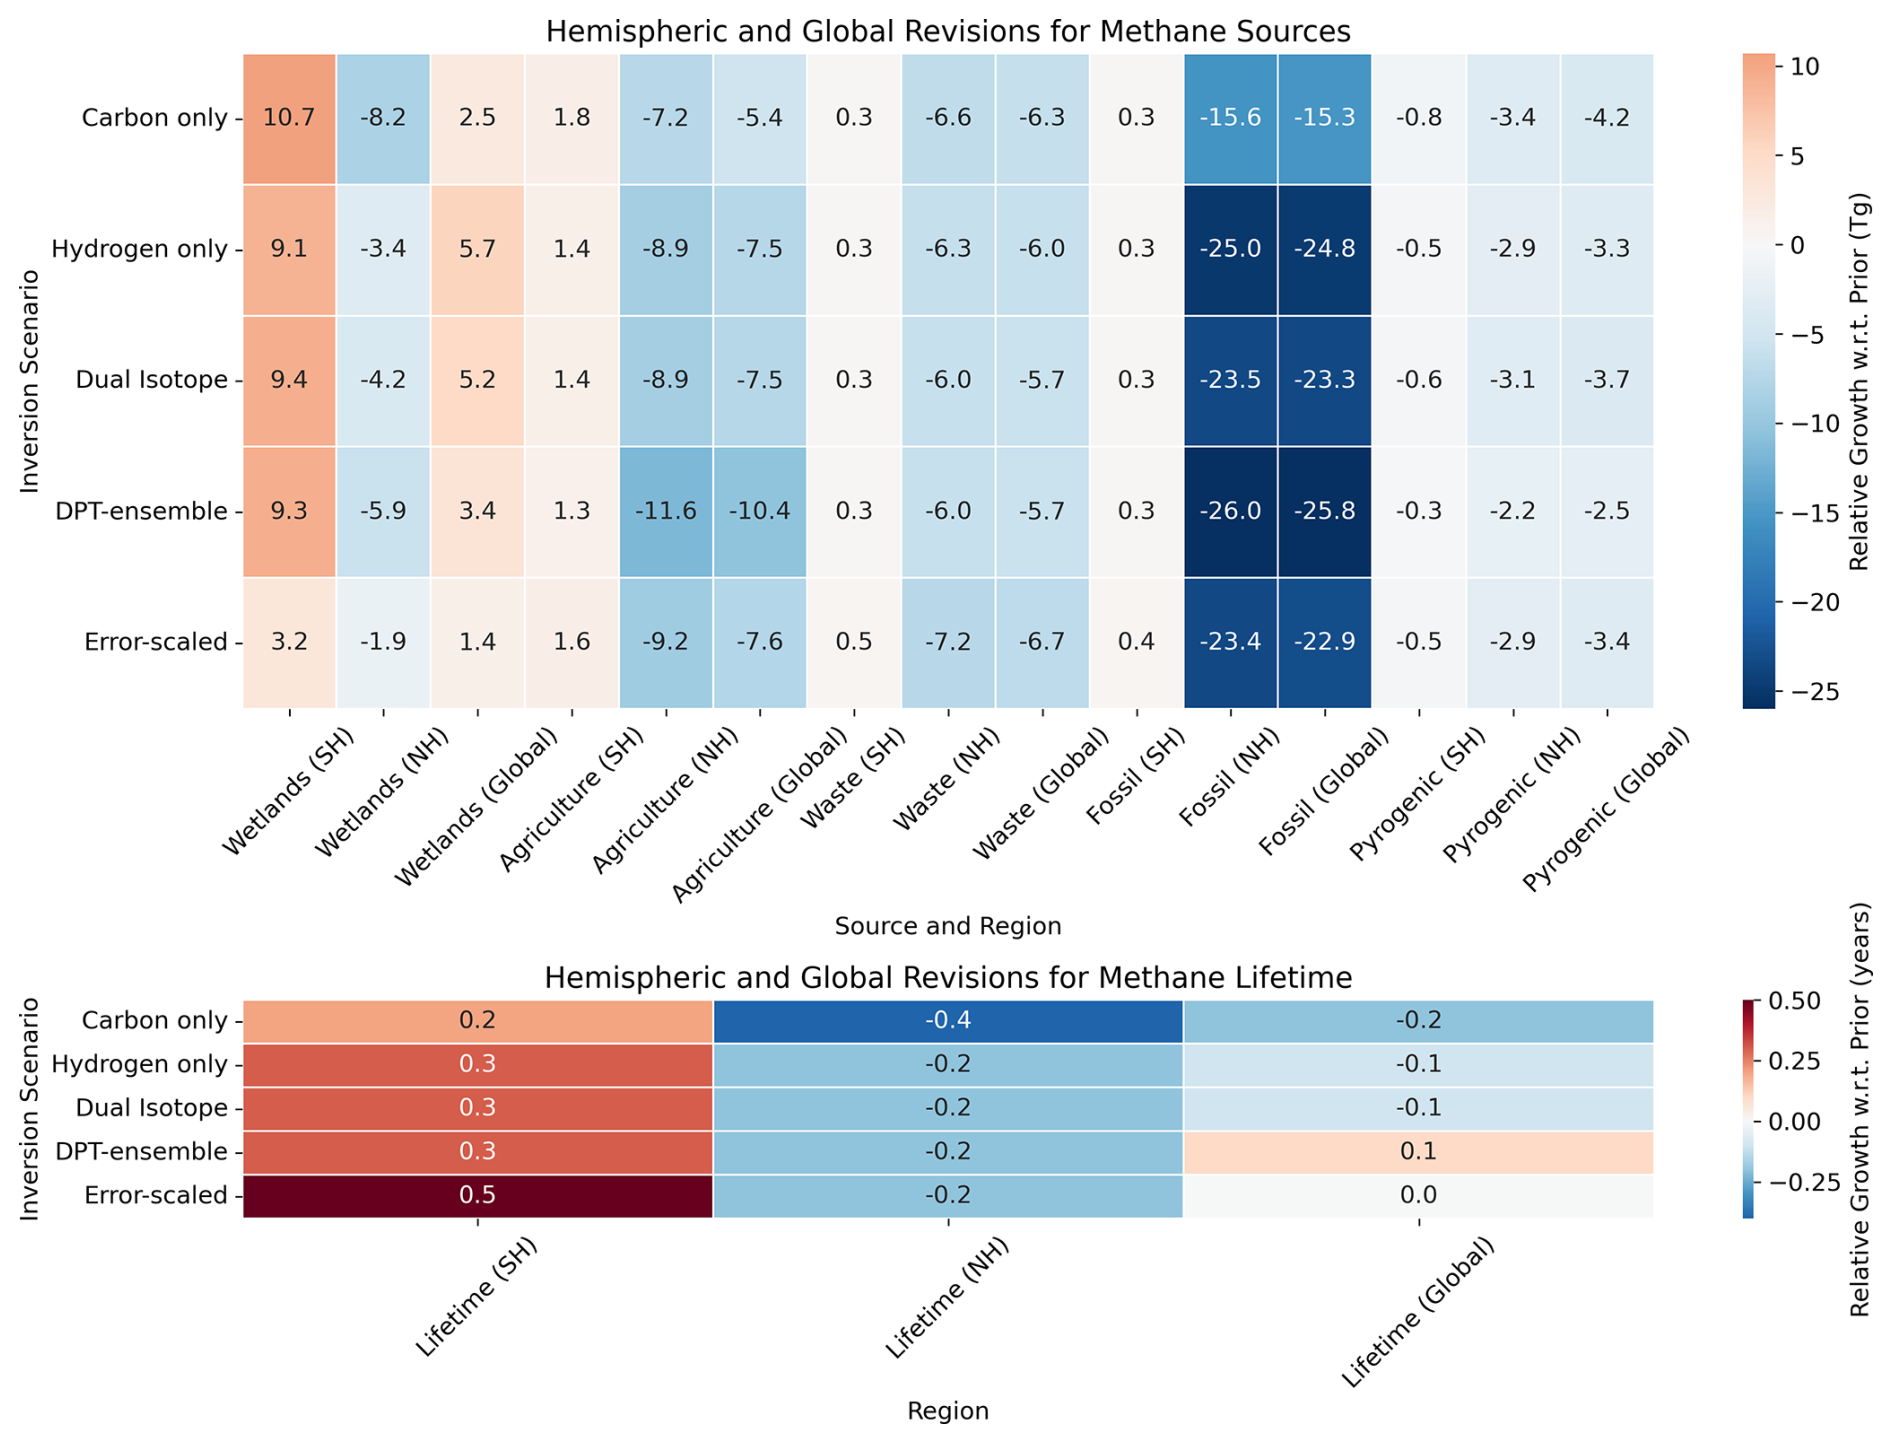
Figure 5Top panel: Hemispheric and global revisions w.r.t the priors (Growthposterior − Growthprior) of the growth in emissions by sector (wetlands, agriculture, waste, fossil, pyrogenic) in teragrams (Tg) per year. Growth is defined as the difference between the 1993–95 and 2021–23 averages. Bottom panel: hemispheric and global revisions for CH4 lifetime (in years). The χ(CH4)-only inversion (using mole fraction data without isotopic constraints) is shown in Sect. S12. This inversion produces unrealistic source partitioning because it lacks isotopic information to distinguish biogenic from thermogenic sources, confirming the necessity of isotopic constraints for robust source attribution.
4.1 Temporal changes of thermogenic and pyrogenic emissions
Prior inventories suggest steady fossil-fuel growth of +44.0 Tg between 1994 and 2022. However, isotope-constrained inversions reveal that most fossil fuel growth occurred between 2000 and 2012, with minimal additional increases thereafter. The carbon-only inversion estimates net thermogenic + pyrogenic growth at +16.6 Tg, while hydrogen-only inversions yield +7.9 Tg, and the dual-isotope solution at +9.1 Tg. Runs that include δD-CH4 (hydrogen-only, dual-isotope, DPT-ensemble) consistently yield smaller thermogenic and pyrogenic growth, with the DPT-ensemble producing only +7.7 Tg of net thermogenic + pyrogenic growth, compared to the prior estimate of +36.0 Tg (which includes the −8.0 Tg pyrogenic reduction).
The inferred total isotopic enrichment associated with methane removal is substantially larger for deuterium (313 ‰) than for carbon (6.8 ‰). In the case of 13C, the sink fractionation is much smaller than the differences of isotopic source signatures between the different source categories, which span 40 ‰, whereas the 2H sink fractionation is twice as wide as the range between the average source signatures of different categories of about 150 ‰ (Table 1). Thus, δD-CH4 provides strong sensitivity to oxidation kinetics. Among the source categories, δD is particularly sensitive to fossil CH4 emissions, which are the only source with δD > −200 ‰. This sensitivity is particularly evident in the timing of the posterior emissions with and without δD. δD-constrained inversions assign roughly 5–10 Tg yr−1 more fossil emissions to the early 1990s and about 5–8 Tg yr−1 less to the 2010s than the carbon-only inversion, i.e. a higher early baseline and reduced recent growth. We note that the δD-inclusive inversions require higher fossil emissions, particularly in the late 1980s–early 1990s, but this overlaps with the model spin-up period (pre-1994) and should therefore be treated cautiously. Still, the consistent post-1994 behaviour across hydrogen-only, dual-isotope and DPT runs supports the robustness of the reduced fossil-growth result.
The downward revision of the fossil increase suggests an underestimation of fossil-fuel emissions in the used inventory in the 1990s and early 2000s, followed by a modest overestimation in the late 2010s (Fig. 4). Although fossil-fuel production continued to rise over this period (IEA, 2023), our posterior emissions stayed comparatively flat. This may result from several non-exclusive and overlapping factors – including declining emission intensity per unit production, the adoption of mitigation measures, changes in extraction and fuel-mix practices, or errors and biases in bottom-up reporting – rather than any single cause. This interpretation is supported by independent inventory estimates from the GAINS model, which also reports lower emission intensities in recent decades (Höglund-Isaksson et al., 2020) and by inversion studies that do not find large fossil-driven growth and in some cases point to increased biogenic contributions (Thompson et al., 2018; Schaefer et al., 2016). Taken together, these lines of evidence support our conclusion that the fossil-fuel growth is likely overestimated in the used bottom-up inventory.
Traditional inversion setups that fix thermogenic isotopic signatures may underestimate regional shifts toward lower-emission production systems, such as modern shale-gas operations in the USA between 2000 and 2012 (Uveges et al., 2025). The DPT framework explores fossil δD within ±5 ‰ of literature values (Table S3), encompassing both conventional gas and heavier shale gas signatures (Uveges et al., 2025; Riddell-Young et al., 2025). Even at the heavier end of this range, the atmospheric δD constraint requires substantial biogenic increases to explain the post-2006 growth, because the isotopic separation between fossil and biogenic methane in δD space (∼ 110–150 ‰) is large relative to the explored fossil δD range. It is also worth noting that if countries overreport fossil-fuel emissions in their national inventories, which serve as the foundation for bottom-up estimates, the resulting prior estimates will overestimate these emissions relative to atmospheric inversion results. Recent evaluation of China's carbon emissions, for example, found that coal-related CO2 output was overestimated due to incorrect assumptions about fuel quality, leading to a downward correction of ∼ 14% for 2013 emissions and a cumulative reduction of ∼ 10.6 Gt CO2 over 2000–2013 (Liu et al., 2015; Hu et al., 2025). Similar reporting uncertainties may affect CH4 inventories.
The decline in pyrogenic emissions (−8.0 Tg in priors) aligns well with satellite observations of shrinking burn areas and improved fire management (van der Werf et al., 2017), and inversions consistently confirm this downward trajectory. These results imply that fossil fuels have played a steady but secondary role in post-2006 CH4 growth, while biomass burning has declined more consistently than bottom-up inventories suggested. The reduction in net thermogenic growth from +36.0 to +7.7 Tg may indicate that certain emission drivers are potentially more influential in recent atmospheric trends than previously thought.
4.2 Temporal changes of biogenic emissions
Bottom-up priors suggest that wetlands, agriculture, and waste collectively contributed approximately +81.5 Tg to global biogenic CH4 growth from 1994 to 2022. However, all five inversion setups revise this estimate downward to between +68.6 and +73.7 Tg, with the DPT-ensemble yielding +69.0 Tg (Table S4). All five are cost-minimised solutions to the same observational constraints under different prior assumptions, and all converge on a ∼ 15% reduction in biogenic growth compared to prior estimates, while still making it the primary driver of post-2006 CH4 growth.
4.2.1 Wetlands
The inversion retains wetlands as a major source but substantially attributes that growth toward the SH, oversetting the NH contribution by two-thirds (Fig. 5). This hemispheric distribution coincides with more negative atmospheric δ13C-CH4 and δD-CH4 values, characteristic of biogenic CH4 (Michel et al., 2024). Field studies link this to ENSO variability, where La Niña events expand tropical inundation and boost CH4 release (Qu et al., 2024; Lin et al., 2024), aligning with the isotopic and atmospheric evidence.
4.2.2 Agriculture
Prior estimate attributes +22.3 Tg of CH4 growth to agriculture globally, dominated by +14.7 Tg from the NH, while all five inversion setups revise this downward, particularly in the NH (Fig. 5). The DPT-ensemble inversion estimates global agricultural growth at +12.0 Tg, with the NH contributing only +3.0 Tg and the SH +8.9 Tg. Similarly, the error-scaled inversion yields +14.7 Tg globally, with +5.4 Tg from the NH and +9.3 Tg from the SH. The shift aligns with documented adoption of CH4 mitigation practices in rice paddies and livestock systems, such as alternate wetting and drying (AWD) in rice fields and improved manure management (Shyamsundar et al., 2019; https://www.cimmyt.org/, last access: 4 January 2025). These findings suggest that while agriculture remains a significant source of CH4, its contribution to recent growth, especially in the NH, may be overstated in inventories. Also worth noting here is that the DPT optimised δ13C-CH4 source signature is increased by 1 ‰ relative to priors, suggesting a higher abundance of C4 crops, but such interpretations are inconclusive, particularly because source signatures and atmospheric observations in SH are fewer.
4.2.3 Waste
Waste-related CH4 emissions, originating from landfills, wastewater, and organic waste decomposition, occupy an intermediate isotopic space between biogenic and thermogenic sources. Prior inventories estimated global waste emissions growth at +29.1 Tg since 1994, concentrated in the NH (+22.7 Tg NH vs. +6.4 Tg SH). All inversion setups revise this estimate slightly downward, particularly in the NH. The DPT-ensemble and dual-isotope inversions both estimate global waste growth at approximately +23.5 and +23.4 Tg, respectively, with the error-scaled inversion yielding +22.4 Tg. Across all scenarios, NH waste growth is consistently reduced to between +15.5 and +16.8 Tg, which is well below the prior estimate of +22.7 Tg, while SH growth remains relatively stable at +6.7 to 6.9 Tg.
4.3 Revised methane lifetime
Across our inversion suite, the posterior global mean lifetime is 9.1 ± 0.1 years, i.e., +0.1 year relative to the fixed prior (9.0 years). Examining the trend over the analysis period, the inverted lifetime reveals a slight net shortening of ∼ 0.1 years. Hemispherically, the two-box posteriors consistently indicate an NH shortening of ∼ 0.2 ± 0.1 years and an SH lengthening of ∼ +0.3 ± 0.1 years.
We note that in an inversion system, such modest adjustments could reflect true changes in sink strength, but they may also compensate for source re-estimations. Therefore, we compare the results to independent evidence on OH changes: studies suggest that the overall OH loss rate is generally “well buffered”. The assigned uncertainty was approximately 10 %–15 % uncertainty during the 2000s (Saunois et al., 2020; Nisbet et al., 2019), which means that a 9 % increase in tropical OH (Anderson et al., 2021; Stavert et al., 2021; Stevenson et al., 2020) is near the detection limit of global-scale budget estimates, similar to our findings. If OH (and/or Cl) have indeed increased modestly, a small but real shortening of lifetime would be expected. Our inversion's global lifetime change (±0.1 year) aligns well between these perspectives: large enough to reflect plausible sink variability, yet small enough to be consistent with a largely stable OH background.
The hemispheric divergence, with NH lifetime declining (−0.2 ± 0.1 years) and SH lifetime increasing (+0.3 ± 0.1 years), qualitatively aligns with independent evidence of stronger oxidant increases in the NH (Anderson et al., 2021) and the southward re-estimation of wetland emissions. Starting from our two-box model structure, the SH box exhibits a baseline longer lifetime (∼ 9.3 years vs. 9.0 years NH) even in the prior, reflecting fundamental differences in oxidant regimes between hemispheres. We acknowledge that 3-D models are better suited for spatial attribution; our two-box framework limits robust hemispheric conclusions. We therefore focus on the more reliable global estimate: a slight lifetime decrease of ∼ 0.1 years. While modest, this adjustment improves the match to observed δ13C-CH4 and δD-CH4 trends, particularly by preventing overcorrection of isotopic signals when rebalancing source contributions.
4.4 Hemispheric Output and Error Scaling
The pronounced interannual variability in posterior wetland emissions reflects compensatory adjustments within an underdetermined inversion rather than model instability. Wetlands carry the largest absolute prior uncertainty (∼ 75 Tg yr−1 at 30 %), so year-to-year adjustments needed to balance atmospheric growth and lifetime variability are most strongly expressed in this category. Agriculture and waste, occupying intermediate isotopic space, are similarly susceptible. For this reason, sectoral growth is assessed using 3-year endpoint averages (Table S4) and 5-year moving averages (Fig. 4), which are robust across all five inversion scenarios. Our sensitivity experiments reveal that varying prior emission uncertainties from 30 % amplifies interannual (year-to-year) variability in posterior emissions. When prior uncertainties tighten below 30 %, absolute uncertainties scale with source size (e.g., wetlands: ∼ 75 → 50 Tg; pyrogenic: ∼ 12 → 8 Tg). To balance isotopic ratios annually, the inversion preferentially adjusts the largest sources because the same fixed uncertainty allows much larger absolute variability, leading to compensatory oscillations in posterior emissions and lifetime that can degrade isotopic fits. Only a minor fraction of this variability, if any, may be caused by teleconnections such as ENSO as seen in pyrogenic and wetland posterior emissions corresponding to El Niño and La Niña years, respectively. Similarly, relative observational error weighting between the 3 tracers critically influences inversion behaviour. Optimal performance occurs when relative uncertainties match isotopologue abundance ratios (1 ppb CH4, 0.01 ppb 13CH4, 0.001 ppb CH3D).
All inversions presented thus far have used fixed uncertainties across sources: 30 % for all emission categories and 10 % for the tropospheric lifetime. To test whether the results are sensitive to this choice, we implemented an error-scaled inversion that adjusts prior uncertainty weights based on the relative flux magnitude of each source. Specifically, larger sources are assigned proportionally smaller absolute uncertainties, while the tropospheric lifetime uncertainty is tightened from 10 % to 9 % based on a sensitivity analysis that shows this configuration optimally balances source and sink adjustments. This error-scaled configuration yields more moderate hemispheric re-estimation than the unweighted dual-isotope inversion while maintaining improved fits to isotopic observations. For example, SH wetland growth is +19.1 Tg (DPT) versus +13.1 Tg (error-scaled), while NH wetland growth is +14.4 Tg (DPT) versus +18.5 Tg (error-scaled). This demonstrates that hemispheric attributions are sensitive to prior weighting, although the global totals remain robust (+69.0 Tg vs. +68.6 Tg biogenic growth).
4.5 New inferences from incorporating δD-CH4 into the two-box model
Runs that include δD-CH4 (hydrogen-only, dual-isotope, DPT-ensemble) consistently yield smaller thermogenic and pyrogenic growth than the carbon-only inversion (+7.9–9.1 Tg vs. +16.6 Tg). δD-CH4 is particularly responsive to the enriched deuterium signature of fossil CH4 (also pyrogenic), and how fast that CH4 is oxidised by OH (Stell et al., 2021). The physical basis for this distinction lies in the magnitude of KIEs and the ranges of source signatures. The tropospheric KIE for deuterium (1.313) corresponds to a fractionation of 313 ‰, compared to 6.8 ‰ for carbon (KIE 1.0068), meaning the deuterium KIE deviation is approximately 46 times larger. This amplification is further enhanced by the large separation between biogenic and thermogenic source signatures in δD space (Table 1): biogenic sources range from −299 ‰ to −339 ‰, while fossil fuels cluster near −191 ‰ to −192 ‰, a separation of ∼ 110 ‰–150 ‰. For comparison, the δ13C separation is only ∼ 20 ‰ (biogenic: −58 ‰ to −64 ‰; fossil: −44 ‰). This results in higher fossil emissions at the beginning of our analysis period, and thus a smaller growth over the following decades, compared to the prior emissions.
The emission trends derived from our δD–CH4–constrained inversions closely align with those of other recent isotope studies, which collectively suggest that the post-2006 CH4 growth is primarily microbial in origin, rather than fossil. Riddell-Young et al. (2025) found that both δ13C- and δD-based mass balances attribute over 70 Tg yr−1 of the 2006–2023 CH4 increase to microbial sources, with little to no fossil trends after 2013. Our δD-inclusive inversions similarly produce only a very small net thermogenic and pyrogenic growth (∼ 8–10 Tg) and significantly larger biogenic growth (∼ 70 Tg). In our 2-box modelling setup, this is associated with a redistribution of emissions toward SH wetlands, reinforcing the notion that microbial sources dominate recent CH4 increases. Fujita et al. (2025) likewise obtained a near-flat fossil emission trajectory after the early 2000s, closely matching the magnitude and trend of our posterior fossil emissions (Fig. 4d). Moreover, their inferred increase in OH (Fig. 6g) is consistent with the slight CH4 lifetime decrease NH in our inversions (Table S4), indicating that modest sink strengthening, rather than rising fossil emissions, helps reconcile the post-2006 CH4 growth. Chandra et al. (2024) highlighted major inventory biases in GAINS and EDGAR fossil sectors; our δD inversions support this interpretation but indicate that correcting early-period fossil baselines, rather than invoking strong post-2000 growth, better reconciles observed isotope trends. Together, these comparisons confirm that δD-CH4 constraints yield smaller trends in fossil contributions than earlier inventories or single-isotope studies, providing independent support for a microbial-dominated CH4 rise and underscoring the value of δD-CH4 for refining emission histories.
4.6 Limitations of the two-box approach
Our two-box framework offers a conceptual and computationally efficient method for combining CH4, δ13C, and δD observations, with the option to perform DPT experiments using millions of individual inversion runs. On the other hand, the two-box model approach has obvious limitations that impact spatial attribution and limit the attribution of the inferred emission adjustments. This approach, by design, collapses latitudinal structure into two hemispheric reservoirs, which removes regional signals, does not resolve mid-latitude or tropical gradients, and importantly, does not include intrahemispheric transport. The conclusions drawn at the global scale, i.e., the dominance of biogenic growth and the reduced fossil-fuel trend, are consistent across all inversion scenarios and are insensitive to lifetime partitioning between hemispheres. Hemispheric-scale results, including the NH/SH wetland split and hemispheric lifetime trends, are more sensitive to model structure and should be interpreted with caution. One question is then how the hemispheric averages are constructed. In our work, we used high-latitude station records because they provide reliable and consistent temporal trends, including robust inter-laboratory offset estimation (Dasgupta et al., 2025a). This requires corrections for the latitudinal gradient to infer hemispheric averages, an approach that carries error when gradients change over time. Alternatively, the inter-laboratory offsets could also be applied to lower-latitude time series, where direct inter-station comparisons are more problematic because of stronger regional influences from nearby sources. However, if regional variability is included anyway, using explicit 3D models that incorporate spatial variability and atmospheric transport is likely the more insightful approach. Spatially resolved inversions may then provide more detailed insight into the origin of the derived emission adjustments compared to the prior. Based on our results, including δD, it can indeed provide additional constraints compared to δ13C alone. Thus, it is also important to expand δD observations, which are still limited compared to δ13C.
This study demonstrates that incorporating both carbon (δ13C-CH4) and hydrogen (δD-CH4) isotopes into a two-box inversion framework enhances our understanding of the strength and temporal evolution of global CH4 sources and sinks. All five inversion setups estimate that after 2007, wetland emissions must increase to reconcile the trend in atmospheric CH4 isotopologues. Hemispheric CH4 lifetimes diverge, while globally, a small decrease in lifetime is observed.
Our results confirm that biogenic CH4 sources are the main driver of the post-2006 CH4 growth, although their increase and sectoral re-estimation have been revised from prior inventories. Second, thermogenic and pyrogenic growth are far smaller than previously thought, due to lower fossil fuel growth and stronger declines in pyrogenic emissions. Third, wetland emissions have shifted southward, with the SH now contributing nearly as much, or more, to global wetland growth as the NH, reflecting stronger tropical wetland responses to climate change. Fourth, agricultural emissions are revised downward, especially in the NH, where growth drops from +14.7 to just +3.0–5.4 Tg, while SH contributions remain stable. Fifth, the dual-isotope inverted lifetime of CH4 shortens between 1994 and 2022 (−0.1 years), with hemispheric adjustments diverging (NH: −0.2 years; SH: +0.3 years).
While the two-box model provides robust global insights, it lacks spatial resolution. Error-scaled inversions confirm that hemispheric re-estimations are affected by prior uncertainty, but regional source–sink interplay remains unresolved. Future work should expand δD-CH4 observations, especially in tropical and mid-latitude regions, and adopt 3-D or 4-D inversion frameworks to improve spatial attribution and reduce residual uncertainties.
The harmonised dataset used in the inversion model is available on the ICOS data portal at https://doi.org/10.18160/V1Y4-NTK0 (Dasgupta et al., 2025b). The relevant Python scripts for the inversion model are available from the author upon request. Additional descriptions, sensitivity tests, the governing continuity equations of the 2-box model, and its numerical implementation are available in the Supplement.
The supplement related to this article is available online at https://doi.org/10.5194/acp-26-8601-2026-supplement.
BD and TR conceptualised the manuscript. BD carried out the analysis, investigation, methodology and visualisation. SP, MM, and SH contributed to inversion modelling, analysis, and visualisation. MM, BRY, RF, SEM and PS helped with analysis and investigation. All authors contributed to the review and editing.
The contact author has declared that none of the authors has any competing interests.
Publisher's note: Copernicus Publications remains neutral with regard to jurisdictional claims made in the text, published maps, institutional affiliations, or any other geographical representation in this paper. The authors bear the ultimate responsibility for providing appropriate place names. Views expressed in the text are those of the authors and do not necessarily reflect the views of the publisher.
The project (24GRD03 – MetHIR) has received funding from the European Partnership on Metrology, co-financed from the European Union's Horizon Europe Research and Innovation Programme and by the Participating States. Part of this work was carried out at the Jet Propulsion Laboratory, California Institute of Technology, under a contract with the National Aeronautics and Space Administration (80NM0018D0004). This study was supported in part by NOAA cooperative agreement NA22OAR4320151 and was also partially supported by NOAA Climate Program Office AC4 program award NA23OAR4310283.
This research has been supported by the European Partnership on Metrology (grant no. 24GRD03 – MetHIR)
This paper was edited by Tanja Schuck and reviewed by two anonymous referees.
Anderson, D. C., Duncan, B. N., Fiore, A. M., Baublitz, C. B., Follette-Cook, M. B., Nicely, J. M., and Wolfe, G. M.: Spatial and temporal variability in the hydroxyl (OH) radical: understanding the role of large-scale climate features and their influence on OH through its dynamical and photochemical drivers, Atmos. Chem. Phys., 21, 6481–6508, https://doi.org/10.5194/acp-21-6481-2021, 2021.
Basu, S., Lan, X., Dlugokencky, E., Michel, S., Schwietzke, S., Miller, J. B., Bruhwiler, L., Oh, Y., Tans, P. P., Apadula, F., Gatti, L. V., Jordan, A., Necki, J., Sasakawa, M., Morimoto, S., Di Iorio, T., Lee, H., Arduini, J., and Manca, G.: Estimating emissions of methane consistent with atmospheric measurements of methane and δ13C of methane, Atmos. Chem. Phys., 22, 15351–15377, https://doi.org/10.5194/acp-22-15351-2022, 2022.
Bellisario, L. M., Bubier, J. L., Moore, T. R., and Chanton, J. P.: Controls on CH4 emissions from a northern peatland, Global Biogeochem. Cy., 13, 81–91, https://doi.org/10.1029/1998GB900021, 1999.
Bousquet, P., Ciais, P., Miller, J. B., Dlugokencky, E. J., Hauglustaine, D. A., Prigent, C., Van der Werf, G. R., Peylin, P., Brunke, E. G., Carouge, C., and Langenfelds, R. L.: Contribution of anthropogenic and natural sources to atmospheric methane variability, Nature, 443, 439–443, https://doi.org/10.1038/nature05132, 2006.
Bousquet, P., Ringeval, B., Pison, I., Dlugokencky, E. J., Brunke, E.-G., Carouge, C., Chevallier, F., Fortems-Cheiney, A., Frankenberg, C., Hauglustaine, D. A., Krummel, P. B., Langenfelds, R. L., Ramonet, M., Schmidt, M., Steele, L. P., Szopa, S., Yver, C., Viovy, N., and Ciais, P.: Source attribution of the changes in atmospheric methane for 2006–2008, Atmos. Chem. Phys., 11, 3689–3700, https://doi.org/10.5194/acp-11-3689-2011, 2011.
Cantrell, C. A., Shetter, R. E., McDaniel, A. H., Calvert, J. G., Davidson, J. A., Lowe, D. C., Tyler, S. C., Cicerone, R. J., and Greenberg, J. P.: Carbon kinetic isotope effect in the oxidation of methane by the hydroxyl radical, J. Geophys. Res., 95, 22455–22462, https://doi.org/10.1029/JD095iD13p22455, 1990.
Chandra, N., Patra, P. K., Fujita, R., Höglund-Isaksson, L., Umezawa, T., Goto, D., Morimoto, S., Vaughn, B. H., and Röckmann, T.: Methane emissions decreased in fossil fuel exploitation and sustainably increased in microbial source sectors during 1990–2020, Commun. Earth Environ., 5, 147, https://doi.org/10.1038/s43247-024-01286-x, 2024.
Dasgupta, B., Menoud, M., van der Veen, C., Levin, I., Veidt, C., Moossen, H., Englund Michel, S., Sperlich, P., Morimoto, S., Fujita, R., Umezawa, T., Platt, S., Zwaaftink, C. G., Myhre, C. L., Fisher, R., Lowry, D., Nisbet, E. G., France, J., Woolley Maisch, C., Brailsford, G., Moss, R., Goto, D., Pandey, S., Houweling, S., Warwick, N., and Röckmann, T.: Harmonisation of methane isotope ratio measurements from different laboratories using atmospheric samples, Atmos. Meas. Tech., 18, 6591–6607, https://doi.org/10.5194/amt-18-6591-2025, 2025a.
Dasgupta, B., Menoud, M., van der Veen, C., Levin, I., Moossen, H., Englund Michel, S., Sperlich, P., Morimoto, S., Fujita, R., Umezawa, T., Platt, S. M., Groot Zwaaftink, C., Lund Myhre, C., Fisher, R., Lowry, D., Nisbet, E., France, J., Woolley Maisch, C., Brailsford, G., Moss, R., Goto, D., Pandey, S., Houweling, S., Warwick, N., and Röckmann, T.: Harmonised and offset corrected methane isotopic composition (ch4, 13ch4, d2h_ch4) from high northern and southern latitudes, ICOS Data Portal [data set], https://doi.org/10.18160/V1Y4-NTK0, 2025b.
Douglas, P. M. J., Stratigopoulos, E., Park, S., and Phan, D.: Geographic variability in freshwater methane hydrogen isotope ratios and its implications for global isotopic source signatures, Biogeosciences, 18, 3505–3527, https://doi.org/10.5194/bg-18-3505-2021, 2021.
Fujita, R., Graven, H., Zazzeri, G., Hmiel, B., Petrenko, V. V., Smith, A. M., Michel, S. E., and Morimoto, S.: Global fossil methane emissions constrained by multi-isotopic atmospheric methane histories, J. Geophys. Res.-Atmos., 130, e2024JD041266, https://doi.org/10.1029/2024JD041266, 2025.
Fujita, R., Morimoto, S., Maksyutov, S., Kim, H.-S., Arshinov, M., Brailsford, G., Aoki, S., and Nakazawa, T.: Global and Regional CH4 Emissions for 1995–2013 Derived From Atmospheric CH4, δ13C-CH4, and δD-CH4 Observations and a Chemical Transport Model, J. Geophys. Res.-Atmos., 125, e2020JD032903, https://doi.org/10.1029/2020JD032903, 2020.
Höglund-Isaksson, L., Gómez-Sanabria, A., Klimont, Z., Rafaj, P., and Schöpp, W.: Technical potentials and costs for reducing global anthropogenic methane emissions in the 2050 timeframe–results from the GAINS model, Environ. Res. Commun., 2, 025004, https://doi.org/10.1088/2515-7620/ab7457, 2020.
Hornibrook, E. R. and Bowes, H. L.: Trophic status impacts both the magnitude and stable carbon isotope composition of methane flux from peatlands, Geophys. Res. Lett., 34, L21401, https://doi.org/10.1029/2007GL031231, 2007.
Hornibrook, E. R.: The stable carbon isotope composition of methane produced and emitted from northern peatlands, in: Carbon cycling in northern peatlands, Geophys. Monogr. Ser., 184, 187–203, https://doi.org/10.1029/2008GM000828, 2009.
Houweling, S., Bergamaschi, P., Chevallier, F., Heimann, M., Kaminski, T., Krol, M., Michalak, A. M., and Patra, P.: Global inverse modeling of CH4 sources and sinks: an overview of methods, Atmos. Chem. Phys., 17, 235–256, https://doi.org/10.5194/acp-17-235-2017, 2017.
Hu, H., Geng, G., Xu, R., Liu, Y., Shi, Q., Xiao, Q., Liu, X., Zheng, B., Zhang, Q., and He, K.: Notable uncertainties in near real-time CO2 emission estimates in China, npj Clim. Atmos. Sci., 8, 108, https://doi.org/10.1038/s41612-025-00991-4, 2025.
IEA: Fossil fuel supply, IEA, Paris, https://www.iea.org/reports/fossil-fuel-supply (last access: 4 January 2025), 2023.
Kirschke, S., Bousquet, P., Ciais, P., Saunois, M., Canadell, J. G., Dlugokencky, E. J., Bergamaschi, P., Bergmann, D., Blake, D. R., Bruhwiler, L., Cameron-Smith, P., Castaldi, S., Chevallier, F., Feng, L., Fraser, A., Heimann, M., Hodson, E. L., Houweling, S., Josse, B., Fraser, P. J., Krummel, P. B., Lamarque, J.-F., Langenfelds, R. L., Le Quéré, C., Naik, V., O'Doherty, S., Palmer, P. I., Pison, I., Plummer, D., Poulter, B., Prinn, R. G., Rigby, M., Ringeval, B., Santini, M., Schmidt, M., Shindell, D. T., Simpson, I. J., Spahni, R., Steele, L. P., Strode, S. A., Sudo, K., Szopa, S., van der Werf, G. R., Voulgarakis, A., van Weele, M., Weiss, R. F., Williams, J. E., and Zeng, G.: Three decades of global methane sources and sinks, Nat. Geosci., 6, 813–823, https://doi.org/10.1038/ngeo1955, 2013.
Lan, X., Basu, S., Schwietzke, S., Bruhwiler, L. M. P., Dlugokencky, E. J., Michel, S. E., Sherwood, O. A., Tans, P. P., Thoning, K., Etiope, G., Zhuang, Q., Liu, L., Oh, Y., Miller, J. B., Pétron, G., Vaughn, B. H., and Crippa, M.: Improved Constraints on Global Methane Emissions and Sinks Using δ13C-CH4, Global Biogeochem. Cy., 35, e2021GB007000, https://doi.org/10.1029/2021GB007000, 2021.
Lin, X., Peng, S., Ciais, P., Hauglustaine, D., Lan, X., Liu, G., Ramonet, M., Xi, Y., Yin, Y., Zhang, Z., Bösch, H., Bousquet, P., Saunois, M., and Li, Z.: Recent methane surges reveal heightened emissions from tropical inundated areas, Nat. Commun., 15, 10894, https://doi.org/10.1038/s41467-024-55266-y, 2024.
Liu, Z., Guan, D., Wei, W., Davis, S. J., Ciais, P., Bai, J., Peng, S., Zhang, Q., Hubacek, K., Marland, G., Andres, R. J., Crawford-Brown, D., Lin, J., Zhao, H., Hong, C., Boden, T. A., Feng, K., Peters, G. P., Xi, F., Liu, J., Li, Y., Zhao, Y., Zeng, N., and He, K.: Reduced carbon emission estimates from fossil fuel combustion and cement production in China, Nature, 524, 335–338, https://doi.org/10.1038/nature14677, 2015.
Menoud, M., van der Veen, C., Lowry, D., Fernandez, J. M., Bakkaloglu, S., France, J. L., Fisher, R. E., Maazallahi, H., Stanisavljević, M., Nęcki, J., Vinkovic, K., Łakomiec, P., Rinne, J., Korbeń, P., Schmidt, M., Defratyka, S., Yver-Kwok, C., Andersen, T., Chen, H., and Röckmann, T.: New contributions of measurements in Europe to the global inventory of the stable isotopic composition of methane, Earth Syst. Sci. Data, 14, 4365–4386, https://doi.org/10.5194/essd-14-4365-2022, 2022.
Michel, S. E., Lan, X., Miller, J., Tans, P., Clark, J. R., Schaefer, H., Sperlich, P., Brailsford, G., Morimoto, S., Moossen, H., Li, J., Englund Michel, S., Umezawa, T., and Röckmann, T.: Rapid shift in methane carbon isotopes suggests microbial emissions drove record high atmospheric methane growth in 2020–2022, P. Natl. Acad. Sci. USA, 121, e2411212121, https://doi.org/10.1073/pnas.2411212121, 2024.
Mikaloff Fletcher, S. E., Tans, P. P., Bruhwiler, L. M., Miller, J. B., and Heimann, M.: CH4 sources estimated from atmospheric observations of CH4 and its isotopic ratios: 1. Inverse modeling of source processes, Global Biogeochem. Cy., 18, GB4004, https://doi.org/10.1029/2004GB002223, 2004.
Monteil, G., Houweling, S., Dlugockenky, E. J., Maenhout, G., Vaughn, B. H., White, J. W. C., and Rockmann, T.: Interpreting methane variations in the past two decades using measurements of CH4 mixing ratio and isotopic composition, Atmos. Chem. Phys., 11, 9141–9153, https://doi.org/10.5194/acp-11-9141-2011, 2011.
Myhre, G., Shindell, D., Bréon, F. M., Collins, W., Fuglestvedt, J., Huang, J., Koch, D., Lamarque, J. F., Lee, D., Mendoza, B., Nakajima, T., Robock, A., Stephens, G., Takemura, T., and Zhang, H.: Anthropogenic and natural radiative forcing, in: Climate Change 2013: The Physical Science Basis. Contribution of Working Group I to the Fifth Assessment Report of the Intergovernmental Panel on Climate Change, edited by: Stocker, T. F., Qin, D., Plattner, G.-K., Tignor, M., Allen, S. K., Boschung, J., Nauels, A., Xia, Y., Bex, V., and Midgley, P. M., Cambridge University Press, Cambridge, United Kingdom and New York, NY, USA, 659–740, https://doi.org/10.1017/CBO9781107415324.018, 2014.
Nisbet, E. G., Dlugokencky, E. J., Manning, M. R., Lowry, D., Fisher, R. E., France, J. L., Michel, S. E., Miller, J. B., White, J. W. C., Vaughn, B., Bousquet, P., Pyle, J. A., Warwick, N. J., Cain, M., Brownlow, R., Zazzeri, G., Lanoisellé, M., Manning, A. C., Gloor, E., Worthy, D. E. J., Brunke, E.-G., Labuschagne, C., Wolff, E. W., and Ganesan, A. L.: Rising atmospheric methane: 2007–2014 growth and isotopic shift, Global Biogeochem. Cy., 30, 1356–1370, https://doi.org/10.1002/2016GB005406, 2016.
Nisbet, E. G., Manning, M. R., Dlugokencky, E. J., Fisher, R. E., Lowry, D., Michel, S. E., Lund Myhre, C., Platt, S. M., Allen, G., Bousquet, P., Brownlow, R., Cain, M., France, J. L., Hermansen, O., Hossaini, R., Jones, A. E., Levin, I., Manning, A. C., Myhre, G., Pyle, J. A., Vaughn, B. H., Warwick, N. J., and White, J. W. C.: Very Strong Atmospheric Methane Growth in the 4 Years 2014–2017: Implications for the Paris Agreement, Global Biogeochem. Cy., 33, 318–342, https://doi.org/10.1029/2018GB006009, 2019.
Prather, M. J., Holmes, C. D., and Hsu, J.: Reactive greenhouse gas scenarios: Systematic exploration of uncertainties and the role of atmospheric chemistry, Geophys. Res. Lett., 39, L09803, https://doi.org/10.1029/2012GL051440, 2012.
Qu, Z., Jacob, D. J., Bloom, A. A., Worden, J. R., Parker, R. J., and Boesch, H.: Inverse modeling of 2010–2022 satellite observations shows that inundation of the wet tropics drove the 2020–2022 methane surge, P. Natl. Acad. Sci. USA, 121, e2402730121, https://doi.org/10.1073/pnas.2402730121, 2024.
Reeburgh, W. S., Hirsch, A. I., Sansone, F. J., Popp, B. N., and Rust, T. M.: Carbon kinetic isotope effect accompanying microbial oxidation of methane in boreal forest soils, Geochim. Cosmochim. Ac., 61, 4761–4767, https://doi.org/10.1016/S0016-7037(97)00277-9, 1997.
Riddell-Young, B., Michel, S.E., Lan, X., Tans, P., Röckmann, T., Dasgupta, B., Oh, Y., Bruhwiler, L.M., Fujita, R., Umezawa, T., and Morimoto, S.: Microbial driver of 2006–2023 CH4 growth indicated by trends in atmospheric δD–CH4 and δ13C–CH4. P. Natl. Acad. Sci. USA, 122, e2516543122, https://doi.org/10.1073/pnas.2516543122, 2025.
Rigby, M., Manning, A. J., and Prinn, R. G.: The value of high-frequency high-precision methane isotopologue measurements for source and sink estimation, J. Geophys. Res.-Atmos., 117, D12312, https://doi.org/10.1029/2011JD017384, 2012.
Röckmann, T., Brass, M., Borchers, R., and Engel, A.: The isotopic composition of methane in the stratosphere: high-altitude balloon sample measurements, Atmos. Chem. Phys., 11, 13287–13304, https://doi.org/10.5194/acp-11-13287-2011, 2011.
Sapart, C. J., Martinerie, P., Witrant, E., Chappellaz, J., van de Wal, R. S. W., Sperlich, P., van der Veen, C., Bernard, S., Sturges, W. T., Blunier, T., Schwander, J., Etheridge, D., and Röckmann, T.: Can the carbon isotopic composition of methane be reconstructed from multi-site firn air measurements?, Atmos. Chem. Phys., 13, 6993–7005, https://doi.org/10.5194/acp-13-6993-2013, 2013.
Saueressig, G., Bergamaschi, P., Crowley, J. N., Fischer, H., and Harris, G. W.: Carbon kinetic isotope effect in the reaction of CH4 with Cl atoms, Geophys. Res. Lett., 22, 1225–1228, https://doi.org/10.1029/95GL00881, 1995.
Saueressig, G., Bergamaschi, P., Crowley, J. N., Fischer, H., and Harris, G. W.: DH kinetic isotope effect in the reaction CH4+ Cl, Geophys. Res. Lett., 23, 3619–3622, https://doi.org/10.1029/96GL03292, 1996.
Saueressig, G., Crowley, J. N., Bergamaschi, P., Brühl, C., Brenninkmeijer, C. A. M., and Fischer, H.: Carbon 13 and D kinetic isotope effects in the reactions of CH4 with O(1D) and OH: New laboratory measurements and their implications for the isotopic composition of stratospheric methane, J. Geophys. Res.-Atmos., 106, 23127–23138, https://doi.org/10.1029/2000JD000120, 2001.
Saunois, M., Bousquet, P., Poulter, B., Peregon, A., Ciais, P., Canadell, J. G., Dlugokencky, E. J., Etiope, G., Bastviken, D., Houweling, S., Janssens-Maenhout, G., Tubiello, F. N., Castaldi, S., Jackson, R. B., Alexe, M., Arora, V. K., Beerling, D. J., Bergamaschi, P., Blake, D. R., Brailsford, G., Brovkin, V., Bruhwiler, L., Crevoisier, C., Crill, P., Covey, K., Curry, C., Frankenberg, C., Gedney, N., Höglund-Isaksson, L., Ishizawa, M., Ito, A., Joos, F., Kim, H.-S., Kleinen, T., Krummel, P., Lamarque, J.-F., Langenfelds, R., Locatelli, R., Machida, T., Maksyutov, S., McDonald, K. C., Marshall, J., Melton, J. R., Morino, I., Naik, V., O'Doherty, S., Parmentier, F.-J. W., Patra, P. K., Peng, C., Peng, S., Peters, G. P., Pison, I., Prigent, C., Prinn, R., Ramonet, M., Riley, W. J., Saito, M., Santini, M., Schroeder, R., Simpson, I. J., Spahni, R., Steele, P., Takizawa, A., Thornton, B. F., Tian, H., Tohjima, Y., Viovy, N., Voulgarakis, A., van Weele, M., van der Werf, G. R., Weiss, R., Wiedinmyer, C., Wilton, D. J., Wiltshire, A., Worthy, D., Wunch, D., Xu, X., Yoshida, Y., Zhang, B., Zhang, Z., and Zhu, Q.: The global methane budget 2000–2012, Earth Syst. Sci. Data, 8, 697–751, https://doi.org/10.5194/essd-8-697-2016, 2016.
Saunois, M., Stavert, A. R., Poulter, B., Bousquet, P., Canadell, J. G., Jackson, R. B., Raymond, P. A., Dlugokencky, E. J., Houweling, S., Patra, P. K., Ciais, P., Arora, V. K., Bastviken, D., Bergamaschi, P., Blake, D. R., Brailsford, G., Bruhwiler, L., Carlson, K. M., Carrol, M., Castaldi, S., Chandra, N., Crevoisier, C., Crill, P. M., Covey, K., Curry, C. L., Etiope, G., Frankenberg, C., Gedney, N., Hegglin, M. I., Höglund-Isaksson, L., Hugelius, G., Ishizawa, M., Ito, A., Janssens-Maenhout, G., Jensen, K. M., Joos, F., Kleinen, T., Krummel, P. B., Langenfelds, R. L., Laruelle, G. G., Liu, L., Machida, T., Maksyutov, S., McDonald, K. C., McNorton, J., Miller, P. A., Melton, J. R., Morino, I., Müller, J., Murguia-Flores, F., Naik, V., Niwa, Y., Noce, S., O'Doherty, S., Parker, R. J., Peng, C., Peng, S., Peters, G. P., Prigent, C., Prinn, R., Ramonet, M., Regnier, P., Riley, W. J., Rosentreter, J. A., Segers, A., Simpson, I. J., Shi, H., Smith, S. J., Steele, L. P., Thornton, B. F., Tian, H., Tohjima, Y., Tubiello, F. N., Tsuruta, A., Viovy, N., Voulgarakis, A., Weber, T. S., van Weele, M., van der Werf, G. R., Weiss, R. F., Worthy, D., Wunch, D., Yin, Y., Yoshida, Y., Zhang, W., Zhang, Z., Zhao, Y., Zheng, B., Zhu, Q., Zhu, Q., and Zhuang, Q.: The Global Methane Budget 2000–2017, Earth Syst. Sci. Data, 12, 1561–1623, https://doi.org/10.5194/essd-12-1561-2020, 2020.
Saunois, M., Martinez, A., Poulter, B., Zhang, Z., Raymond, P. A., Regnier, P., Canadell, J. G., Jackson, R. B., Patra, P. K., Bousquet, P., Ciais, P., Dlugokencky, E. J., Lan, X., Allen, G. H., Bastviken, D., Beerling, D. J., Belikov, D. A., Blake, D. R., Castaldi, S., Crippa, M., Deemer, B. R., Dennison, F., Etiope, G., Gedney, N., Höglund-Isaksson, L., Holgerson, M. A., Hopcroft, P. O., Hugelius, G., Ito, A., Jain, A. K., Janardanan, R., Johnson, M. S., Kleinen, T., Krummel, P. B., Lauerwald, R., Li, T., Liu, X., McDonald, K. C., Melton, J. R., Mühle, J., Müller, J., Murguia-Flores, F., Niwa, Y., Noce, S., Pan, S., Parker, R. J., Peng, C., Ramonet, M., Riley, W. J., Rocher-Ros, G., Rosentreter, J. A., Sasakawa, M., Segers, A., Smith, S. J., Stanley, E. H., Thanwerdas, J., Tian, H., Tsuruta, A., Tubiello, F. N., Weber, T. S., van der Werf, G. R., Worthy, D. E. J., Xi, Y., Yoshida, Y., Zhang, W., Zheng, B., Zhu, Q., Zhu, Q., and Zhuang, Q.: Global Methane Budget 2000–2020, Earth Syst. Sci. Data, 17, 1873–1958, https://doi.org/10.5194/essd-17-1873-2025, 2025.
Schaefer, H., Fletcher, S. E. M., Veidt, C., Lassey, K. R., Brailsford, G. W., Bromley, T. M., Dlugokencky, E. J., Michel, S. E., Miller, J. B., Levin, I., Lowe, D. C., Martin, R. J., Vaughn, B. H., and White, J. W. C.: A 21st-century shift from fossil-fuel to biogenic methane emissions indicated by 13CH4, Science, 352, 80–84, https://doi.org/10.1126/science.aad2705, 2016.
Schwietzke, S., Sherwood, O. A., Bruhwiler, L. M. P., Miller, J. B., Etiope, G., Dlugokencky, E. J., Michel, S. E., Arling, V. A., Vaughn, B. H., White, J. W. C., and Tans, P. P.: Upward revision of global fossil fuel methane emissions based on isotope database, Nature, 538, 88–91, https://doi.org/10.1038/nature19797, 2016.
Sherwood, O. A., Schwietzke, S., Arling, V. A., and Etiope, G.: Global Inventory of Gas Geochemistry Data from Fossil Fuel, Microbial and Burning Sources, version 2017, Earth Syst. Sci. Data, 9, 639–656, https://doi.org/10.5194/essd-9-639-2017, 2017.
Shyamsundar, P., Springer, N. P., Tallis, H., Polasky, S., Jat, M. L., Sidhu, H. S., Krishnapriya, P. P., Skiba, N., Ginn, W., Ahuja, V., Cummins, J., Datta, I., Dholakia, H. H., Dixon, J., Farrell, P., Gonzalez-Abraham, C., Tittonell, P., Leisher, C., Mandle, L., Mulligan, M., Naeem, S., Ricketts, T. H., Wunder, S., and Zhang, W.: Fields on fire: Alternatives to crop residue burning in India, Science, 365, 536–538, https://doi.org/10.1126/science.aaw4085, 2019.
Snover, A. K. and Quay, P. D.: Hydrogen and carbon kinetic isotope effects during soil uptake of atmospheric methane, Global Biogeochem. Cy., 14, 25–39, https://doi.org/10.1029/1999GB900089, 2000.
Stavert, A. R., Saunois, M., Canadell, J. G., Poulter, B., Jackson, R. B., Regnier, P., Lauerwald, R., Raymond, P. A., Allen, G. H., Patra, P. K., Bergamaschi, P., Bousquet, P., Chandra, N., Ciais, P., Gustafson, A., Ishizawa, M., Ito, A., Kleinen, T., Maksyutov, S., Joe McNorton, J. R., Melton, Müller, J., Niwa, Y., Peng, S., Riley, W. J., Segers, A., Tian, H., Tsuruta, A., Yin, Y., Zhang, Z., Zheng, B., and Zhuang, Q.: Regional trends and drivers of the global methane budget, Glob. Change Biol., 28, 182–200, https://doi.org/10.1111/gcb.15901, 2021.
Stell, A. C., Douglas, P. M. J., Rigby, M., and Ganesan, A. L.: The impact of spatially varying wetland source signatures on the atmospheric variability of δD-CH4, Philos. T. R. Soc. A, 379, 20200442, https://doi.org/10.1098/rsta.2020.0442, 2021.
Stevenson, D. S., Zhao, A., Naik, V., O'Connor, F. M., Tilmes, S., Zeng, G., Murray, L. T., Collins, W. J., Griffiths, P. T., Shim, S., Horowitz, L. W., Sentman, L. T., and Emmons, L.: Trends in global tropospheric hydroxyl radical and methane lifetime since 1850 from AerChemMIP, Atmos. Chem. Phys., 20, 12905–12920, https://doi.org/10.5194/acp-20-12905-2020, 2020.
Thompson, R. L., Nisbet, E. G., Pisso, I., Stohl, A., Blake, D., Dlugokencky, E. J., Helmig, D., and White, J. W. C.: Variability in Atmospheric Methane From Fossil Fuel and Microbial Sources Over the Last Three Decades, Geophys. Res. Lett., 45, 11499–11508, https://doi.org/10.1029/2018GL078127, 2018.
Turner, A. J., Frankenberg, C., Wennberg, P. O., and Jacob, D. J.: Ambiguity in the causes for decadal trends in atmospheric methane and hydroxyl, P. Natl. Acad. Sci. USA, 114, 5367–5372, https://doi.org/10.1073/pnas.1616020114, 2017.
Tyler, S. C., Brailsford, G. W., Yagi, K., Minami, K., and Cicerone, R. J.: Seasonal variations in methane flux and δ13CH4 values for rice paddies in Japan and their implications, Global Biogeochem. Cy., 8, 1–12, https://doi.org/10.1029/93GB03123, 1994.
Tyler, S. C., Rice, A. L., and Ajie, H. O.: Stable isotope ratios in atmospheric CH4: Implications for seasonal sources and sinks, J. Geophys. Res., 112, D03303, https://doi.org/10.1029/2006JD007231, 2007.
Uveges, B. T., Howarth, R. W., and Sparks, J. P.: Fossil fuel methane emissions likely underestimated in a model based on atmospheric δ13C trends, P. Natl. Acad. Sci. USA, 122, e2507837122, https://doi.org/10.1073/pnas.2507837122, 2025.
van der Werf, G. R., Randerson, J. T., Giglio, L., van Leeuwen, T. T., Chen, Y., Rogers, B. M., Mu, M., van Marle, M. J. E., Morton, D. C., Collatz, G. J., Yokelson, R. J., and Kasibhatla, P. S.: Global fire emissions estimates during 1997–2016, Earth Syst. Sci. Data, 9, 697–720, https://doi.org/10.5194/essd-9-697-2017, 2017.
Warwick, N. J., Cain, M. L., Fisher, R., France, J. L., Lowry, D., Michel, S. E., Nisbet, E. G., Vaughn, B. H., White, J. W. C., and Pyle, J. A.: Using δ13C-CH4 and δD-CH4 to constrain Arctic methane emissions, Atmos. Chem. Phys., 16, 14891–14908, https://doi.org/10.5194/acp-16-14891-2016, 2016.
Worden, J. R., Bloom, A. A., Pandey, S., Jiang, Z., Worden, H. M., Walker, T. W., Houweling, S., and Röckmann, T.: Reduced biomass burning emissions reconcile conflicting estimates of the post-2006 atmospheric methane budget, Nat. Commun., 8, 2227, https://doi.org/10.1038/s41467-017-02246-0, 2017.