the Creative Commons Attribution 4.0 License.
the Creative Commons Attribution 4.0 License.
 | 10 Jun 2026
Impact of future aircraft NOx emissions on atmospheric composition and climate: dependence on background conditions
Zosia Staniaszek
Didier A. Hauglustaine
Yann Cohen
Agnieszka Skowron
Sigrun Matthes
Robin Thor
Marianne T. Lund
Aviation emissions are predicted to have caused 4 % of anthropogenic warming to date. While aviation CO2 climate effects are well known, the magnitude of non-CO2 effects of aviation are highly uncertain. Nitrogen oxide (NOx) emissions from aircraft affect greenhouse gases: local production of ozone in the short term, and long-term impacts on methane, stratospheric water vapour and ozone. Ozone production is non-linear and depends on the background concentrations of NOx and volatile organic compounds (VOCs). Previous single-model studies have found an increased sensitivity of NOx-induced response to aviation emissions in high-mitigation scenarios compared to low-mitigation scenarios. Here we extend this to a multi-model study, using three models to explore the dependence of aviation NOx effects on background conditions in two future scenarios. We calculate the ozone radiative forcing from a 20 % change in aviation NOx emissions for two different future aviation emission scenarios, running each scenario in a high and low mitigation background. We find that the models agree on some features of ozone sensitivity to background scenario. We calculate a positive net NOx forcing in both future scenarios; in the high mitigation scenario in two of three models the long-term methane forcing is sufficiently negative to make the net NOx forcing negative. We estimate lower aviation net NOx RFs for high-mitigation SSP1 background compared to those for an SSP3 background. There is continued uncertainty in the climate impacts of aviation NOx, and we suggest that more model consensus is required to enable parametrisations of these NOx impacts.
- Article
(2404 KB) - Full-text XML
-
Supplement
(974 KB) - BibTeX
- EndNote


The aviation sector contributes around 3 % of annual carbon dioxide (CO2) emissions globally (IEA, 2026). Non-CO2 emissions from aviation exert both direct and indirect effects on climate, and are estimated to have double the impact on climate until present compared to CO2 from aviation (Lee et al., 2021). These non-CO2 emissions include aerosols, water vapour and nitrogen oxides (NOx). NOx emissions in turn lead to impacts on tropospheric ozone formation in the short term, and reduce methane concentrations and lifetime via hydroxyl radical (OH) reactions (Fuglestvedt et al., 1999). Both methane and ozone are key short-lived climate forcers, and the resulting methane changes also affect ozone on a long-term scale, as well as stratospheric water vapour, which also has a radiative impact. Overall, emissions from aviation are estimated to have caused 4 % of anthropogenic global warming to date, and a corresponding projected 0.1° of warming by 2050 (Aamaas et al., 2025; Klöwer et al., 2021). Non-CO2 impacts contribute around 8 times more uncertainty than CO2 in the estimates of aviation's climate impact (for 2018, Lee et al., 2021).
The impacts of aviation on climate from CO2 are well known – CO2 is a long-lived greenhouse gas, and emissions of CO2 from aircraft have a global warming impact that is independent of emissions location and time of day. By contrast, the non-CO2 impacts of aviation on climate have a much higher uncertainty associated with them due to the many processes involved, including cloud and contrail formation, direct and indirect aerosol effects, and non-linear ozone chemistry (Righi et al., 2021; Burkhardt and Kärcher, 2011; Myhre et al., 2011; Gettelman and Chen, 2013; Grooß et al., 1998). The formation of ozone is strongly dependent on the background levels of both NOx and volatile organic compounds (VOCs), so the impact of a perturbation in NOx emissions (such as from aviation) on ozone depends on the local chemical composition of NOx and VOCs. The ozone production efficiency is location and season dependent, for example with increased efficiency of ozone production from NOx released at higher cruise altitudes (Søvde et al., 2014; Terrenoire et al., 2022). Several previous studies have explored the sensitivity of the ozone response to aviation NOx in different atmospheric backgrounds. More polluted sites are less sensitive to the addition of more NOx, with the most important control being background NOx levels (Stevenson and Derwent, 2009; Holmes et al., 2011). This means that the response to aviation NOx is dependent on the regional and vertical distribution of the emissions (Köhler et al., 2008a; Lund et al., 2017). Increased lightning NOx emissions (and therefore background NOx) have been found to lead to a reduction in the aviation-induced ozone perturbation (Khodayari et al., 2018).
The net aviation NOx response includes long-term changes in methane, ozone and stratospheric water vapour, which are also affected by the background atmospheric composition, due to differences in the atmospheric oxidising capacity. More recently, using the revised formula for calculating methane radiative forcing from Etminan et al. (2016) has led to a stronger estimated negative methane forcing from aviation NOx, which may outweigh the ozone forcing, resulting in a negative net NOx forcing under certain conditions (Skowron et al., 2021; Terrenoire et al., 2022). Skowron et al. (2021) found that the aviation net NOx forcing was lower in high mitigation (low NOx) scenarios, and that this was particularly dependent on background surface NOx emissions, with any 1 % change in surface NOx emissions modifying aircraft net NOx RF by ∼ 1.5 %. The short-term ozone and methane responses have different sensitivities to the background conditions, and the net response depends on the balance between them (Skowron et al., 2021; Stevenson and Derwent, 2009). Many of these studies use a single model, and there is a need for multi-model studies on the net impact of aviation NOx (Terrenoire et al., 2022).
Chemistry-climate models (CCMs) and chemistry-transport models (CTMs) are used to quantify the climate impacts of aviation and probe different scenarios. Due to model differences in chemistry, transport and parametrisations of the processes involved, there is high model spread in the predicted climate impact of aviation, especially for non-CO2 impacts (Holmes et al., 2011; Lee et al., 2021; Olsen et al., 2013). Therefore, multi-model studies with comparable scenarios and experimental setup are required to further understand and explain these differences, as part of the path forward for reducing the uncertainty of non-CO2 aviation impacts. Here we use MOZART3, LMDZ-INCA, OsloCTM3 and EMAC models to explore the climate impacts of aviation NOx (Hauglustaine et al., 2004; Kinnison et al., 2007; Pozzer et al., 2011; Søvde et al., 2012). This work is closely related to two previous studies focusing on the climatology of these models and comparison with observations (Cohen et al., 2025a), and the present-day impact of aviation NOx and aerosols (Cohen et al., 2026). We expand on these to consider future scenarios and the influence of different background atmospheric conditions.
Future pathways for the aviation sector span a wide range of possibilities combining changes in demand, regional distribution, new technologies aimed at decarbonisation, and more (ICAO, 2025; Aamaas et al., 2025). The Shared Socioeconomic Pathways (SSPs) from the sixth Coupled Model Intercomparison Project (CMIP6) span this range: SSP3-7.0 is characterised by unabated increases in air pollution, slow implementation of new technologies, and increasing aviation demand, while SSP1-2.6 includes strong air pollution reduction measures, emphasis on low-carbon technologies, and limited increases in air traffic (Fujimori et al., 2017; Gidden et al., 2019; van Vuuren et al., 2017). The future impacts of aviation on climate depend both on the aviation emissions trajectory, and the background emissions (Skowron et al., 2021; Hodnebrog et al., 2011), so it is crucial to assess if these non-linearities in the NOx-induced ozone production can be confirmed in a multi-model study.
For this purpose, we explore the short-term ozone and overall impacts of aviation NOx emissions, in the present day and for the SSP1-2.6 and SSP3-7.0 future scenarios in 2050. The next section outlines the experiments performed and models used, Sect. 3 compares the short-term ozone climate impact of aviation in the future and present day, and Sect. 4 explores the sensitivity of this effect to background conditions in the different SSPs.
We show results from a multi-model study of global chemistry and climate models (CCMs and GCMs, Sect. 2.1). We explore the changes in atmospheric ozone distribution and net radiative forcing (Sect. 2.2) induced by aviation NOx emissions, and the sensitivity of these to the background state.
2.1 Multi-model experiments
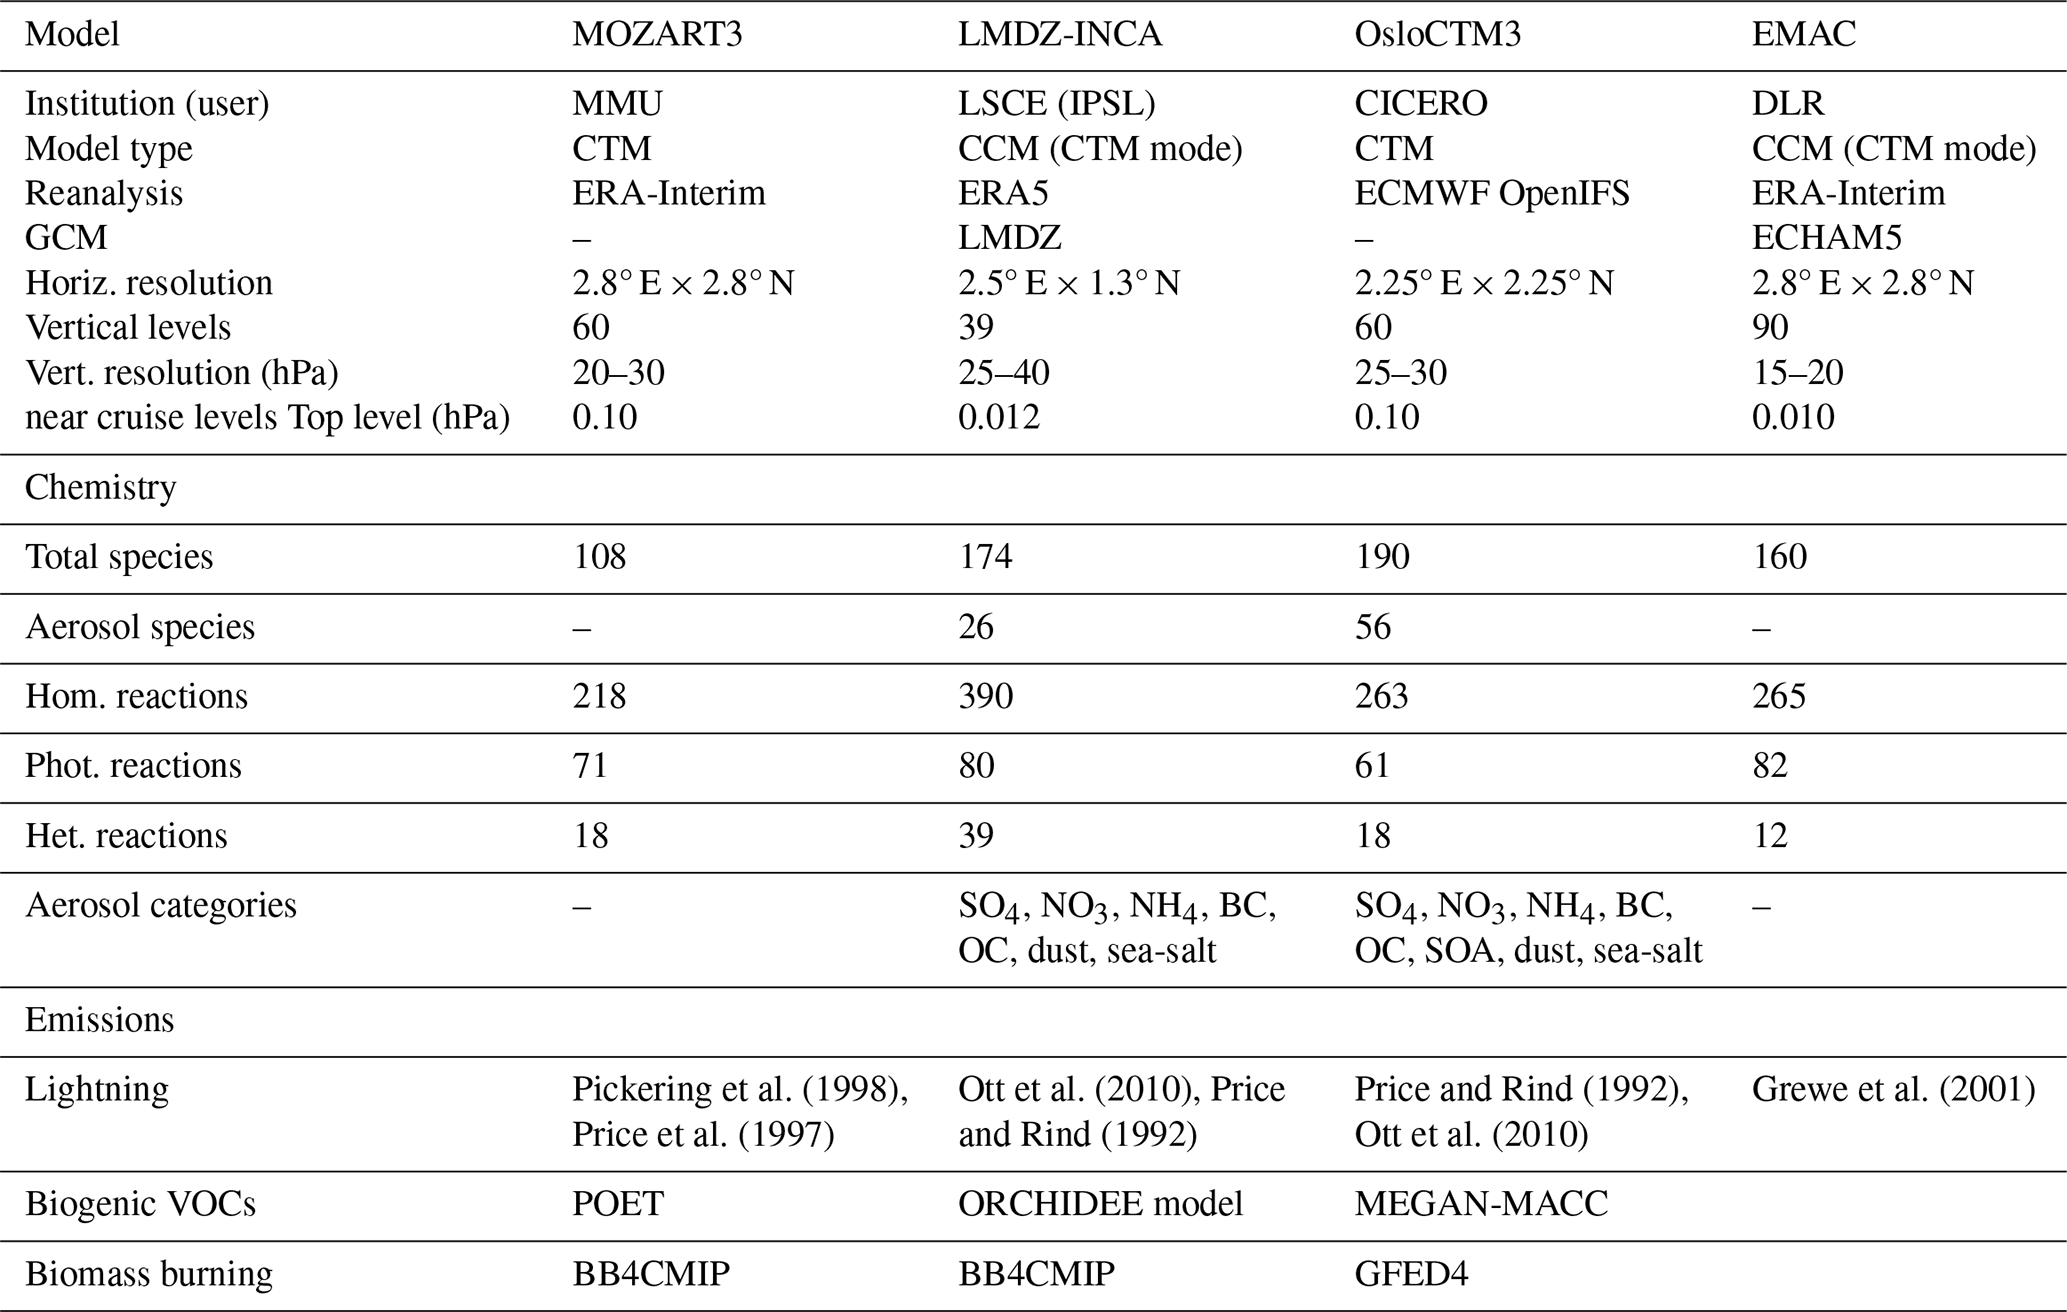
The numerical experiments in this multi-model study were carried out under the European Union project “Advancing the Science for Aviation and Climate” (ACACIA). Six models participated, four of which ran the future aviation experiments studied here: MOZART3 (Kinnison et al., 2007), LMDZ-INCA (Hauglustaine et al., 2004, 2014), OsloCTM3 (Søvde et al., 2012) and EMAC (Pozzer et al., 2011, did not run background sensitivity experiments). Table 1 shows a comparison of the setup, chemistry and emissions of these models. For a full description of the models, and evaluation of model differences in atmospheric composition compared to observations, see Cohen et al. (2025a).
Table 1Model description overview for global atmospheric models used in this study. First column abbreviations horiz., vert., hom., phot., and het. correspond respectively to: horizontal, vertical, homogenous, photolytic and heterogeneous. Aerosol categories include sulfate (SO4), nitrate (NO3), black carbon (BC) and organic carbon (OC).
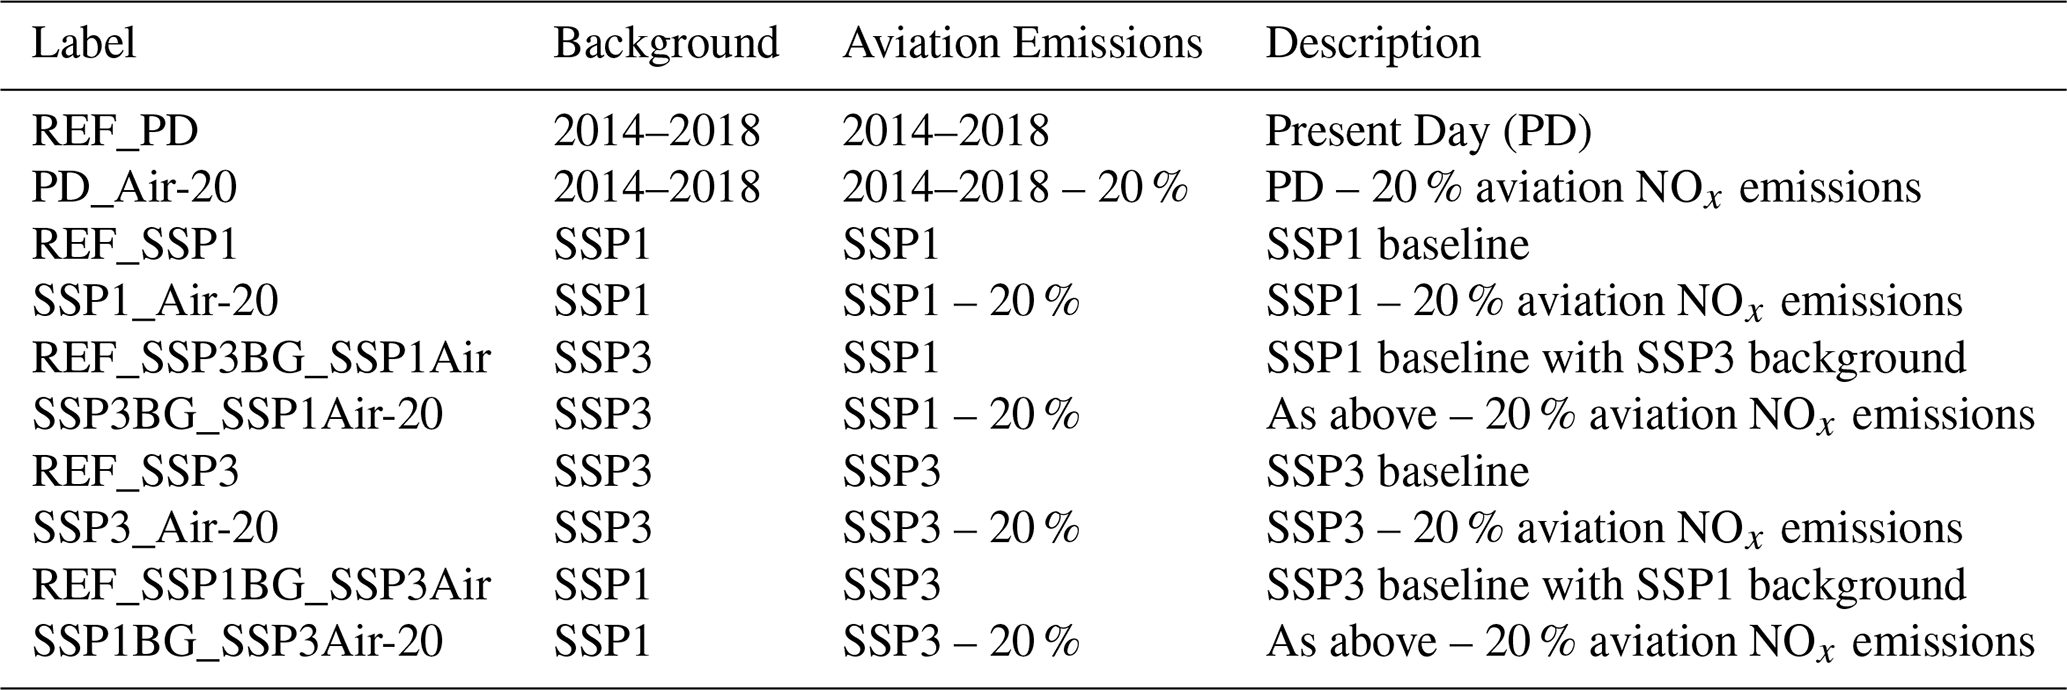
This study focuses on aviation-induced effects associated with NOx emissions in future scenarios, exploring the influence of different background conditions. Table 2 outlines the relevant experiments performed as part of the wider multi-model study. Perturbations of −20 % for NOx aviation emissions were implemented in a present-day (2014–2018) scenario and for two future scenarios in 2050 (SSP1-2.6 and SSP3-7.0, hereafter referred to as SSP1 and SSP3) (Gidden et al., 2019). To test the sensitivity of the ozone response to different background conditions, both future emissions scenarios were run with SSP1 and SSP3 backgrounds. The experiments are all timeslice runs, with one year of spin-up and then run for five years (four years for OsloCTM3). Present-day meteorology from 2014–2018 is used for all runs (including for the future scenarios), taken directly from the reanalysis datasets for the CTMs and run using a quasi-CTM mode (nudged) for LMDZ-INCA and EMAC (see Table 1). All other inputs e.g. emissions, methane concentrations, correspond to the scenario and year (present day or 2050). The present-day emissions are from the Community Earth atmospheric Data System (CEDS) inventory (Hoesly et al., 2018), and the SSP1 and SSP3 emissions (including aviation scenarios and long-lived greenhouse gases) are from CMIP6 (Gidden et al., 2019). All models use a lower boundary condition for methane, i.e. a fixed global mean concentration at the surface corresponding to present day or SSP1/3. We use the corrected CEDS aviation emissions from Thor et al. (2023), see Table S1 in the Supplement. In Sect. 3, to compare the impact attributable to the aviation sector in present and future we use results from the −20 % perturbations (Air-20 scenarios) and scale them up to 100 % to give a whole sector estimate e.g. (Köhler et al., 2008b). We use model-specific scaling factors from the PD_Air-20 and equivalent −100 % experiments from Cohen et al. (2026), which range between 1.09 and 1.18. For EMAC, the PD_Air-20 experiment was not performed, so we use the −100 % experiment directly. For the sensitivity analysis (Sect. 4) the results are all from the −20 % experiments.
Here we use a perturbation method, where we compare experiments with 20 % lower aviation emissions with a baseline experiment (REF_PD, REF_SSP1 or REF_SSP3). This contrasts to source apportionment methods, where pollutants are tagged and their transport and reaction pathways are tracked. These two methods give different results due to the non-linearity of the NOx–O3 system. Maruhashi et al. (2024) compared these methods and found a factor of 1.16 to 2.55 difference between the tagging and perturbation methods for the ozone response to NOx emissions, with the tagging method simulating higher ozone production. For sensitivity analysis such as that done in Sect. 4, perturbation methods are the most appropriate and this is the method we have used.
2.2 Radiative forcing calculations
The ozone radiative forcing (RF) was calculated from the aviation-induced ozone perturbations using a concentration-based kernel from Skeie et al (2020), which compares favourably to offline radiative transfer calculations from OsloCTM3 (Lund et al., 2021) and LMDZ-INCA (see Table S3, Cohen et al., 2026; Terrenoire et al., 2022). 3D monthly averages of ozone mixing ratio from each model were conservatively interpolated onto a 2.25° × 2.25° grid and linearly interpolated in pressure onto 60 vertical levels, from the surface up to 0.1 hPa, to match the kernel grid. The ozone column (in Dobson Units, DU per kernel level) was calculated using air mass from OsloCTM3 for all models, following the method in Skeie et al. (2020). From this, using the kernel (in W m−2 DU−1), the radiative forcing response (in W m−2) was calculated. The kernel takes into account the sensitivity of ozone RF to location (see Skeie et al., 2020, Fig. S1). In some areas of the atmosphere, such as the upper free troposphere, changes in ozone produce a much stronger RF per DU impact than ozone changes at higher or lower altitudes (e.g. Köhler et al., 2008b). When aviation emissions affect ozone in these areas, this gives a greater short-term ozone climate impact per Tg of NOx.
Table 2Simulations from the ACACIA projects used in this study, performed by models MOZART3, LMDZ-INCA, OsloCTM3 and EMAC (present day and SSP3 only, for the latter). Background refers to all non-aviation emissions and chemical state. NOx aviation emissions were perturbed (reduced) by 20 % compared to the baseline (present day, SSP1 and SSP3). LMDZ-INCA reductions include aerosols and NOx. Not all models ran all experiments; no background sensitivity experiments were run in EMAC. See Table S1 for NOx emissions quantified. Prescribed global mean methane mixing ratios for present day, SSP1 and SSP3 are 1834, 1519, and 2472 ppb respectively.
Since a methane lower boundary condition is used in these models, an offline method is required to estimate the resulting change in global annual mean methane mixing ratio, ΔCH4 (and the associated radiative forcing, RF) from the emissions perturbations in these experiments. ΔCH4 is calculated based on the modelled relative change in methane lifetime from each simulation (), combined with the methane feedback factor and an emission non-steady state factor, as shown in Eq. (1) (method described in Berntsen et al., 2005; Hodnebrog et al., 2012; Terrenoire et al., 2022; Cohen et al., 2026). The methane reference mixing ratios in 2050, [CH4]REF, are taken from O'Neill et al. (2016) (i.e. 2472 ppbv for scenario SSP3-7.0 and 1519 ppbv for scenario SSP1-2.6). The methane feedback on its own lifetime (ffeedback=1.45) is taken as the model mean from a recent model intercomparison (Sand et al., 2023). fnon-steady is a factor to correct for the implicit assumption in using ffeedback, which assumes a steady state is reached (see discussion in Grewe et al. (2019) and Lee et al. (2021). Due to its long lifetime, and slow feedbacks on lifetime via OH, a methane lifetime corresponding to steady state is not reached in any given year, and the methane concentration change resulting from NOx perturbations also depends on the recent history of the emissions of NOx, and of OH concentrations. For increasing NOx emissions, assuming steady state to derive the radiative forcing overestimates the methane concentration response (e.g. Grewe et al., 2019), and vice versa for decreasing emissions. Based on the method described by Grewe and Stenke (2008) (solving their Eq. 3) we recalculated these factors for 2050 conditions for both SSP1-2.6 and SSP3-7.0 future scenarios and derived non-steady factors of 1.06 and 0.90 respectively.
From this methane mixing ratio change (in ppbv), the methane RF (in W m−2) is calculated using the simplified equation from Etminan et al. (2016) (Eq. 2).
where [CH4]PERT is the perturbed methane mixing ratio, [CH4]REF the reference methane mixing ratio, and [N2O] the N2O mixing ratio in 2050 (taken to be 355 ppbv). These inferred methane perturbations for the future scenarios, and (for results in Sect. 4.1) are given in Table S4. The indirect long-term ozone and stratospheric water vapour RFs are calculated based on the change in methane mixing ratio adopting the normalized forcings from a recent model intercomparison (Sand et al., 2023, Table S5): for long-term ozone we use a normalized forcing of 0.180 W m−2 CH4 ppbv−1 and for stratospheric water a normalized forcing of 0.058 W m−2 CH4 ppbv−1. The RFs are also converted to ERF using the ratios from Lee et al. (2021) to give an estimate of net NOx ERF with an efficacy of 1.370 for the short-term ozone forcing and 1.180 for the methane direct and indirect (stratospheric water vapour and long-term ozone) forcings. These ratios are used due to absence of better information – the ERF/RF ratios are assumed to be equal to efficacy factors from a single study and are therefore associated with a high uncertainty (Ponater et al., 2006).
To provide context for the future aviation scenarios, we first compare aviation NOx emissions in the SSP1 and SSP3 scenarios to the present day. Nitrogen oxides are co-emitted with greenhouse gases in combustion processes, and also affect local air quality, so NOx emissions are controlled via both climate and air quality policies. SSP1 represents an optimistic future trajectory with stringent air quality and climate policies, while SSP3 has increasing greenhouse gas and ozone precursor emissions in a rapidly warming world (Gidden et al., 2019). We calculate the ozone radiative forcing associated with aviation NOx emissions, hereafter referred to as the short-term ozone change, which is modelled directly. This contrasts with the long-term ozone changes induced via methane changes, which are calculated offline. Figure 1a, b show the spatial distribution of the present-day aviation NOx emissions in these experiments. NOx emissions in 2050 for SSP3 are around 50 % higher than the present day, while in SSP1 they are ∼ 25 % lower (see Fig. 1c, d, e). The aviation NOx emissions in the present day, SSP1 and SSP3 scenarios are 3.78, 2.86, 5.80 TgNO2 yr−1 respectively, and the total anthropogenic emissions are 152, 71 and 164 TgNO2 yr−1 respectively. The spatial distribution of the NOx emissions is similar in the present day and future scenarios, due to assumptions about continuing air traffic trends in the underlying SSP scenarios. The SSP3 and SSP1 scenarios correspond to the upper and lower bounds (for CO2 emissions) in future scenarios used by the International Civil Aviation Organization up to 2070 (LTAG scenarios, Aamaas et al., 2025; ICAO, 2025), with the upper bound representing no new technologies or operational improvements, and the lower bound fixed at 2019 levels.
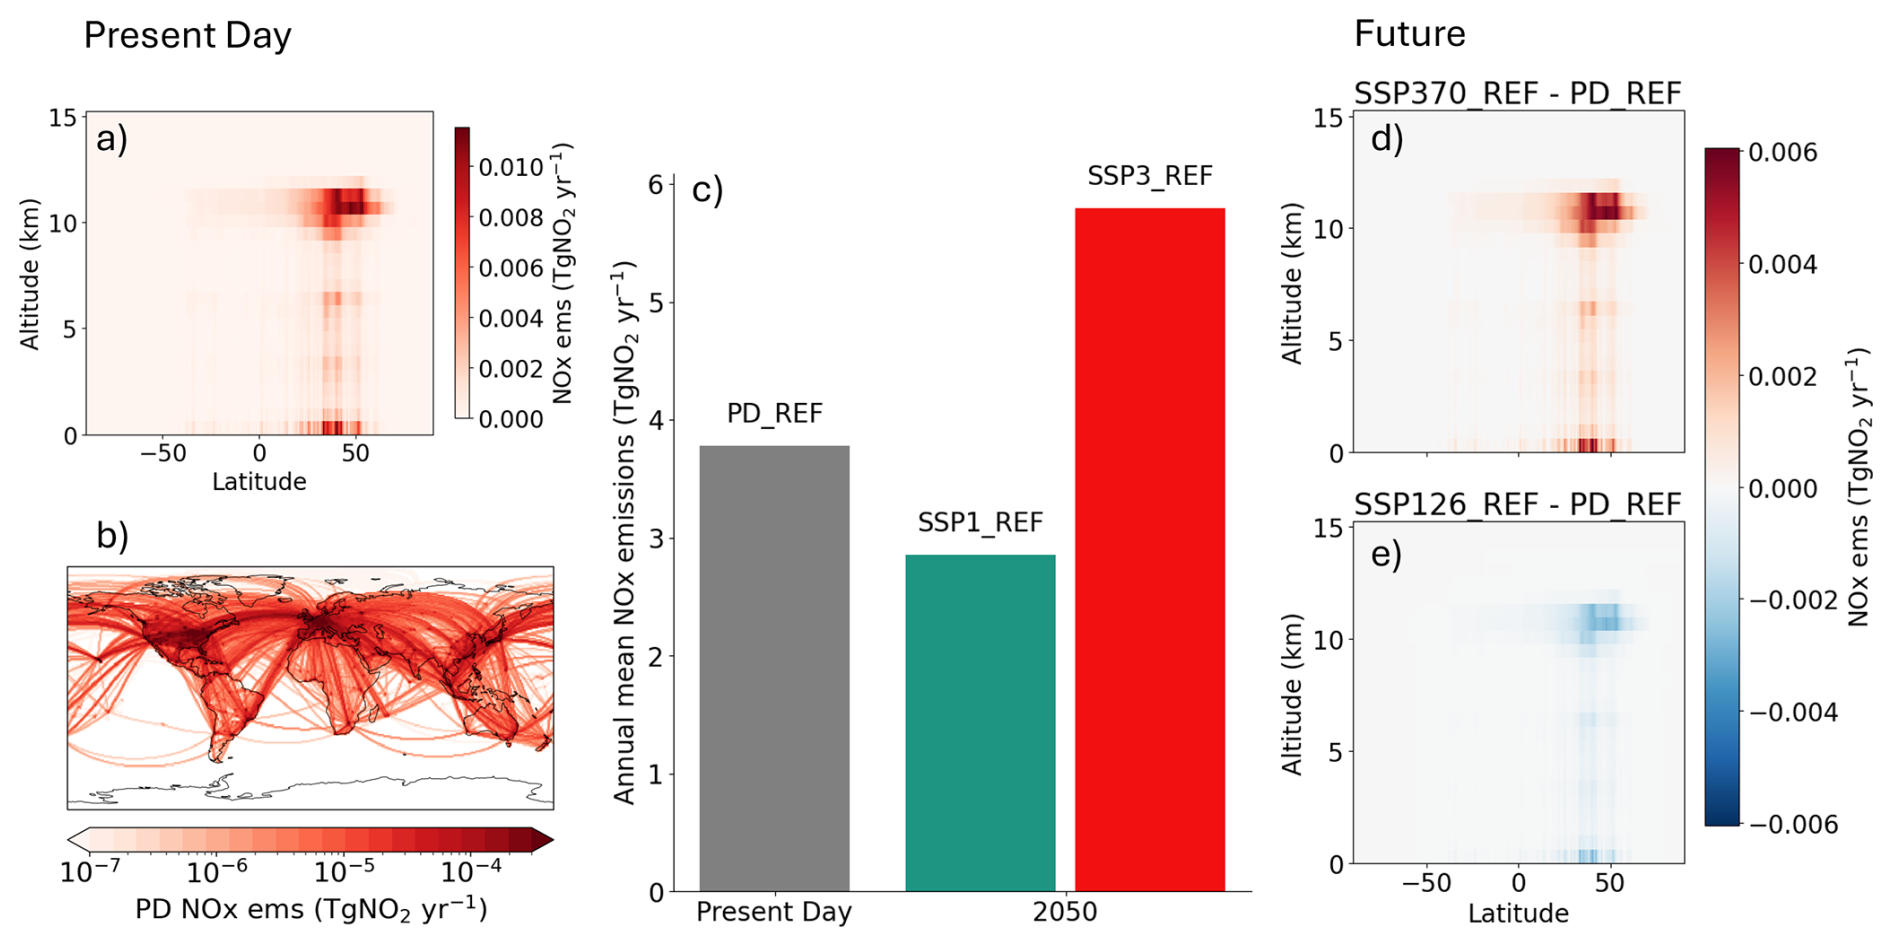
Figure 1NOx emissions in present day (a, b) and future (c, d, e) scenarios, in TgNO2 yr−1. (a) Zonal mean NOx emissions from present day. (b) Global distribution in present day (whole column sum). (c) Annual mean sum of emissions. (d, e) Zonal mean difference between future and present-day NOx emissions for SSP1 and SSP3 respectively (compared to a).
The ozone attributable to aviation NOx emissions (in the short term, not including long-term effects via methane) is shown in Fig. 2a, b, for the present day and future scenarios. Figure 2a shows the total mass of ozone (burden) and Fig. 2b shows the vertical distribution (global annual mean). The models show varied responses: a stronger ozone response in LMDZ-INCA and MOZART3, and a weaker response in EMAC and OsloCTM3 (Fig. 2b). OsloCTM3 also has a lower and broader peak (∼ 340 hPa) than the other three models (which peak around 220–250 hPa). The altitude of the aviation NOx emissions is consistent between models, so the differences in the vertical distribution of the ozone response, and how localised it is, are attributable to the model chemistry and atmospheric transport. Varying vertical resolution is a contributing factor to the vertical distribution of the model response (e.g. van 't Hoff et al., 2025), with LMDZ-INCA and EMAC having the fewest and most levels respectively. Differences in model baselines (e.g. baseline ozone concentration in present day or 2050) also affect the modelled response to a perturbation. Cohen et al. (2025a) compared the climatology of the models used here to long-term airborne observations (IAGOS: In-service Aircraft for a Global Observing System; Petzold et al., 2015) in the upper troposphere (UT) and lowermost stratosphere (LS). They found that the models overestimate UT and underestimate LS ozone concentrations. Results from present-day simulations using the same model ensemble suggest that in the upper troposphere, increased local photochemical production of ozone causes the short-term ozone increase, while in the lowermost stratosphere, the increase is due to a combination of lower ozone net flux to the UT (due to smaller ozone gradient between stratosphere and troposphere), and less LS ozone destruction via OH (Cohen et al., 2026). The seasonality of the ozone response varies between models, with a peak ozone response in April for EMAC, and in June for OsloCTM3 and MOZART3. There is considerable model spread in short-term ozone response to aviation NOx emissions, in terms of magnitude and seasonality of response – for more details see Cohen et al. (2026).
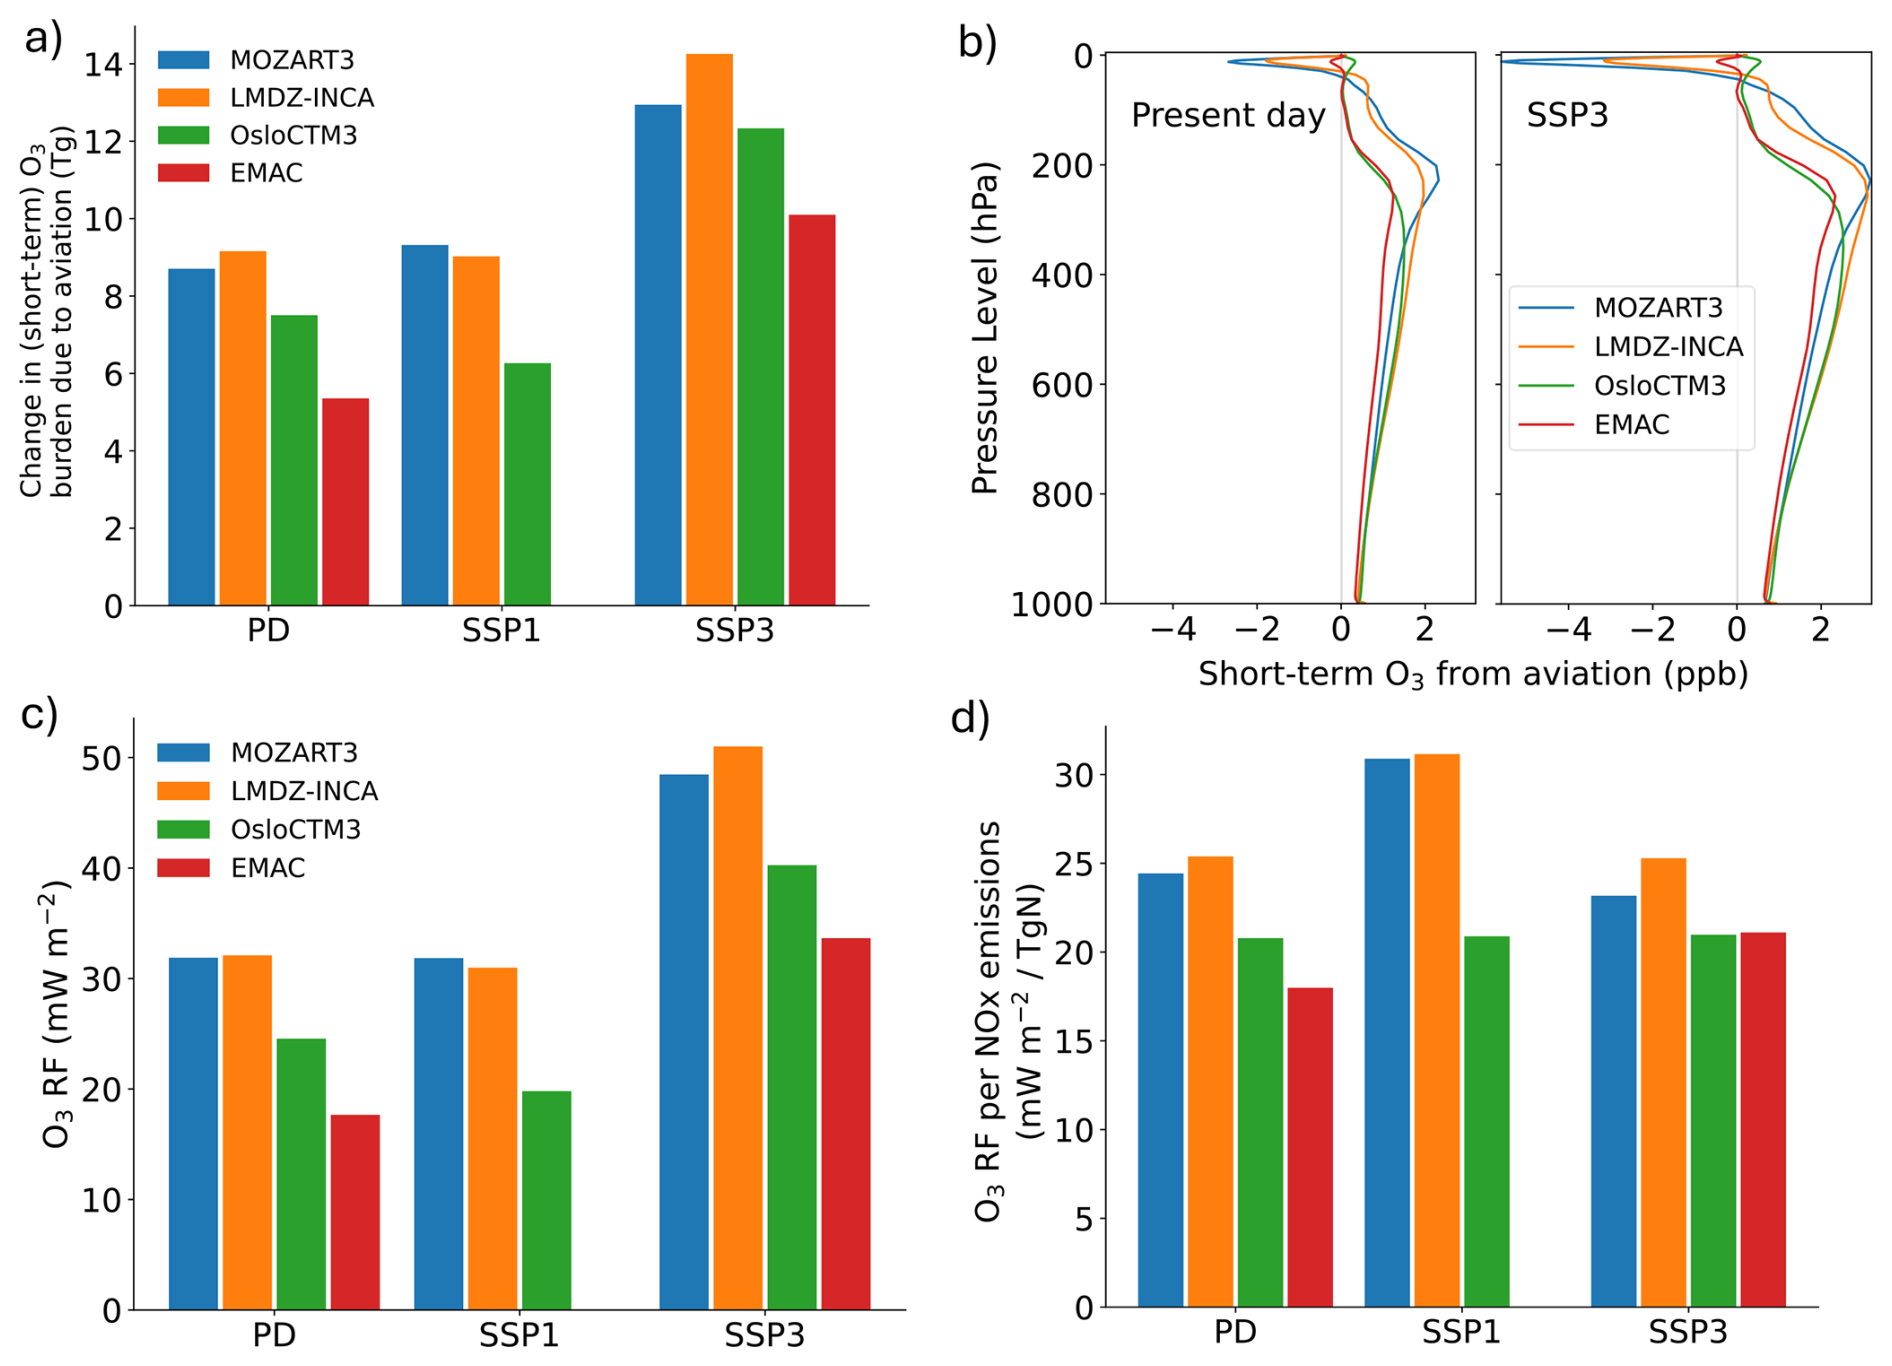
Figure 2Global annual mean short-term ozone concentrations and radiative forcing (RF) from aviation emissions in present-day, SSP1 and SSP3 scenarios. (a) aviation induced short-term ozone burden, (b) vertical profiles of ozone mixing ratio attributed to short-term effect of aviation emissions for present day and SSP3 (c) unscaled ozone RF and (d) ozone RF normalised by change in annual total NOx emissions.
Figure 2c shows the radiative forcing associated with the aviation-induced ozone concentration changes. The present day and SSP1 RFs are relatively similar (27 (18–32) and 26 (19–27) mW m−2 respectively), compared to the higher aviation impact in SSP3 (43 (34-51) mW m−2). This is partly due to differences in aviation NOx emissions in the different scenarios, as shown in Fig. 1; the aviation sector in SSP3 is larger and therefore has a greater radiative impact. Lee et al. (2021) calculated a short-term ozone RF for present day (2018) of 36.0 (23–56) mW m−2, based on a review of previous studies. We find a lower present-day RF, with a smaller range, and all models except EMAC are within the Lee et al. (2021) range. When normalised by the NOx emissions, the short-term ozone RFs are more comparable across the scenarios (Fig. 2d). Previous studies have shown a higher sensitivity of ozone to NOx emissions changes in high-mitigation scenarios (like SSP1) compared to other scenarios (e.g. Terrenoire et al., 2022; Skowron et al., 2021), which we also see for our models. Here, the inter-model differences in ozone response to NOx emissions are larger than the inter-scenario differences (see Fig. 2d). We explore this sensitivity further in the next section.
We use paired experiments with the same aviation emissions, but different background conditions (SSP1 and SSP3, see Fig. 1) to look at the sensitivity of the short-term ozone response to background state. Only models that ran the SSP1BG_SSP3Air (and SSP3BG_SSP1Air, see Table 2) are included in this analysis (i.e. excluding EMAC). Ozone production is determined non-linearly by NOx concentrations, VOC concentrations, temperature and sunlight, and so the short-term ozone response to changes in NOx emissions is expected to be dependent on the location of emissions and the local chemical state. Skowron et al. (2021) found that the short-term ozone RF from aviation emissions depended on the background NOx conditions, including surface NOx concentrations. Part of the model diversity we explore here includes how the background emissions from the SSP1 and SSP3 scenarios (e.g. surface NOx emissions) affect the background conditions in the UTLS region (e.g. UTLS NOx concentrations), and this contributes to the model diversity in sensitivity of the ozone response.
We use the SSP experiments in Table 2, with 20 % reductions in aviation emissions (for SSP1 and SSP3 emissions), in an SSP1 and SSP3 background (see Table S1 for emissions). Figure 3 shows the annual mean global short-term ozone RF impact of these emissions, with colours representing different models, and hatching/dotted lines showing results from an SSP1 background. We find a range of model responses to changes in background. MOZART3 simulates very similar global ozone RF with SSP1 and SSP3 backgrounds, i.e. the RF is found to be independent of the background in these experiments. This contrasts with Skowron et al. (2021) where MOZART3 was also used, but with different background scenarios (RCPs), different aircraft emissions scenarios (2.2 and 5.6 TgN yr−1), and with a 100 % perturbation in aviation emissions, that resulted in a significantly larger perturbation than this study. MOZART3 also has the highest non-linearity in ozone response of the three models used here (Table S2, Cohen et al., 2026). In OsloCTM3, an SSP1 background scenario yields a lower ozone RF (lower sensitivity of ozone to NOx emissions) and LMDZ-INCA shows the opposite effect, with a larger short-term ozone RF in an SSP1 background scenario.
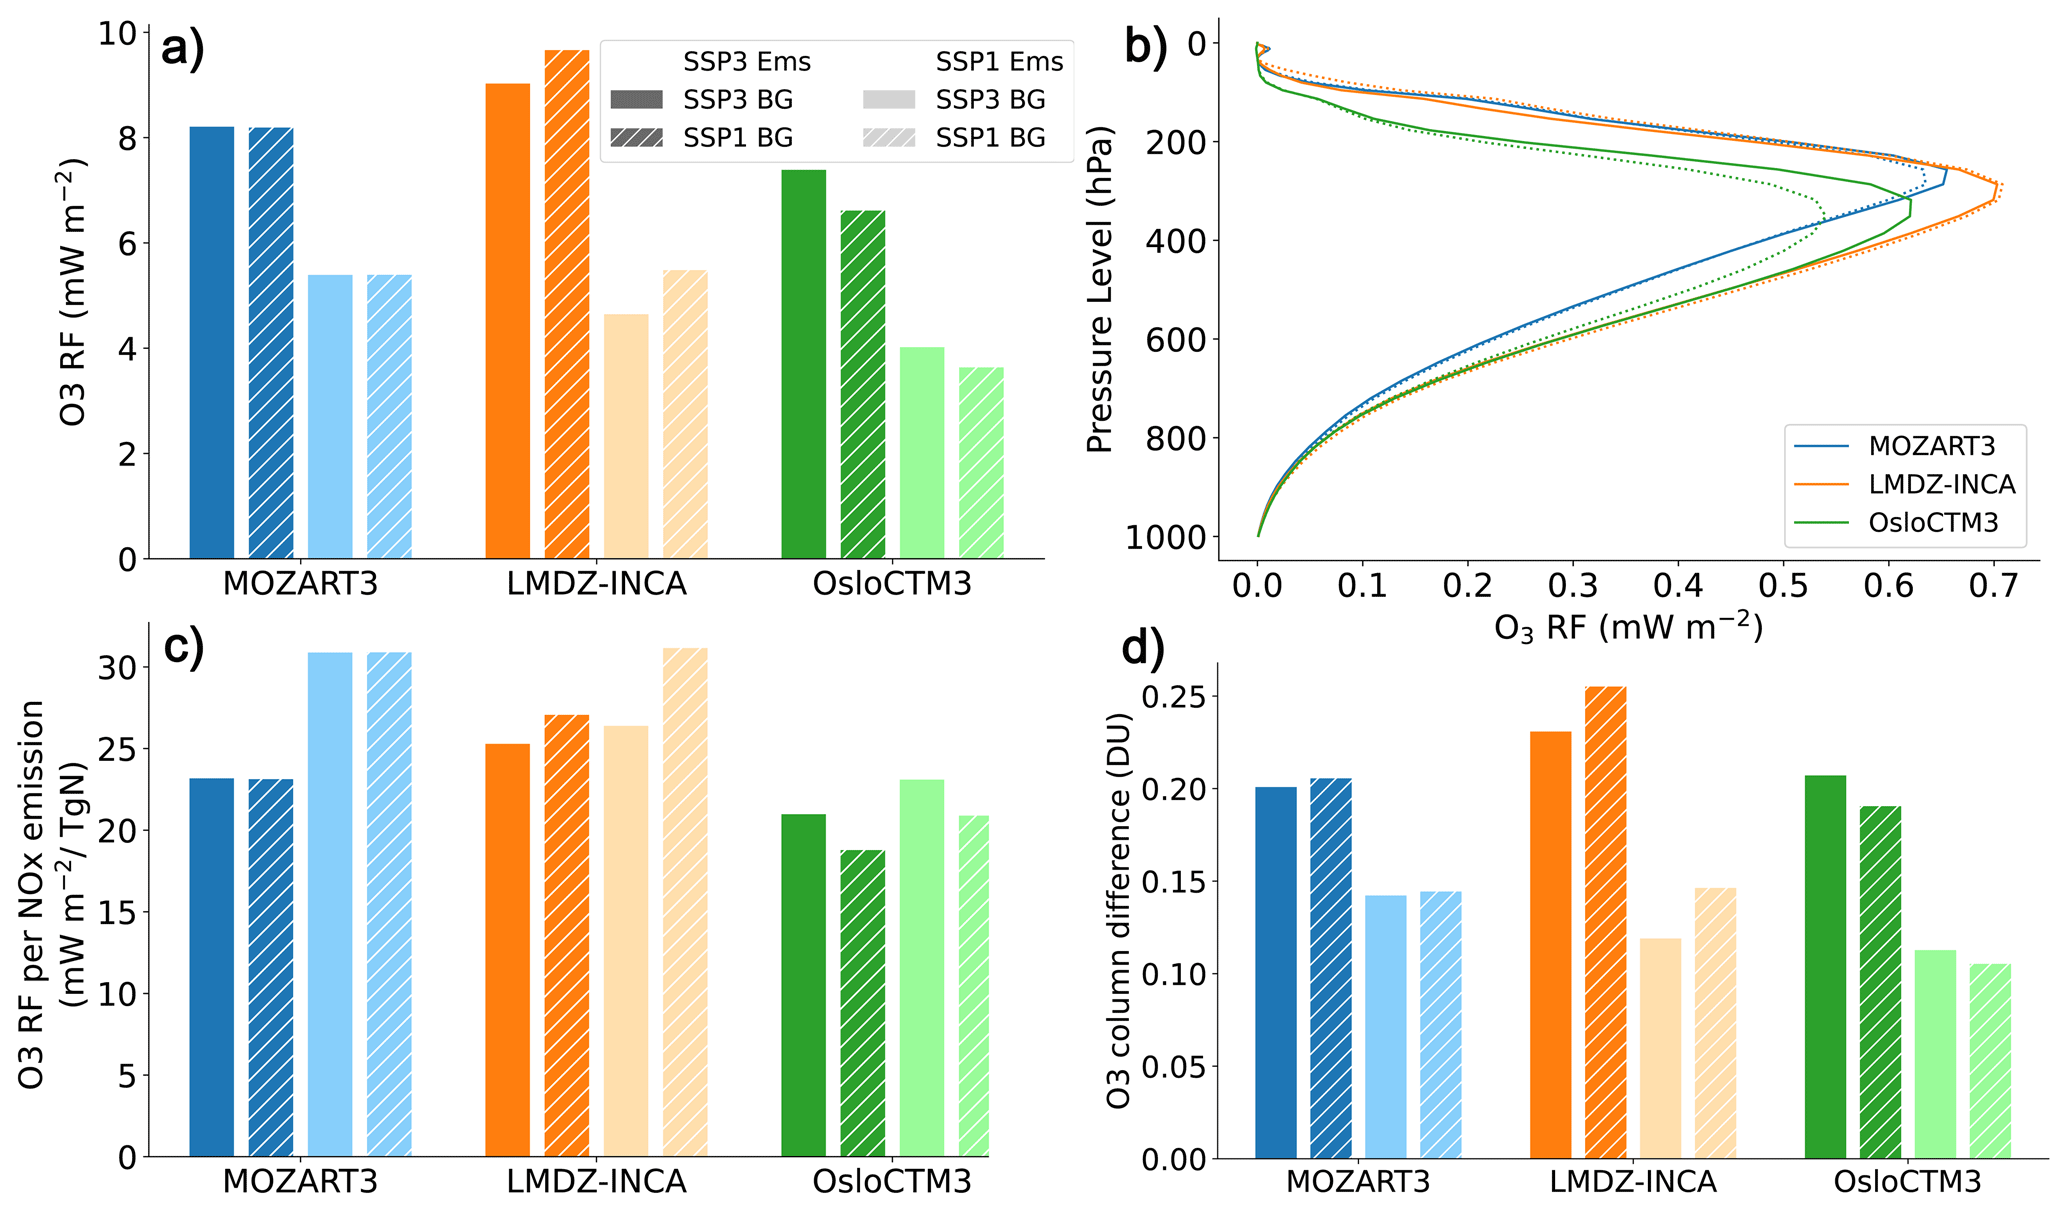
Figure 3Short-term ozone radiative forcing for a 20 % reduction in aviation emissions for SSP3 and SSP1 (darker and lighter colours respectively) with varying background emissions (SSP3 solid and SSP1 hatched). (a) annual mean ozone RF global sum, (b) vertical profile of ozone RF, solid line is SSP3 emissions and background, dotted line is SSP3 emissions with SSP1 background, (c) annual mean ozone RF normalised to NOx emissions perturbation, (d) ozone column difference (in DU) from NOx perturbation, which is used to calculate RF.
For all models here, the sensitivity to background was the same sign for both SSP1 and SSP3 emissions scenarios: higher in SSP1BG for LMDZ-INCA, lower in SSP1BG for OsloCTM3 and similar for both backgrounds in MOZART3. These changes in RF for the different models in varying backgrounds are driven by the underlying changes in ozone column (Fig. 3d compared to Fig. 3a). In terms of ozone column sensitivity to NOx emissions, both MOZART3 and LMDZ-INCA show a higher sensitivity
in an SSP1 background compared to SSP3 (Fig. S4). For MOZART3, this sensitivity occurs in regions where the radiative forcing effect is weak, so the resulting radiative forcing sensitivity to NOx emissions is negligible. Figure 3b shows the vertical distribution of the change in short-term ozone RF. This shows some of the model diversity in response to the same NOx emissions change, with e.g. MOZART3 giving a more localized, higher altitude response and OsloCTM3 showing a lower altitude and more vertically distributed ozone response. The lower vertical resolution in LMDZ-INCA may contribute to its more (vertically) broad ozone response. Overall, the inter-model differences in ozone RF response are larger than the response to a change in background state. Here we show the annual mean response, but there are also some seasonal differences in the sensitivity, e.g. LMDZ-INCA in summer with SSP3 emissions shows a lower sensitivity to SSP1 background, consistent with OsloCTM3 (see Fig. S1).
The global sum of short-term ozone radiative forcing also masks heterogeneity in the underlying ozone response in different areas of the atmosphere. The three models show a different response in terms of where the ozone impact is the largest. This is largely due to differences in model chemistry and transport, as the magnitude and location of aviation NOx emissions were consistent between models, but there may be some differences due to different model vertical pressure grids and therefore injection heights (Terrenoire et al., 2022). Figure 4 shows the zonal mean differences in (a) ozone mixing ratio (b) and ozone (short-term) RF between the SSP1 background and the SSP3 background (SSP1–SSP3), for the SSP3 emissions experiment. The corresponding figures for the SSP1 emissions experiment are shown in Fig. S3. An increase (red) means that an SSP1 background gives a higher ozone concentration change or RF due to aircraft emissions, i.e. a higher ozone sensitivity. Figure 4c and d show the vertical difference in short-term ozone RF (SSP1BG – SSP3BG) for SSP3 and SSP1 emissions respectively. The models all show reduced ozone production from aviation NOx under an SSP1 (vs. SSP3) background in the northern mid latitude upper troposphere, and enhanced ozone in the LS under SSP1 (vs. SSP3) background (Fig. 4a). The relative magnitude of these changes varies between models, giving a different net response. In MOZART3, lower net ozone production in the NOx emissions region (in SSP1BG compared to SSP3BG), and higher net ozone production elsewhere leads to a very small net increase due to the background (Fig. 4a, b left panels). All models also show an increased ozone response in SSP1 compared to SSP3 in the northern hemisphere lower levels, which may contribute to air pollution, especially in scenarios where surface air pollutant concentrations are low (e.g. SSP1).
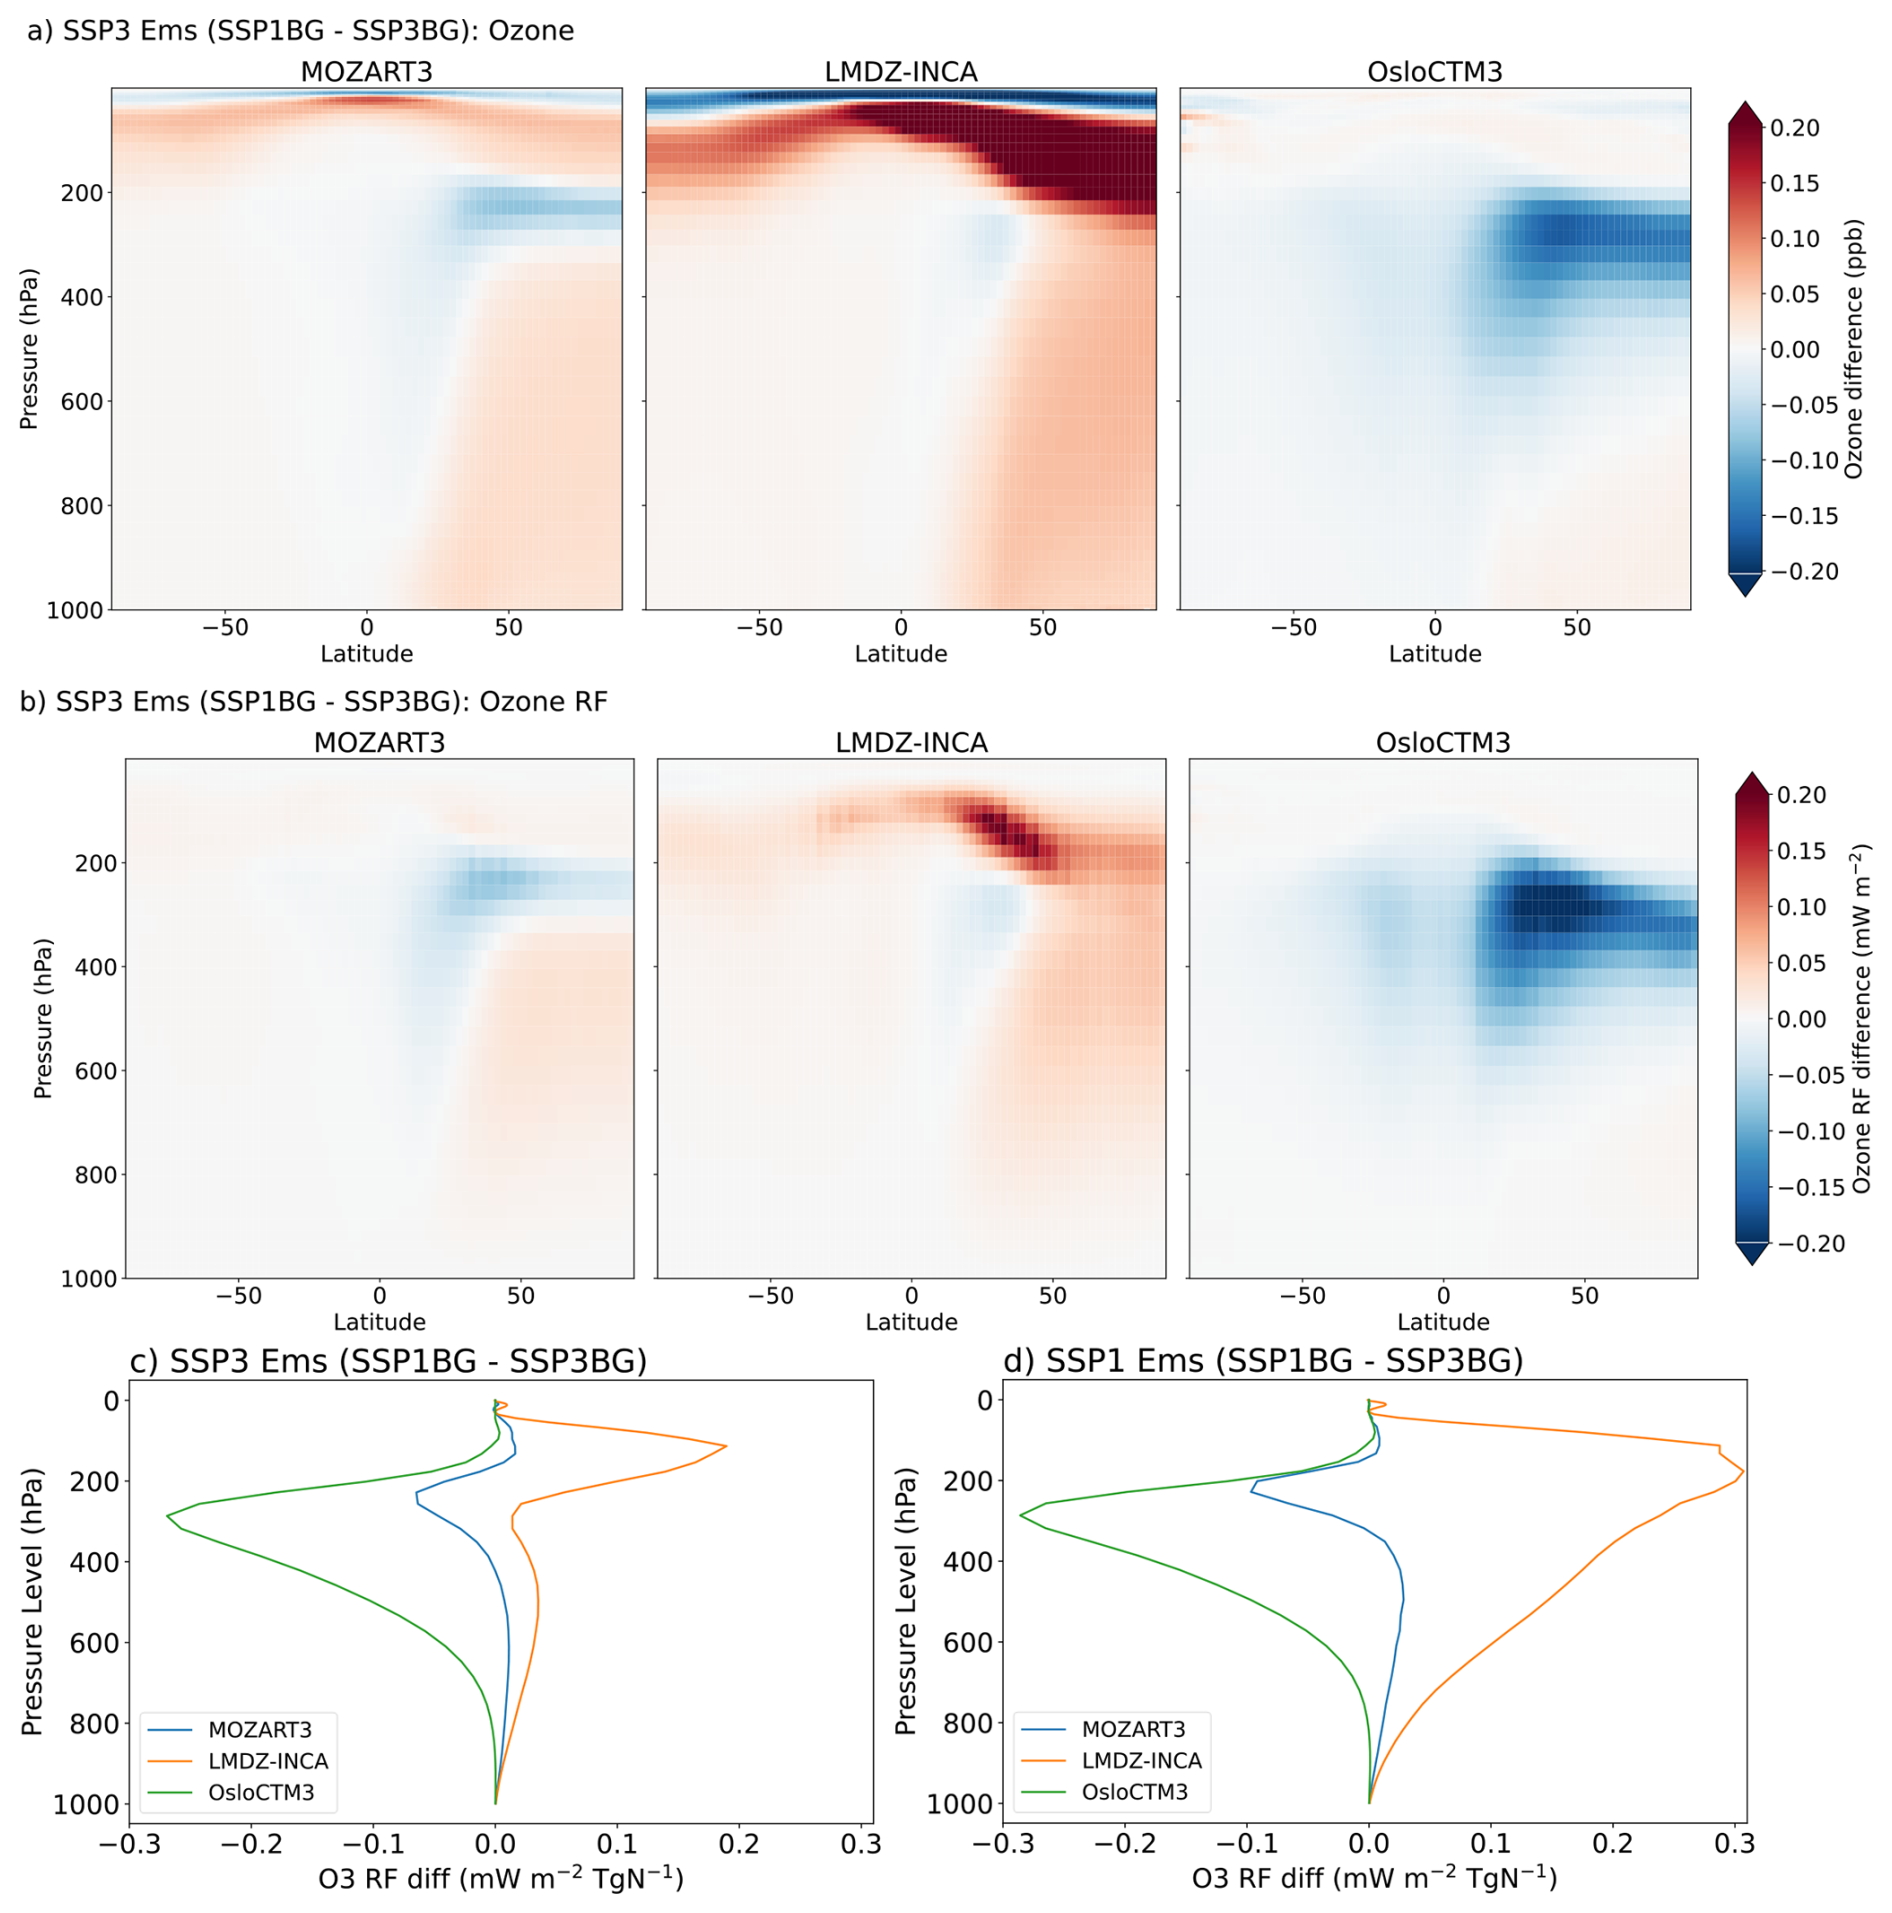
Figure 4Difference between scenarios (SSP1 vs. SSP3 background) of the response to a 20 % reduction in aviation emissions (a) ozone mixing ratio change and (b) ozone RF. Positive (red) means that there is greater ozone reduction in SSP1 than in SSP3 background, i.e. higher sensitivity. Vertical profile of difference in ozone RF in SSP1 background compared to SSP3 background for (c) SSP3 emissions and (d) SSP1 emissions, normalised by NOx emissions difference.
Given the same surface VOC and NOx emissions, the models simulate different background conditions for the upper troposphere lower stratosphere (UTLS) region (see Fig. S5), which is important for the aviation NOx response. For MOZART3, the UTLS background is similar in SSP1 and SSP3, suggesting that what drives the ozone response are the aircraft emissions and non-linearities. LMDZ-INCA simulates lower NOx concentrations in the UTLS region in the SSP1 background (mostly higher up but also weakly at typical cruise altitudes). OsloCTM3 shows slightly higher UTLS NOx concentrations in SSP1 (excluding the decrease from lower aviation emissions, Fig. S5). OsloCTM3 uses a boundary condition approach for N2O concentrations in the stratosphere, and due to limitations in this approach, the N2O concentrations were kept consistent in both future scenarios, while in the other models the N2O emissions are scenario-specific. This may affect the UTLS NOx concentration via differences in production of NOx from photolysis of N2O. However, more additional experiments would be required to disentangle this from other differences in model transport and chemistry. Taking into account these background differences, there is consistency between all models in showing a higher ozone burden sensitivity for a cleaner NOx UTLS background. OsloCTM3 and MOZART3 do not show the strong positive ozone response in the LS region seen in LMDZ-INCA, which may be due to more similar background NOx in the UTLS region in SSP1 and SSP3, and/or due to less stratosphere-troposphere exchange (than in LMDZ-INCA).
The sensitivities we find here contrast to previous model studies, for example Skowron et al. (2021) also used MOZART3 and found a strong sensitivity of short-term ozone change to background and surface NOx. LMDZ-INCA shows a strong ozone increase at higher altitudes, in the lowermost stratosphere (and MOZART3 and OsloCTM3 to a much lesser extent). This suggests that in LMDZ-INCA, a larger amount of aviation NOx from the perturbation reaches the lowermost stratosphere, where the local chemical environment is more sensitive to NOx injection, and means a small perturbation in NOx emissions leads to more ozone destruction (Köhler et al., 2008b; Maruhashi et al., 2024). To quantify the ozone sensitivity to NOx emissions we calculate the change in ozone burden per change in NOx emissions (TgO3/(TgN yr−1), Fig. S4). Since consistent emissions were used between models, the sensitivity is consistent with the results shown in Fig. 3: LMDZ-INCA shows a higher sensitivity in an SSP1 background, OsloCTM3 lower, and MOZART3 gives the least pronounced sensitivity, with an ensemble mean of 7.2 (5.9–9.1) TgO3/(TgN yr−1). Due to the inter-model differences in background conditions under the same scenario (as discussed above and in Fig. S5), all models show a consistent response, indicating higher ozone sensitivities in cleaner backgrounds.
The larger spatial differences in ozone concentration response (Fig. 4a) are modulated by the radiative forcing kernel, due to the spatial heterogeneity of RF sensitivity, which is largest in the upper free tropical troposphere (Skeie et al., 2020). This means that the modelled ozone RF response (Fig. 4b) is mainly determined by the ozone concentration changes in this region (and not so much affected by ozone concentration differences in the upper stratosphere, Fig. 4a). We therefore find that the overall sensitivity of ozone RF to background scenarios (rather than specifically UTLS background conditions) varies in sign and magnitude between models. In terms of vertical profiles, the SSP1 emissions experiment gives a larger ozone RF response to changing background in MOZART3 and LMDZ-INCA (Fig. 4c, d), showing that in these models, the sensitivity to background NOx is higher with lower initial aviation emissions, consistent with a more NOx-limited regime. Again, the models are internally consistent between experiments, but show different signs for the response to an SSP1 background.
Figure 1 shows the similar spatial distribution of aviation emissions in the present day and both future scenarios. Different regional distributions of future aviation NOx emissions, given different potential scenarios for evolution of the aviation sector, are not represented in the SSP scenarios. The future scenarios used here (and available in the literature) are therefore a limited representation of the whole scope of future emissions and impacts. A shift in aviation patterns (for example towards the Global South) would lead to a different regional distribution of aviation emissions, and would likely impact sensitivity to background conditions (Maruhashi et al., 2024). Here we do not take into account changes in underlying climate: changes in temperature and humidity, which affect reaction rates and oxidant concentrations, and combined with different background NOx and VOC emissions would affect ozone production and therefore the aviation NOx impact (e.g. Griffiths et al., 2021).
Net NOx radiative forcing
We calculate the methane, long-term (methane-induced) ozone and stratospheric water vapour RFs to give a net NOx RF corresponding to the aviation sector in the future scenarios (for equivalent results for present day simulations, see Cohen et al., 2026). Previous studies have shown that in some cases with high-mitigation background scenario (similar to SSP1), the negative methane component of the RF becomes larger, and enough to make the net NOx RF negative (Skowron et al., 2021; Terrenoire et al., 2022). Figure 5 shows the net NOx RFs calculated for these experiments as outlined in Sect. 2.2, with hatching showing the SSP1 background experiments. We do not find a consistent sign change in net NOx RF with a change in background, although the methane RF component is larger in all of the SSP1 background experiments, and causes the net NOx forcing to be negative in LMDZ-INCA and OsloCTM3 for SSP1 emissions. For OsloCTM3, this means that although the short-term ozone response is weaker in an SSP1 background, the methane lifetime response is larger. In LMDZ-INCA the net NOx forcing is negative for SSP1 emissions regardless of background. We find a global, model mean net NOx forcing for aviation emissions in SSP3 of 6.7 mW m−2 (4.1–10.6, multi-model range) and in SSP1 of −0.2 mW m−2 (−3.8–5.6). The net NOx RF for the corresponding present-day experiments is 8.5 ± 3.5 mW m−2 (5 models, Cohen et al., 2026). Lee et al. (2021) calculated a net NOx RF of 8.2 (−4.8–16) mW m−2 for 2018 emissions, which when scaled to the NOx emissions used here corresponds to 10.2 mW m−2, consistent with our multi-model range. We also calculate the net NOx ERFs to enable comparison with other studies (see Table S3, and caveats to this method in Sect. 2.2). The high uncertainty and strong sensitivity of the NOx terms to underlying assumptions (discussed further below) mean that the uncertainty in the net NOx RF is large, and net negative values of forcing cannot be excluded, as also shown in more comprehensive assessments e.g. Lee et al. (2021).
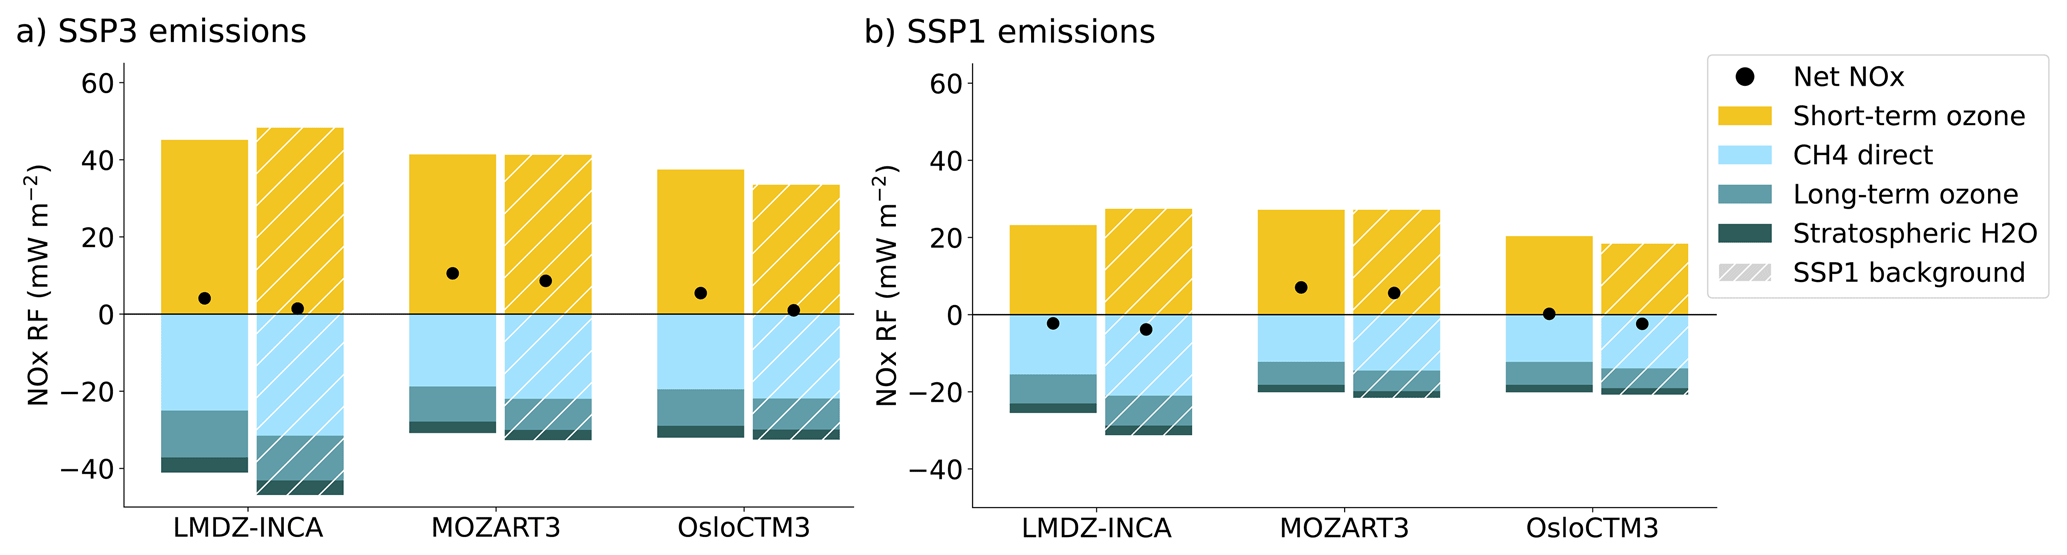
Figure 5Net NOx Radiative Forcing (RF) calculated from 20 % reductions in aviation emissions in (a) SSP3 and (b) SSP1 scenarios, with SSP3 (solid) and SSP1 (hashed) background emissions. The net NOx RF comprises short-term and long-term (methane-induced) ozone, methane and stratospheric water vapour. Data for all components is available in Table S2.
The use of 2014–2018 meteorology here means that the effects of future climate change are not included, as discussed in the previous section, and which has been highlighted as an ongoing question (Terrenoire et al., 2022). There is high uncertainty in the trajectories of future aviation emissions, both in terms of magnitude and spatial distribution (Aamaas et al., 2025). This depends on changes in technology, adoption of low-carbon fuels and changing regional demand. The resulting changes in the latitudinal distribution of NOx emissions could lead to differences in the sensitivity of the ozone response to aviation emissions, for example if the shift leads to more aviation emissions in previously low-NOx regions.
A steady state factor (1.06 for SSP1 and 0.90 for SSP3) is used in the RF calculations to account for the fact that methane cannot respond interactively in these models, since the lower boundary condition is set at the surface. Performing the RF calculation without this steady-state factor gives a net negative forcing in all scenarios for LMDZ-INCA and for the SSP1 background scenarios for OsloCTM3, while the MOZART3 net NOx RFs remain positive with and without the steady state scaling factor. This highlights the importance of the methane contribution and the potential for it to result in a net negative NOx RF, as emphasised by Skowron et al. (2021) who did not use a steady state factor. Here, the methane RF (and therefore net NOx RF) is sensitive to the value used for the steady state factor, which has a high uncertainty and scenario dependence. In the methane concentration calculations we also use a multi-model average for the methane feedback factor, which likely masks some inter-model differences had model-specific feedback factors been used, and adds to the uncertainty. These are limitations from using models with a lower boundary condition for methane, rather than an interactive scheme where the methane mixing ratio can respond to NOx, OH and ozone changes over time (e.g. Folberth et al., 2022). Early studies using chemistry transport models to study aviation NOx impacts did include methane emissions and therefore a had more interactive ozone-OH-methane representation, including the short and long term ozone response, and the methane response (Stevenson et al., 2004; Wild et al., 2001). Both studies found an overall small net positive RF from aviation NOx perturbations. Stevenson et al., (2004) also highlighted a complex seasonal variation in the tradeoff between the short and long term responses, which affected the sign of the net NOx RF.
The net NOx estimates here do not account for changes in aerosols resulting from aviation NOx emissions. Prashanth et al. (2022) estimated that aviation NOx causes −3.4 mW m−2 of secondary aerosol forcing, via nitrate and sulfate aerosols. Terrenoire et al. (2022) found that the inclusion of this nitrate and sulfate forcing could change the sign of the net NOx RF from positive to negative. The secondary aerosol impacts are strongly dependent on the NH3 and SO2 levels in the upper troposphere, and are therefore strongly affected by background scenario. Unger et al. (2013) found a superlinear response in nitrate aerosol forcing to aviation NOx, with 4× and 10× larger forcing in 2050 compared to present day, for a low and high mitigation scenario respectively. In the present-day experiments using the same models as in this study, Cohen et al. (2026) found very high model diversity in present-day aerosol responses to aviation, based on the complexity of the aerosol scheme used.
We use an ensemble of models (LMDZ-INCA, MOZART3, EMAC and OsloCTM3) to evaluate the impact of aviation NOx emissions on climate in future scenarios, with SSP1 and SSP3 background states to probe the sensitivity of short-term ozone response to background conditions. We find a multi-model mean short-term ozone radiative forcing from aviation of 41.3 (37.4–45.2) mW m−2 in SSP3 and 23.3 (18.4–27.4) mW m−2 in SSP1 for the future scenarios, compared to 27 (18–32) mW m−2 in present day (for the standard scenarios with consistent emissions and background). The differences are largely attributable to the differences in aviation NOx emissions between these scenarios. When scaled to NOx emissions, the short-term ozone forcing per NOx emission is 23 (21–25), 27 (21–31) and 22 (18–25) mW m−2 TgN−1 for SSP3, SSP1 and PD respectively. The higher sensitivity in SSP1 compared to SSP3 and present day is driven by LMDZ-INCA and MOZART3, while OsloCTM3 shows the same sensitivity regardless of scenario (see Fig. 2d). We find a large model spread in ozone response to aviation NOx: inter-model differences in ozone response in any given scenario are greater than the differences between scenarios.
When comparing experiments with the same aviation emissions but different background emissions (SSP1 and SSP3) directly, we find a sensitivity of the ozone burden to changes in background (UTLS concentrations), which is in agreement with previous single model studies (e.g., Terrenoire et al., 2022; Skowron et al., 2021). A higher sensitivity to ozone is observed in cleaner backgrounds, which aligns with the findings presented by Cohen et al. (2026, Fig. 7a) for present-day conditions. When considering ozone RF response, LMDZ-INCA shows the expected response, with increased sensitivity to emissions in a cleaner (SSP1) background, OsloCTM3 shows the reverse response and MOZART3 shows little sensitivity to background conditions. There is model diversity in the upper troposphere/lower stratosphere background response to different emissions scenarios, or how effectively surface emissions affect this region in the different models. This has an impact on the sensitivity of the aviation NOx-induced ozone response to different backgrounds. We do not find model agreement on the ozone RF response to changing background emissions, which has been shown in previous single model studies – when considered in a multi-model approach, the models agree on some features of ozone dependence on background NOx, but there are also differences that we cannot fully disentangle at this point. This suggests that more work is needed in this area to quantify the sensitivity of the aviation NOx impact to different background scenarios, which has wide applications e.g. in simple climate models and in the aviation sector for planning non-CO2 mitigation measures. For example, Aamaas et al. (2025) (using a parameterization of NOx dependence on background based on Skowron et al., 2021) simulate a 0.06 °C spread in aviation NOx-induced global mean surface temperature (GMST) change based on different background scenarios, of a total aviation-induced GMST increase between 2020 and 2070 of 0.15 °C under a high aviation emission scenario. The parametrisation of the background dependence of the NOx response is dependent on model results, for which we find high model diversity with these three models. An improved understanding of NOx-induced effects is particularly relevant for the development of operational mitigation strategies, e.g. contrail avoidance by flying higher or lower, as the ozone response to NOx (and the resulting forcing in particular) is highly altitude dependent. These measures may alter impacts from aviation NOx in the future (e.g. Simorgh and Soler, 2025; Søvde et al., 2014), and may change the sensitivity of ozone response to background conditions. The magnitude of net NOx forcing from aviation remains associated with a high uncertainty (spanning positive and negative values), driven by uncertainty in the parameters used for the calculation, and multi-model differences. This contrasts with the well-understood and robust climate forcing effects of CO2 emissions from aviation (Lee et al., 2021).
We estimate the net radiative forcing from aviation NOx by including the effects of long-term changes in ozone, stratospheric water vapour and methane. We find a positive net NOx radiative forcing for the aviation experiments under both SSP1 and SSP3 future emissions scenarios with an SSP3 background (except LMDZ-INCA with SSP1 emissions). When switching to an SSP1 background, the negative forcing from methane gives a sufficiently negative long-term forcing to counteract the positive short-term ozone forcing in OsloCTM3 and LMDZ-INCA, consistent with previous studies (Skowron et al., 2021). We find reduced aviation net NOx RF estimates in all models for the same aviation emissions in a high-mitigation SSP1 background scenario compared to an SSP3 background. Our derivation of the methane mixing ratio response from the change in lifetime, including the use of a steady-state factor, is a limitation on the methane forcing estimate, and increases its uncertainty. The use of methane boundary conditions as standard in CCMs and CTMs limits a fully interactive methane response. The quantification of aviation NOx forcing in methane emissions-driven models, including sensitivity to background, would be key in improving the understanding of aviation NOx impacts.
Model data from the relevant experiments used in this study can be accessed at https://doi.org/10.5281/zenodo.16949722 (Cohen et al., 2025b). Scripts for analysis and making figures in this paper and the Supplement can be found at https://doi.org/10.5281/zenodo.20430139 (Staniaszek, 2026).
The supplement related to this article is available online at https://doi.org/10.5194/acp-26-7985-2026-supplement.
All authors contributed to the conceptualisation of the study. MTL, YC, AS and RT carried out the model experiments. ZS and DH performed the analysis. ZS prepared the manuscript, with contributions from all co-authors.
The contact author has declared that none of the authors has any competing interests.
Publisher's note: Copernicus Publications remains neutral with regard to jurisdictional claims made in the text, published maps, institutional affiliations, or any other geographical representation in this paper. The authors bear the ultimate responsibility for providing appropriate place names. Views expressed in the text are those of the authors and do not necessarily reflect the views of the publisher.
The LMDZ-INCA simulations at LSCE were performed using high-performance computing resources from GENCI (Grand Équipement National de Calcul Intensif) under project no. gen2201. The OsloCTM3 simulations were performed on resources provided by Sigma2 – the National Infrastructure for High-Performance Computing and Data Storage in Norway. AS has also received support from the UK Department for Transport.
This research has been supported by the EU Horizon 2020 (grant no. 875036), the Direction Générale de l'Aviation Civile (grant no. DGAC 382 N2021-39 AirClim) and the Research Council of Norway (grant no. 300718 Aviate).
This paper was edited by Jason West and reviewed by Charlie Wartnaby and one anonymous referee.
Aamaas, B., Lund, M. T., Fuglestvedt, J. S., Totterdill, A., Owen, B., Skowron, A., and Lee, D. S.: Continued global warming from aviation even under high-ambition mitigation scenarios, One Earth, https://doi.org/10.1016/j.oneear.2025.101451, 2025.
Berntsen, T. K., Fuglestvedt, J. S., Joshi, M. M., Shine, K. P., Stuber, N., Ponater, M., Sausen, R., Hauglustaine, D. A., and Li, L.: Response of climate to regional emissions of ozone precursors: sensitivities and warming potentials, Tellus B, 57, 283–304, https://doi.org/10.3402/tellusb.v57i4.16549, 2005.
Burkhardt, U. and Kärcher, B.: Global radiative forcing from contrail cirrus, Nat. Clim. Change, 1, 54–58, https://doi.org/10.1038/nclimate1068, 2011.
Cohen, Y., Hauglustaine, D., Bellouin, N., Lund, M. T., Matthes, S., Skowron, A., Thor, R., Bundke, U., Petzold, A., Rohs, S., Thouret, V., Zahn, A., and Ziereis, H.: Evaluation of O3, H2O, CO, and NOy climatologies simulated by four global models in the upper troposphere–lower stratosphere with IAGOS measurements, Atmos. Chem. Phys., 25, 5793–5836, https://doi.org/10.5194/acp-25-5793-2025, 2025a.
Cohen, Y., Hauglustaine, D., Lund, M. T., Skowron, A., Matthes, S., and Thor, R.: Perturbation simulations for aircraft NOx and aerosol emissions in present day and future: multi-model data from the ACACIA EU project, Zenodo [data set], https://doi.org/10.5281/zenodo.16949722, 2025b.
Cohen, Y., Hauglustaine, D., Staniaszek, Z., Lund, M. T., Dedoussi, I., Matthes, S., Quadros, F., Righi, M., Skowron, A., and Thor, R.: Impact of present aircraft NOx and aerosol emissions on atmospheric composition and climate: results from a model intercomparison, Atmos. Chem. Phys., 26, 5983–6013, https://doi.org/10.5194/acp-26-5983-2026, 2026.
Etminan, M., Myhre, G., Highwood, E. J., and Shine, K. P.: Radiative forcing of carbon dioxide, methane, and nitrous oxide: A significant revision of the methane radiative forcing, Geophys. Res. Lett., 43, 12614–12623, https://doi.org/10.1002/2016GL071930, 2016.
Folberth, G. A., Staniaszek, Z., Archibald, A. T., Gedney, N., Griffiths, P. T., Jones, C. D., O'Connor, F. M., Parker, R. J., Sellar, A. A., and Wiltshire, A.: Description and Evaluation of an Emission-Driven and Fully Coupled Methane Cycle in UKESM1, J. Adv. Model. Earth Sy., 14, e2021MS002982, https://doi.org/10.1029/2021MS002982, 2022.
Fuglestvedt, J. S., Berntsen, T. K., Isaksen, I. S. A., Mao, H., Liang, X.-Z., and Wang, W.-C.: Climatic forcing of nitrogen oxides through changes in tropospheric ozone and methane; global 3D model studies, Atmos. Environ., 33, 961–977, https://doi.org/10.1016/S1352-2310(98)00217-9, 1999.
Fujimori, S., Hasegawa, T., Masui, T., Takahashi, K., Herran, D. S., Dai, H., Hijioka, Y., and Kainuma, M.: SSP3: AIM implementation of Shared Socioeconomic Pathways, Global Environ. Chang., 42, 268–283, https://doi.org/10.1016/j.gloenvcha.2016.06.009, 2017.
Gettelman, A. and Chen, C.: The climate impact of aviation aerosols, Geophys. Res. Lett., 40, 2785–2789, https://doi.org/10.1002/grl.50520, 2013.
Gidden, M. J., Riahi, K., Smith, S. J., Fujimori, S., Luderer, G., Kriegler, E., van Vuuren, D. P., van den Berg, M., Feng, L., Klein, D., Calvin, K., Doelman, J. C., Frank, S., Fricko, O., Harmsen, M., Hasegawa, T., Havlik, P., Hilaire, J., Hoesly, R., Horing, J., Popp, A., Stehfest, E., and Takahashi, K.: Global emissions pathways under different socioeconomic scenarios for use in CMIP6: a dataset of harmonized emissions trajectories through the end of the century, Geosci. Model Dev., 12, 1443–1475, https://doi.org/10.5194/gmd-12-1443-2019, 2019.
Grewe, V. and Stenke, A.: AirClim: an efficient tool for climate evaluation of aircraft technology, Atmos. Chem. Phys., 8, 4621–4639, https://doi.org/10.5194/acp-8-4621-2008, 2008.
Grewe, V., Brunner, D., Dameris, M., Grenfell, J. L., Hein, R., Shindell, D., and Staehelin, J.: Origin and variability of upper tropospheric nitrogen oxides and ozone at northern mid-latitudes, Atmos. Environ., 35, 3421–3433, https://doi.org/10.1016/S1352-2310(01)00134-0, 2001.
Grewe, V., Matthes, S., and Dahlmann, K.: The contribution of aviation NOx emissions to climate change: are we ignoring methodological flaws?, Environ. Res. Lett., 14, 121003, https://doi.org/10.1088/1748-9326/ab5dd7, 2019.
Griffiths, P. T., Murray, L. T., Zeng, G., Shin, Y. M., Abraham, N. L., Archibald, A. T., Deushi, M., Emmons, L. K., Galbally, I. E., Hassler, B., Horowitz, L. W., Keeble, J., Liu, J., Moeini, O., Naik, V., O'Connor, F. M., Oshima, N., Tarasick, D., Tilmes, S., Turnock, S. T., Wild, O., Young, P. J., and Zanis, P.: Tropospheric ozone in CMIP6 simulations, Atmos. Chem. Phys., 21, 4187–4218, https://doi.org/10.5194/acp-21-4187-2021, 2021.
Grooß, J., Brühl, C., and Peter, T.: Impact of aircraft emissions on tropospheric and stratospheric ozone. Part I: chemistry and 2-D model results, Atmos. Environ., 32, 3173–3184, https://doi.org/10.1016/S1352-2310(98)00016-8, 1998.
Hauglustaine, D. A., Hourdin, F., Jourdain, L., Filiberti, M.-A., Walters, S., Lamarque, J.-F., and Holland, E. A.: Interactive chemistry in the Laboratoire de Météorologie Dynamique general circulation model: Description and background tropospheric chemistry evaluation, J. Geophys. Res.-Atmos., 109, https://doi.org/10.1029/2003JD003957, 2004.
Hauglustaine, D. A., Balkanski, Y., and Schulz, M.: A global model simulation of present and future nitrate aerosols and their direct radiative forcing of climate, Atmos. Chem. Phys., 14, 11031–11063, https://doi.org/10.5194/acp-14-11031-2014, 2014.
Hodnebrog, Ø., Berntsen, T. K., Dessens, O., Gauss, M., Grewe, V., Isaksen, I. S. A., Koffi, B., Myhre, G., Olivié, D., Prather, M. J., Pyle, J. A., Stordal, F., Szopa, S., Tang, Q., van Velthoven, P., Williams, J. E., and Ødemark, K.: Future impact of non-land based traffic emissions on atmospheric ozone and OH – an optimistic scenario and a possible mitigation strategy, Atmos. Chem. Phys., 11, 11293–11317, https://doi.org/10.5194/acp-11-11293-2011, 2011.
Hodnebrog, Ø., Berntsen, T. K., Dessens, O., Gauss, M., Grewe, V., Isaksen, I. S. A., Koffi, B., Myhre, G., Olivié, D., Prather, M. J., Stordal, F., Szopa, S., Tang, Q., van Velthoven, P., and Williams, J. E.: Future impact of traffic emissions on atmospheric ozone and OH based on two scenarios, Atmos. Chem. Phys., 12, 12211–12225, https://doi.org/10.5194/acp-12-12211-2012, 2012.
Hoesly, R. M., Smith, S. J., Feng, L., Klimont, Z., Janssens-Maenhout, G., Pitkanen, T., Seibert, J. J., Vu, L., Andres, R. J., Bolt, R. M., Bond, T. C., Dawidowski, L., Kholod, N., Kurokawa, J.-I., Li, M., Liu, L., Lu, Z., Moura, M. C. P., O'Rourke, P. R., and Zhang, Q.: Historical (1750–2014) anthropogenic emissions of reactive gases and aerosols from the Community Emissions Data System (CEDS), Geosci. Model Dev., 11, 369–408, https://doi.org/10.5194/gmd-11-369-2018, 2018.
Holmes, C. D., Tang, Q., and Prather, M. J.: Uncertainties in climate assessment for the case of aviation NO, P. Natl. Acad. Sci. USA, 108, 10997–11002, https://doi.org/10.1073/pnas.1101458108, 2011.
ICAO Environmental Report 2025: https://www.icao.int/environmental-protection/Pages/envrep2025.aspx, last access: 28 May 2026.
IEA: https://www.iea.org/energy-system/transport/aviation, last access: 28 May 2026.
Khodayari, A., Vitt, F., Phoenix, D., and Wuebbles, D. J.: The impact of NOx emissions from lightning on the production of aviation-induced ozone, Atmos. Environ., 187, 410–416, https://doi.org/10.1016/j.atmosenv.2018.05.057, 2018.
Kinnison, D. E., Brasseur, G. P., Walters, S., Garcia, R. R., Marsh, D. R., Sassi, F., Harvey, V. L., Randall, C. E., Emmons, L., Lamarque, J. F., Hess, P., Orlando, J. J., Tie, X. X., Randel, W., Pan, L. L., Gettelman, A., Granier, C., Diehl, T., Niemeier, U., and Simmons, A. J.: Sensitivity of chemical tracers to meteorological parameters in the MOZART-3 chemical transport model, J. Geophys. Res.-Atmos., 112, https://doi.org/10.1029/2006JD007879, 2007.
Klöwer, M., Allen, M. R., Lee, D. S., Proud, S. R., Gallagher, L., and Skowron, A.: Quantifying aviation's contribution to global warming, Environ. Res. Lett., 16, 104027, https://doi.org/10.1088/1748-9326/ac286e, 2021.
Köhler, M. O., Rädel, G., Dessens, O., Shine, K. P., Rogers, H. L., Wild, O., and Pyle, J. A.: Impact of perturbations to nitrogen oxide emissions from global aviation, J. Geophys. Res.-Atmos., 113, https://doi.org/10.1029/2007JD009140, 2008a.
Köhler, M. O., Rädel, G., Dessens, O., Shine, K. P., Rogers, H. L., Wild, O., and Pyle, J. A.: Impact of perturbations to nitrogen oxide emissions from global aviation, J. Geophys. Res.-Atmos., 113, https://doi.org/10.1029/2007JD009140, 2008b.
Lee, D. S., Fahey, D. W., Skowron, A., Allen, M. R., Burkhardt, U., Chen, Q., Doherty, S. J., Freeman, S., Forster, P. M., Fuglestvedt, J., Gettelman, A., De León, R. R., Lim, L. L., Lund, M. T., Millar, R. J., Owen, B., Penner, J. E., Pitari, G., Prather, M. J., Sausen, R., and Wilcox, L. J.: The contribution of global aviation to anthropogenic climate forcing for 2000 to 2018, Atmos. Environ., 244, 117834, https://doi.org/10.1016/j.atmosenv.2020.117834, 2021.
Lund, M. T., Aamaas, B., Berntsen, T., Bock, L., Burkhardt, U., Fuglestvedt, J. S., and Shine, K. P.: Emission metrics for quantifying regional climate impacts of aviation, Earth Syst. Dynam., 8, 547–563, https://doi.org/10.5194/esd-8-547-2017, 2017.
Lund, M. T., Rap, A., Myhre, G., Haslerud, A. S., and Samset, B. H.: Land cover change in low-warming scenarios may enhance the climate role of secondary organic aerosols, Environ. Res. Lett., 16, 104031, https://doi.org/10.1088/1748-9326/ac269a, 2021.
Maruhashi, J., Mertens, M., Grewe, V., and Dedoussi, I. C.: A multi-method assessment of the regional sensitivities between flight altitude and short-term O3 climate warming from aircraft NOx emissions, Environ. Res. Lett., 19, 054007, https://doi.org/10.1088/1748-9326/ad376a, 2024.
Myhre, G., Shine, K. P., Rädel, G., Gauss, M., Isaksen, I. S. A., Tang, Q., Prather, M. J., Williams, J. E., van Velthoven, P., Dessens, O., Koffi, B., Szopa, S., Hoor, P., Grewe, V., Borken-Kleefeld, J., Berntsen, T. K., and Fuglestvedt, J. S.: Radiative forcing due to changes in ozone and methane caused by the transport sector, Atmos. Environ., 45, 387–394, https://doi.org/10.1016/j.atmosenv.2010.10.001, 2011.
Olsen, S. C., Brasseur, G. P., Wuebbles, D. J., Barrett, S. R. H., Dang, H., Eastham, S. D., Jacobson, M. Z., Khodayari, A., Selkirk, H., Sokolov, A., and Unger, N.: Comparison of model estimates of the effects of aviation emissions on atmospheric ozone and methane, Geophys. Res. Lett., 40, 6004–6009, https://doi.org/10.1002/2013GL057660, 2013.
O'Neill, B. C., Tebaldi, C., van Vuuren, D. P., Eyring, V., Friedlingstein, P., Hurtt, G., Knutti, R., Kriegler, E., Lamarque, J.-F., Lowe, J., Meehl, G. A., Moss, R., Riahi, K., and Sanderson, B. M.: The Scenario Model Intercomparison Project (ScenarioMIP) for CMIP6, Geosci. Model Dev., 9, 3461–3482, https://doi.org/10.5194/gmd-9-3461-2016, 2016.
Ott, L. E., Pickering, K. E., Stenchikov, G. L., Allen, D. J., DeCaria, A. J., Ridley, B., Lin, R.-F., Lang, S., and Tao, W.-K.: Production of lightning NOx and its vertical distribution calculated from three-dimensional cloud-scale chemical transport model simulations, J. Geophys. Res.-Atmos., 115, https://doi.org/10.1029/2009JD011880, 2010.
Petzold, A., Thouret, V., Gerbig, C., Zahn, A., Brenninkmeijer, C. A. M., Gallagher, M., Hermann, M., Pontaud, M., Ziereis, H., Boulanger, D., Marshall, J., Nédélec, P., Smit, H. G. J., Friess, U., Flaud, J.-M., Wahner, A., Cammas, J.-P., and Volz-Thomas, A.: Global-scale atmosphere monitoring by in-service aircraft – current achievements and future prospects of the European Research Infrastructure IAGOS, Tellus B, 67, 28452, https://doi.org/10.3402/tellusb.v67.28452, 2015.
Pickering, K. E., Wang, Y., Tao, W.-K., Price, C., and Müller, J.-F.: Vertical distributions of lightning NOx for use in regional and global chemical transport models, J. Geophys. Res.-Atmos., 103, 31203–31216, https://doi.org/10.1029/98JD02651, 1998.
Ponater, M., Pechtl, S., Sausen, R., Schumann, U., and Hüttig, G.: Potential of the cryoplane technology to reduce aircraft climate impact: A state-of-the-art assessment, Atmos. Environ., 40, 6928–6944, https://doi.org/10.1016/j.atmosenv.2006.06.036, 2006.
Pozzer, A., Jöckel, P., Kern, B., and Haak, H.: The Atmosphere-Ocean General Circulation Model EMAC-MPIOM, Geosci. Model Dev., 4, 771–784, https://doi.org/10.5194/gmd-4-771-2011, 2011.
Prashanth, P., Eastham, S. D., Speth, R. L., and Barrett, S. R. H.: Aerosol formation pathways from aviation emissions, Environ. Res. Commun., 4, 021002, https://doi.org/10.1088/2515-7620/ac5229, 2022.
Price, C. and Rind, D.: A simple lightning parameterization for calculating global lightning distributions, J. Geophys. Res.-Atmos., 97, 9919–9933, https://doi.org/10.1029/92JD00719, 1992.
Price, C., Penner, J., and Prather, M.: NOx from lightning: 1. Global distribution based on lightning physics, J. Geophys. Res.-Atmos., 102, 5929–5941, https://doi.org/10.1029/96JD03504, 1997.
Righi, M., Hendricks, J., and Beer, C. G.: Exploring the uncertainties in the aviation soot–cirrus effect, Atmos. Chem. Phys., 21, 17267–17289, https://doi.org/10.5194/acp-21-17267-2021, 2021.
Sand, M., Skeie, R. B., Sandstad, M., Krishnan, S., Myhre, G., Bryant, H., Derwent, R., Hauglustaine, D., Paulot, F., Prather, M., and Stevenson, D.: A multi-model assessment of the Global Warming Potential of hydrogen, Commun. Earth Environ., 4, 1–12, https://doi.org/10.1038/s43247-023-00857-8, 2023.
Simorgh, A. and Soler, M.: Climate-optimized flight planning can effectively reduce the environmental footprint of aviation in Europe at low operational costs, Commun. Earth Environ., 6, 66, https://doi.org/10.1038/s43247-025-02031-8, 2025.
Skeie, R. B., Myhre, G., Hodnebrog, Ø., Cameron-Smith, P. J., Deushi, M., Hegglin, M. I., Horowitz, L. W., Kramer, R. J., Michou, M., Mills, M. J., Olivié, D. J. L., Connor, F. M. O., Paynter, D., Samset, B. H., Sellar, A., Shindell, D., Takemura, T., Tilmes, S., and Wu, T.: Historical total ozone radiative forcing derived from CMIP6 simulations, NPJ Clim. Atmos. Sci., 3, 1–10, https://doi.org/10.1038/s41612-020-00131-0, 2020.
Skowron, A., Lee, D. S., De León, R. R., Lim, L. L., and Owen, B.: Greater fuel efficiency is potentially preferable to reducing NOx emissions for aviation's climate impacts, Nat. Commun., 12, 564, https://doi.org/10.1038/s41467-020-20771-3, 2021.
Søvde, O. A., Prather, M. J., Isaksen, I. S. A., Berntsen, T. K., Stordal, F., Zhu, X., Holmes, C. D., and Hsu, J.: The chemical transport model Oslo CTM3, Geosci. Model Dev., 5, 1441–1469, https://doi.org/10.5194/gmd-5-1441-2012, 2012.
Søvde, O. A., Matthes, S., Skowron, A., Iachetti, D., Lim, L., Owen, B., Hodnebrog, Ø., Di Genova, G., Pitari, G., Lee, D. S., Myhre, G., and Isaksen, I. S. A.: Aircraft emission mitigation by changing route altitude: A multi-model estimate of aircraft NOx emission impact on O3 photochemistry, Atmos. Environ., 95, 468–479, https://doi.org/10.1016/j.atmosenv.2014.06.049, 2014.
Staniaszek, Z.: zosiast/ACACIA_future_paper3_figs: accepted_figs_28_05_26, Zenodo [code], https://doi.org/10.5281/zenodo.20430139, 2026.
Stevenson, D. S. and Derwent, R. G.: Does the location of aircraft nitrogen oxide emissions affect their climate impact?, Geophys. Res. Lett., 36, https://doi.org/10.1029/2009GL039422, 2009.
Stevenson, D. S., Doherty, R. M., Sanderson, M. G., Collins, W. J., Johnson, C. E., and Derwent, R. G.: Radiative forcing from aircraft NOx emissions: Mechanisms and seasonal dependence, J. Geophys. Res.-Atmos., 109, https://doi.org/10.1029/2004JD004759, 2004.
Terrenoire, E., Hauglustaine, D. A., Cohen, Y., Cozic, A., Valorso, R., Lefèvre, F., and Matthes, S.: Impact of present and future aircraft NOx and aerosol emissions on atmospheric composition and associated direct radiative forcing of climate, Atmos. Chem. Phys., 22, 11987–12023, https://doi.org/10.5194/acp-22-11987-2022, 2022.
Thor, R. N., Mertens, M., Matthes, S., Righi, M., Hendricks, J., Brinkop, S., Graf, P., Grewe, V., Jöckel, P., and Smith, S.: An inconsistency in aviation emissions between CMIP5 and CMIP6 and the implications for short-lived species and their radiative forcing, Geosci. Model Dev., 16, 1459–1466, https://doi.org/10.5194/gmd-16-1459-2023, 2023.
Unger, N., Zhao, Y., and Dang, H.: Mid-21st century chemical forcing of climate by the civil aviation sector, Geophys. Res. Lett., 40, 641–645, https://doi.org/10.1002/grl.50161, 2013.
van 't Hoff, J. A., Hauglustaine, D., Pletzer, J., Skowron, A., Grewe, V., Matthes, S., Meuser, M. M., Thor, R. N., and Dedoussi, I. C.: Multi-model assessment of the atmospheric and radiative effects of supersonic transport aircraft, Atmos. Chem. Phys., 25, 2515–2550, https://doi.org/10.5194/acp-25-2515-2025, 2025.
van Vuuren, D. P., Stehfest, E., Gernaat, D. E. H. J., Doelman, J. C., van den Berg, M., Harmsen, M., de Boer, H. S., Bouwman, L. F., Daioglou, V., Edelenbosch, O. Y., Girod, B., Kram, T., Lassaletta, L., Lucas, P. L., van Meijl, H., Müller, C., van Ruijven, B. J., van der Sluis, S., and Tabeau, A.: Energy, land-use and greenhouse gas emissions trajectories under a green growth paradigm, Global Environ. Chang., 42, 237–250, https://doi.org/10.1016/j.gloenvcha.2016.05.008, 2017.
Wild, O., Prather, M. J., and Akimoto, H.: Indirect long-term global radiative cooling from NOx Emissions, Geophys. Res. Lett., 28, 1719–1722, https://doi.org/10.1029/2000GL012573, 2001.
- Abstract
- Introduction
- Methods
- Comparison of future and present-day aviation NOx-induced effects
- Sensitivity of the aviation impacts to background conditions
- Conclusions
- Code and data availability
- Author contributions
- Competing interests
- Disclaimer
- Acknowledgements
- Financial support
- Review statement
- References
- Supplement