the Creative Commons Attribution 4.0 License.
the Creative Commons Attribution 4.0 License.
 | 05 Jun 2026
Impacts of lake on diurnal evolution of surface PM2.5 concentrations around a typical megacity of China
Zining Yang
Chun Zhao
Zihan Xia
Qiuyan Du
Gudongze Li
Mingyue Xu
Zhiyuan Hu
Renmin Yuan
Jiawang Feng
Yubin Li
Lake-land thermal contrasts significantly modulate regional air quality, yet the coupling mechanisms by which inland lakes regulate the diurnal evolution of PM2.5 and its components remain poorly understood. This study conducts high-resolution (1 km) WRF-Chem simulations over Lake Chaohu and the adjacent megacity of Hefei, China, during spring to elucidate these interactions. Results reveal a distinct diurnal reversal effect. During daytime, the lake presence facilitates PM2.5 increases of predominantly 0–10 µg m−3 both over the lake and in surrounding urban areas by suppressed planetary boundary layer height, weakened vertical mixing, and reduced dry deposition velocities, which collectively transform the lake into “storage zone” that prolongs PM2.5 lifetimes. This accumulation is dominated by secondary PM2.5, as the cooler and more humid lake air thermodynamically favors the ammonium nitrate formation. Furthermore, convergence zones where lake breezes meet background winds create localized stagnation traps that intensify shoreline pollution. At night, while the lake surface maintains higher PM2.5 concentrations than surrounding land, its impact on the city reverses, exerting a purification effect with urban PM2.5 decreasing by predominantly 0–10 µg m−3 as land-breeze circulation enhances vertical mixing and facilitates primary pollutant dispersion. Sensitivity experiments reveal that failing to distinguish lake surfaces in emission inventories can significantly amplify daytime pollution. These findings emphasize that lakes act as complex dual regulators of urban air quality, with identified mechanisms likely applicable to other urban-lake systems globally. This study highlights the necessity of high-resolution meteorological modeling and precise surface characterization for improved air quality forecasting in lake-adjacent megacities regions.
- Article
(16238 KB) - Full-text XML
-
Supplement
(11343 KB) - BibTeX
- EndNote


-
Lake-land thermal contrasts drive a diurnal reversal in air quality by facilitating daytime accumulation while promoting nighttime urban dispersion.
-
Daytime PM2.5 increase is dominated by secondary PM2.5 formation, while nighttime purification results from enhanced vertical mixing of primary PM2.5.
-
Suppressed boundary layers, weak mixing, and low deposition create lake “storage zones,” while breeze-driven convergence intensifies shoreline pollution.
Rapid urbanization and economic development in China over recent decades have led to severe urban air pollution (e.g., Lei et al., 2011; Li et al., 2011; Liu et al., 2018). Fine particulate matter (PM), known as PM2.5 (particulate matter with aerodynamic diameters less than 2.5 µm), is the primary air pollutant (e.g., Zhang et al., 2012; Hu et al., 2014a; Chai et al., 2014; Wang et al., 2014; He et al., 2017; Lu et al., 2017). Ambient PM2.5 poses significant health risks including lung cancer, ischemic heart disease, and respiratory disorders (e.g., Hu et al., 2014b; Guo et al., 2017; Ho et al., 2018; Yang et al., 2019; Chen and Hoek, 2020; Yue et al., 2021), while also affecting visibility (Li et al., 2014), radiation budget (Steiner et al., 2013), atmospheric circulation (Jiang et al., 2017), cloud properties (Unger et al., 2009), and regional climates (Guo et al., 2016; Li et al., 2016, 2017c). The formation and evolution of urban PM2.5 are comprehensively influenced by source emissions, long-range transport, chemical transformations, and meteorological conditions (Guo et al., 2014; Huang et al., 2014; Zhang et al., 2015b; Zhang et al., 2013; Hu et al., 2014c; Miao et al., 2017, 2013; Zhang et al., 2015a). Among these factors, local-scale underlying surface characteristics, such as land use type and surface cover, exert crucial influence on PM2.5 distributions by altering surface energy balance, water cycles, and momentum exchange, which subsequently affects turbulent mixing, pollutant transport, deposition, and chemical processes.
Lakes exert a significant “lake effect” on surrounding areas through their distinctive physical properties. Their high heat capacity, low albedo, and substantial moisture supply create thermal contrasts with surrounding terrestrial surfaces, modifying local and regional weather and climate patterns (Levy et al., 2010; Hayden et al., 2011; Wentworth et al., 2015). Differential heating drives the formation of local circulation systems. During daytime, solar heating warms land surfaces while minimally affecting water, creating temperature gradients that generate pressure gradients and initiate lake breezes (Atkinson, 1981; Stull, 1988). Air above the lake moves inland in a shallow inflow layer while air aloft over land returns offshore. As cooler lake air advances over warmer land surfaces, it forms a thermal internal boundary layer (TIBL) that increases in height with inland distance (Lyons and Olsson, 1973; Garratt, 1990). At the leading edge of the lake breeze, air is forced upward at the convergence zone (lake-breeze front) where cooler lake air meets warmer inland air, producing enhanced vertical motion, increased moisture and wind shear, decreased temperature, and directional wind shifts (Lyons, 1972). At night, the temperature gradient reverses, generating a land breeze.
Lakes can significantly impact the atmospheric environment. Research on lake-induced local circulation has been extensively conducted worldwide, predominantly focusing on lake effects on ozone formation and distribution. Nocturnal stable boundary layers and land breezes cause substantial accumulation of ozone and its precursors over lake surfaces, resulting in significant ozone concentration increases after sunrise (Capps et al., 2010; Fast and Heilman, 2005). Dye et al. (1995) demonstrated that temperature inversions over Lake Michigan confine urban pollution over the lake, where other emissions may be located within or above this inversion layer but experience limited vertical mixing. Additionally, lake breezes transport ozone downwind during daytime. Ozone moves landward via airflow and disperses upward under the influence of updrafts at the lake breeze front (Lyons et al., 1995; Wentworth et al., 2015). Due to downdrafts from the backflow effect, high ozone concentrations can be detected in mid-lake regions (Burley et al., 2015; Hayden et al., 2011). Some pollutants may re-enter the onshore airflow and spiral along the lake shoreline (Makar et al., 2010; Harris and Kotamarthi, 2005). Levy et al. (2010) observed high O3 concentrations over the southern Great Lakes, where daytime updrafts transport O3 to higher altitudes over urban areas, while downdrafts subsequently transport O3 back to the lake surface. Furthermore, lake-breeze circulations can influence pollution transport by trapping pollutants within the shallow TIBL (Sills et al., 2011), and the complex wind patterns induced by lakes can cause rapid spatial variations in pollutant concentrations over small distances (Hayden et al., 2011; Levy et al., 2008). Wang et al. (2023) found ozone concentration in lakeshore areas within 5 km of Lake Taihu approximately 20 ppb higher than other regions due to TIBL formation and lake-breeze regulation.
In addition to generating local circulation through thermal differences between lakes and land surfaces, lakes also influence O3 concentrations through modifications to other critical meteorological conditions. Lakes can reduce air temperature and planetary boundary layer height (PBLH) (Wang et al., 2017; Zhang et al., 2017) while altering the spatial distribution of pollutant precursors (Hu and Xue, 2016; Li et al., 2019), affecting both the diffusion of air pollutants and reaction conditions for secondary pollutant formation, potentially causing ozone pollution in surrounding urban areas. Furthermore, dry deposition rates of O3 over water surfaces are substantially lower compared to terrestrial surfaces (Monks et al., 2015), allowing O3 to accumulate within the shallow boundary layer above the lake surface (Brook et al., 2013). This reduced deposition efficiency contributes to the persistence and buildup of ozone concentrations over lake areas, which can subsequently be transported to adjacent regions through lake-breeze circulation patterns.
In contrast to the extensive literature on ozone, limited research has examined the complex influence of lake effects on PM2.5. Existing studies have primarily identified that the vertical and horizontal motions within lake breeze circulation systems cause the re-circulation of primary and secondary pollutants (Brook et al., 2013; Harris and Kotamarthi, 2005) and enhance aerosol formation rates compared to the background conditions (Brook et al., 2013; Hayden et al., 2011). For instance, increased concentrations of secondary pollutants, such as sulfate and nitrate, have been observed following lake breeze circulation events (Fosco and Schmeling, 2006). Despite these findings, significant knowledge gaps remain. Existing studies have primarily focused on individual processes or specific pollution episodes, lacking systematic investigation into how lakes affect the spatial distribution and diurnal variation of PM2.5 and its different components. Furthermore, the complex interactions among lake-related processes, including local circulation, boundary layer mixing, dry deposition, and chemical transformation, and how these processes collectively shape PM2.5 distribution remain poorly understood. Moreover, existing research has been largely concentrated in the North American Great Lakes region, while lake-urban interactions in rapidly urbanizing areas characterized by intensive anthropogenic emissions, particularly in East Asia, remain underexplored.
In summary, these research gaps highlight the need for systematic investigation of lake effects on PM2.5 pollution. Existing studies lack systematic investigation into how lakes affect the spatial distribution and diurnal variation of PM2.5 and its components (primary and secondary aerosols) within lake-urban systems. Moreover, how lake-related processes such as local circulation, boundary layer mixing, dry deposition, and chemical transformation interact and collectively influence pollutant concentrations remains poorly understood (Hayden et al., 2011; Zhang et al., 2017; Wang et al., 2023). Lake Chaohu, one of China's five major freshwater lakes, provides an ideal case for addressing these gaps. The megacity of Hefei, adjacent to the lake's northern shore, forms a typical lake-urban system exemplifying the common global pattern where large cities border natural water bodies (Chen et al., 2017; Peng et al., 2019; Hu and Li, 2020). Rapid industrialization and urbanization in this region have led to severe air pollution, yet the complex interactions between substantial urban emissions and lake-induced meteorological effects remain underexplored. Therefore, this study conducts high-resolution (1 km) WRF-Chem simulations during a spring pollution episode (March 2019) with comparative scenarios including (Lake) and excluding (Nolake) the lake to systematically investigate how lake effects influence the spatiotemporal distribution of PM2.5 and its key components, and to elucidate the coupling mechanisms between physical processes (turbulent mixing, dry deposition, local circulation) and chemical processes. It should be emphasized that this sensitivity experiment approach is employed as a scientific tool to isolate and quantify the lake's influence on PM2.5 distributions, rather than to evaluate the feasibility of lake removal as an air quality management strategy. The primary objective is to advance our mechanistic understanding of how large water bodies affect atmospheric pollution in megacity environments. The findings will provide scientific support for air quality forecasting and pollution control strategies in lake-adjacent cities.
The paper is organized as follows: Sect. 2 introduces the WRF-Chem model configuration, the design of different experiments, and emissions from different sources. Section 3 presents the spatial distribution and diurnal variation of PM2.5 concentrations from different sensitivity experiments and reveals the key mechanisms of lake effect on the PM2.5. Section 4 present the conclusion and discussion of the analysis.
2.1 WRF-Chem
In this study, the version of WRF-Chem updated by the University of Science and Technology of China (USTC version of WRF-Chem) is used. Compared with the publicly released version, this USTC version of WRF-Chem includes some additional functions such as the diagnosis of radiative forcing of aerosol species, land surface coupled biogenic VOC (volatile organic compound) emission, aerosol-snow interaction, improved PBL mixing of aerosols, and a detailed diagnosis of the contributions of each crucial process to pollutant concentrations (Zhao et al., 2013a, 2013b, 2014, 2016; Hu et al., 2019; Du et al., 2020; Zhang et al., 2021; Yang et al., 2025).
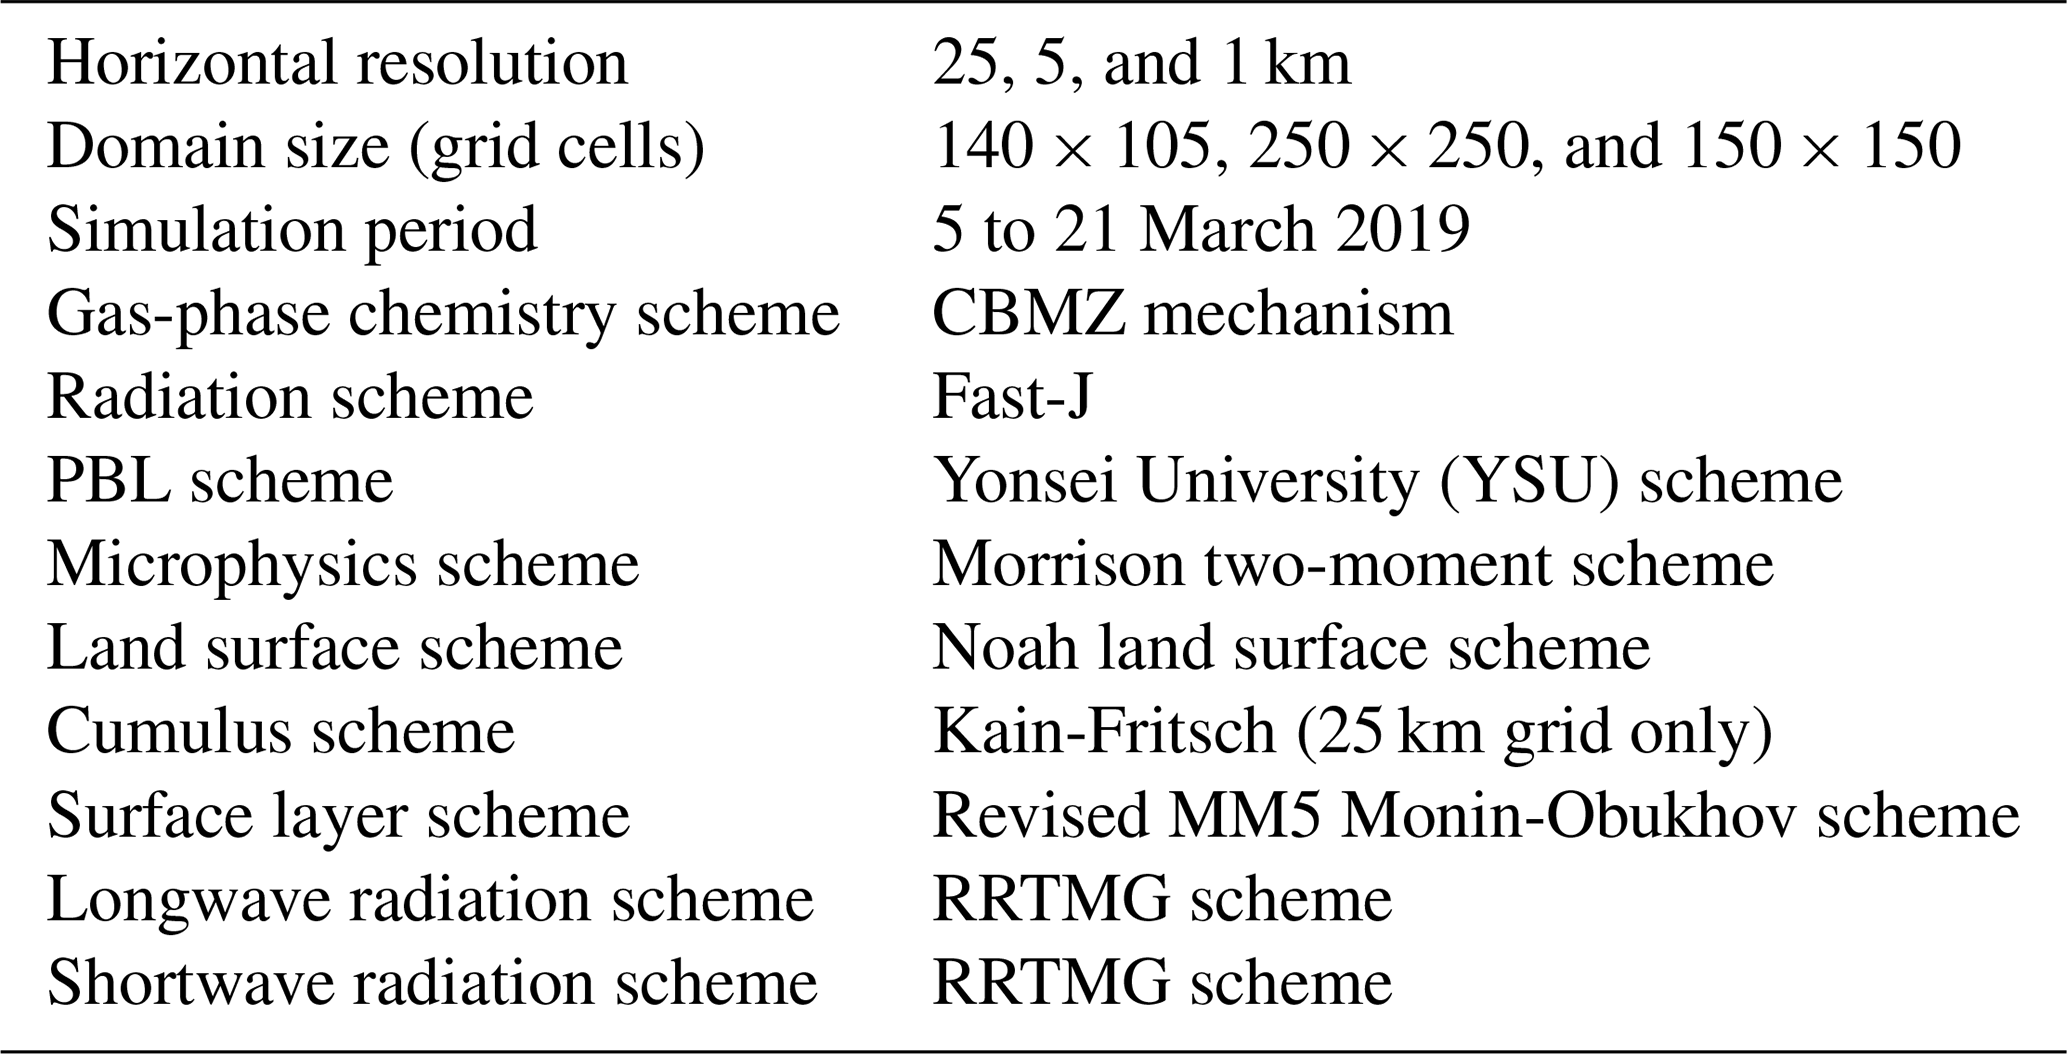
The configuration of WRF-Chem in this study is given in Table 1. In summary, the Model for Simulating Aerosol Interactions and Chemistry (MOSAIC) and the CBM-Z (carbon bond mechanism) photochemical mechanism (Zaveri and Peters, 1999) are used. The MOSAIC aerosol scheme includes important physical and chemical processes such as nucleation, condensation, coagulation, aqueous-phase chemistry, and water uptake by aerosols. Sulfate (SO, nitrate, (NO, ammonium (NH, sea salt, mineral dust, organic matter (OM), black carbon (BC), and other (unspecified) inorganics (OIN) constitute the prognostic species in MOSAIC. OIN represents the unidentified aerosol species other than OM, BC, sulfate, ammonium, and nitrate in emissions if any, which are composed mostly of minerals in emissions in this study. The aerosol direct effect is coupled to the Rapid Radiative Transfer Model (RRTMG) (Mlawer et al., 1997; Iacono et al., 2000) for both SW (shortwave) and LW (longwave) radiation as implemented by Zhao et al. (2011). The optical properties and direct radiative forcing of individual aerosol species in the atmosphere are diagnosed following the methodology described in Zhao et al. (2013b). We also turned on the aerosol indirect effect, which represents the interactions between aerosols and clouds, including the first and second indirect effects, activation/resuspension, wet scavenging, and aqueous chemistry (Gustafson et al., 2007; Chapman et al., 2009). The photolysis rate is computed by the Fast-J radiation parameterization (Wild et al., 2000). Dry deposition of aerosol mass and number is simulated following the approach of Binkowski and Shankar (1995), which includes both particle diffusion and gravitational effects. Other model configurations include the Yonsei University (YSU) nonlocal PBL parameterization scheme (Hong et al., 2006), the Noah land surface model (Chen and Dudhia, 2001) for the surface layer process, and the Morrison two-moment scheme (Morrison et al., 2009) for cloud microphysics.
2.2 Numerical experiments
The study period spans from 5 to 20 March 2019. Following previous research (Yang et al., 2025), the first 5 d are considered to be the model spin-up time, while the remaining integration period (10–20 March 2019) is used for analysis. The selected episode was strategically chosen based on several considerations. This period corresponds to the pollution season when PM2.5 concentrations are typically much higher than in summer, and lake-land thermal contrasts remain sufficiently strong to drive significant lake-breeze circulations. Importantly, the episode was characterized by predominantly clear-sky conditions, with total column cloud water and cloud ice content remaining at low levels (less than 0.1 kg m−2 in most areas) and negligible precipitation (hourly accumulation greater than 0.5 mm). These conditions are favorable for isolating the intrinsic lake effects while minimizing confounding influences from cloud microphysics and wet scavenging on PM2.5 distributions (detailed spatial distributions are not shown here). Additionally, March represents a transitional season between winter and summer circulation patterns, which facilitates the investigation of interactions among lake-induced meteorological perturbations, boundary layer evolution, and PM2.5 pollution. Given the extremely high computational cost of 1 km resolution WRF-Chem simulations, the 10 d period can capture diurnal variations of lake effects while remaining computationally feasible. It should be noted that ERA5 reanalysis dataset (https://rda.ucar.edu/datasets/ds630.0/, last access: 15 April 2019) indicates significant differences in large-scale circulation across different months during the pollution season (October, January, March) (see Fig. S1 in the Supplement), and the selected period represents springtime transitional conditions with moderate background winds. Therefore, our results should be interpreted as lake effects under specific springtime meteorological conditions, and the lake impact mechanisms may differ in other seasons, rather than being statistically representative of all pollution seasons. The sensitivity experiments employ identical initial and boundary conditions, ensuring that simulation differences primarily reflect perturbations induced by lake presence.
As shown in Fig. 1a, a three-domain nested simulation is implemented with spatial resolutions of 25, 5, and 1 km resolution, respectively. The outermost domain encompasses East, North, and South China with 140 × 105 grid cells (107–128° E, 17–45° N) at 25 km horizontal resolution. The intermediate domain covers the Yangtze River Delta (YRD) region in East China, consisting of 250 × 250 grid cells (111.8–121.8° E, 27–37° N) at 5 km resolution. The innermost domain centers on Hefei City and encompasses Chaohu Lake, covering 150 × 150 grid cells (116.6–117.8° E, 31.2–32.4° N) at 1 km horizontal resolution. Domain 3 was selected as the main scope of study for this research, as shown in Fig. 1b. Hefei, the capital city of Anhui province and a typical megacity in the YRD, is located in the mid-latitude zone with a humid subtropical monsoon climate. The solid black triangle indicates the location of Hefei, as shown in Fig. 1b. Chaohu Lake (31.40–31.72° N, 117.27–117.85° E), China's fifth-largest freshwater lake, is situated in central Anhui Province, approximately 15 km southeast of Hefei. The lake encompasses approximately 780 km2 with an average depth of 3 m and a 176 km shoreline. Thus, in this study, the lake is characterized as a large, shallow, freshwater body situated within an inland monsoon region, a configuration representative of numerous lakes in East Asia. We define lake impact as the aggregate atmospheric perturbation driven by the thermal and physical contrasts between the water surface and the surrounding terrestrial landscape. This includes the modification of the surface energy balance, alterations in aerodynamic roughness, and the regulation of atmospheric moisture, which collectively govern the development of the internal boundary layer and the thermodynamic stability of the overlying air. Specifically, this is expressed as the difference between the Lake (control) and Nolake (sensitivity) experiments, or between the Lake_emis (control) and Nolake_emis (sensitivity) experiments, as discussed below. This approach allows us to isolate the net effect of the intrinsic physical and chemical properties of the lake on the overlying atmosphere, providing a clear mathematical framework to evaluate how the presence of the water body modulates the regional environment.
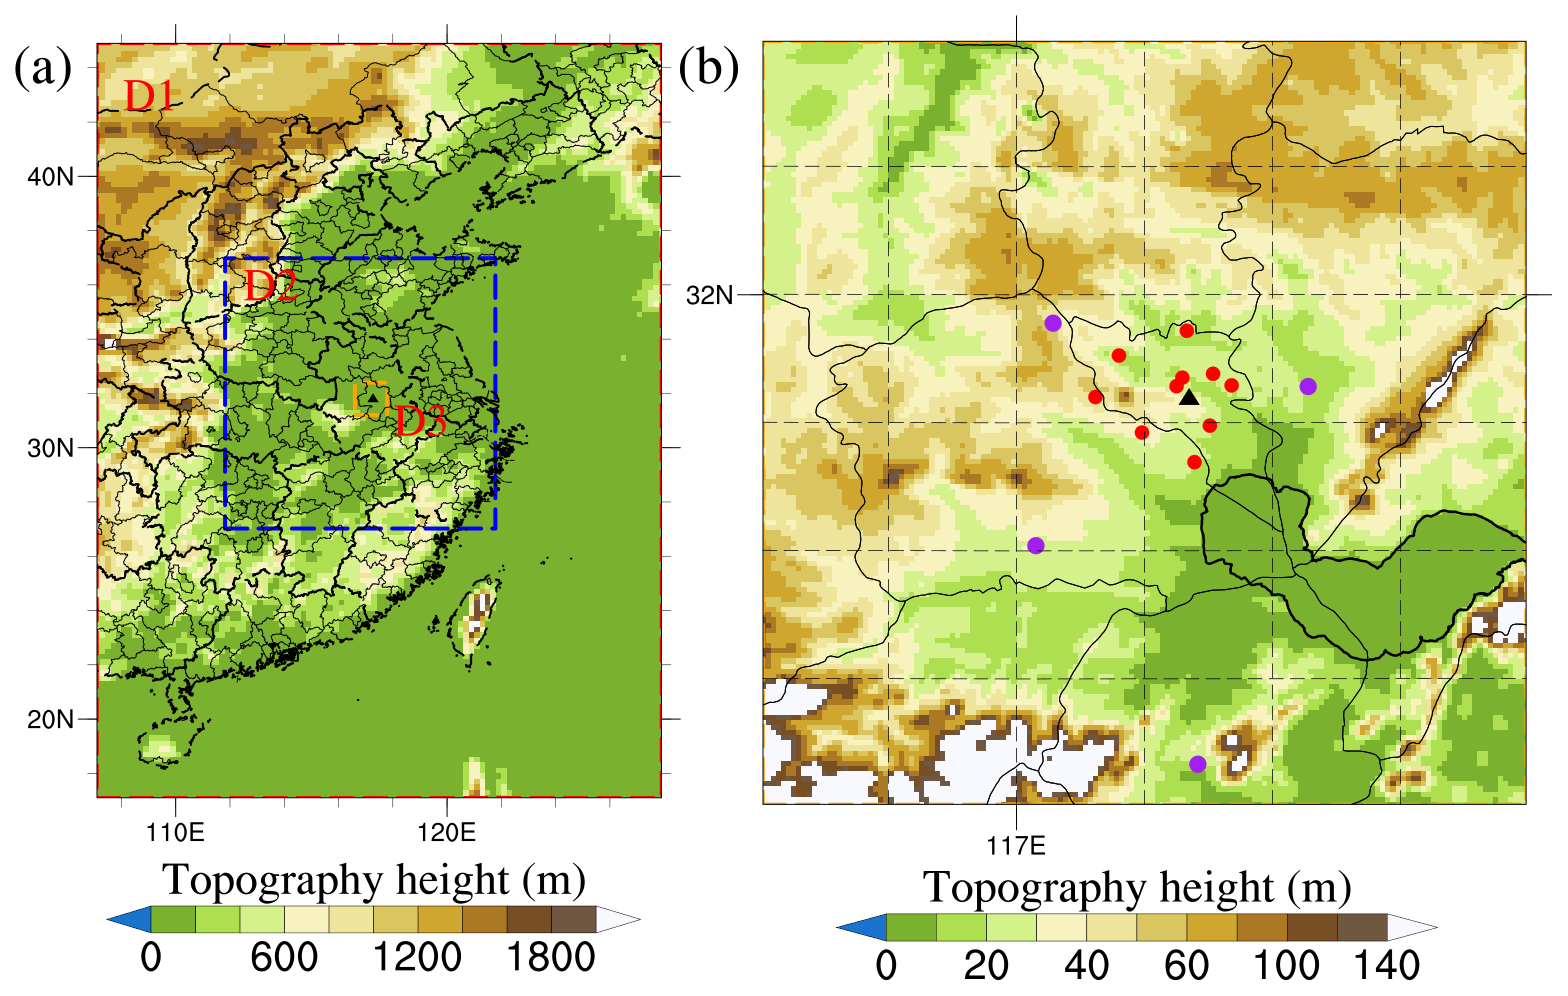
Figure 1(a) The three domains used in the WRF-Chem simulations and the terrain height (m) of each domain. Domain one (D1) has a horizontal grid spacing of 25 km, domain 2 (D2) 5 km, and domain 3 (D3) 1 km; (b) The spatial distribution of the terrain height (m) in D3. The solid black triangle indicates the location of Hefei, the solid dots triangles indicate MEP monitoring sites, and the purple solid dots indicate AWSs locations.
We derive terrain information from a high-resolution (∼ 1 km) US Geological Survey (USGS) topographic data and interpolate it onto the WRF grid. Furthermore, to better resolve the PBL structure and mixing processes, we implemented a finer vertical resolution within the PBL. A total of 50 terrain-following vertical eta-layers extending from the surface to approximately 15 km were used, with 30 layers distributed below 2 km above the ground to describe the atmospheric boundary structure in detail. The vertical layer was strategically designed with 7 layers below 200 m (each approximately 20 m in height), 3 layers between 200 and 300 m (each about 30 m in height), and 8 layers between 300 and 1000 m (each approximately 80 m in height). This configuration comprehensively captures mixed layer development and key turbulent processes (e.g., entrainment and surface flux exchange) through layer densification, which is sufficient to capture PBL turbulent mixing.
Additionally, to ensure consistent boundary forcing across the three nested domains, initial and boundary conditions are configured hierarchically. For the 25 km resolution domain, meteorological initial and lateral boundary conditions are obtained from the National Center for Environmental Prediction (NCEP) Final Reanalysis (FNL) data at 1° × 1° resolution and 6 h temporal intervals. Initial and boundary conditions for the trace gases and aerosol species are provided by the quasi-global WRF-Chem simulation with 360 × 145 grid cells (67.5° S–77.5° N, 180° W–180° E) at 1° × 1° resolution. More details about the quasi-global WRF-Chem simulation can be found in Zhao et al. (2013b). The 5 km resolution simulation obtains its initial and boundary conditions from the 25 km simulation output, while the 1 km resolution simulation is similarly driven by the 5 km simulation results. Furthermore, the 25 km resolution simulation turns on the option of cumulus parameterization, which uses the Kain-Fritsch cumulus and shallow convection scheme (Kain, 2004) to simulate sub-grid scale clouds and precipitation. However, this option is turned off in the other two higher-resolution simulations because the fine-resolution is sufficient to resolve the cloud-forming processes.
The land cover dataset is derived from a 1 km horizontal resolution dataset for China (Zhang et al., 2021). The land use categories follow the United States Geological Survey's (USGS) 24-category classification, and the dataset is based on China's land cover conditions as of 2015. This provides a more accurate representation of current land cover, particularly for eastern China, which has experienced intensive urban expansion since the 2000s. Figure 2a shows the land cover data at 1 km resolution, with detailed descriptions of the legend and land cover classes provided in Table S1 in the Supplement. This set of simulations is referred to as the “Lake experiment”. To evaluate the impact of lake effects on meteorological conditions and PM2.5 concentrations in surrounding urban regions, we conducted a sensitivity experiment in which Chaohu Lake was replaced with cropland, the dominant land use type surrounding the lake, as illustrated in Fig. 2b. This experiment is referred to as the “Nolake experiment”. Specifically, only the lake area was replaced with cropland while preserving land-use types in other regions, with all other conditions remaining unchanged, including initial and boundary conditions, emissions, and parameterization schemes. With the exception of part of Sect. 3.3, all other analyses in this study are based on the results of these two comparative experiments.
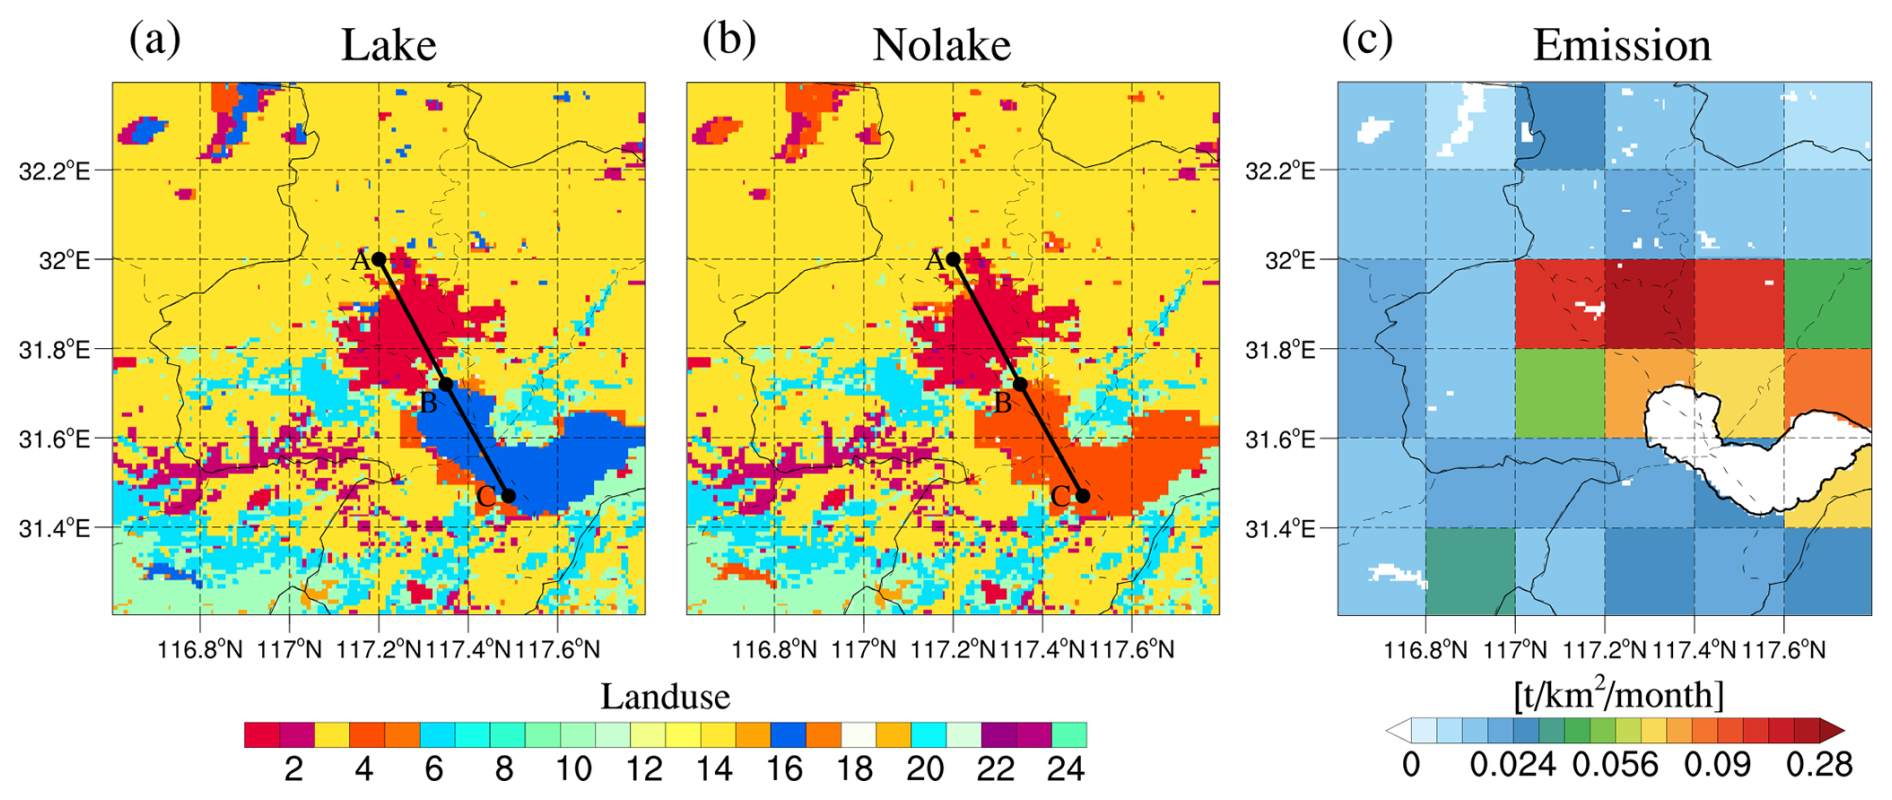
Figure 2The spatial distribution of land use types in the (a) Lake experiment and (b) Nolake experiment across the study area, with detailed descriptions of the legend and land cover classes provided in Table S1 in the Supplement. (c) The spatial distribution of PM2.5 emissions in both the Lake and Nolake experiments averaged over the entire day throughout the study area. The black line segments (AB and BC) in panels (a) and (b) represent transects selected for subsequent detailed analyses, traversing both urban and lake regions to capture the spatial characteristics of lake-urban interactions.
2.3 Emissions
Conventionally, lake surfaces are regarded as emission-free areas, with theoretical emission rates assumed to be zero. However, due to the coarse spatial resolution of current emission inventories, most datasets cannot effectively distinguish between land and lake surfaces. When emission inventories are spatially allocated or downscaled to finer grid resolutions for air quality modeling, the lack of explicit lake-land differentiation in these inventories results in emission fluxes being distributed uniformly across grid cells, thereby erroneously assigning anthropogenic emissions to lake areas that should theoretically be emission-free. Consequently, anthropogenic emissions are often assigned to lake regions in many previous studies, which may introduce biases and limit our understanding of atmospheric processes over lake environments. To address the differences between scenarios with and without actual emissions over the lake surface, this study designed four sets of comparative experiments. The first two experiments are the previously mentioned “Lake experiment” and “Nolake experiment”, in which lake surface emissions were masked (i.e., set to zero), allowing investigation of how an emission-free lake surface affects the distribution of particulate matter in the lake region and adjacent urban areas. The results presented in Sect. 3.1 and 3.2 are based on these two experiments. Additionally, to assess scenarios where emissions are retained over the lake surface, a prevalent configuration in current air quality modeling studies due to emission inventory limitations, two additional experiments, “Lake_emis experiment” and “Nolake_emis experiment”, were conducted. These experiments preserve the original lake emissions while all other model settings remain consistent with the “Lake experiment” and “Nolake experiment”. The purpose of these additional experiments is to evaluate how the erroneous assignment of emissions to lake surfaces, a systematic bias resulting from insufficient spatial resolution in emission inventories, may alter the lake effects revealed in the idealized zero-emission scenarios and subsequently impact PM2.5 distribution patterns in surrounding urban areas. Related analyses are presented in Sect. 3.3. This four comprehensive experimental design enables systematic evaluation of how both the presence of lake surfaces and the configuration of lake emissions influence regional air pollution and lake-urban interactions.
For all simulations, anthropogenic emissions for the outer quasi-global simulation are derived from the Hemispheric Transport of Air Pollution version-2 (HTAPv2) at 0.1° × 0.1° horizontal resolution with monthly temporal resolution for 2010 (Janssens-Maenhout et al., 2015). The Multi-resolution Emission Inventory for China (MEIC) at 0.25° × 0.25° horizontal resolution for 2019 (Li et al., 2017a; Li et al., 2017b; Zheng et al., 2018; Geng et al., 2024a) is used to replace emissions over China within the simulation domain. Specially, anthropogenic emissions for Domain 1 (D1) are obtained from the original HTAPv2 and MEIC inventory interpolated to 25 km resolution. Emissions for Domain 2 (D2) and Domain 3 (D3) are subsequently derived by interpolating the 25 km resolution emissions to 5 and 1 km resolution domains, respectively. This study primarily focuses on PM2.5. The spatial distribution of PM2.5 emissions averaged over the entire day for both the Lake and Nolake experiments is shown in Fig. 2c, and Fig. S2 illustrates the corresponding spatial distribution of PM2.5 emissions in both the experiments at 08:00, 11:00, 14:00, 17:00, 20:00, 23:00, 02:00, and 05:00 local time (LT) throughout the study area. Additionally, the spatial distribution of PM2.5 emissions in both the Lake_emis and Nolake_emis experiments averaged over the entire day is shown in Fig. S3. Biomass burning emissions are obtained from the Fire Inventory from NCAR (FINN) at a 1 km horizontal resolution and 1 h temporal resolution (Wiedinmyer et al., 2011). The diurnal variation in biomass-burning emissions follows the suggestions by WRAP (2005), with injection heights based on Dentener et al. (2006) from the Aerosol Comparison between Observations and Models (AeroCom) project. Biogenic emissions were calculated using the Model of Emissions of Gases and Aerosols from Nature (MEGAN) v3.0 model (Gustafson et al., 2007; Zhang et al., 2021).
2.4 Observational data
2.4.1 Meteorological data
The meteorological data were obtained from automatic weather stations (AWSs), which were established based on the operational standards issued by the China Meteorological Administration (CMA, 2018). The hourly data underwent quality control (QC) by local meteorological bureaus of Anhui, following World Meteorological Organization guidelines (Estevez et al., 2011). The QC included checks of consistency, such as internal, temporal-spatial, and climatic range validations. These QC data were used to determine daily mean, minimum, and maximum meteorological variables. The AWSs recorded various parameters, including air temperature (T, °), wind speed (U, m s−1), air pressure (P, Pa), and wind direction. In this study, we focus on the 3-hourly 2 m temperature and 10 m wind speed obtained from four AWS stations located in the study region. The four AWS sites are marked by purple solid dots in Fig. 1b.
2.4.2 Environmental data
Ground observations of hourly PM2.5 near-surface concentrations during March 2019 were obtained from the website of the Ministry of Environmental Protection of China (MEP of China). As our study concentrates on the Hefei region, we selected 10 monitoring stations within this area for detailed analysis. These stations are marked by red solid dots in Fig. 1b.
While hourly observations for both meteorology and pollutants are available, model outputs are provided at 3 h intervals to balance computational efficiency and storage requirements. Hourly output data would provide higher time resolution but significantly increase storage demands. Given that we ran simulations at 1 km resolution, hourly outputs would have generated prohibitively large data volumes. On the other hand, this 3 h output interval remains sufficient for our primary research objective of investigating the diurnal reversal effect of lake impacts on PM2.5 concentrations and elucidating the coupling mechanisms between physical processes (turbulent mixing, dry deposition, local circulation) and chemical processes. This approach effectively captures the distinct daytime pollution enhancement and nighttime purification patterns without losing essential detail for understanding lake-urban air quality interactions. To ensure consistent temporal resolution between model and observations, hourly observations were sampled to match our 3 h model output intervals.
3.1 PM2.5 near-surface concentrations over lake and urban areas during daytime and nighttime
Before presenting the simulation results of PM2.5 near-surface concentrations over lake and urban areas during daytime and nighttime, a systematic evaluation of the Lake experiment is first conducted to verify the capability of the simulation framework in reproducing real atmospheric conditions with the lake present. The evaluation covers the meteorological fields and PM2.5 surface concentrations during the study period from 10 to 20 March 2019, which are compared against in-situ observational data averaged over 10 MEP sites in Hefei.
The model's performance in reproducing meteorological conditions is assessed by comparing the simulated 10 m wind speed and 2 m temperature with observational data from four AWSs in the Hefei region, as shown in Fig. S4. Overall, the model performs well in simulating both variables and successfully reproduces the temporal evolution throughout the study period. The model overestimates peak wind speed during the strong wind event around 20 March, likely attributable to complex mesoscale interactions. Nevertheless, this bias does not compromise the overall assessment of circulation characteristics throughout the study period, as demonstrated in Fig. S4a. The simulated 2 m temperature agrees well with observations, indicating that the model accurately characterizes the surface energy budget and thermodynamic conditions that form the physical basis for analyzing the lake-land thermal contrast in this study, as shown in Fig. S4b. The model's ability to reproduce PM2.5 surface concentrations is then assessed against observational data from 10 MEP sites in the Hefei region. Figure S5 shows the comparison between the simulated and observed diurnal variations of PM2.5 averaged over the study period. The model captures the key features of the observed diurnal cycle well, including the nocturnal accumulation of PM2.5 under stable boundary layer conditions and the daytime concentration decrease driven by boundary layer development and enhanced turbulent mixing. The simulated diurnal variation are generally consistent with observations, while the overestimation of nighttime concentrations is primarily attributed to insufficient representation of turbulent mixing intensity under stable nocturnal boundary layer conditions in the model (Yang et al., 2025).
It is worth noting that the Nolake experiment, in which Chaohu Lake is replaced by cropland, is a controlled sensitivity experiment designed to isolate lake-induced effects and does not represent an observable atmospheric state, so independent observational validation is neither feasible nor necessary. Given the overall satisfactory performance of the Lake experiment demonstrated above, the simulation framework is considered reliable, and the lake-induced signals identified through the differential analysis between the two experiments are sufficiently credible to support the discussion in the following sections.
3.1.1 Diurnal reversal of lake effects on near-surface PM2.5 concentrations
The spatial distribution of PM2.5 near-surface concentrations (the lowest model level) in the Lake experiment and the differences between the Lake and Nolake experiments at 08:00, 14:00, 20:00, and 02:00 LT, averaged over 10–20 March 2019, is illustrated in Fig. 3. Unless otherwise specified, all analyses presented in this study represent temporal averages over the 10 d period from 10 to 20 March 2019. At 08:00 LT (Fig. 3a), significant PM2.5 pollution centers appeared in urban areas where concentrations typically exceeded 70 µg m−3, while lake area concentrations in the Lake experiment reached 50–60 µg m−3. Figure 3b presents that PM2.5 concentrations over the lake region in the Lake experiment significantly exceeded those in the Nolake experiment, with the differences predominantly ranging from 0 to 10 µg m−3 and exceeding 10 µg m−3 in some regions. Additionally, the lake presence induced varying degrees of PM2.5 concentration enhancement in urban areas to the north and northwest. These results indicate that the lake enhances pollutant accumulation over its surface and facilitates transport to surrounding regions through atmospheric dispersion, thereby exacerbating urban PM2.5 pollution during morning. At 14:00 LT, PM2.5 concentrations throughout the region decreased substantially (Fig. 3c), with urban concentrations declining to approximately 30–40 µg m−3 due to daytime boundary layer development and enhanced dispersion. Over the lake area, PM2.5 concentrations in the Lake experiment approached 40 µg m−3, comparable to urban concentrations and substantially higher than corresponding values in the Nolake experiment. The difference shown in Fig. 3d reveals that the lake's pollution-enhancing effect peaked during afternoon. Specifically, PM2.5 concentrations in the Lake experiment over the lake surface significantly exceeded those in the Nolake experiment by more than 10 µg m−3. Compared to 08:00 LT, pollutant dispersion from the lake surface to surrounding areas extended over greater distances in the Lake experiment, with more pronounced relative differences in concentrations. Significant concentration enhancement zones of 0–10 µg m−3 form around the lake perimeter. These results indicate that the lake's pollution-enhancing effect intensifies during the afternoon and further exacerbates air pollution in surrounding urban areas.
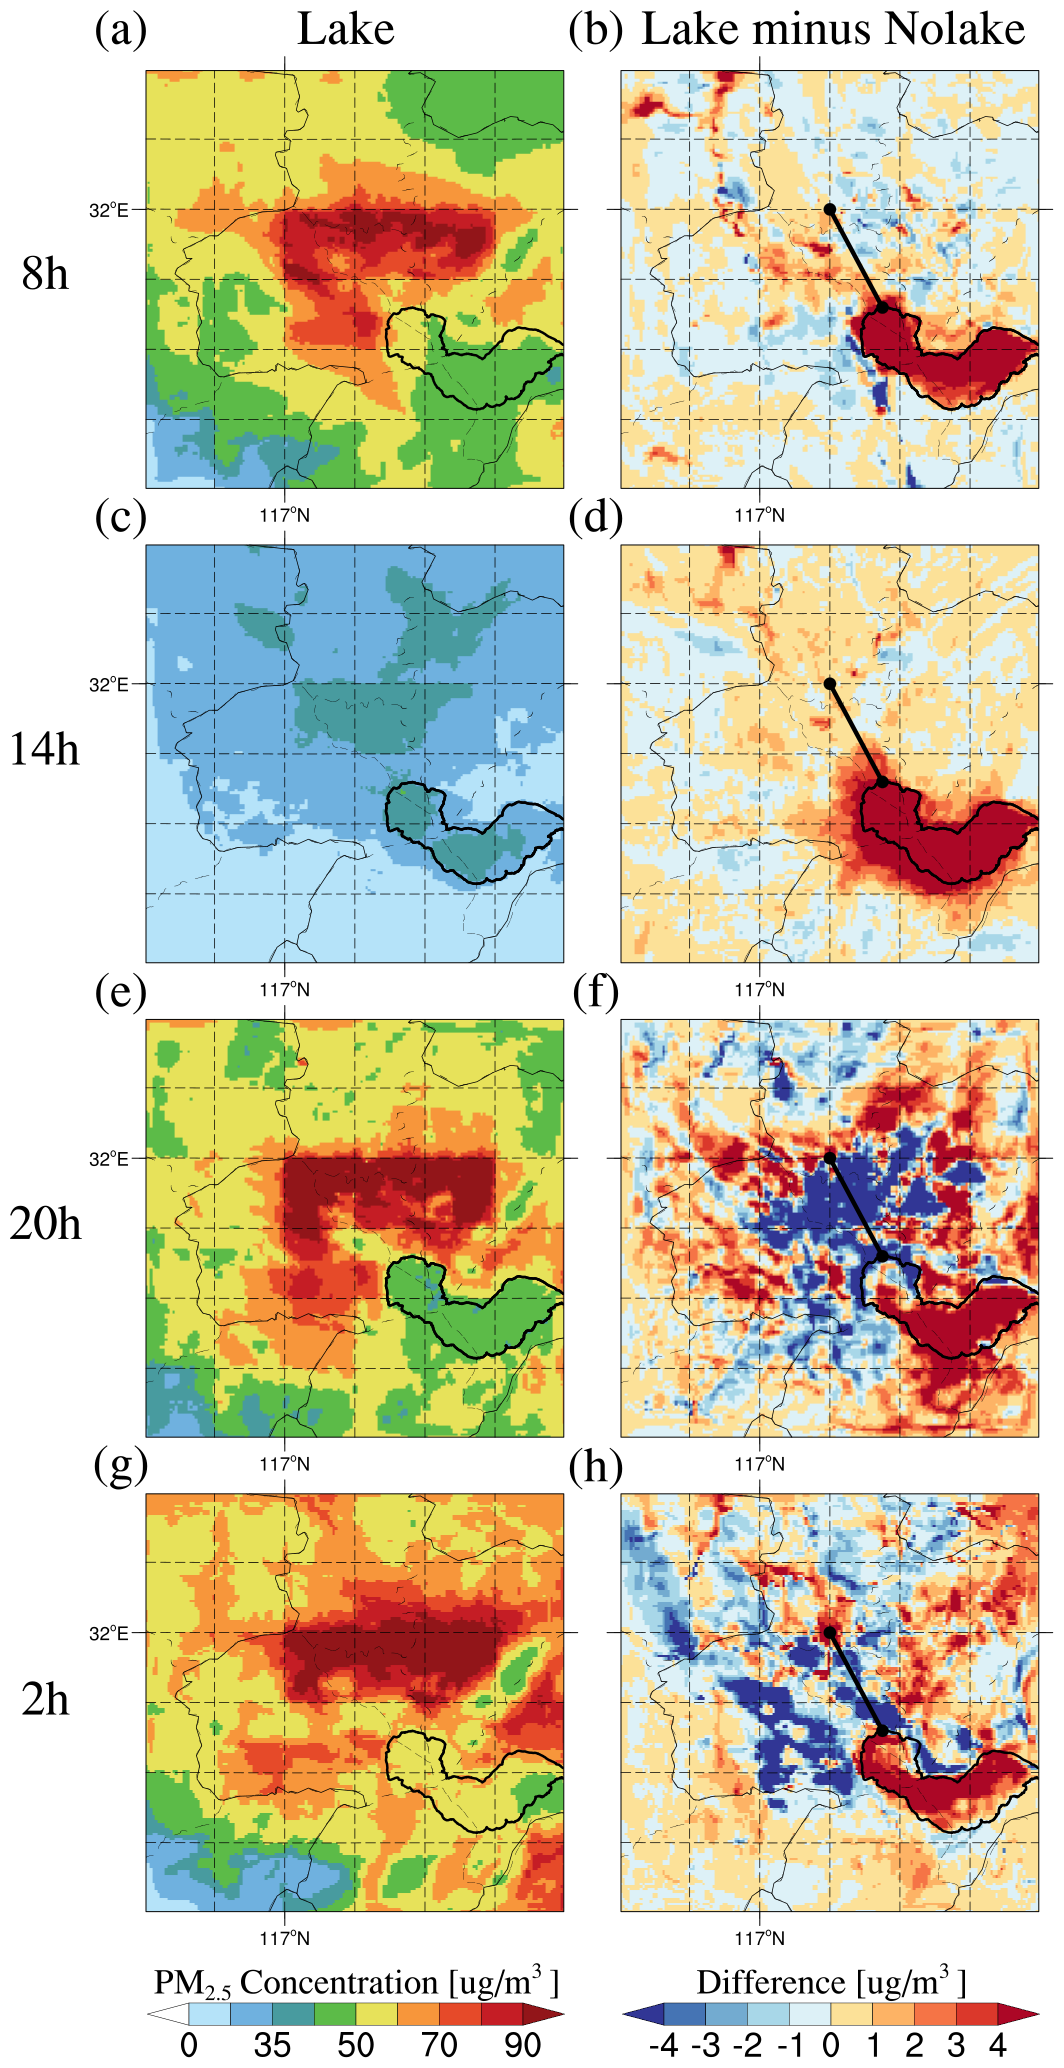
Figure 3The spatial distribution of PM2.5 near-surface concentrations in the (a, c, e, g) Lake experiment and (b, d, f, h) the differences between Lake and Nolake experiments (Lake minus Nolake) at 08:00, 14:00, 20:00, and 02:00 local time (LT) across the study area, averaged over 10–20 March 2019. Note that the line segments shown in panels (b, d, f, h) correspond to the AB transect marked in Fig. 2.
To further support the reliability of the simulated PM2.5 accumulation over the lake surface, we examine the spatial distribution of satellite-derived hourly high-resolution near-surface PM2.5 data over eastern China from the ChinaHighPM2.5 dataset (Wei et al., 2021), which provides hourly near-surface PM2.5 concentrations during 08:00–17:00 LT. The corresponding results are shown in Fig. S6. It should be emphasized that this comparison is not intended as a quantitative validation of our simulation results. The ChinaHighPM2.5 data used here are from 2018 rather than the simulated period of March 2019, precluding an exact temporal match with our model output. In addition, satellite-derived PM2.5 estimates are subject to inherent retrieval uncertainties, particularly over water surfaces, which renders meaningful quantitative comparison with model output unfeasible. Figure S6 is therefore presented purely for qualitative purposes, to demonstrate that elevated PM2.5 concentrations over the lake surface relative to surrounding areas represent a physically plausible phenomenon supported by independent observational evidence, rather than an artifact of the model configuration. Figure S6 shows that daytime lake-surface PM2.5 is comparable to or exceeds that over adjacent urban areas, with this feature being most pronounced during 11:00–16:00 LT (Fig. S6d–i), which is qualitatively consistent with the accumulation mechanism identified in our simulations. We acknowledge that direct quantitative validation of lake-surface PM2.5 using in-situ observations would be highly desirable. Unfortunately, in-situ air quality observations over lake surfaces and shoreline areas remain extremely scarce in China, with very limited publicly available data. Targeted observational deployments are discussed further in Sect. 4.
During nighttime, the lake impact on surrounding air quality underwent a fundamental reversal. At 20:00 LT, regional PM2.5 concentrations increased rapidly due to reduced nighttime PBLH and deteriorated dispersion conditions, as shown in Fig. 3e. In urban areas, PM2.5 concentrations in the Lake experiment exceeded 80 µg m−3, while concentrations over the lake surface ranged from approximately 40–50 µg m−3. Figure 3f clearly demonstrates that PM2.5 concentrations over the lake surface in the Lake experiment remained higher than those in the Nolake experiment, with the differences predominantly ranging from 0 to 10 µg m−3 and exceeding 10 µg m−3 in some regions. However, the lake presence significantly reduced PM2.5 concentrations in urban areas to its north and northwest, with reductions generally exceeding 10 µg m−3. This phenomenon indicates that the lake exerted a distinct and continuous purification effect on surrounding urban areas during nighttime. By 02:00 LT, high-concentration pollution masses continued to persist and accumulate in urban areas, with concentrations in the central urban area exceeding 90 µg m−3 (Fig. 3g). The lake area maintained higher concentrations in the Lake experiment compared to the Nolake experiment (Fig. 3h). The nighttime purification effect persisted at 02:00 LT, with PM2.5 concentrations in the Lake experiment remaining lower in urban areas by 0–10 µg m−3. Although the spatial extent and pattern of the purification effect evolved slightly compared to 20:00 LT, the improvement effect of the lake on urban air quality remained stable and persistent throughout the night. The spatial distributions of PM2.5 near-surface concentrations in the Lake and Nolake experiments at 11:00, 17:00, 23:00, and 05:00 LT (Fig. S7) displayed patterns consistent with those at 08:00, 14:00, 20:00, and 02:00 LT, further validating the stability and reproducibility of the diurnal variation in the lake's impact on local PM2.5 concentrations. The lake exhibits significant diurnal variation in its influence on local PM2.5 concentrations, consistently maintaining higher concentrations over the lake surface than in the Nolake experiment. The lake's impact on surrounding urban areas shows distinct diurnal differences, enhancing urban PM2.5 concentrations by 0–10 µg m−3 (exceeding 10 µg m−3 in some regions) during daytime with peak effects at 14:00 LT, while reducing concentrations by 0–10 µg m−3 (exceeding 10 µg m−3 in some regions) during nighttime, revealing a dual role in regulating local air quality.
Furthermore, to more clearly quantify the PM2.5 concentration differences between the Lake and Nolake experiments and their temporal and spatial variations, Fig. 4 presents the diurnal variation of PM2.5 concentrations along the key path indicated in Fig. 3. Figure 4a compares the average PM2.5 concentration differences along this transect during daytime (the average of 08:00, 11:00, 14:00, and 17:00 LT) and nighttime (the average of 20:00, 23:00, 02:00, and 05:00 LT). During daytime, the presence of the lake consistently elevates PM2.5 concentrations along the transect, with the most significant impact at point B adjacent to the lakeshore (0 km distance), where the peak difference exceeds 8 µg m−3. This effect gradually weakens with increasing distance and stabilizes at 0–2 µg m−3 beyond approximately 15 km. At night, a significant purification effect is observed. At point B, the concentration difference is slightly positive but rapidly becomes negative approximately 1 km from the lakeshore, reaching maximum purification effectiveness in the urban center 16–17 km from point B, with concentration reductions approaching 8 µg m−3. This indicates that the most significant nighttime purification occurs not immediately adjacent to the lakeshore but rather appears in areas at a certain distance from the lakeshore.
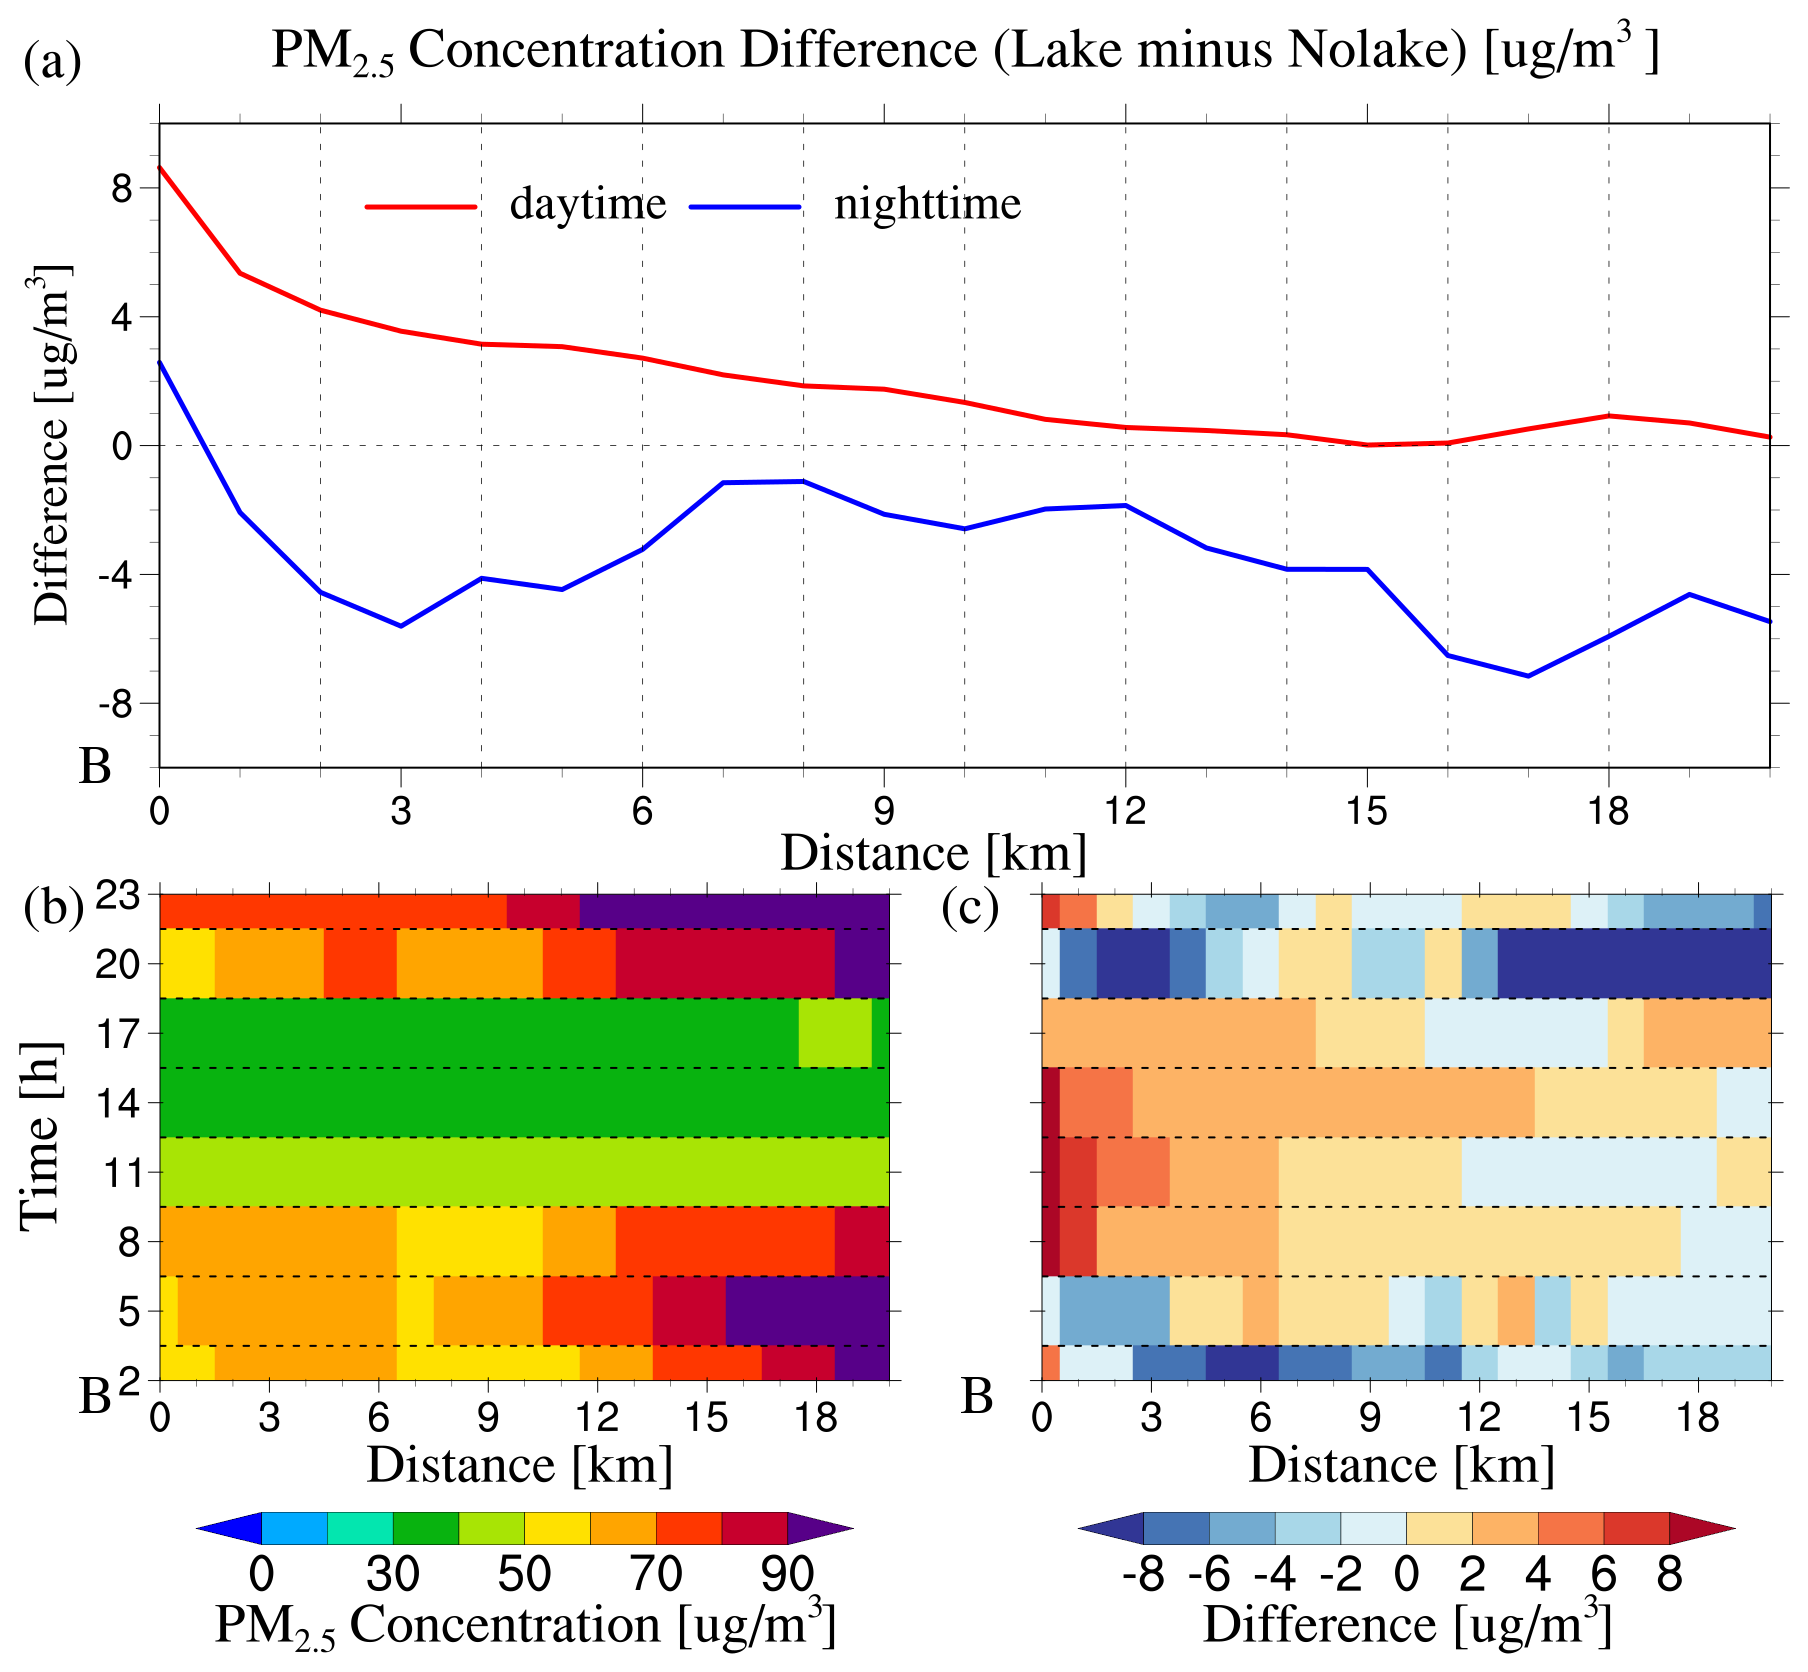
Figure 4Diurnal variation of PM2.5 near-surface concentration along the path. (a) Average PM2.5 concentration differences (Lake minus Nolake) during daytime (the average of 08:00, 11:00, 14:00, and 17:00 LT, red line) and nighttime (the average of 20:00, 23:00, 02:00, and 05:00 LT, blue line), averaged over 10–20 March 2019, as a function of distance from point B toward A, as marked in Figs. S2 and S3. (b) Diurnal variation of PM2.5 concentration with distance in the Lake experiments. (c) Diurnal variation of PM2.5 concentration differences between Lake and Nolake experiments (Lake minus Nolake) with distance. The x-axis represents the distance from point B along the transect, the y-axis in (a) represents the concentration difference, and the y-axis in (b) and (c) represents the local time.
Figures 4b shows the evolution of PM2.5 concentrations along the path with time and distance for the Lake experiments, exhibiting strong diurnal variation. During nighttime to early morning (approximately 19:00–08:00 LT), PM2.5 concentrations exceed 70 µg m−3 due to persistent pollutant accumulation under stable boundary layer conditions. During daytime (approximately 09:00–18:00 LT), concentrations decrease significantly to 30–50 µg m−3 as the boundary layer develops and dispersion conditions improve. Figure 4c displays the diurnal variation of PM2.5 concentration differences between the Lake and Nolake experiments with distance, revealing the day-night reversal in the impact of the lake. During daytime, PM2.5 concentrations are higher in the Lake experiment, with the greatest enhancement occurring in the near-lake area 0–6 km from point B, where the maximum increase exceeds 8 µg m−3, decreasing with increasing distance. Notably, the influence range is most extensive at 14:00 LT, with concentration increases of 2–4 µg m−3 still present within 15 km from the lakeshore, consistent with the daytime performance shown in Fig. 4a. At night, PM2.5 concentrations decrease, with more significant reductions at certain distances from the shore. For example, at 20:00 LT in the area approximately 12–18 km from point B, maximum reductions exceed 8 µg m−3. To further investigate the diurnal reversal pattern at different times, Fig. S8 shows the distribution of average PM2.5 concentration differences along the path at eight key moments. The results are highly consistent with Fig. 4, revealing in greater detail the intensity variations, influence ranges, and temporal evolution of the pollution enhancement and purification effects. Overall, the lake exerts a strong diurnal regulatory effect on local PM2.5 concentrations, exacerbating pollution in near-shore areas during daytime while providing a purification effect for surrounding urban areas during nighttime.
3.1.2 Aerosol-species dependent response of PM2.5 to lake effects
Furthermore, PM2.5 is composed of different components, yet the diurnal variation characteristics of these different components and their response mechanisms to lake influence remain unclear. To investigate the different impact of the lake on various PM2.5 components, this study conducted an in-depth analysis of primary and secondary PM2.5, as shown in Figs. 5 and 6. During daytime, the difference in secondary PM2.5 concentrations between the Lake and Nolake experiments is substantially larger than that of primary PM2.5. At 14:00 LT (Figs. 5c, 5d, 6c and 6d), the increase of secondary PM2.5 concentration over the lake is generally 5–10 µg m−3, which is not only significantly greater than the 0-5 µg m−3increase in primary PM2.5, but also extends over a broader range and extent of influence in surrounding areas. This spatial pattern reflects a sequential transport process. Particulate matter is first transported from pollution source regions (such as urban areas) to the lake surface, which has no local emissions. Subsequently, due to the suppressed boundary layer height, weak boundary layer mixing, and low dry deposition rates over the lake, particles accumulate substantially on the lake surface (detailed mechanism explained in Sect. 3.2.2). Notably, secondary PM2.5 concentrations over the lake are 15–18 µg m−3, while secondary PM2.5 concentrations in urban areas in the Lake experiment are approximately 12–15 µg m−3, forming an anomalous pollution pattern where lake surface concentrations exceed urban concentrations, which differs dramatically from conventional understanding. Moreover, because the accumulation of secondary PM2.5 over the lake during daytime is much greater than that of primary PM2.5 (detailed mechanism explained in Sect. 3.2.4), a greater amount of secondary particles is subsequently transported back to urban and other surrounding areas through lake-breeze circulation and dispersion (detailed mechanism explained in Sect. 3.2.3), becoming a key factor in exacerbating urban daytime PM2.5 pollution.
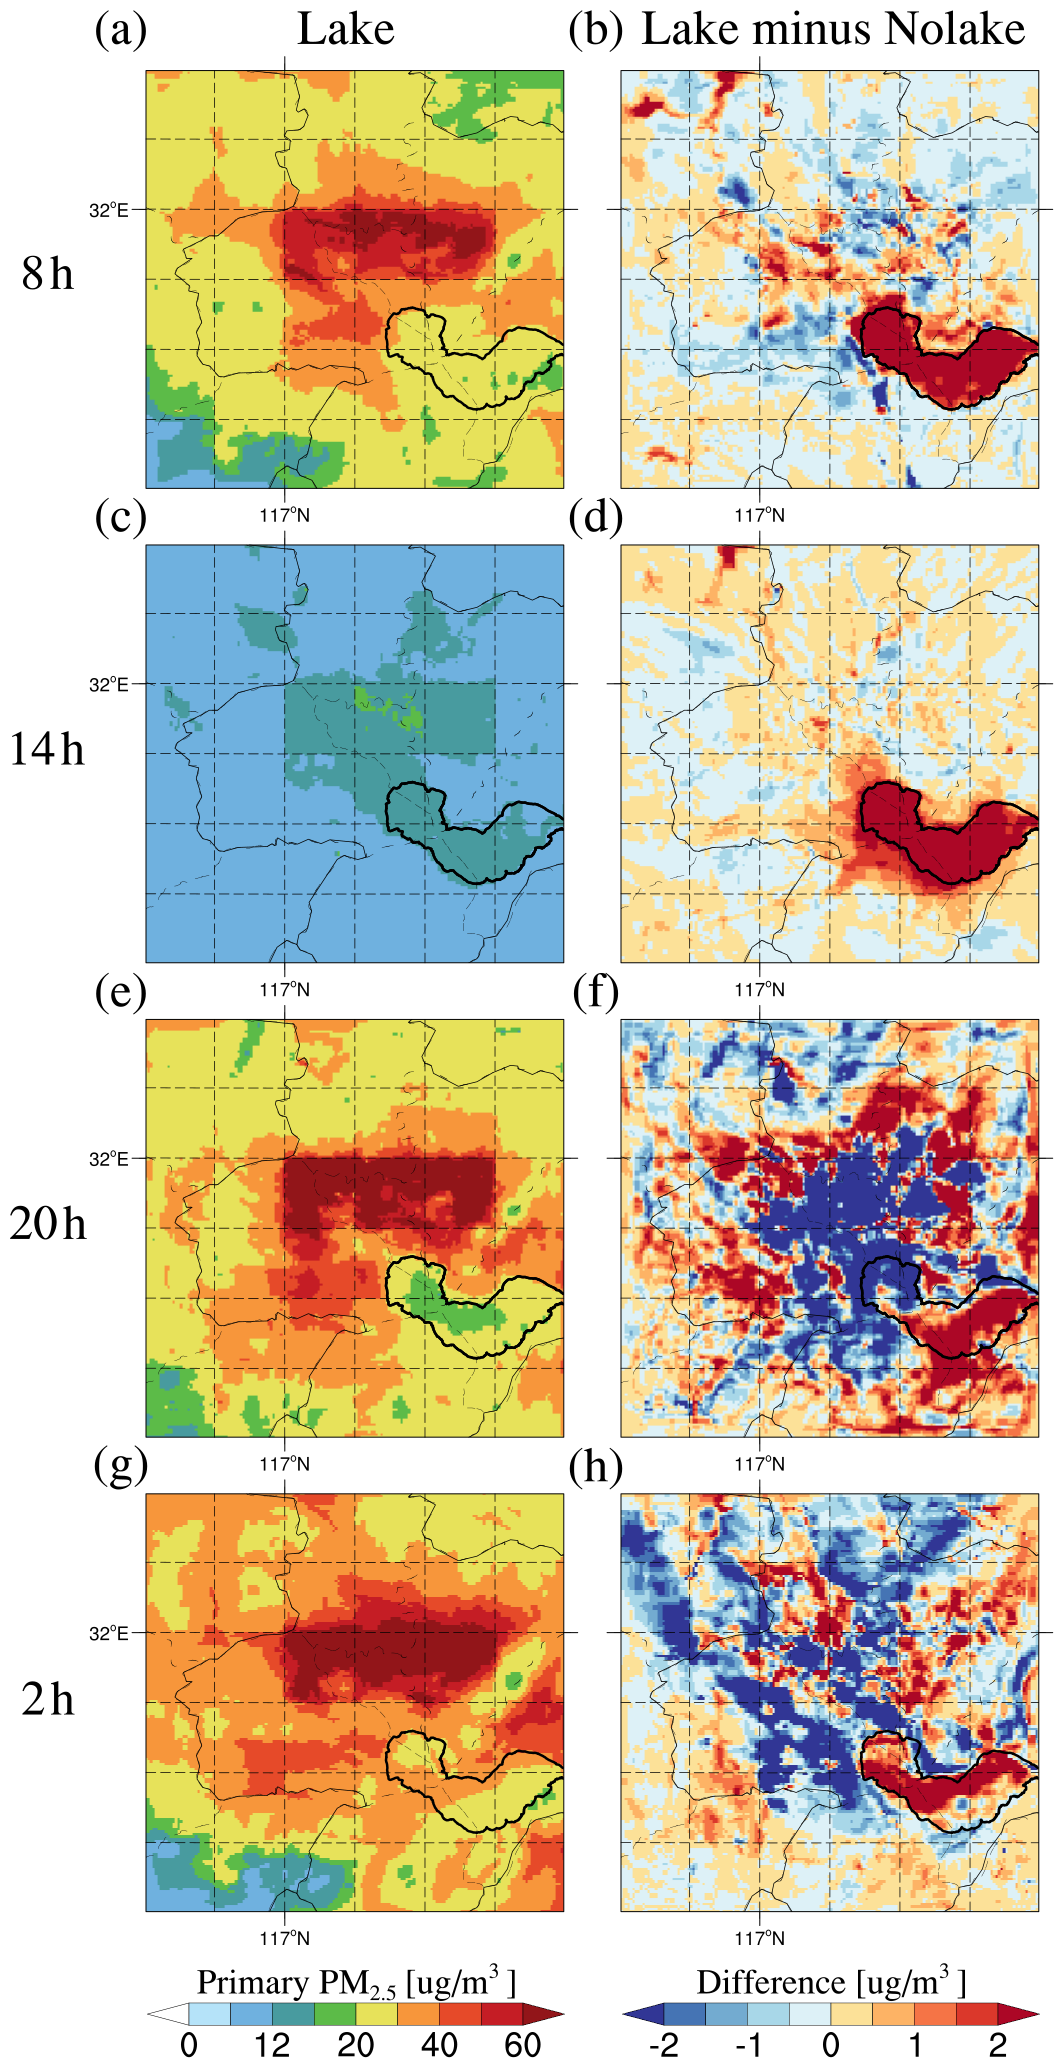
Figure 5The spatial distribution of primary PM2.5 near-surface concentrations (sum of black carbon (BC), organic carbon (OC), and other inorganics (OIN)) in the (a, c, e, g) Lake experiment and (b, d, f, h) the differences between Lake and Nolake experiments (Lake minus Nolake) at 08:00, 14:00, 20:00, and 02:00 LT across the study area, averaged over 10–20 March 2019.
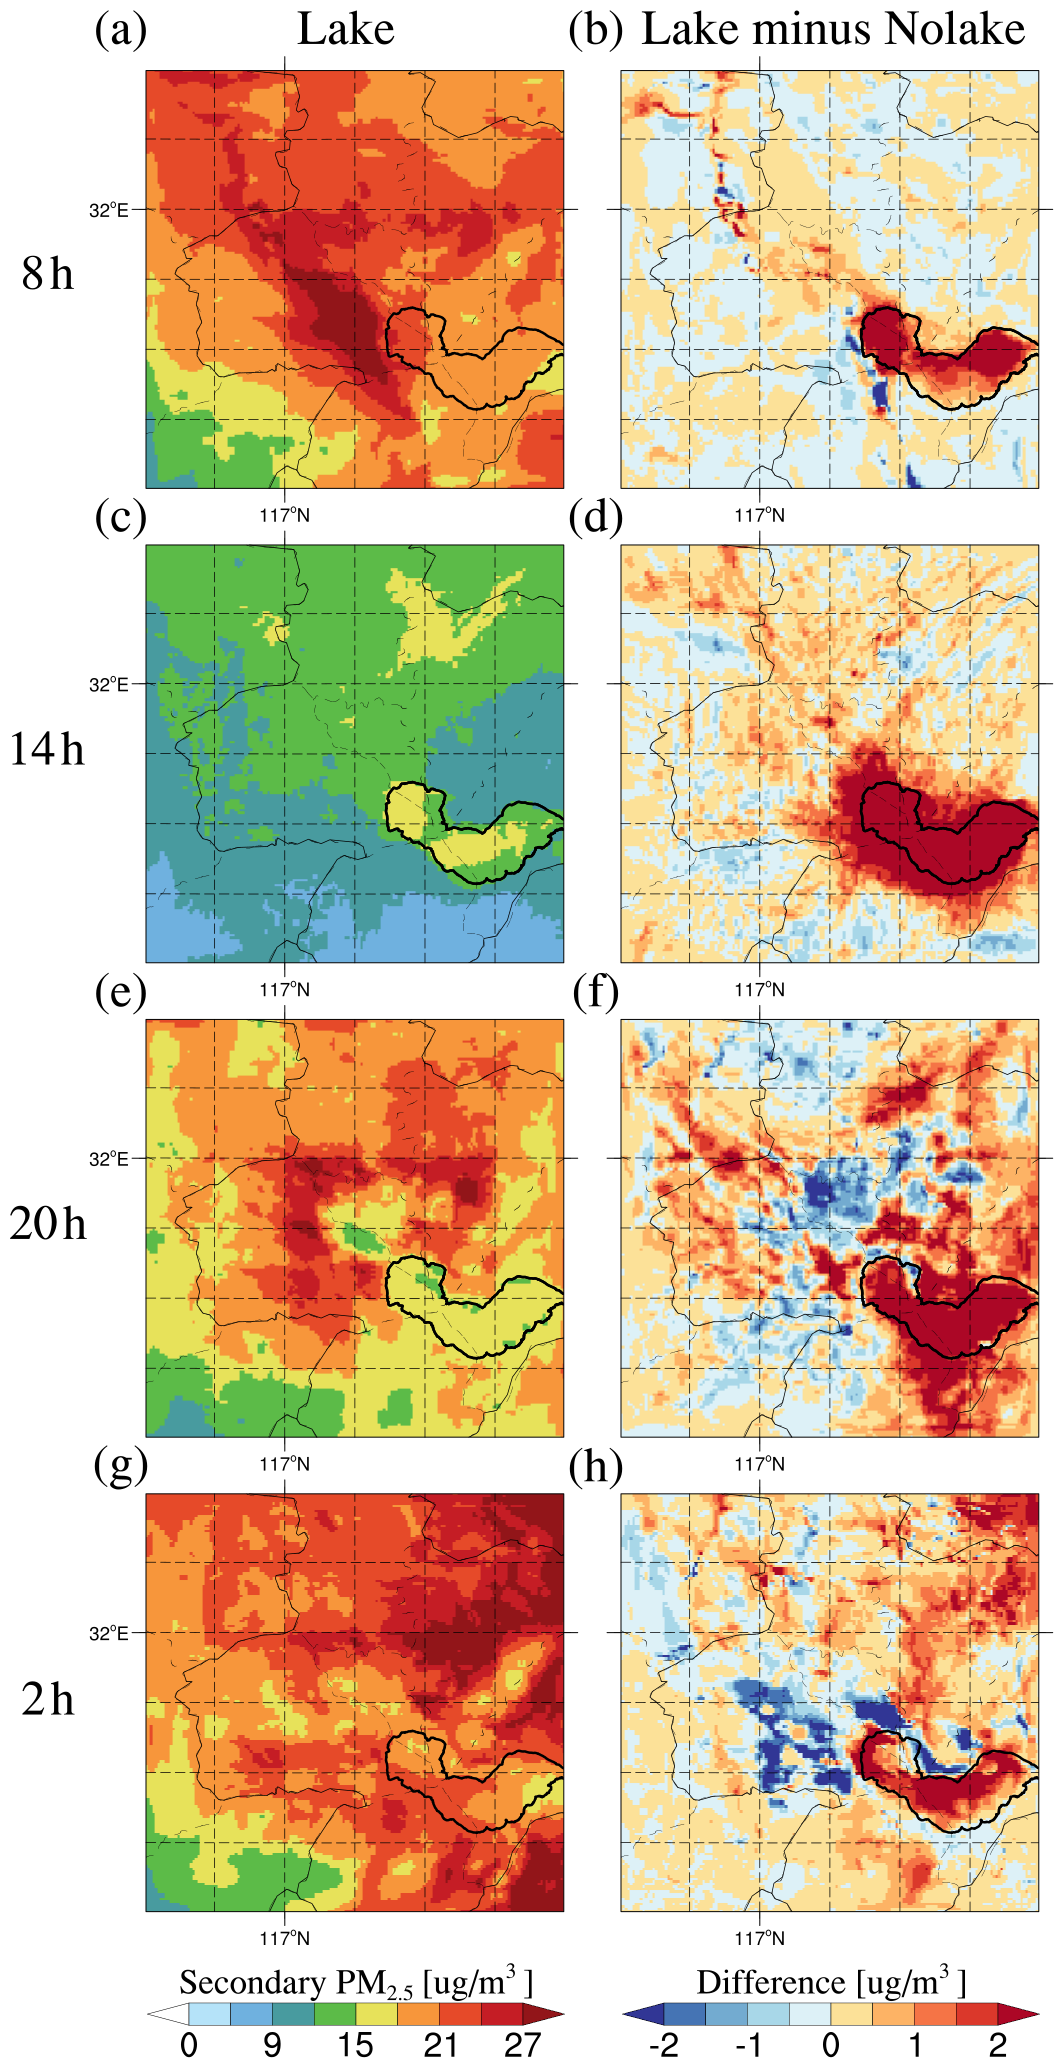
Figure 6The spatial distribution of secondary PM2.5 near-surface concentrations (sum of sulfate (SO, nitrate(NO, and ammonium (NH in the (a, c, e, g) Lake experiment and (b, d, f, h) the differences between Lake and Nolake experiments (Lake minus Nolake) at 08:00, 14:00, 20:00, and 02:00 LT across the study area, averaged over 10–20 March 2019.
During nighttime, however, the dominant mechanism undergoes a fundamental reversal, with physical transport of primary PM2.5 becoming the key factor determining changes in total PM2.5 concentrations in urban areas. Primary PM2.5 concentrations in urban areas are substantially reduced due to the lake presence, while secondary PM2.5 reductions are relatively limited. Therefore, primary PM2.5 dominate the spatial distribution of PM2.5 concentrations in urban areas during nighttime. At 20:00 LT (Figs. 5f and 6f), widespread reductions in primary PM2.5 concentrations occur across urban areas, with decreases exceeding 10 µg m−3 that correspond closely to the negative difference zones of total PM2.5. In contrast, secondary PM2.5 reductions are much weaker, with scattered affected areas and intensities generally ranging between 0–2.5 µg m−3, indicating that the nighttime purification effect is primarily achieved through effective removal of directly emitted pollutants (primary PM2.5). Additionally, Figs. S9 and S10 show the primary and secondary PM2.5 distribution at several other time points, with the overall pattern consistent with these results. In summary, the impact of lake on PM2.5 exhibits significant aerosol-species dependent response and diurnal transition characteristics. The nighttime purification effect is dominated by physical removal of primary PM2.5, while the daytime pollution enhancement effect, particularly the formation of extreme concentrations above the lake, is closely related to the unique chemical-physical interactions involving secondary PM2.5.
3.2 Factors controlling the variations of PM2.5 concentrations over the lake and urban areas
To elucidate the fundamental physical and chemical mechanisms underlying the diurnal reversal effect of lakes on PM2.5 concentrations, we conducted an in-depth analysis of the evolution of PM2.5 and its associated physical, dynamic, and chemical drivers in this section.
3.2.1 Spatiotemporal evolution of PM2.5 vertical distribution
Figure 7 presents the vertical cross-section of PM2.5 concentrations and wind vectors along the key path AC (as shown in Fig. 2). At 08:00, the PM2.5 high-concentration zone in both experiments was primarily concentrated below 0.3 km in urban areas, exceeding 55 µg m−3, while concentrations over the lake region were relatively low. The lake effect had already begun to manifest. Figure 7c shows near-surface PM2.5 concentrations over the lake were significantly higher in the Lake experiment, with peak differences exceeding 5 µg m−3, spreading toward surrounding urban areas and maintaining substantial differences at considerable distances from the lakeshore. Notably, near the top of the boundary layer, PM2.5 concentrations in the Lake experiment were actually lower than those in the Nolake experiment. At 14:00 LT, although PM2.5 concentrations generally decreased to 20–35 µg m−3 due to boundary layer development, the pollution-enhancing effect of the lake peaked. The high-concentration layer extending upward to approximately 1.5 km altitude with more uniform vertical mixing. Figure 7f shows maximum positive concentration differences of approximately 10 µg m−3 over the lake region, extending upward to nearly 1 km in height. This effect significantly spread both horizontally and vertically toward adjacent urban areas, forming an extensive strong positive difference zone in the lakeside region that stretched from the near-surface up to 1.3 km altitude. Compared to 08:00 LT, the afternoon PM2.5 concentration increase was larger with broader impact range, further exacerbating air pollution in surrounding urban areas, consistent with the horizontal distribution patterns described earlier.
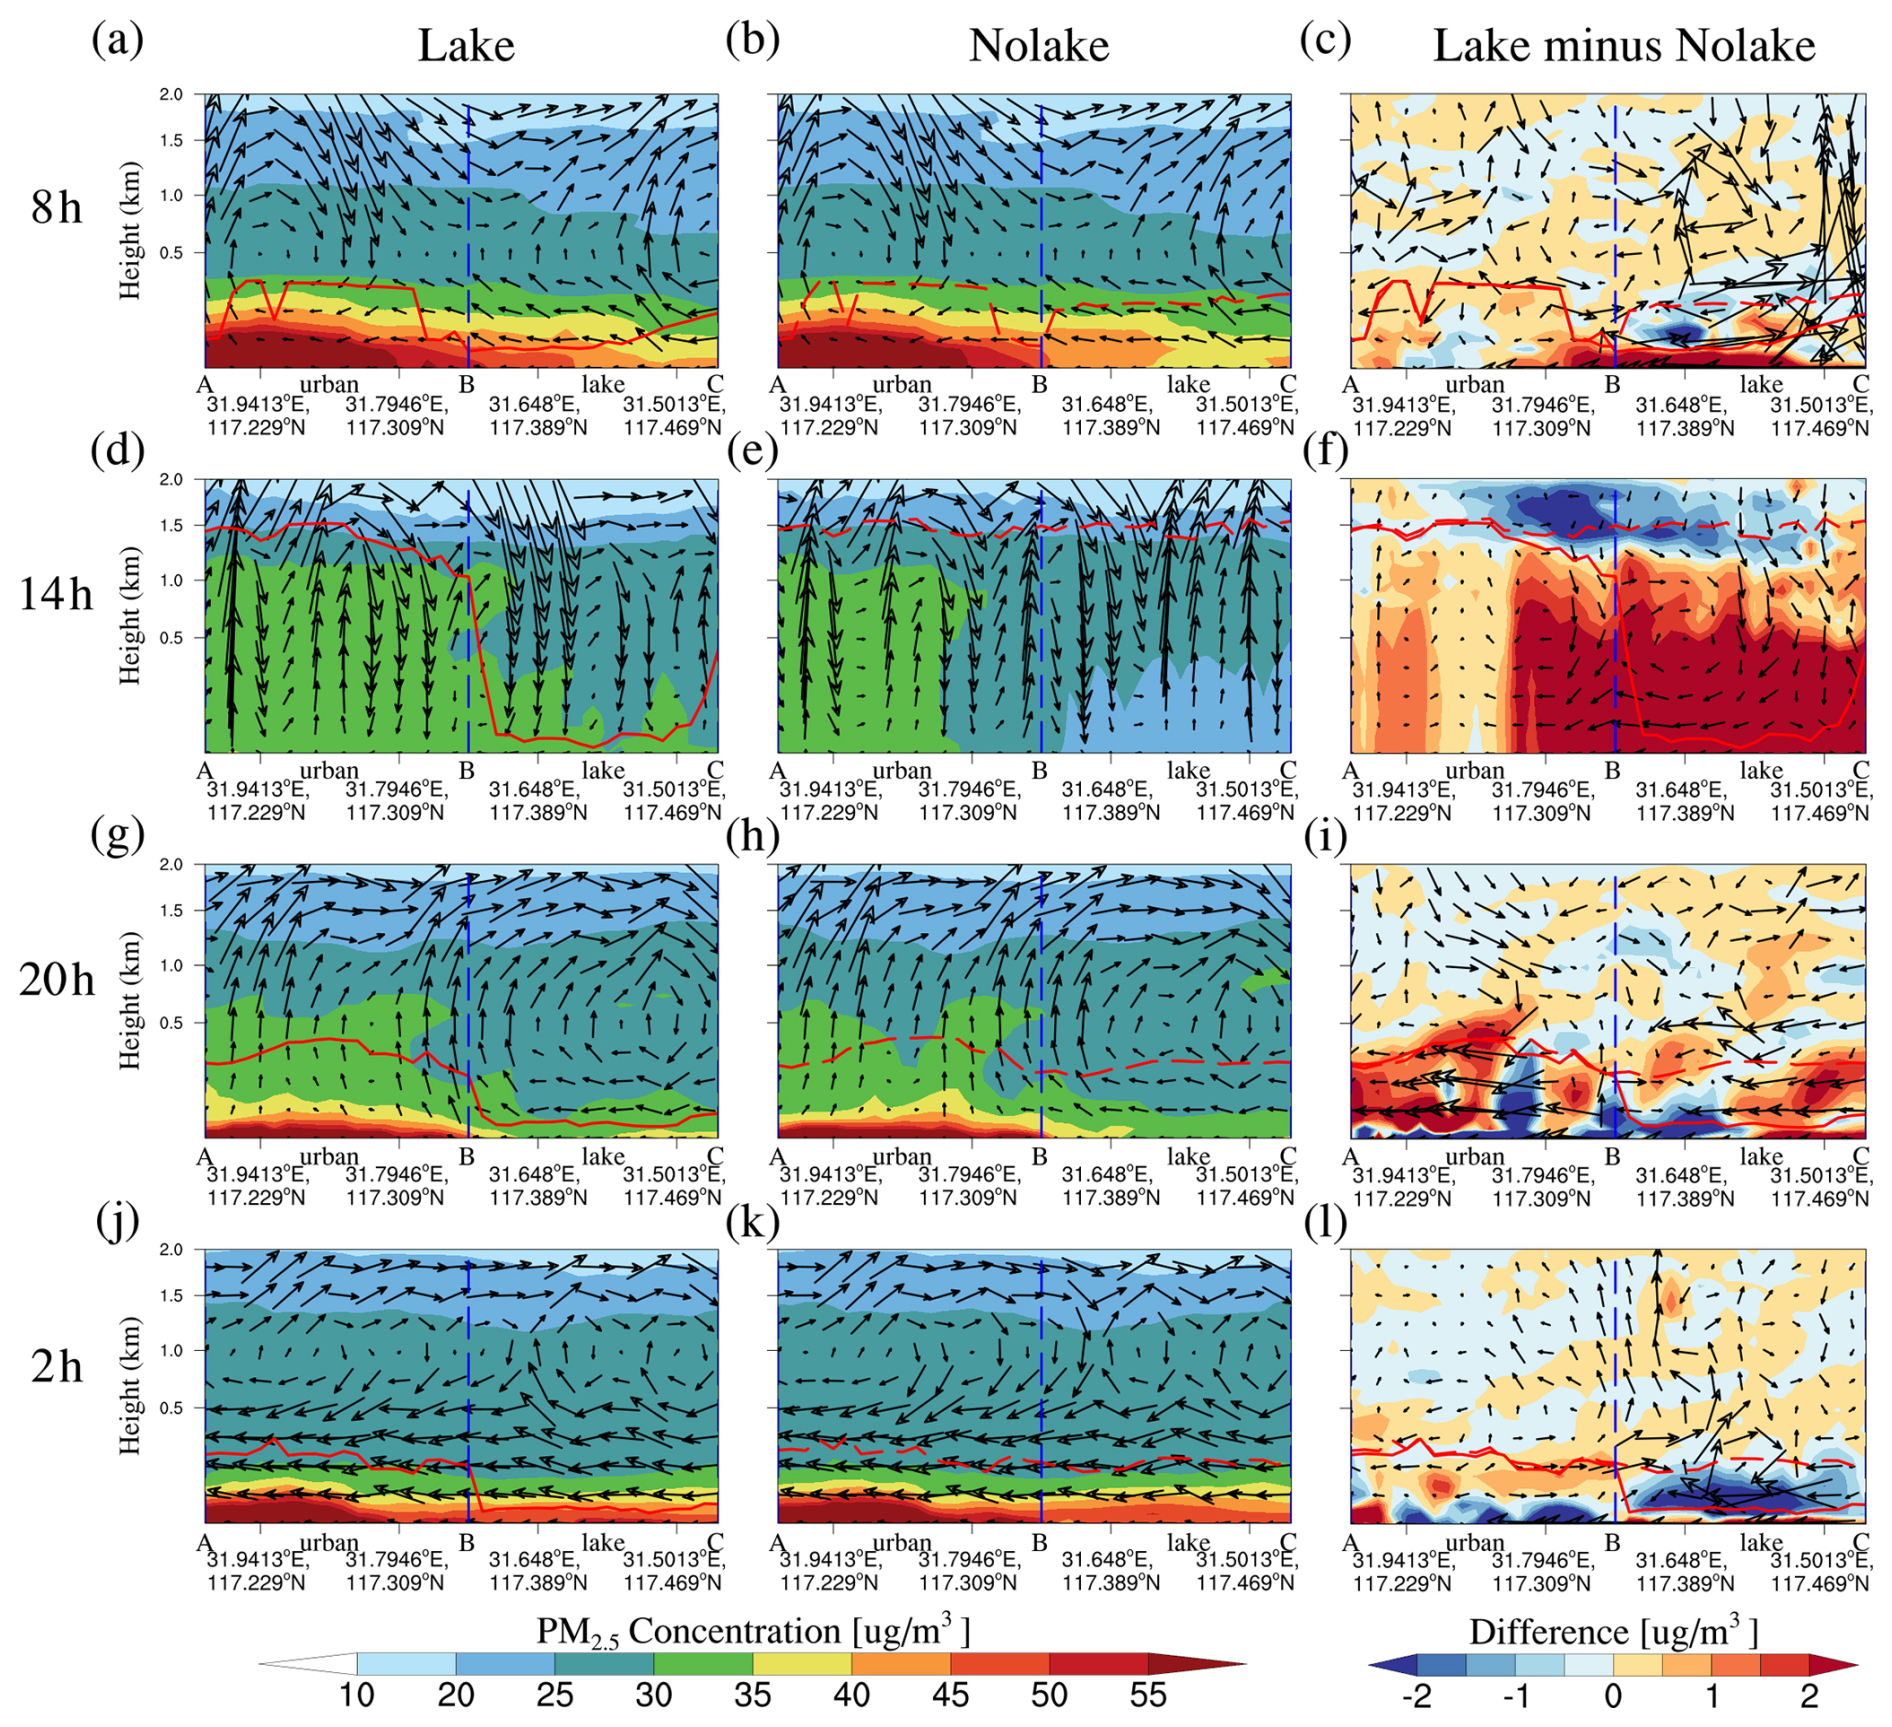
Figure 7The vertical cross-section of PM2.5 concentration and wind vectors along the key path AC (indicated in Fig. 2) for the (a, d, g, j) Lake experiment, (b, e, h, k) Nolake experiment, and (c, f, i, l) their differences (Lake minus Nolake) at 08:00, 14:00, 20:00, and 02:00 LT, averaged over 10–20 March 2019. The shaded contours represent PM2.5 concentrations or their differences between the two experiments at each altitude. The black vector arrows indicate the superimposed vertical wind field (including horizontal and vertical wind components), with the vertical vector being multiplied by 50 for visibility. The red solid line represents the planetary boundary layer height (PBLH) in the Lake experiment, and the red dashed line represents the planetary boundary layer height in the Nolake experiment. The blue dashed line represents the lake-land boundary.
At 20:00 and 02:00 LT (Fig. 7g–l), decreased PBLH causes pollutants to re-accumulate near the urban surface, forming a shallow pollution layer exceeding 55 µg m−3. Over the lake area, PM2.5 concentrations near the lake surface in the Lake experiment remained higher than in the Nolake experiment, while concentrations above the lake surface were lower. In urban areas, the nighttime differences exhibit distribution characteristics completely opposite to daytime. The vertical cross-sections (Fig. 7i, l) reveal a “negative below, positive above” difference pattern. Near-surface PM2.5 concentrations are lower in the Lake experiment with maximum decreases of approximately 15 µg m−3, while at higher boundary layer levels, the situation is completely reversed, PM2.5 concentrations are higher in the Lake experiment by approximately 0–10 µg m−3. Other periods also exhibit the same vertical distribution, as shown in Fig. S11.
3.2.2 Lake-induced meteorological regulation and the accumulation of PM2.5 over the lake
The unique physical properties of lakes constitute the intrinsic mechanism underlying these concentration variations. First, the lake significantly suppresses boundary layer development above its surface. As shown in Fig. 7, the PBLH over the lake surface in the Lake experiment is markedly lower than in the Nolake experiment, particularly at 14:00 LT (Fig. 7d), where it was suppressed to an extremely shallow level of less than 0.1 km while the boundary layer in the Nolake experiment had developed to nearly 1.5 km. This reduced PBLH inhibits the upward dispersion of PM2.5 from the lake region, causing particles to accumulate over the lake surface and thereby increasing PM2.5 concentrations. At 20:00 and 02:00 LT (Fig. 7g–l), the nighttime boundary layer height in the Lake experiment remained substantially lower than in the Nolake experiment, strongly inhibiting upward PM2.5 diffusion above the lake surface.
Second, the lake substantially weakens vertical mixing capacity above it. During daytime, land areas exhibit strong mixing with generally high mixing coefficients, particularly in urban areas where values exceed 15 m2 s−1, as shown in Fig. 8a. However, mixing capacity above the lake is significantly suppressed, with extremely low mixing coefficients of approximately 0–0.4 m2 s−1. Figure 8b demonstrates that the lake presence greatly reduced daytime boundary layer mixing intensity compared to the Nolake experiment. During nighttime, the PBL mixing coefficient above the lake in the Lake experiment remained over 40 % lower than in the Nolake experiment (Fig. 8d). This weakened mixing stems from two primary mechanisms. First, the large specific heat capacity of lake water causes slow daytime warming, resulting in surface temperatures lower than those of surrounding land. This thermal contrast creates stable atmospheric stratification that suppresses vertical thermal turbulence, leading to rapid PM2.5 accumulation over the lake surface. Second, the significantly lower aerodynamic roughness of the lake surface compared to land plays a crucial role. The smooth water surface generates considerably less mechanical turbulence (wind shear) than the rougher farmland surface in the Nolake experiment. Consequently, the lack of mechanical mixing further inhibits vertical diffusion, maintaining the storage effect of the lake.
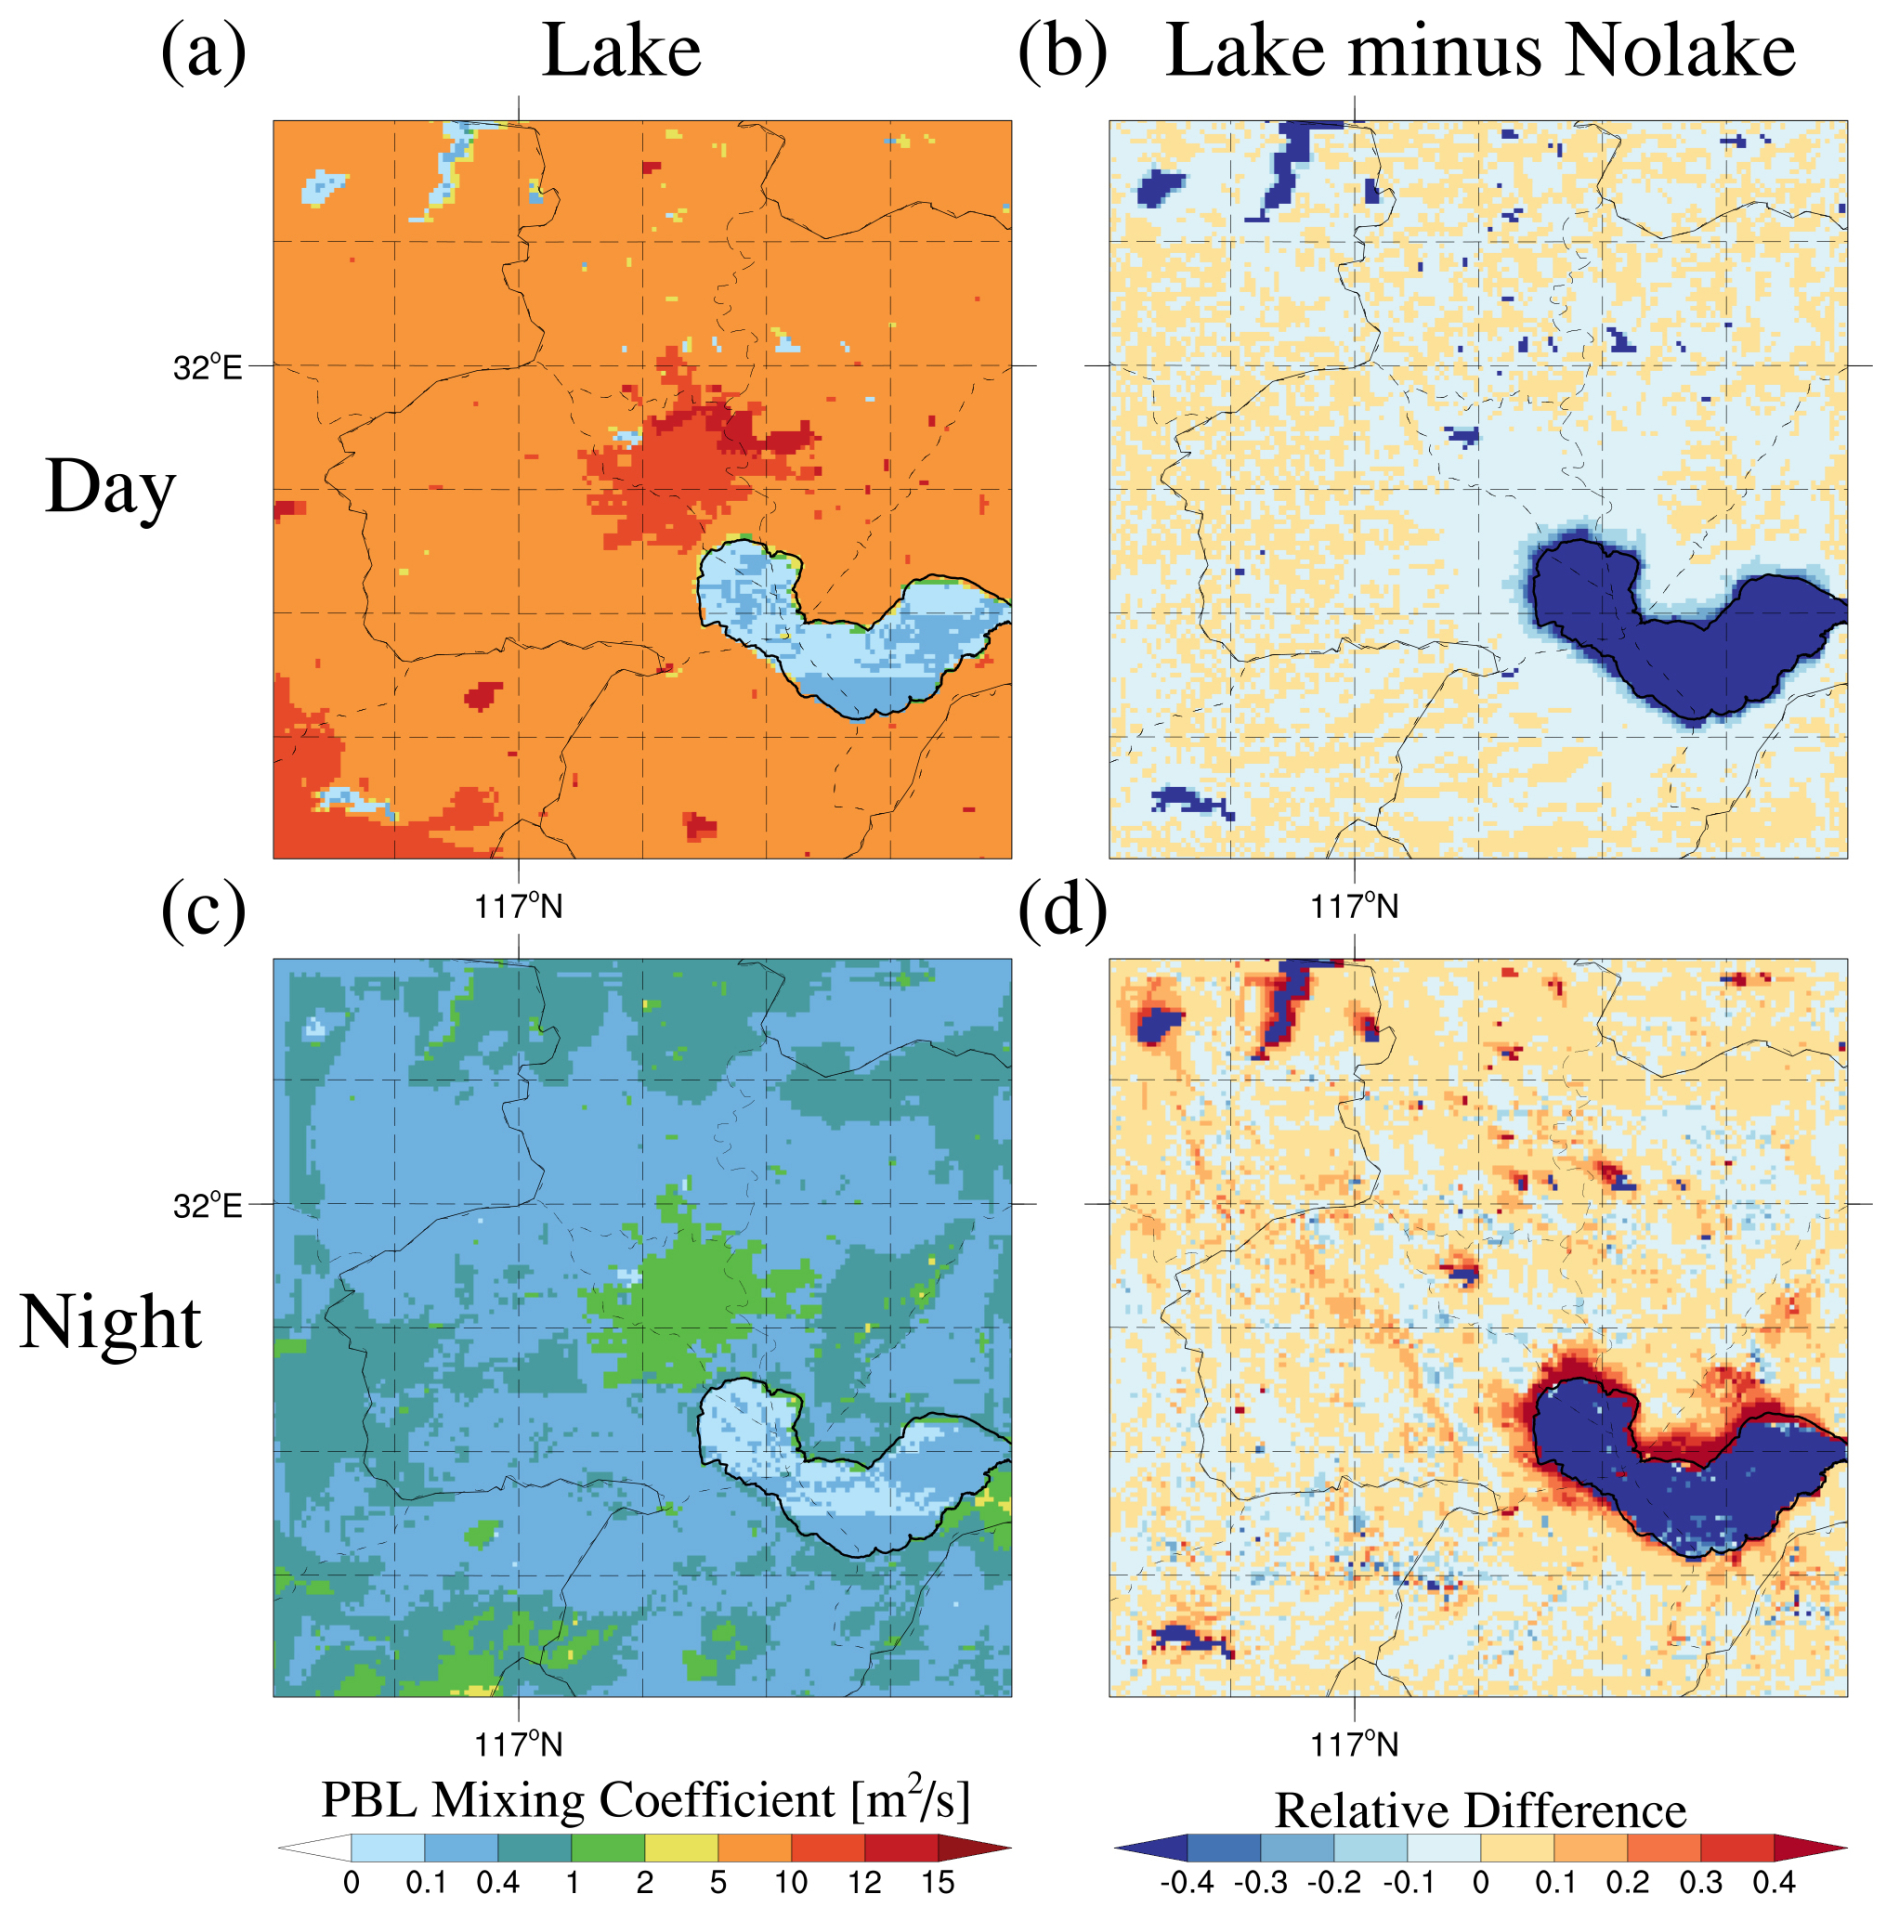
Figure 8The spatial distribution of planetary boundary layer (PBL) mixing coefficients averaged during (a, b) daytime (08:00, 11:00, 14:00, and 17:00 LT, averaged over 10–20 March 2019) and (c, d) nighttime (20:00, 23:00, 02:00, and 05:00 LT, averaged over 10–20 March 2019) for the (a, c) Lake experiment and (b, d) relative differences ((Lake − Nolake) Lake) across the study area.
Furthermore, dry deposition velocity differs significantly between the lake and land surface. Figure 9 shows the spatial distribution of dry deposition velocity in the study area. Daytime land areas, especially urban surfaces, exhibit relatively high dry deposition velocity reaching up to 0.045 m s−1. However, dry deposition velocity over the lake in the Lake experiment was extremely low, approaching zero, while in the Nolake experiment, the farmland surface replacement increased dry deposition velocity dramatically to 0.025–0.03 m s−1 (Fig. 9a). Figure 9b clearly shows that the lake significantly reduced the dry deposition velocity in this region. During nighttime, the lake also significantly reduced dry deposition velocity above its surface, with decreases far exceeding 10 % (Fig. 9d). This indicates that the lake water body acts as an extremely inefficient deposition surface, making it difficult for pollutants to settle on its surface, directly leading to prolonged PM2.5 lifetimes and more pronounced pollution accumulation in the near-surface boundary layer.
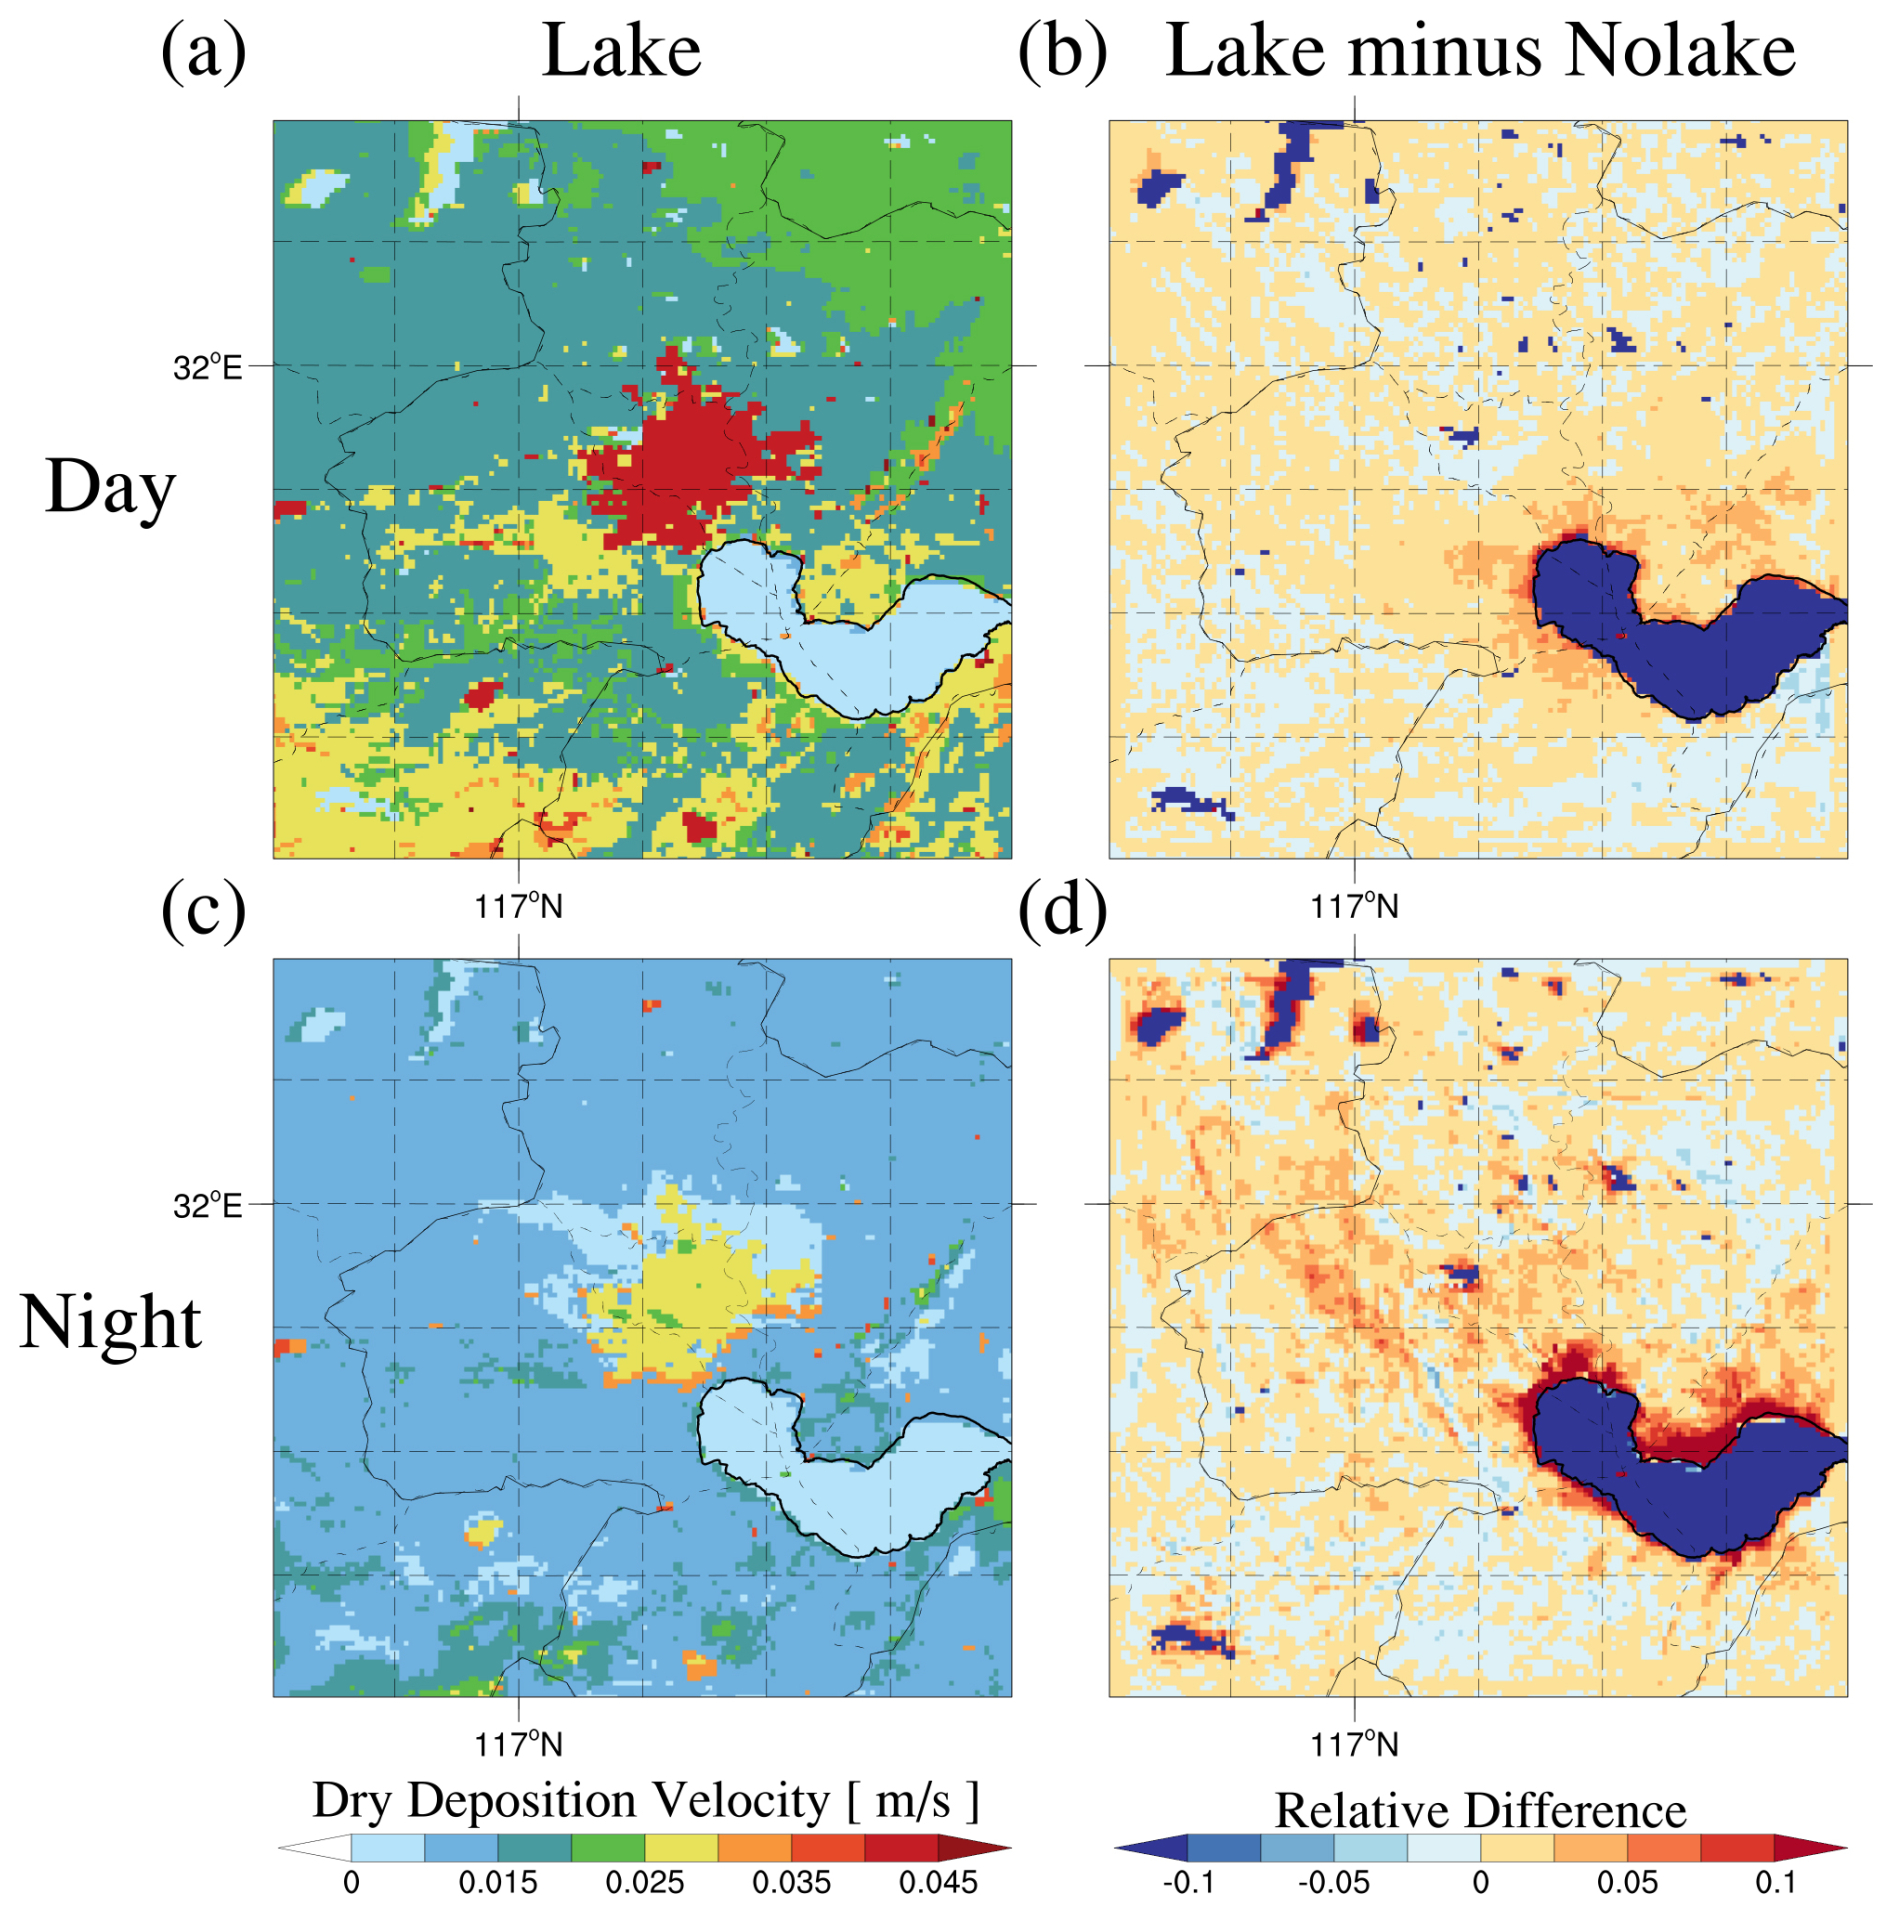
Figure 9The spatial distribution of dry deposition velocity averaged during (a, b) daytime (08:00, 11:00, 14:00, and 17:00 LT, averaged over 10–20 March 2019) and (c, d) nighttime (20:00, 23:00, 02:00, and 05:00 LT, averaged over 10–20 March 2019) for the (a, c) Lake experiment and (b, d) relative differences ((Lake − Nolake) Lake) across the study area.
Figure 10 further illustrates the spatial distribution of PM2.5 lifetimes in the study area. During daytime, land areas show relatively short PM2.5 lifetimes, particularly in urban areas where they are only 50–100 h attributed to higher dry deposition rates that promote pollutant removal. In the Lake experiment (Fig. 10a), PM2.5 lifetimes over the lake surface exhibited extremely high values exceeding 1500 h, forming a stark contrast with surrounding land areas. Figure 10b shows that the lake presence even increased PM2.5 lifetimes above its surface by over 800 h. During nighttime, the lake similarly extended pollutant lifetimes (Fig. 10d), with maximum increases of approximately 500 h. This demonstrates that the combined effects of the compressed boundary layer, weak turbulent mixing, and significantly reduced dry deposition velocity over the lake work synergistically to inhibit PM2.5 removal in the lake region, making the lake a “storage zone” for particles, thereby causing strong near-surface pollutant accumulation.
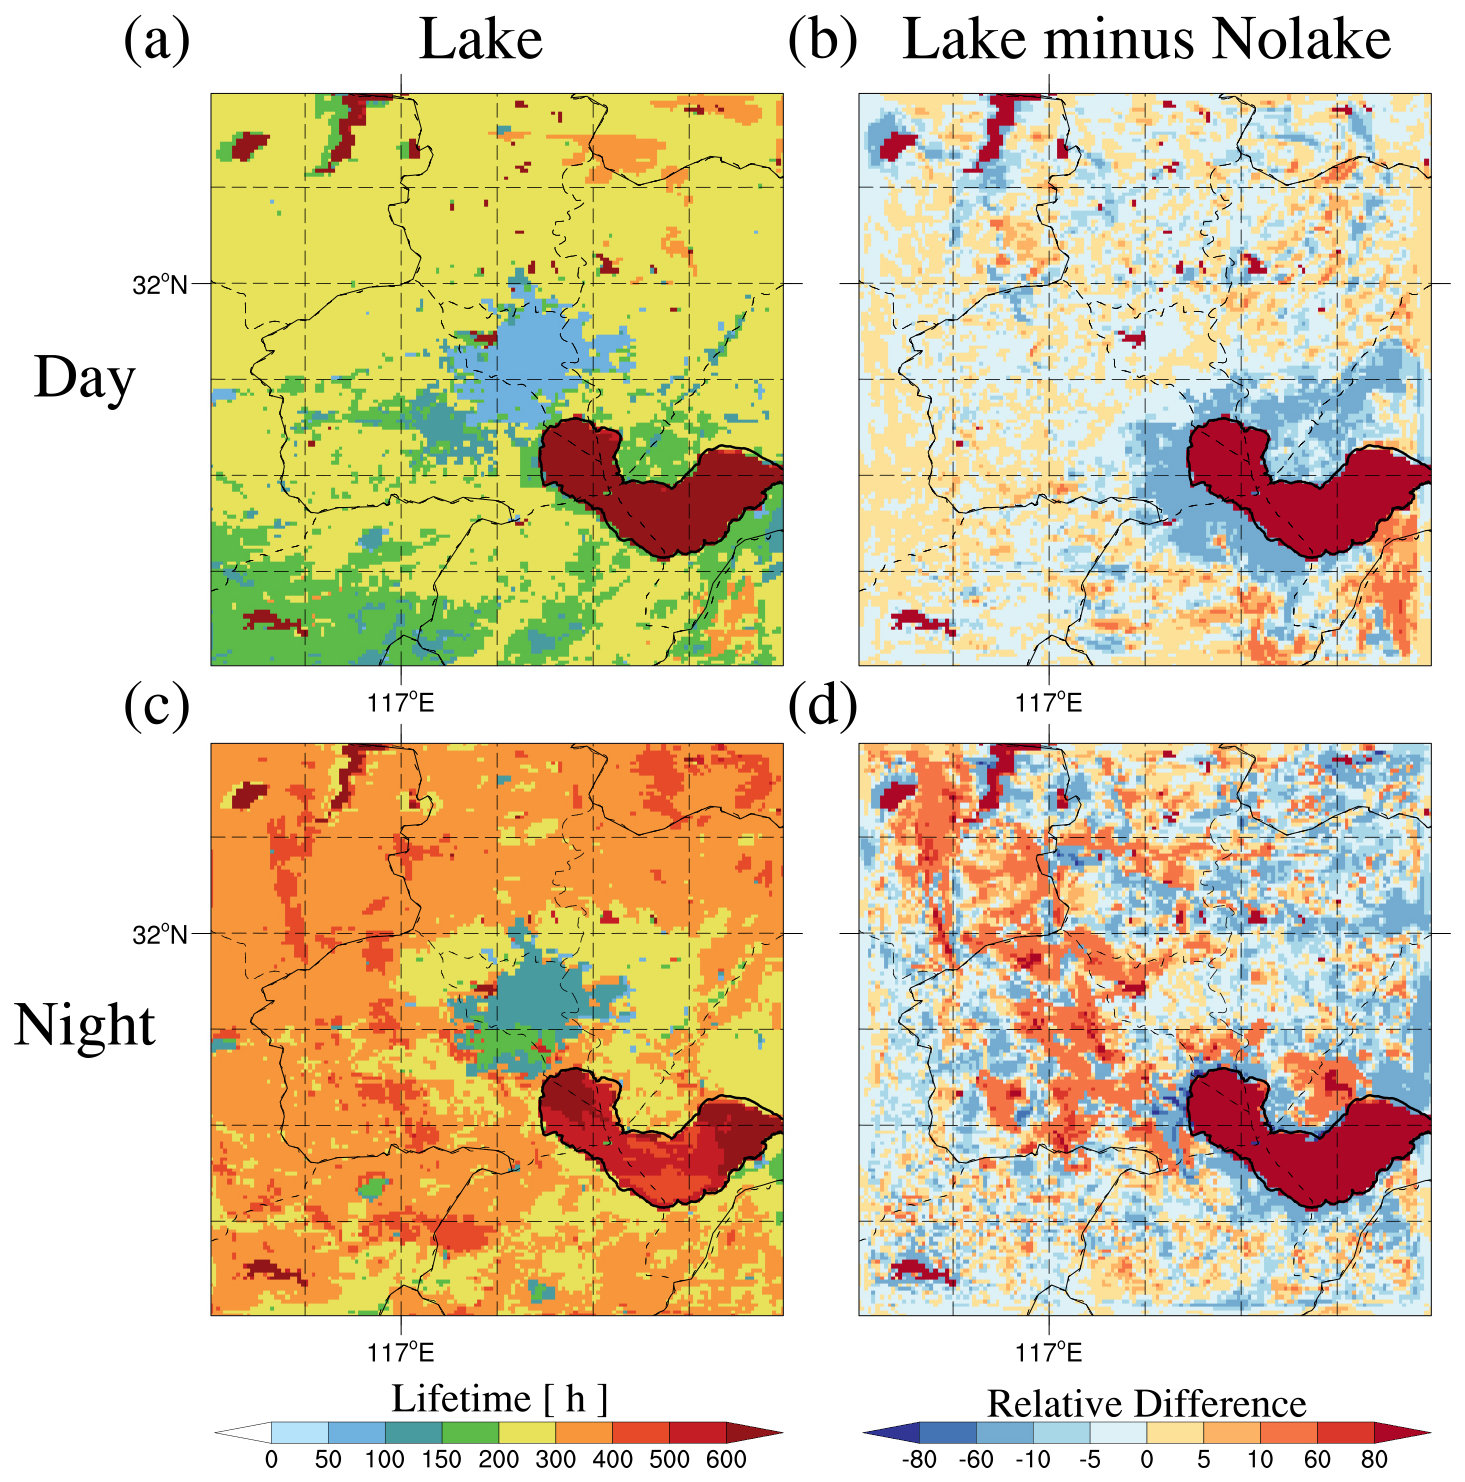
Figure 10The spatial distribution of the lifetime averaged during (a, b) daytime (08:00, 11:00, 14:00, and 17:00 LT, averaged over 10–20 March 2019) and (c, d) nighttime (20:00, 23:00, 02:00, and 05:00 LT, averaged over 10–20 March 2019) for the (a, c) Lake experiment and (b, d) relative differences ((Lake − Nolake) Lake) across the study area. The PM2.5 lifetime is calculated by dividing the PM2.5 column concentration by the dry deposition flux.
3.2.3 Lake-induced transport regulation and the redistribution of PM2.5 in urban areas
While physical mechanisms lead to pollutant accumulation, dynamic processes drive the transport and redistribution of these particles. Pollutants are first transported from source regions (such as urban areas) to the lake surface, which has no local emissions. Subsequently, the suppressed boundary layer height, weakened turbulent mixing, and reduced dry deposition velocity over the lake cause PM2.5 to accumulate substantially near the surface, resulting in near-surface PM2.5 concentrations in the Lake experiment being substantially higher than in the Nolake experiment over the lake area. However, this accumulation is largely confined to the near-surface layer. At upper levels, the pattern reverses. The Nolake experiment shows higher PM2.5 concentrations as stronger thermal turbulence from the farmland surface mixes more pollutants to higher altitudes, whereas the Lake experiment maintains a more stable atmosphere that suppresses vertical mixing. This mechanism operates consistently during both daytime and nighttime, as validated by the vertical profiles of PM2.5 concentrations in Fig. S12. Figure S12b and d demonstrate that over the lake area, PM2.5 concentrations in the Lake experiment remain higher near the surface but lower aloft than in the Nolake experiment throughout the diurnal cycle. This vertically-stratified pollution structure over the lake represents only the direct local effect. The lake's influence extends to surrounding urban areas through complex dynamical transport processes that redistribute the accumulated pollutants both horizontally and vertically back to urban and other surrounding areas. These lake-induced perturbations to urban areas exhibit distinct mechanisms during daytime (horizontal convergence and frontal stagnation) and nighttime (enhanced vertical redistribution). These dual mechanisms govern the spatiotemporal patterns of lake-urban PM2.5 interactions and explain the observed diurnal reversal effect in urban air quality.
During daytime, this influence manifests primarily through horizontal transport processes coupled with lake breeze-background wind interactions. High-pollution air masses formed over the lake affect surrounding urban areas through horizontal transport by concentration gradients between the lake and city. As PM2.5 concentrations over the lake increase significantly, pollutants diffuse outward, creating a positive difference layer extending from the lake to the city from the surface to nearly 1 km altitude, with maximum concentration differences of approximately 10 µg m−3. The dramatic PM2.5 increases in specific lakefront regions, particularly the southwestern shore, result from intense dynamical interactions between lake breeze circulation and the background wind field. At 14:00 LT, peak solar radiation creates maximum lake-land temperature differences, driving lake breeze formation that radiates outward and superimposes on the prevailing southwest wind (Fig. 11d). In the southwestern lake region, the northeastward lake breeze meets the background southwest wind head-on, forming a persistent convergence line termed the “lake breeze front” that acts as a dynamical barrier. This front creates a horizontal stagnation zone with sharply reduced wind speeds (Fig. 11f), trapping high-concentration pollutants diffusing from the lake and those carried by the background wind, causing concentrations to spike. Figure S13 shows wind speed at other times, displaying varying degrees of daytime dynamical convergence. Cross-sectional analysis along pathway AC (Fig. 7d) further confirms this mechanism, showing airflow from the urban area being strongly lifted by lake-area airflow near the lakeshore, blocking background airflow advance and forcing strong upward motion, a typical characteristic of convergence zones absent in the Nolake experiment. At the northern shore, the southward lake breeze converges with the westward background wind, creating less intense but still significant convergence. At the northeastern shore, the lake breeze aligns with the background southwest wind, preventing frontal convergence, so pollutant accumulation results solely from diffusion with much smaller intensity. While lake-induced meteorological perturbations to urban areas remain relatively limited during daytime due to vigorous urban boundary layer development, intense turbulent mixing, and strong dry deposition velocity (Figs. 8b and 9b), the lake breeze-driven convergence mechanism creates localized “pollutant stagnation traps” at strategic locations where opposing wind systems meet, fundamentally altering pollution patterns along specific lakefront areas.

Figure 11The spatial distribtion of 10 m wind speed in the (a, d, g, j) Lake experiment, (b, e, h, k) Nolake experiment, and (c, f, i, l) their differences (Lake minus Nolake) at 08:00, 14:00, 20:00, and 02:00 LT across the study area, averaged over 10–20 March 2019.
In stark contrast to the daytime horizontal convergence and gradient-driven diffusion, nighttime dynamics are dominated by enhanced vertical redistribution that reverses the lake's effect on near-surface urban air quality. As shown in Fig. 7i and l, the urban area exhibits a distinct “negative-below, positive-above” difference pattern stemming from lake-induced perturbation effect. Figure 12 reveals the underlying mechanism by showing the net contribution of vertical mixing to PM2.5 concentrations along path AC. In urban areas under both scenarios (Fig. 12a, b), vertical mixing presents a “negative below, positive above” contribution pattern. Near the surface, pollutants are transported upward by turbulent mixing, leading to strong negative contributions below −16 µg m−3. Meanwhile, within the boundary layer above (approximately below 0.3 km), strong positive contributions far exceeding +16 µg m−3 occur due to pollutants reception from below. The difference between experiments (Fig. 12c) reveals that near the urban surface, negative difference values indicate greater concentration reduction in the Lake experiment, while positive values aloft indicate greater concentration increases, demonstrating that PBL vertical mixing intensity in urban areas is much greater in the Lake experiment. The underlying mechanism involves land breeze circulation driven by lake-land thermal contrasts, which induces additional dynamic turbulence and upward motion above the city, disrupting typical nighttime stable conditions. This lake-enhanced vertical mixing more efficiently transports accumulated near-surface pollutants upward, achieving effective purification of near-surface urban air. Figure S12c validates these results, showing lower PM2.5 concentrations near the urban surface but higher concentrations at 100–300 m altitude in the Lake experiment during nighttime, indicating a dynamic process transporting near-surface pollutants upward driven by lake-induced perturbations to urban meteorological fields and PBL vertical mixing processes. Notably, this nighttime concentration reduction in urban areas is primarily attributable to the vertical mixing of primary PM2.5 rather than secondary aerosols. As illustrated in Fig. S14, nighttime urban areas continue to experience active secondary aerosol formation through chemical reactions, which increases secondary PM2.5 concentrations and counteracts the reduction effect from vertical mixing. Consequently, the net decrease in near-surface urban PM2.5 concentrations during nighttime predominantly results from the efficient upward transport of primary particles via lake-enhanced vertical mixing, while the reduction of secondary PM2.5 is substantially offset by concurrent chemical production.

Figure 12The vertical cross-section of PBL mixing process contributions to PM2.5 concentrations along the key path AC (indicated in Fig. 2) for the (a) Lake experiment, (b) Nolake experiment, and (c) their differences (Lake minus Nolake) during nighttime, averaged over 10–20 March 2019. The shaded contours represent the contribution of PBL mixing processes to surface PM2.5 concentrations or their differences between the two experiments at each altitude. The red solid line represents the PBLH in the Lake experiment, and the red dashed line represents the PBLH in the Nolake experiment. The blue dashed line represents the lake-land boundary.
3.2.4 Lake-induced chemical regulation and the formation of secondary PM2.5
Beyond the physical and dynamical mechanisms discussed above, lakes profoundly influence PM2.5 distributions by regulating atmospheric chemical processes, particularly for secondary aerosols. As revealed in Sect. 3.1.2, secondary PM2.5 concentration differences between the Lake and Nolake experiments over the lake region at 14:00 LT significantly exceed those of primary PM2.5, with lake surface concentrations reaching or exceeding urban levels. This stems from fundamental differences in formation mechanisms and thermodynamic sensitivity. While primary PM2.5 (BC, OC, OIN) originates mainly from direct emissions with minimal chemical transformations, secondary PM2.5 formation is highly sensitive to temperature and humidity, which lakes powerfully regulate through their large heat capacity. The ammonium nitrate formation process (NH3+ HNO3 ⇌ NH4NO3) exhibits thermodynamic reversibility, which decreased temperature or increased humidity promotes particulate NH4NO3 formation, while high-temperature and low-humidity cause decomposition into NH3 and HNO3 gases. In contrast, sulfate formation through SO2 oxidation is almost irreversible and demonstrates greater atmospheric stability.
At 08:00 LT, chemical contributions remain consistent between experiments, showing weak net production (6–10 µg m−3) in near-surface urban areas due to precursor enrichment from traffic, industrial, and domestic activities, while lake contributions approach zero (Fig. S15a, c). At 14:00 LT, however, dramatically different patterns emerge (Fig. S15b and d). In the Nolake experiment, elevated temperatures and lower humidity below 0.5 km promote NH4NO3 decomposition, producing strong negative PM2.5 contributions (exceeding −16 µg m−3), while turbulent transport carries decomposed precursors to 0.5–1.5 km altitudes where lower temperatures and higher humidity favor re-condensation, creating strong positive contributions (exceeding 16 µg m−3 ). Conversely, the Lake experiment shows near-zero chemical contributions throughout the lake area from surface to upper atmosphere. Higher humidity and slower temperature increases due to large heat capacity enhance NH4NO3 stability and suppress decomposition, reducing near-surface decomposition, cutting off precursor transport to higher altitudes, and minimizing chemical influence due to weak vertical transport and mixing. These combined effects result maximum nitrate and ammonium concentration differences between experiments at 14:00 LT, with nitrates and ammonium passively accumulating over the lake exceeding urban concentrations (Figs. S16 and S17). In comparison, sulfate differences remain much smaller (Fig. S18) due to sulfate's irreversible formation and atmospheric stability. In summary, lakes impact secondary PM2.5 during daytime more than primary PM2.5 by regulating local temperature and humidity, profoundly intervening in reversible chemical equilibria and transforming themselves from passive surface types into efficient pollutant “storage zones”.
3.3 PM2.5 near-surface concentrations over lake and urban areas during daytime and nighttime under artificial lake emission scenarios
The preceding analysis systematically revealed the complex lake effect on PM2.5 concentrations through meteorological field alterations under the idealized zero-emission lake scenario. However, practical air quality modeling faces pervasive uncertainty from limited emission inventory spatial resolution. Most current inventories cannot effectively distinguish land from lake areas, erroneously assigning emissions to lakes that should have none. This systematic bias may significantly alter lake effects. To assess the real impact of such emission configuration on regional air pollution and lake-urban interactions, we designed two additional control experiments (Lake_emis and Nolake_emis) retaining original emission settings over lake surfaces, with all other parameters consistent with previous two experiments (Lake and Nolake). Comparing these experiments thoroughly investigates how lake surface emissions, prevalent in current simulations, impact PM2.5 distribution in surrounding urban areas. Figure 13 shows the spatial distribution of near-surface PM2.5 concentrations in the Lake_emis experiment and differences between Lake_emis and Nolake_emis at 08:00, 14:00, 20:00, and 02:00 LT under the scenario retaining the original emission inventory over lake surfaces. At 08:00 LT (Fig. 13a, b), high pollution centers remain in urban areas with concentrations exceeding 80 µg m−3 regardless of lake presence, with peak concentration differences in the lake area exceeding 20 µg m−3. At 14:00 LT (Fig. 13c, d), the lake area becomes an extremely prominent pollution hotspot with concentrations reaching 50–80 µg m−3, far exceeding urban concentrations of 35-40 µg m−3. Compared to the scenario without lake emissions (Fig. 3d), positive differences intensify dramatically in the lake region with peak values approaching 60 µg m−3, while surrounding areas also exhibit strong positive differences, indicating that direct daytime lake emissions synergize with physical accumulation mechanisms to jointly exacerbate pollution over the lake and surrounding urban areas. Figures S19a-d confirm this pattern persists at 11:00 and 17:00 LT. At 20:00 LT (Fig. 13e, f), regional pollution rises again with high concentrations centered in urban areas, while the lake region maintains strong positive differences due to continuous emissions combined with weak nighttime boundary layer mixing and low dry deposition. However, urban areas still exhibit significant negative differences with maximum reductions are approximately 30 µg m−3, demonstrating that the lake's physical purification mechanism for urban areas persists even with lake surface emissions. At 02:00 LT (Fig. 13g, h), urban pollution remains elevated while concentration differences stay negative at approximately −20 µg m−3, further confirming the lake's significant nighttime purification effect. Notably, both positive and negative differences coexist in the lake region, potentially reflecting complex physicochemical mechanisms introduced by lake emissions. Figure. S19e–h at 23:00 and 05:00 LT confirm these phenomena. Furthermore, Fig. 14 shows the vertical cross-sections of PM2.5 concentrations along the AC pathway under the retained lake emission scenario, revealing how lake emissions alter PM2.5 vertical structure. During daytime, lake surface emissions synergize with the lake's intrinsic physical properties, emerging at 08:00 LT and peaking at 14:00 LT. At 08:00 LT (Fig. 14a–c), although high-concentration zones in both experiments remain near the urban surface, differences already reveal significant positive layers over the lake area. By 14:00 LT (Fig. 14d–f), this difference amplifies dramatically. While the Nolake_emis experiment confines high pollution to the deep urban boundary layer, Lake_emis experiment transforms the lake into a new pollution core with intensity far exceeding the city, with PM2.5 hotspots exceeding 55 µg m−3 hovering over the lake. Differences (Fig. 14f) show large positive areas exceeding 40 µg m−3 covering the entire lake area and surroundings. Figure S20a–f confirm similar distributions at 11:00 and 17:00 LT, demonstrating that direct lake emissions synergize with unique daytime physical accumulation mechanisms such as compressed boundary layers and weak dry deposition, making the lake an anomalous pollution source exceeding major urban sources. Nighttime cross-sections (Fig. 14g–l) confirm that even with lake emissions, the lake-driven physical purification mechanism significantly effects urban areas through persistent negative differences near the surface (Fig. 14i, l), while positive and negative differences coexist over the lake, potentially reflecting complex physicochemical mechanisms triggered by lake emissions. Figure S20g–l show similar patterns at 23:00 and 05:00 LT. In summary, these comparative experiments confirm that treatment of lake emissions profoundly affects assessment of lake environmental effects. Retaining lake emissions synergizes with physical accumulation mechanisms to significantly amplify apparent daytime pollution enhancement, while nighttime urban physical purification remains significant. Accurately characterizing underlying surface emissions is crucial for correctly quantifying the dual role lakes play through daytime pollution enhancement and nighttime purification.
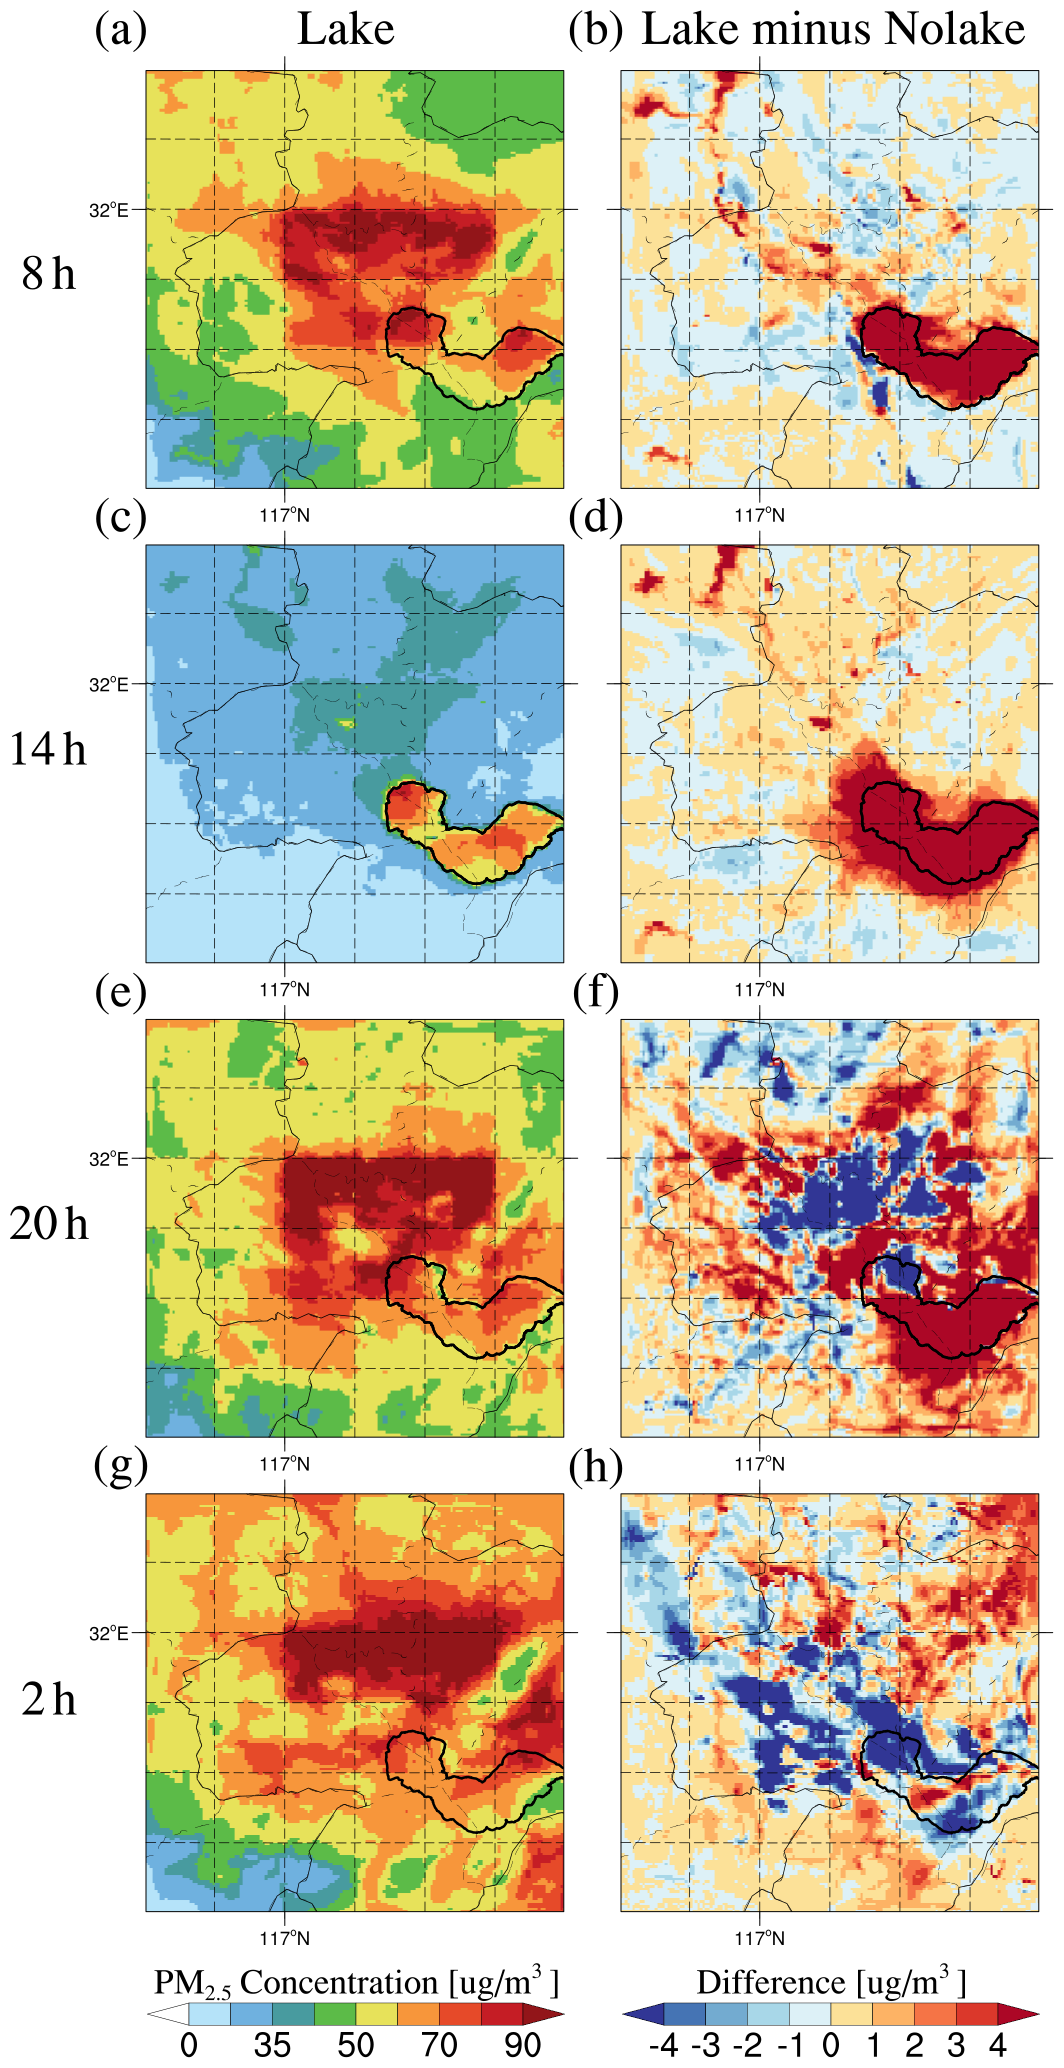
Figure 13The spatial distribution of PM2.5 near-surface concentrations in the (a, c, e, g) Lake_emis experiment and (b, d, f, h) the differences between Lake_emis and Nolake_emis experiments (Lake_emis minus Nolake_emis) at 08:00, 14:00, 20:00, and 02:00 LT across the study area, averaged over 10–20 March 2019.
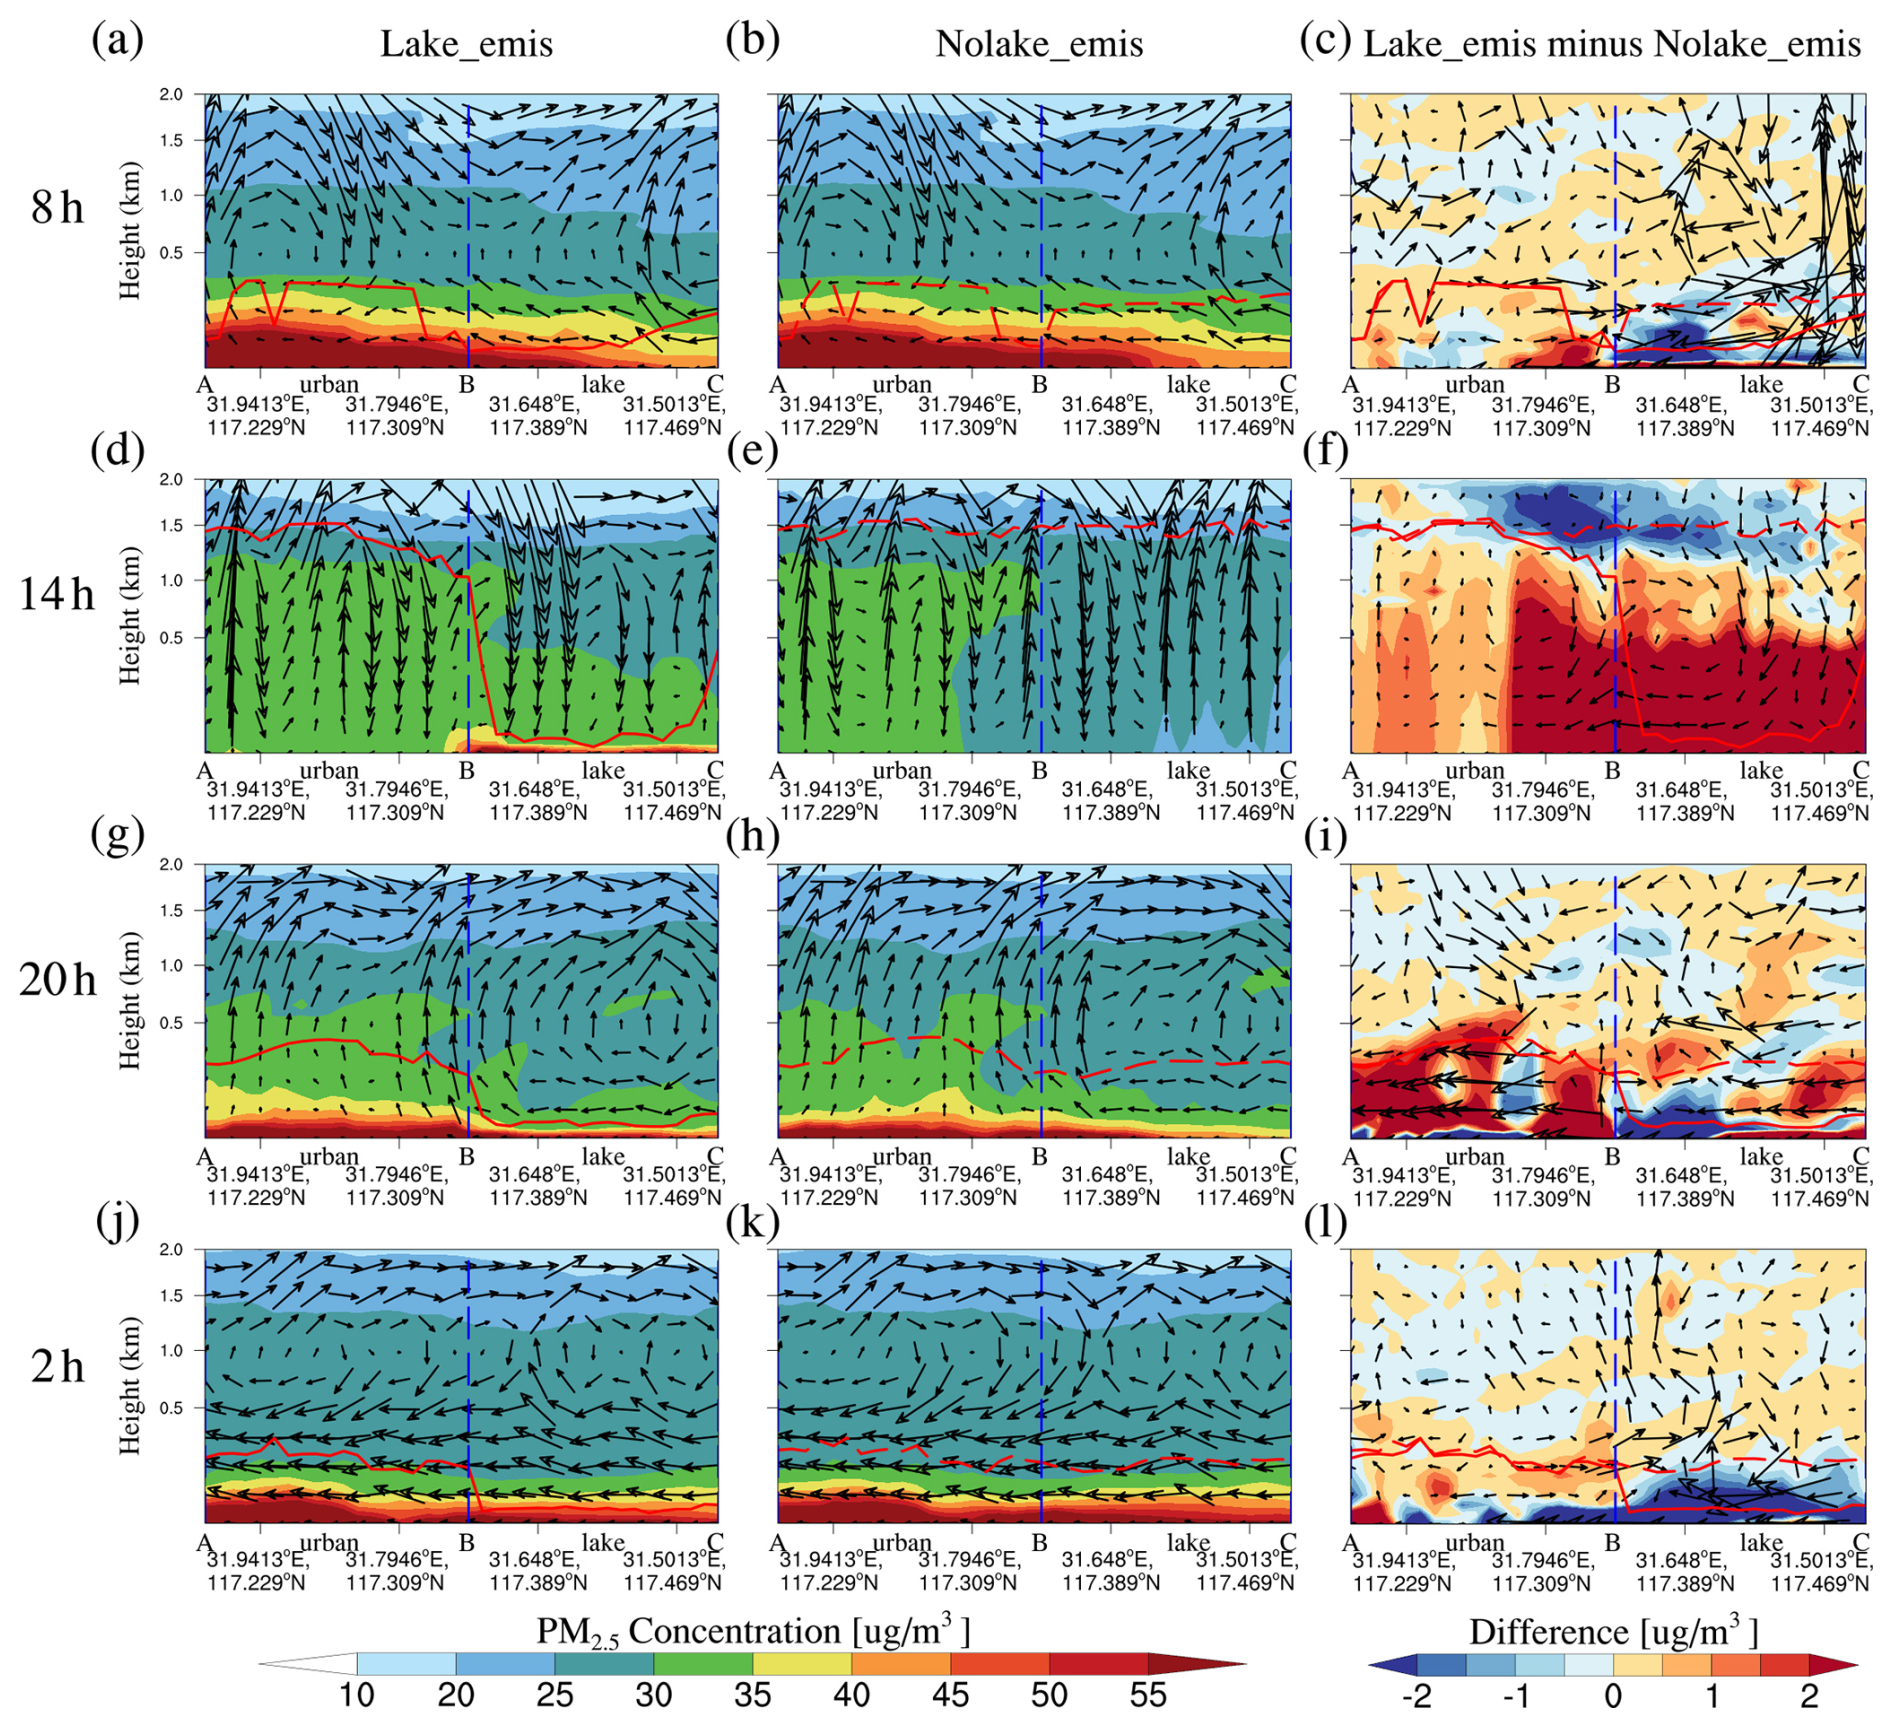
Figure 14The vertical cross-section of PM2.5 concentration and wind vectors along the key path AC (indicated in Fig. 2) for the (a, d, g, j) Lake_emis experiment, (b, e, h, k) Nolake_emis experiment, and (c, f, i, l) their differences (Lake_emis minus Nolake_emis) at 08:00, 14:00, 20:00, and 02:00 LT, averaged over 10–20 March 2019. The shaded contours represent PM2.5 concentrations or their differences between the two experiments at each altitude. The black vector arrows indicate the superimposed vertical wind field (including horizontal and vertical wind components), with the vertical wind vector being multiplied by 50 for visibility. The red solid line represents the planetary boundary layer height (PBLH) in the Lake experiment, and the red dashed line represents the planetary boundary layer height in the Nolake experiment. The blue dashed line represents the lake-land boundary.
Lakes significantly alter local meteorological conditions through thermal contrasts with surrounding surfaces, influencing air pollutant transport and accumulation in adjacent urban areas. While extensive research has examined lake effects on ozone, systematic investigation into lake impacts on PM2.5 and its components remains lacking, particularly regarding coupling between lake-induced physical processes (circulation, mixing, deposition) and chemical transformation. This study systematically reveals lake effects on PM2.5 and its components within a lake-urban system, elucidating regional PM2.5 evolution patterns through physical-chemical coupling mechanisms under lake influence.
We investigated the lake effect on PM2.5 concentrations during a spring pollution episode (March 2019) through high-resolution WRF-Chem simulations with Lake and Nolake scenarios centered on the Lake Chaohu and Hefei region. During daytime, the lake significantly enhances PM2.5 accumulation, with concentrations over the lake surface exceeding those in the Nolake experiment by 0–10 µg m−3 (exceeding 10 µg m−3 in some regions) and reaching levels comparable to or higher than urban areas, particularly at 14:00 LT when the pollution-enhancing effect peaks. This daytime enhancement extends to surrounding urban areas, gradually weakening with distance. Satellite observations validate this anomalous daytime accumulation over the lake surface. During nighttime, however, the lake's impact fundamentally reverses, reducing urban PM2.5 concentrations by approximately 0–10 µg m−3 (exceeding 10 µg m−3 in some regions), with maximum purification effects occurring 12–18 km from the lakeshore rather than in immediately adjacent areas. Notably, this diurnal reversal exhibits strong component-dependency. Component analysis demonstrates that secondary PM2.5 dominates daytime pollution enhancement, with increases of 5–10 µg m−3 significantly exceeding primary PM2.5 increases of 0–5 µg m−3. The accumulation of secondary particles over the lake, subsequently transported to urban areas by lake breeze and dispersion, is a key mechanism worsening urban daytime pollution. Conversely, nighttime purification is primarily driven by physical removal of primary PM2.5, with reductions exceeding 10 µg m−3 in urban areas, while secondary PM2.5 reductions remain limited to 0–2.5 µg m−3. The diurnal reversal of lake effects on PM2.5 identified here both corroborates and extends prior findings. Earlier studies on the North American Great Lakes demonstrated that lake-breeze circulations promote recirculation of primary and secondary pollutants and enhance aerosol formation rates (Brook et al., 2013; Hayden et al., 2011), consistent with the daytime urban PM2.5 enhancement quantified in the present study. The anomalous daytime PM2.5 accumulation over the lake surface is qualitatively analogous to the confinement of urban pollution documented by Dye et al. (1995) over Lake Michigan and the elevated near-surface O3 concentrations reported by Wang et al. (2023) for Lake Taihu. These findings demonstrate that lakes play a complex dual role in regulating regional air quality through distinct physical-chemical mechanisms during day and night.
To elucidate the diurnal reversal mechanism, we analyzed the physical, dynamical, and chemical drivers of PM2.5 evolution. Lakes suppress boundary layer development, reduce turbulent mixing, and decrease dry deposition velocity, with effects persisting throughout the diurnal cycle but varying in intensity. These combined effects extend lake surface PM2.5 lifetimes by over 800 h during daytime and approximately 500 h during nighttime, effectively transforming lakes into particle “storage zones”. Lake-land thermal contrasts drive distinct transport regimes during different periods. During daytime, lake breeze-background wind interactions create convergence zones along lakeshores that trap pollutants, increasing concentrations by up to 10 µg m−3 from the surface to nearly 1 km altitude. At night, land breeze circulation enhances urban vertical mixing, purifying near-surface PM2.5 by up to 16 µg m−3 while elevating concentrations aloft. This dual mechanism explains the diurnal reversal effect on urban air quality. In addition, lakes regulate local temperature and humidity, suppressing thermal decomposition of ammonium nitrate and other secondary aerosols, with secondary PM2.5 differences substantially exceeding those of primary particles. These chemical-physical coupling mechanisms, not previously articulated in lake-urban pollution studies, operate synergistically to shape the complex spatiotemporal patterns of PM2.5 interactions between lakes and urban areas.
To assess the impact of emission inventory uncertainty on lake-urban PM2.5 interactions, we conducted additional experiments (Lake_emis and Nolake_emis) retaining the artificial emission settings over lake surfaces, as most inventories erroneously assign anthropogenic emissions to lakes. Results show that emission treatment profoundly affects lake effect assessments. During daytime, lake emissions synergize with physical accumulation mechanisms to transform the lake area into a prominent pollution hotspot with concentrations reaching 50–80 µg m−3, exceeding urban levels of 35–40 µg m−3 at 14:00 LT. Peak concentration differences approach 60 µg m−3, significantly amplifying the apparent pollution enhancement compared to the zero-emission scenario. During nighttime, the lake-driven purification mechanism persists, with near-surface urban concentration reductions reaching approximately 30 µg m−3 at 20:00 LT and 20 µg m−3 at 02:00 LT. These findings confirm that accurate emission characterization is crucial for quantifying lakes' complex role in regional air quality, and further suggest that previous high-resolution air quality modeling studies over lake-containing domains may have erroneously attributed emission-driven pollution hotspots to lake meteorological effects, thereby systematically overestimating the contribution of the lake itself to the spatial distribution of PM2.5. However, most current emission inventories lack sufficient spatial resolution to distinguish water surfaces from land, often erroneously assigning anthropogenic emissions to lake areas and biasing lake effect assessments. Although Zhang et al. (2017) conducted a similar lake-replacement sensitivity experiment for ozone over Lake Taihu, their study did not address the treatment of emissions over water surfaces, an oversight that appears to be prevalent across similar studies. Therefore, the explicit zeroing of anthropogenic emissions over water surfaces during the preprocessing stage of regional air quality simulations should be established as a standardized procedure, a requirement that becomes increasingly urgent as China's emission inventories are continuously refined under the impetus of clean air action policies (Geng et al., 2024a; Geng et al., 2024b). Developing emission inventories that accurately characterize surface-specific emission patterns is crucial for reliable assessment of lake-urban air quality interactions and effective pollution control strategies.
While this study provides valuable insights into lake effects on PM2.5 distributions, several considerations emerge regarding broader applicability and future research directions. It is important to emphasize that while this study centers on the Lake Chaohu and Hefei system, the identified mechanisms governing the diurnal evolution of PM2.5 are rooted in fundamental physical principles rather than site-specific coincidences. The intrinsic properties of a lake surface, notably its high thermal capacity and low aerodynamic roughness, are universal physical attributes that consistently distinguish water bodies from terrestrial surfaces regardless of geographic location. These characteristics drive the suppression of PBL development and mechanical turbulence while leading to characteristically low dry deposition velocities. Such processes collectively facilitate the formation of atmospheric storage zones that prolong pollutant lifetimes and create potential pollution reservoirs over the water. At night, the presence of the lake enhances turbulent mixing in the urban area, thereby promoting the purification of near-surface pollutants in the adjacent city. Combined with thermodynamic regulation of secondary aerosol formation, these surface contrasts establish lakes as dual regulators that both enhance and purify pollution. This may represents a widespread atmospheric phenomenon characteristic of urban-lake interfaces globally rather than an isolated case. However, we acknowledge that the specific manifestation and magnitude of these lake effects are modulated by local environmental factors, such as topography, emission intensity, and background wind fields. These conditions determine the precise horizontal and vertical redistribution of pollutants and the exact location of convergence zones. Therefore, while our findings provide a generalized framework for understanding lake-atmosphere-pollution coupling, the exact impact in other regions remains dependent on the local environmental configuration. By elucidating these universal physical drivers, this study provides a transferable scientific basis for air quality assessment and forecasting in lake-adjacent regions worldwide.
The lake effects revealed in this study should be interpreted in the context of the meteorological background and the limitations of the simulation period. This study aims to quantitatively isolate the net lake impacts on PM2.5 and identify the underlying physical-chemical mechanisms through high-resolution sensitivity experiments, rather than conducting long-term climatological statistical analysis, given the extremely high computational cost of 1 km resolution WRF-Chem simulations. The selected period in March 2019 corresponds to the pollution season when PM2.5 concentrations are typically much higher than in summer, and lake-land thermal contrasts remain sufficiently strong to drive significant lake-breeze circulations. However, this study is not statistically representative of all pollution seasons. The 850 hPa wind fields from ERA5 reanalysis for January, March, and October (Fig. S1) indicate significant differences in large-scale circulation patterns over eastern China across winter, spring, and autumn. January is more strongly controlled by winter monsoon circulation, March exhibits a transitional circulation pattern, while October shows distinct autumn circulation characteristics different from the former two. This implies that the intensity, spatial extent, and even the dominant pathways of lake impacts on PM2.5 may vary with seasonal circulation backgrounds. Additionally, the study period was characterized by predominantly clear skies and moderate background winds, with weak cloud content and precipitation, which was a deliberate aspect of the study selection strategy to facilitate the isolation of intrinsic lake effects. Although frontal passages can influence PM2.5 through wind field reorganization, boundary layer structural adjustments, thermal changes, and wet scavenging processes, this study was not dominated by persistent, large-scale, strong frontal precipitation events, and thus frontal scavenging was not a primary controlling factor in this analysis. Since the Lake and Nolake experiments employ identical initial and boundary conditions, the synoptic-scale circulation constitutes a common background forcing in both simulations, and thus the simulation differences primarily reflect perturbations induced by lake presence. In summary, this study are more applicable to stable weather conditions similar to this springtime transitional period. Future research should systematically evaluate lake impacts on pollutants across multiple seasons and different weather patterns (including frontal events) to establish a more comprehensive understanding of lake-air quality interactions and quantify their seasonal and circulation dependencies.
Furthermore, our investigation concentrated on PM2.5 and its components, yet atmospheric pollution involves complex multi-species interactions. The transport patterns of gaseous pollutants such as SO2 and NO2 within lake-land thermal circulation systems, and their conversion to secondary particulate matter under lake modulation, deserve comprehensive investigation. Extending analysis to other lake-urban systems and conducting simultaneous multi-pollutant observations would enhance understanding of lakes' integrated impacts on regional atmospheric chemistry, providing scientific foundations for air quality management and multi-pollutant synergistic control strategies in lake-adjacent regions globally. Technical limitations also present opportunities for improvement. Although this study employed high-resolution 1 km simulations, the fine-scale structures of lake-land boundary layers and mesoscale phenomena such as lake-breeze fronts require even higher spatial resolution for accurate representation. Current planetary boundary layer parameterization schemes may contain uncertainties when handling complex surface conditions, particularly in water-land transition zones. Future research should integrate more sophisticated numerical methods, develop specialized parameterization schemes for lake-land interface processes, and optimize dry deposition parameterizations across different surface types based on expanded observational datasets to enhance model capabilities in simulating lake micrometeorology and boundary layer dynamics.
Additionally, the key limitation of current lake-urban air quality research is the scarcity of direct observations over lake surfaces and lakeside regions. Although this study has validated the simulations against urban observation networks, the most significant lake effects we identified occur precisely over lake surfaces and nearshore areas where observational infrastructure is absent. While satellite-retrieved PM2.5 products provide qualitative support for lake surface accumulation phenomena, their spatiotemporal resolution and retrieval uncertainties over water surfaces are insufficient to meet the needs for detailed mechanistic validation, underscoring the necessity of systematic field observations. This observational challenge is particularly acute in China. Many major cities have developed along inland lakes, yet systematic lake-atmosphere monitoring remains extremely limited compared to North America and Europe. Future research should prioritize the establishment of comprehensive observation networks specifically designed for lake-urban pollution gradients. Such networks should include monitoring stations deployed at multiple locations along lakeshores and cross-sectional observations along lake-urban corridors (such as the A-B-C transect examined in this study) to measure PM2.5 concentrations, chemical composition, and meteorological parameters. Lake-based platform observations (buoys or low-altitude drones) can capture spatial heterogeneity and transient features such as lake-breeze fronts, while vertical profiling measurements (tethered balloons, drones, or ground-based remote sensing) can observe boundary layer structure and lake-land breeze circulation. Additionally, measurements of dry deposition velocities and surface fluxes over both lake and land surfaces, combined with dense low-cost sensor networks monitoring fine-scale spatial patterns, will provide multidimensional data support for understanding lake effects. These observations will not only directly validate the lake-induced PM2.5 gradients and vertical mixing signals identified in this study but also reveal small-scale turbulent mixing and chemical transformation mechanisms. Filling the observational gap in lake environments represents a critical frontier for advancing air quality research in rapidly urbanizing inland lake regions globally.
The updated USTC version of WRF-Chem can be downloaded from https://doi.org/10.5281/zenodo.15702248 (Xia et al., 2024) or can be obtained from the corresponding author upon request. The Multi-resolution Emission Inventory for China (MEIC) at 0.25° × 0.25° resolution for 2019 is available at http://meicmodel.org.cn (last access: 11 August 2025) (Li et al., 2017a, 2017b; Zheng et al., 2018; Geng et al., 2024a). The NCEP final reanalysis (FNL) data with a 1° × 1° resolution and 6 h temporal resolution are available at https://doi.org/10.5065/D6M043C6 (NCEP, 2000).
The supplement related to this article is available online at https://doi.org/10.5194/acp-26-7867-2026-supplement.
ZY, QY, and CZ designed the experiments and conducted and analyzed the simulations. All authors contributed to the discussion and final version of the paper.
The contact author has declared that none of the authors has any competing interests.
Publisher's note: Copernicus Publications remains neutral with regard to jurisdictional claims made in the text, published maps, institutional affiliations, or any other geographical representation in this paper. The authors bear the ultimate responsibility for providing appropriate place names. Views expressed in the text are those of the authors and do not necessarily reflect the views of the publisher.
This research was supported by the National Key Scientific and Technological Infrastructure project “Earth System Numerical Simulation Facility” (EarthLab). The study used computing resources from the Supercomputing Center of the University of Science and Technology of China (USTC) and the Qingdao Supercomputing and Big Data Center.
This research was supported by the National Key Research and Development Program of China (grant no. 2023YFC3706300), the Strategic Priority Research Program of the Chinese Academy of Sciences (grant no. XDB0500303), the National Natural Science Foundation of China (grant no. 41775146), the USTC Research Funds of the Double First-Class Initiative (grant nos. YD2080002007 and KY2080000114), the Science and Technology Innovation Project of Laoshan Laboratory (grant no. LSKJ202300305), the National Natural Science Foundation of China (NSFC) Young Students' Basic Research Project (Doctoral Candidates, grant no. 424B2042), the Innovation Group Project of Southern Marine Science and Engineering Guangdong Laboratory (Zhuhai) (grant no. 311024009), and the Southern Marine Science and Engineering Guangdong Laboratory (Zhuhai) (grant no. SML2024SP011).
This paper was edited by Andrea Pozzer and reviewed by I. Pérez and one anonymous referee.
Atkinson, B. W.: Meso-scale atmospheric circulations, Academic Press, London, 495 pp., ISBN 978-0120659609, 1981.
Binkowski, F. S. and Shankar, U.: The Regional Particulate Matter Model, 1, Model description and preliminary results, J. Geophys. Res. Atmos., 100, 26191–26209, https://doi.org/10.1029/95jd02093, 1995.
Brook, J. R., Makar, P. A., Sills, D. M. L., Hayden, K. L., and McLaren, R.: Exploring the nature of air quality over southwestern Ontario: main findings from the Border Air Quality and Meteorology Study, Atmos. Chem. Phys., 13, 10461–10482, https://doi.org/10.5194/acp-13-10461-2013, 2013.
Burley, J. D., Theiss, S., Bytnerowicz, A., Gertler, A., Schilling, S., and Zielinska, B.: Surface ozone in the Lake Tahoe Basin, Atmos. Environ., 109, 351–369, https://doi.org/10.1016/j.atmosenv.2015.02.001, 2015.
Capps, S. L., Hu, Y., and Russell, A. G.: Assessing Near-Field and Downwind Impacts of Reactivity-Based Substitutions, J. Air Waste Manag. Assoc., 60, 316–327, https://doi.org/10.3155/1047-3289.60.3.316, 2010.
Chai, F., Gao, J., Chen, Z., Wang, S., Zhang, Y., Zhang, J., Zhang, H., Yun, Y., and Ren, C.: Spatial and temporal variation of particulate matter and gaseous pollutants in 26 cities in China, J. Environ. Sci., 26, 75–82, https://doi.org/10.1016/s1001-0742(13)60383-6, 2014.
Chapman, E. G., Gustafson Jr., W. I., Easter, R. C., Barnard, J. C., Ghan, S. J., Pekour, M. S., and Fast, J. D.: Coupling aerosol-cloud-radiative processes in the WRF-Chem model: Investigating the radiative impact of elevated point sources, Atmos. Chem. Phys., 9, 945–964, https://doi.org/10.5194/acp-9-945-2009, 2009.
Chen, F. and Dudhia, J.: Coupling an Advanced Land Surface–Hydrology Model with the Penn State–NCAR MM5 Modeling System. Part I: Model Implementation and Sensitivity, Mon. Weather Rev., 129, 569–585, 2001.
Chen, J. and Hoek, G.: Long-term exposure to PM and all-cause and cause-specific mortality: A systematic review and meta-analysis, Environ. Int., 143, https://doi.org/10.1016/j.envint.2020.105974, 2020.
Chen, X., Chen, Y., Shimizu, T., Niu, J., Nakagami, K. i., Qian, X., Jia, B., Nakajima, J., Han, J., and Li, J.: Water resources management in the urban agglomeration of the Lake Biwa region, Japan: An ecosystem services-based sustainability assessment, Sci. Total Environ., 586, 174–187, https://doi.org/10.1016/j.scitotenv.2017.01.197, 2017.
CMA, 2018: Technical Specifications for Maintenance of Regional Automatic Weather Stations, QX/T 465–201, http://cmastd.cmatc.cn/standardView.jspx?id=3076 (last access: 5 May 2022), 2018 (in Chinese).
Dentener, F., Kinne, S., Bond, T., Boucher, O., Cofala, J., Generoso, S., Ginoux, P., Gong, S., Hoelzemann, J. J., Ito, A., Marelli, L., Penner, J. E., Putaud, J.-P., Textor, C., Schulz, M., van der Werf, G. R., and Wilson, J.: Emissions of primary aerosol and precursor gases in the years 2000 and 1750 prescribed data-sets for AeroCom, Atmos. Chem. Phys., 6, 4321–4344, https://doi.org/10.5194/acp-6-4321-2006, 2006.
Du, Q., Zhao, C., Zhang, M., Dong, X., Chen, Y., Liu, Z., Hu, Z., Zhang, Q., Li, Y., Yuan, R., and Miao, S.: Modeling diurnal variation of surface PM2.5 concentrations over East China with WRF-Chem: impacts from boundary-layer mixing and anthropogenic emission, Atmos. Chem. Phys., 20, 2839–2863, https://doi.org/10.5194/acp-20-2839-2020, 2020.
Dye, T. S., Roberts, P. T., and Korc, M. E.: Observations of Transport Processes for Ozone and Ozone Precursors during the 1991 Lake Michigan Ozone Study, J. Appl. Meteorol. Clim., 34, 1877–1889, https://doi.org/10.1175/1520-0450(1995)034<1877:Ootpfo>2.0.Co;2, 1995.
Estevez, J., Gavilan, P., and Giraldez, J. V.: Guidelines on validation procedures for meteorological data from automatic weather stations, J. Hydrol., 402, 144–154, https://doi.org/10.1016/j.jhydrol.2011.02.031, 2011.
Fast, J. D. and Heilman, W. E.: Simulated sensitivity of seasonal ozone exposure in the Great Lakes region to changes in anthropogenic emissions in the presence of interannual variability, Atmos. Environ., 39, 5291–5306, https://doi.org/10.1016/j.atmosenv.2005.05.032, 2005.
Fosco, T. and Schmeling, M.: Aerosol ion concentration dependence on atmospheric conditions in Chicago, Atmos. Environ., 40, 6638–6649, https://doi.org/10.1016/j.atmosenv.2006.05.061, 2006.
Garratt, J. R.: The internal boundary layer – a review, Bound.-Layer Meteorol., 50, 171–203, https://doi.org/10.1007/bf00120524, 1990.
Geng, G., Liu, Y., Liu, Y., Liu, S., Cheng, J., Yan, L., Wu, N., Hu, H., Tong, D., Zheng, B., Yin, Z., He, K., and Zhang, Q.: Efficacy of China's clean air actions to tackle PM2.5 pollution between 2013 and 2020, Nat. Geosci., 17, https://doi.org/10.1038/s41561-024-01540-z, 2024a.
Geng, G. N., Liu, Y. X., Liu, Y., Liu, S. G., Cheng, J., Yan, L., Wu, N. N., Hu, H. W., Tong, D., Zheng, B., Yin, Z. C., He, K. B., and Zhang, Q.: Efficacy of China's clean air actions to tackle PM2.5 pollution between 2013 and 2020, Nat. Geosci., 17, https://doi.org/10.1038/s41561-024-01540-z, 2024b.
Guo, H., Cheng, T., Gu, X., Wang, Y., Chen, H., Bao, F., Shi, S., Xu, B., Wang, W., Zuo, X., Zhang, X., and Meng, C.: Assessment of PM2.5 concentrations and exposure throughout China using ground observations, Sci. Total Environ., 601, 1024–1030, https://doi.org/10.1016/j.scitotenv.2017.05.263, 2017.
Guo, J., Deng, M., Lee, S. S., Wang, F., Li, Z., Zhai, P., Liu, H., Lv, W., Yao, W., and Li, X.: Delaying precipitation and lightning by air pollution over the Pearl River Delta. Part I: Observational analyses, J. Geophys. Res. Atmos., 121, 6472–6488, https://doi.org/10.1002/2015jd023257, 2016.
Guo, S., Hu, M., Zamora, M. L., Peng, J., Shang, D., Zheng, J., Du, Z., Wu, Z., Shao, M., Zeng, L., Molina, M. J., and Zhang, R.: Elucidating severe urban haze formation in China, Proc. Natl. Acad. Sci. USA, 111, 17373–17378, https://doi.org/10.1073/pnas.1419604111, 2014.
Gustafson, W. I., Jr., Chapman, E. G., Ghan, S. J., Easter, R. C., and Fast, J. D.: Impact on modeled cloud characteristics due to simplified treatment of uniform cloud condensation nuclei during NEAQS 2004, Geophys. Res. Lett., 34, https://doi.org/10.1029/2007gl030021, 2007.
Harris, L. and Kotamarthi, V. R.: The characteristics of the Chicago Lake breeze and its effects on trace particle transport: Results from an episodic event simulation, J. Appl. Meteorol. Climatol., 44, 1637–1654, https://doi.org/10.1175/jam2301.1, 2005.
Hayden, K. L., Sills, D. M. L., Brook, J. R., Li, S.-M., Makar, P. A., Markovic, M. Z., Liu, P., Anlauf, K. G., O'Brien, J. M., Li, Q., and McLaren, R.: Aircraft study of the impact of lake-breeze circulations on trace gases and particles during BAQS-Met 2007, Atmos. Chem. Phys., 11, 10173–10192, https://doi.org/10.5194/acp-11-10173-2011, 2011.
He, J., Gong, S., Yu, Y., Yu, L., Wu, L., Mao, H., Song, C., Zhao, S., Liu, H., Li, X., and Li, R.: Air pollution characteristics and their relation to meteorological conditions during 2014-2015 in major Chinese cities, Environ. Pollut., 223, 484–496, https://doi.org/10.1016/j.envpol.2017.01.050, 2017.
Ho, H. C., Wong, M. S., Yang, L., Shi, W., Yang, J., Bilal, M., and Chan, T.-C.: Spatiotemporal influence of temperature, air quality, and urban environment on cause-specific mortality during hazy days, Environ. Int., 112, 10–22, https://doi.org/10.1016/j.envint.2017.12.001, 2018.
Hong, S.-Y., Noh, Y., and Dudhia, J.: A new vertical diffusion package with an explicit treatment of entrainment processes, Mon. Weather Rev., 134, 2318–2341, https://doi.org/10.1175/mwr3199.1, 2006.
Hu, J., Wang, Y., Ying, Q., and Zhang, H.: Spatial and temporal variability of PM2.5 and PM10 over the North China Plain and the Yangtze River Delta, China, Atmos. Environ., 95, 598–609, https://doi.org/10.1016/j.atmosenv.2014.07.019, 2014a.
Hu, J., Zhang, H., Chen, S., Ying, Q., Wiedinmyer, C., Vandenberghe, F., and Kleeman, M. J.: Identifying PM2.5 and PM0.1 Sources for Epidemiological Studies in California, Environ. Sci. Technol., 48, 4980–4990, https://doi.org/10.1021/es404810z, 2014b.
Hu, L. and Li, Q.: Greenspace, bluespace, and their interactive influence on urban thermal environments, Environ. Res. Lett., 15, https://doi.org/10.1088/1748-9326/ab6c30, 2020.
Hu, X.-M. and Xue, M.: Influence of Synoptic Sea-Breeze Fronts on the Urban Heat Island Intensity in Dallas-Fort Worth, Texas, Mon. Weather Rev., 144, 1487–1507, https://doi.org/10.1175/mwr-d-15-0201.1, 2016.
Hu, X.-M., Ma, Z., Lin, W., Zhang, H., Hu, J., Wang, Y., Xu, X., Fuentes, J. D., and Xue, M.: Impact of the Loess Plateau on the atmospheric boundary layer structure and air quality in the North China Plain: A case study, Sci. Total Environ., 499, 228–237, https://doi.org/10.1016/j.scitotenv.2014.08.053, 2014c.
Hu, Z., Huang, J., Zhao, C., Bi, J., Jin, Q., Qian, Y., Leung, L. R., Feng, T., Chen, S., and Ma, J.: Modeling the contributions of Northern Hemisphere dust sources to dust outflow from East Asia, Atmos. Environ., 202, 234–243, https://doi.org/10.1016/j.atmosenv.2019.01.022, 2019.
Huang, R.-J., Zhang, Y., Bozzetti, C., Ho, K.-F., Cao, J.-J., Han, Y., Daellenbach, K. R., Slowik, J. G., Platt, S. M., Canonaco, F., Zotter, P., Wolf, R., Pieber, S. M., Bruns, E. A., Crippa, M., Ciarelli, G., Piazzalunga, A., Schwikowski, M., Abbaszade, G., Schnelle-Kreis, J., Zimmermann, R., An, Z., Szidat, S., Baltensperger, U., El Haddad, I., and Prevot, A. S. H.: High secondary aerosol contribution to particulate pollution during haze events in China, Nature, 514, 218–222, https://doi.org/10.1038/nature13774, 2014.
Iacono, M. J., Mlawer, E. J., Clough, S. A., and Morcrette, J. J.: Impact of an improved longwave radiation model, RRTM, on the energy budget and thermodynamic properties of the NCAR community climate model, CCM3, J. Geophys Res. Atmos., 105, 14873–14890, https://doi.org/10.1029/2000jd900091, 2000.
Janssens-Maenhout, G., Crippa, M., Guizzardi, D., Dentener, F., Muntean, M., Pouliot, G., Keating, T., Zhang, Q., Kurokawa, J., Wankmüller, R., Denier van der Gon, H., Kuenen, J. J. P., Klimont, Z., Frost, G., Darras, S., Koffi, B., and Li, M.: HTAP_v2.2: a mosaic of regional and global emission grid maps for 2008 and 2010 to study hemispheric transport of air pollution, Atmos. Chem. Phys., 15, 11411–11432, https://doi.org/10.5194/acp-15-11411-2015, 2015.
Jiang, Z., Huo, F., Ma, H., Song, J., and Dai, A.: Impact of Chinese Urbanization and Aerosol Emissions on the East Asian Summer Monsoon, J. Clim., 30, 1019–1039, https://doi.org/10.1175/jcli-d-15-0593.1, 2017.
Kain, J. S.: The Kain-Fritsch convective parameterization: An update, J. Appl. Meteorol. Climatol., 43, 170–181, https://doi.org/10.1175/1520-0450(2004)043<0170:Tkcpau>2.0.Co;2, 2004.
Lei, Y., Zhang, Q., He, K. B., and Streets, D. G.: Primary anthropogenic aerosol emission trends for China, 1990–2005, Atmos. Chem. Phys., 11, 931–954, https://doi.org/10.5194/acp-11-931-2011, 2011.
Levy, I., Dayan, U., and Mahrer, Y.: A five-year study of coastal recirculation and its effect on air pollutants over the East Mediterranean region, J. Geophys. Res. Atmos., 113, https://doi.org/10.1029/2007jd009529, 2008.
Levy, I., Makar, P. A., Sills, D., Zhang, J., Hayden, K. L., Mihele, C., Narayan, J., Moran, M. D., Sjostedt, S., and Brook, J.: Unraveling the complex local-scale flows influencing ozone patterns in the southern Great Lakes of North America, Atmos. Chem. Phys., 10, 10895–10915, https://doi.org/10.5194/acp-10-10895-2010, 2010.
Li, H., Ren, G., and Li, W.: Diurnal and intra-season variation of warm-season temperature in coastal zone of Qinghai Lake, Theor. Appl. Climatol., 138, 1203–1217, https://doi.org/10.1007/s00704-019-02893-x, 2019.
Li, M., Liu, H., Geng, G., Hong, C., Liu, F., Song, Y., Tong, D., Zheng, B., Cui, H., Man, H., Zhang, Q., and He, K.: Anthropogenic emission inventories in China: a review, Natl. Sci. Rev., 4, 834–866, https://doi.org/10.1093/nsr/nwx150, 2017a.
Li, M., Zhang, Q., Kurokawa, J.-I., Woo, J.-H., He, K., Lu, Z., Ohara, T., Song, Y., Streets, D. G., Carmichael, G. R., Cheng, Y., Hong, C., Huo, H., Jiang, X., Kang, S., Liu, F., Su, H., and Zheng, B.: MIX: a mosaic Asian anthropogenic emission inventory under the international collaboration framework of the MICS-Asia and HTAP, Atmos. Chem. Phys., 17, 935–963, https://doi.org/10.5194/acp-17-935-2017, 2017b.
Li, Y., An, J., and Gultepe, I.: Effects of Additional HONO Sources on Visibility over the North China Plain, Adv. Atmos. Sci., 31, 1221–1232, https://doi.org/10.1007/s00376-014-4019-1, 2014.
Li, Z., Guo, J., Ding, A., Liao, H., Liu, J., Sun, Y., Wang, T., Xue, H., Zhang, H., and Zhu, B.: Aerosol and boundary-layer interactions and impact on air quality, Natl. Sci. Rev., 4, 810–833, https://doi.org/10.1093/nsr/nwx117, 2017c.
Li, Z., Li, C., Chen, H., Tsay, S. C., Holben, B., Huang, J., Li, B., Maring, H., Qian, Y., Shi, G., Xia, X., Yin, Y., Zheng, Y., and Zhuang, G.: East Asian Studies of Tropospheric Aerosols and their Impact on Regional Climate (EAST-AIRC): An overview, J. Geophys. Res. Atmos., 116, https://doi.org/10.1029/2010jd015257, 2011.
Li, Z., Lau, W. K. M., Ramanathan, V., Wu, G., Ding, Y., Manoj, M. G., Liu, J., Qian, Y., Li, J., Zhou, T., Fan, J., Rosenfeld, D., Ming, Y., Wang, Y., Huang, J., Wang, B., Xu, X., Lee, S. S., Cribb, M., Zhang, F., Yang, X., Zhao, C., Takemura, T., Wang, K., Xia, X., Yin, Y., Zhang, H., Guo, J., Zhai, P. M., Sugimoto, N., Babu, S. S., and Brasseur, G. P.: Aerosol and monsoon climate interactions over Asia, Rev. Geophys., 54, 866–929, https://doi.org/10.1002/2015rg000500, 2016.
Liu, Z., Gao, W., Yu, Y., Hu, B., Xin, J., Sun, Y., Wang, L., Wang, G., Bi, X., Zhang, G., Xu, H., Cong, Z., He, J., Xu, J., and Wang, Y.: Characteristics of PM2.5 mass concentrations and chemical species in urban and background areas of China: emerging results from the CARE-China network, Atmos. Chem. Phys., 18, 8849–8871, https://doi.org/10.5194/acp-18-8849-2018, 2018.
Lu, D., Xu, J., Yang, D., and Zhao, J.: Spatio-temporal variation and influence factors of PM2.5 concentrations in China from 1998 to 2014, Atmos. Pollut. Res., 8, 1151–1159, https://doi.org/10.1016/j.apr.2017.05.005, 2017.
Lyons, W. A.: The climatology and prediction of the Chicago lake breeze, J. Appl. Meteorol. Climatol., 11, 1259–1270, 1972.
Lyons, W. A. and Olsson, L. E.: Detailed mesometeorological studies of air pollution dispersion in the Chicago lake breeze, Mon. Weather Rev., 101, 387–403, 1973.
Lyons, W. A., Pielke, R. A., Tremback, C. J., Walko, R. L., Moon, D. A., and Keen, C. S.: Modeling impacts of mesoscale vertical motions upon coastal zone air pollution dispersion, Atmos. Environ., 29, 283–301, https://doi.org/10.1016/1352-2310(94)00217-9, 1995.
Makar, P. A., Zhang, J., Gong, W., Stroud, C., Sills, D., Hayden, K. L., Brook, J., Levy, I., Mihele, C., Moran, M. D., Tarasick, D. W., He, H., and Plummer, D.: Mass tracking for chemical analysis: the causes of ozone formation in southern Ontario during BAQS-Met 2007, Atmos. Chem. Phys., 10, 11151–11173, https://doi.org/10.5194/acp-10-11151-2010, 2010.
Miao, Y., Liu, S., Chen, B., Zhang, B., Wang, S., and Li, S.: Simulating urban flow and dispersion in Beijing by coupling a CFD model with the WRF model, Adv. Atmos. Sci., 30, 1663–1678, https://doi.org/10.1007/s00376-013-2234-9, 2013.
Miao, Y., Guo, J., Liu, S., Liu, H., Li, Z., Zhang, W., and Zhai, P.: Classification of summertime synoptic patterns in Beijing and their associations with boundary layer structure affecting aerosol pollution, Atmos. Chem. Phys., 17, 3097–3110, https://doi.org/10.5194/acp-17-3097-2017, 2017.
Mlawer, E. J., Taubman, S. J., Brown, P. D., Iacono, M. J., and Clough, S. A.: Radiative transfer for inhomogeneous atmospheres: RRTM, a validated correlated-k model for the longwave, J. Geophys. Res. Atmos., 102, 16663–16682, https://doi.org/10.1029/97jd00237, 1997.
Monks, P. S., Archibald, A. T., Colette, A., Cooper, O., Coyle, M., Derwent, R., Fowler, D., Granier, C., Law, K. S., Mills, G. E., Stevenson, D. S., Tarasova, O., Thouret, V., von Schneidemesser, E., Sommariva, R., Wild, O., and Williams, M. L.: Tropospheric ozone and its precursors from the urban to the global scale from air quality to short-lived climate forcer, Atmos. Chem. Phys., 15, 8889–8973, https://doi.org/10.5194/acp-15-8889-2015, 2015.
Morrison, H., Thompson, G., and Tatarskii, V.: Impact of Cloud Microphysics on the Development of Trailing Stratiform Precipitation in a Simulated Squall Line: Comparison of One- and Two-Moment Schemes, Mon. Weather Rev., 137, 991–1007, https://doi.org/10.1175/2008mwr2556.1, 2009.
NCEP: NCEP FNL operational model global tropospheric analyses, continuing from July 1999, Research Data Archive at the National Center for Atmospheric Research, Computational and Information Systems Laboratory [data set], https://doi.org/10.5065/D6M043C6, 2000.
Peng, J., Huang, Y., Liu, T., Jiang, L., Xu, Z., Xing, W., Feng, X., and De Maeyer, P.: Atmospheric nitrogen pollution in urban agglomeration and its impact on alpine lake-case study of Tianchi Lake, Sci. Total Environ., 688, 312–323, https://doi.org/10.1016/j.scitotenv.2019.06.202, 2019.
Sills, D. M. L., Brook, J. R., Levy, I., Makar, P. A., Zhang, J., and Taylor, P. A.: Lake breezes in the southern Great Lakes region and their influence during BAQS-Met 2007, Atmos. Chem. Phys., 11, 7955–7973, https://doi.org/10.5194/acp-11-7955-2011, 2011.
Steiner, A. L., Mermelstein, D., Cheng, S. J., Twine, T. E., and Oliphant, A.: Observed Impact of Atmospheric Aerosols on the Surface Energy Budget, Earth Interact., 17, https://doi.org/10.1175/2013ei000523.1, 2013.
Stull, R. B.: An Introduction to Boundary Layer Meteorology, Atmospheric Sciences Library, Kluwer Academic Publishers, Dordrecht, https://doi.org/10.1007/978-94-009-3027-8, 1988.
Unger, N., Menon, S., Koch, D. M., and Shindell, D. T.: Impacts of aerosol-cloud interactions on past and future changes in tropospheric composition, Atmos. Chem. Phys., 9, 4115–4129, https://doi.org/10.5194/acp-9-4115-2009, 2009.
Wang, F., Wang, Y., and Gao, M.: Impact of lake-atmosphere exchange on summertime ozone in the Lake Taihu region, Atmos. Environ., 300, https://doi.org/10.1016/j.atmosenv.2023.119664, 2023.
Wang, Y., Ying, Q., Hu, J., and Zhang, H.: Spatial and temporal variations of six criteria air pollutants in 31 provincial capital cities in China during 2013–2014, Environ. Int., 73, 413–422, https://doi.org/10.1016/j.envint.2014.08.016, 2014.
Wang, Y., Gao, Y., Qin, H., Huang, J., Liu, C., Hu, C., Wang, W., Liu, S., and Lee, X.: Spatiotemporal Characteristics of Lake Breezes over Lake Taihu, China, J. Appl. Meteorol. Climatol. and Climatology, 56, 2053–2065, https://doi.org/10.1175/jamc-d-16-0220.1, 2017.
Wei, J., Li, Z., Pinker, R. T., Wang, J., Sun, L., Xue, W., Li, R., and Cribb, M.: Himawari-8-derived diurnal variations in ground-level PM2.5 pollution across China using the fast space-time Light Gradient Boosting Machine (LightGBM), Atmos. Chem. Phys., 21, 7863–7880, https://doi.org/10.5194/acp-21-7863-2021, 2021.
Wentworth, G. R., Murphy, J. G., and Sills, D. M. L.: Impact of lake breezes on ozone and nitrogen oxides in the Greater Toronto Area, Atmos. Environ., 109, 52–60, https://doi.org/10.1016/j.atmosenv.2015.03.002, 2015.
Wiedinmyer, C., Akagi, S. K., Yokelson, R. J., Emmons, L. K., Al-Saadi, J. A., Orlando, J. J., and Soja, A. J.: The Fire INventory from NCAR (FINN): a high resolution global model to estimate the emissions from open burning, Geosci. Model Dev., 4, 625–641, https://doi.org/10.5194/gmd-4-625-2011, 2011.
Wild, O., Zhu, X., and Prather, M. J.: Fast-j: Accurate simulation of in- and below-cloud photolysis in tropospheric chemical models, J. Atmos. Chem., 37, 245–282, https://doi.org/10.1023/a:1006415919030, 2000.
WRAP: 2002 Fire Emission Inventory for the WRAP Region – Phase II, Project No. 178-6, http://www.wrapair.org/forums/fejf/tasks/FEJFtask7PhaseII.html (last access: 30 September 2021), 2005.
Xia, Z., Zhao, C., Yang, Z., Du, Q., Jia, W., Jin, C., Shi, J., and An, H.: Source code for Hybrid WRFCHEM with Physics and AI Schemes (Aerosol Chemistry and Interactions) (v1.0), Zenodo [code], https://doi.org/10.5281/zenodo.15702248, 2024.
Yang, Y., Ruan, Z., Wang, X., Yang, Y., Mason, T. G., Lin, H., and Tian, L.: Short-term and long-term exposures to fine particulate matter constituents and health: A systematic review and meta-analysis, Environ. Pollut., 247, 874–882, https://doi.org/10.1016/j.envpol.2018.12.060, 2019.
Yang, Z., Du, Q., Yang, Q., Zhao, C., Li, G., Xia, Z., Xu, M., Yuan, R., Li, Y., Xia, K., Gu, J., and Feng, J.: Modeling urban pollutant transport at multiple resolutions: impacts of turbulent mixing, Atmos. Chem. Phys., 25, 8831–8857, https://doi.org/10.5194/acp-25-8831-2025, 2025.
Yue, X., Ma, N. L., Sonne, C., Guan, R., Lam, S. S., Le, Q. V., Chen, X., Yang, Y., Gu, H., Rinklebe, J., and Peng, W.: Mitigation of indoor air pollution: A review of recent advances in adsorption materials and catalytic oxidation, J. Hazard. Mater., 405, https://doi.org/10.1016/j.jhazmat.2020.124138, 2021.
Zaveri, R. A. and Peters, L. K.: A new lumped structure photochemical mechanism for large-scale applications, J. Geophys. Res. Atmos., 104, 30387–30415, https://doi.org/10.1029/1999jd900876, 1999.
Zhang, H., Wang, Y., Hu, J., Ying, Q., and Hu, X.-M.: Relationships between meteorological parameters and criteria air pollutants in three megacities in China, Environ. Res., 140, 242–254, https://doi.org/10.1016/j.envres.2015.04.004, 2015a.
Zhang, L., Zhu, B., Gao, J., and Kang, H.: Impact of Taihu Lake on city ozone in the Yangtze River Delta, Adv. Atmos. Sci., 34, 226–234, https://doi.org/10.1007/s00376-016-6099-6, 2017.
Zhang, M., Zhao, C., Yang, Y., Du, Q., Shen, Y., Lin, S., Gu, D., Su, W., and Liu, C.: Modeling sensitivities of BVOCs to different versions of MEGAN emission schemes in WRF-Chem (v3.6) and its impacts over eastern China, Geosci. Model Dev., 14, 6155–6175, https://doi.org/10.5194/gmd-14-6155-2021, 2021.
Zhang, R., Wang, G., Guo, S., Zarnora, M. L., Ying, Q., Lin, Y., Wang, W., Hu, M., and Wang, Y.: Formation of Urban Fine Particulate Matter, Chem. Rev., 115, 3803–3855, https://doi.org/10.1021/acs.chemrev.5b00067, 2015b.
Zhang, R., Jing, J., Tao, J., Hsu, S.-C., Wang, G., Cao, J., Lee, C. S. L., Zhu, L., Chen, Z., Zhao, Y., and Shen, Z.: Chemical characterization and source apportionment of PM2.5 in Beijing: seasonal perspective, Atmos. Chem. Phys., 13, 7053–7074, https://doi.org/10.5194/acp-13-7053-2013, 2013.
Zhang, X. Y., Wang, Y. Q., Niu, T., Zhang, X. C., Gong, S. L., Zhang, Y. M., and Sun, J. Y.: Atmospheric aerosol compositions in China: spatial/temporal variability, chemical signature, regional haze distribution and comparisons with global aerosols, Atmos. Chem. Phys., 12, 779–799, https://doi.org/10.5194/acp-12-779-2012, 2012.
Zhao, C., Liu, X., Ruby Leung, L., and Hagos, S.: Radiative impact of mineral dust on monsoon precipitation variability over West Africa, Atmos. Chem. Phys., 11, 1879–1893, https://doi.org/10.5194/acp-11-1879-2011, 2011.
Zhao, C., Leung, L. R., Easter, R., Hand, J., and Avise, J.: Characterization of speciated aerosol direct radiative forcing over California, J. Geophys. Res. Atmos., 118, 2372–2388, https://doi.org/10.1029/2012jd018364, 2013a.
Zhao, C., Chen, S., Leung, L. R., Qian, Y., Kok, J. F., Zaveri, R. A., and Huang, J.: Uncertainty in modeling dust mass balance and radiative forcing from size parameterization, Atmos. Chem. Phys., 13, 10733–10753, https://doi.org/10.5194/acp-13-10733-2013, 2013b.
Zhao, C., Hu, Z., Qian, Y., Ruby Leung, L., Huang, J., Huang, M., Jin, J., Flanner, M. G., Zhang, R., Wang, H., Yan, H., Lu, Z., and Streets, D. G.: Simulating black carbon and dust and their radiative forcing in seasonal snow: a case study over North China with field campaign measurements, Atmos. Chem. Phys., 14, 11475–11491, https://doi.org/10.5194/acp-14-11475-2014, 2014.
Zhao, C., Huang, M., Fast, J. D., Berg, L. K., Qian, Y., Guenther, A., Gu, D., Shrivastava, M., Liu, Y., Walters, S., Pfister, G., Jin, J., Shilling, J. E., and Warneke, C.: Sensitivity of biogenic volatile organic compounds to land surface parameterizations and vegetation distributions in California, Geosci. Model Dev., 9, 1959–1976, https://doi.org/10.5194/gmd-9-1959-2016, 2016.
Zheng, B., Tong, D., Li, M., Liu, F., Hong, C., Geng, G., Li, H., Li, X., Peng, L., Qi, J., Yan, L., Zhang, Y., Zhao, H., Zheng, Y., He, K., and Zhang, Q.: Trends in China's anthropogenic emissions since 2010 as the consequence of clean air actions, Atmos. Chem. Phys., 18, 14095–14111, https://doi.org/10.5194/acp-18-14095-2018, 2018.
Chemistry (WRF-Chem) simulations to investigate how Lake Chaohu affects fine
particulate matter (PM2.5) in Hefei. The lake shows a diurnal reversal, increasing
daytime pollution by secondary aerosol formation and storage zones with suppressed
mixing and low deposition, while purifying urban air at night through enhanced vertical
mixing. Lake emission treatment affects lake-urban air quality assessments.
Chemistry...