the Creative Commons Attribution 4.0 License.
the Creative Commons Attribution 4.0 License.
 | 22 May 2026
Convective controls on anvil cloud evolution in the ICON km-scale global climate model
Mathilde Ritman
William Jones
Philip Stier
Deep convective clouds substantially modify the balance of shortwave and longwave radiative energy at the top of the atmosphere. Although in the present-day these effects approximately balance out, projected changes in deep convective clouds could alter the future top-of-atmosphere energy balance. Past studies have found relationships between convection and anvil clouds, but our understanding of how convection typically controls the properties and evolution of anvil clouds that determine anvil radiative effects remains incomplete, limiting our ability to explain or justify projected changes in cloud optical properties. This manuscript presents a new method to track the lifecycle of deep convective clouds and their convective cores in three-dimensional space in km-scale global climate models. An analysis of how convective organisation, intensity and area relate to anvil properties in the ICOsahedral Non-hydrostatic (ICON) model is then presented. Approximately 1000 deep convective clouds are tracked over one simulation week in the tropical Amazon region. We find that while both updraft intensity and area correspond to larger anvils, the correlation between convective area and anvil size is stronger than that between anvil size and updraft intensity. Updraft intensity was associated with a 4-fold increase in anvil extent when convective cores were larger, compared to when they were in the bottom 50th size percentile. This result could not be explained by associated changes in peak convective mass flux or organisation. These results indicate how changes in the frequency or typical size of convective updrafts may link to changes in anvil development, extent and, ultimately, radiative effects.
- Article
(8106 KB) - Full-text XML
- BibTeX
- EndNote


Deep convective clouds (DCCs) are inarguably the most striking result of the atmosphere's constant mission to redistribute the energy surplus that characterises the tropics to high latitudes. They form as warm, moist air rises and undergoes buoyant accelerations as water vapour condenses, releasing latent heat. The partition of “deep” from other convective clouds typically refers to those clouds that predominantly detrain at and above the freezing level, or at the tropopause itself. The detrainment of mass results in large anvil clouds that can span many hundreds of kilometres and substantially modify the long- and short-wave top-of-atmosphere radiative energy budgets (Wild et al., 2019).
The size, location, temperature, timing, and microphysical properties of deep convective anvil clouds collectively determine whether a cloud will increase or decrease the total radiative energy at the top of the atmosphere (Gasparini et al., 2023). Changes in many of these properties, and in the processes that control them, are anticipated in response to warming, but the overall response of deep convective clouds to warming and their consequent feedbacks remains poorly understood (Sherwood et al., 2020).
Anvil cloud area is projected to decrease with warming (Tompkins and Craig, 1999). Well-developed theory with model and observational support has shown that a reduction in anvil expansion can result from increased tropospheric stability and reduced clear-sky convergence at upper levels (Bony et al., 2016). However, recent work has constrained this feedback, showing that unphysically large reductions in anvil area would be required to sufficiently explain the expected anvil cloud area feedback (McKim et al., 2024). Instead, attention has turned to assessments that additionally consider shifts in the distribution of anvil ice water path, and therefore approximate optical thickness and radiative effects (Sokol et al., 2024; Raghuraman et al., 2024; Deutloff et al., 2025). These works project a reduction in the amount of thick anvil cloud, the production and maintenance of which is dominated by convective, rather than stability–divergence, processes.
Many observational assessments have noted a positive correlation between anvil cloud area and proxies for convective intensity or convective depth (e.g., Machado and Rossow, 1993; Genio and Kovari, 2002; Gupta et al., 2024). The intensity of convection has also been shown to have some dependence on the size of the convective area, through the interaction of entrainment with the convective environment (Jensen and Genio, 2006; Varble et al., 2024; Jo et al., 2025). Observations have also found that convective or precipitating area is positively correlated to anvil extent (Yuan and Houze, 2010; Li and Schumacher, 2011). But nuance persists and challenges a unified theory of convective anvil evolution as these studies have found that, in spite of their physical interdependence, anvil extent correlates more strongly with convective area than convective intensity.
Until recent years, it has been infeasible to directly simulate convection in global-scale models or observe convective motions from space, which has meant that a unified, global view of how convection typically determines anvil clouds has remained obscure (Prein et al., 2015; Morrison et al., 2020). The latest generation of km-scale climate models has overcome the simulation component of this challenge. Instead of parameterising convective motions, higher resolution models such as the ICOsahedral Non-hydrostatic (ICON) model explicitly resolve non-hydrostatic vertical motions, allowing convection to arise as part of the large-scale dynamics (Hohenegger et al., 2020, 2023). As a result, convection-permitting models have demonstrated substantial advances in skill compared to global climate models with convective parameterisations. ICON has been shown to reproduce key characteristics of precipitation, clouds, and mesoscale cloud systems from observations including the diurnal cycle, spatial distribution, size, propagation speed, and lifetime (e.g., Feng et al., 2023b; Respati et al., 2024; Feng et al., 2025), and to reproduce the trimodal structure of convective clouds (Roh et al., 2021). However, the strength of vertical motions and intensity of precipitation in ICON and other convection-permitting models are overestimated compared to observations (Senf et al., 2018; Crook et al., 2019; Feng et al., 2023b), and the tropics tends to be characterised by more smaller and fewer larger clouds, and by less convective organisation, compared to reality (Becker et al., 2021; Feng et al., 2025). Additionally, differences in the relative frequency of shallow and deep convective modes, and liquid and ice hydrometeors, can be large between models, even exceeding regional differences (Nugent et al., 2022; Turbeville et al., 2022). In summary, although the magnitude and frequency of convective and cloud quantities may be subject to large biases, these models offer a useful and new means of studying the relationship between convective updrafts and cloud development according to our best approximation of the relevant physics at the global scale, an important complement to the higher resolution but idealised investigations at the scale of large-eddy simulations.
While much can be learnt about convective clouds from an Eulerian perspective, such insights are fundamentally limited by the simple fact that clouds move and change substantially throughout their lifetime. Instead, Lagrangian frameworks offer a powerful tool to analyse the lifecycle of cloud processes and development. To achieve this, many methods have been developed to track clouds in space and time. Common techniques include: checks for sufficient, or any, overlap of detected objects between time steps (Machado et al., 1998; Crook et al., 2019; Feng et al., 2023a); predictive motion algorithms that use wind fields (Stein et al., 2014; Lochbihler et al., 2017; Ocasio et al., 2020); derived object advection rates from preceding scenes (Heikenfeld et al., 2019a; Sokolowsky et al., 2023); and more (e.g., Fiolleau and Roca, 2013). Studies comparing multiple tracking methods report consistent qualitative results and small differences in the magnitude of bulk cloud characteristics, but that substantial differences can arise in reported cloud frequency (Müller et al., 2023; Prein et al., 2024; Feng et al., 2025).
To date, regional scale cloud tracking has largely been performed in two-dimensional space (see Feng et al., 2023b; Jones et al., 2024; Fiolleau and Roca, 2024; Freeman et al., 2024; Feng et al., 2025). In observations, this restriction is set by the nature of our observing systems, but km-scale models facilitate tracking of convective clouds in the true dimensionality in which they evolve. Obtaining regional-scale vertically-resolved information on the properties and evolution of clouds and convection offers substantial resources to challenge our understanding of these processes, and past works have demonstrated this utility (e.g., Heikenfeld et al., 2019b). Past studies using regional and global km-scale model simulations have also often been limited to hourly temporal resolution, limiting the scope of past works to larger, longer-lived systems, such as organised mesoscale convective systems (Feng et al., 2025). Tracking at sub-hourly resolution extends analyses to isolated deep convection and precursors of organised systems and presents opportunities for direct comparison between results derived from geostationary satellites and convection-permitting models.
The objective of this paper is to (i) advance the capability of existing cloud tracking algorithms to better handle the complex anvil morphologies and constituent structures (i.e., updrafts) associated with deep convective clouds in three-dimensional space, and (ii) use the resulting dataset to understand how convection controls anvil cloud extent and characteristics. We address the former by developing a method to test for cloud overlap that is less sensitive to cloud shape and motion (Sect. 2.2). We then use the resulting algorithm to track approximately 1000 deep convective clouds and their convective cores over 1 week of 15 min, 0.1° resolution ICON km-scale climate model data in the Amazon. The latter, we address by contrasting the effect of convective area, intensity, and organisation on the bulk properties of anvil clouds in the tracked systems (Sect. 3).
2.1 Data
We use global ICON simulation data taken from the NextGEMs project production run (also called development cycle 4) (Wieners et al., 2024; Segura et al., 2025). Within the 30-year production run, the NextGEMs project released two weeks of simulation output which provided instantaneous cloud and dynamic fields in three-dimensional space at 15 min resolution (called development cycle 4008a). The first of these two weeks of simulation output was used in this study. The data were subset to the tropical Amazon region, defined as from −15 to 15° N and −43 to −83° E (Fig. 1). The Amazon region was chosen because of the high frequency of deep convection. Future assessments may explore larger or multiple domains, but for the purposes of this study a single domain was used to reduce the computational burden.
The data are resolved to 0.1° (approximately 10 km) in horizontal space and 91 vertical levels. The vertical coordinates use the Smooth Level Vertical (SLEVE) coordinate system (Schär et al., 2002; Leuenberger et al., 2010), which uses terrain-following geometric altitude rather than pressure, as in a non-hydrostatic model pressure cannot be assumed to monotonically decrease with height. The atmosphere is simulated using the 3D Navier-Stokes equations (Zängl et al., 2015) and parameterisations for radiation, microphysics, and turbulence, namely, the Radiative Transfer for Energetics for General circulation model applications–Parallel (RTE-RRTMGP) scheme (Pincus et al., 2019), a one-moment microphysics scheme (Baldauf et al., 2011), and a modified Smagorinsky scheme (Smagorinsky, 1963; Lilly, 1962). Convection in the simulation thus arises directly as a result of local buoyancy from the interaction of the simulated fluid flow with the radiation, microphysics, and turbulence schemes, rather than being represented for each grid box using a convective parameterisation scheme.
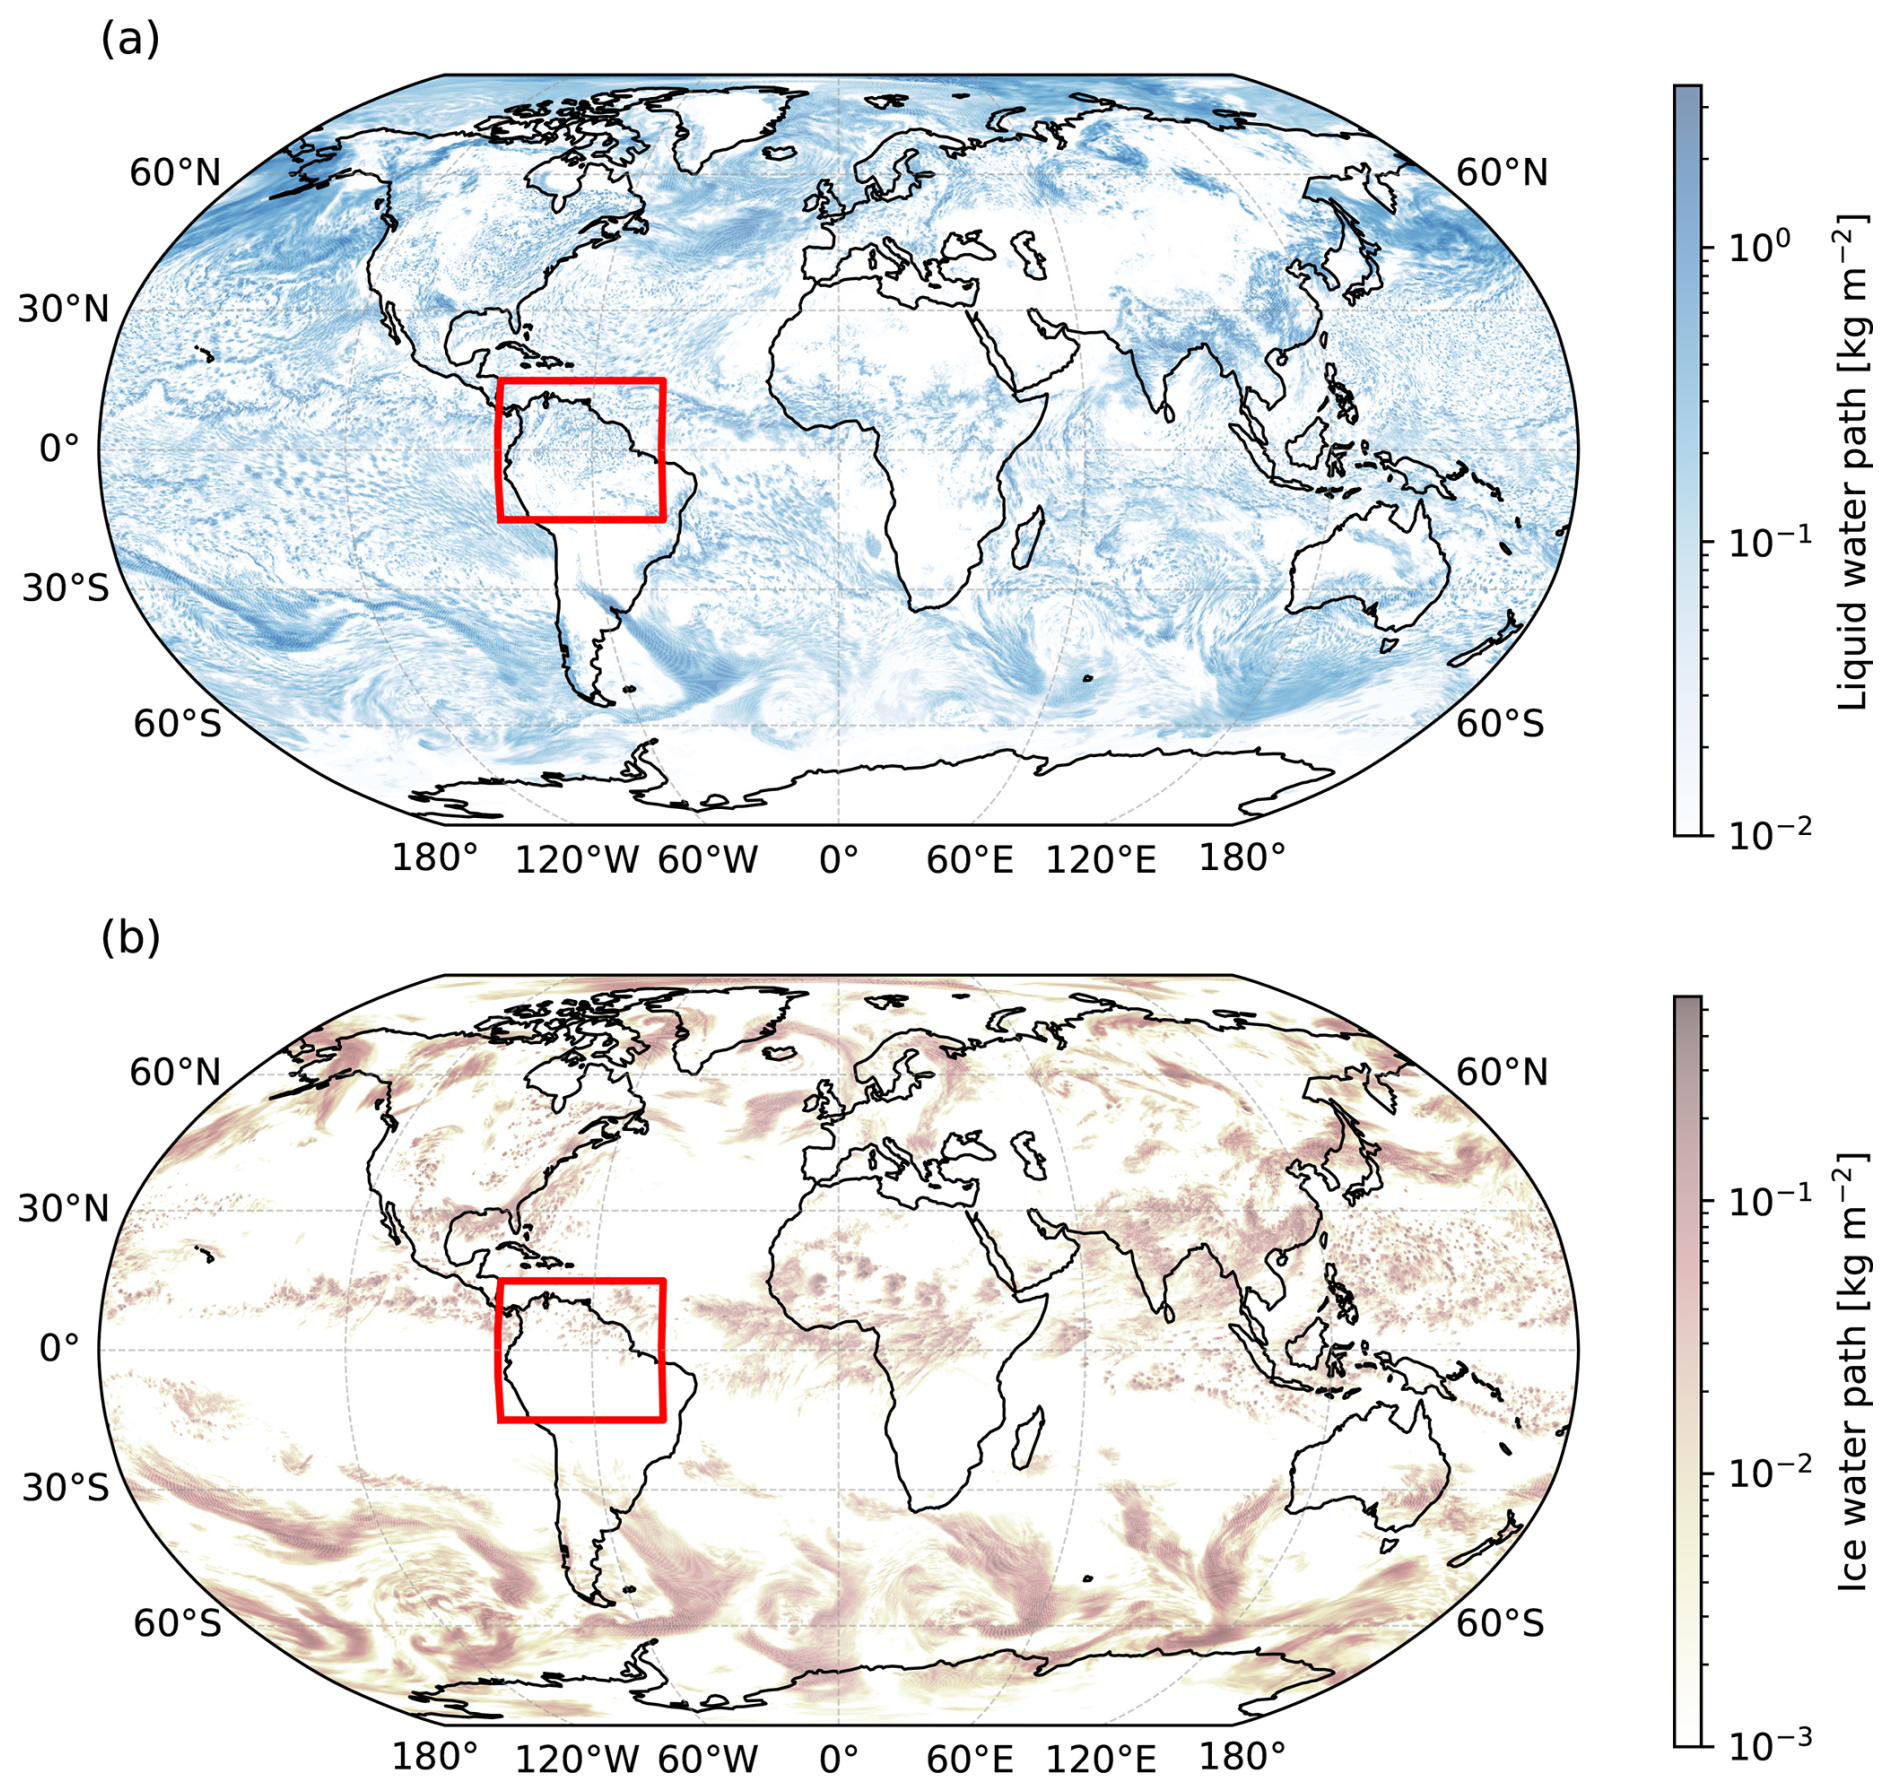
Figure 1Study domain (red) and a snapshot of the ICON simulated vertically integrated cloud (a) water and (b) ice at 20:00 UTC on 4 July 2021.
2.2 Tracking algorithm
This section details the method used to track deep convective clouds in the four-dimensional ICON model data, and the algorithm is conceptually summarised in Fig. 2. The objective was to develop an algorithm that tracks deep convective cloud systems from their initiation to decay and, within each system, follows the lifecycle of the feeder updraft core(s) and resulting anvil clouds. To do this, we made use of the open-source Python library, tobac, (Heikenfeld et al., 2019a; Sokolowsky et al., 2023) to identify updrafts and ice clouds and to track their displacements (steps 1 and 2 in Fig. 2). We then developed new algorithms to better handle object splitting and merging in three-dimensional space (step 3) and to define the resulting deep convective system (step 4) and anvil cloud (step 5).
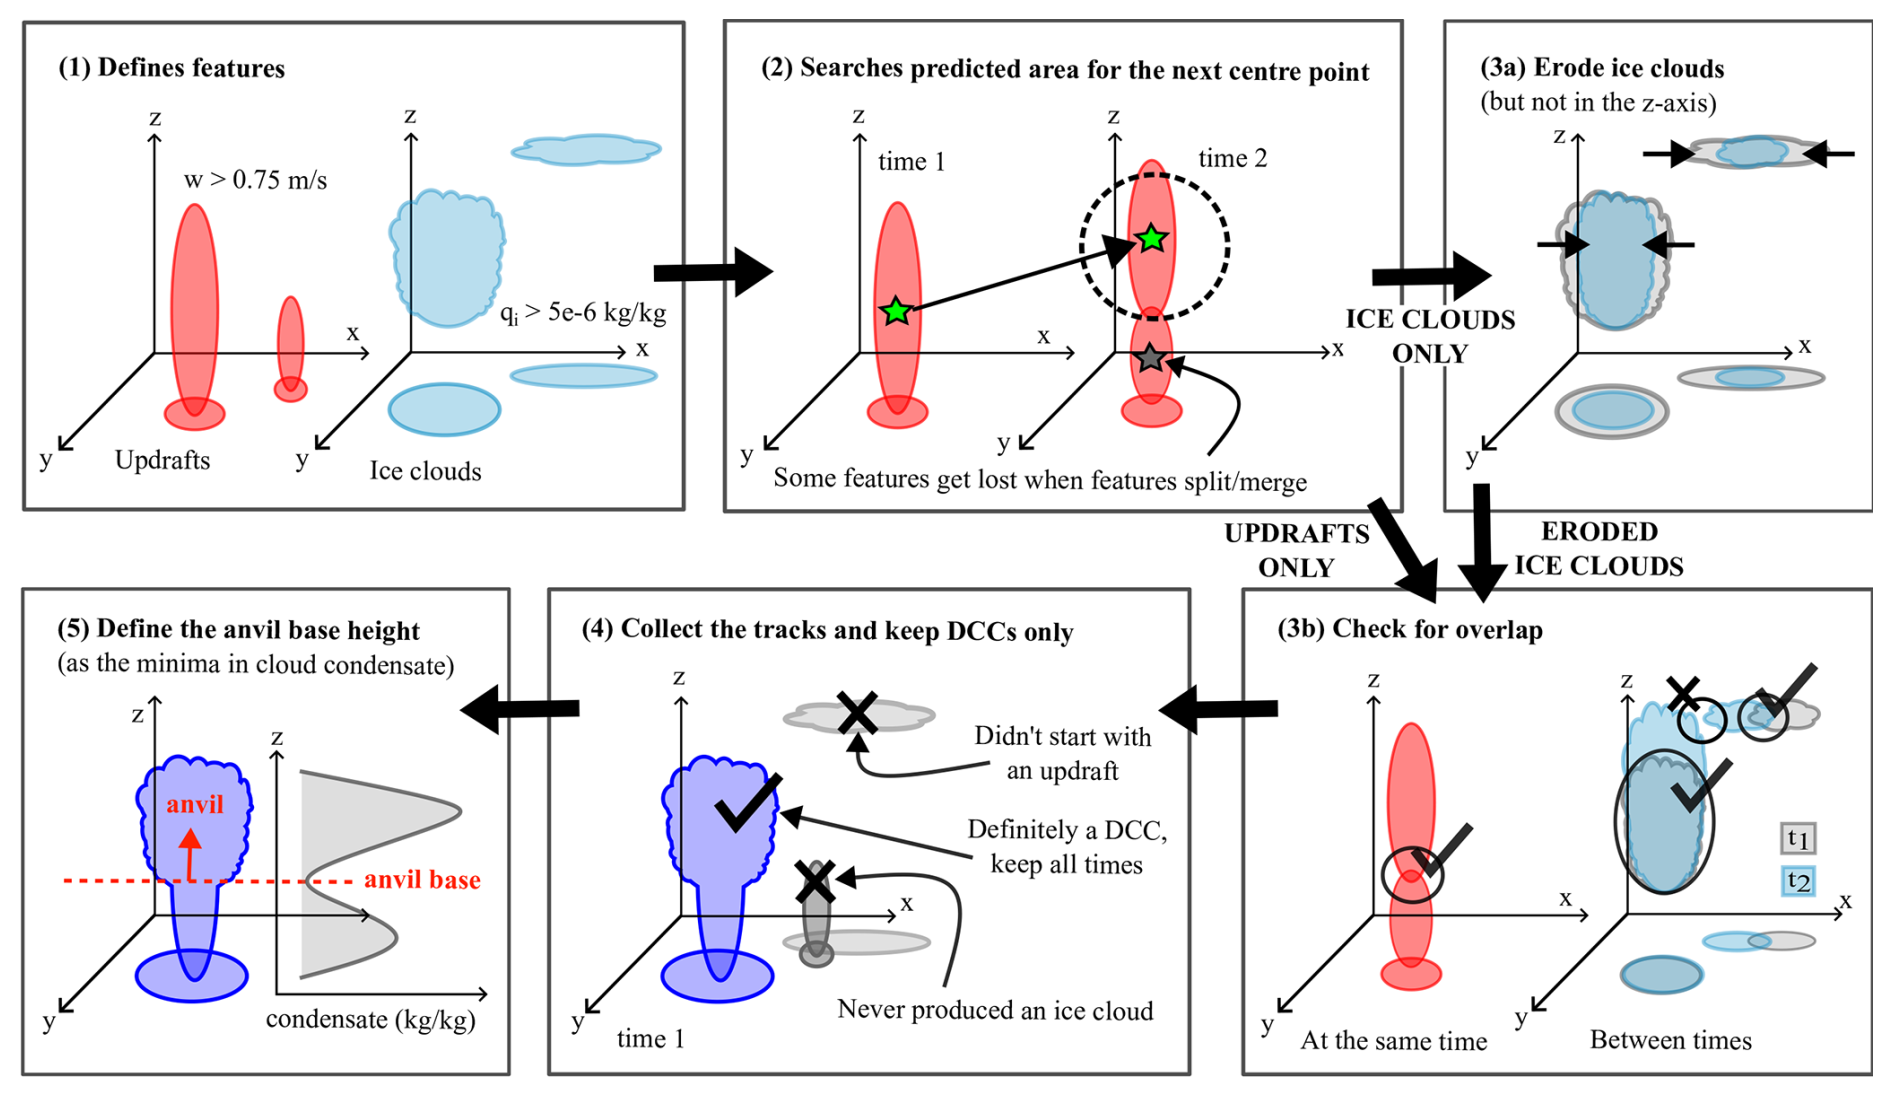
Figure 2Overview of the algorithm used to track deep convective clouds and their updrafts and anvils in the four-dimensional ICON climate model data. Steps 1 (Sect. 2.2.2) and 2 (Sect. 2.2.3) make use of the tobac cloud tracking algorithm (Heikenfeld et al., 2019a; Sokolowsky et al., 2023), while the remaining steps use new developments detailed the following sections (Sect. 2.2.4 and 2.2.5).
2.2.1 Determining appropriate thresholds
A standard and intuitive approach to tracking convective clouds in model simulations is to identify regions of high upward vertical velocity and determine the extent of the connected region of non-zero water or ice. But what exactly constitutes a “high” upward velocity or a “non-zero” amount of water or ice?
Typically, studies that adopt vertical velocity thresholds for distinguishing convective from non-convective cloud use a threshold of 1 m s−1 (Giangrande et al., 2016; Wang et al., 2019, 2020; Freeman et al., 2024). This threshold choice seems to originate from the partition used in analysis of the 1980s Global Atmospheric Research Program’s Atlantic Tropical Experiment (GATE) observation campaign (Zipser and LeMone, 1980). However, while parcel theory implies a scale break between vertical velocities in the background atmosphere and those within convective updrafts (due to acceleration by latent heat release), no general threshold emerges that distinguishes background from convective motions. The range of observed updraft velocities varies greatly between observational campaigns (e.g., Klingebiel et al., 2021; Savazzi et al., 2021) and the magnitudes of global-scale convective intensities, using proxies, differ across regions, even within tropical environments of comparable CAPE (Takahashi et al., 2023).
To determine if and at what value a scale-break occurs in our dataset, we assessed the distribution of modelled vertical velocities. We sampled 100 random times in the model week over the study domain. Results show that there was no suggestion of bi-modality in the distribution of vertical velocity at 500 hPa (Fig. 3). Further, we found no obvious change in the distribution of 500 hPa vertical velocities when sampling pixels that were very cloudy and occurred over land during the time of peak convection (total column kg kg−1 at 14:00–18:00 Amazon Mean Time (AMT)). That means that no clear threshold emerged from the data to support a less arbitrary partitioning of convective and non-convective clouds. Instead, dynamic, rather than static, partitions of such phenomena may be more appropriate. For our purposes, we therefore resolve the lack of a data-informed velocity threshold by choosing a semi-arbitrary value. Instead of the commonly used 1 m s−1, we relax this threshold to 0.75 m s−1, to capture transport in weaker motions, and assess the sensitivity of results to changing the threshold used.
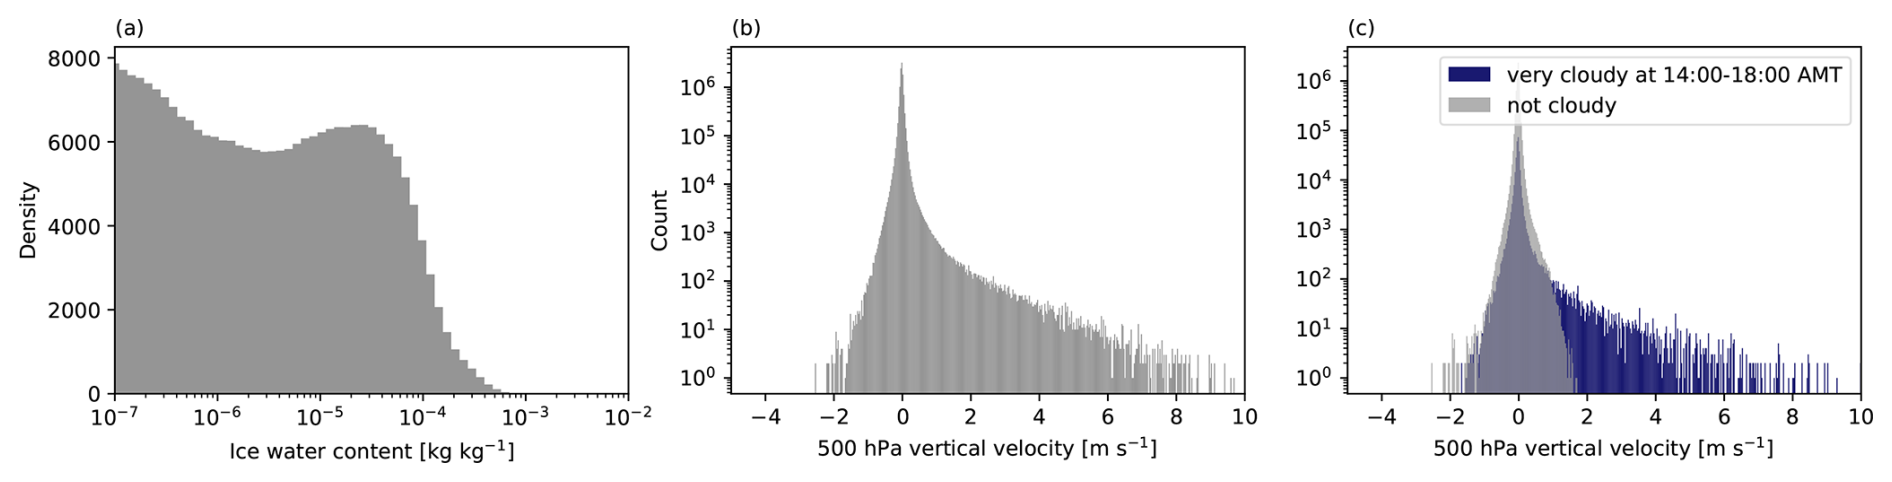
Figure 3Distributions of (a) cloud ice concentrations and 500 hPa vertical velocities for (b) all cases and (c) afternoon very cloudy (dark blue) vs clear (grey). Where very cloudy is defined as and times are sampled between 12:00–18:00 local time only. Computed from a random sample of 100 time snapshots in the ICON model week, 1–8 July 2021, in the Amazon.
To determine exactly which near-zero numerical value to set as the lower bound for identifying ice, we assessed the distribution of specific ice water in the model data (Fig. 3a). Based on the peak mass mixing ratio (below which we assume dry pixels), we used thresholds of and kg kg−1.
2.2.2 Identifying updrafts and ice clouds
The centre and spatial extent of updrafts and ice clouds were identified using tobac. To define the ice cloud centres and extents, the input field was smoothed by the tobac algorithm. This was done because the arrangement of cloud ice was highly variable between timesteps, resulting in centroid locations that sometimes misrepresented the centre of the object when the fields were unsmoothed. No smoothing was applied to the updraft features.
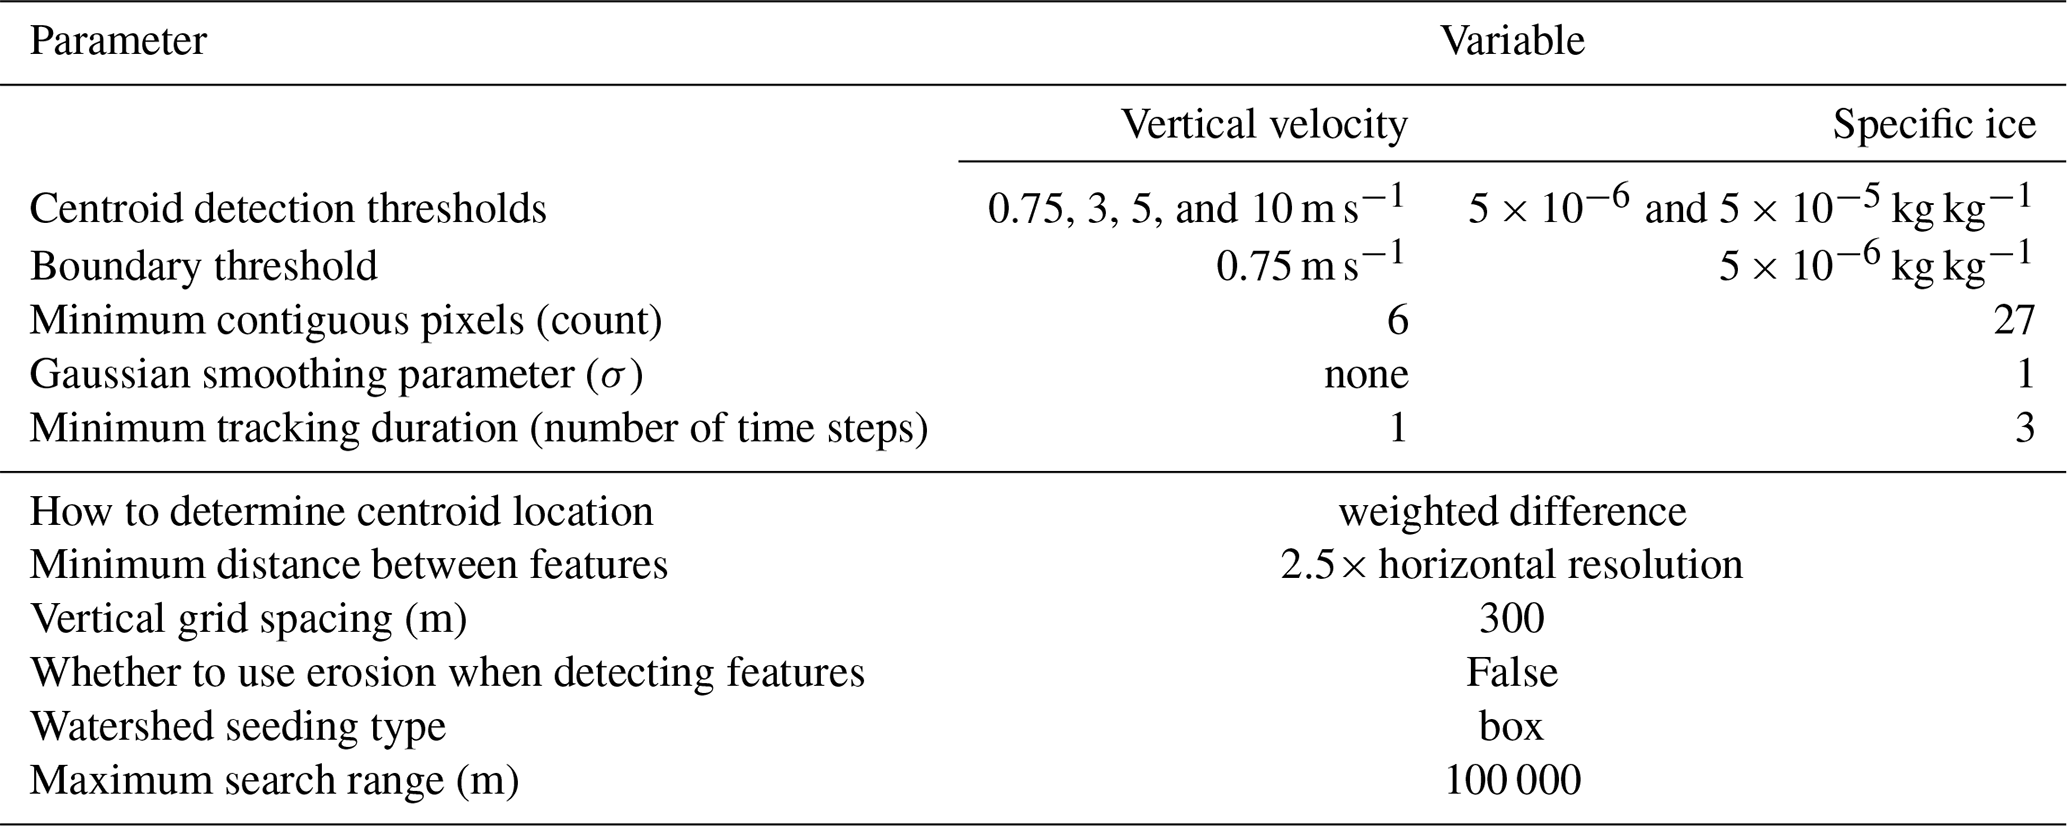
The exact algorithm specifications are detailed in Table 1. Ice cloud features required 27 contiguous pixels, whereas the requirement was relaxed to 6 pixels for updraft features to retain narrow updrafts in the 10 km grid. If two features were separated by less than 2.5 horizontal pixels, the smaller feature was ignored.
Table 1Parameters passed to the tobac detection, segmentation, and tracking algorithms to identify and track updrafts and ice clouds in the ICON model data.
2.2.3 Tracking objects using their centroids
Centroid-based tracking was performed using tobac linking, an implementation of the trackpy library (Allan et al., 2024). Our exact algorithm specifications are provided in Table 1.
2.2.4 Tracking objects using erosion and contiguity
Here, we extend the functionality of tobac with two new developments. The main limitation of tobac in this study arose from its reliance on centroid-based tracking. The modelled ice clouds were often fed by pulses of convection in individual cores, resulting in vertically inhomogeneous condensate. In the case of organised convection, multiple cores at different locations fed one cloud, resulting in horizontal inhomogeneities. At the decay stage, processes other than horizontal advection influence where the greatest condensate loading persists, reducing the predictability of centroid displacements. The result was that multiple centroids frequently described one ice cloud, and the associated cloud segments were tracked as individual features. This behaviour was not rectified with the use of tobac feature merging, whose functionality is optimised for splitting and merging of convective cores based on proximity, not more complex anvil morphologies which organise over larger distances.
Checking for sufficient (threshold-based) object overlap between adjacent times is a simple, effective, and well utilised tracking method that is suitable when an object cannot substantially displace itself within the temporal resolution of its dataset (Machado and Rossow, 1993; Crook et al., 2019; Feng et al., 2023a). However, when objects can substantially displace themselves, only a small required overlap threshold would enable continued tracking (Fig. 4a), increasing the likelihood of merging nearby features of distinct convective origin. To avoid this sensitivity, we adopted a similar, but not equivalent, method to test for sufficient overlap between time steps that is less sensitive to the shape and direction of motion of the object.
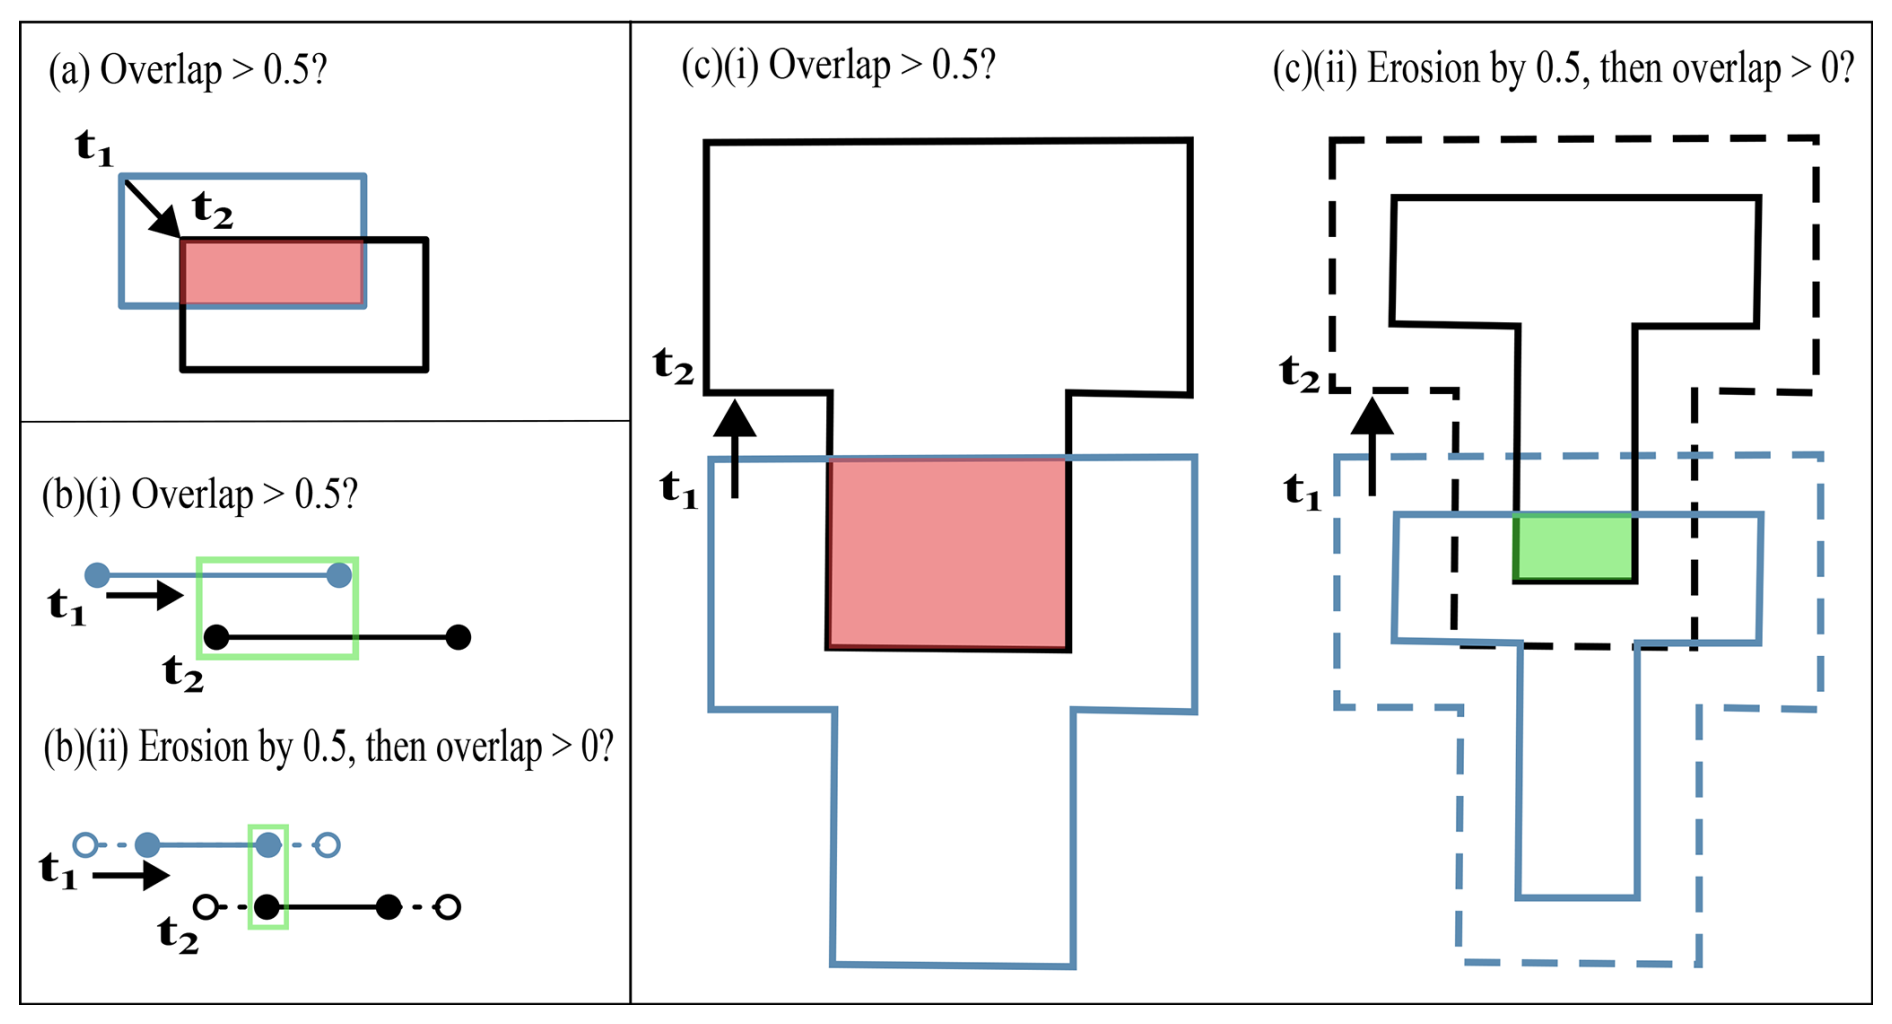
Figure 4Comparisons between using a minimum overlap threshold to link objects and using an eroded-contiguity check, for a threshold choice of in (a), (b), and (c). For calculation of the erosion by 0.5 in (c), see Fig. 5.
Our method shrinks (or “erodes”) each cloud by an amount that is proportional to the size of the cloud itself, rather than by a fixed number of pixels. This means that the erosion is weighted by the size of each object in question. After the cloud has been shrunk appropriately, we test whether the cloud overlaps or touches any adjacent objects at the current or next time step. If the shrunken cloud is contiguous with a future object or neighbour, the two are said to be the same cloud and are tracked through time. The exact fraction (α) by which to erode each cloud is at the user's discretion. Here, we erode our clouds by 50 %, as this amount was experimentally determined to best balance accounting for the propagation of the ice clouds while limiting the amount of non-convective-origin ice cloud that is collected at more relaxed thresholds and sensitivity tests showed that the exact threshold used had little impact on resulting statistics (Fig. A1). In one dimension, this method is exactly equivalent to a minimum-overlap method when the minimum required overlap is exactly the allowed fractional erosion, α (Fig. 4b). But in two or more dimensions, sensitivity to the object shape and direction of motion is reduced (Fig. 4c).
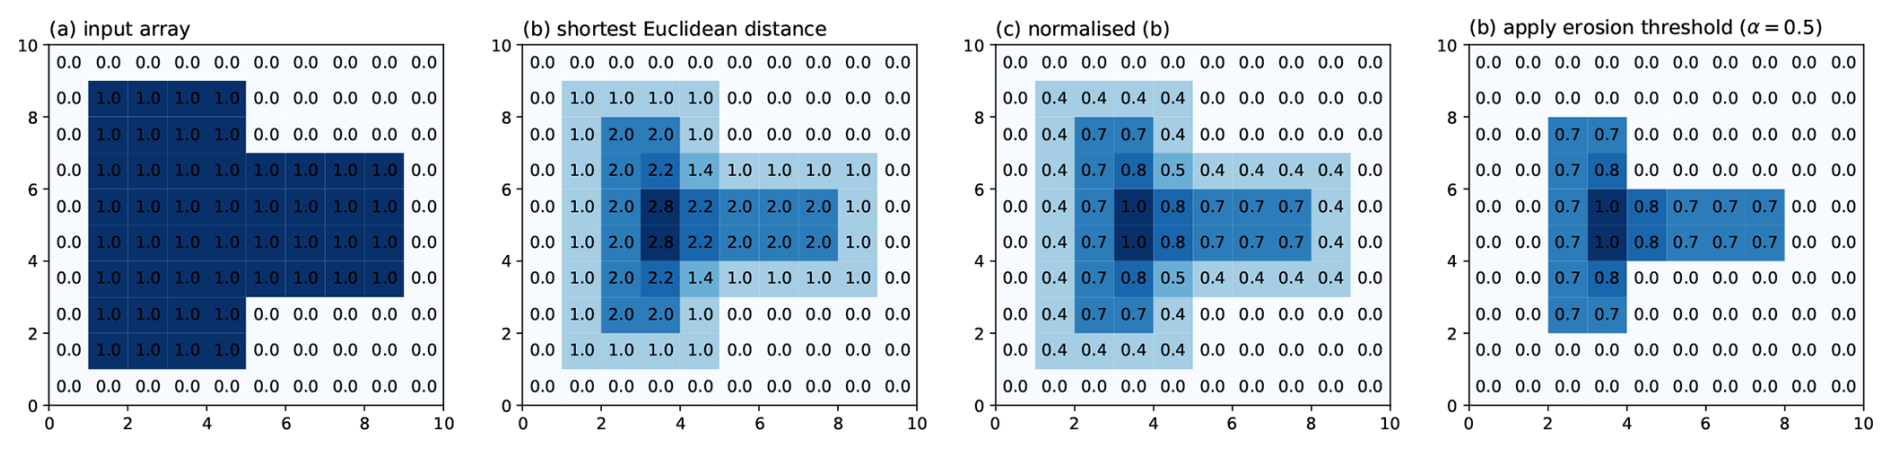
The exact procedure used to erode the objects is described as follows. The object erosion is performed in 2-dimensional horizontal space, each vertical level treated independently. The 2-dimensional object is represented as an array of non-zero integer values in a background zero-valued array (Fig. 5a), . The erosion algorithm is then as follows.
- 1
Perform a distance transformation of the input matrix (Fig. 5b) using the Python scipy package for multidimensional image processing (Virtanen et al., 2020). Each entry in the new array contains the shortest Euclidean distance from the current element to the background (any zero-valued element). Yields .
- 2
Normalise the distance array by the maximum Euclidean distance it contains (Fig. 5c). In a perfect circle, this would be the radius of the circle and the result would be invariant to rotation. Yields .
- 3
Apply the erosion threshold, e.g. α=0.5. All array elements with a normalised distance below the threshold are set to zero (Fig. 5d). Yields or .
Thus, we can retain the advantages of an aggressive minimum overlap threshold while avoiding merging features of distinct convective origin. Note also that more irregular shapes are eroded less by this method compared to those that eroded objects by a fixed number of pixels rather than Euclidean distance.
After erosion, a three-dimensional spatial contiguity check between adjacent times was performed to track the resulting objects. The computational time required to perform this method was comparable to that required to first detect and segment the objects using tobac (Fig. C1). No erosion was applied to the updraft features. Instead, a three-dimensional spatial contiguity check was applied to the updraft features to complement the centroid tracking.
2.2.5 Putting it all together
At this stage, two separate tracking operations have been described, centroid-based and contiguity-based. These have been performed on both the vertical velocity and cloud ice fields. Next, the results of the two operations must be combined. This was achieved by identifying tracked objects from each method that co-occurred in space at any, but at least one, time. For example, if a cloud at some time, t, was tracked by both methods, then the trajectories of each method, which contain cloud detections from preceding or subsequent times, are combined. That means that the total lifetime of the cloud tracked is derived from the union of the two input tracks. By combining the results of both tracking operations, we additionally ensure that objects that may have been “shredded” vertically by the erosion are reconstituted.
Finally, the same method was used to determine the overall deep convective cloud system. To do this, the updraft tracks were compared to the ice cloud tracks, and, as described above, if one co-occurred in space with the other at any time, t, their trajectories were combined and designated to a single overall system. The result is that updrafts can precede the development of the anvil, and the anvil can be tracked beyond the cessation of convection. This method is likely generalisable to shallow convection and broader geographic regions, but may not be helpful in cases where link between the source of hydrometeors and the cloud deck are more complex or inseparable, such as frontal cloud in the mid latitudes or stratocumulus decks.
Updrafts not associated with an ice cloud were ignored, as were ice clouds with no connected updrafts. The final dataset was created by filtering out systems that initiated above the freezing level, persisted for less than one hour, or intersected the domain boundary. An example of a deep convective cloud system tracked by this method is shown in Fig. 6, illustrating multiple developing convective cores, a deep convective tower forming in the mid-to-late afternoon, and the resulting anvil cloud decaying and subsiding after the cessation of convection.
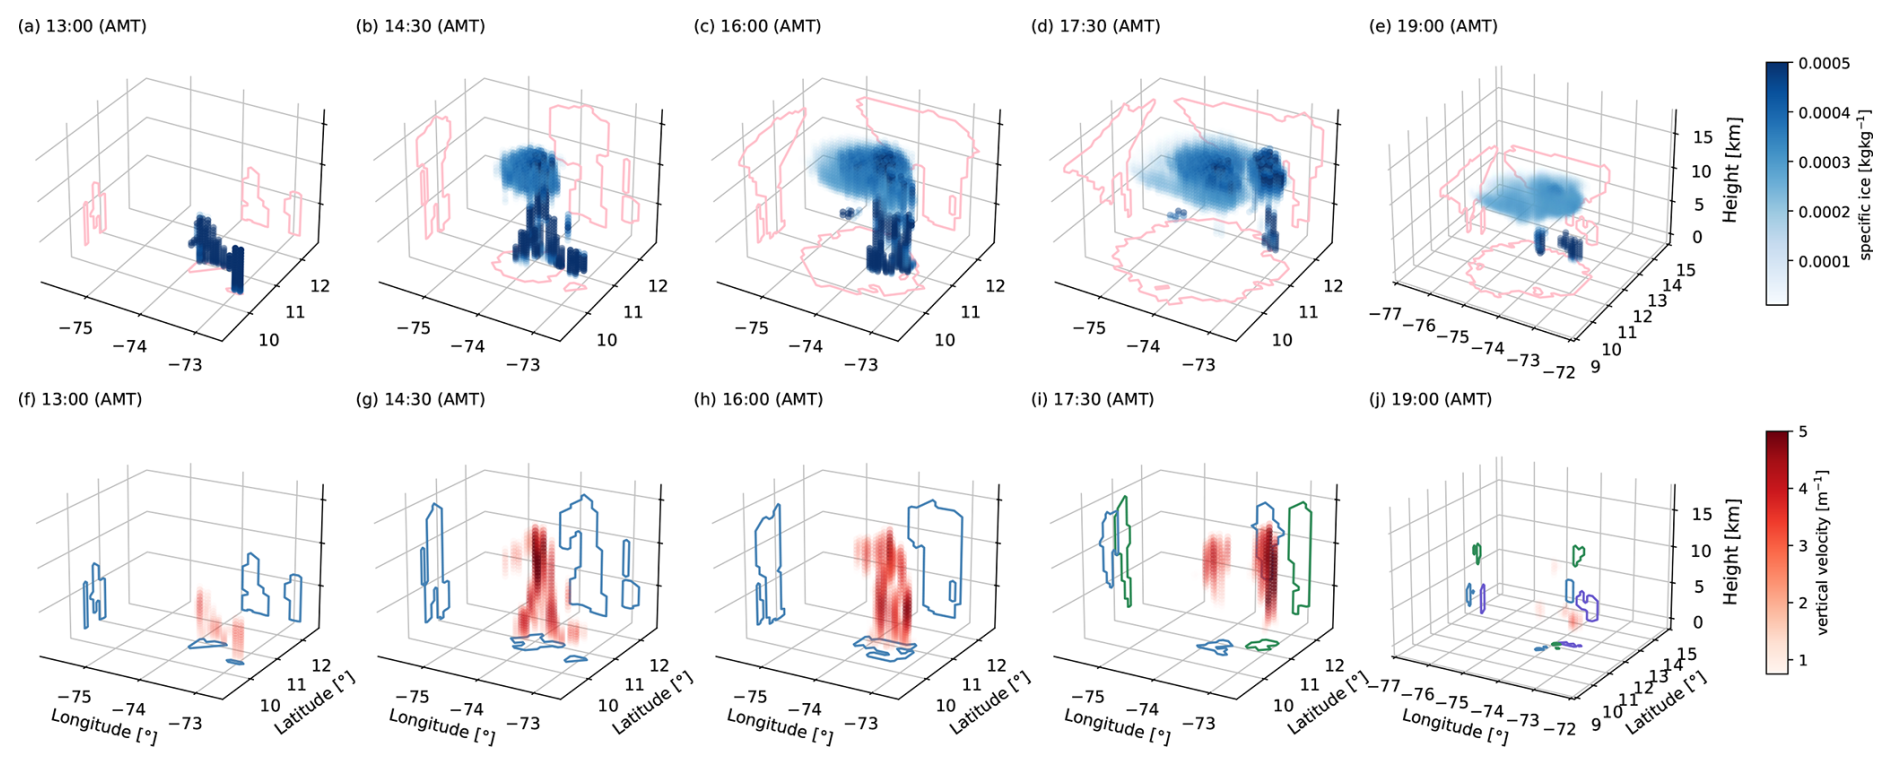
Figure 6Example of a tracked deep convective cloud and its convective cores. (a)–(e) specific cloud ice content (kg kg−1) within the system and (pink) projections of the associated cloud mask. (f)–(j) The convective updraft cores and their vertical velocities (m s−1), two-dimension core mask projections are coloured differently for different tracked cores.
A large majority of updrafts and ice clouds initially detected by the algorithm were associated with a final tracked deep convective cloud system (Fig. 7). A small portion of the identified ice clouds were not tracked (Fig. 7c), as a minimum lifetime of three timesteps was applied (Table 1). No minimum lifetime requirement was applied for updraft tracking, meaning that all identified updrafts were retained. However, not all updrafts were associated with an ice cloud (Fig. 7e). The amount of non-convective ice cloud was greatest at high altitudes and in the late afternoon and evening. At lower levels between 14:00 and 16:00 local time, the area covered by non-ice-producing updrafts was approximately equal to that covered by deep convective cloud updraft cores. These must correspond to cases where the updraft plumes either did not reach the freezing level to produce substantial ice condensate or produced no condensate at all.
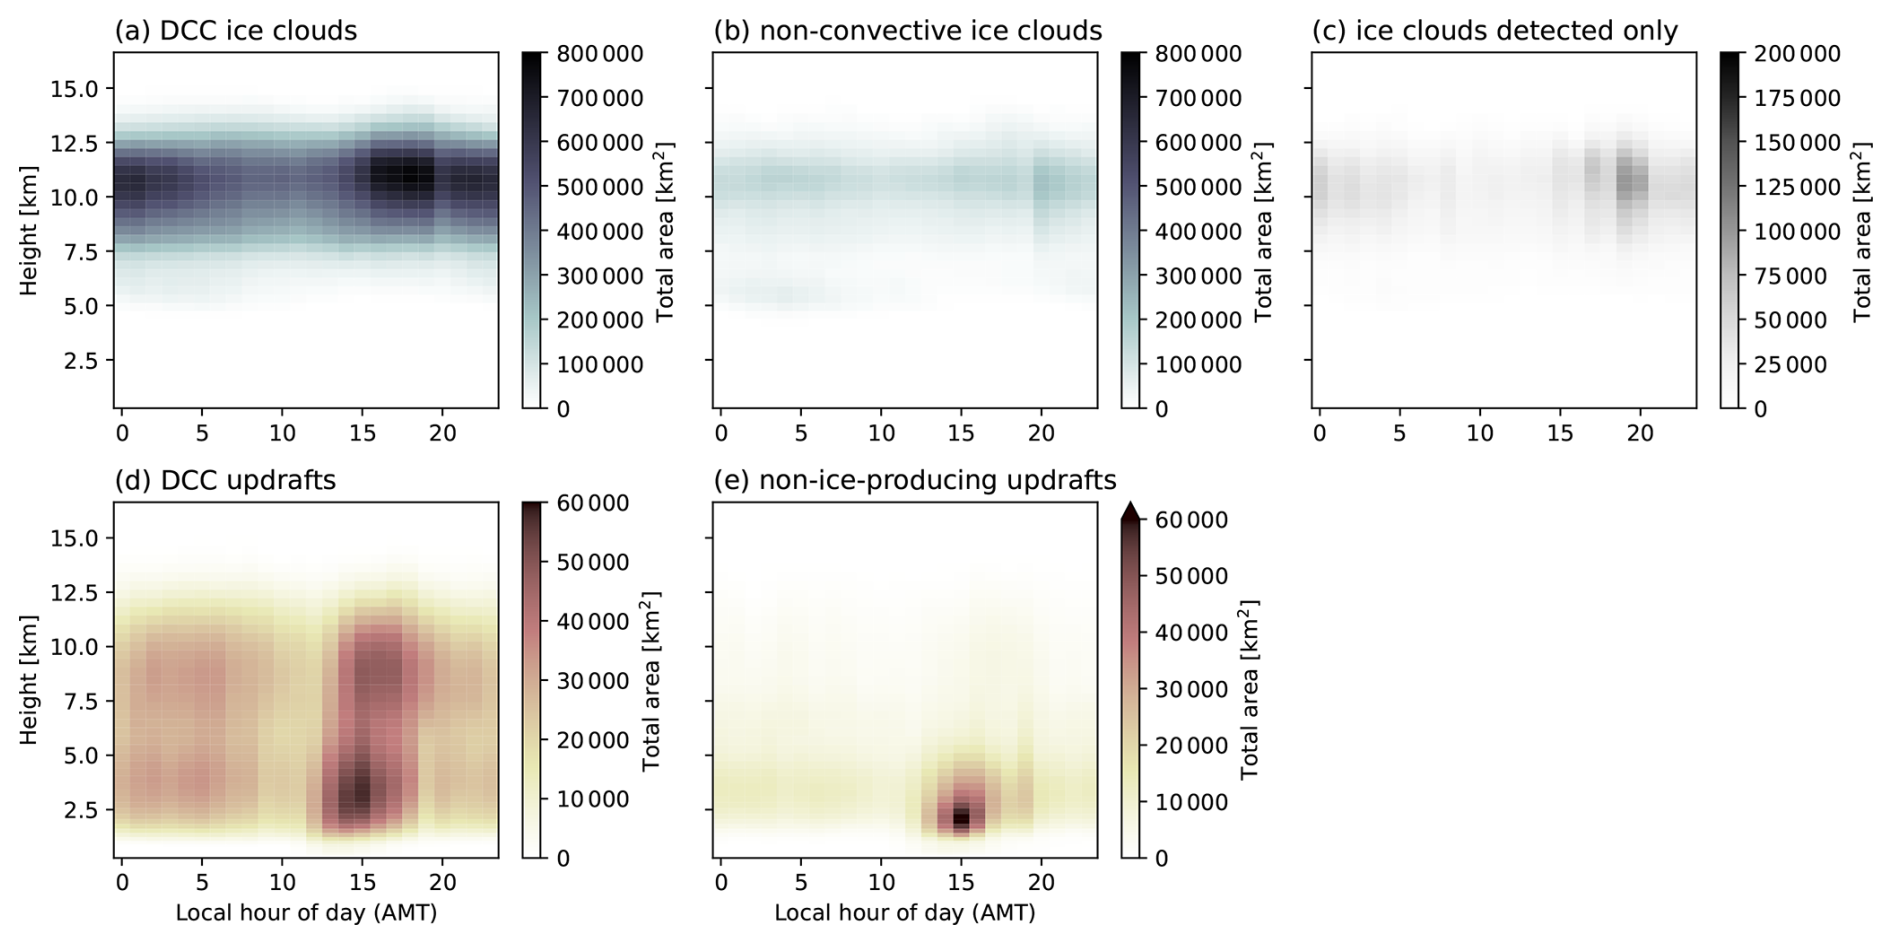
Figure 7(left) Total area covered by tracked deep convective cloud constituent (a) ice clouds, and (d) updraft cores. The area covered by ice clouds tracked but not associated with a convective core is shown in (b) and area covered by updraft cores tracked but not associated with an ice cloud is shown in (e). (c) Shows identified but untracked ice clouds. All identified updrafts were tracked.
2.3 Definition of anvil base height
The anvil base height was defined as the average height of the highest local minimum in the vertical condensate profile. This height agreed well with the height above which vertical velocity was decelerating (this concept is visualised in panel 5 of Fig. 2).
2.4 Definition of isolated and complex deep convective clouds
Tracked DCCs were classified as isolated or complex using the number and arrangement of their convective cores. DCCs with one core, or with multiple subsequent cores at the same location, were deemed “isolated”. DCCs with multiple cores that did not all occur at the same location were deemed “complex”. The term “complex” is used rather than “organised” to acknowledge the possibility that isolated DCCs may have occurred within scenes characterised by large-scale organisation.
3.1 Tracked deep convective clouds in the Amazon
A total of 984 deep convective clouds were tracked over seven days in ICON’s Amazon. Tracked DCCs were most commonly found north of the equator, as expected during the northern-hemisphere summertime (Fig. 8a, b). The number of DCCs peaked daily in the late afternoon and early evening, between 16:00 and 18:00 local time (Fig. 8c). Systems that persisted overnight had larger anvils and more cores on average. The smallest mean anvil sizes occurred around the time of convective initiation, near midday.
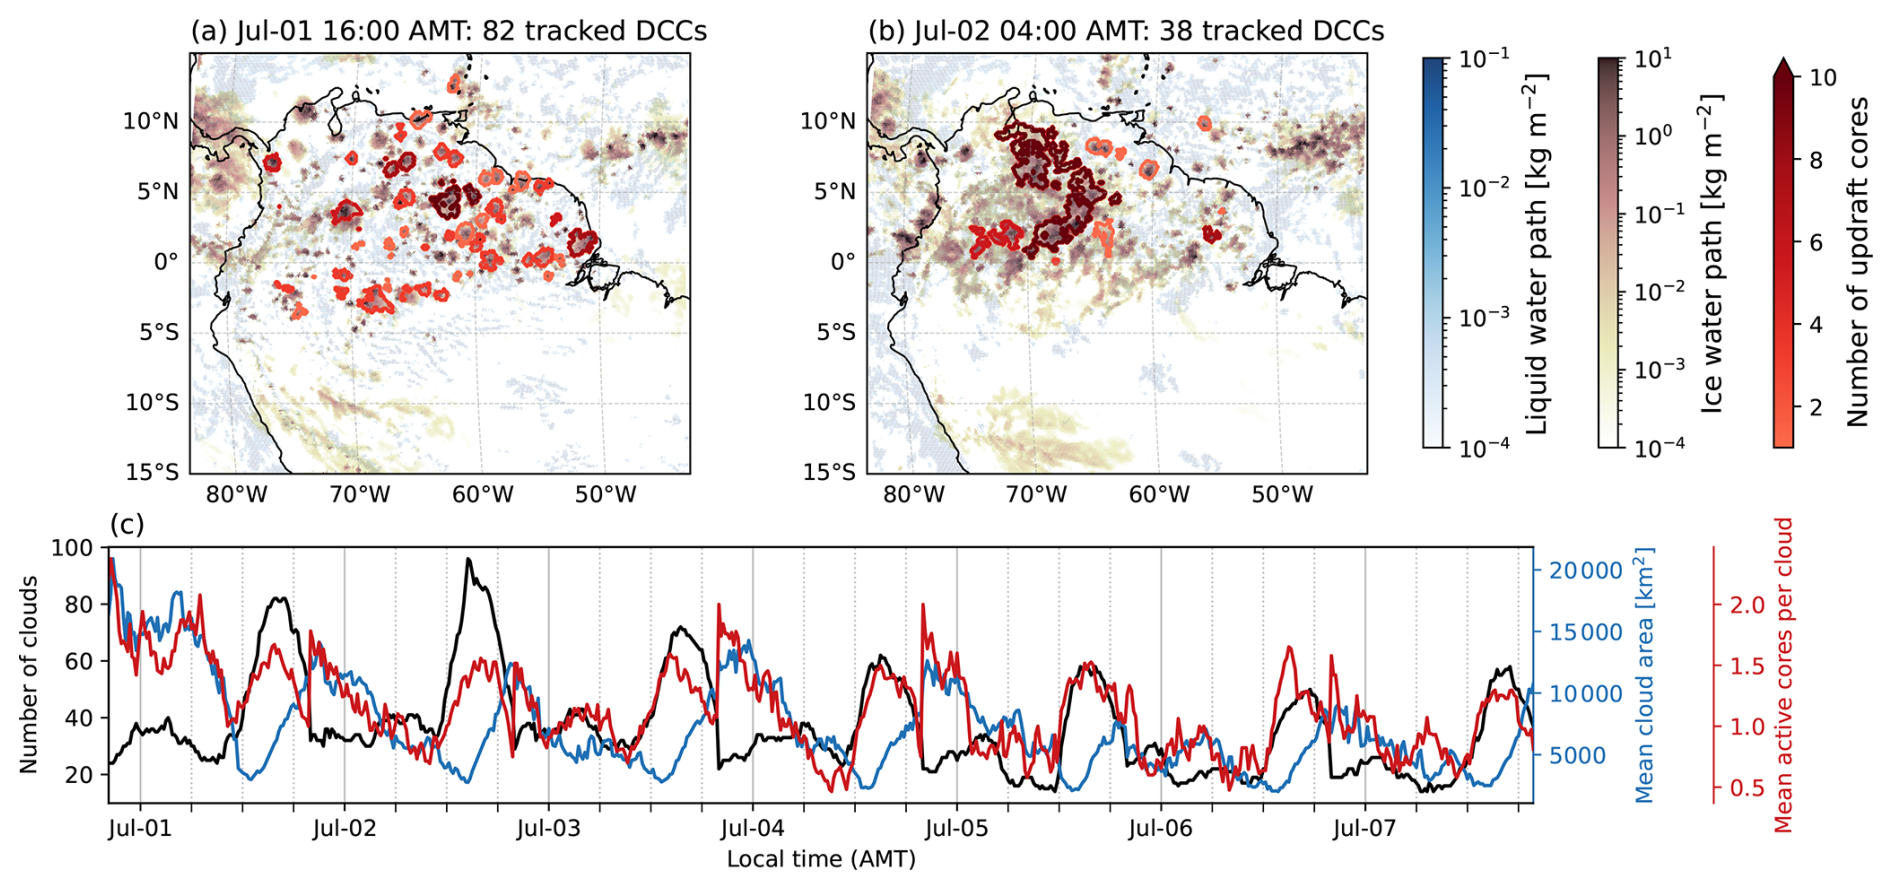
Figure 8Afternoon (a) and early-morning (b) snapshots of liquid (blue) and ice (pink) water path in the ICON model Amazon, with the tracked deep convective cloud extents overlain in red (darker reds correspond to more updraft cores). (c) shows the number of tracked clouds (black), average cloud area (blue), and average number of updrafts per DCC throughout the model week (July 1–8 2021).
The distribution of cloud and convective core bulk properties broadly agreed with those reported from past observational studies (Fig. 9). The sizes of the tracked clouds were within the range of typical reports of DCC size, from O(1000) to O(10 000) km2 for isolated DCCs and O(10 000) to O(100 000) km2 for mesoscale systems (Futyan and Genio, 2007; Feng et al., 2021; Gasparini et al., 2021; Wilcox et al., 2023; Jones et al., 2024). In contrast to these satellite-derived size-distributions, more small and fewer large DCCs were observed. This is as expected, as the observational studies were tailored to mesoscale systems, and biases towards isolated DCCs have been noted in the ICON simulations (see discussion in Sect. 1). The lifetime of the tracked clouds also agreed with observational expectations (Futyan and Genio, 2007; Jones et al., 2024). Isolated systems had shorted lifetimes, most commonly living for about 5 h. Whereas complex DCCs typically persisted for more than 5 h, comparable to the minimum lifetime typically reported for mesoscale systems (Feng et al., 2021; Gasparini et al., 2021). Complex systems were also more likely to have larger anvils and greater anvil thicknesses than isolated cases. The properties of the constituent convective cores were similarly distributed in both isolated and complex systems.
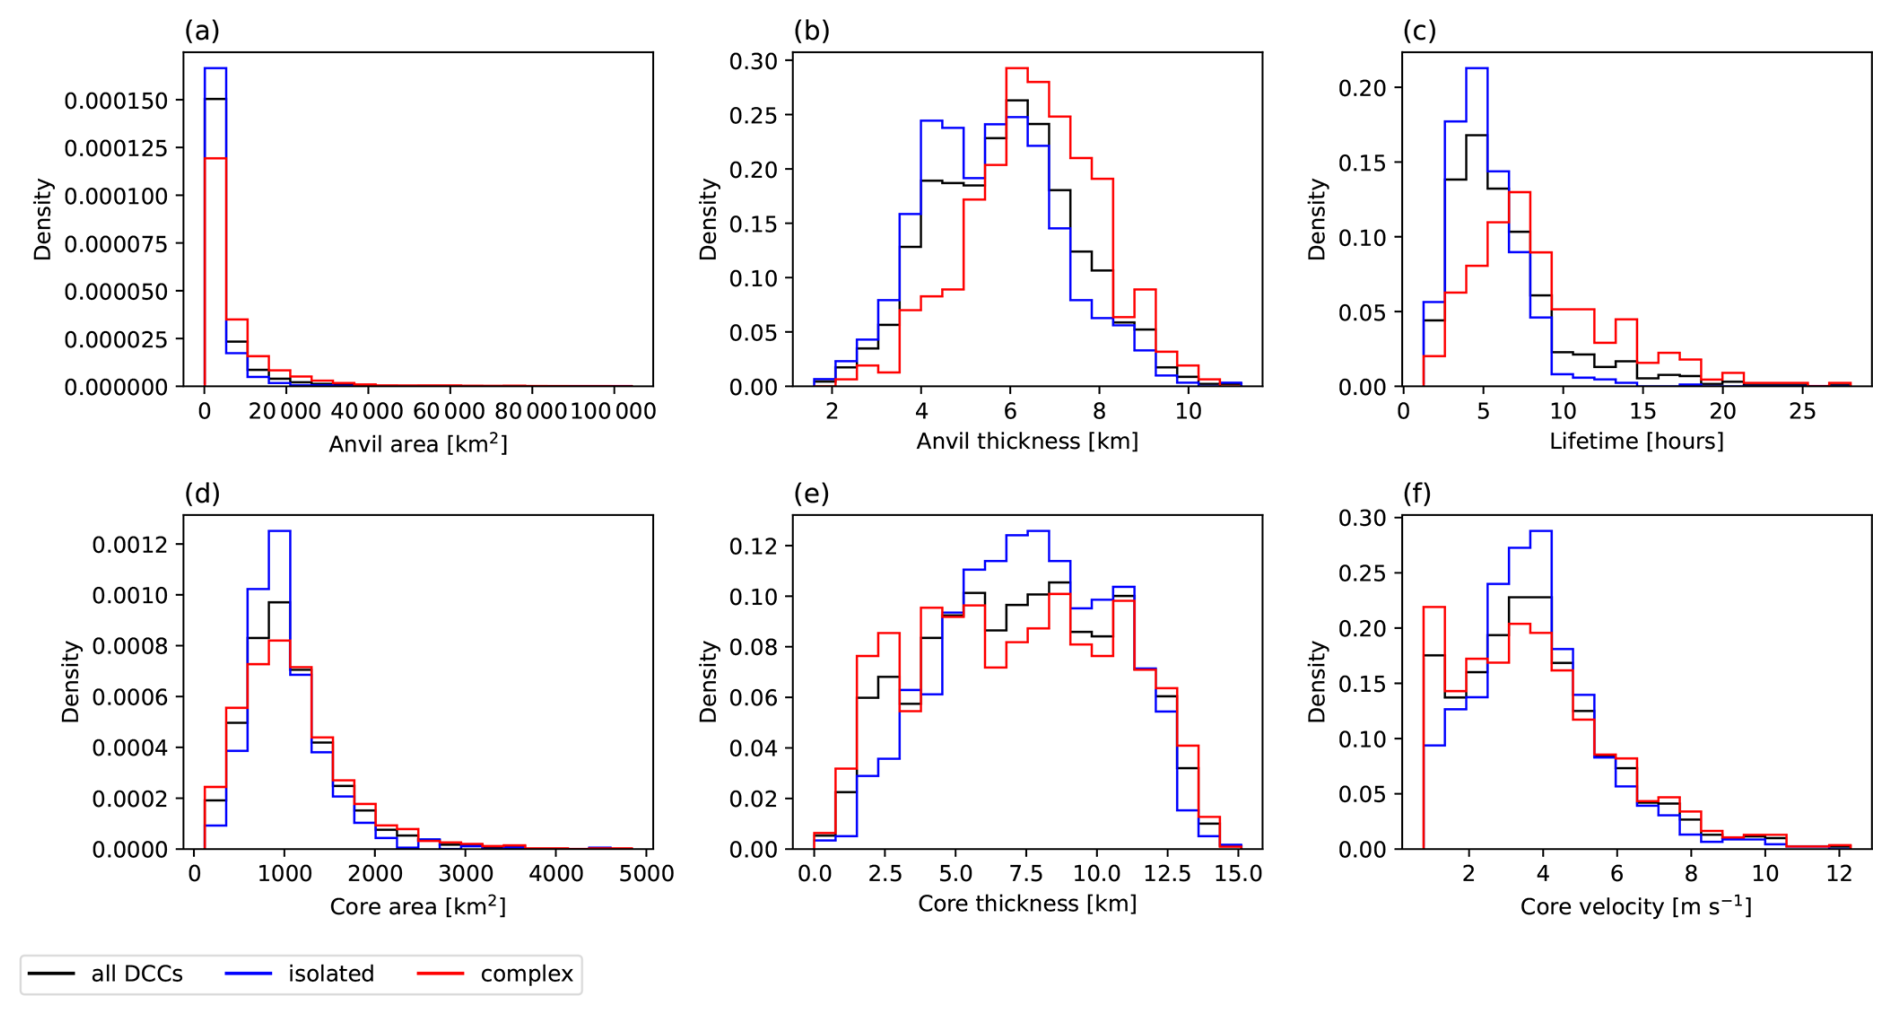
Figure 9Distribution of DCC bulk properties for all (grey), isolated (black) and complex (red) clouds. (a) DCC area, (b) DCC anvil thickness, (c) DCC lifetime, (d) convective core area, (e) convective core thickness, and (f) convective core maximum velocity. Calculated from 984 DCCs tracked between 1–8 July 2021 in the ICON model Amazon.
All tracked anvils detrained at or above the typical tropospheric freezing level (6–9 km) and below the temperature inversion (16 km) (Fig. 10). Anvils with higher top heights tended to belong to complex, rather than isolated, DCCs. The peak in anvil top heights in complex systems was about 1 km higher than that observed for isolated cases. The derived base height of the anvil clouds ranged from less than 6 km to approximately 9 km, at freezing. The constituent convective cores predominantly arose at heights between 1–2 km above the surface. However, 11 % of the tracked cores had base heights above the freezing level, at about 8 km. These upper level cores predominately occurred in complex DCCs and were more likely to be associated with the most complex systems that had the highest number of cores, largest maximum extents and longest lifetimes. While most cores penetrated the detrainment level, some saw top heights at lower levels and may have been inhibited around the freezing level.
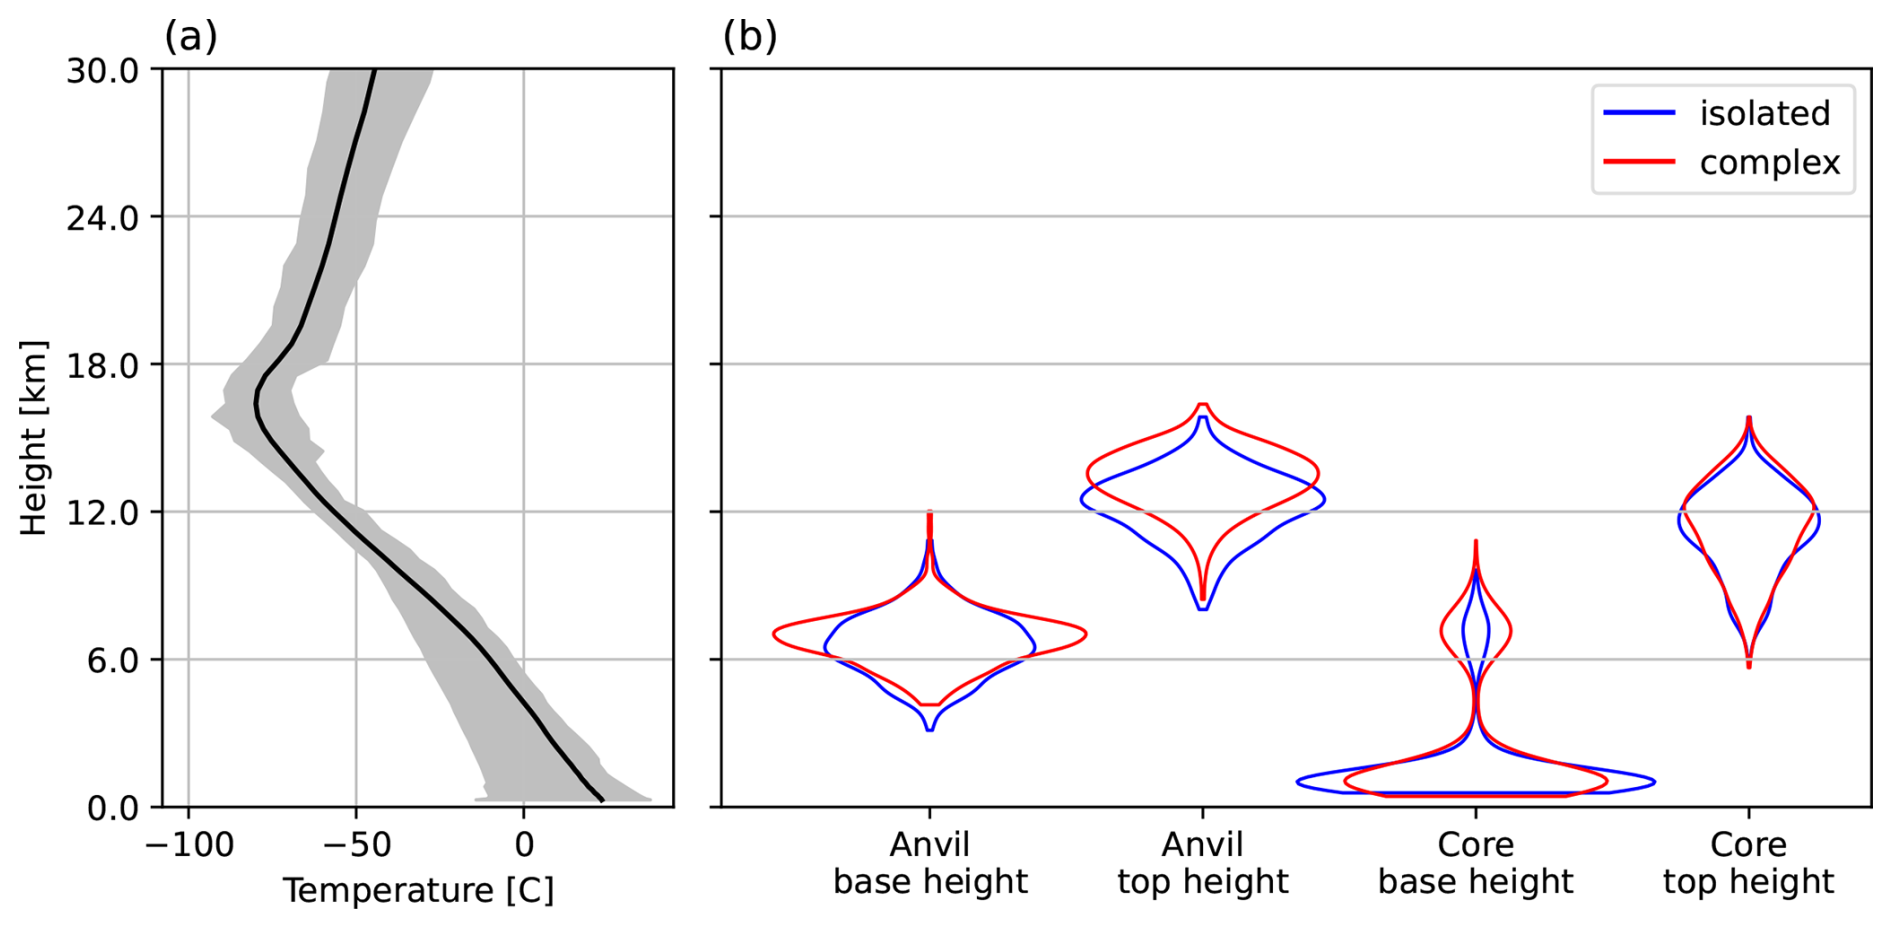
Figure 10(a) Mean (black) and range (grey) of the background atmospheric temperature profile in the study domain, and (b) symmetric probability density functions of anvil base height, anvil top height, core base height, and core top height. Calculated from 984 DCCs tracked between 1–8 July 2021 in the ICON model Amazon.
Past tracking studies have reported that peak areal extent for DCCs and mesoscale systems typically arises at 50 %–70 % of the cloud lifetime (Roca et al., 2017; Wall et al., 2018; Gupta et al., 2024). In this study, cloud extent peaked at approximately 80 % of the cloud lifetime (Fig. 11). This tells us that a larger portion of the cloud decay stage went untracked in our dataset than those used in previous works. This explanation is supported by the relatively large cloud areas reported at the end of the normalised cloud lifetimes. This reflects the compromises made between sensitivity to ice and robust tracking across time in the four-dimensional dataset, which meant fewer objects tracked but ensured the tracks obtained were more robust.
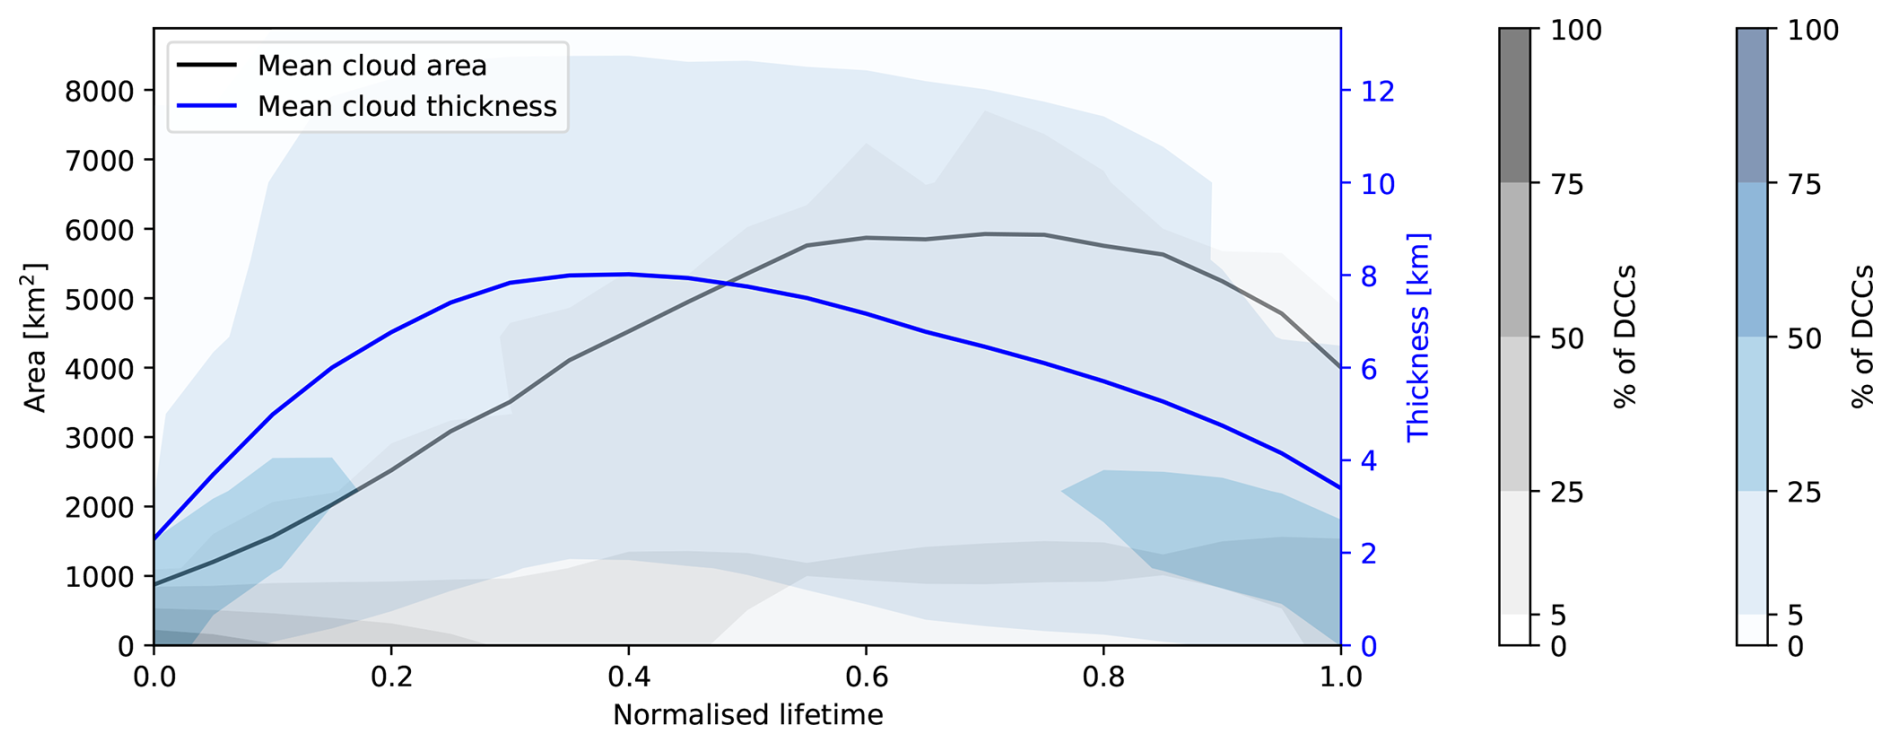
Figure 11Composited DCC area (black) and thickness (blue) evolution over cloud lifetime. Shading indicates the percentage of DCC within each value rage at each lifestage. Calculated from 984 DCCs tracked between 1–8 July 2021 in the ICON model Amazon.
3.2 Convective controls on anvil cloud properties
Isolated DCCs were the most common type tracked (Fig. 12a). Those with two convective cores were equally likely to be either isolated or complex. Convective core maximum velocity was strongly related to convective core thickness (Fig. 12b). At core thicknesses of 8–10 km or less, the relationship between thickness and velocity was approximately linear. However, the overall relationship between core velocity and thickness was logarithmic, with a subdued response at high values, corresponding to the point at which convective towers reach the tropopause stable layer. The Pearson correlation coefficient (R2) between convective velocity and thickness was 0.88. Convective core velocity and area were also positively correlated (Fig. 12c), with a lower R2 score of 0.67. Weaker updrafts were associated with smaller cores, and stronger updrafts tended to occur within larger cores. However, the range of observed updraft velocities in larger cores was broad. For example, cores larger than 2000 km2 saw maximum velocities ranging from between 3–12 ms−1.
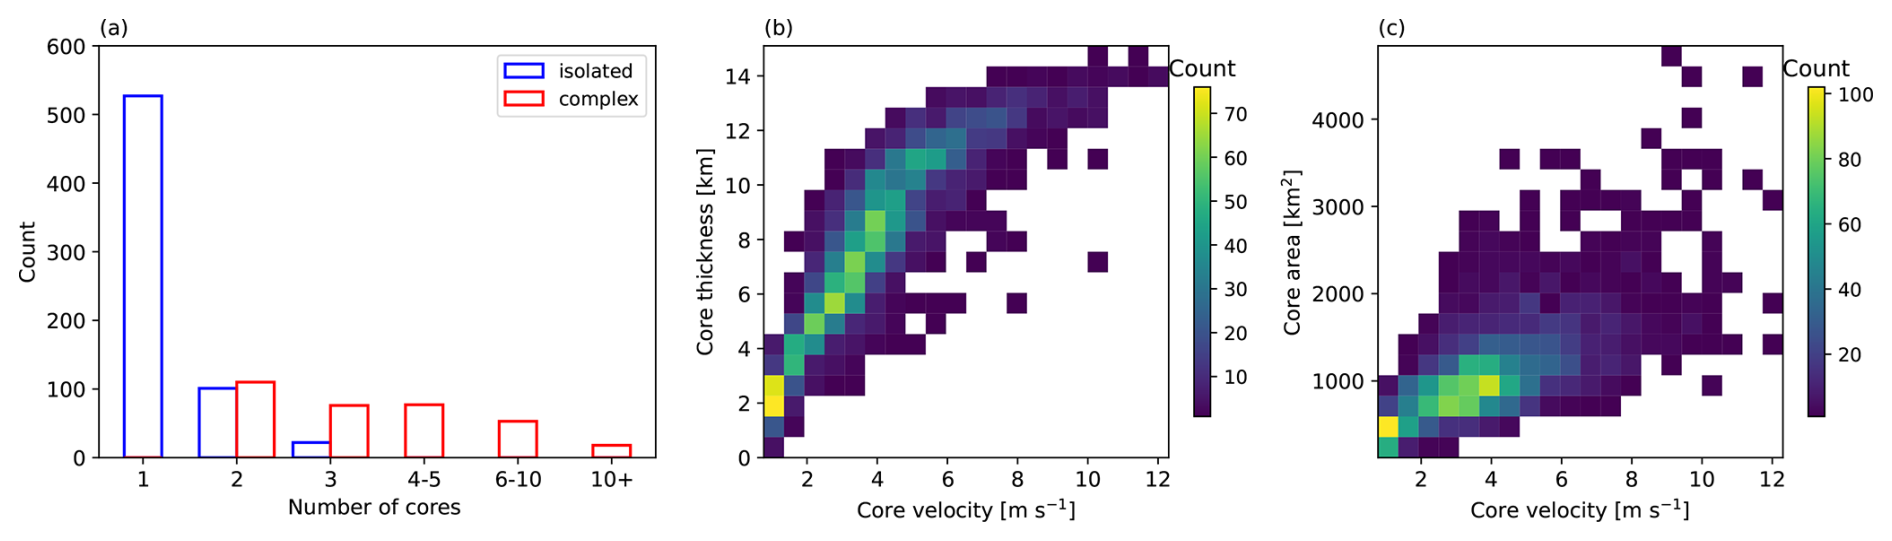
Figure 12(a) The number of DCCs with a given number of convective updraft cores. A DCC was isolated if all constituent cores occurred in the same location, otherwise, it was complex. Two-dimensional histograms of (b) core velocity and thickness, and (c) core velocity and area. Calculated from 984 DCCs tracked between 1–8 July 2021 in the ICON model Amazon.
Figure 13 presents phase-space diagrams of five anvil cloud properties. The results show how each anvil property varied with the mean properties (maximum velocity and area) of its convective cores. Wider cores and faster velocities were associated with increased anvil top heights. The highest anvil base heights were associated with the weakest and most narrow cores as well as the strongest and largest ones. Figure 10 showed that higher anvil base heights were more likely to be associated with complex systems, so this result may indicate that while stronger more widespread convection can be associated with more organised systems, these cases can also support weaker, smaller convective contributions. Anvil geometric thickness increased with increases in both convective core velocity and area. This dependence must result from increases in anvil top height, as no consistent change in anvil base height was found as updraft intensity and area increased. The longest DCC lifetimes were associated with the largest convective cores and the shortest lifetimes occurred with the smallest and weakest cores. However, when convective area was unchanged (a single row in Fig. 13e), DCC lifetime tended to decrease with increased updraft intensity.
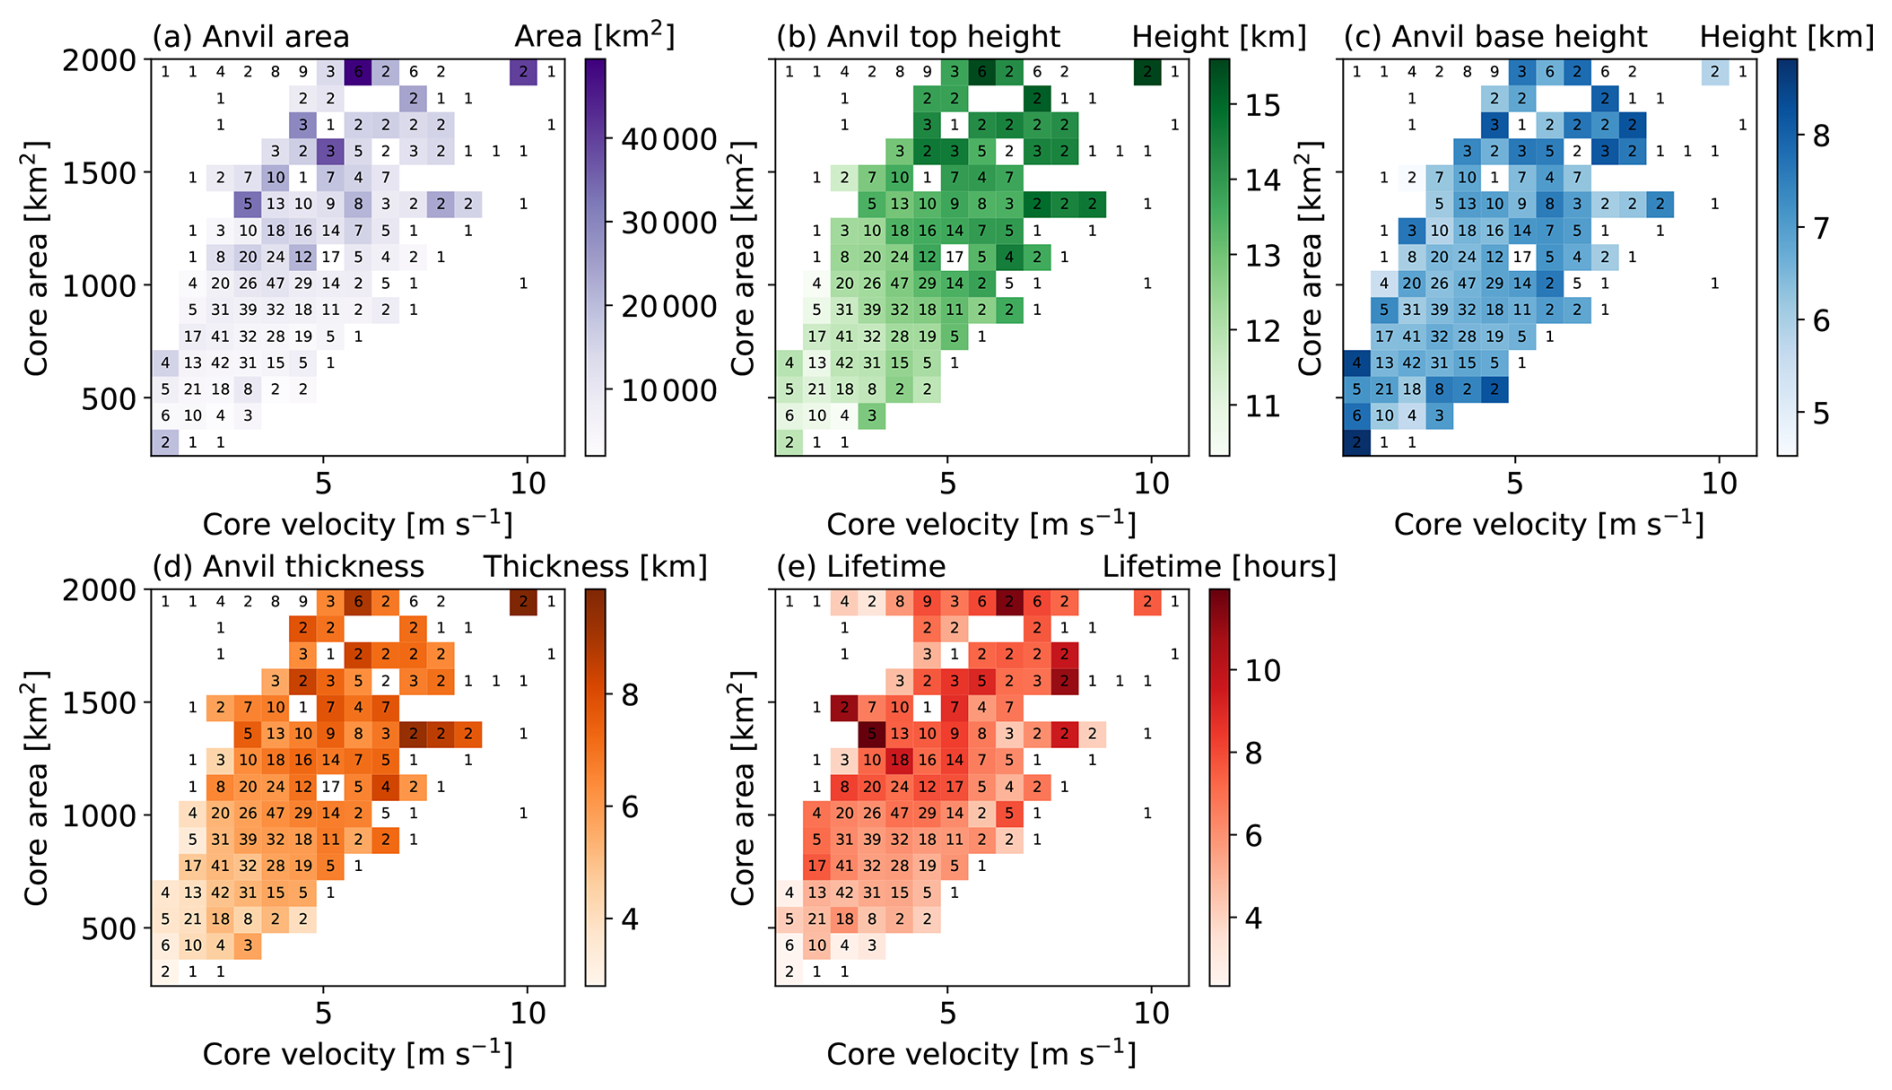
Figure 13Convective core velocity-area phase space diagrams. For multicore systems, the average of the maximum core area and velocity in each core were used. Each velocity-area bin is shaded by the average anvil property of all DCCs within that bin. Results are presented for DCC anvil (a) maximum area, (b) maximum top height, (c) minimum base height, (d) maximumm thickness, and (e) lifetime. Calculated from 984 DCCs tracked between 1–8 July 2021 in the ICON model Amazon.
Increases in both core velocity and size were associated with larger anvil areas (Fig. 13a). However, despite these two convective parameters being closely related (Fig. 12), Fig. 13a shows that that increases in convective area were more consistently associated with larger anvils than faster updrafts. Convective area was also more strongly correlated to anvil extent than convective velocity, with R2 scores of 0.43 and 0.26, respectively. This result is further explored by contrasting the response of the anvil extent to the updraft intensity and area over the full DCC lifecycle.
Composites of the mean evolution of tracked DCCs are presented in Fig. 14. The results are partitioned by the 50th percentiles of core size and velocity. In systems with narrow cores (those in the bottom 50th percentile of core size), stronger updrafts increased maximum anvil area by 10 %. In contrast, stronger updrafts increased maximum anvil area by 42 % in wide cores. In both cases, the pickup in anvil area occurred slightly later in the typical lifecycle when updraft intensity was greater, and the rate of anvil expansion during development was greater. The bottom row of Fig. 14 flips this analysis. In systems with weak updrafts (those in the bottom 50th percentile of core maximum velocity), larger convective areas were associated with an 86 % increase in anvil maximum extent. In those with strong updrafts, larger convective areas corresponded to a 106 % increase in anvil maximum extent. In summary, the response of anvil extent to convective area was greater than the response to updraft intensity. Further, the response of anvil extent to updraft intensity was 4 times greater when the convective area was in the upper 50th percentile. Sensitivity tests found that the greater response of anvil extent to convective intensity in wide cores was robust to changing measure of convective intensity and the velocity threshold used to define the convective core (Fig. B1).
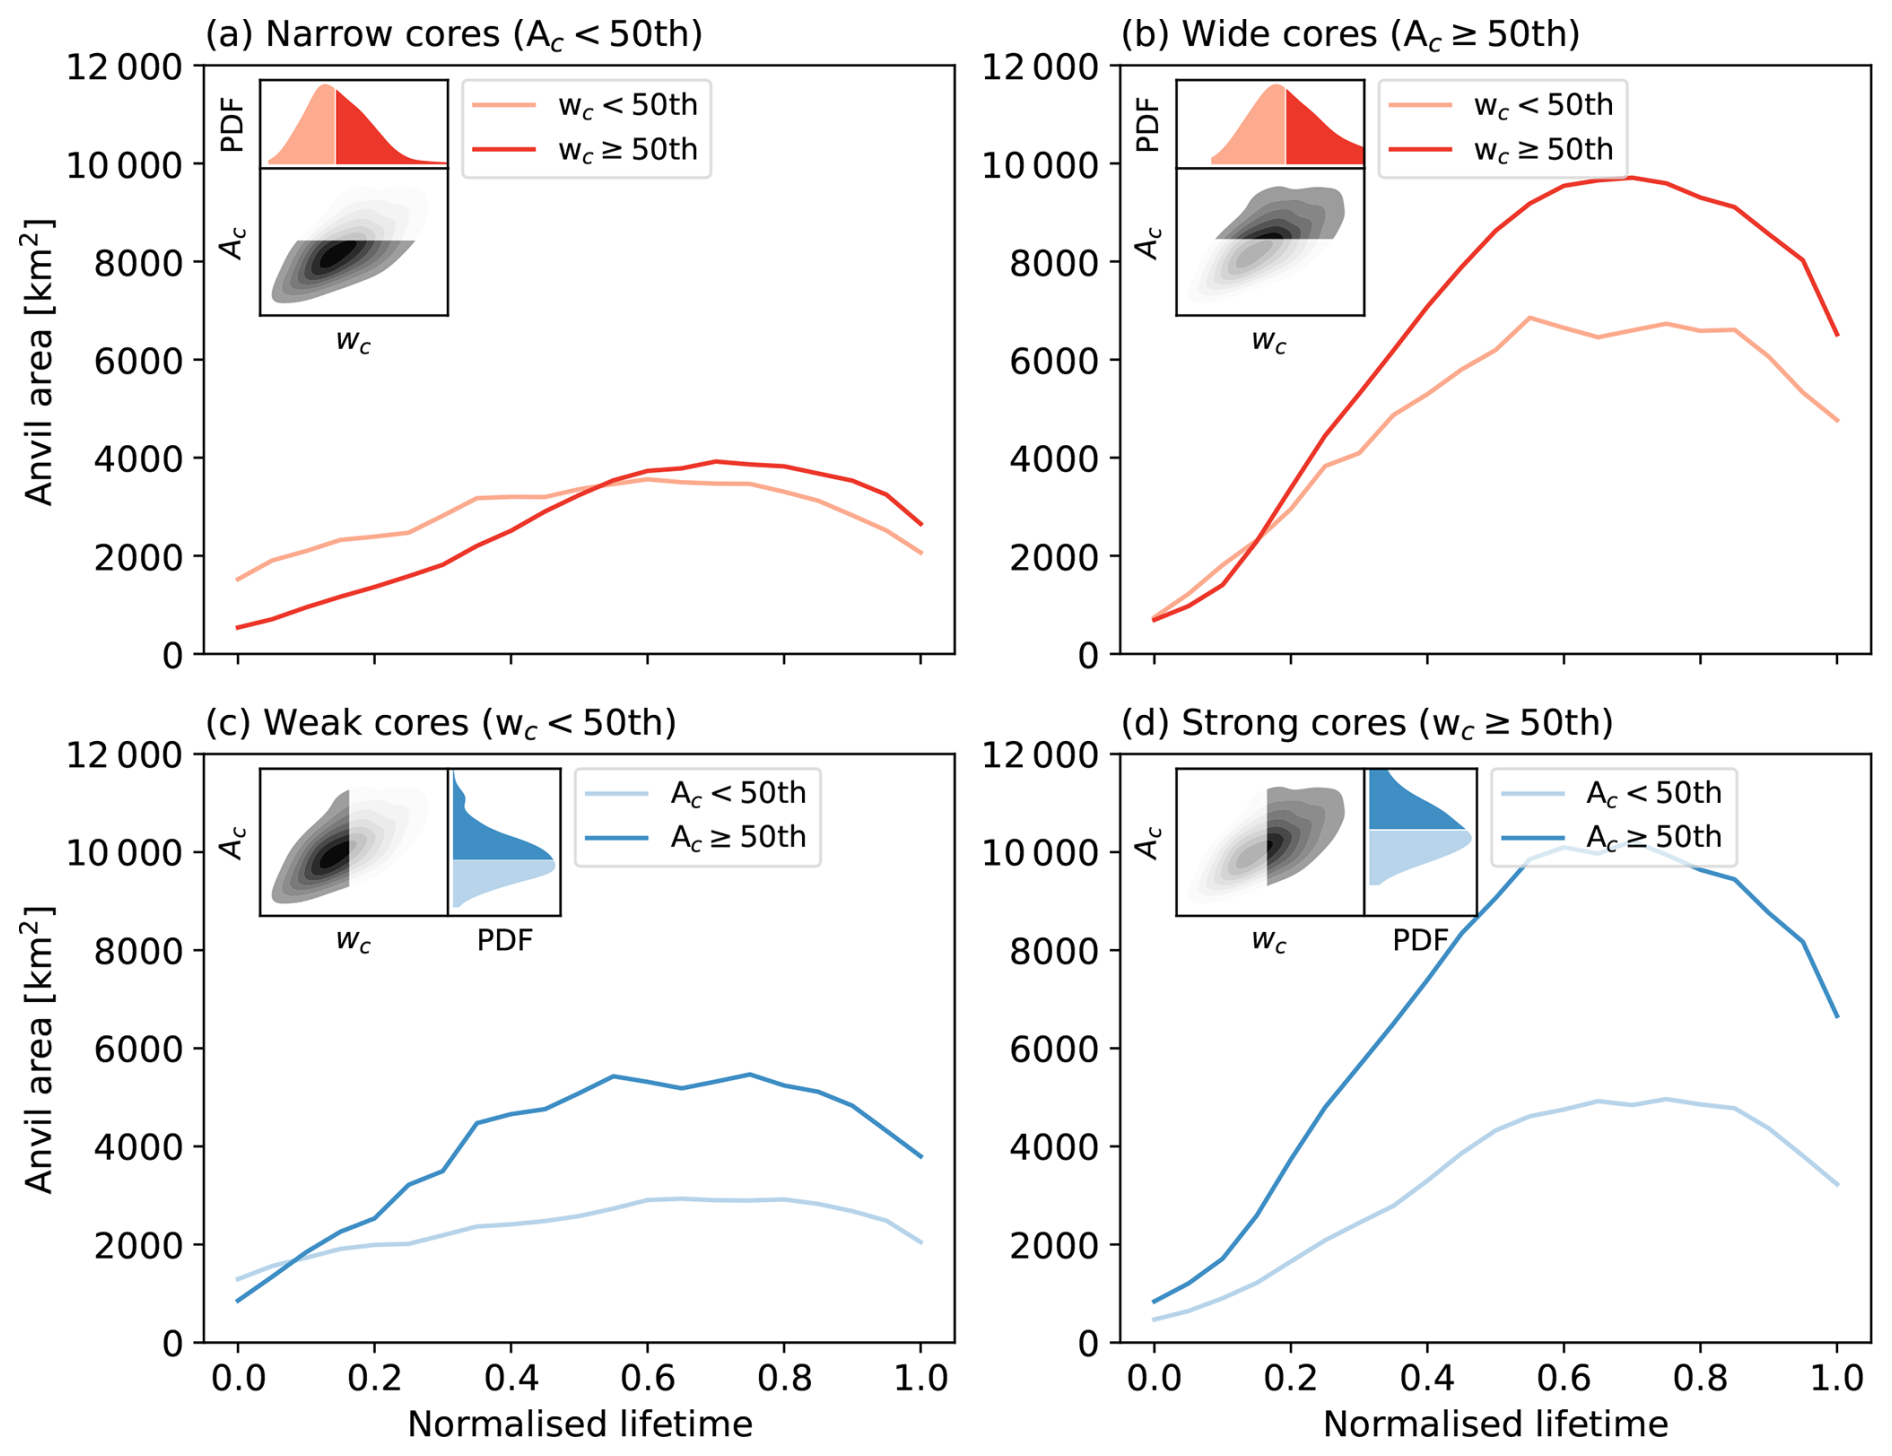
Figure 14Mean evolution of DCC area by normalised cloud lifetime. (top) Results are partitioned by core size: (a) narrow and (b) wide, showing results for stronger and weaker vertical velocities within each partition. Conversely, (bottom) results are partitioned by core velocity: (c) weak and (d) strong, showing larger and smaller cores within each partition. Calculated from 984 DCCs tracked between 1–8 July 2021 in the ICON model's tropical Amazon.
Additional statistics were assessed to provide an indication of the associated changes in related convective and anvil processes under systems with narrower or wider cores. The increase in the estimated peak convective mass transport (maximum core velocity times area) due to faster updrafts was similar in narrow and wide cores, 89 % and 100 %, respectively. The degree of DCC organisation (the partition as isolated or complex and the number of constituent convective cores) was largely unchanged between the narrow and wide cases. There was no substantial change in the total amount of convective and stratiform precipitation with intensity in either the narrow or wide partitions. However, convective precipitation increased by 113 % in narrow cores and by 70 % in wide cores.
The total area covered by anvil clouds in the tropics is projected to decrease under future warming scenarios (Sherwood et al., 2020) and changes in clear-sky divergence cannot alone explain the expected changes to anvil coverage (Bony et al., 2016; McKim et al., 2024). Observational assessments have shown that anvil extent is positively correlated to proxies for convective intensity (Machado and Rossow, 1993). Greater convective intensity is associated with greater vertical mass transport and deeper penetration into the troposphere (Emanuel, 1994), and observational and cloud-resolving modelling studies have found that the depth of convection is well correlated to the initial spreading rate of anvil clouds (Futyan and Genio, 2007; Senf et al., 2018). However, the correlation between convective intensity proxies and maximal or instantaneous anvil size has been observed to be weaker when sampling the full lifecycle, and stronger correlations have been recorded between anvil size and the convective or precipitating area (Yuan and Houze, 2010; Li and Schumacher, 2011). We explore this nuance in Sect. 3.2, by contrasting the impact of these two interdependent convective parameters on anvil evolution in the ICON convection-permitting simulations.
We find anvil extent was more highly correlated to convective area than to updraft intensity, with Pearson correlation coefficients of 0.43 and 0.26, respectively. This is consistent with past results from regional-scale observational assessments that use proxies for convective intensity, while here we use the average of the maximum vertical velocity within each three-dimensional convective core. A probable contributor to this result is that larger convective areas more greatly increase the convective mass transport than faster velocities, meaning greater vertical mass displacement and more anvil spreading. However, our results indicate additional nuance in the convective contribution to anvil extent, as the relative response of anvil extent to convective intensity was stronger in cores in the upper 50th size percentile than those in the bottom 50th (Figs. 14 and B1). Further, this difference was not explained by a comparable relative change in the convective mass transport between the two samples, as the relative change in peak convective mass transport with stronger velocities was approximately 90 %–100 % in both narrow and wide cases (Fig. 14).
Several physically plausible mechanisms may account for the weaker response of anvil extent to convective intensity in narrow cores, although the analyses conducted cannot elucidate which process or processes were responsible. Increased fractional entrainment in narrow cores can reduce in-cloud buoyancy due to mixing with surrounding dry air (Hernandez-Deckers and Sherwood, 2016), potentially shortening the duration of convection by more quickly dampening vertical accelerations. Entrainment rates are typically underestimated in km-scale simulations (Jeevanjee and Zhou, 2022), however this does not imply that the relative influence of mixing on cloud development for different convective areas is inconsistent. The development of downdrafts and cold pools can suppress or completely cut-off regions of uplift, particularly under low wind shear (Byers and Braham, 1949), but while these features have been demonstrated in higher resolution ICON runs (Weiss et al., 2025), at the 10 km resolution presented here their presence and interaction with the simulated clouds may be underestimated. Increased precipitation efficiency is another mechanism that may weaken the link between intense convection and anvil extent, by reducing the mass transported to the anvil. Increased precipitation is associated with more intense convection (Ge et al., 2024), and we found a greater relative increase in precipitation with intensity in narrow cores than in wide ones. However the efficiency of this compared to the moisture and hydrometeors that are candidates for fall-out depends on both environmental and in-cloud processes, which may or may not depend on the size of the convective area. Further analysis would be required to indicate whether these or other mechanisms predominantly drive the weaker response of anvil extent to convective intensity in narrow cores.
More generally, the relationship between convection and anvil evolution is not one-to-one (Zipser, 2003); the mapping between convective uplift and the size, structure and radiative effects of the resulting anvil outflow depends on the collective influence of many thermodynamic processes from the micro- to meso-scale (Gasparini et al., 2023). For example, Ge et al. (2024) found that oceanic anvils grew more relative to their convective area than those found over land, highlighting the importance of the near-surface and the environment in which convection arises. Additionally, the timing of convection in the diurnal cycle has been shown to modify anvil radiative heating profiles, thereby influencing anvil lofting and, as a result, anvil lifetime and extent (Sokol and Hartmann, 2020; Gasparini et al., 2022). Local relative humidity at mid-levels modifies the impact of entrainment-driven buoyancy dilution in convective cores (Varble et al., 2024) and wind shear is associated with increased convective organisation and larger cloud shields (Feng et al., 2012; Igel and van den Heever, 2015). The extent to which the coincident influence of these process contributes to the different evolution of strong and weak anvil clouds in narrow and wide convective cores in this study could be preliminarily assessed by further partitioning of the simulated cases. However, a robust effort would require a larger simulation domain to sample more cases in more convective environments, which is relegated to future work or the motivated reader. Instead, we re-emphasise that the results presented in Fig. 14 were consistent across samples of both isolated and complex convective systems, suggesting that convective organisation, which is correlated to increased shear and environmental moisture, did not explain the observed response in the dataset analysed.
Further, these results have not accounted for the influence of in-cloud processes that can also modify anvil evolution and structure. Regional observational and modelling has shown aerosol loading can modify cloud microphysical processes and precipitation rates, resulting in large changes to convective development and anvil cloud evolution and radiative properties (Koren et al., 2010; Herbert et al., 2021; Herbert and Stier, 2023). The relative importance of these effects is difficult to disentangle, however. For example, cloud-resolving model inter-comparison experiments modifying aerosol loading have found the response of anvil ice loading to be highly varied between models, even disagreeing on the sign of the change (Saleeby et al., 2025). The microphysical processes themselves additionally depend on in-cloud heating profiles, excitation by gravity waves and upper-level humidity, all of which can alter ice sedimentation and sublimation rates, new ice production, and spreading (Gasparini et al., 2019). Addressing the contribution of these processes may be progressed using microphysical and aerosol perturbation experiments with higher resolution simulations than the ICON version employed here. Such efforts may help elucidated the relative importance of these small-scale changes in determining when and why basic relationships between convection and anvil spreading hold true and fall short.
The objectives of this study were to improve our understanding of how convective processes determine the characteristics of deep convective anvil clouds and to advance existing tracking algorithms to reliably follow deep convective clouds in three-dimensional space from initiation to decay. The main outcomes are highlighted as follows:
-
We have introduced an advancement to existing cloud tracking methods that allows cloud overlap to be assessed in a manner that is less sensitive to the shape and direction of motion of each object.
-
Using this development together with the tobac cloud tracking algorithm, we present a robust means of tracking deep convective clouds, as well as their convective cores and anvil outflows, in the full dimensionality in which they evolve.
-
The size of the convective core was more strongly related to increased anvil extent than the intensity of the convection itself, and wider cores saw greater increases in anvil area in response to stronger vertical velocities than narrow cores. This finding, discussed in Sect. 4, is consistent with the premise that larger convective areas support the development of large deep convective clouds through mechanisms beyond associated increases in convective mass transport alone.
Also assessed, were relationships between convective parameters and the bulk properties of deep convective clouds in ICON. Consistent with existing observational literature (e.g., Jones et al., 2024), multicore DCCs were more likely to have larger, higher, and longer-lived anvils. More intense convection was associated with deeper convective cores, higher anvil top heights, larger, and thicker anvils. Convective core size was similarly associated with increased anvil top height, and larger, thicker anvils, and longer-lived systems. These results add to the existing literature by linking convection and anvils as measured by the simulated cloud dynamic and moist fields themselves rather than observational proxies and using information throughout the full vertical column. Past studies that have evidenced direct relationships between convective intensity or area and anvil characteristics are built upon by contrasting the response of anvil characteristics to the joint influence of intensity and area, revealing that increases in both parameters were associated with higher cloud tops but that faster updrafts tended to be associated with decreased DCC lifetime among cores of comparable size.
While convective processes are clearly linked to the properties of the anvil clouds they produce, the evolution of anvil clouds is determined by the collective interaction of these and many other environmental, dynamic, and microphysical processes (Gasparini et al., 2023). Thus, the relationships presented here may change in strength or may not be universal under differing large-scale environments, and this is discussed in more detail in Sect. 4.
Additionally, the model representation of these processes may result in an over or underestimation of the realistic response of anvil evolution to convective transport. For example Jeevanjee and Zhou (2022), show total anvil amount decreases with increasing model resolution, suggesting that anvil production here may be overestimated compared to simulations in which turbulence is more highly resolved. In contrast, adopting a two-moment microphysical scheme instead of the single-moment scheme employed in the NextGEMs simulation assessed may imply that anvil production is underestimated, as studies have shown an increase in total ice under two-moment microphysics (Igel et al., 2015), including in the ICON model (Sela et al., 2025). Additionally, differences in the lifecycle of cloud ice from Lagrangian, rather than domain-mean, perspectives in response to different overall model configurations and aerosol loadings are highly variable, even disagreeing on the sign of the change (e.g., Saleeby et al., 2025). Overall, these uncertainties (i) emphasise the continued need to constrain the sensitivity of large-scale cloud properties to small-scale processes and (ii) indicate that the exact scalings reported between convection and anvil properties are likely inexact. However, the universality of these biases within the model suggests that the relative scaling between narrow and wide cores is qualitatively robust, and this claim is further supported by sensitivity tests performed to methodological choices and different measures of convective intensity.
Thus, the greater dependence of anvil expansion on convective area demonstrated in this study provides an important basis for future process-level investigations into how convection controls the characteristics of anvil clouds most relevant for radiation and climate. This result implies that a reduction in the typical size of convective cores or in the intensity of convection in a future climate would see a reduction in high cloud area, and that changes in the frequency of larger convective cores may cause a greater reduction. We also found that both convective area and velocity were associated with greater anvil thickness, which then implies that a decrease in either convective property would reduce both anvil extent and anvil thickness. These results suggest that changes in tropical convection are a plausible mechanism for anvil cloud thinning, meaning that if the frequency of larger, stronger convective clouds reduces (e.g., Bolot et al., 2025), the net radiative effect of tropical deep convection may shift to more positive values and result in a more positive feedback on the rate of warming than previously supposed (Sokol et al., 2024; Raghuraman et al., 2024; Deutloff et al., 2025).
Convection-permitting climate models are a new and promising tool in challenging our understanding of how cloud processes interact with global climate. Experiments using convection-permitting models to simulate warmer climates offer an important test of whether the relationships assessed in this manuscript hold under a warmer global atmosphere, or whether other changes, such as changes in the microphysical evolution or diurnal cycle of convection, dominate changes in the radiative effect of tropical deep convection. In such efforts, Lagrangian methods that capture cloud development and lifecycle in the dimensionality in which it is simulated will help maximise the insights possible. Ultimately, we argue that studies and methods linking convection to anvil clouds are crucial to ensure that the processes that control anvil structure and spreading are understood and that projected changes can be physically justified.
We tested three erosion thresholds on the first simulation day over the study domain, 0.25, 0.5, and 0.75. Statistics were then derived from the tracking metadata dataframes, which record the lifetime, extent, and thresholds met for each DCC and convective core tracked. While the allocation of condensate and updraft fields to different DCC labels changes, the fields included in the final tracks are not substantially changed.
At smaller erosion thresholds (indicating less change from a standard overlap check), the number of uniquely labelled DCCs decreased and the typical DCC size and lifetime increased. Despite this, the probability distributions of cloud lifetime and number of cores were not greatly changed. Nor were the joint densities of the core maximum velocity and the DCC size and mean ice water concentration.
Here we test the sensitivity of bulk DCC properties in response to changes in the fractional erosion threshold, α. This assessment was performed on the first simulation day over the study domain, using three thresholds, 0.25, 0.5, and 0.75. The resulting statistics were then derived from the tracking metadata, which records the lifetime and volume of each tracked DCC, along with the velocity threshold each DCC core reached during tracking, which we use as a proxy for the core maximum velocity. The sensitivity tests show minimal change in either the bulk properties (lifetime, number of convective cores) of the tracked DCCs or the relationships between updraft velocity and cloud amount. Instead the impact of different thresholds pertained to the degree of cloud object merging. The number of unique DCCs tracked under each threshold was 1096, 1528, and 2328 for the 0.25, 0.5, and 0.75 erosion thresholds, respectively. This indicates that while the tracking is sensitivity to the threshold used, the statistical relationships between the associated cloud properties are not.
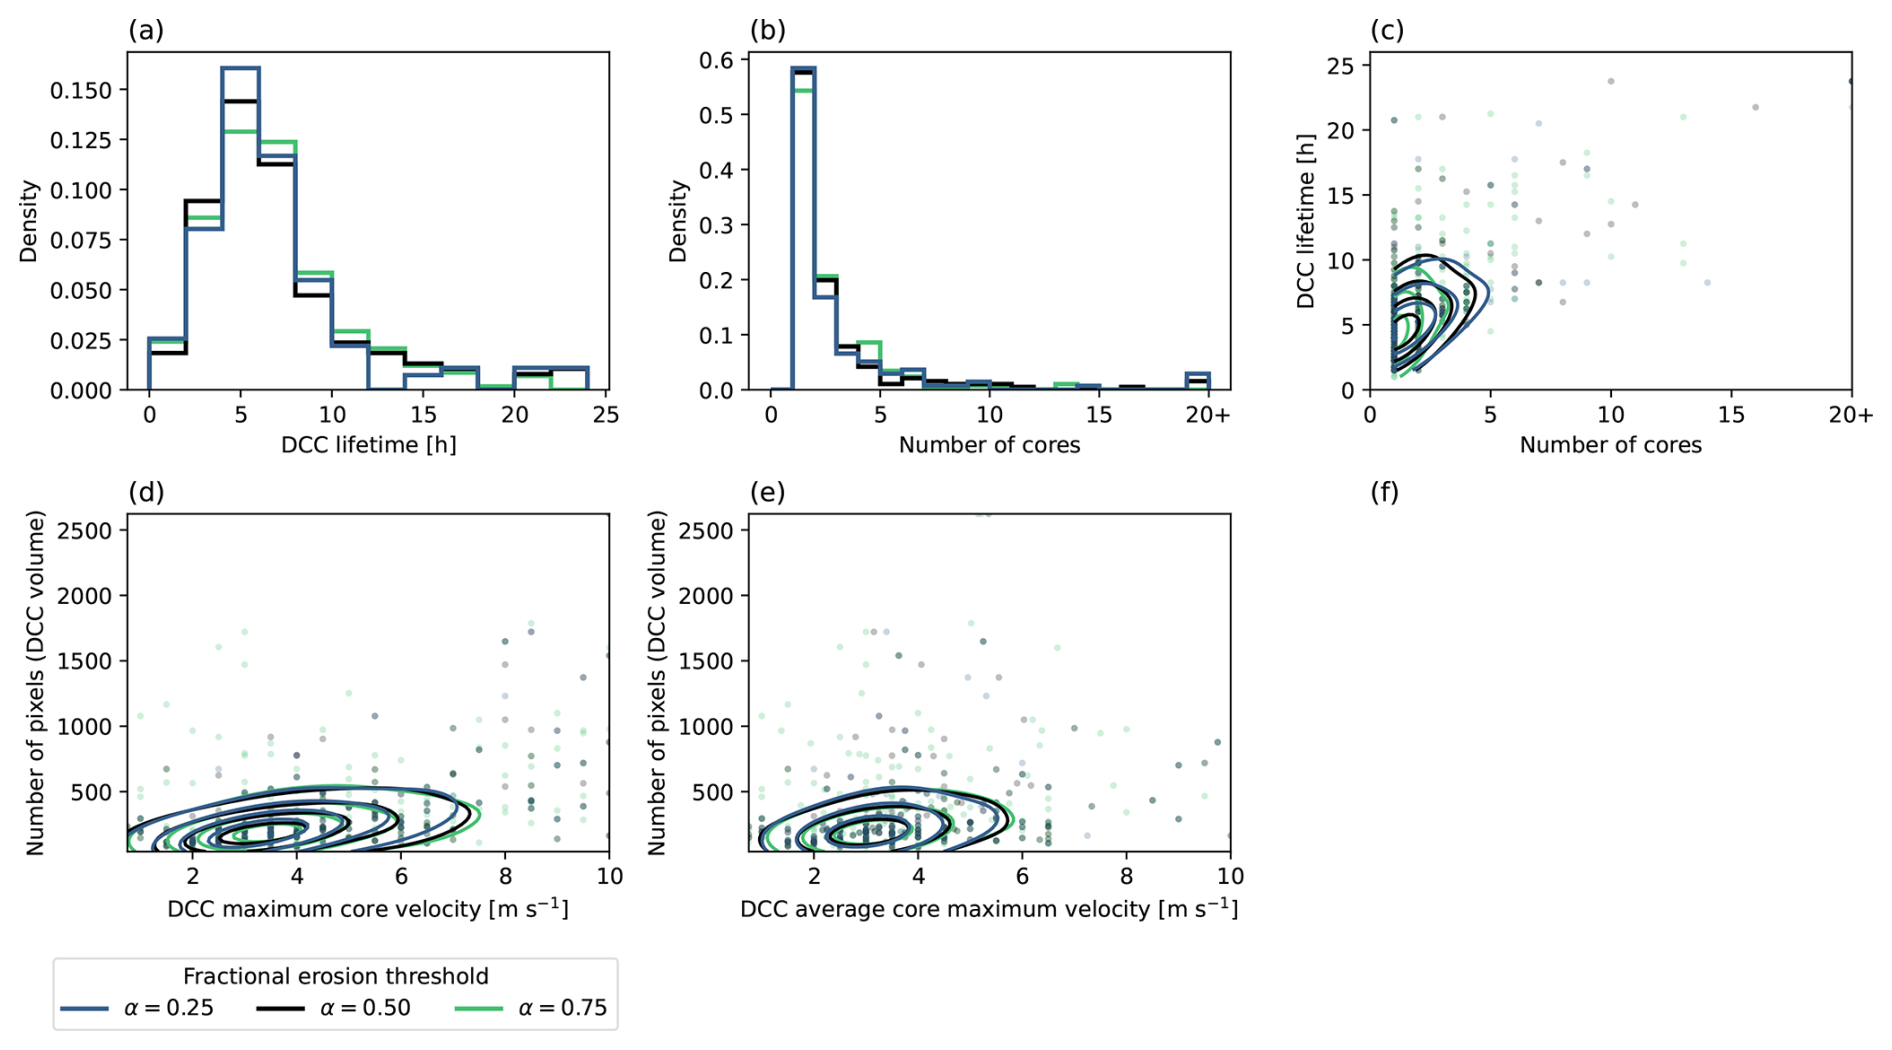
Figure A1Comparison of DCC statistics derived from tracking using a fractional erosion of α=0.25 (blue), α=0.5 (black), and α=0.75 (green). (a)–(b) show histograms of (a) DCC lifetime and (b) the number of cores per DCC. (c)–(e) show joint distributions using scatter points of observed points and the kernel density estimation (KDE) of their distribution, for (c) number of cores against DCC lifetime; (d) the DCC maximum updraft against the maximum volume of the DCC; and (e) the maximum updraft of each core, averaged across each core in the DCC against the maximum volume of the DCC.
How does the relationship between anvil area and convective intensity change depending on the definition of the convective core and the choice of the convective intensity metric?
To perform this sensitivity test, we defined five intensity metrics and used three vertical velocity thresholds to redefine the convective cores. To redefine the convective cores, we applied each vertical velocity threshold (0.75, 1, and 2 m s−1) to the column-maximum velocities derived from the convective cores in the original dataset (which were created using a threshold of 0.75 m s−1, called “true 0.75 m s−1”). This approach avoids repeating the tracking and subsequent analyses from scratch for each vertical velocity threshold, thereby avoiding high computational costs. Some differences are expected in the results for the 0.75 m s−1 and true 0.75 m s−1 cases due to tilted cores.
In all cases, stronger convective intensity was associated with a greater increase in anvil extent when convective cores were wide, compared to when they were narrow. The magnitude of that difference between strong and weak convection in wide and narrow cores did depend on the metric used; it was comparable when using the maximum or mean vertical velocity (a–b and c–d) but was subdued by roughly 50 %–75 % when using the maximum CMF (e–f) or maximum convective core depth (g–e). The inter-metric differences resulted almost entirely from changes in the response to convection in wide cores. In narrow cores, changes in the anvil area evolution were small for all metrics and velocity thresholds assessed.
The threshold used to define updrafts was generally associated with smaller changes in anvil extent than those associated with using different metrics to define convective intensity. In wide cores, having a lower threshold meant there were smaller differences in maximum anvil extent due to stronger and weaker convection. This suggests that the relationships presented in this study (where updrafts were defined as vertical velocity >0.75 m s−1) may be conservative compared to those reported in existing literature (which typically defines updrafts as vertical velocity >1 m s−1). Further, this indicates that convective core structure is an important contributor to anvil extent, as cases in which the region of rapid (>2 m s−1) ascent were more intense saw the largest increase in anvil area for all intensity metrics.
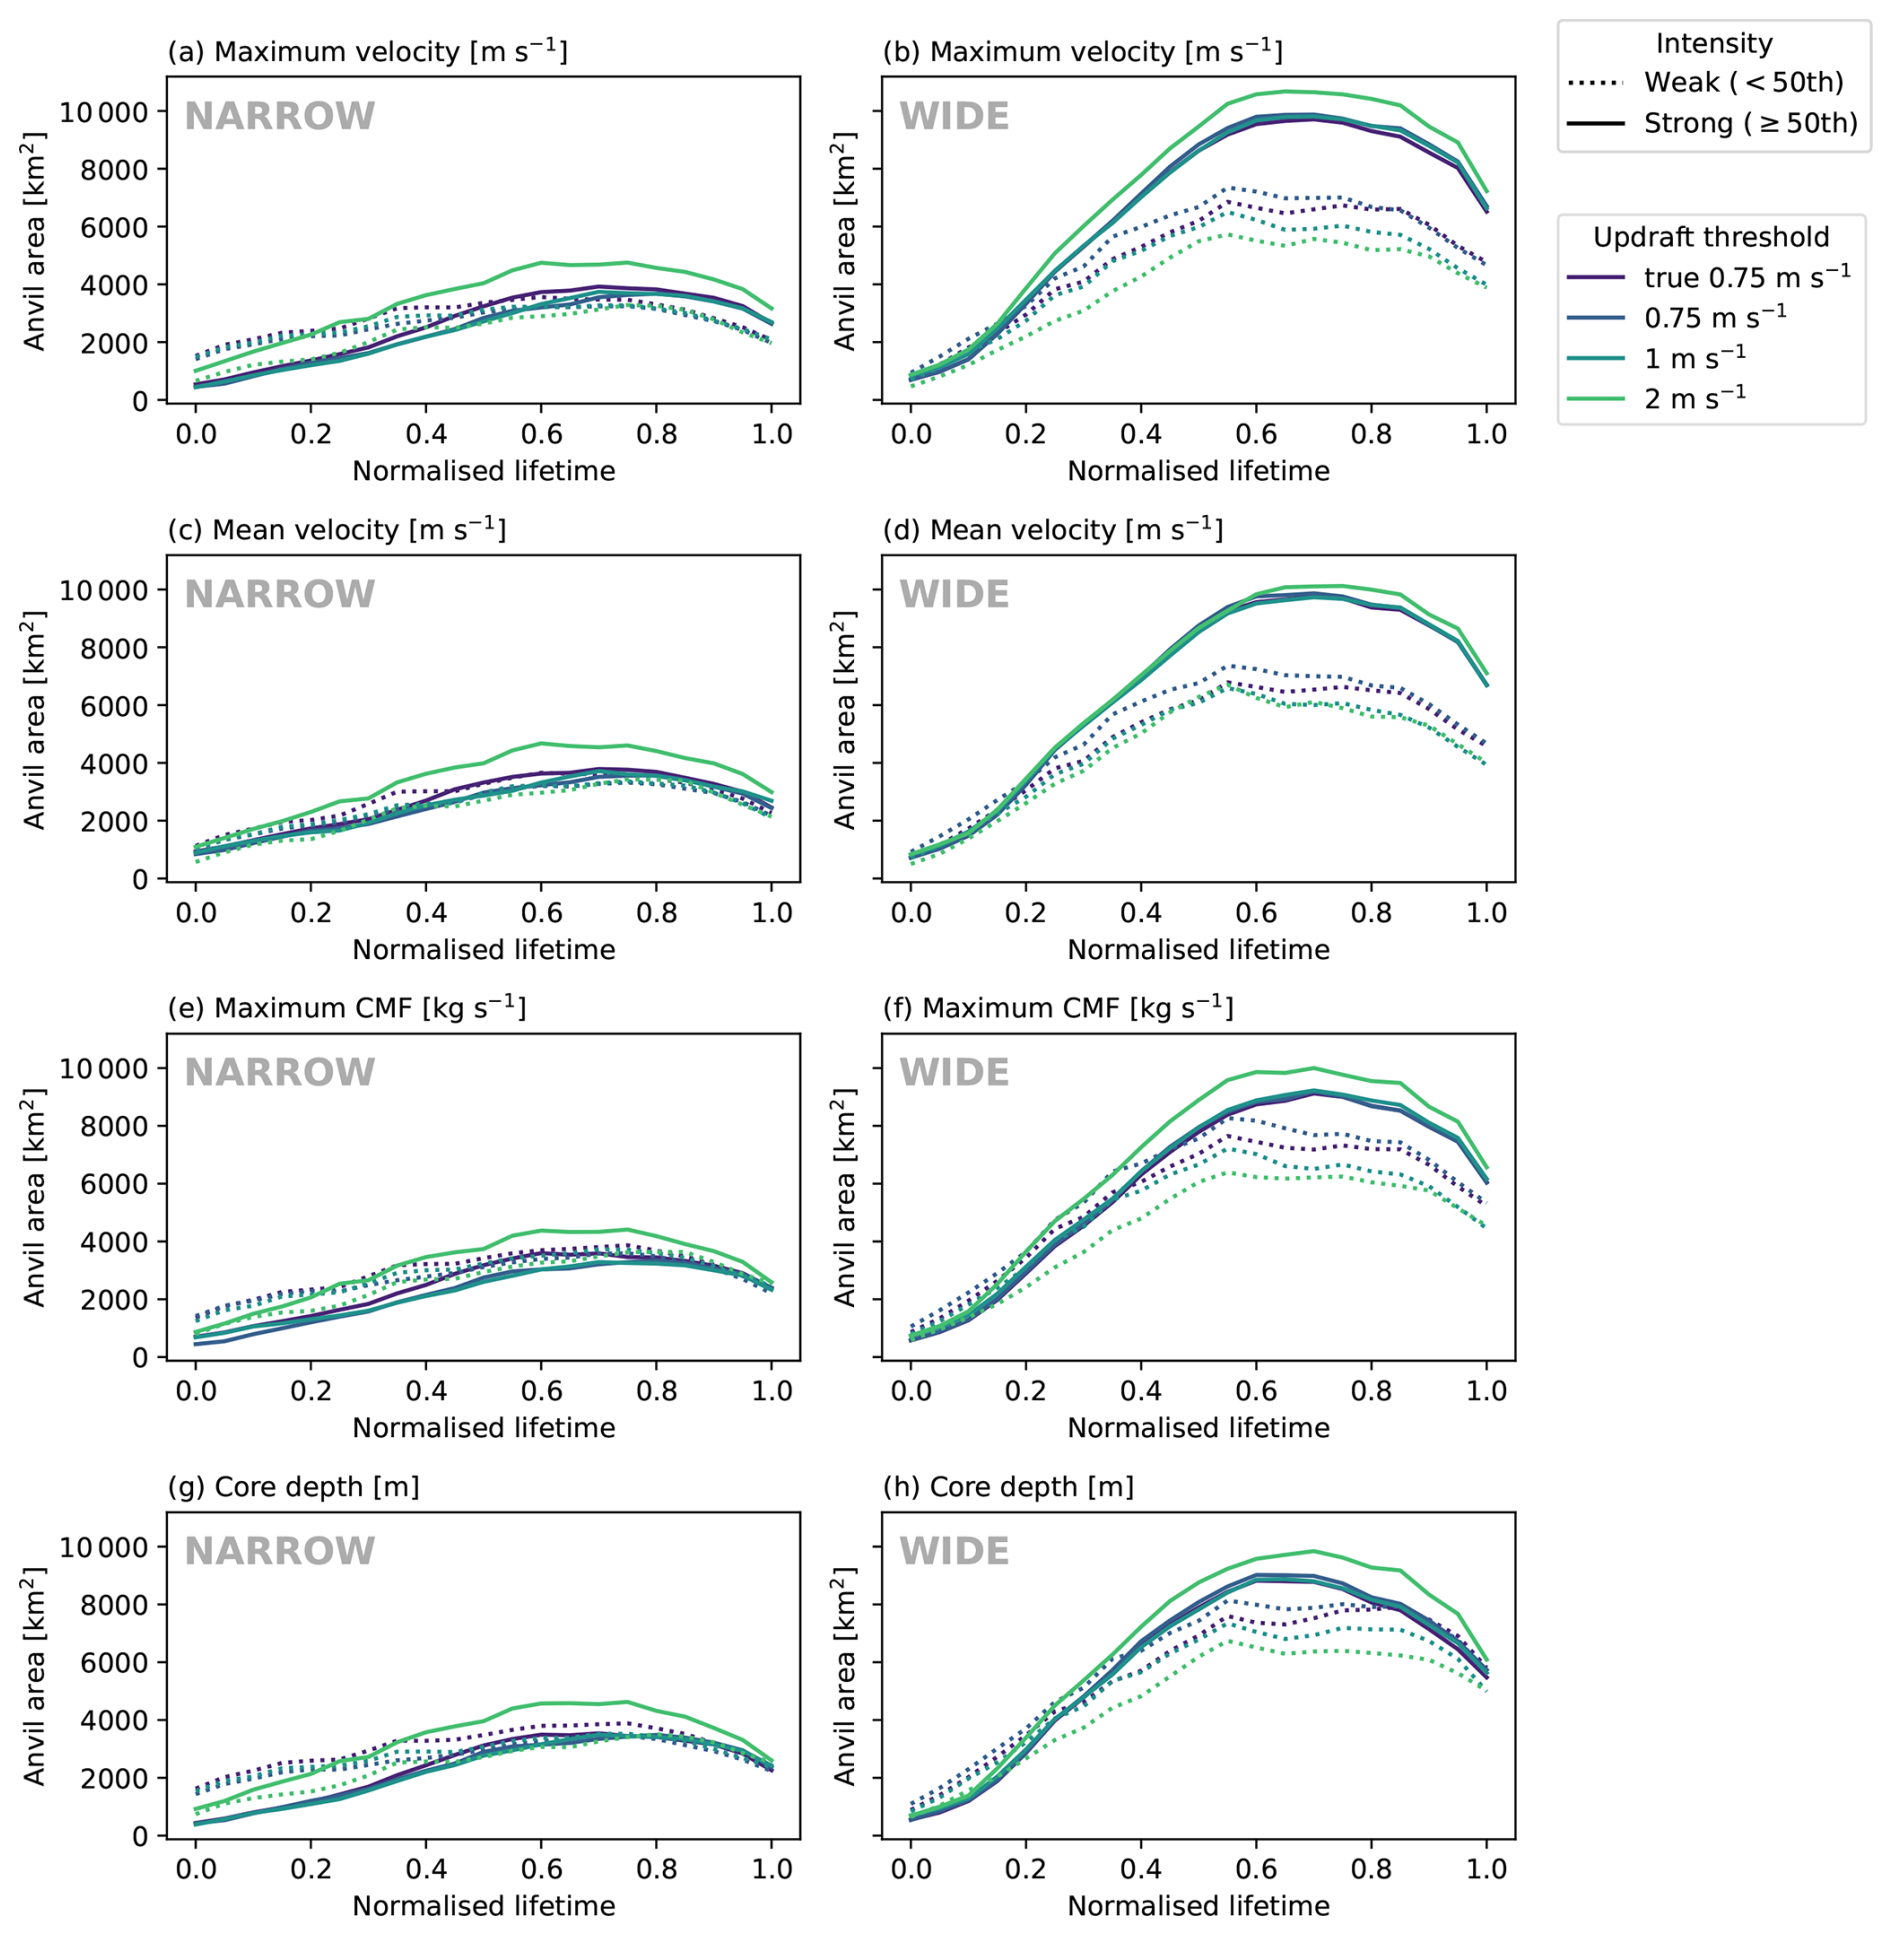
Figure B1Reproduction of the results presented in the top panel of Fig. 14 for five different intensity metrics (each row) and four vertical velocity thresholds (each line colour). Narrow (left) and wide (right) DCCs were partitioned for each metric and velocity threshold according to the 50th percentile of the convective core area. Next, DCCs within each size category were partitioned into weak (dotted lines) and strong (solid lines) convective intensity using the 50th percentile for each metric assessed.
The newly developed (light blue) eroded-contiguity tracked had the largest time cost of the tracking operations assessed, but was comparable to the cost required to perform the initial (light grey) detection of objects using tobac. Taking the combined (dark green) tobac plus eroded-contiguity approach presented in this manuscript is approximately twice as costly as performing the (black) tobac tracking alone. In both cases, the cost per GiB of data was roughly one 1 minute and scaled linearly with increasing dataset size. Thus, it is feasible to perform the tracking over large, even global, domains at the km-scale.
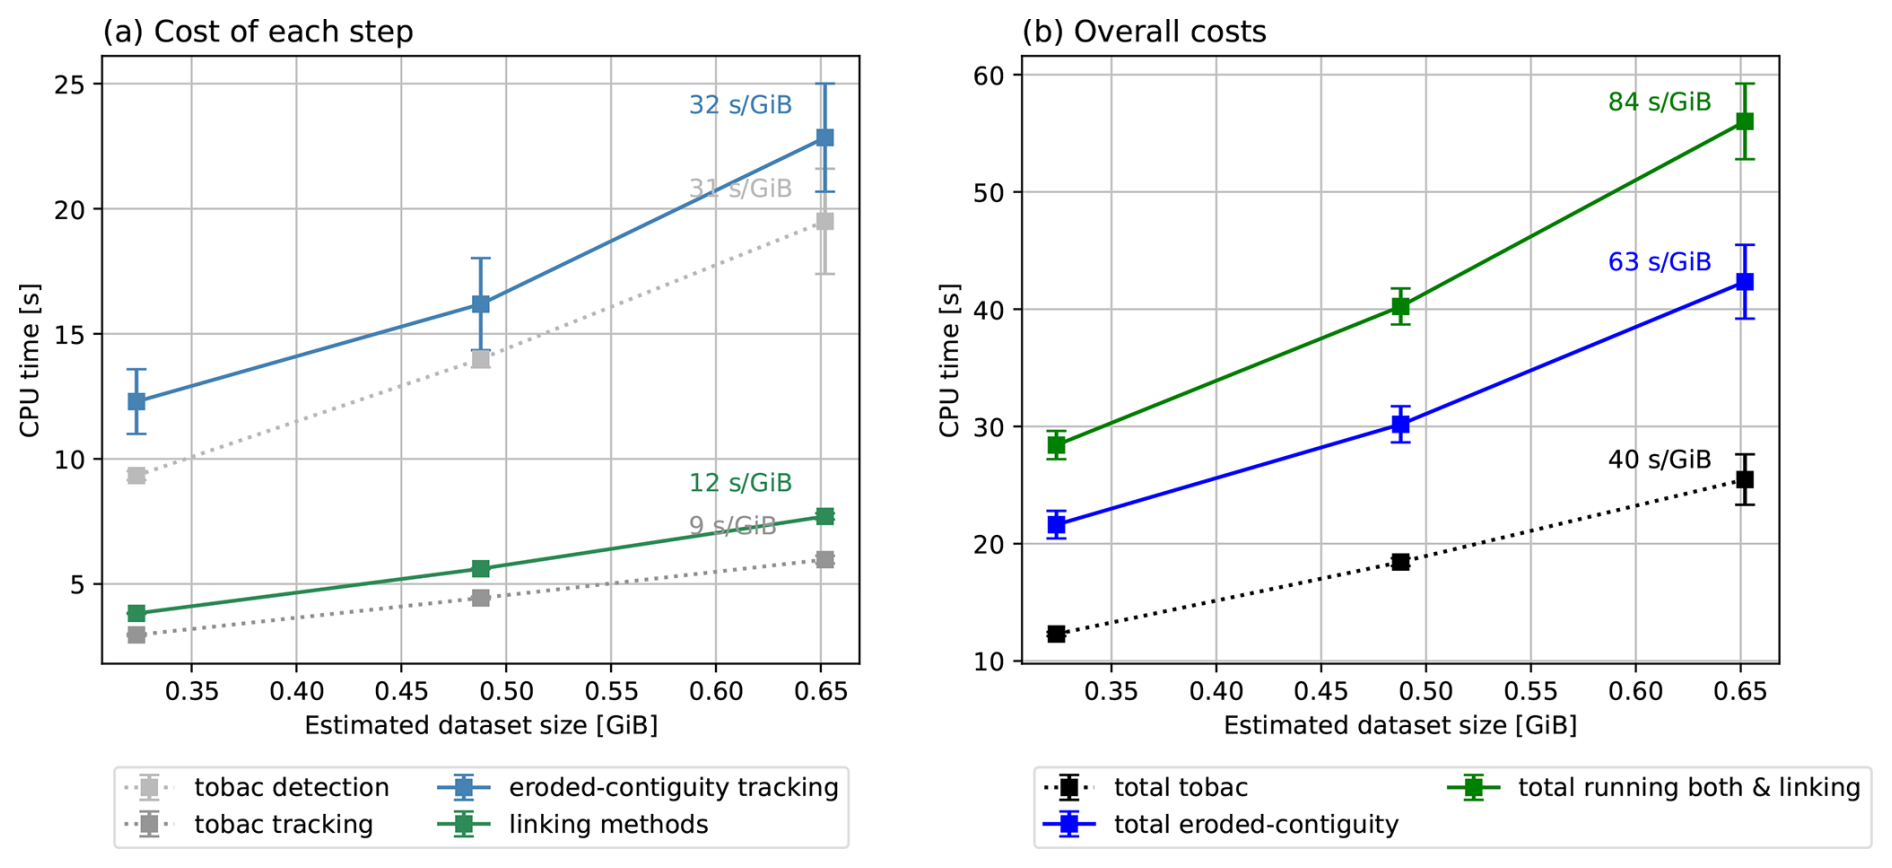
Figure C1Computational scaling times of the tracking algorithm. The time taken (seconds) to complete key algorithm steps (a) for different dataset sizes using a Computation Processing Unit (CPU) on the Levante computing infrastructure. In (b) the CPU time of three options for a complete tracking algorithm was then compared.
The deep convective clouds statistics assessed in this study are published at https://doi.org/10.5281/zenodo.18413874 (Ritman, 2026a), as are additional derived data used to produce the figures in this manuscript. The Python library developed to conduct the cloud tracking and statistical computations and the scripts and notebooks used to perform the analyses and create the figures are provided at https://doi.org/10.5281/zenodo.18414234 (Ritman, 2026b) and will be available to users in upcoming versions of the tobac Python library.
All authors contributed to research conceptualisation. MR designed and conducted the analyses. MR wrote this article with contributions from WJ and PS.
At least one of the (co-)authors is a member of the editorial board of Atmospheric Chemistry and Physics. The peer-review process was guided by an independent editor, and the authors also have no other competing interests to declare.
Publisher's note: Copernicus Publications remains neutral with regard to jurisdictional claims made in the text, published maps, institutional affiliations, or any other geographical representation in this paper. The authors bear the ultimate responsibility for providing appropriate place names. Views expressed in the text are those of the authors and do not necessarily reflect the views of the publisher.
The authors would like to acknowledge Daniel Klocke, the Max Planck Institute for Meteorology, and the NextGEMs project for producing the ICON simulation analysed. Professor Sue van den Heever, Tennessee Leeuwenberg, and Dr Gabrielle Leung are thanked for discussions, which greatly assisted the authorship team in conducting and interpreting this work. The authors thank the internal reviewers whose insights greatly improved the presentation of this research.
This research has been supported by the General Sir John Monash Foundation, the UK Research and Innovation (grant no. 101137639) and the EU Horizon 2020 (grant no. 101003470).
This paper was edited by Blaž Gasparini and reviewed by two anonymous referees.
Allan, D. B., Caswell, T., Keim, N. C., van der Wel, C. M., and Verweij, R. W.: Soft-Matter/Trackpy: V0.6.4, Zenodo [code], https://doi.org/10.5281/ZENODO.1213240, 2024. a
Baldauf, M., Seifert, A., Förstner, J., Majewski, D., Raschendorfer, M., and Reinhardt, T.: Operational Convective-Scale Numerical Weather Prediction with the COSMO Model: Description and Sensitivities, Mon. Weather Rev., 139, 3887–3905, https://doi.org/10.1175/MWR-D-10-05013.1, 2011. a
Becker, T., Bechtold, P., and Sandu, I.: Characteristics of convective precipitation over tropical Africa in storm-resolving global simulations, Q. J. Roy. Meteor. Soc., 147, 4388–4407, https://doi.org/10.1002/qj.4185, 2021. a
Bolot, M., Roca, R., Fiolleau, T., and Muller, C.: No decrease of tropical convection in individual deep convective systems with global warming, npj Clim. Atmos. Sci., 9, 14, https://doi.org/10.1038/s41612-025-01285-5, 2025. a
Bony, S., Stevens, B., Coppin, D., Becker, T., Reed, K. A., Voigt, A., and Medeiros, B.: Thermodynamic Control of Anvil Cloud Amount, P. Natl. Acad. Sci., 113, 8927–8932, https://doi.org/10.1073/pnas.1601472113, 2016. a, b
Byers, H. R. and Braham, R. R.: The Thunderstorm: Report of the Thunderstorm Project, US Government Printing Office, 1949. a
Crook, J., Klein, C., Folwell, S., Taylor, C. M., Parker, D. J., Stratton, R., and Stein, T.: Assessment of the Representation of West African Storm Lifecycles in Convection-Permitting Simulations, Earth and Space Science, 6, 818–835, https://doi.org/10.1029/2018EA000491, 2019. a, b, c
Deutloff, J., Buehler, S. A., Brath, M., and Naumann, A. K.: Insights on Tropical High-Cloud Radiative Effect From a New Conceptual Model, J. Adv. Model. Earth. Sy., 17, e2024MS004615, https://doi.org/10.1029/2024MS004615, 2025. a, b
Emanuel, K. A.: Atmospheric Convection, Oxford University Press, ISBN 978-0-19-506630-2, 1994. a
Feng, Z., Dong, X., Xi, B., McFarlane, S. A., Kennedy, A., Lin, B., and Minnis, P.: Life cycle of midlatitude deep convective systems in a Lagrangian framework, J. Geophys. Res.-Atmos., 117, https://doi.org/10.1029/2012JD018362, 2012. a
Feng, Z., Leung, L. R., Liu, N., Wang, J., Houze Jr, R. A., Li, J., Hardin, J. C., Chen, D., and Guo, J.: A Global High-Resolution Mesoscale Convective System Database Using Satellite-Derived Cloud Tops, Surface Precipitation, and Tracking, J. Geophys. Res.-Atmos., 126, e2020JD034202, https://doi.org/10.1029/2020JD034202, 2021. a, b
Feng, Z., Hardin, J., Barnes, H. C., Li, J., Leung, L. R., Varble, A., and Zhang, Z.: PyFLEXTRKR: a flexible feature tracking Python software for convective cloud analysis, Geosci. Model Dev., 16, 2753–2776, https://doi.org/10.5194/gmd-16-2753-2023, 2023a. a, b
Feng, Z., Leung, L. R., Hardin, J., Terai, C. R., Song, F., and Caldwell, P.: Mesoscale Convective Systems in DYAMOND Global Convection-Permitting Simulations, Geophys. Res. Lett., 50, e2022GL102603, https://doi.org/10.1029/2022GL102603, 2023b. a, b, c
Feng, Z., Prein, A. F., Kukulies, J., Fiolleau, T., Jones, W. K., Maybee, B., Moon, Z. L., Núnéz Ocasio, K. M., Dong, W., Molina, M. J., Albright, M. G., Rajagopal, M., Robledo, V., Song, J., Song, F., Leung, L. R., Varble, A. C., Klein, C., Roca, R., Feng, R., and Mejia, J. F.: Mesoscale Convective Systems Tracking Method Intercomparison (MCSMIP): Application to DYAMOND Global km-Scale Simulations, J. Geophys. Res.-Atmos., 130, e2024JD042204, https://doi.org/10.1029/2024JD042204, 2025. a, b, c, d, e
Fiolleau, T. and Roca, R.: An Algorithm for the Detection and Tracking of Tropical Mesoscale Convective Systems Using Infrared Images From Geostationary Satellite, IEEE T. Geosci. Remote, 51, 4302–4315, https://doi.org/10.1109/TGRS.2012.2227762, 2013. a
Fiolleau, T. and Roca, R.: A database of deep convective systems derived from the intercalibrated meteorological geostationary satellite fleet and the TOOCAN algorithm (2012–2020), Earth Syst. Sci. Data, 16, 4021–4050, https://doi.org/10.5194/essd-16-4021-2024, 2024. a
Freeman, S. W., Posselt, D. J., Reid, J. S., and van den Heever, S. C.: Dynamic and Thermodynamic Environmental Modulation of Tropical Congestus and Cumulonimbus in Maritime Tropical Regions, https://doi.org/10.1175/JAS-D-24-0055.1, J. Atmos. Sci., 2024. a, b
Futyan, J. M. and Genio, A. D. D.: Deep Convective System Evolution over Africa and the Tropical Atlantic, J. Climate, 20, 5041–5060, https://doi.org/10.1175/JCLI4297.1, 2007. a, b, c
Gasparini, B., Blossey, P. N., Hartmann, D. L., Lin, G., and Fan, J.: What Drives the Life Cycle of Tropical Anvil Clouds?, J. Adv. Model. Earth. Sy., 11, 2586–2605, https://doi.org/10.1029/2019MS001736, 2019. a
Gasparini, B., Rasch, P. J., Hartmann, D. L., Wall, C. J., and Dütsch, M.: A Lagrangian Perspective on Tropical Anvil Cloud Lifecycle in Present and Future Climate, J. Geophys. Res.-Atmos., 126, e2020JD033487, https://doi.org/10.1029/2020JD033487, 2021. a, b
Gasparini, B., Sokol, A. B., Wall, C. J., Hartmann, D. L., and Blossey, P. N.: Diurnal Differences in Tropical Maritime Anvil Cloud Evolution, J. Climate, 35, 1655–1677, https://doi.org/10.1175/JCLI-D-21-0211.1, 2022. a
Gasparini, B., Sullivan, S. C., Sokol, A. B., Kärcher, B., Jensen, E., and Hartmann, D. L.: Opinion: Tropical cirrus – from micro-scale processes to climate-scale impacts, Atmos. Chem. Phys., 23, 15413–15444, https://doi.org/10.5194/acp-23-15413-2023, 2023 . a, b, c
Ge, J., Hu, X., Mu, Q., Liu, B., Zhu, Z., Du, J., Su, J., Li, Q., and Zhang, C.: Contrasting characteristics of continental and oceanic deep convective systems at different life stages from CloudSat observations, Atmos. Res., 298, 107157, https://doi.org/10.1016/j.atmosres.2023.107157, 2024. a, b
Genio, A. D. D. and Kovari, W.: Climatic Properties of Tropical Precipitating Convection under Varying Environmental Conditions, J. Climate, 15, 2597–2615, https://doi.org/10.1175/1520-0442(2002)015<2597:CPOTPC>2.0.CO;2, 2002. a
Giangrande, S. E., Toto, T., Jensen, M. P., Bartholomew, M. J., Feng, Z., Protat, A., Williams, C. R., Schumacher, C., and Machado, L.: Convective Cloud Vertical Velocity and Mass-Flux Characteristics from Radar Wind Profiler Observations during GoAmazon2014/5, J. Geophys. Res.-Atmos., 121, 12891–12913, https://doi.org/10.1002/2016JD025303, 2016. a
Gupta, S., Wang, D., Giangrande, S. E., Biscaro, T. S., and Jensen, M. P.: Lifecycle of updrafts and mass flux in isolated deep convection over the Amazon rainforest: insights from cell tracking, Atmos. Chem. Phys., 24, 4487–4510, https://doi.org/10.5194/acp-24-4487-2024, 2024. a, b
Heikenfeld, M., Marinescu, P. J., Christensen, M., Watson-Parris, D., Senf, F., van den Heever, S. C., and Stier, P.: tobac 1.2: towards a flexible framework for tracking and analysis of clouds in diverse datasets, Geosci. Model Dev., 12, 4551–4570, https://doi.org/10.5194/gmd-12-4551-2019, 2019a. a, b, c
Heikenfeld, M., White, B., Labbouz, L., and Stier, P.: Aerosol effects on deep convection: the propagation of aerosol perturbations through convective cloud microphysics, Atmos. Chem. Phys., 19, 2601–2627, https://doi.org/10.5194/acp-19-2601-2019, 2019b. a
Herbert, R. and Stier, P.: Satellite observations of smoke–cloud–radiation interactions over the Amazon rainforest, Atmos. Chem. Phys., 23, 4595–4616, https://doi.org/10.5194/acp-23-4595-2023, 2023. a
Herbert, R., Stier, P., and Dagan, G.: Isolating Large-Scale Smoke Impacts on Cloud and Precipitation Processes Over the Amazon With Convection Permitting Resolution, J. Geophys. Res.-Atmos., 126, e2021JD034615, https://doi.org/10.1029/2021JD034615, 2021. a
Hernandez-Deckers, D. and Sherwood, S. C.: A Numerical Investigation of Cumulus Thermals, J. Atmos. Sci., 73, 4117–4136, https://doi.org/10.1175/JAS-D-15-0385.1, 2016. a
Hohenegger, C., Kornblueh, L., Klocke, D., Becker, T., Cioni, G., Engels, J. F., Schulzweida, U., and Stevens, B.: Climate Statistics in Global Simulations of the Atmosphere, from 80 to 2.5 Km Grid Spacing, J. Meteorol. Soc. Jpn., Ser. II, 98, 73–91, https://doi.org/10.2151/jmsj.2020-005, 2020. a
Hohenegger, C., Korn, P., Linardakis, L., Redler, R., Schnur, R., Adamidis, P., Bao, J., Bastin, S., Behravesh, M., Bergemann, M., Biercamp, J., Bockelmann, H., Brokopf, R., Brüggemann, N., Casaroli, L., Chegini, F., Datseris, G., Esch, M., George, G., Giorgetta, M., Gutjahr, O., Haak, H., Hanke, M., Ilyina, T., Jahns, T., Jungclaus, J., Kern, M., Klocke, D., Kluft, L., Kölling, T., Kornblueh, L., Kosukhin, S., Kroll, C., Lee, J., Mauritsen, T., Mehlmann, C., Mieslinger, T., Naumann, A. K., Paccini, L., Peinado, A., Praturi, D. S., Putrasahan, D., Rast, S., Riddick, T., Roeber, N., Schmidt, H., Schulzweida, U., Schütte, F., Segura, H., Shevchenko, R., Singh, V., Specht, M., Stephan, C. C., von Storch, J.-S., Vogel, R., Wengel, C., Winkler, M., Ziemen, F., Marotzke, J., and Stevens, B.: ICON-Sapphire: simulating the components of the Earth system and their interactions at kilometer and subkilometer scales, Geosci. Model Dev., 16, 779–811, https://doi.org/10.5194/gmd-16-779-2023, 2023. a
Igel, A. L., Igel, M. R., and van den Heever, S. C.: Make It a Double? Sobering Results from Simulations Using Single-Moment Microphysics Schemes, J. Atmos. Sci., 72, 910–925, https://doi.org/10.1175/JAS-D-14-0107.1, 2015. a
Igel, M. R. and van den Heever, S. C.: The relative influence of environmental characteristics on tropical deep convective morphology as observed by CloudSat, J. Geophys. Res.-Atmos., 120, 4304–4322, https://doi.org/10.1002/2014JD022690, 2015. a
Jeevanjee, N. and Zhou, L.: On the Resolution-Dependence of Anvil Cloud Fraction and Precipitation Efficiency in Radiative-Convective Equilibrium, J. Adv. Model. Earth. Sy., 14, e2021MS002759, https://doi.org/10.1029/2021MS002759, 2022. a, b
Jensen, M. P. and Genio, A. D. D.: Factors Limiting Convective Cloud-Top Height at the ARM Nauru Island Climate Research Facility, J. Climate, 19, 2105–2117, https://doi.org/10.1175/JCLI3722.1, 2006. a
Jo, E., Feng, Z., Varble, A. C., Marquis, J. N., and Gustafson, W. I.: The Effect of Updraft Entrainment on Convective Cell Deepening in Realistic Large-Eddy Simulations, J. Atmos. Sci., 82, 1361–1379, https://doi.org/10.1175/JAS-D-24-0218.1, 2025. a
Jones, W. K., Stengel, M., and Stier, P.: A Lagrangian perspective on the lifecycle and cloud radiative effect of deep convective clouds over Africa, Atmos. Chem. Phys., 24, 5165–5180, https://doi.org/10.5194/acp-24-5165-2024, 2024. a, b, c, d
Klingebiel, M., Konow, H., and Stevens, B.: Measuring Shallow Convective Mass Flux Profiles in the Trade Wind Region, J. Atmos. Sci., 78, 3205–3214, https://doi.org/10.1175/JAS-D-20-0347.1, 2021. a
Koren, I., Remer, L. A., Altaratz, O., Martins, J. V., and Davidi, A.: Aerosol-induced changes of convective cloud anvils produce strong climate warming, Atmos. Chem. Phys., 10, 5001–5010, https://doi.org/10.5194/acp-10-5001-2010, 2010. a
Leuenberger, D., Koller, M., Fuhrer, O., and Schär, C.: A Generalization of the SLEVE Vertical Coordinate, Mon. Weather Rev., 138, 3683–3689, https://doi.org/10.1175/2010MWR3307.1, 2010. a
Li, W. and Schumacher, C.: Thick Anvils as Viewed by the TRMM Precipitation Radar, J. Climate, 24, 1718–1735 https://doi.org/10.1175/2010JCLI3793.1, 2011. a, b
Lilly, D. K.: On the Numerical Simulation of Buoyant Convection, Tellus, 14, 148–172, https://doi.org/10.1111/j.2153-3490.1962.tb00128.x, 1962. a
Lochbihler, K., Lenderink, G., and Siebesma, A. P.: The spatial extent of rainfall events and its relation to precipitation scaling, Geophys. Res. Lett., 44, 8629–8636, https://doi.org/10.1002/2017GL074857, 2017. a
Machado, L. A. T. and Rossow, W. B.: Structural Characteristics and Radiative Properties of Tropical Cloud Clusters, Mon. Weather Rev., 121, 3234–3260, https://doi.org/10.1175/1520-0493(1993)121<3234:SCARPO>2.0.CO;2, 1993. a, b, c
Machado, L. A. T., Rossow, W. B., Guedes, R. L., and Walker, A. W.: Life Cycle Variations of Mesoscale Convective Systems over the Americas, 126, 1630–1654, Mon. Weather Rev., https://doi.org/10.1175/1520-0493(1998)126<1630:LCVOMC>2.0.CO;2, 1998. a
McKim, B., Bony, S., and Dufresne, J.-L.: Weak Anvil Cloud Area Feedback Suggested by Physical and Observational Constraints, Nat. Geosci., 17, 392–397, https://doi.org/10.1038/s41561-024-01414-4, 2024. a, b
Morrison, H., van Lier-Walqui, M., Fridlind, A. M., Grabowski, W. W., Harrington, J. Y., Hoose, C., Korolev, A., Kumjian, M. R., Milbrandt, J. A., Pawlowska, H., Posselt, D. J., Prat, O. P., Reimel, K. J., Shima, S.-I., van Diedenhoven, B., and Xue, L.: Confronting the Challenge of Modeling Cloud and Precipitation Microphysics, J. Adv. Model. Earth Sy., 12, e2019MS001689, https://doi.org/10.1029/2019MS001689, 2020. a
Müller, S. K., Caillaud, C., Chan, S., de Vries, H., Bastin, S., Berthou, S., Brisson, E., Demory, M.-E., Feldmann, H., Goergen, K., Kartsios, S., Lind, P., Keuler, K., Pichelli, E., Raffa, M., Tölle, M. H., and Warrach-Sagi, K.: Evaluation of Alpine-Mediterranean precipitation events in convection-permitting regional climate models using a set of tracking algorithms, Clim. Dynam., 61, 939–957, https://doi.org/10.1007/s00382-022-06555-z, 2023. a
Nugent, J. M., Turbeville, S. M., Bretherton, C. S., Blossey, P. N., and Ackerman, T. P.: Tropical Cirrus in Global Storm-Resolving Models: 1. Role of Deep Convection, Earth and Space Science, 9, e2021EA001965, https://doi.org/10.1029/2021EA001965, 2022. a
Ocasio, K. M. N., Evans, J. L., and Young, G. S.: Tracking Mesoscale Convective Systems that are Potential Candidates for Tropical Cyclogenesis, Mon. Weather Rev., 148, 655–669, https://doi.org/10.1175/MWR-D-19-0070.1, 2020. a
Pincus, R., Mlawer, E. J., and Delamere, J. S.: Balancing Accuracy, Efficiency, and Flexibility in Radiation Calculations for Dynamical Models, J. Adv. Model. Earth. Sy., 11, 3074–3089, https://doi.org/10.1029/2019MS001621, 2019. a
Prein, A. F., Langhans, W., Fosser, G., Ferrone, A., Ban, N., Goergen, K., Keller, M., Tölle, M., Gutjahr, O., Feser, F., Brisson, E., Kollet, S., Schmidli, J., van Lipzig, N. P. M., and Leung, R.: A review on regional convection-permitting climate modeling: Demonstrations, prospects, and challenges, Rev. Geophys., 53, 323–361, https://doi.org/10.1002/2014RG000475, 2015. a
Prein, A. F., Feng, Z., Fiolleau, T., Moon, Z. L., Nünéz Ocasio, K. M., Kukulies, J., Roca, R., Varble, A. C., Rehbein, A., Liu, C., Ikeda, K., Mu, Y., and Rasmussen, R. M.: Km-Scale Simulations of Mesoscale Convective Systems Over South America – Feature Tracker Intercomparison, J. Geophys. Res.-Atmos., 129, e2023JD040254, https://doi.org/10.1029/2023JD040254, 2024. a
Raghuraman, S. P., Medeiros, B., and Gettelman, A.: Observational Quantification of Tropical High Cloud Changes and Feedbacks, J. Geophys. Res.-Atmos., 129, e2023JD039364, https://doi.org/10.1029/2023JD039364, 2024. a, b
Respati, M. R., Dommenget, D., Segura, H., and Stassen, C.: Diagnosing drivers of tropical precipitation biases in coupled climate model simulations, Clim. Dynam., 62, 8691–8709, https://doi.org/10.1007/s00382-024-07355-3, 2024. a
Ritman, M.: ICON tracked deep convective cloud statistics and data accompanying the manuscript “Convective controls on anvil cloud evolution in the ICON km-scale global climate model”, Zenodo [code], https://doi.org/10.5281/zenodo.18413874, 2026a. a
Ritman, M.: Scripts to produces results presented in “Convective controls on anvil cloud evolution in the ICON km-scale global climate model”, Zenodo [code], https://doi.org/10.5281/zenodo.18414234, 2026b. a
Roca, R., Fiolleau, T., and Bouniol, D.: A Simple Model of the Life Cycle of Mesoscale Convective Systems Cloud Shield in the Tropics, J. Climate, 30, 4283–4298, https://doi.org/10.1175/JCLI-D-16-0556.1, 2017. a
Roh, W., Satoh, M., and Hohenegger, C.: Intercomparison of Cloud Properties in DYAMOND Simulations over the Atlantic Ocean, J. Meteorol. Soc. Jpn., Ser. II, 99, 1439–1451, https://doi.org/10.2151/jmsj.2021-070, 2021. a
Saleeby, S. M., van den Heever, S. C., Marinescu, P. J., Oue, M., Barrett, A. I., Barthlott, C., Cherian, R., Fan, J., Fridlind, A. M., Heikenfeld, M., Hoose, C., Matsui, T., Miltenberger, A. K., Quaas, J., Shpund, J., Stier, P., Vie, B., White, B. A., and Zhang, Y.: Model Intercomparison of the Impacts of Varying Cloud Droplet-Nucleating Aerosols on the Life Cycle and Microphysics of Isolated Deep Convection, J. Atmos. Sci., 82, 2197–2217, https://doi.org/10.1175/JAS-D-24-0181.1, 2025. a, b
Savazzi, A. C. M., Jakob, C., and Siebesma, A. P.: Convective Mass-Flux From Long Term Radar Reflectivities Over Darwin, Australia, J. Geophys. Res.-Atmos., 126, e2021JD034910, https://doi.org/10.1029/2021JD034910, 2021. a
Schär, C., Leuenberger, D., Fuhrer, O., Lüthi, D., and Girard, C.: A New Terrain-Following Vertical Coordinate Formulation for Atmospheric Prediction Models, Mon. Weather Rev., 130, 2459–2480, https://doi.org/10.1175/1520-0493(2002)130<2459:ANTFVC>2.0.CO;2, 2002. a
Segura, H., Pedruzo-Bagazgoitia, X., Weiss, P., Müller, S. K., Rackow, T., Lee, J., Dolores-Tesillos, E., Benedict, I., Aengenheyster, M., Aguridan, R., Arduini, G., Baker, A. J., Bao, J., Bastin, S., Baulenas, E., Becker, T., Beyer, S., Bockelmann, H., Brüggemann, N., Brunner, L., Cheedela, S. K., Das, S., Denissen, J., Dragaud, I., Dziekan, P., Ekblom, M., Engels, J. F., Esch, M., Forbes, R., Frauen, C., Freischem, L., García-Maroto, D., Geier, P., Gierz, P., González-Cervera, Á., Grayson, K., Griffith, M., Gutjahr, O., Haak, H., Hadade, I., Haslehner, K., ul Hasson, S., Hegewald, J., Kluft, L., Koldunov, A., Koldunov, N., Kölling, T., Koseki, S., Kosukhin, S., Kousal, J., Kuma, P., Kumar, A. U., Li, R., Maury, N., Meindl, M., Milinski, S., Mogensen, K., Niraula, B., Nowak, J., Praturi, D. S., Proske, U., Putrasahan, D., Redler, R., Santuy, D., Sármány, D., Schnur, R., Scholz, P., Sidorenko, D., Spät, D., Sützl, B., Takasuka, D., Tompkins, A., Uribe, A., Valentini, M., Veerman, M., Voigt, A., Warnau, S., Wachsmann, F., Wacławczyk, M., Wedi, N., Wieners, K.-H., Wille, J., Winkler, M., Wu, Y., Ziemen, F., Zimmermann, J., Bender, F. A.-M., Bojovic, D., Bony, S., Bordoni, S., Brehmer, P., Dengler, M., Dutra, E., Faye, S., Fischer, E., van Heerwaarden, C., Hohenegger, C., Järvinen, H., Jochum, M., Jung, T., Jungclaus, J. H., Keenlyside, N. S., Klocke, D., Konow, H., Klose, M., Malinowski, S., Martius, O., Mauritsen, T., Mellado, J. P., Mieslinger, T., Mohino, E., Pawłowska, H., Peters-von Gehlen, K., Sarré, A., Sobhani, P., Stier, P., Tuppi, L., Vidale, P. L., Sandu, I., and Stevens, B.: nextGEMS: entering the era of kilometer-scale Earth system modeling, Geosci. Model Dev., 18, 7735–7761, https://doi.org/10.5194/gmd-18-7735-2025, 2025. a
Sela, M., Weiss, P., and Stier, P.: Sensitivity of cloud structure and precipitation to cloud microphysics schemes in ICON and implications for global km-scale simulations, EGUsphere [preprint], https://doi.org/10.5194/egusphere-2025-5803, 2025. a
Senf, F., Klocke, D., and Brueck, M.: Size-Resolved Evaluation of Simulated Deep Tropical Convection, Mon. Weather Rev., 146, 2161–2182, https://doi.org/10.1175/MWR-D-17-0378.1, 2018. a, b
Sherwood, S. C., Webb, M. J., Annan, J. D., Armour, K. C., Forster, P. M., Hargreaves, J. C., Hegerl, G., Klein, S. A., Marvel, K. D., Rohling, E. J., Watanabe, M., Andrews, T., Braconnot, P., Bretherton, C. S., Foster, G. L., Hausfather, Z., von der Heydt, A. S., Knutti, R., Mauritsen, T., Norris, J. R., Proistosescu, C., Rugenstein, M., Schmidt, G. A., Tokarska, K. B., and Zelinka, M. D.: An Assessment of Earth's Climate Sensitivity Using Multiple Lines of Evidence, Rev. Geophys., 58, e2019RG000678, https://doi.org/10.1029/2019RG000678, 2020. a, b
Smagorinsky, J.: General Circulation Experiments with the Primitive Equations: I. The Basic Experiment, Mon. Weather Rev., 91, 99–164, https://doi.org/10.1175/1520-0493(1963)091<0099:GCEWTP>2.3.CO;2, 1963. a
Sokol, A. B. and Hartmann, D. L.: Tropical Anvil Clouds: Radiative Driving Toward a Preferred State, J. Geophys. Res.-Atmos., 125, e2020JD033107, https://doi.org/10.1029/2020JD033107, 2020. a
Sokol, A. B., Wall, C. J., and Hartmann, D. L.: Greater Climate Sensitivity Implied by Anvil Cloud Thinning, Nat. Geosci., 17, 398–403, https://doi.org/10.1038/s41561-024-01420-6, 2024. a, b
Sokolowsky, G. A., Freeman, S. W., Jones, W. K., Kukulies, J., Senf, F., Marinescu, P. J., Heikenfeld, M., Brunner, K. N., Bruning, E. C., Collis, S. M., Jackson, R. C., Leung, G. R., Pfeifer, N., Raut, B. A., Saleeby, S. M., Stier, P., and van den Heever, S. C.: tobac v1.5: introducing fast 3D tracking, splits and mergers, and other enhancements for identifying and analysing meteorological phenomena, Geosci. Model Dev., 17, 5309–5330, https://doi.org/10.5194/gmd-17-5309-2024, 2024. a, b, c
Stein, T. H. M., Hogan, R. J., Hanley, K. E., Nicol, J. C., Lean, H. W., Plant, R. S., Clark, P. A., and Halliwell, C. E.: The Three-Dimensional Morphology of Simulated and Observed Convective Storms over Southern England, Mon. Weather Rev., 142, 3264–3283, https://doi.org/10.1175/MWR-D-13-00372.1, 2014. a
Takahashi, H., Luo, Z. J., Stephens, G., and Mulholland, J. P.: Revisiting the Land-Ocean Contrasts in Deep Convective Cloud Intensity Using Global Satellite Observations, Geophys. Res. Lett., 50, e2022GL102089, https://doi.org/10.1029/2022GL102089, 2023. a
Tompkins, A. M. and Craig, G. C.: Sensitivity of Tropical Convection to Sea Surface Temperature in the Absence of Large-Scale Flow, J. Climate, 12, 462–476, https://doi.org/10.1175/1520-0442(1999)012<0462:SOTCTS>2.0.CO;2, 1999. a
Turbeville, S. M., Nugent, J. M., Ackerman, T. P., Bretherton, C. S., and Blossey, P. N.: Tropical Cirrus in Global Storm-Resolving Models: 2. Cirrus Life Cycle and Top-of-Atmosphere Radiative Fluxes, Earth and Space Science, 9, e2021EA001978, https://doi.org/10.1029/2021EA001978, 2022. a
Varble, A. C., Feng, Z., Marquis, J. N., Zhang, Z., Geiss, A., Hardin, J. C., and Jo, E.: Updraft Width Modulates Ambient Atmospheric Controls on Convective Cloud Depth, J. Geophys. Res.-Atmos., 129, e2024JD041769, https://doi.org/10.1029/2024JD041769, 2024. a, b
Virtanen, P., Gommers, R., Oliphant, T. E., Haberland, M., Reddy, T., Cournapeau, D., Burovski, E., Peterson, P., Weckesser, W., Bright, J., van der Walt, S. J., Brett, M., Wilson, J., Millman, K. J., Mayorov, N., Nelson, A. R. J., Jones, E., Kern, R., Larson, E., Carey, C. J., Polat, Ä., Feng, Y., Moore, E. W., VanderPlas, J., Laxalde, D., Perktold, J., Cimrman, R., Henriksen, I., Quintero, E. A., Harris, C. R., Archibald, A. M., Ribeiro, A. H., Pedregosa, F., and van Mulbregt, P.: SciPy 1.0: fundamental algorithms for scientific computing in Python, Nature Methods, 17, 261–272, https://doi.org/10.1038/s41592-019-0686-2, 2020. a
Wall, C. J., Hartmann, D. L., Thieman, M. M., Smith, W. L., and Minnis, P.: The Life Cycle of Anvil Clouds and the Top-of-Atmosphere Radiation Balance over the Tropical West Pacific, J. Climate, 31, 10059–10080, https://doi.org/10.1175/JCLI-D-18-0154.1, 2018. a
Wang, D., Giangrande, S. E., Schiro, K. A., Jensen, M. P., and Houze Jr., R. A.: The Characteristics of Tropical and Midlatitude Mesoscale Convective Systems as Revealed by Radar Wind Profilers, J. Geophys. Res.-Atmos., 124, 4601–4619, https://doi.org/10.1029/2018JD030087, 2019. a
Wang, D., Giangrande, S. E., Feng, Z., Hardin, J. C., and Prein, A. F.: Updraft and Downdraft Core Size and Intensity as Revealed by Radar Wind Profilers: MCS Observations and Idealized Model Comparisons, J. Geophys. Res.-Atmos., 125, e2019JD031774, https://doi.org/10.1029/2019JD031774, 2020. a
Weiss, P., Herbert, R., and Stier, P.: ICON-HAM-lite 1.0: simulating the Earth system with interactive aerosols at kilometer scales, Geosci. Model Dev., 18, 3877–3894, https://doi.org/10.5194/gmd-18-3877-2025, 2025. a
Wieners, K.-H., Rackow, T., Aguridan, R., Becker, T., Beyer, S., Cheedela, S. K., Dreier, N.-A., Engels, J. F., Esch, M., Frauen, C., Klocke, D., Kölling, T., Pedruzo-Bagazgoitia, X., Putrasahan, D., Sidorenko, D., Schnur, R., Stevens, B., and Zimmermann, J.: nextGEMS: output of the production simulations for ICON and IFS, https://www.wdc-climate.de/ui/entry?acronym=nextGEMS_prod (last access: 15 January 2026), 2024. a
Wilcox, E. M., Yuan, T., and Song, H.: Deep convective cloud system size and structure across the global tropics and subtropics, Atmos. Meas. Tech., 16, 5387–5401, https://doi.org/10.5194/amt-16-5387-2023, 2023. a
Wild, M., Hakuba, M. Z., Folini, D., Dörig-Ott, P., Schär, C., Kato, S., and Long, C. N.: The Cloud-Free Global Energy Balance and Inferred Cloud Radiative Effects: An Assessment Based on Direct Observations and Climate Models, Clim. Dynam., 52, 4787–4812, https://doi.org/10.1007/s00382-018-4413-y, 2019. a
Yuan, J. and Houze, R. A.: Global Variability of Mesoscale Convective System Anvil Structure from A-Train Satellite Data, J. Climate, 23, 5864–5888, https://doi.org/10.1175/2010JCLI3671.1, 2010. a, b
Zängl, G., Reinert, D., Rípodas, P., and Baldauf, M.: The ICON (ICOsahedral Non-hydrostatic) Modelling Framework of DWD and MPI-M: Description of the Non-Hydrostatic Dynamical Core, Q. J. Roy. Meteor. Soc., 141, 563–579, https://doi.org/10.1002/qj.2378, 2015. a
Zipser, E. J.: Some Views On “Hot Towers” after 50 Years of Tropical Field Programs and Two Years of TRMM Data, Meteor. Mon., 29, 49–58, https://doi.org/10.1175/0065-9401(2003)029<0049:CSVOHT>2.0.CO;2, 2003. a
Zipser, E. J. and LeMone, M. A.: Cumulonimbus Vertical Velocity Events in GATE. Part II: Synthesis and Model Core Structure, J. Atmos. Sci., 37, 2458–2469, https://doi.org/10.1175/1520-0469(1980)037<2458:CVVEIG>2.0.CO;2, 1980. a
- Abstract
- Introduction
- Data and methods
- Results
- Discussion
- Conclusions
- Appendix A: Sensitivity of cloud properties to the fractional erosion threshold
- Appendix B: Sensitivity of results to methodological choices, including the measure of convective intensity
- Appendix C: Time required to compute the tracking algorithm
- Code and data availability
- Author contributions
- Competing interests
- Disclaimer
- Acknowledgements
- Financial support
- Review statement
- References