the Creative Commons Attribution 4.0 License.
the Creative Commons Attribution 4.0 License.
 | 22 May 2026
Large ozone enhancement over South Asia triggered by sudden stratospheric warming under westerly QBO phase: implications on ozone radiative forcing
Shubhajyoti Roy
Satheesh P. R. Chandran
Vijay Sagar
Michaela I. Hegglin
Rolf Müller
Prashant Chavan
Tropospheric ozone pollution in South Asia is mainly blamed on anthropogenic emissions. However, based on ERA5 reanalysis data, this study highlights the contribution of stratospheric ozone intrusions into the Upper Troposphere and Lower Stratosphere (UTLS) associated with Sudden Stratospheric Warming (SSW) events in enhancing upper tropospheric ozone over the South Asian region. We report an enhancement in ozone in the UTLS by more than 80 % for 2018 and ∼ 30 % within ±6 d of the onset during SSW events concurrent with the westerly phase of Quasi-biennial oscillation (WQBO-SSW) compared to non-SSW years. The equatorward shift (south of 30° N) of the subtropical jet during WQBO-SSW causes lowering of the tropopause and more Rossby-wave breaking in the upper troposphere. This results in higher stratospheric ozone intrusions over the South Asian region. The ozone enhancement during WQBO-SSW events produces an instantaneous radiative forcing at the top of the atmosphere of 0.09±0.05 W m−2 due to UTLS ozone changes and 0.17±0.05 W m−2 from total-column ozone changes over South Asia.
- Article
(9810 KB) - Full-text XML
-
Supplement
(852 KB) - BibTeX
- EndNote


Tropospheric ozone is a short-lived greenhouse gas that plays a crucial role in atmospheric chemistry and radiative forcing (Wang et al., 2022). It is also a major air pollutant that significantly affects human health (Fleming et al., 2018), damages vegetation (Feng et al., 2021), disrupts ecosystems, and imposes economic costs (Dewan and Lakhani, 2022). In South Asia, a significant amount of tropospheric ozone is a growing concern due to its increased hazardous health effects (Lin et al., 2018).
The contribution from the downward transport of ozone-rich air from the stratosphere is the largest natural source of tropospheric ozone (e.g., Fadnavis et al., 2010). Studies have reported that stratospheric influence on the tropospheric ozone exceeds 50 % in the winter season at the extratropics (Williams et al., 2019). Wang and Fu (2021) estimate that stratosphere-to-troposphere exchange (STE) contributes approximately 347±12 Tg yr−1 to the global tropospheric ozone budget based on both observations and reanalysis data. CMIP6 model simulations for the period 1997 to 2014 indicate that up to 30 % of surface ozone in the Northern Hemisphere during winter (DJF) is due to stratospheric ozone intrusions (Li et al., 2024). In the Northwest Pacific, STE increases mid and upper-tropospheric ozone by about 96 % in winter and 40 % in summer between 1990 and 2020 (Ma et al., 2025). Roy et al. (2023) reported an ozone enhancement of ∼ 40 ppb in the upper troposphere over the Indian region caused by stratospheric intrusions associated with tropical cyclones.
Sudden stratospheric warming (SSW) events play a key role in atmospheric dynamics and stratospheric ozone intrusions into the troposphere (e.g., Williams et al., 2024). SSWs are one of the most significant large-scale dynamical phenomena in the stratosphere during winter (Butler et al., 2015; Baldwin et al., 2021). Enhanced planetary wave activity from the troposphere disrupts the stratospheric polar vortex, decelerating or even reversing the stratospheric westerlies, and causing a rapid rise in polar stratospheric temperatures by up to 50 K within few days (Baldwin et al., 2021). SSW events are crucial in modulating extreme heat, air pollution, wildfires, wind extremes, storm clusters, tropical cyclones, and sea ice melt in the northern high latitudes (Domeisen and Butler, 2020). The temperature and wind anomalies associated with SSWs propagate downward into the troposphere over timescales ranging from weeks to months, impacting tropospheric weather in the Northern Hemisphere for up to 40 d following the onset of the event (Baldwin and Dunkerton, 2001; Hall et al., 2021). Studies also suggest that SSWs are often followed by an equatorward shift of the tropospheric jet stream and storm tracks, as well as surface pressure anomalies that resemble the negative phase of the Northern Annular Mode (Sigmond et al., 2013; Kidston et al., 2015). Projection studies suggest that SSW events will increase by approximately one event per decade by the end of the 21st century (Charlton-Perez et al., 2008). High greenhouse gas emission scenarios indicate a doubling in SSW frequency (Schimanke et al., 2012). Considering the frequent occurrences and the potential role of SSWs in STE, it is important to investigate SSWs influence on tropospheric ozone enhancements and the associated radiative effects.
SSW events have a significant influence on STE and impact the tropospheric ozone budget, particularly in high-latitude regions (Xia et al., 2023; Williams et al., 2024). Based on 11 polar-night jet oscillation (PJO) type SSW events from 1980 to 2013 and chemistry-climate model simulations, STE led to an average increase of 5 %–10 % in near-surface ozone over the Arctic (Williams et al., 2024). Xia et al. (2023) reported an even more pronounced increase of 76 % in Arctic surface ozone due to STE in the 2020/21 SSW event. While most of these studies focus on the polar regions, some have identified SSW-induced ozone variability in the mid-latitudes (Liu et al., 2009; Williams et al., 2024). Liu et al. (2009) noted an ozone enhancement of about 186 Tg in the upper troposphere over East Asia during the 2002–2003 SSW, using MOZART-3 simulations. However, tropospheric ozone variations during SSW events over South Asia are among the least studied. Additionally, the broader implications of these events on the ozone radiative forcing over this region remain largely underexplored.
In this study, we investigate the impact of all the SSW events from 1962 to 2018 on ozone variability in the upper troposphere and lower stratosphere (UTLS: 300–50 hPa) over the South Asian region (20–35° N, 65–90° E) using ERA5 reanalysis data. The composite is obtained by averaging data with the onset day as a central date (details in the “Methods” section). The February 2018 SSW was a major SSW characterized by pronounced downward propagation of stratospheric signals into the troposphere. It prominently impacted weather across the Northern Hemisphere, including cold extremes over Asia, North America, and Europe (Shi et al., 2023; Lü et al., 2020; Xie et al., 2020). Signatures of this event were also seen in ST-Radar observations over India (Remya et al., 2021). ST-Radar observations showed downward propagation of horizontal wind and a pronounced increase of westerly wind amplitude in the UTLS. These findings suggest that the SSW influences the South Asian UTLS. Transport of ozone and ozone radiative forcing due to SSW over South Asia are not investigated yet. Since 2018-SSW is a major SSW, and there is evidence of its influence over India (ST-Radar observations), we therefore choose 2018-SSW as a case study, and then extend the analysis to all SSWs and assess their contribution to upper-tropospheric ozone and regional ozone radiative forcing over South Asia.
The paper is organised as follows. Section 2 describes the ERA5 reanalysis dataset, and the computation of ozone radiative forcixieng using the radiative-kernel method. Section 3 presents the (i) UTLS ozone changes during the 2018 SSW event over South Asia, (ii) composite analysis of SSWs, and (iii) ozone radiative forcing. Section 4 summarises the main findings.
2.1 ERA 5 Reanalysis Data
We analysed daily data of ozone, zonal and meridional winds, geopotential height (GPH), and potential vorticity (PV) from the fifth-generation reanalysis dataset (ERA5) provided by the European Centre for Medium-Range Weather Forecasts (ECMWF) (Hersbach et al., 2020). The ERA5 ozone field is generated through assimilation of multiple satellite- and ground-based observations, including TOMS (1978–2006), SBUV v8.6 (1978–present), CCI MIPAS (2005–2012), SCIAMACHY (2002–2012), Aura MLS v4.2 (2004–present), and OMI-DOAS (2004–present) (Hersbach et al., 2020; S-RIP, 2022). Comparison of ERA5 ozone with observations shows a slight overestimation in the UTLS. For example, over the North India region, ERA5 shows an overestimation of ∼ 20 ppb ozone (Fadnavis et al., 2023). Although ERA5 ozone is biased, it performs better compared to other reanalyses (Fadnavis et al., 2023). The S-RIP (2022) assessment report states an overestimation of zonal mean ozone by ∼ 10 %–40 % between 50° N and 50° S. The ERA5 variables have a horizontal resolution of 0.25° × 0.25° across 37 standard pressure levels (1000 to 1 hPa). Composite analysis is conducted for all variables for ±30 d, centered on the onset of SSW events (30 d before and after the onset), to assess the impact.
The long-term trend is removed from the daily ERA5 data before computing anomalies. This approach ensures that anomalies reflect deviations from typical background conditions. The non-SSW years were first separated into easterly QBO (EQBO-nonSSW) and westerly QBO (WQBO-nonSSW) years. For each non-SSW phase, we applied a Monte Carlo resampling method. For this, calendar-matched non-SSW background samples were constructed by randomly resampling days within the same day-of-year window for the EQBO-nonSSW and WQBO-nonSSW years separately (Dai et al., 2022). In each case, 20 000 random samples of non-SSW episodes were generated. The mean of 20 000 samples for WQBO-nonSSW is referred to as the “WQBO-nonSSW climatology”. The same procedure is repeated for the easterly non-SSW phase and is referred to as “EQBO-nonSSW climatology”. This climatology was used to calculate composite anomalies for the SSW years (EQBO-SSW – EQBO-nonSSW climatology, WQBO-SSW – WQBO-nonSSW climatology). For the 2018 SSW, which occurred during the westerly QBO phase, we used the “WQBO-nonSSW climatology” for calculating its anomaly. The spread of the 20 000 resampled non-SSW sets for each phase was used to evaluate the statistical significance of the changes caused by the SSWs within that phase (Dai et al., 2022). We then applied an exact Wilcoxon signed-rank test to the same data. A grid point is considered significant only when both tests agree at 95 % significance.
The onset of all the SSW events is identified as the day when the zonal mean westerly winds at 10 hPa and 60° N reverse their direction from westerlies to easterlies (Charlton and Polvani, 2007). Figure S1 in the Supplement shows the temporal evolution of the zonal-mean zonal wind at 60° N and 10 hPa for the 2018 SSW event. To diagnose stratospheric intrusions, we use potential vorticity (PV) as a dynamical tracer of stratospheric air (e.g., Holton et al., 1995; Kunz et al., 2011). Intrusions are identified from PV streamers or tropopause folds when high-PV (≥ 2 PVU) extends equatorward and downward into the upper troposphere (Fig. S2) (e.g., Sprenger et al., 2007). To identify the stratospheric intrusion associated with RWB, we used a criterion of PV > 2 PVU and ozone > 80 ppbv at 300 hPa. This criterion is adopted since background ozone at 300 hPa is < 80 ppbv. To demarcate the tropopause, we used the WMO lapse-rate tropopause (WMO, 1957). We used the lapse rate tropopause (LRT) derived from the ERA5 data for the present study (Hoffmann and Spang, 2022). This definition is adopted to mark a continuous, temporally varying tropopause across the subtropical-tropical transition in our study region. Further, phases of the Quasi-biennial oscillation (QBO) are identified using zonal-mean zonal wind data from radiosonde observations published by the Freie Universität Berlin (Naujokat, 1986). The classification of westerly and easterly QBO phases is based on winds at 70 hPa, over the equatorial latitude band (2° S–2° N). Periods with positive zonal wind values (> 0 m s−1) are identified as the westerly QBO (WQBO), while periods with negative zonal wind values (< 0 m s−1) are classified as the easterly QBO (EQBO).
2.2 Computation of ozone radiative forcing
The ozone radiative forcing (RF) is estimated using an ozone radiative kernel method (Skeie et al., 2020). The radiative kernel is constructed using the University of Oslo radiative transfer model (Myhre et al., 2011) by perturbing the ozone layer-by-layer. Temperature, water vapour, and clouds are incorporated into the model from ECMWF's forecast for the year 2003 and applied as monthly averages. The model calculates radiative forcing using a broad-band scheme for longwave radiation (Myhre and Stordal, 1997) and the DIScrete Ordinate Radiative Transfer (DISORT) code for shortwave radiation (Stamnes et al., 1988). Previous studies have shown that the ozone radiative forcing estimates from the radiative kernel technique and a radiative transfer model agree within 0.01 W m−2 globally (Iglesias-Suarez et al., 2018). Before applying the kernel, the ERA5 ozone data are linearly interpolated to the kernel resolution (∼5.6° × 5.6° horizontal, with 60 vertical levels). The interpolated ozone fields are first converted into layer-wise partial column amounts in Dobson units (DU) following Ziemke et al. (2001). Ozone anomalies in DU are then computed from the non-SSW climatology at each grid point. These layer-wise DU anomalies are multiplied by the long-wave instantaneous clear-sky ozone kernel (W m−2 DU−1), which gives the change in top-of-atmosphere (TOA) long-wave radiative flux (defined as an increase in net downward flux; Δ (Fin−Fout) > 0) per DU of ozone change in each layer. Following Shell et al. (2008), we calculate the instantaneous ozone RF by vertically summing the layer-wise TOA contributions from the UTLS and the total atmosphere.
3.1 Polar vortex evaluation in 2018 SSW event
The time evolution of the vortex structure depicted by PV at 10 hPa for ±60 d around the 2018 SSW onset is shown in Fig. 1. As the SSW event approaches, the vortex begins to elongate and become asymmetrical (Fig. 1a–g) due to the influence of planetary wave activity propagating upward from the troposphere; such deformation of the vortex was reported in the past (e.g., Baldwin et al., 2021). On the onset day (12 February), the vortex splits into two high-PV lobes, one positioned over North America and another over Eurasia (Fig. 1h). Following the onset, smaller vortices exhibit swirling and filamentation, with the Eurasian lobe drifting westward (Fig. 1i–j). Polar vortex splitting or deformations cause equatorward meandering of upper tropospheric jet that affect the Rossby wave breaking (RWB) and ozone intrusions in the mid-latitudes (Baldwin et al., 2021; Albers et al., 2016). The equatorial meandering of the jet may influence the tropical region; however such analysis is sparse. In the following sections we show the influence of the 2018 SSW on the South Asian region. First we show ozone variation in the UTLS over South Asia and then explain the associated dynamical changes in RWB and the upper tropospheric jet.
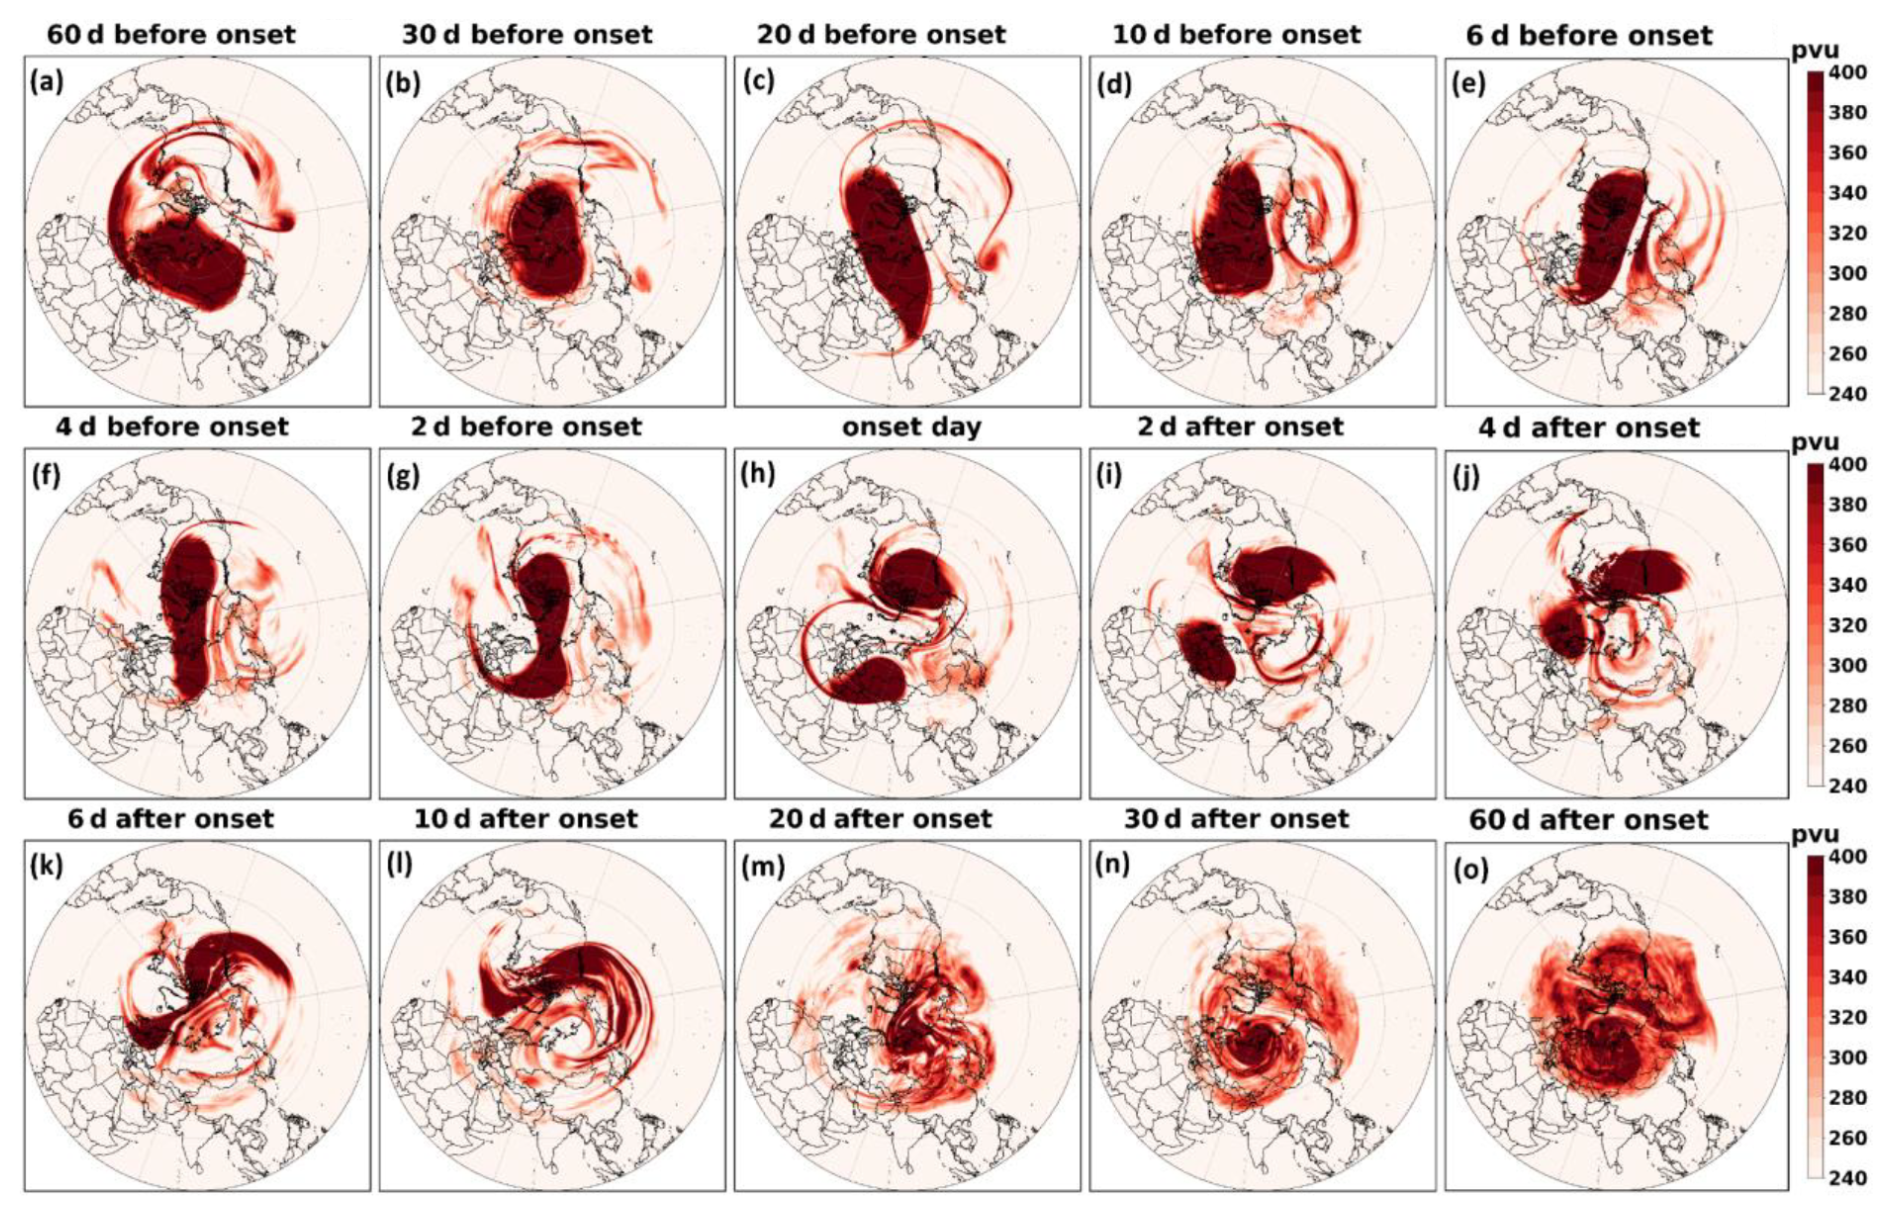
Figure 1Time slice of the spatial distribution of potential vorticity (PV) at 10 hPa from 60 d before to 30 d after the onset of the 2018 SSW event.
3.2 February 2018 SSW case: UTLS ozone variation
Figure 2a shows the vertical distribution of the temporal evolution of ozone anomalies averaged over South Asia for the 2018 SSW event. There is a large ozone enhancement in the UTLS, with values > 80 % (> 150 ppb) in 2018 within ±6 d around the SSW onset. Figure 2a indicates that the ozone enhancements in the UTLS region coincide with negative geopotential height (GPH) anomalies. Since the most pronounced ozone enhancement in the UTLS is observed within ±6 d around the SSW onset, all subsequent analyses in this study are performed for this time period. The latitude–pressure (Fig. 2b) and longitude-pressure (Fig. 2c) cross-sections of ozone anomalies show large ozone enhancement for ±6 d around the onset in the UTLS over South Asia, exceeding 60 % (> 80 ppb). Interestingly, a peak in ozone enhancement is seen at the subtropical jet core (Fig. 2b). This suggests the role of the subtropical jet causing ozone enhancement in the upper troposphere over South Asia. The strong negative GPH anomaly (indicating a low-pressure area) coincident with large ozone enhancements provides evidence of stratospheric intrusions occurring during the 2018 SSW event (Fig. 2c). In addition, the reduced tropopause height near the onset in Fig. 2a shows the occurrence of tropopause folds. Earlier studies have shown that Rossby wave breaking (RWB) produces tropopause folds, providing an efficient pathway for quasi-isentropic descent of ozone-rich stratospheric air into the UTLS (Sprenger et al., 2003; Holton et al., 1995). Past literature reports ozone enhancements in the polar region associated with SSW (e.g., Baldwin et al., 2021); however, high ozone enhancement in the UTLS over the South Asian region underscores the unique regional impacts of SSWs.
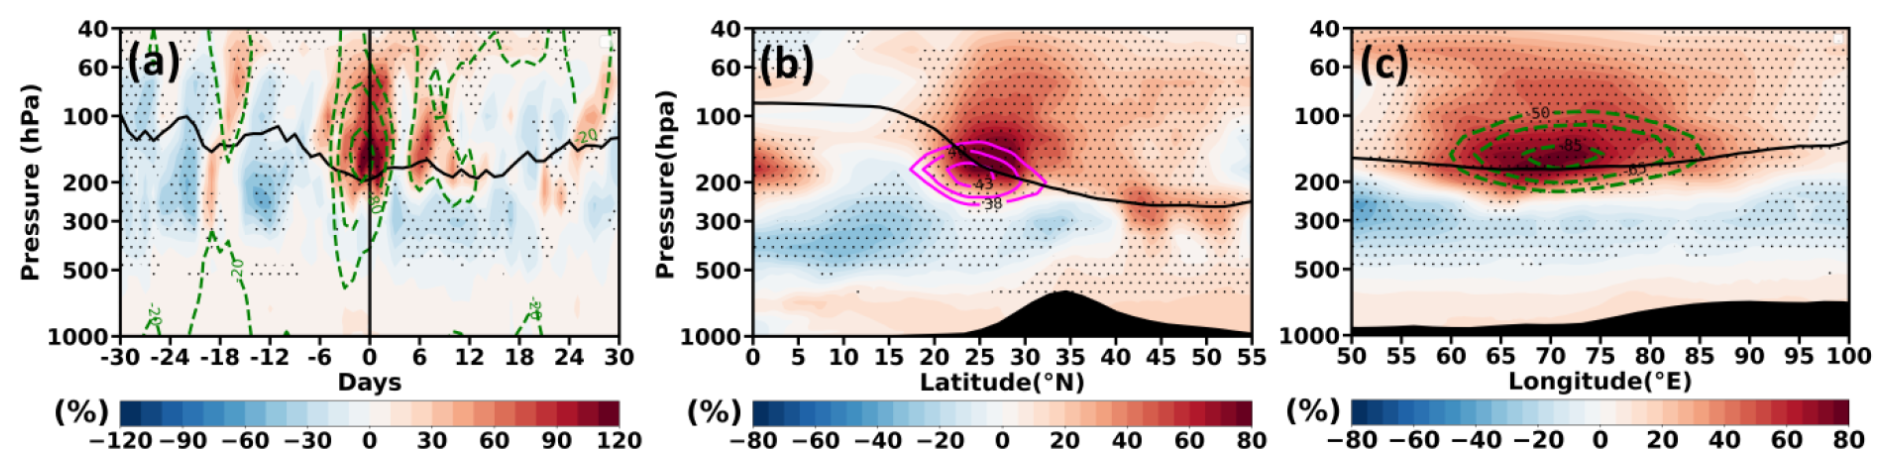
Figure 2(a) Temporal evolution of vertical ozone anomalies averaged over the South Asian region (65–90° E, 20–35° N) from 30 d before to 30 d after the onset for the 2018 event. (b) Latitude-pressure section of ozone anomalies averaged over South Asia (65–90° E) for ±6 d around the onset for 2018 SSW event. (c) is the same as that of (b) but represents longitude variations of vertical ozone anomalies averaged over South Asia (20–35° N). The vertical solid black line in (a) represents the onset day. Magenta solid contour lines in (b) represent the mean zonal wind and green dashed contour lines in (a) and (c) represent the GPH anomaly. Solid black lines in panels (a)–(c) represent the lapse rate tropopause. Black dots indicate a region of 95 % confidence level.
Further, we discuss the possible mechanism responsible for the ozone enhancement in the UTLS over South Asia associated with the 2018 SSW event. Several studies have shown that SSW-related planetary wave disturbances occur across a deep layer of the stratosphere (e.g., Albers et al., 2016). These disturbances extend downward and disrupt horizontal flows in the upper troposphere (200 hPa) (Albers et al., 2016). To explore the influence of these disturbances over the South Asian region, we analysed GPH anomalies at 200 hPa. The evolution of GPH anomalies at 200 hPa for ±2 d around the SSW onset (12 February 2018) is shown over the South Asian region in Fig. 3a–e and for the Northern Hemisphere in (Fig. S3a–e). In the Northern Hemisphere, patterns of high and low GPH anomalies at 200 hPa in the subtropical region (15–40° N) indicate the presence of synoptic-scale Rossby waves in the upper troposphere (Fig. S3a–e). The low GPH anomaly over South Asia (also see Fig. 3a–e) indicates a low-pressure area causing deepening of trough. It is associated with the eastward propagation of Rossby waves, which can facilitate enhanced stratospheric intrusions. RWB is characterised by large filaments of high-potential vorticity (PV) air extending towards the equator. The 2 PVU contour lines, along with ozone anomaly maps at 200 hPa, depicted in Fig. 3f–j show clear indications of RWB causing ozone intrusions over South Asia. Such quasi-isentropic equatorward excursions cause irreversible ozone intrusion from the lower stratosphere into the upper troposphere (e.g., Holton et al., 1995; Waugh and Polvani, 2000).
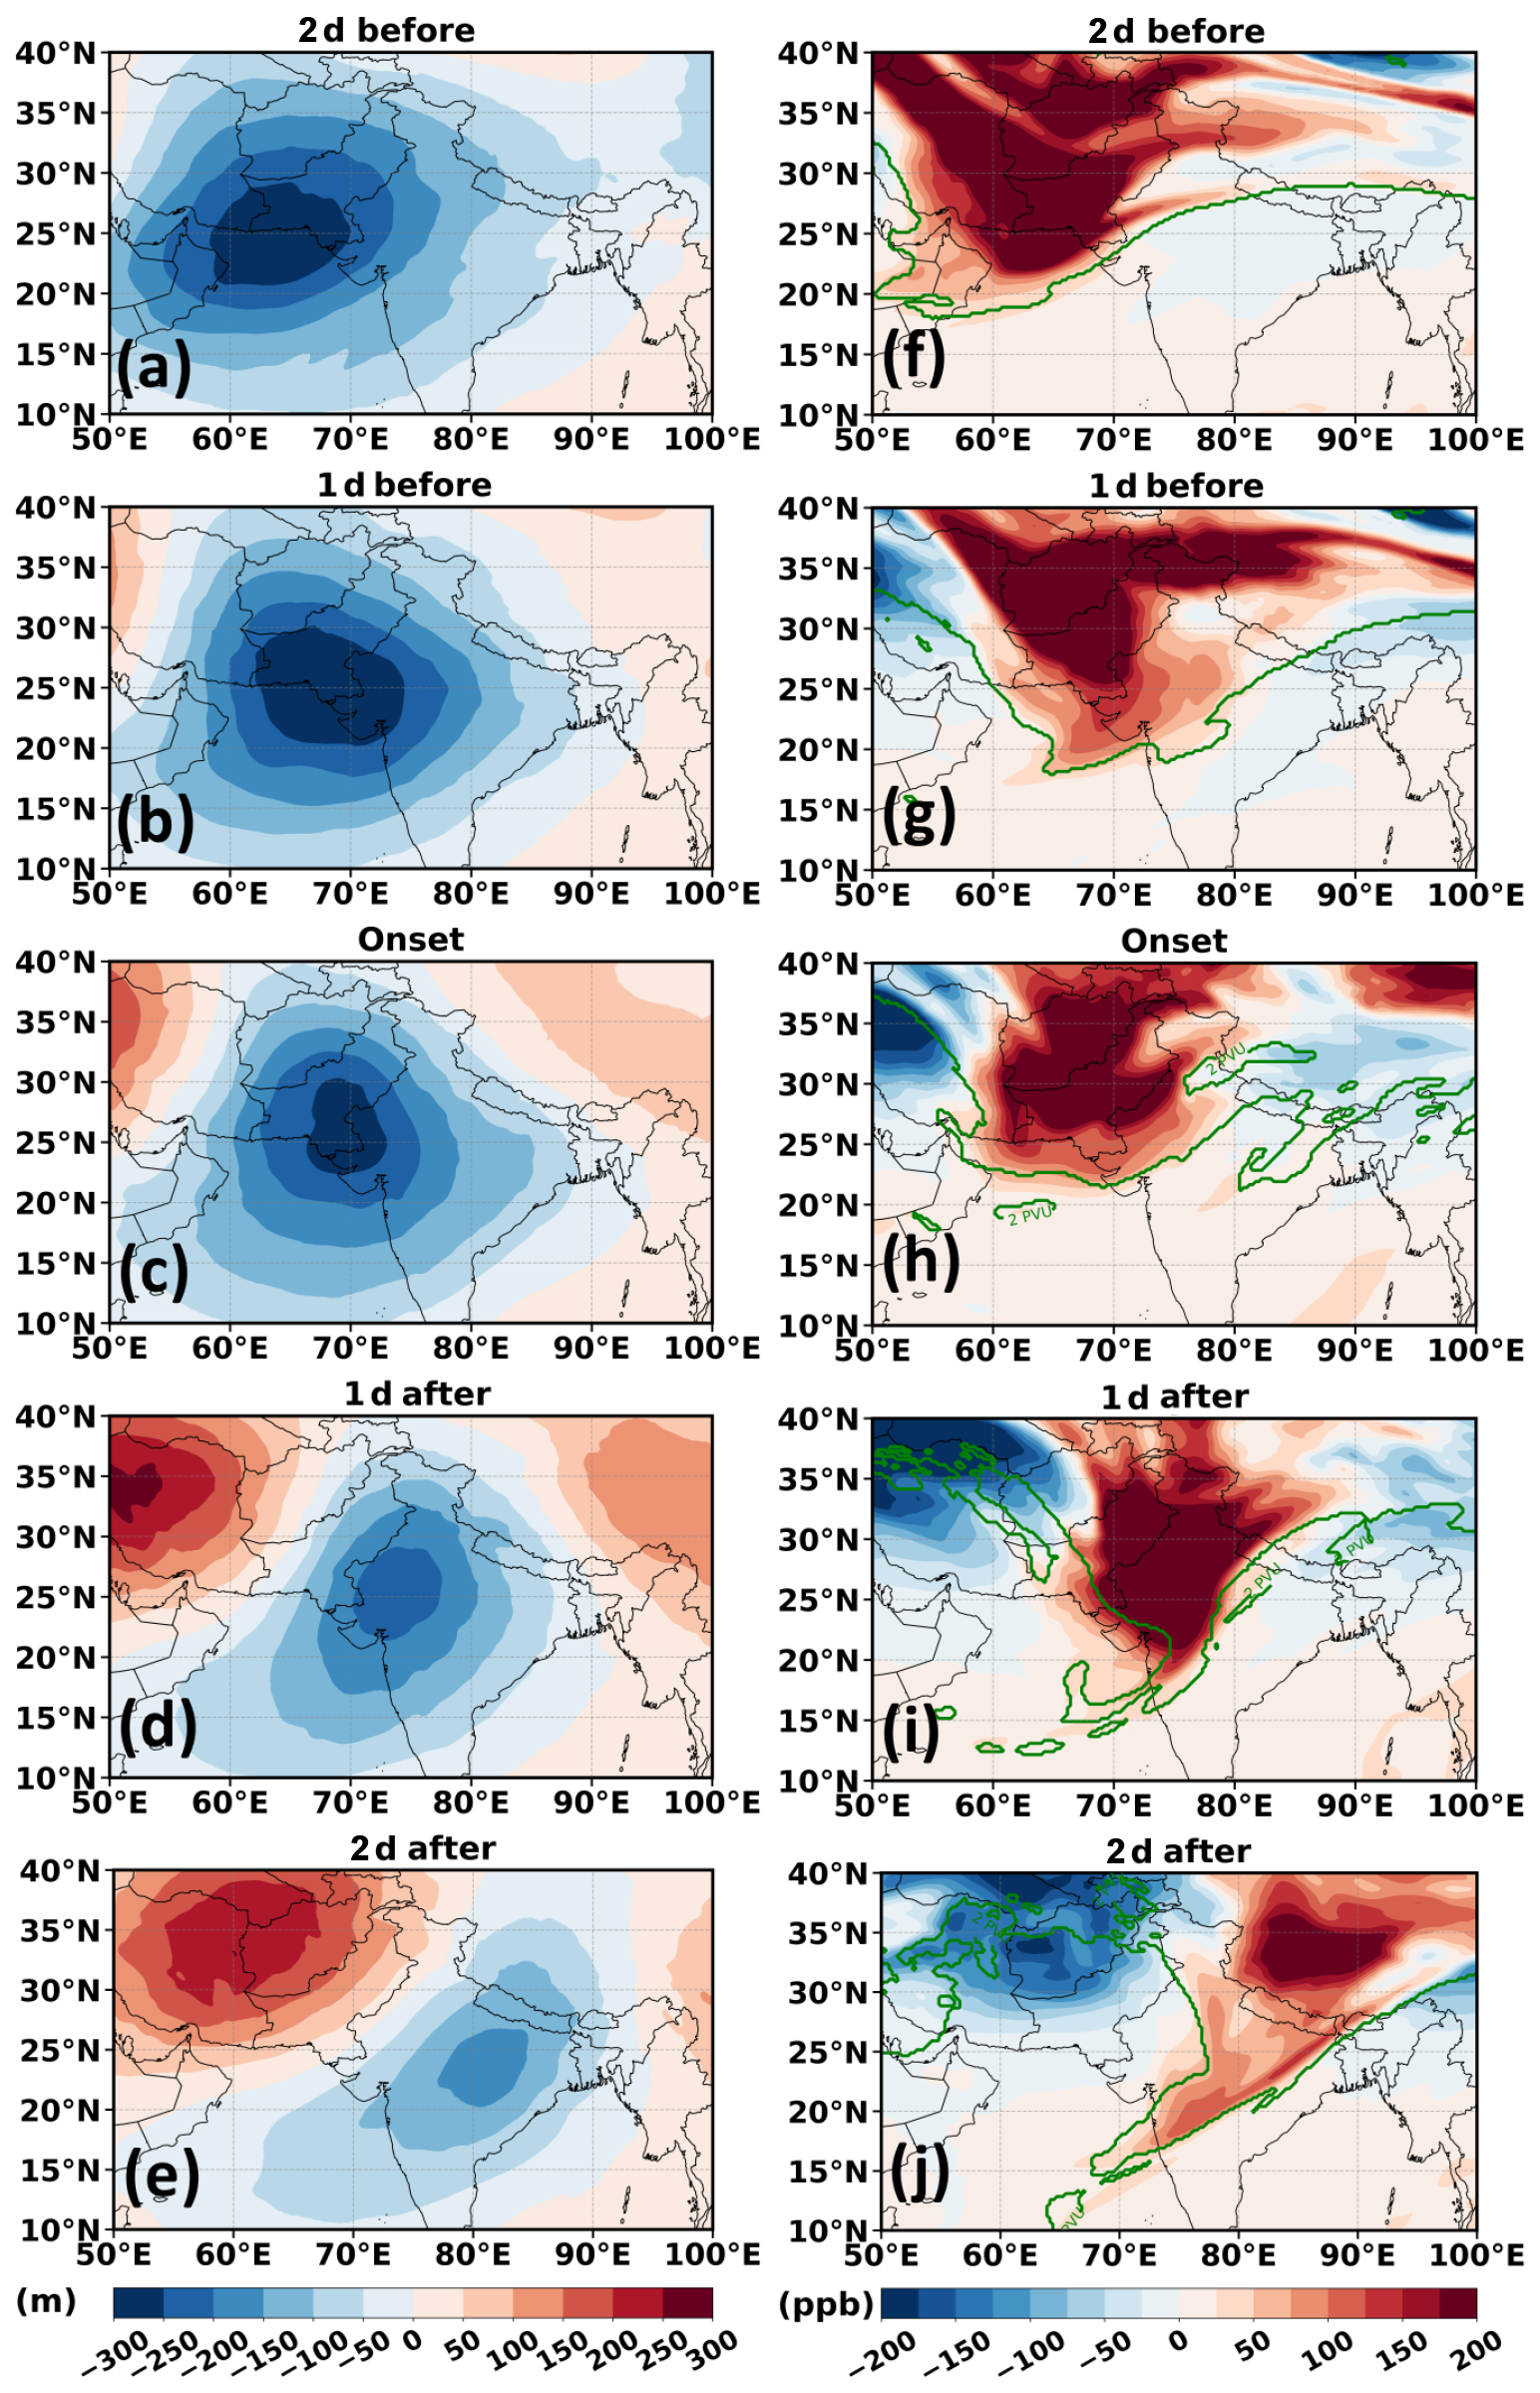
Figure 3Spatial map of (a–e) GPH anomaly at 200 hPa, (f–j) ozone anomaly at 200 hPa from 2 d before to 2 d after the onset of the 2018 SSW event, along with 2 PVU contour (green solid line), shown at 1 d intervals.
Figures 3f–j clearly show that intrusions near SSW onset days cause large ozone enhancements > 150 ppb (> 80 %) over South Asia. Since the location and strength of the subtropical jet set the refractive waveguide and the location of wave breaking (Hoskins and Ambrizzi, 1993; Hitchman and Huesmann, 2007), we next diagnose the jet's evolution during this period. Figure 4 displays the latitude-time Hovmöller diagrams of zonal wind at 200 hPa and the time-altitude section around the onset over the South Asian region. Figure 4 clearly shows the equatorward shift of the subtropical jet around onset, creating the background flow conducive to the RWB and ozone intrusions seen in Fig. 3. The time evolution of zonal winds depicted in Fig. 4a shows that thirty days before the onset, the subtropical jet core is positioned over the northern part of the Indian subcontinent, and migrates equatorward more prominently for ±6 d around the onset. The vertical variation of zonal wind (Fig. 4b) also indicates an equatorward displacement of the subtropical jet, with enhanced westerlies near 200 hPa extending into 10–20° N over 65–90° E around the onset day. Such changes in jet structure are consistent with a stronger upper-tropospheric Rossby-wave waveguide and background conditions under which RWB is more likely to occur near the tropopause (Hoskins and Ambrizzi, 1993; Homeyer and Bowman 2013).
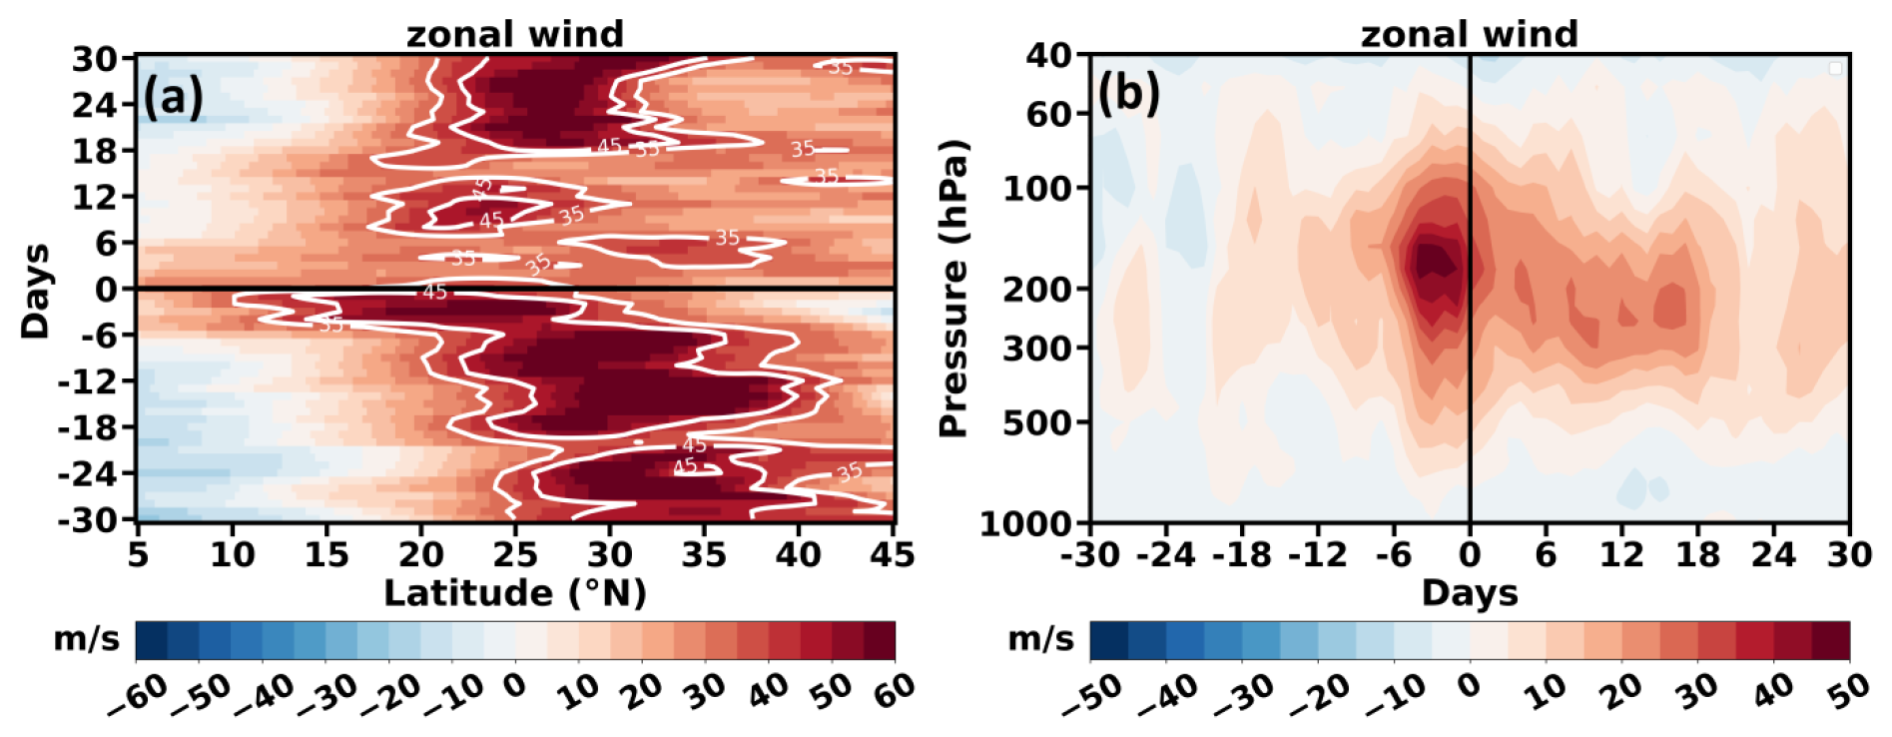
Figure 4(a) Latitude-time plot of zonal wind averaged over South Asia (65–90° E) at 200 hPa. (b) Time-pressure plot of zonal wind averaged over the South Asian region (65–90° E, 10–20° N) for ±30 d around the onset of the 2018 SSW event. The horizontal solid line in (a) and the vertical solid line in (b) represent the onset day.
The observed equatorward shift of the subtropical jet during the 2018 SSW may also be influenced by the concurrent phase of the Quasi-Biennial Oscillation (QBO) (e.g., White et al., 2016; Li et al., 2023). Notably, the February 2018 SSW took place during the westerly phase of the QBO (Butler et al., 2020). Earlier studies have reported an equatorward shift of the subtropical jet over the East Asia–North Pacific region during the westerly phase of QBO (Park et al., 2021). Our analysis reveals a similar equatorward displacement of the subtropical jet over South Asia during SSWs (Fig. 4a), coinciding with the westerly QBO phase. During the westerly QBO, the associated secondary circulation warms the equatorial lower stratosphere and cools the subtropics, sharpening and shifting the UTLS meridional temperature gradient equatorward (e.g., Hitchman et al., 2021). By thermal-wind balance, this strengthens upper-tropospheric westerlies on the equatorward flank and displaces the subtropical jet equatorward over South Asian longitudes, favouring subtropical wave guidance, RWB, and PV-streamer intrusions (Homeyer and Bowman, 2013; Albers et al., 2016). Additionally, previous studies have shown that the westerly phase of QBO (WQBO) is associated with a lowering of the tropopause (Collimore et al., 2003; Kumar et al., 2014). This lowering perturbs the subtropical waveguide structure and enhances tropopause fold activity (Kumar et al., 2020), thereby increasing the frequency of Rossby wave breaking and strengthening stratosphere–troposphere exchange, causing enhanced ozone intrusions. While these results support a physically plausible role of WQBO in preconditioning the subtropical jet and waveguide over South Asia, the detailed dynamical interaction between the QBO and the SSW that leads to the observed jet shift and enhanced RWB frequency is beyond the scope of present study.
3.3 Composite UTLS Ozone Response during all SSW Events
Further, we investigate the twenty-seven major SSW events from 1962 to 2017, to examine their influence on ozone variability in the upper troposphere over the South Asian region. Motivated by the 2018 case study, we examined whether the QBO-phase dependence is evident across events. Table 1 lists all the major SSW events considered in this study along with their QBO phases. Of the 27 major SSWs, 15 occur during the westerly phase (WQBO-SSW) and 12 during the easterly phase (EQBO-SSW).
Table 1List of all major SSW events from 1962 to 2018 considered for the present analysis alongside their onset dates and QBO phases at 70 hPa.
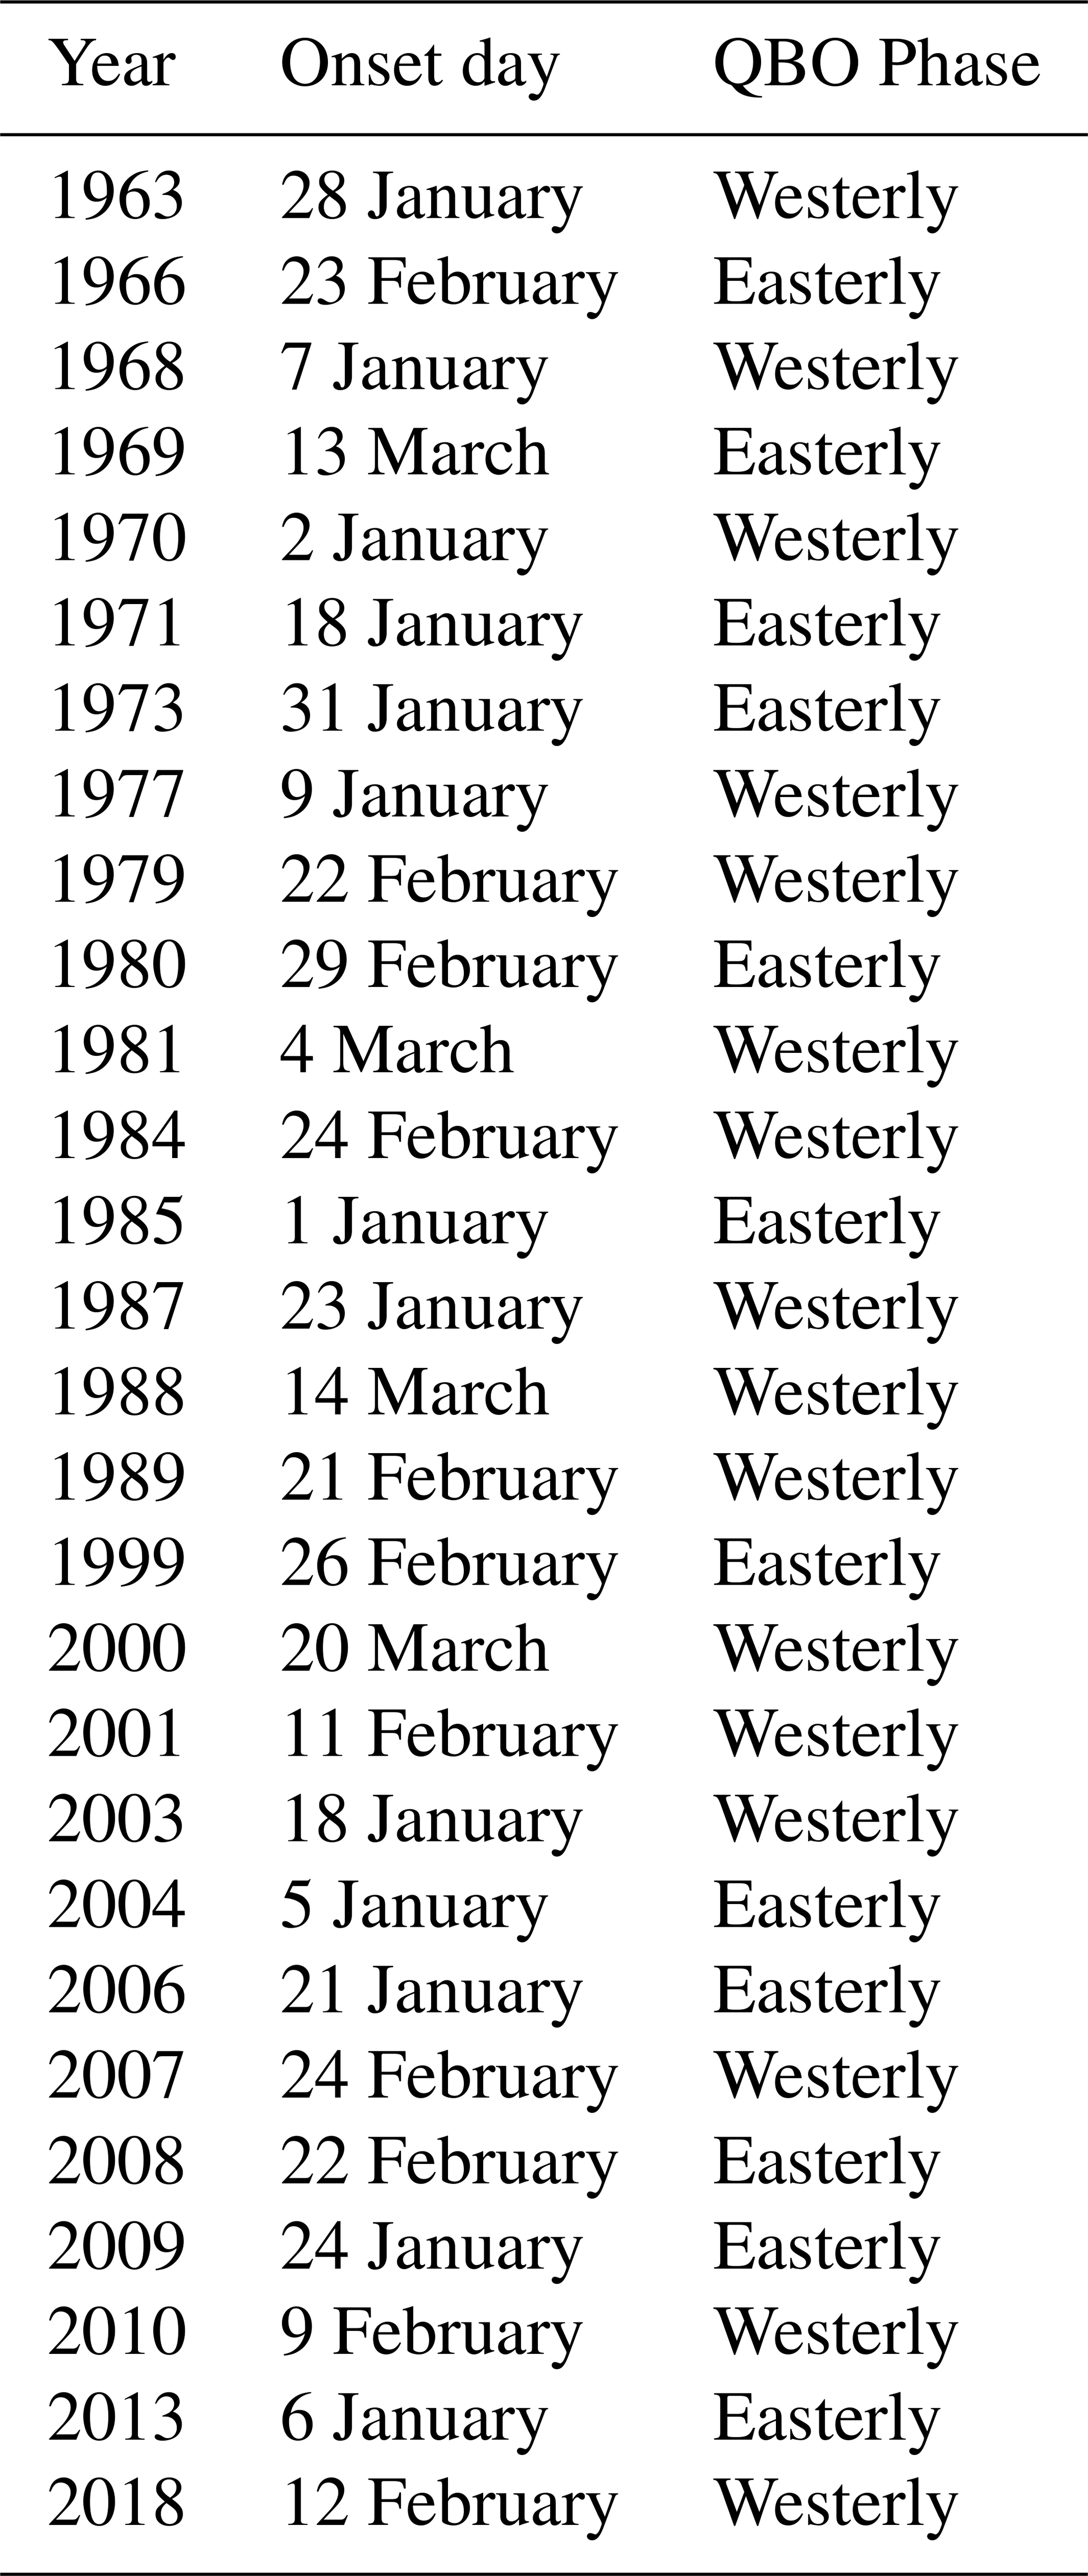
Figure 5a shows that, during the composite WQBO-SSW events, ozone intrudes down to 400 hPa, with anomalies exceeding ∼ 30 % (over 80 ppb) within ±6 d of the onset. On the other hand, during the composite EQBO-SSW events, no significant ozone intrusion is evident within the same period (Fig. 5b). The latitude–pressure (Fig. 5c) and longitude–pressure (Fig. 5d) sections for WQBO-SSW further reveal enhanced ozone in the UTLS within ±6 d over South Asia, with anomalies increases by 20 % (> 60 ppb) compared to climatology. As seen earlier (Fig. 2b–c), the maximum ozone enhancement in the WQBO–SSW composite is located near the subtropical jet core (Fig. 5c) along with a strong negative GPH anomaly (Fig. 5d), indicating that jet dynamics play a key role in UTLS ozone enhancement during WQBO-SSW. These enhancements are smaller than in 2018. This may be due to variation in space and time of ozone intrusions during individual SSW. The averaging across multiple events may subdue the effect but it remains statistically significant.
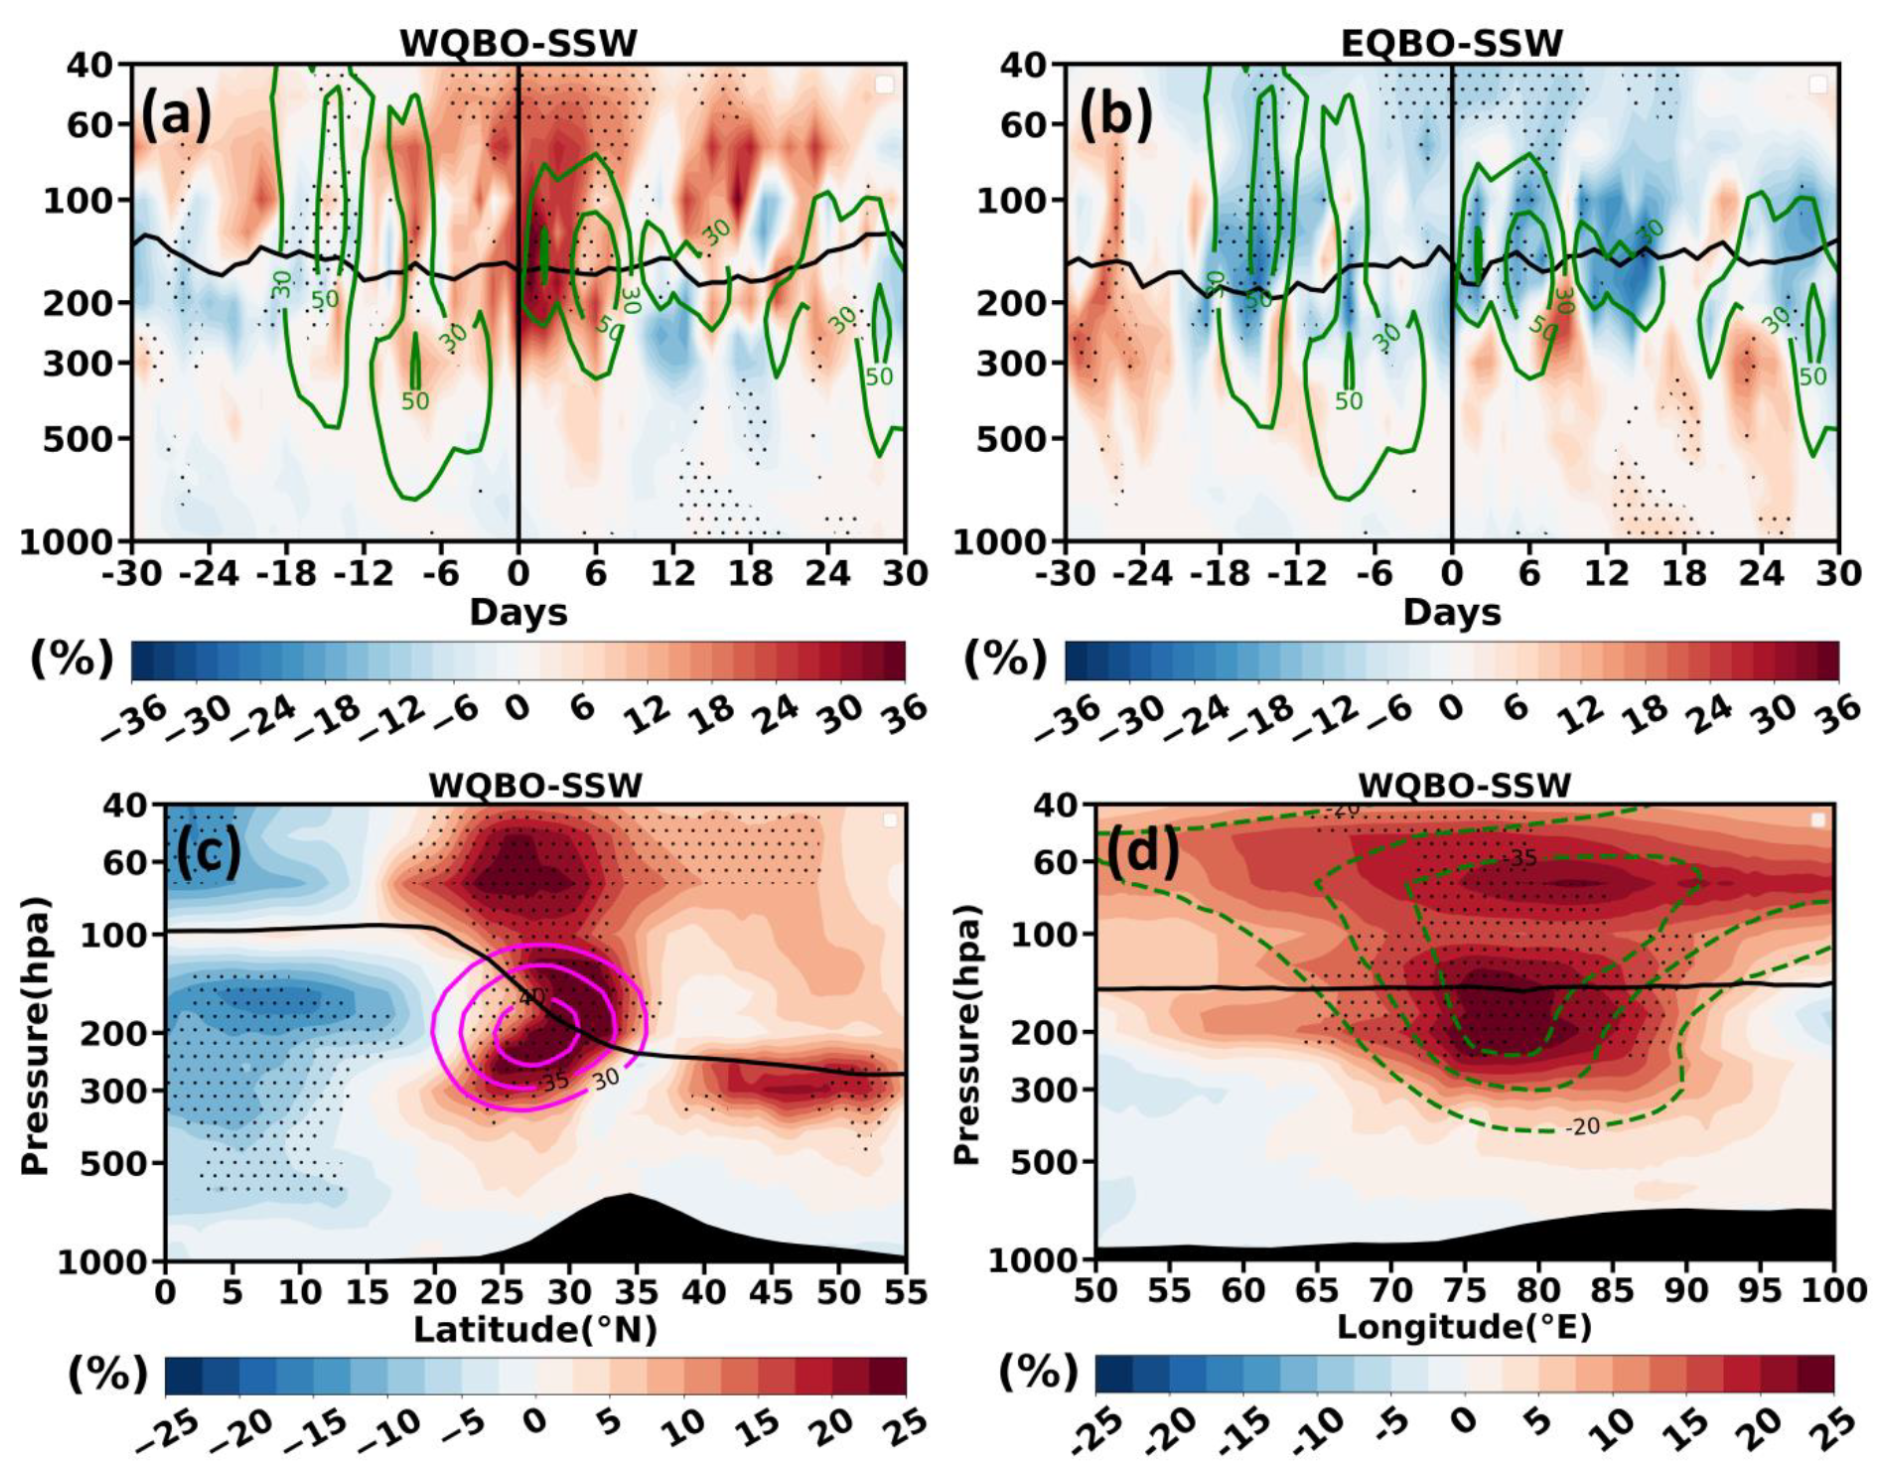
Figure 5Temporal evolution of vertical ozone anomalies averaged over the South Asian region (65–90° E, 20–35° N) from 30 d before to 30 d after the onset for (a) WQBO-SSW and (b) EQBO-SSW. (c) Latitude-pressure cross-section of ozone anomalies averaged over South Asia (65–90° E) for ±6 d around all the WQBO-SSW onsets. (d) is the same as that of (c) but represents the longitude variation of vertical ozone anomalies averaged over South Asia (20–35° N). The vertical solid line in (a)–(b) represents the onset day. Magenta contour lines in (c) represent the mean zonal wind, and dashed green contour lines in (a) and (d) represent the negative GPH anomaly and solid green contour lines in (b) represent the positive GPH anomaly. Solid black lines in (a-d) represent the lapse rate tropopause. Black dots indicate a region of 95 % confidence level.
Further, we analysed the GPH anomaly in the upper troposphere for WQBO-SSW and EQBO-SSW composites within ±6 d around the onset (at 200 hPa) (Fig. 6a–b). The alternating trough–ridge patterns in GPH over the subtropics indicate synoptic-scale Rossby waves in the upper troposphere. During the WQBO-SSW, a pronounced negative GPH anomaly is observed over the South Asian region (Fig. 6a), whereas positive GPH anomalies dominates during the EQBO-SSW (Fig. 6b). The anomalous low over South Asia during WQBO-SSW events indicates a deepening of the upper-tropospheric trough, which favours the tropopause folding and associated stratospheric intrusions into the upper troposphere (e.g., Knowland et al., 2017; Sprenger et al., 2007).
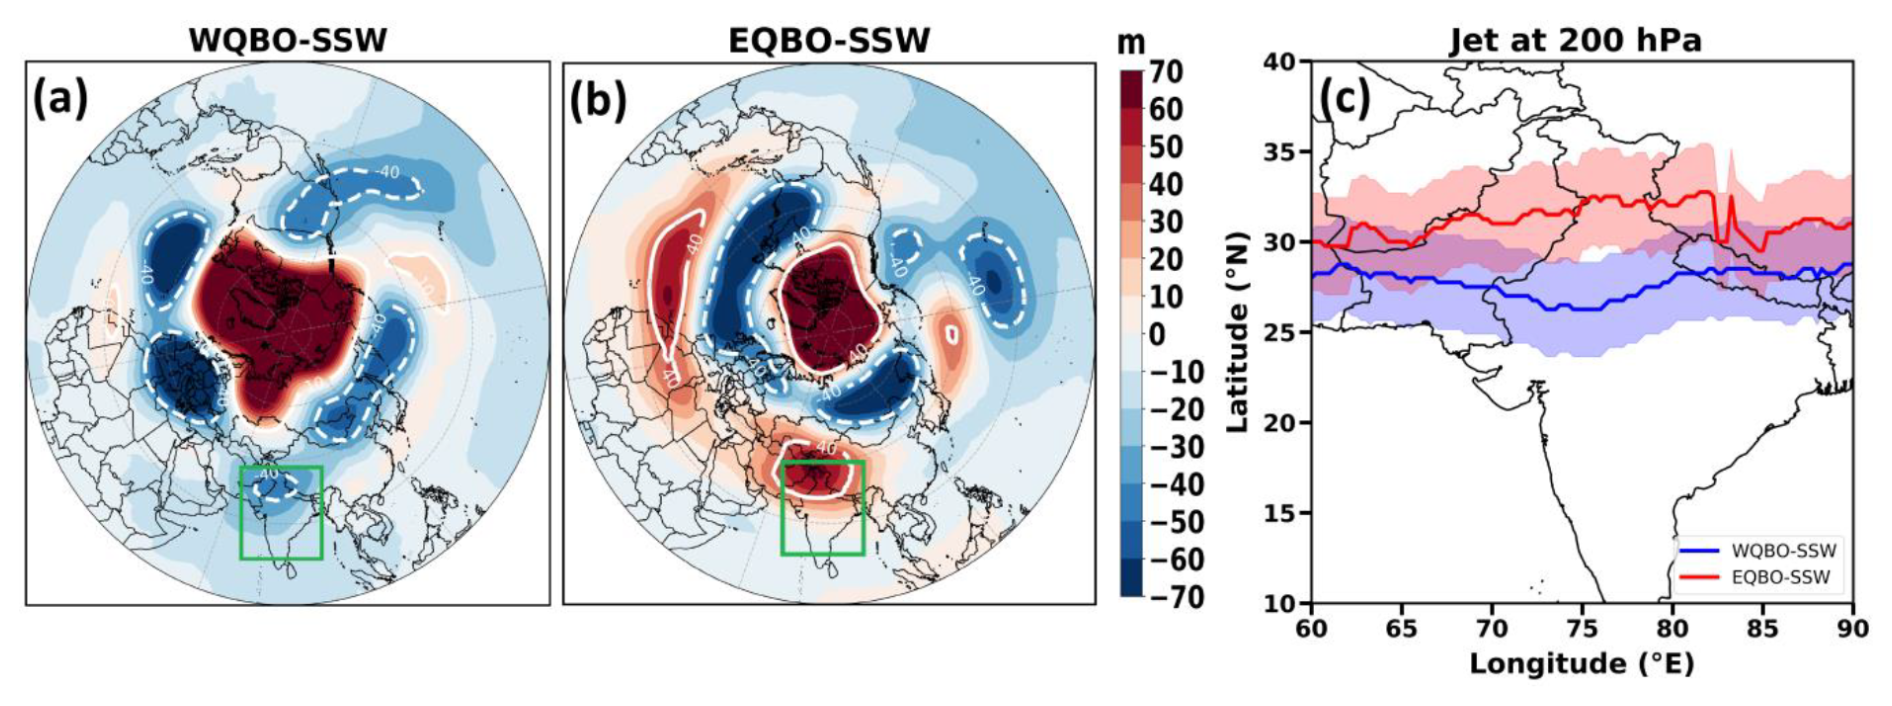
Figure 6Spatial map of GPH anomaly for (a) WQBO-SSW and (b) EQBO-SSW and (c) jet core at 200 hPa averaged for ±6 d around the onset. White solid and dashed contour line in (a)–(b) indicates positive and negative GPH anomaly. The square box in (a)–(b) represents the South Asian region considered for the present study. Blue line and red line in (c) represents the jet core for westerly phase and easterly phase of QBO respectively. The shading in (c) represents standard error.
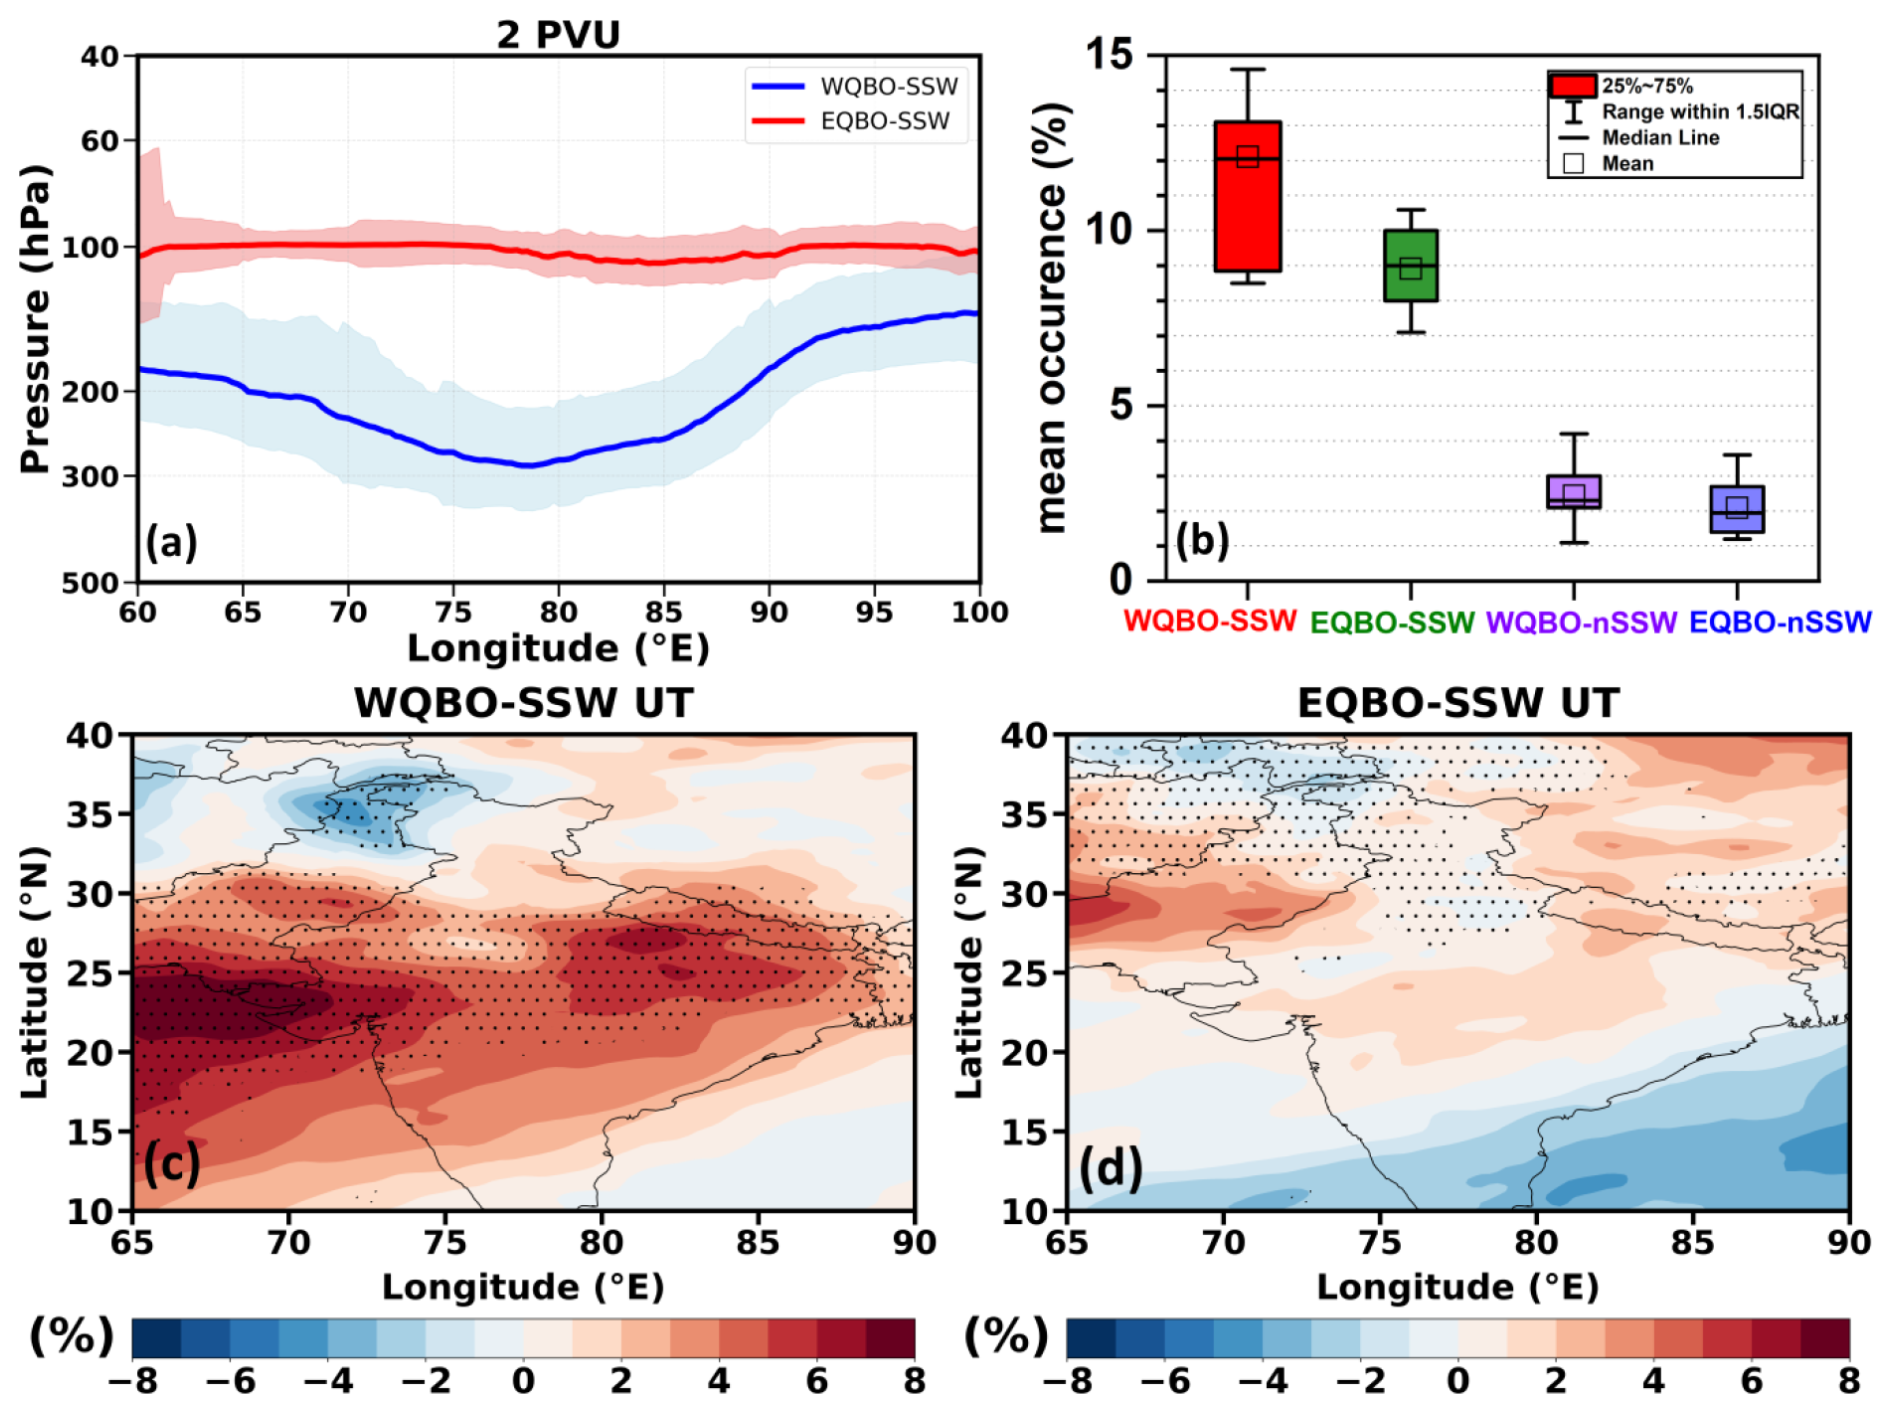
Figure 7(a) Longitude-pressure cross section of 2PVU line averaged over South Asia (20–35° N) for WQBO-SSW and EQBO-SSW composites, shown for the days of deepest intrusion selected within ±6 d around the onset. The shading represents standard error. (b) Area-averaged occurrence frequency (%) of ozone-rich high-PV intrusion signatures consistent with Rossby wave breaking events during January–March over South Asia identified from PV > 2 and Ozone > 80 ppbv at 300 hPa for WQBO-SSW, EQBO-SSW, WQBO-nonSSW, and EQBO-nonSSW. (c) Upper tropospheric ozone anomaly composites (400–250 hPa; in %) for ±30 d around onset for WQBO-SSW relative to the corresponding phase-matched non-SSW climatology WQBO-nonSSW. (d) same as that of (c) but for EQBO-SSW relative to the corresponding phase-matched non-SSW climatology EQBO-nonSSW. Stippling indicates a region of 95 % confidence level.
Further, we show the position of the subtropical jet core within ±6 d around the SSW onset (within ±6 d) for WQBO-SSW and EQBO-SSW. Figure 6c shows that during WQBO-SSW, the subtropical jet shifts equatorwardsouth of 30° N. Whereas, during the EQBO-SSW, the jet (red line) remains north of 30° N. (Detailed mechanism discussed in the Sect. 3.2).
Figure 7a shows the longitude-pressure cross-section of 2PVU for WQBO–SSW and EQBO–SSW. The figure shows that during the WQBO–SSW, the 2 PVU contour bends downward. While during EQBO–SSW events, the 2 PVU contour remains at higher altitudes, suggesting weaker intrusions. The bending of the 2PVU line is associated with RWB and tropopause folds. We further computed the occurrence frequency of RWB over South Asia for WQBO-SSW, EQBO-SSW, WQBO-nonSSW, and EQBO-nonSSW. Figure 7b shows the highest occurrence of RWB (∼12 %) for WQBO-SSW. Upper tropospheric ozone anomalies (400–250 hPa) are also highest (∼8 %) for WQBO-SSW (Fig. 7c–d).
3.4 Radiative Forcing of ozone associated with WQBO-SSWs over the South Asian region
Further, we assessed instantaneous radiative forcing at the top of the atmosphere (TOA) due to ozone enhancements in (1) the UTLS and (2) total-column over the South Asian region associated with WQBO-SSW events. The instantaneous RF is computed for ±6 d around the onset. The estimated RF at the TOA due to the total-column ozone changes is 0.28±0.19 W m−2 for the 2018 event and 0.17±0.05 W m−2 for the composite. These results highlight the significant role of WQBO-SSW events in modulating the radiative balance at the TOA over South Asia. RF at TOA due to the ozone enhancements in the UTLS is 0.25±0.18 W m−2 for the 2018 SSW, while the WQBO-SSW composite produces a forcing of 0.09±0.05 W m−2. This radiative forcing is due to changes in ozone in the UTLS, where the ozone radiative forcing efficiency is greatest (e.g., Forster and Shine 1997). These changes in RF can alter local heating rate, temperature, stability, and influence high clouds (e.g., Xia et al., 2018; Nowack et al., 2014).
Using the ERA5 reanalysis (1962–2018), we investigated the impact of sudden stratospheric warmings (SSWs) on ozone variations in the UTLS (300–50 hPa) over South Asia. Unlike prior global analyses, we demonstrate that SSWs coinciding with the westerly phase of QBO (WQBO-SSW) lead to a substantial enhancement in UTLS ozone and radiative forcing over South Asia. Our analysis shows that the influence of SSW over South Asia is mediated by Rossby-wave dynamics. However, it should be noted that the interaction between the QBO and the SSW leading to the change in the jet and the corresponding RWB breaking is complex. The involved dynamics is beyond the scope of this study.
We find that SSWs coinciding with the westerly phase of the QBO (WQBO-SSW) are associated with an equatorward shift of the subtropical jet (south of 30° N) and intensification of RWB.This causes a large ozone enhancement in the UTLS over South Asia (150 ppb (80 %) for 2018 and 80 ppb (30 %) for WQBO-SSW composite). This ozone enhancement in the UTLS during WQBO-SSW events enhances an instantaneous radiative forcing at the top of the atmosphere by 0.25±0.18 W m−2 for the 2018 and 0.09±0.05 W m−2 during the composite of all WQBO-SSW. The total-column ozone changes enhance the instantaneous RF at the top of the atmosphere increases by 0.28±0.19 W m−2 for 2018 and 0.17±0.05 W m−2 for the WQBO-SSW composite. This enhancement in TOA radiative forcing does not necessarily imply surface warming, as ozone perturbations can also induce negative surface radiative forcing. For example, Williams et al. (2024) reported a surface forcing of −0.36 W m−2 associated with an increase in ozone in the UTLS. Our radiative kernel method does not estimate a surface forcing associated with ozone changes in the UTLS. The enhancements in ozone and associated RF can affect the stability and temperature of the UTLS, high clouds, and the STE. However, such analysis is beyond the scope of the present study.
Since the evolution of the polar vortex modulates the subtropical jet that affects South Asia, these stratospheric influences must be represented in regional prediction systems. Earlier studies have shown that using high-top, stratosphere-resolving models improve subseasonal-to-seasonal predictability (Hardiman et al., 2012; Scaife et al., 2022). We emphasise that models should be extended to the stratosphere, including polar vortex dynamics, for accurate sub seasonal-to-seasonal prediction over South Asia.
The ERA5 reanalysis data used in this study are publicly available from the Copernicus Climate Change Service (C3S) Climate Data Store (https://doi.org/10.24381/cds.bd0915c6, Hersbach et al., 2023). All the Figures are created using the Python software. The python code used to plot figures in this paper are available on Zenodo (https://doi.org/10.5281/zenodo.17639489, Roy et al., 2025).
The supplement related to this article is available online at https://doi.org/10.5194/acp-26-7047-2026-supplement.
Conceptualisation: SF Supervision: SF, MH, RF Investigation and methodology: SR, SC, VS, and PC. Writing: all authors.
At least one of the (co-)authors is a member of the editorial board of Atmospheric Chemistry and Physics. The peer-review process was guided by an independent editor, and the authors also have no other competing interests to declare.
Publisher's note: Copernicus Publications remains neutral with regard to jurisdictional claims made in the text, published maps, institutional affiliations, or any other geographical representation in this paper. The authors bear the ultimate responsibility for providing appropriate place names. Views expressed in the text are those of the authors and do not necessarily reflect the views of the publisher.
This article is part of the special issue “Exploring impacts of troposphere–stratosphere coupling processes and challenges of forecasting extreme events in the Asian summer monsoon in a changing climate (ACP/WCD inter-journal SI)”. It is a result of the International Workshop on Stratosphere-Troposphere Interactions and Prediction of Monsoon weather EXtremes (STIPMEX), Pune, India, 2–7 June 2024.
The authors thank the staff of the High Power Computing Centre (HPC) in IITM, Pune, India, for providing computer resources and the team members of ERA5 for providing data. The authors are thankful to three anonymous reviewers for their valuable suggestions.
This paper was edited by Gabriele Stiller and reviewed by three anonymous referees.
Albers, J. R., Kiladis, G. N., Birner, T., and Dias, J.: Tropical upper-tropospheric potential vorticity intrusions during sudden stratospheric warmings, J. Atmos. Sci., 73, 2361–2384, https://doi.org/10.1175/jas-d-15-0238.1, 2016.
Baldwin, M. P. and Dunkerton, T. J.: Stratospheric harbingers of anomalous weather regimes, Science, 294, 581–584, https://doi.org/10.1126/science.1063315, 2001.
Baldwin, M. P., Domeisen, D. I. V., Hegglin, M. I., Garny, H., Garfinkel, C. I., Langematz, U., Charlton-Perez, A. J., Butchart, N., Gerber, E. P., Birner, T., Butler, A. H., Ayarzagüena, B., and Pedatella, N. M.: Sudden Stratospheric Warmings, Rev. Geophys., 59, https://doi.org/10.1029/2020rg000708, 2021.
Butler, A. H., Seidel, D. J., Hardiman, S. C., Butchart, N., Birner, T., and Match, A.: Defining sudden stratospheric warmings, B. Am. Meteorol. Soc., 96, 1913–1928, https://doi.org/10.1175/bams-d-13-00173.1, 2015.
Butler, A. H., Lillo, S. P., Long, C. S., Lee, S. H., and Lawrence, Z. D.: Differences between the 2018 and 2019 stratospheric polar vortex split events, Q. J. Roy. Meteor. Soc., 146, 3503–3521, https://doi.org/10.1002/qj.3858, 2020.
Charlton, A. J. and Polvani, L. M.: A new look at stratospheric sudden warmings. part I: Climatology and modeling benchmarks, J. Climate, 20, 449–469, https://doi.org/10.1175/jcli3996.1, 2007.
Charlton-Perez, A. J., Polvani, L. M., Austin, J., and Li, F.: The frequency and dynamics of stratospheric sudden warmings in the 21st century, J. Geophys. Res.-Atmos., 113, https://doi.org/10.1029/2007jd009571, 2008.
Collimore, C. C., Huesmann, A., Martin, D. W., Hitchman, M. H., and Waliser, D. E.: On The Relationship between the QBO and Tropical Deep Convection, J. Climate, 16, 2552–2568, https://doi.org/10.1175/1520-0442(2003)016<2552:otrbtq>2.0.co;2, 2003.
Dai, Y., Hitchcock, P., Mahowald, N. M., Domeisen, D. I., Hamilton, D. S., Li, L., Marticorena, B., Kanakidou, M., Mihalopoulos, N., and Aboagye-Okyere, A.: Stratospheric impacts on dust transport and air pollution in West Africa and the Eastern Mediterranean, Nat. Commun., 13, https://doi.org/10.1038/s41467-022-35403-1, 2022.
Dewan, S. and Lakhani, A.: Tropospheric ozone and its natural precursors impacted by climatic changes in emission and dynamics, Front. Environ. Sci., 10, https://doi.org/10.3389/fenvs.2022.1007942, 2022.
Domeisen, D. I. and Butler, A. H.: Stratospheric drivers of extreme events at the Earth's surface, Commun. Earth Environ., 1, https://doi.org/10.1038/s43247-020-00060-z, 2020.
Fadnavis, S., Chakraborty, T., and Beig, G.: Seasonal stratospheric intrusion of ozone in the upper troposphere over India, Ann. Geophys., 28, 2149–2159, https://doi.org/10.5194/angeo-28-2149-2010, 2010.
Fadnavis, S., Wienhold, F. G., Müller, R., Oelsner, P., Vogel, B., Naja, M., Sonbawne, S., Dirksen, R., Sagalgile, A., and Peter, T.: Comparison of ozonesonde measurements in the upper troposphere and lower Stratosphere in Northern India with reanalysis and chemistry-climate-model data, Sci. Rep., 13, https://doi.org/10.1038/s41598-023-34330-5, 2023.
Feng, Z., Agathokleous, E., Yue, X., Oksanen, E., Paoletti, E., Sase, H., Gandin, A., Koike, T., Calatayud, V., Yuan, X., Liu, X., De Marco, A., Jolivet, Y., Kontunen-Soppela, S., Hoshika, Y., Saji, H., Li, P., Li, Z., Watanabe, M., and Kobayashi, K.: Emerging challenges of ozone impacts on Asian plants: Actions are needed to protect ecosystem health, Ecosystem Health and Sustainability, 7, https://doi.org/10.1080/20964129.2021.1911602, 2021.
Fleming, Z. L., Doherty, R. M., von Schneidemesser, E., Malley, C. S., Cooper, O. R., Pinto, J. P., Colette, A., Xu, X., Simpson, D., Schultz, M. G., Lefohn, A. S., Hamad, S., Moolla, R., Solberg, S., and Feng, Z.: Tropospheric Ozone Assessment Report: Present-day ozone distribution and trends relevant to human health, Elementa: Science of the Anthropocene, 6, https://doi.org/10.1525/elementa.273, 2018.
Hall, R. J., Mitchell, D. M., Seviour, W. J., and Wright, C. J.: Tracking the stratosphere-to-surface impact of sudden stratospheric warmings, J. Geophys. Res.-Atmos., 126, https://doi.org/10.1029/2020jd033881, 2021.
Hardiman, S. C., Butchart, N., Hinton, T. J., Gray, L. J., and Osprey, S. M.: The Effect of a Well-Resolved Stratosphere on Surface Climate: Differences between CMIP5 Simulations with High and Low Top Versions of the Met Office Climate Model, J. Climate, 25, 7083–7099, https://doi.org/10.1175/jcli-d-11-00579.1, 2012.
Hersbach, H., Bell, B., Berrisford, P., Hirahara, S., Horányi, A., Muñoz-Sabater, J., Nicolas, J., Peubey, C., Radu, R., Schepers, D., Simmons, A., Soci, C., Abdalla, S., Abellan, X., Balsamo, G., Bechtold, P., Biavati, G., Bidlot, J., Bonavita, M., De Chiara, G., Dahlgren, P., Dee, D., Diamantakis, M., Dragani, R., Flemming, J., Forbes, R., Fuentes, M., Geer, A., Haimberger, L., Healy, S., Hogan, R. J., Hólm, E., Janisková, M., Keeley, S., Laloyaux, P., Lopez, P., Lupu, C., Radnoti, G., de Rosnay, P., Rozum, I., Vamborg, F., Villaume, S., and Thépaut, J.: The ERA5 global reanalysis, Q. J. Roy. Meteor. Soc., 146, 1999–2049, https://doi.org/10.1002/qj.3803, 2020.
Hersbach, H., Bell, B., Berrisford, P., Biavati, G., Horányi, A., Muñoz Sabater, J., Nicolas, J., Peubey, C., Radu, R., Rozum, I., Schepers, D., Simmons, A., Soci, C., Dee, D., and Thépaut, J.-N.: ERA5 hourly data on pressure levels from 1940 to present, Copernicus Climate Change Service (C3S) Climate Data Store (CDS) [data set], https://doi.org/10.24381/cds.bd0915c6, 2023.
Hitchman, M. H. and Huesmann, A. S.: A Seasonal Climatology of Rossby Wave Breaking in the 320–2000-K Layer, J. Atmos. Sci., 64, 1922–1940, https://doi.org/10.1175/jas3927.1, 2007.
Hitchman, M. H., Tegtmeier, S., Yoden, S., Haynes, P. H., and Kumar, V.: An Observational History of the Direct Influence of the Stratospheric Quasi-biennial Oscillation on the Tropical and Subtropical Upper Troposphere and Lower Stratosphere, J. Meteorol. Soc. Jpn. Ser. II, 99, 239–267, https://doi.org/10.2151/jmsj.2021-012, 2021.
Hoffmann, L. and Spang, R.: An assessment of tropopause characteristics of the ERA5 and ERA-Interim meteorological reanalyses, Atmos. Chem. Phys., 22, 4019–4046, https://doi.org/10.5194/acp-22-4019-2022, 2022.
Holton, J. R., Haynes, P. H., McIntyre, M. E., Douglass, A. R., Rood, R. B., and Pfister, L.: Stratosphere-Troposphere exchange, Rev. Geophys., 33, 403–439, https://doi.org/10.1029/95rg02097, 1995.
Homeyer, C. R. and Bowman, K. P.: Rossby Wave Breaking and Transport between the Tropics and Extratropics above the Subtropical Jet, J. Atmos. Sci., 70, 607–626, https://doi.org/10.1175/jas-d-12-0198.1, 2013.
Hoskins, B. J. and Ambrizzi, T.: Rossby Wave Propagation on a Realistic Longitudinally Varying Flow, J. Atmos. Sci., 50, 1661–1671, https://doi.org/10.1175/1520-0469(1993)050<1661:rwpoar>2.0.co;2, 1993.
Iglesias-Suarez, F., Kinnison, D. E., Rap, A., Maycock, A. C., Wild, O., and Young, P. J.: Key drivers of ozone change and its radiative forcing over the 21st century, Atmos. Chem. Phys., 18, 6121–6139, https://doi.org/10.5194/acp-18-6121-2018, 2018.
Kidston, J., Scaife, A. A., Hardiman, S. C., Mitchell, D. M., Butchart, N., Baldwin, M. P., and Gray, L. J.: Stratospheric influence on tropospheric jet streams, storm tracks and Surface Weather, Nat. Geosci., 8, 433–440, https://doi.org/10.1038/ngeo2424, 2015.
Knowland, K. E., Ott, L. E., Duncan, B. N., and Wargan, K.: Stratospheric intrusion-influenced ozone air quality exceedances investigated in the NASA Merra-2 Reanalysis, Geophys. Res. Lett., 44, https://doi.org/10.1002/2017gl074532, 2017.
Kumar, V., Dhaka, S. K., Reddy, K. K., Gupta, A., Prasad, S. B. S., Panwar, V., Singh, N., Ho, S.-P., and Takahashi, M.: Impact of quasi-biennial oscillation on the inter-annual variability of the tropopause height and temperature in the tropics: A study using COSMIC/FORMOSAT-3 observations, Atmos. Res., 139, 62–70, https://doi.org/10.1016/j.atmosres.2013.12.014, 2014.
Kumar, K. N., Sharma, S. K., Naja, M., and Phanikumar, D. V.: A Rossby wave breaking-induced enhancement in the tropospheric ozone over the Central Himalayan region, Atmos. Environ., 224, 117356, https://doi.org/10.1016/j.atmosenv.2020.117356, 2020.
Kunz, A., Konopka, P., Müller, R., and Pan, L. L.: Dynamical tropopause based on isentropic potential vorticity gradients, J. Geophys. Res., 116, https://doi.org/10.1029/2010jd014343, 2011.
Li, H., Fan, Y., Li, Q., Ji, X., Zhang, J., and Sheng, B.: The Gravity Wave Activity during Two Recent QBO Disruptions Revealed by U.S. High-Resolution Radiosonde Data, Remote Sensing, 15, 472, https://doi.org/10.3390/rs15020472, 2023.
Li, Y., Xia, Y., Xie, F., and Yan, Y.: Influence of stratosphere-troposphere exchange on long-term trends of surface ozone in CMIP6, Atmos. Res., 297, 107086, https://doi.org/10.1016/j.atmosres.2023.107086, 2024.
Lin, Y., Jiang, F., Zhao, J., Zhu, G., He, X., Ma, X., Li, S., Sabel, C. E., and Wang, H.: Impacts of O3 on premature mortality and crop yield loss across China, Atmos. Environ., 194, 41–47, https://doi.org/10.1016/j.atmosenv.2018.09.024, 2018.
Liu, Y., Liu, C. X., Wang, H. P., Tie, X. X., Gao, S. T., Kinnison, D., and Brasseur, G.: Atmospheric tracers during the 2003–2004 stratospheric warming event and impact of ozone intrusions in the troposphere, Atmos. Chem. Phys., 9, 2157–2170, https://doi.org/10.5194/acp-9-2157-2009, 2009.
Lü, Z., Li, F., Orsolini, Y. J., Gao, Y., and He, S.: Understanding of European cold extremes, sudden stratospheric warming, and siberian snow accumulation in the winter of 2017/18, J. Climate, 33, 527–545, https://doi.org/10.1175/jcli-d-18-0861.1, 2020.
Ma, X., Huang, J., Hegglin, M. I., Jöckel, P., and Zhao, T.: Causes of growing middle-to-upper tropospheric ozone over the northwest Pacific region, Atmos. Chem. Phys., 25, 943–958, https://doi.org/10.5194/acp-25-943-2025, 2025.
Myhre, G. and Stordal, F.: Role of spatial and temporal variations in the computation of radiative forcing and GWP, J. Geophys. Res.-Atmos., 102, 11181–11200, https://doi.org/10.1029/97jd00148, 1997.
Myhre, G., Shine, K. P., Rädel, G., Gauss, M., Isaksen, I. S. A., Tang, Q., Prather, M. J., Williams, J. E., van Velthoven, P., Dessens, O., Koffi, B., Szopa, S., Hoor, P., Grewe, V., Borken-Kleefeld, J., Berntsen, T. K., and Fuglestvedt, J. S.: Radiative forcing due to changes in ozone and methane caused by the transport sector, Atmos. Environ., 45, 387–394, https://doi.org/10.1016/j.atmosenv.2010.10.001, 2011.
Naujokat, B.: An update of the observed quasi-biennial oscillation of the stratospheric winds over the Tropics, J. Atmos. Sci., 43, 1873–1877, https://doi.org/10.1175/1520-0469(1986)043<1873:AUOTOQ>2.0.CO;2, 1986.
Nowack, P. J., Luke Abraham, N., Maycock, A. C., Braesicke, P., Gregory, J. M., Joshi, M. M., Osprey, A., and Pyle, J. A.: A large ozone-circulation feedback and its implications for global warming assessments, Nat. Clim. Change, 5, 41–45, https://doi.org/10.1038/nclimate2451, 2014.
Park, C., Choi, J., Son, S., and Lim, Y.: Quasi-biennial oscillation-related surface air temperature change over the western North Pacific in late winter, Int. J. Climatol., 42, 4351–4359, https://doi.org/10.1002/joc.7470, 2021.
Remya, R., Manoj, M. G., Rakesh, V., Mohanakumar, K., and Sivan, C.: Influence of high latitude sudden stratospheric warming on tropical weather: Observations from a 205 MHz stratosphere troposphere radar and surface meteorological parameters, Earth Space Sci., 8, https://doi.org/10.1029/2020ea001418, 2021.
Roy, C., Ravishankara, A. R., Newman, P. A., David, L. M., Fadnavis, S., Rathod, S. D., Lait, L., Krishnan, R., Clark, H., and Sauvage, B.: Estimation of stratospheric intrusions during Indian Cyclones, J. Geophys. Res.-Atmos., 128, https://doi.org/10.1029/2022jd037519, 2023.
Roy, S., P R, S. C., Fadnavis, S., Kumar Sagar, V., Hegglin, M., Müller, R., and Chavan, P.: Large Ozone Enhancement over South Asia Triggered by Sudden Stratospheric Warming under Westerly QBO phase: Implications on Ozone Radiative Forcing, Zenodo [code], https://doi.org/10.5281/zenodo.17639489, 2025.
Scaife, A. A., Baldwin, M. P., Butler, A. H., Charlton-Perez, A. J., Domeisen, D. I. V., Garfinkel, C. I., Hardiman, S. C., Haynes, P., Karpechko, A. Y., Lim, E.-P., Noguchi, S., Perlwitz, J., Polvani, L., Richter, J. H., Scinocca, J., Sigmond, M., Shepherd, T. G., Son, S.-W., and Thompson, D. W. J.: Long-range prediction and the stratosphere, Atmos. Chem. Phys., 22, 2601–2623, https://doi.org/10.5194/acp-22-2601-2022, 2022.
Schimanke, S., Spangehl, T., Huebener, H., and Cubasch, U.: Variability and trends of major stratospheric warmings in simulations under constant and increasing GHG concentrations, Clim. Dynam., 40, 1733–1747, https://doi.org/10.1007/s00382-012-1530-x, 2012.
Shell, K. M., Kiehl, J. T., and Shields, C. A.: Using the radiative kernel technique to calculate climate feedbacks in NCAR's community atmospheric model, J. Climate, 21, 2269–2282, https://doi.org/10.1175/2007jcli2044.1, 2008.
Shi, Y., Evtushevsky, O., Milinevsky, G., Wang, X., Klekociuk, A., Han, W., Grytsai, A., Wang, Y., Wang, L., Novosyadlyj, B., and Andrienko, Y.: Impact of the 2018 major sudden stratospheric warming on weather over the midlatitude regions of Eastern Europe and East Asia, Atmos. Res., 297, 107112, https://doi.org/10.1016/j.atmosres.2023.107112, 2023.
Sigmond, M., Scinocca, J. F., Kharin, V. V., and Shepherd, T. G.: Enhanced seasonal forecast skill following stratospheric sudden warmings, Nat. Geosci., 6, 98–102, https://doi.org/10.1038/ngeo1698, 2013.
Skeie, R. B., Myhre, G., Hodnebrog, Ø., Cameron-Smith, P. J., Deushi, M., Hegglin, M. I., Horowitz, L. W., Kramer, R. J., Michou, M., Mills, M. J., Olivié, D. J., Connor, F. M., Paynter, D., Samset, B. H., Sellar, A., Shindell, D., Takemura, T., Tilmes, S., and Wu, T.: Historical total ozone radiative forcing derived from CMIP6 simulations, npj Clim. Atmos. Sci., 3, https://doi.org/10.1038/s41612-020-00131-0, 2020.
SPARC Reanalysis Intercomparison Project (S-RIP): Final Report, edited by: Fujiwara, M., Manney, G. L., Gray, L. J., and Wright, J. S., SPARC Report No. 10, WCRP-17/2020, https://doi.org/10.17874/800dee57d13, 2022.
Sprenger, M., Croci Maspoli, M., and Wernli, H.: Tropopause folds and cross-Tropopause Exchange: A global investigation based upon ECMWF analyses for the time period March 2000 to February 2001, J. Geophys. Res.-Atmos., 108, https://doi.org/10.1029/2002jd002587, 2003.
Sprenger, M., Wernli, H., and Bourqui, M.: Stratosphere–troposphere exchange and its relation to potential vorticity streamers and cutoffs near the extratropical tropopause, J. Atmos. Sci., 64, 1587–1602, https://doi.org/10.1175/jas3911.1, 2007.
Stamnes, K., Tsay, S.-C., Wiscombe, W., and Jayaweera, K.: Numerically stable algorithm for discrete-ordinate-method radiative transfer in multiple scattering and emitting layered media, Appl. Opt., 27, 2502, https://doi.org/10.1364/ao.27.002502, 1988.
Wang, H., Lu, X., Jacob, D. J., Cooper, O. R., Chang, K.-L., Li, K., Gao, M., Liu, Y., Sheng, B., Wu, K., Wu, T., Zhang, J., Sauvage, B., Nédélec, P., Blot, R., and Fan, S.: Global tropospheric ozone trends, attributions, and radiative impacts in 1995–2017: an integrated analysis using aircraft (IAGOS) observations, ozonesonde, and multi-decadal chemical model simulations, Atmos. Chem. Phys., 22, 13753–13782, https://doi.org/10.5194/acp-22-13753-2022, 2022.
Wang, M. and Fu, Q.: Stratosphere-troposphere exchange of Air Masses and ozone concentrations based on reanalyses and observations, J. Geophys. Res.-Atmos., 126, https://doi.org/10.1029/2021jd035159, 2021.
Waugh, D. W. and Polvani, L. M.: Climatology of intrusions into the tropical upper troposphere, Geophys. Res. Lett., 27, 3857–3860, https://doi.org/10.1029/2000gl012250, 2000.
White, I. P., Lu, H., and Mitchell, N. J.: Seasonal evolution of the QBO-induced wave forcing and circulation anomalies in the northern winter stratosphere, J. Geophys. Res.-Atmos., 121, 10411–10431, https://doi.org/10.1002/2015jd024507, 2016.
Williams, R. S., Hegglin, M. I., Kerridge, B. J., Jöckel, P., Latter, B. G., and Plummer, D. A.: Characterising the seasonal and geographical variability in tropospheric ozone, stratospheric influence and recent changes, Atmos. Chem. Phys., 19, 3589–3620, https://doi.org/10.5194/acp-19-3589-2019, 2019.
Williams, R. S., Hegglin, M. I., Jöckel, P., Garny, H., and Shine, K. P.: Air quality and radiative impacts of downward-propagating sudden stratospheric warmings (SSWs), Atmos. Chem. Phys., 24, 1389–1413, https://doi.org/10.5194/acp-24-1389-2024, 2024.
World Meteorological Organization (WMO): Meteorology – A three dimensional science: Second session of the Commission for Aerology, WMO Bulletin, IV, 134–138, 1957.
Xia, Y., Huang, Y., and Hu, Y.: On the climate impacts of upper tropospheric and lower stratospheric ozone, J. Geophys. Res.-Atmos., 123, 730–739, https://doi.org/10.1002/2017jd027398, 2018.
Xia, Y., Xie, F., and Lu, X.: Enhancement of Arctic surface ozone during the 2020–2021 winter associated with the sudden stratospheric warming, Environ. Res. Lett., 18, 024003, https://doi.org/10.1088/1748-9326/acaee0, 2023.
Xie, J., Hu, J., Xu, H., Liu, S., and He, H.: Dynamic diagnosis of stratospheric sudden warming event in the boreal winter of 2018 and its possible impact on weather over North America, Atmosphere, 11, 438, https://doi.org/10.3390/atmos11050438, 2020.
Ziemke, J. R., Chandra, S., and Bhartia, P. K.: “cloud slicing”: A new technique to derive upper tropospheric ozone from satellite measurements, J. Geophys. Res.-Atmos., 106, 9853–9867, https://doi.org/10.1029/2000jd900768, 2001.