the Creative Commons Attribution 4.0 License.
the Creative Commons Attribution 4.0 License.
 | 20 Apr 2026
Lagrangian particle–based simulation of aerosol-dependent vertical variation of cloud microphysics in a laboratory convection cloud chamber
Inyeob La
Wojciech W. Grabowski
Yongjoon Kim
Sanggyeom Kim
We investigate the vertical variability of cloud microphysics in a turbulent convection cloud chamber through large-eddy simulations coupled with a Lagrangian super droplet (SD) model. Numerical experiments mimic the convection chamber under construction at the Korea Institute of Science and Technology (KIST), employing realistic aerosol size distributions derived from field measurements (VOCALS campaign and Seoul, South Korea). Simulations show that cloud water mixing ratio generally increases with height due to continuous droplet activation and growth during ascent, but this vertical gradient weakens significantly as aerosol concentration increases. Enhanced aerosol loading intensifies competition for water vapor, shortening phase relaxation times and suppressing supersaturation variability, resulting in more vertically uniform cloud water mixing ratio profiles. Lagrangian trajectory analyses reveal that upward motion substantially influences droplet growth and activation under clean conditions, but this influence diminishes sharply in polluted environments where the shorter phase relaxation time keeps supersaturation close to a low quasi-steady value. Furthermore, droplets experiencing sustained upward motion activate more readily, although this effect is weakened considerably in polluted conditions. In a turbulent convection-chamber setting, we quantify how aerosol loading modulates the vertical distribution of cloud-water mixing ratio using LES model with Lagrangian super droplet tracking, thereby clarifying the coupled roles of vapor competition and vertical transport. Our results emphasize the critical role of aerosol loading in shaping vertical microphysical structures and highlight the interplay between vapor competition and vertical dynamics. These findings provide important insights for improving cloud parameterizations and understanding aerosol-cloud interactions in both controlled laboratory and atmospheric contexts.
- Article
(12106 KB) - Full-text XML
-
Supplement
(823 KB) - BibTeX
- EndNote


Clouds are key regulators of Earth's climate, influencing radiative balance, precipitation, and atmospheric dynamics. Aerosols, serving as cloud condensation nuclei (CCN), play a crucial role in cloud formation and significantly impact cloud microphysical and optical properties. Human activities have increased aerosol concentrations globally, altering cloud behavior and radiative effects. Recent observations also suggest that reduced ship emissions, resulting from tightened regulations, have substantially decreased aerosol concentrations over the oceans, leading to decreased cloud reflectivity and accelerated global warming (Hansen et al., 2025). Among climate forcing components, aerosol–cloud interactions represent a major source of uncertainty. The IPCC AR6 assigns high confidence to effective radiative forcing from direct aerosol–radiation interactions, but confidence remains low to medium for aerosol–cloud interactions, reflecting continued uncertainties in cloud adjustment processes (IPCC, 2021). This reflects the complex and nonlinear sensitivity of cloud processes to aerosol properties such as size, number, and composition (Seinfeld et al., 2016; Carslaw et al., 2013). Capturing these interactions in models requires detailed understanding of microphysical processes, which are often difficult to constrain from observations. Laboratory cloud chambers have been widely used to probe cloud microphysics under controlled conditions; however, these experiments and measurements are often limited by spatial and temporal resolution, and isolating individual parameter effects remains challenging.
The importance of turbulence-induced supersaturation fluctuations for droplet growth has been highlighted in experimental studies using the Michigan Tech convection cloud chamber (known as the Pi Chamber), where aerosol injection rates are precisely controlled (Chandrakar et al., 2016). These experiments have demonstrated how turbulence broadens cloud-droplet size distributions, particularly at lower aerosol concentrations, which enhances droplet size dispersion and promotes conditions favorable for precipitation formation. Meanwhile, high-resolution numerical simulations that replicate chamber conditions can offer a valuable tool to isolate specific processes, such as droplet activation and supersaturation dynamics, and to explore their sensitivities under well-controlled scenarios. In this context, high-resolution numerical modeling offers a powerful complementary approach. By replicating chamber conditions within a computational framework, models can resolve detailed processes such as aerosol activation, droplet growth, and supersaturation dynamics at scales inaccessible to direct measurement (Grabowski et al., 2024; Thomas et al., 2023). Furthermore, they enable systematic variation of aerosol and thermodynamic properties, facilitating deeper investigation into vertical microphysical evolution and sensitivities to aerosol concentration. This modeling approach is especially valuable for interpreting chamber experiments and extending their implications to atmospheric conditions beyond the laboratory setting (Grabowski and Pawlowska, 2025).
Previous modeling-based laboratory chamber studies (e.g., Thomas et al., 2019; Prabhakaran et al., 2022; Yang et al., 2023) have significantly advanced our understanding of aerosol–cloud interactions; however, most have relied on simplified aerosol representations or bin microphysical schemes. More recent modeling efforts, such as Grabowski et al. (2024), have incorporated realistic aerosol size distributions using the Lagrangian framework. Yet, their focus has largely remained on spatially averaged properties and activation statistics. In contrast, our study centers on the vertical evolution of microphysical structure, using trajectory-resolved analysis to connect individual droplet growth histories with ascent time and S fluctuations, an approach still rare in chamber-scale simulations.
These previous chamber simulations raise a straightforward process level question. Why do qc profiles tend to increase with height at low aerosol loading and become more vertically uniform as aerosol concentration increases, and which mechanisms control this behavior. In this study we test the hypothesis that changes in CCN concentration modify the balance between turbulent mixing and microphysical adjustment, and that this timescale balance controls both the vertical structure of qc and the spread of condensational growth along Lagrangian trajectories. Our goal is to use trajectory resolved diagnostics in LES of a convection cloud chamber to quantify this aerosol dependent timescale regime and to provide a framework that can be used to interpret chamber experiments and link them to shallow boundary layer clouds.
We perform large-eddy simulations (LES) of turbulent moist convection in a laboratory-scale cloud chamber using a Lagrangian particle-based microphysics model. This approach builds upon recent advances in Lagrangian particle-based microphysics (e.g., Shima et al., 2009; Arabas and Shima, 2013; Arabas et al., 2015; Grabowski et al., 2019; Dziekan et al., 2021; Hoffmann and Feingold, 2021; Chandrakar et al., 2022; Yang et al., 2023; Morrison et al., 2024), which support detailed droplet-scale simulations of cloud microphysics, including aspects of aerosol activation and growth dynamics. Following the design specifications of the chamber under construction at the Korea Institute of Science and Technology (KIST), which is intended to support both expansion and convection experiments, the simulation domain is configured to mimic the convection mode of a cloud chamber. Realistic dry aerosol size distributions are adopted from field measurements during the VOCALS campaign (Grabowski et al., 2011) and at a site in Seoul, South Korea (Park et al., 2023a, b), spanning aerosol concentrations from clean to polluted conditions. Through full Lagrangian tracking of individual super droplets, we quantify how cloud liquid water mixing ratio (qc) evolves with height. We also assess how this vertical structure responds to variations in aerosol concentration, with characteristic timescales of S depletion and droplet ascent. Yang et al. (2023) observed an increasing trend of cloud water mixing ratio with height in LES simulations of Pi Chamber. Similarly, Wang et al. (2024a) showed that the cloud water mixing ratio maximum occurred near the Pi Chamber top under the lowest aerosol injection rate condition. However, neither study systematically investigated the mechanisms driving this vertical structure. Additionally, Thomas et al. (2022) reported vertical profiles of cloud water mixing ratio from LES simulations of the Pi Chamber, showing a similar trend where cloud water mixing ratio increased with height under lower aerosol injection rates, resulting in a mid-level maximum in cloud water mixing ratio. However, this vertical gradient diminished as aerosol injection rates increased. Notably, in Wang et al. (2024a), the height of maximum cloud water mixing ratio shifted downward, or became less distinct, under higher aerosol injection rates. This trend suggests a potential modulation of vertical condensate structure by aerosol concentration, which our study addresses using Lagrangian trajectory-based microphysical diagnostics across systematically varied aerosol scenarios.
By linking detailed droplet-scale microphysical trajectories to bulk cloud properties under systematically varied aerosol conditions, our findings provide novel insights into the intricate interplay between aerosol properties and cloud microphysical structure. These insights are expected to significantly enhance our ability to accurately represent aerosol-cloud interactions within atmospheric and climate models, ultimately reducing uncertainties associated with cloud feedback mechanisms in climate projections.
Numerical simulations in this study were performed using the babyEULAG model, a simplified three-dimensional, nonhydrostatic anelastic Eulerian–semi-Lagrangian model coupled with Lagrangian super droplet microphysics. The dynamic model is a simplified serial version of the 3D nonhydrostatic anelastic Eulerian–semi-Lagrangian (EULAG) model (https://www2.mmm.ucar.edu/eulag/, last access: 16 April 2026), referred to as babyEULAG (Grabowski, 2020). This Lagrangian particle–based approach to microphysics (i.e., using super droplets; Shima et al., 2009; Grabowski et al., 2019) enables a detailed representation of droplet size distributions and microphysical processes at the particle level. Subgrid-scale turbulence is implicitly represented through the monotone multidimensional positive-definite advection transport algorithm (MPDATA), eliminating the need for explicit subgrid-scale parameterizations. Detailed model descriptions and numerical schemes are provided in Grabowski (2020) and Grabowski et al. (2024). The computational domain was configured to resemble the convection cloud chamber currently under construction at the Korea Institute of Science and Technology (KIST), which is cylindrical with a diameter of 1.5 m and a height of 2.0 m (∼3.53 m3 in volume). While not exactly identical, the model domain closely approximates these dimensions, consisting of grid points with uniform grid spacings of 0.04 m horizontally and 0.02 m vertically. A temperature gradient was imposed with bottom and top boundaries set at 299 and 280 K, respectively, establishing a 19 K difference to drive turbulent moist convection. Sidewall temperatures were fixed at an intermediate value of 289.5 K. The time step for the simulations was set to 0.025 s.
Following Grabowski et al. (2024), the simulations use the babyEULAG configuration with periodic lateral boundaries and rigid-lid lower and upper boundaries. At the lower and upper boundaries, temperature and water vapor mixing ratio are reset at every time step to prescribed values, and the horizontal velocity components satisfy free-slip. Although the free-slip condition at the lower and upper boundaries is idealized relative to the solid plates in an actual chamber, this dynamical configuration has been evaluated extensively in previous Pi Chamber simulations. Grabowski (2020) showed that, in the absence of CCN, the model reproduces the observed mean supersaturation and its standard deviation when averaged over the interior of the chamber, and Grabowski et al. (2024) demonstrated that the simulated mean TKE is close to values inferred from Pi Chamber observations. To represent the solid chamber walls within the horizontally periodic framework, we introduce internal sidewall regions at the 10th grid point in each horizontal direction. Around each of these planes, a three-grid-point wide relaxation zone is applied in which all three velocity components are relaxed toward zero and the thermodynamic variables are nudged toward the prescribed wall state (T=289.5 K, RH=100 %) with a relaxation time scale of 0.1 s. Thus, the physical sidewalls of the chamber are mimicked by internal relaxation zones, while the outer lateral boundaries of the computational box remain strictly periodic. Because the thin viscous layers adjacent to the top and bottom plates are not resolved at our grid spacing, we do not attempt to represent viscous wall stresses at the resolved scale explicitly. A more complete treatment would require parameterized near-wall fluxes (momentum, and possibly heat and moisture) constrained by chamber conditions, but such constraints remain limited, and the applicability of similarity-based wall functions in a closed chamber, particularly across different wall orientations, is not well constrained. Recent LES wall-modeling work for dry Rayleigh–Bénard convection, a wall-bounded buoyancy-driven flow relevant to chamber-like configurations, has shown that conventional MOST-based wall treatments can produce substantial errors and that near-surface vertical velocity can be an important control on wall fluxes (Wang et al., 2024b). This highlights that near-wall treatment in a convection cloud chamber is itself a nontrivial modeling problem, so the present specified-state and free-slip configuration should be viewed as an idealized chamber representation rather than a fully resolved wall-flux formulation. Unless stated otherwise, statistics are computed over an interior subdomain that excludes a few grid levels adjacent to the top and bottom plates to minimize sensitivity to under-resolved near-wall dynamics. The sensitivity of the key vertical velocity-supersaturation diagnostics to this choice is evaluated in Sect. 3.2. In contrast to sidewall treatments used previously to promote near-wall evaporation and particle removal, such as 95 % RH at the sidewalls in Grabowski (2020) and recycling of super droplets entering wall-adjacent zones in Grabowski et al. (2024), this study prescribes RH=100 % at all boundaries, including the wall zones. To represent laboratory wall-loss processes more realistically, any super droplet that approaches within 0.1×dx (for walls normal to x), 0.1×dy (for walls normal to y), or 0.1×dz (for the lower or upper boundary) is removed from the domain. This criterion implicitly includes sedimentation losses, because droplets settling under gravity are likewise removed when they come within 0.1×dz of the lower boundary. The chamber pressure is held constant at 1000 hPa, consistent with Grabowski et al. (2024).
Two aerosol size distributions, identical to those in Grabowski et al. (2024), were considered: one from aircraft measurements during the VOCALS campaign (southeast Pacific; Grabowski et al., 2011) and another from ground-based observations at Yonsei University, Seoul (Park et al., 2023a, b). The VOCALS distribution was bimodal (Aitken and accumulation modes) with an original number concentration of 198.9 cm−3. Following the approach used in Grabowski et al. (2024), this value was rounded to 200 cm−3 for ease of comparison and is hereafter referred to as VOCALS (200, CTRL). The Seoul distribution was unimodal, dominated by ultrafine particles typical of polluted urban environments, with an original number concentration of approximately 11 400 cm−3. To maintain consistency with the VOCALS case, this value was similarly rounded to 10 K cm−3, hereafter referred to as 10 K, and is labeled as Seoul (10 K, CTRL). Both distributions maintained their spectral characteristics while systematically scaling total aerosol concentrations between 60 and 10 K cm−3. Distributions were discretized into 30 logarithmically spaced bins, ranging from 0.002–0.2 µm (VOCALS) and 0.005–0.24 µm (Seoul). Following assumptions from Grabowski et al. (2024), NaCl was assumed for VOCALS aerosols, and (NH4)2SO4 for Seoul aerosols. These compositions determined critical radius and critical supersaturation for activation. Size-dependent critical radius and supersaturation values were also obtained from Grabowski et al. (2024). Each super droplet corresponds to a single bin of the 30-bin aerosol distribution, and the model is initialized with 30 super droplets per grid volume. Figure 1 shows the aerosol size distributions of the two representative aerosol concentrations (200 and 10 K cm−3), illustrating how each distribution maintains its spectral shape while the total number concentration varies.
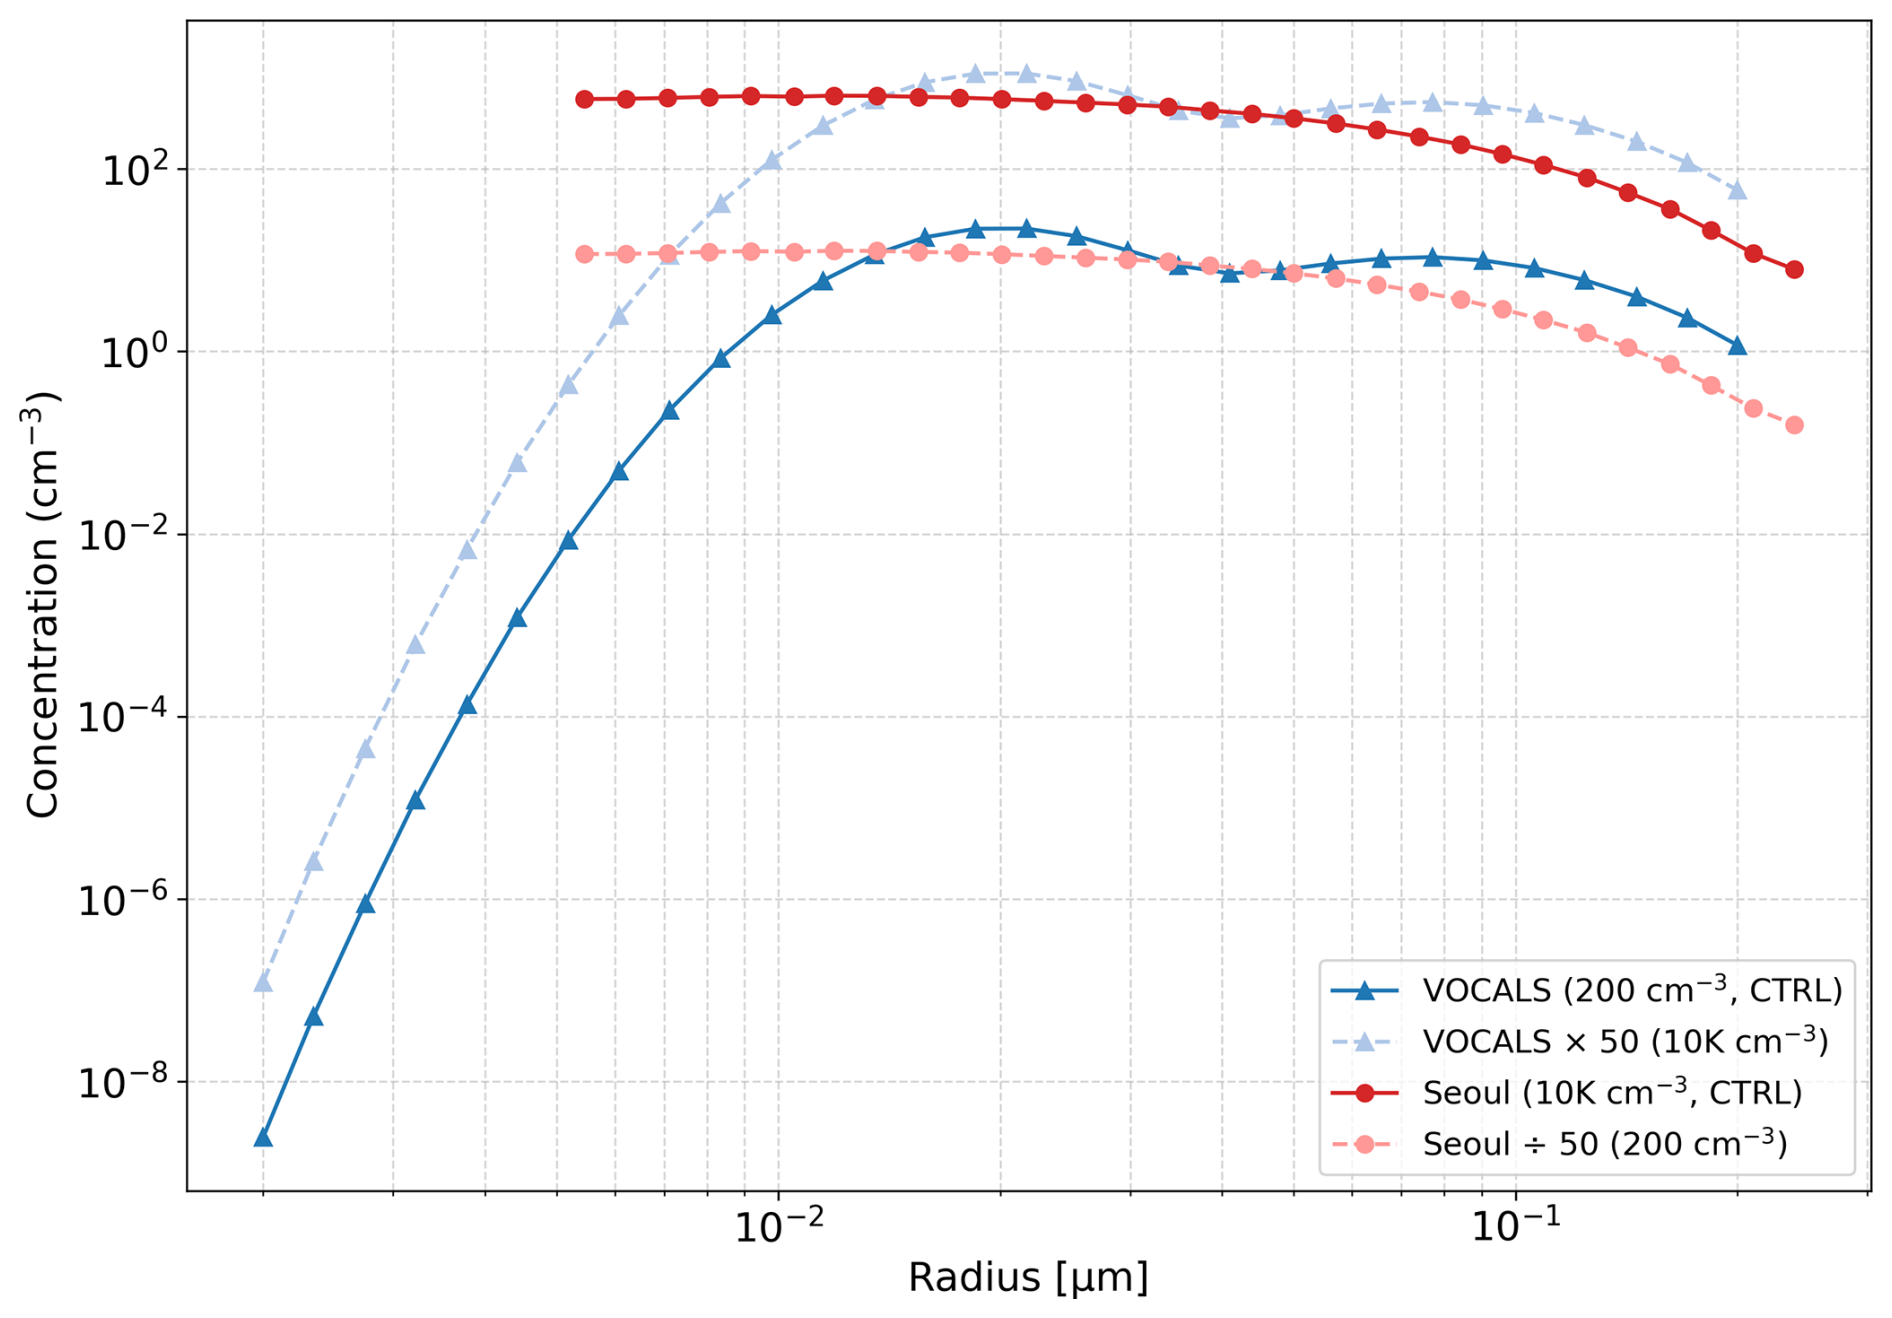
Figure 1Dry aerosol size distributions used in the simulation experiments, based on measurements during the VOCALS campaign and at a site in Seoul, South Korea. Solid lines show the original observational cases (VOCALS: 200 cm−3; Seoul: 10 K cm−3), while dashed or faded lines show size distributions rescaled to match alternative aerosol concentrations (; ). Each bin-resolved concentration is used to assign the multiplicity of corresponding super droplets in the simulation.
To sustain quasi-steady aerosol conditions, aerosol particles were continuously injected at a single grid point near the chamber's top boundary. Compared to the treatment in Grabowski et al. (2024), the present setup offers a more physically realistic representation of both wall-loss and aerosol injection processes. The removal of droplets near boundaries, which implicitly includes droplet sedimentation effects, and sustained aerosol injection reflect laboratory conditions better and support more accurate simulation of quasi-steady aerosol environments. This sedimentation-induced balance was also conceptually highlighted by Prabhakaran et al. (2022). Across all cases, 270 super droplets (SDs) were injected at each model time step, corresponding to 9 SDs per size bin for the 30-bin aerosol distribution. The physical aerosol injection rate, expressed in terms of particle number concentration per second (), was controlled solely by adjusting the SD multiplicity. For VOCALS (200, CTRL), this configuration resulted in 10 800 SDs per second (270 per model time step, 9 SDs per bin), corresponding to approximately 2.3 million physical aerosol particles per second, or 0.51 . The Seoul (10 K, CTRL) case applied a proportionally higher multiplicity to achieve an injection rate of 25.5 , based on the aerosol size distribution shown in Fig. 1. Following Yang et al. (2023), efflorescence was not considered, and all aerosol particles were initialized at their equilibrium haze sizes corresponding to 90 % RH, reflecting the expected rapid hygroscopic growth under moist chamber conditions. In contrast, the initial aerosol field at t=0 was initialized with particles at their equilibrium wet sizes corresponding to 100 % RH. Figure 2 presents time series of domain-averaged cloud water mixing ratio (qc), cloud droplet number concentration (Nc), and mean droplet radius (rm) for both VOCALS (left column) and Seoul (right column) aerosol distributions, sampled at 1 min intervals. Simulation cases are labeled using the region of origin and aerosol concentration, following the format “VOCALS (200, CTRL)” or “Seoul (10 K, CTRL)”, where the number indicates the prescribed aerosol concentration (in cm−3) and “CTRL” denotes the baseline case for each distribution. For statistical analysis in this study, cloud droplets (haze particles) are defined as hydrometeors with radii larger (smaller) than 1 µm, following Yang et al. (2023). All three metrics rise rapidly during the first 15 min, after which they enter a quasi-equilibrium stage (approximately t≥15 min). The simulated increase of qc with aerosol concentration is largely attributable to reduced sedimentation losses under higher droplet number concentrations and smaller mean radius, which reduce terminal velocities and favor condensate accumulation, as conceptualized in Shaw et al. (2023). VOCALS cases exhibit higher Nc and smaller rm values compared to Seoul cases for the same aerosol concentration, because the VOCALS aerosol size distributions include a greater fraction of larger aerosol particles that activate more readily under similarSconditions. To minimize wall effects, all statistical quantities (e.g., qc, Nc, rm) were computed using the data from interior grid points located more than 0.08 m from side walls and 0.1 m from top and bottom walls. To minimize wall effects, all statistical quantities (e.g., qc, Nc, rm) were computed using the data from interior grid points located more than 0.08 m from side walls and 0.1 m from top and bottom walls. To further assess the role of the boundaries, we diagnosed the cumulative cloud water loss at each boundary for the period between 15 and 30 min in three VOCALS simulations spanning the aerosol concentration range (60, 200, and 10 K cm−3, not shown). In the VOCALS (60) case, approximately 86 % of the cloud water loss during this period occurs at the lower boundary and about 14 % at the sidewalls, with almost negligible loss at the upper boundary. For VOCALS (200, CTRL) the corresponding fractions are about 70 % at the lower boundary, 30 % at the sidewalls, and less than 1 % at the upper boundary, whereas in VOCALS (10 K) they are roughly 38 %, 59 %, and 3 %, respectively. These diagnostics show that both the bottom plate and the sidewalls act as important sinks for condensate, while the upper boundary remains a minor loss pathway. The decreasing share of condensate loss at the lower boundary from VOCALS (60) to VOCALS (10 K) is consistent with reduced sedimentation losses at higher CCN concentrations and supports our interpretation that smaller mean droplet size for larger Nc favors condensate accumulation in the chamber interior. Compared to the treatments in Grabowski (2020) and Grabowski et al. (2024), the present setup offers improved realization of simulating both wall-loss and aerosol injection processes. By removing SDs near boundaries (mimicking wall loss) and introducing aerosols via controlled injection, the model more faithfully replicates actual chamber behavior, where particles are lost to walls and replenished through external sources. Indeed, Shaw et al. (2023) observed an increase in qc with aerosol concentration in their Pi-chamber experiments, consistent with our simulation results. This consistency further underscores that our continuous aerosol injection scheme more accurately captures the physical processes involved, in contrast to Grabowski et al. (2024), who reported no clear increase in qc with increasing aerosol concentration. These refinements strengthen the physical representativeness of the simulated system.
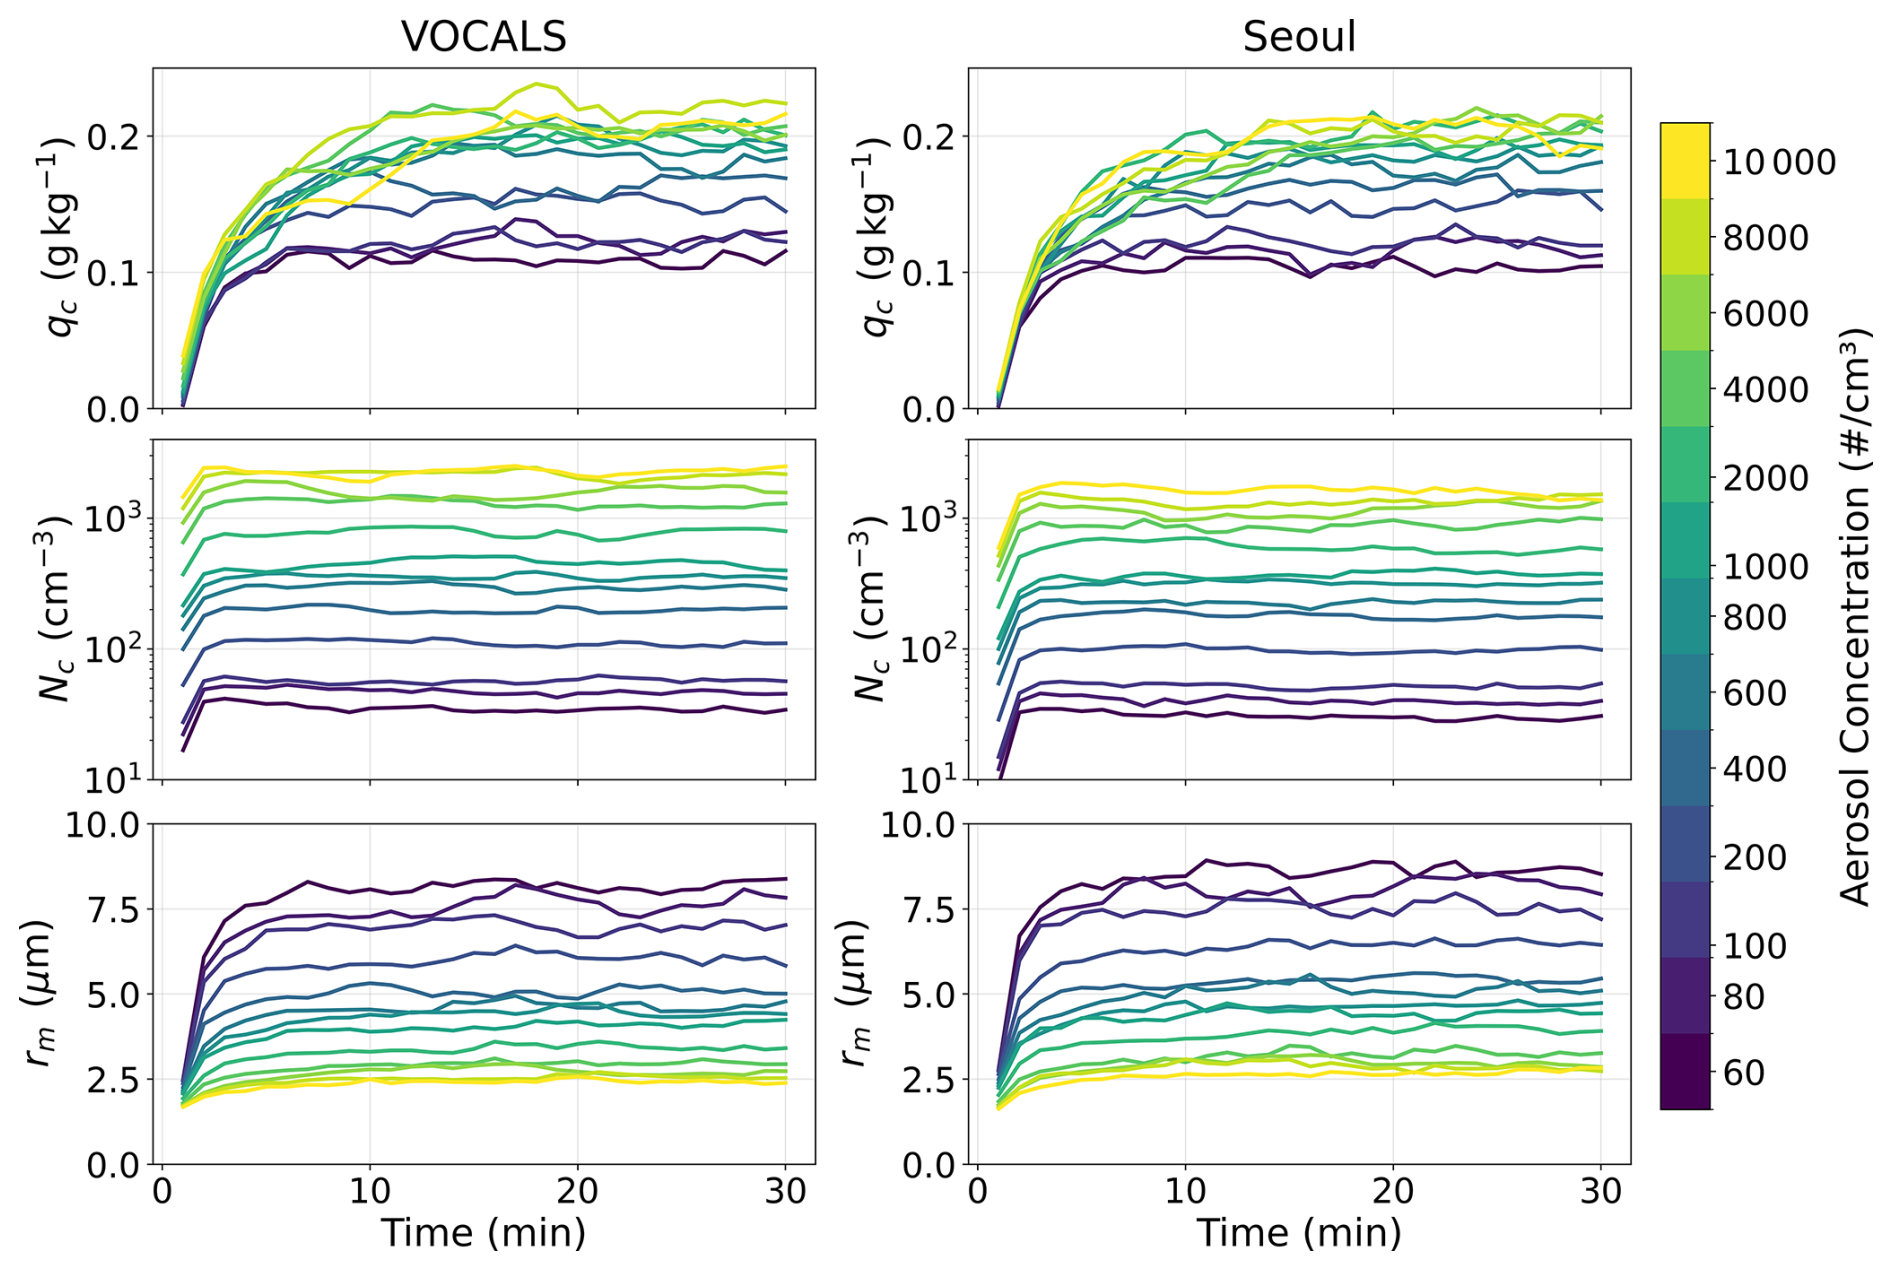
Figure 2Time series of domain-averaged microphysical variables for VOCALS (left column) and Seoul (right column) aerosol distributions. Each colored line corresponds to a different aerosol concentration (cm−3), as indicated in the legends. VOCALS cases range from 60–10 K cm−3 (with 200 cm−3 as CTRL), and Seoul cases similarly span 60–10 K cm−3 (with 10 K cm−3 as CTRL). Panels from top to bottom show qc, Nc, and rm, respectively.
Droplet collision and coalescence processes were not included in these simulations. This choice is based on Thomas et al. (2022), who demonstrated that collision-coalescence effects are negligible for a chamber height of 2 m, whereas significant impacts emerge only for taller chambers (>4 m). Thus, excluding collision-coalescence allows us to isolate and investigate aerosol-induced effects on condensational growth and droplet activation.
3.1 Vertical Structure of Cloud Water Mixing Ratio (qc)
This section analyzes how qc varies vertically in the convection cloud chamber. Since simulations reached quasi-equilibrium around 15 min, vertical profiles presented are averaged over the subsequent 15 min period (15–30 min). Figure 3 (top panels) shows the vertical profiles of domain-averaged qc for varying aerosol concentrations based on VOCALS and Seoul aerosol distributions. In general, qc increases with height; however, this increase with height weakens with increasing aerosol concentrations. At higher aerosol concentrations, the vertical distribution of qc becomes increasingly uniform, suggesting more spatially homogeneous droplet growth within the cloud chamber. To quantify the vertical variation in qc, a diagnostic metric, Δqc, was introduced. Δqc indicates the relative difference in qc between the upper and lower portions of the cloud chamber, capturing the degree of vertical inhomogeneity:
where the numerator is the horizontal mean qc at z=1.7 m minus the horizontal mean qc at z=0.3 m, and the denominator is the mean qc at these two reference heights during the quasi-equilibrium period, which is used to normalize the vertical-contrast metric. These heights are chosen to be symmetrically offset from the lower and upper plates (0.3 m from each boundary) to reduce sensitivity to boundary-adjacent layers. Figure 3 (bottom panel) shows that Δqc decreases with increasing aerosol concentration for both VOCALS and Seoul aerosol distributions. At low aerosol concentrations (60–200 cm−3), Δqc typically ranges between approximately 9 %–15 %, indicating a relatively strong vertical increase in qc that reflects efficient droplet activation and condensational growth in the lower part of the chamber where mixing between warm, moist air from the bottom boundary and cooler air aloft generates enhanced supersaturation. Conversely, under high-aerosol conditions (), Δqc drops below 5 %, reaching approximately 2 % in certain Seoul cases, indicative of a vertically uniform cloud structure. The weakening vertical gradient in qc with increasing aerosol concentration implies underlying mechanisms: intensified competition for water vapor and therefore low values of supersaturation (S), which are examined further in the following section.
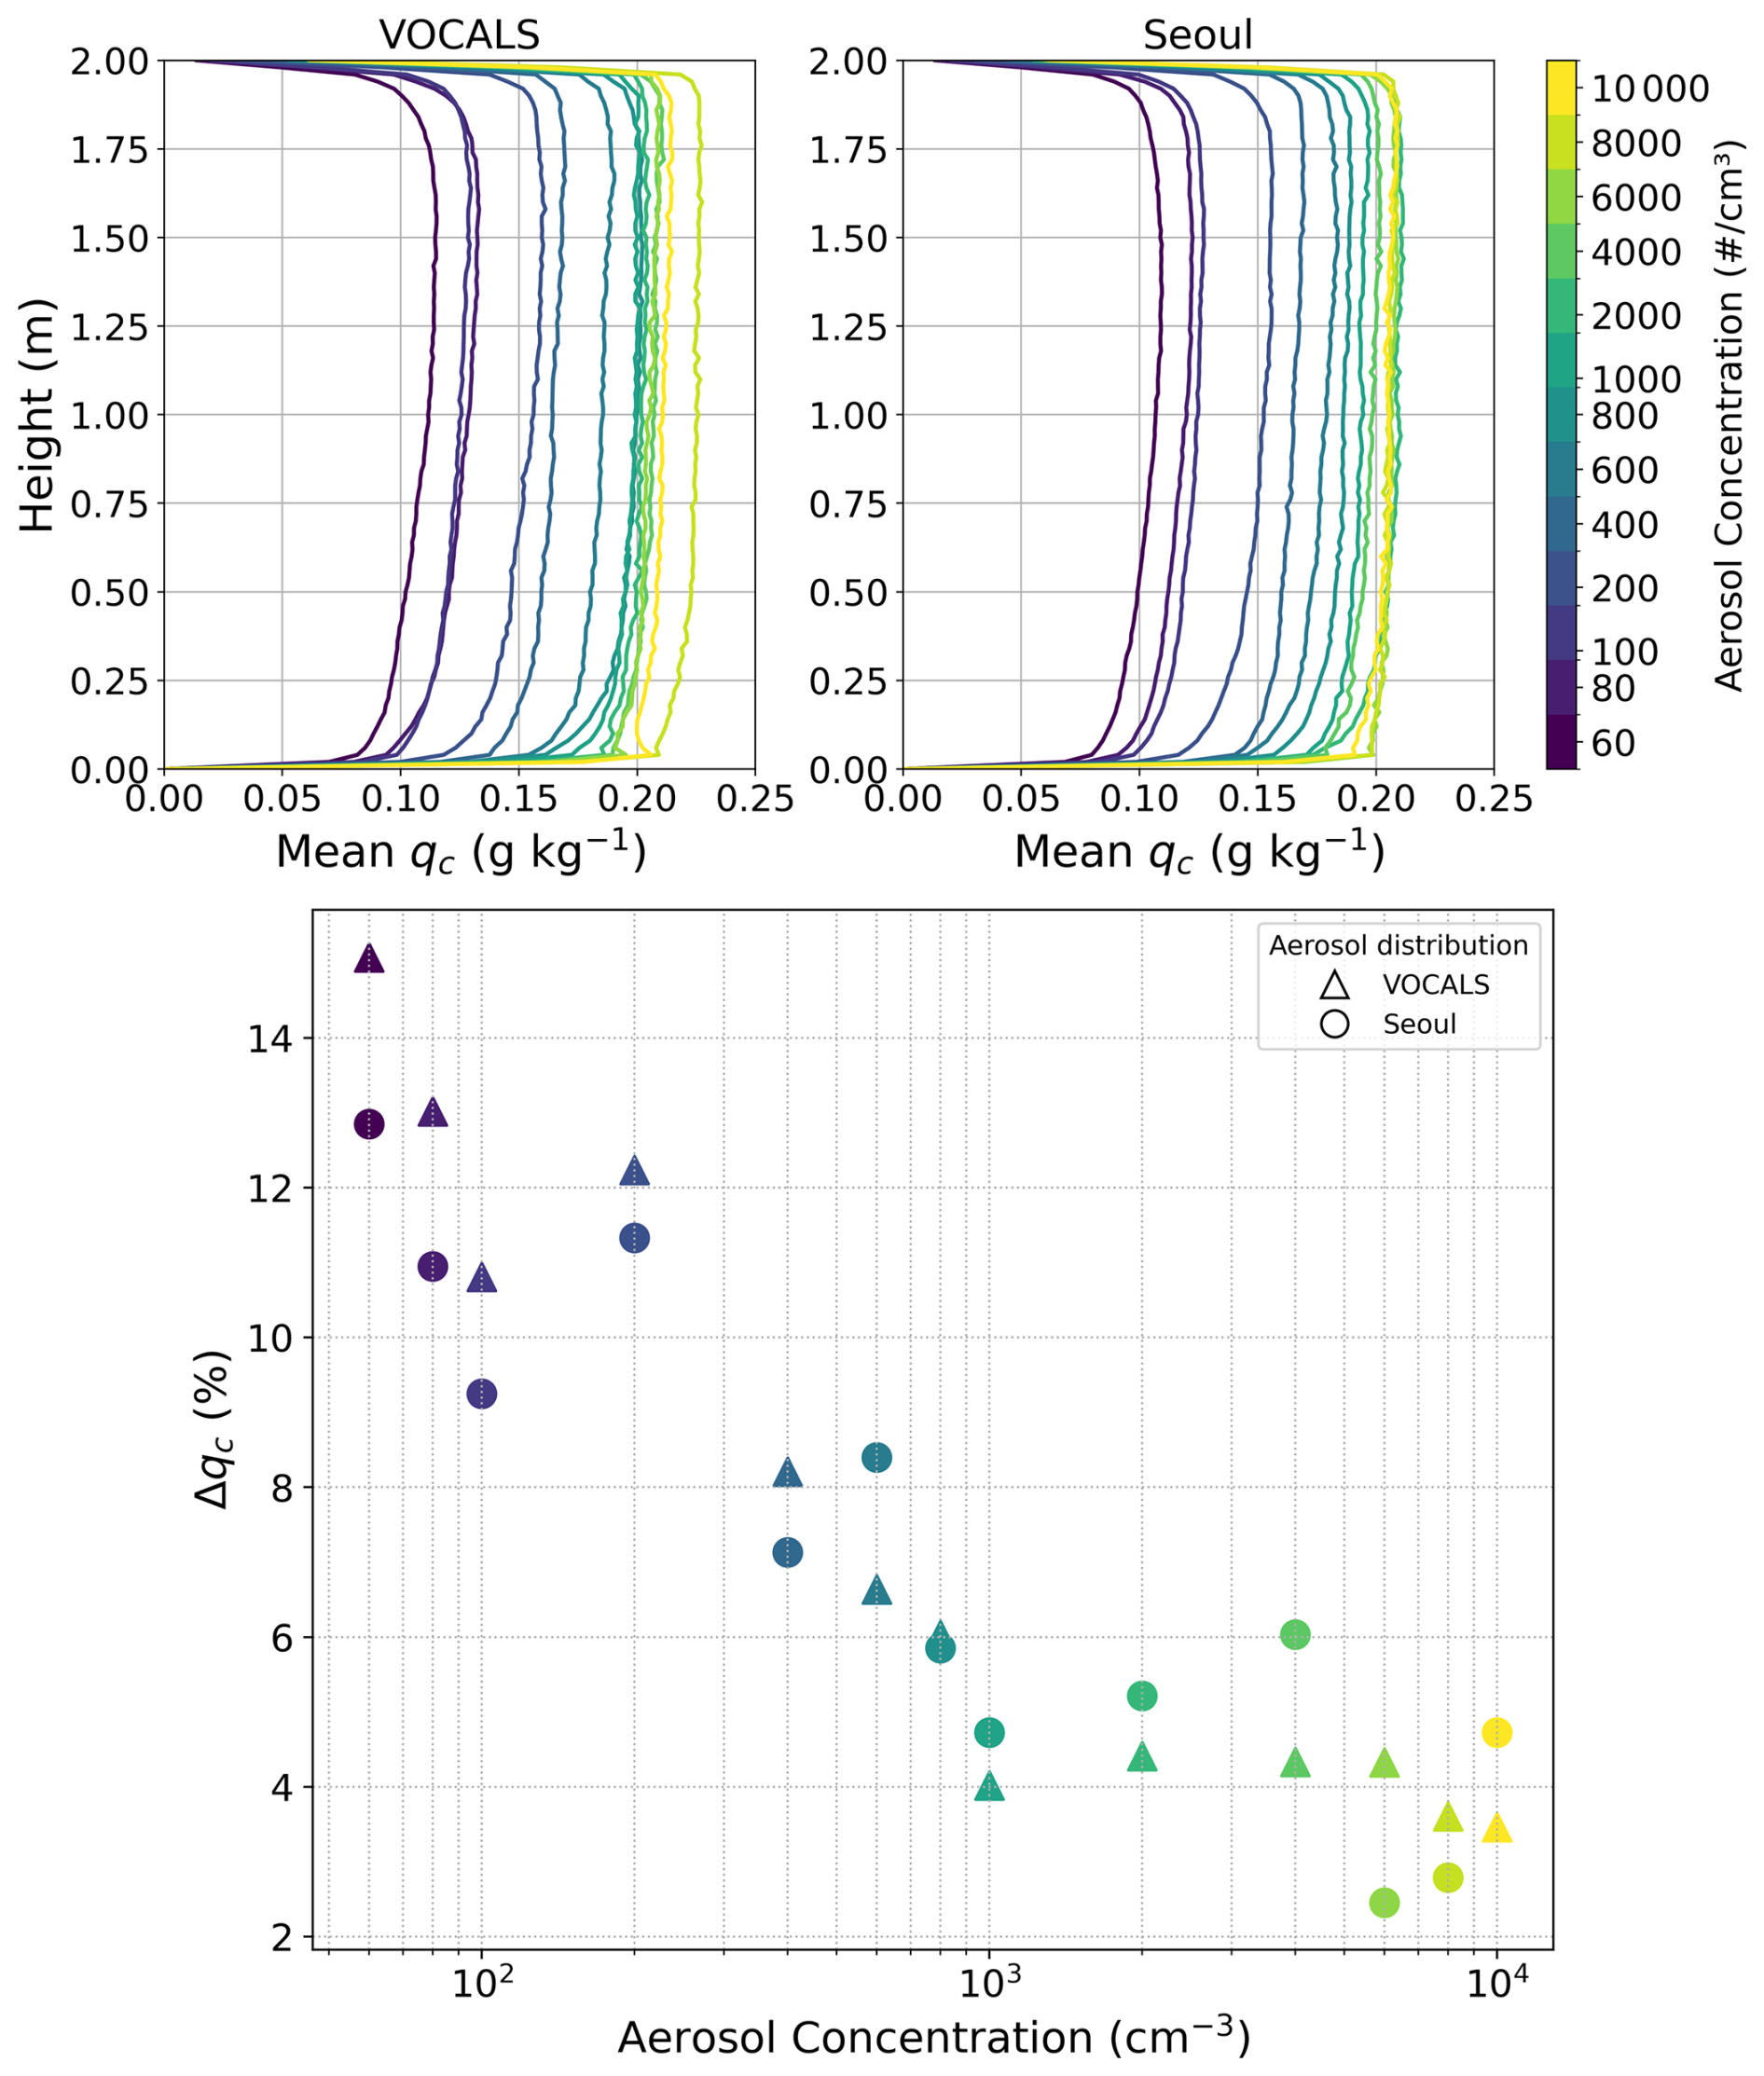
Figure 3Top panels: Vertical profiles of time-averaged cloud water mixing ratio (qc) from 0–2 m height for VOCALS (left) and Seoul (right) aerosol cases at varying aerosol concentrations (60–10 K cm−3). Each colored line corresponds to a different aerosol concentration (see legends). Profiles are averaged over the quasi-equilibrium period (15–30 min). Bottom panel: Δqc as a function of aerosol concentration, where each point represents the averaged value for the quasi-equilibrium period (15–30 min) of each aerosol distribution. Large Δqc indicates a strong increase of qc with height, whereas small or negligible Δqc would indicate a nearly uniform vertical qc profile. Triangles denote VOCALS cases; circles denote Seoul cases.
3.2 Vapor Competition and Supersaturation Dynamics as Constraints on the Vertical Distribution of Cloud Water Mixing Ratio
To elucidate the mechanisms behind the simulated reduction in Δqc at high aerosol concentrations, relationships between Δqc and key microphysical parameters were analyzed. Figure 4 shows a strong positive correlation (R2=0.82) between Δqc and the phase relaxation time, which is defined as , where Dc is a modified molecular diffusion coefficient for water vapor. A longer τp, characteristic of low aerosol conditions, is linked to a relatively greater vertical increase in qc. Physically, τp represents the time required for cloud droplets to equilibrate with the surrounding vapor field. When aerosol concentrations are high, the number of droplets increases, leading to stronger competition for available water vapor. As a result, supersaturation is driven rapidly toward a low quasi-steady value, so individual droplets experience weaker supersaturation and grow more slowly, but the population equilibrates sooner and exhibits limited additional growth aloft, thereby weakening the vertical increase in qc. In the polluted cases, the enhanced condensational sink keeps supersaturation close to its low quasi-steady value during ascent, which limits additional condensational growth aloft and therefore reduces the vertical increase in qc. The suppression of vertical S gradients under high aerosol concentrations is clearly illustrated in Fig. 5a and b, which show vertical profiles of S for the VOCALS and Seoul cases, respectively. Notably, the near-bottom layer exhibits predominantly positive mean supersaturation, although both positive and negative values occur intermittently. This behavior is consistent with moist Rayleigh–Bénard convection results from a one-dimensional turbulence (ODT) framework (Chandrakar et al., 2020), supporting the role of the lower boundary layer as a plausible activation region. As aerosol loading increases, the vertical variation in S becomes gradually reduced, reflecting enhanced competition for water vapor and faster equilibration. In other words, higher Nc leaves insufficient vapor to sustain S during ascent, resulting in vertically almost uniform qc profiles.
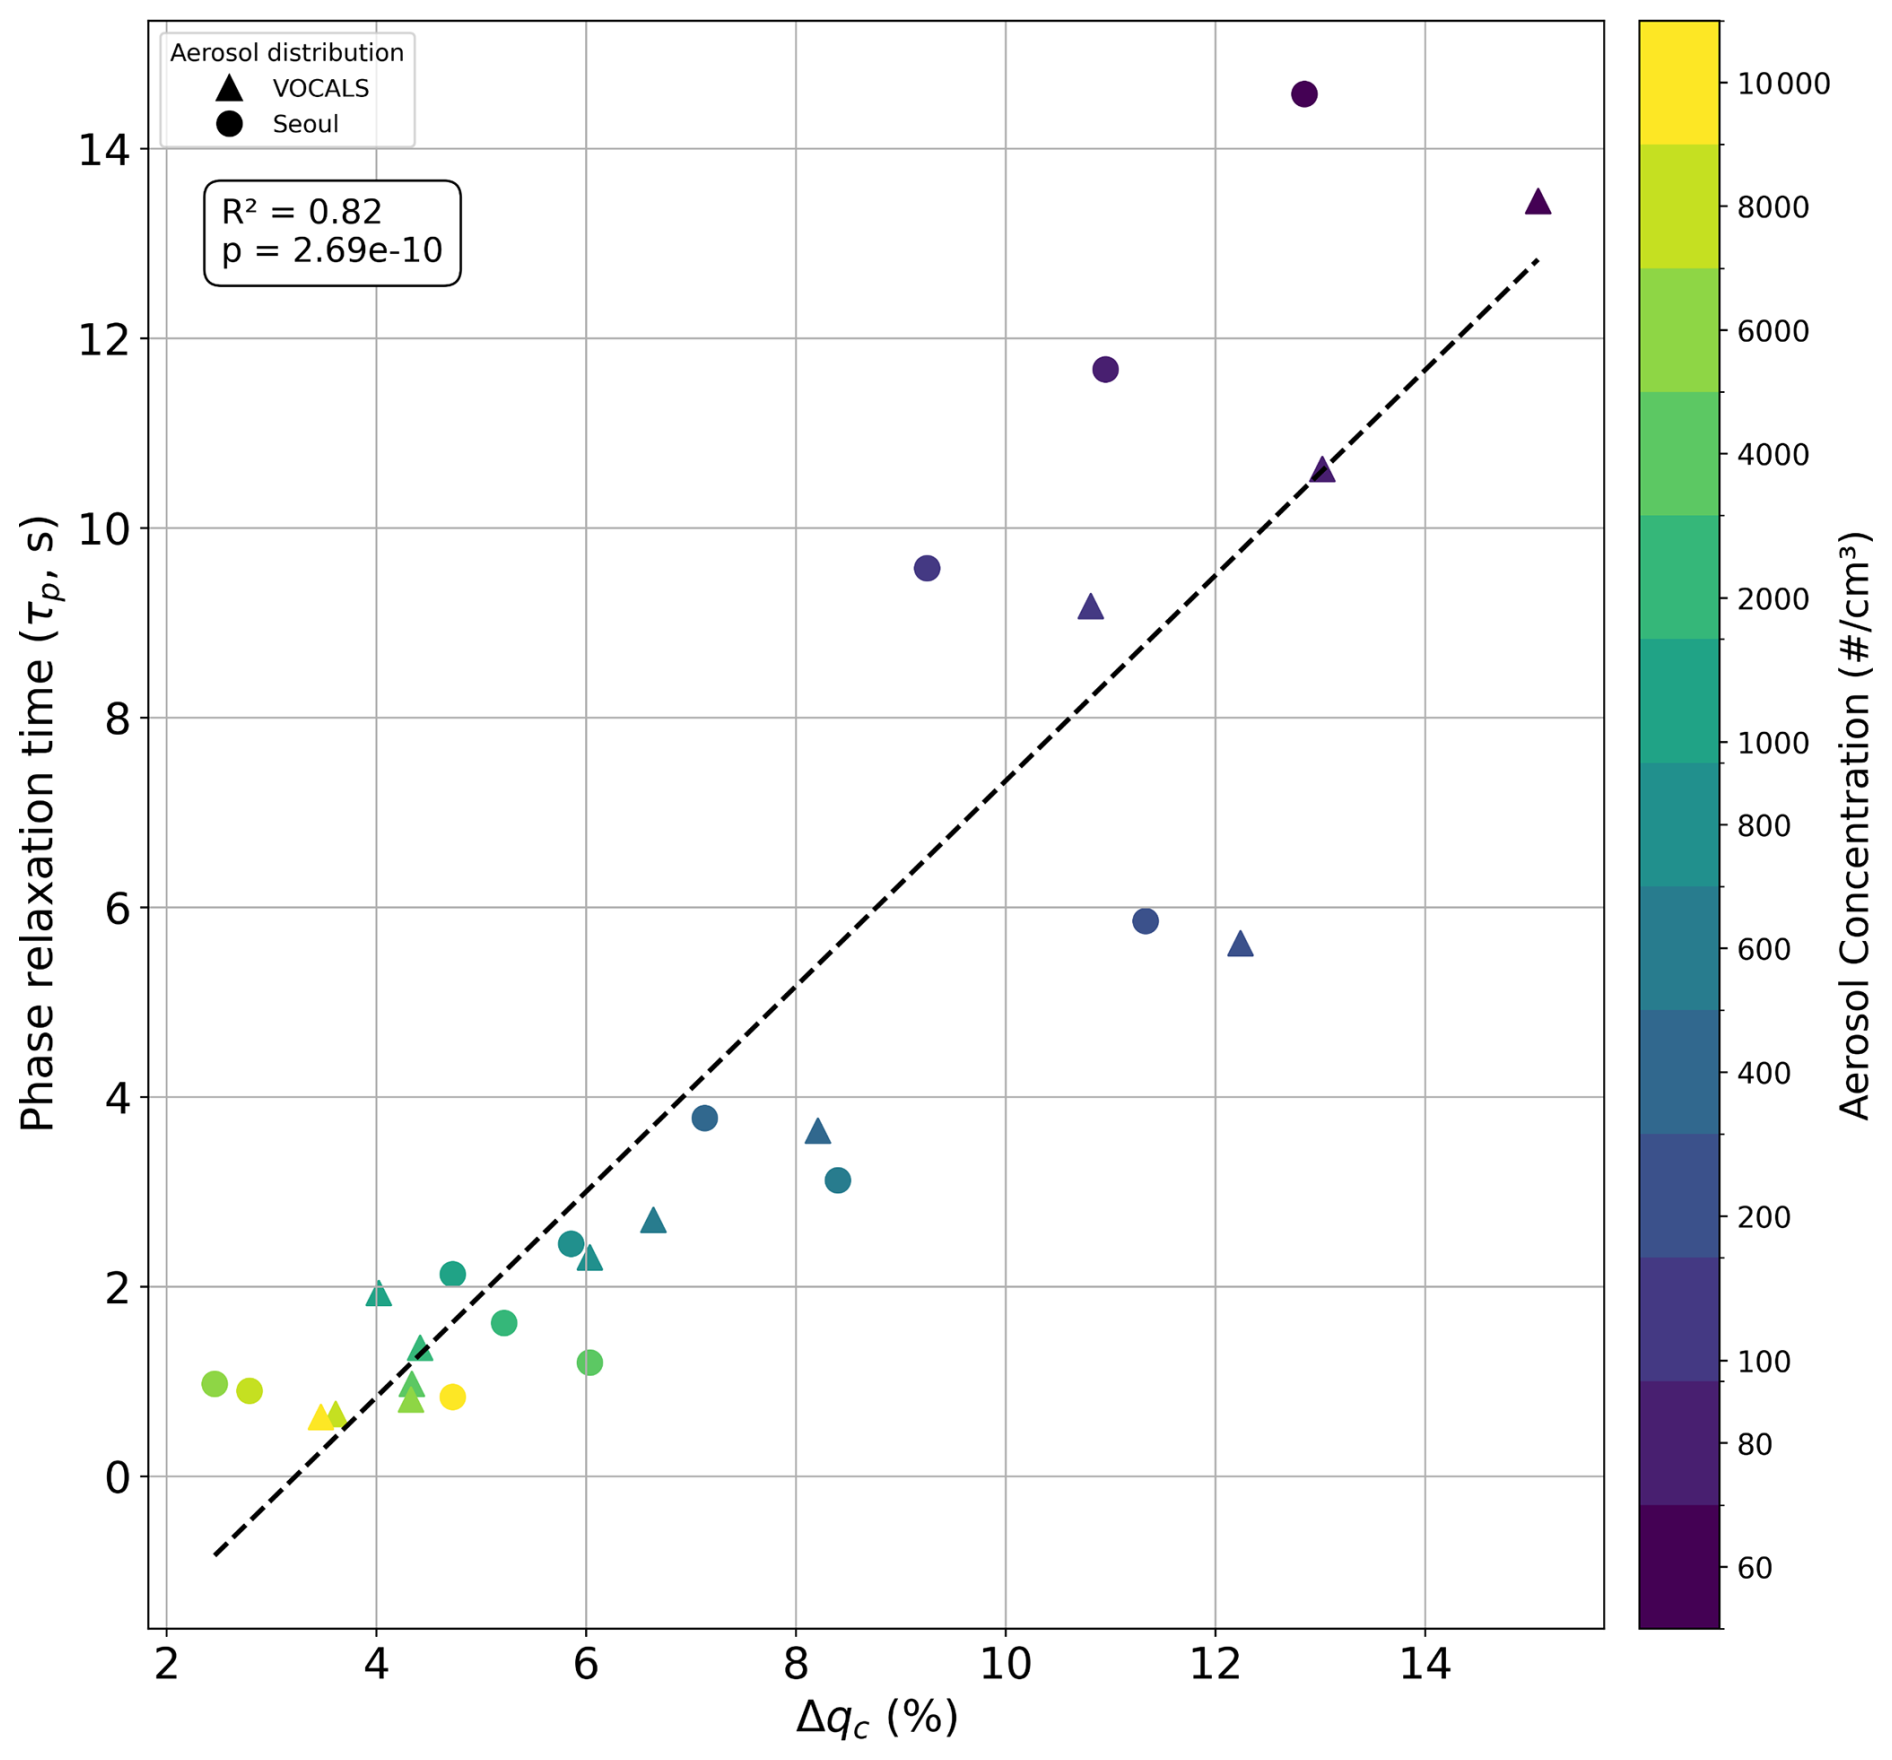
Figure 4Scatter plot showing the relationship between Δqc (%) and phase relaxation time (τp) for VOCALS (triangles) and Seoul (circles) aerosol cases. Each point represents the averaged value for the quasi-equilibrium period (15–30 min).
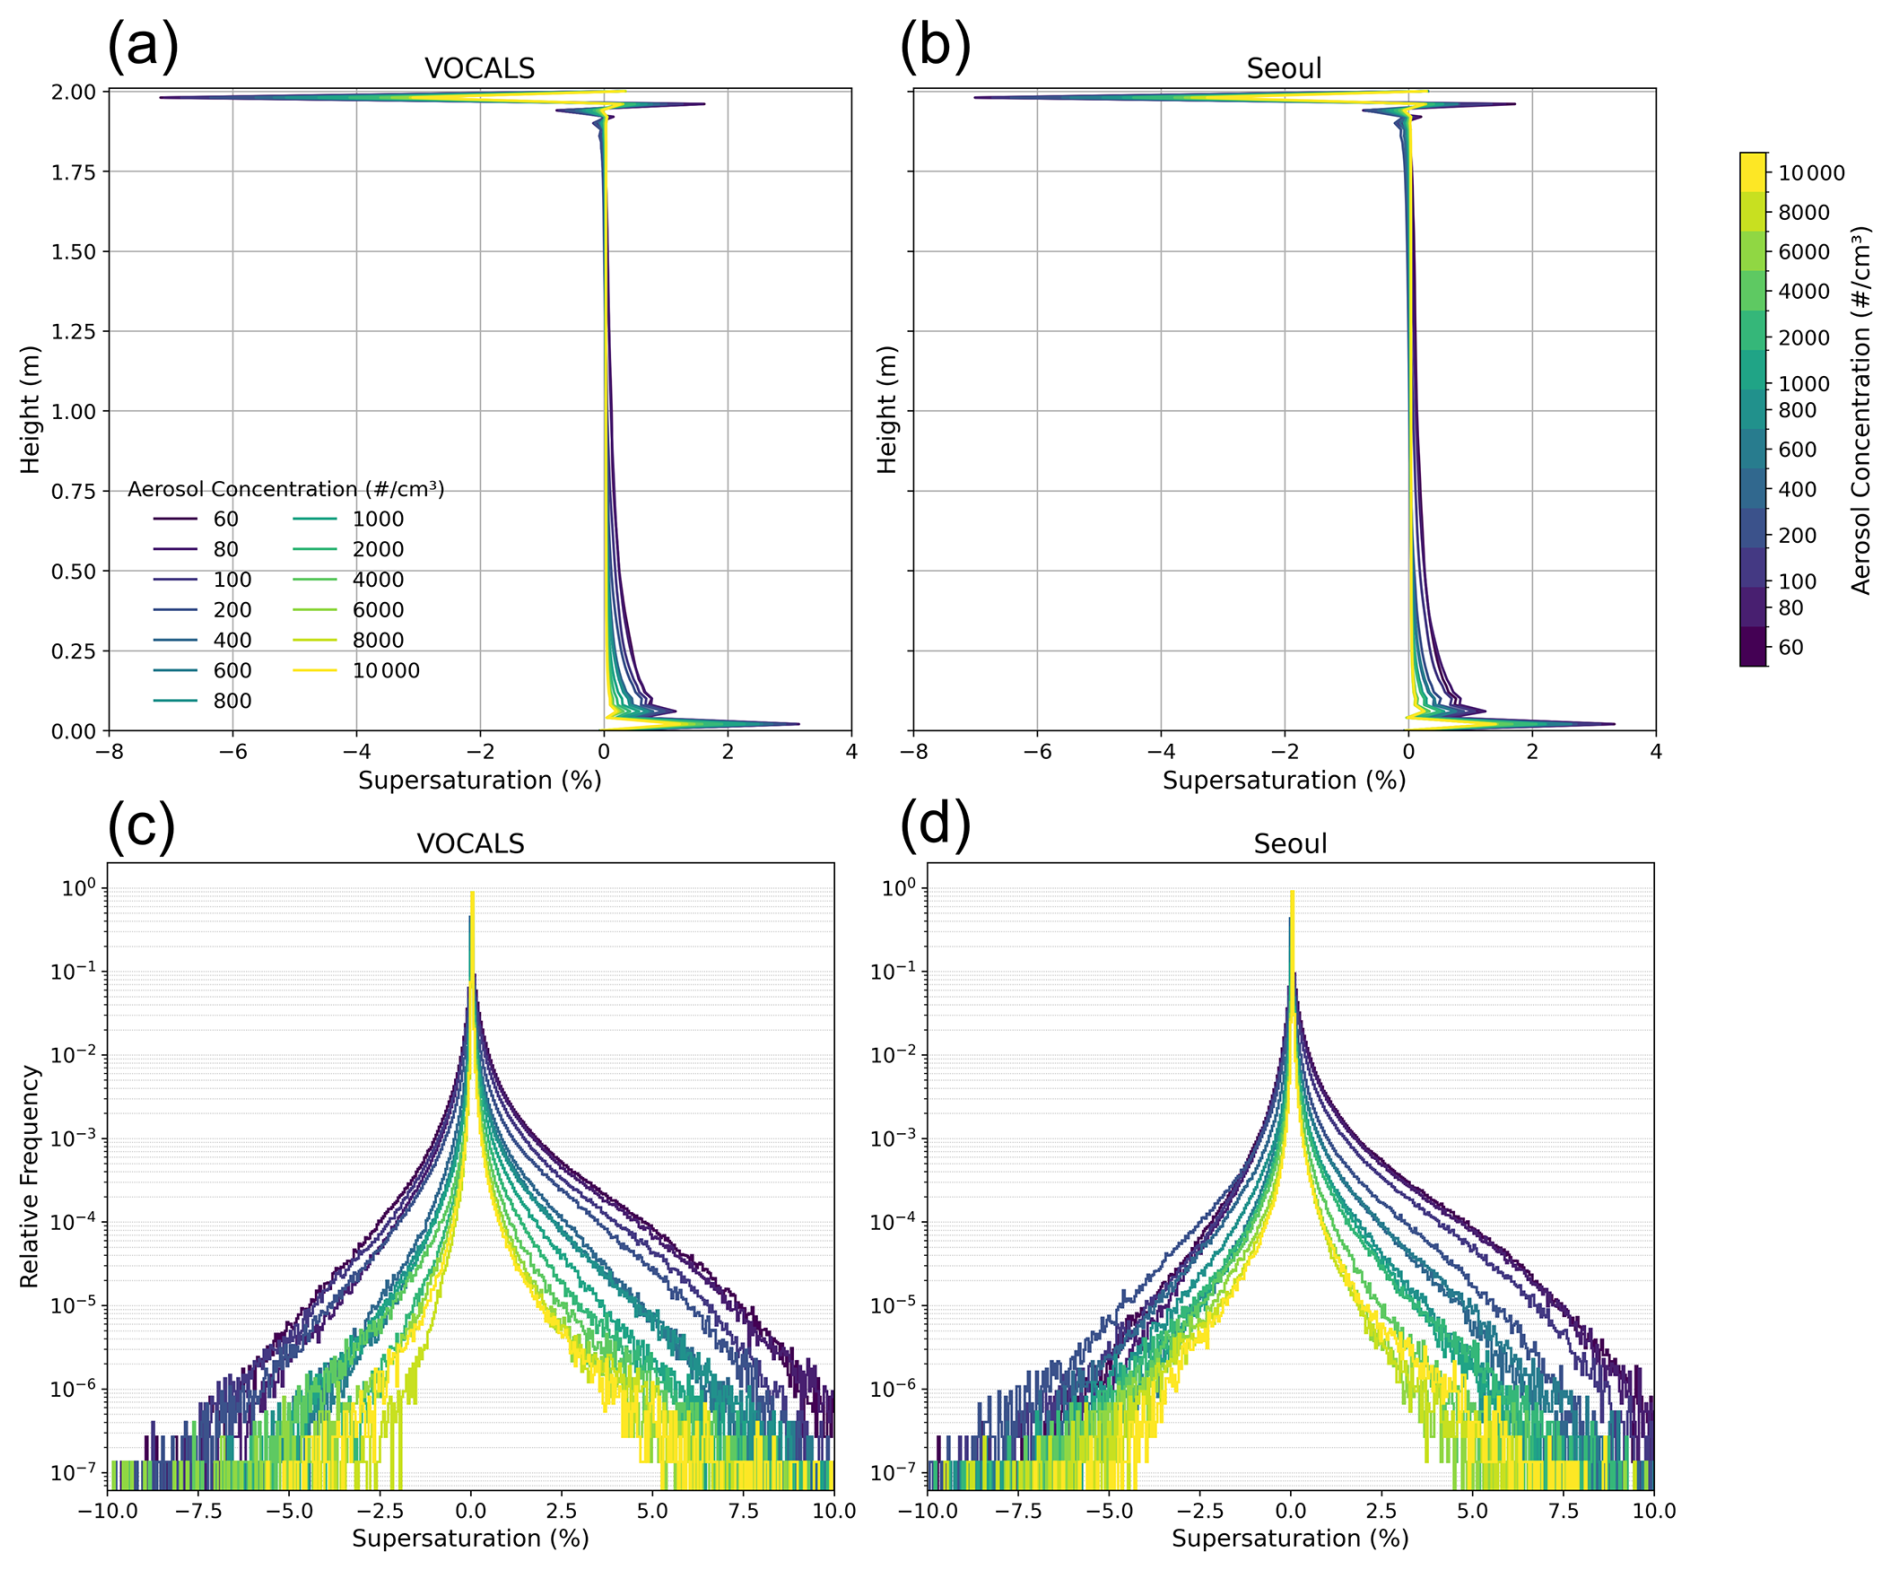
Figure 5(a, b) Vertical profiles of supersaturation S for those same aerosol cases in the VOCALS (a) and Seoul (b) simulations, with line color denoting aerosol concentration. (c, d) S histograms for selected aerosol cases in the VOCALS (c) and Seoul (d) simulations, constructed from supersaturation values at interior grid points, excluding locations within 0.08 m of the sidewalls and 0.1 m of the top and bottom boundaries, during the same quasi-equilibrium period.
The S histograms in Fig. 5c and d confirm this narrowing distribution, clearly illustrating the diminished variability and reduced magnitude of S in polluted cases. Figure 6 further demonstrates a systematic decline in the standard deviation of supersaturation (σS) with increasing aerosol concentrations, reflecting suppressed S fluctuations in more polluted environments. In addition, the domain-mean supersaturation () also shows a decreasing trend with increasing aerosols (Fig. 6; see symbol colors), indicating an overall reduction in the thermodynamic potential for droplet activation and growth. The minimum critical supersaturation (Scrit) in the prescribed aerosol spectrum is approximately 0.02 %, designated to the largest aerosol particles in the size distribution. As aerosol loading increases, steadily falls toward this value, often converging near 0.02 % (see Fig. 6). This behavior is qualitatively consistent with Yang et al. (2025), who found that mean supersaturation approached the critical value for their monodisperse aerosol. In our polydisperse case, does not collapse to a single value, but instead converges to a narrow range near the minimum Scrit set by the largest particles. When is near this threshold, particles with Scrit close to can repeatedly transition between weak activation and deactivation as turbulent S fluctuations move conditions slightly above or below their critical value, which effectively buffers . This buffering helps explain why, beyond a certain aerosol concentration, the domain-mean qc no longer increases (Fig. 2): enhanced vapor competition limits additional net activation and condensational growth despite further increases in aerosol loading. This suppression of S variability parallels the weakening of the vertical qc gradient discussed earlier. That is, just as vertical differences in qc become less pronounced with increasing aerosol, so does the vertical structure of S. Figure 2 also shows that each microphysical variable, Nc, rm, or qc, exhibits distinct timescales to reach quasi-equilibrium conditions, with these timescales varying systematically with aerosol concentration (see Supplement Figs. S1 and S2 for a detailed analysis). Specifically, the increasing aerosol concentration reduces (Fig. 6), influencing these equilibrium timescales.
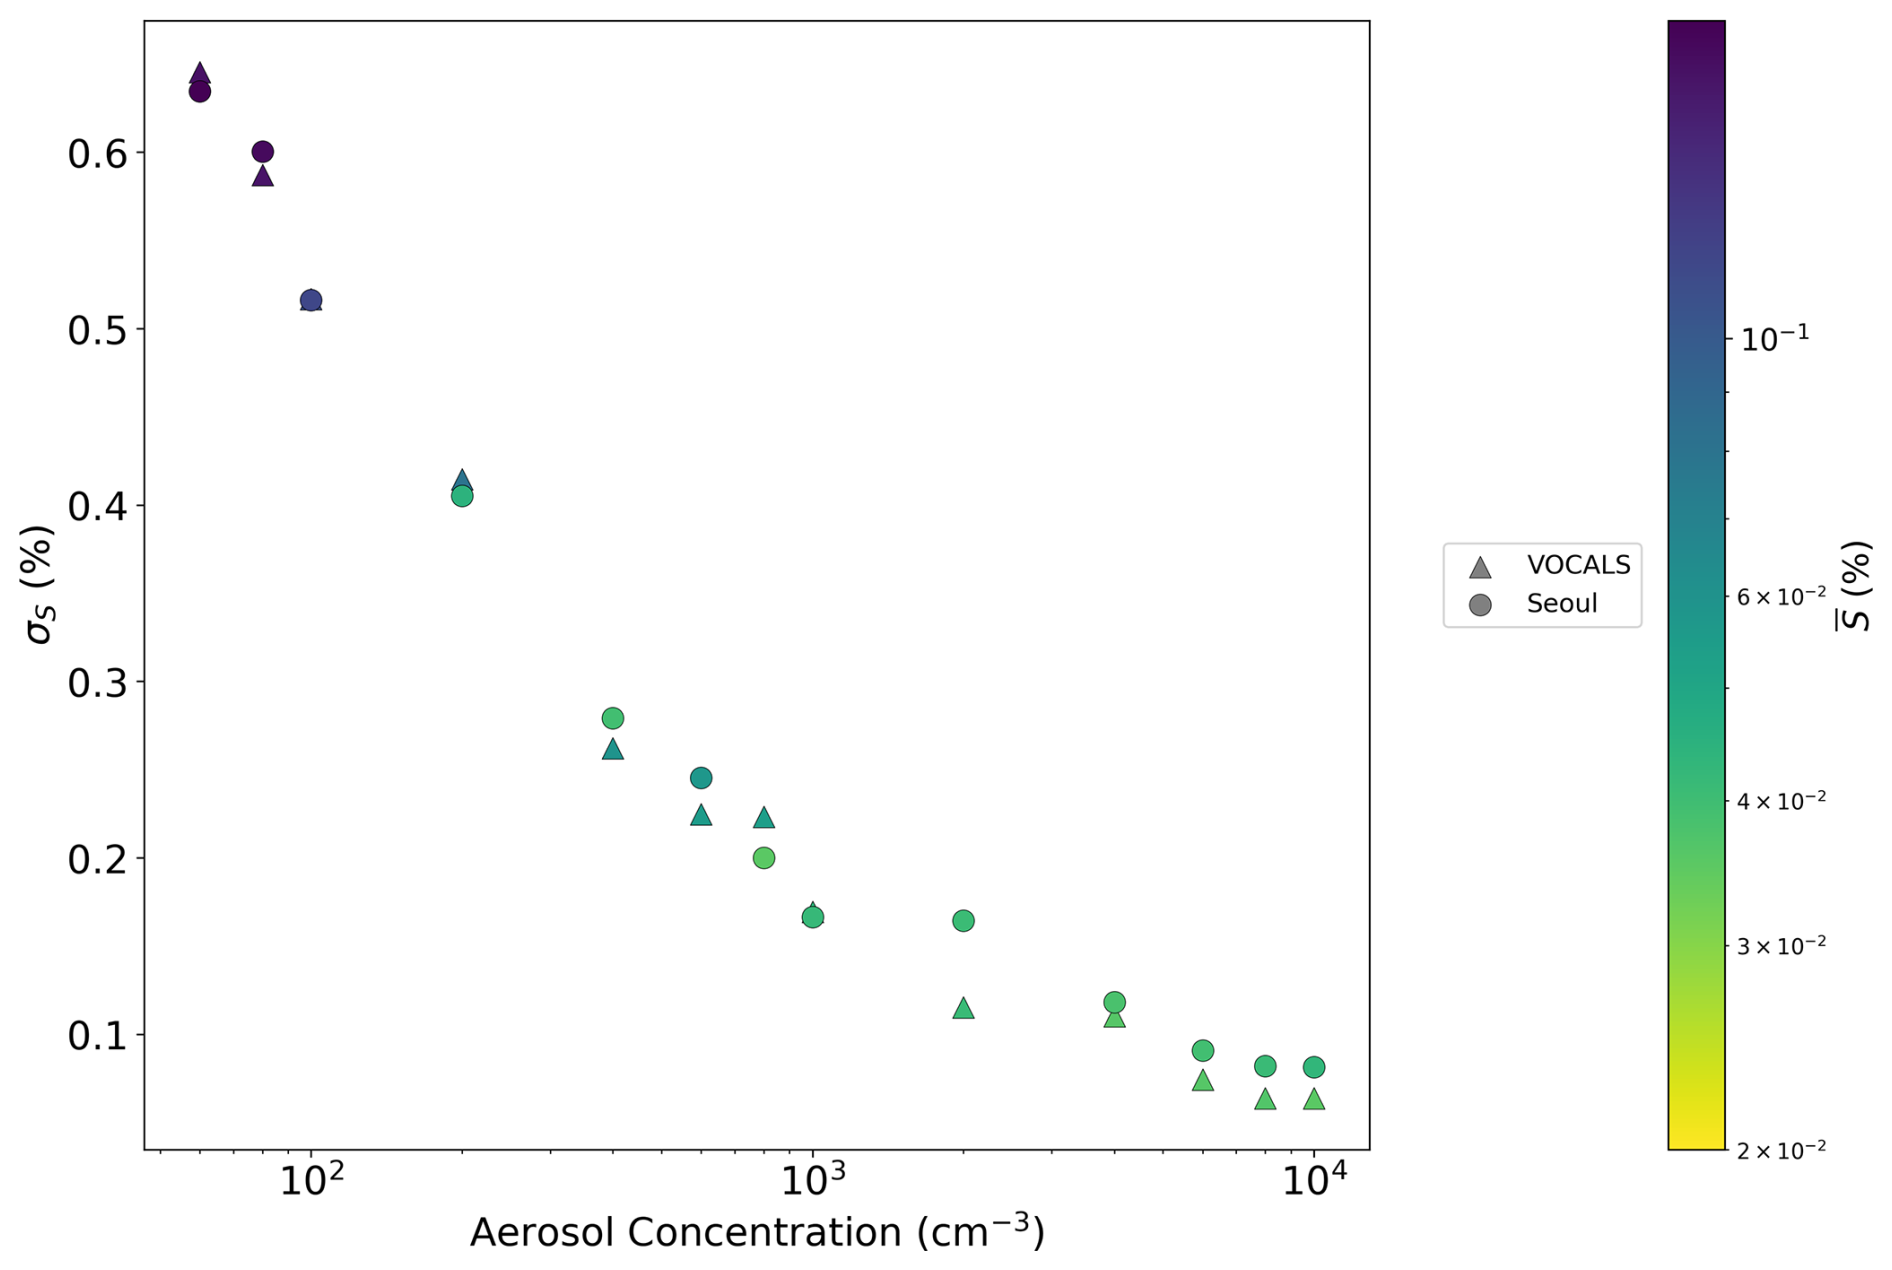
Figure 6Scatter of supersaturation standard deviation, σS, versus aerosol concentration for VOCALS (triangles) and Seoul (circles) aerosol distributions. Marker color denotes the mean supersaturation .
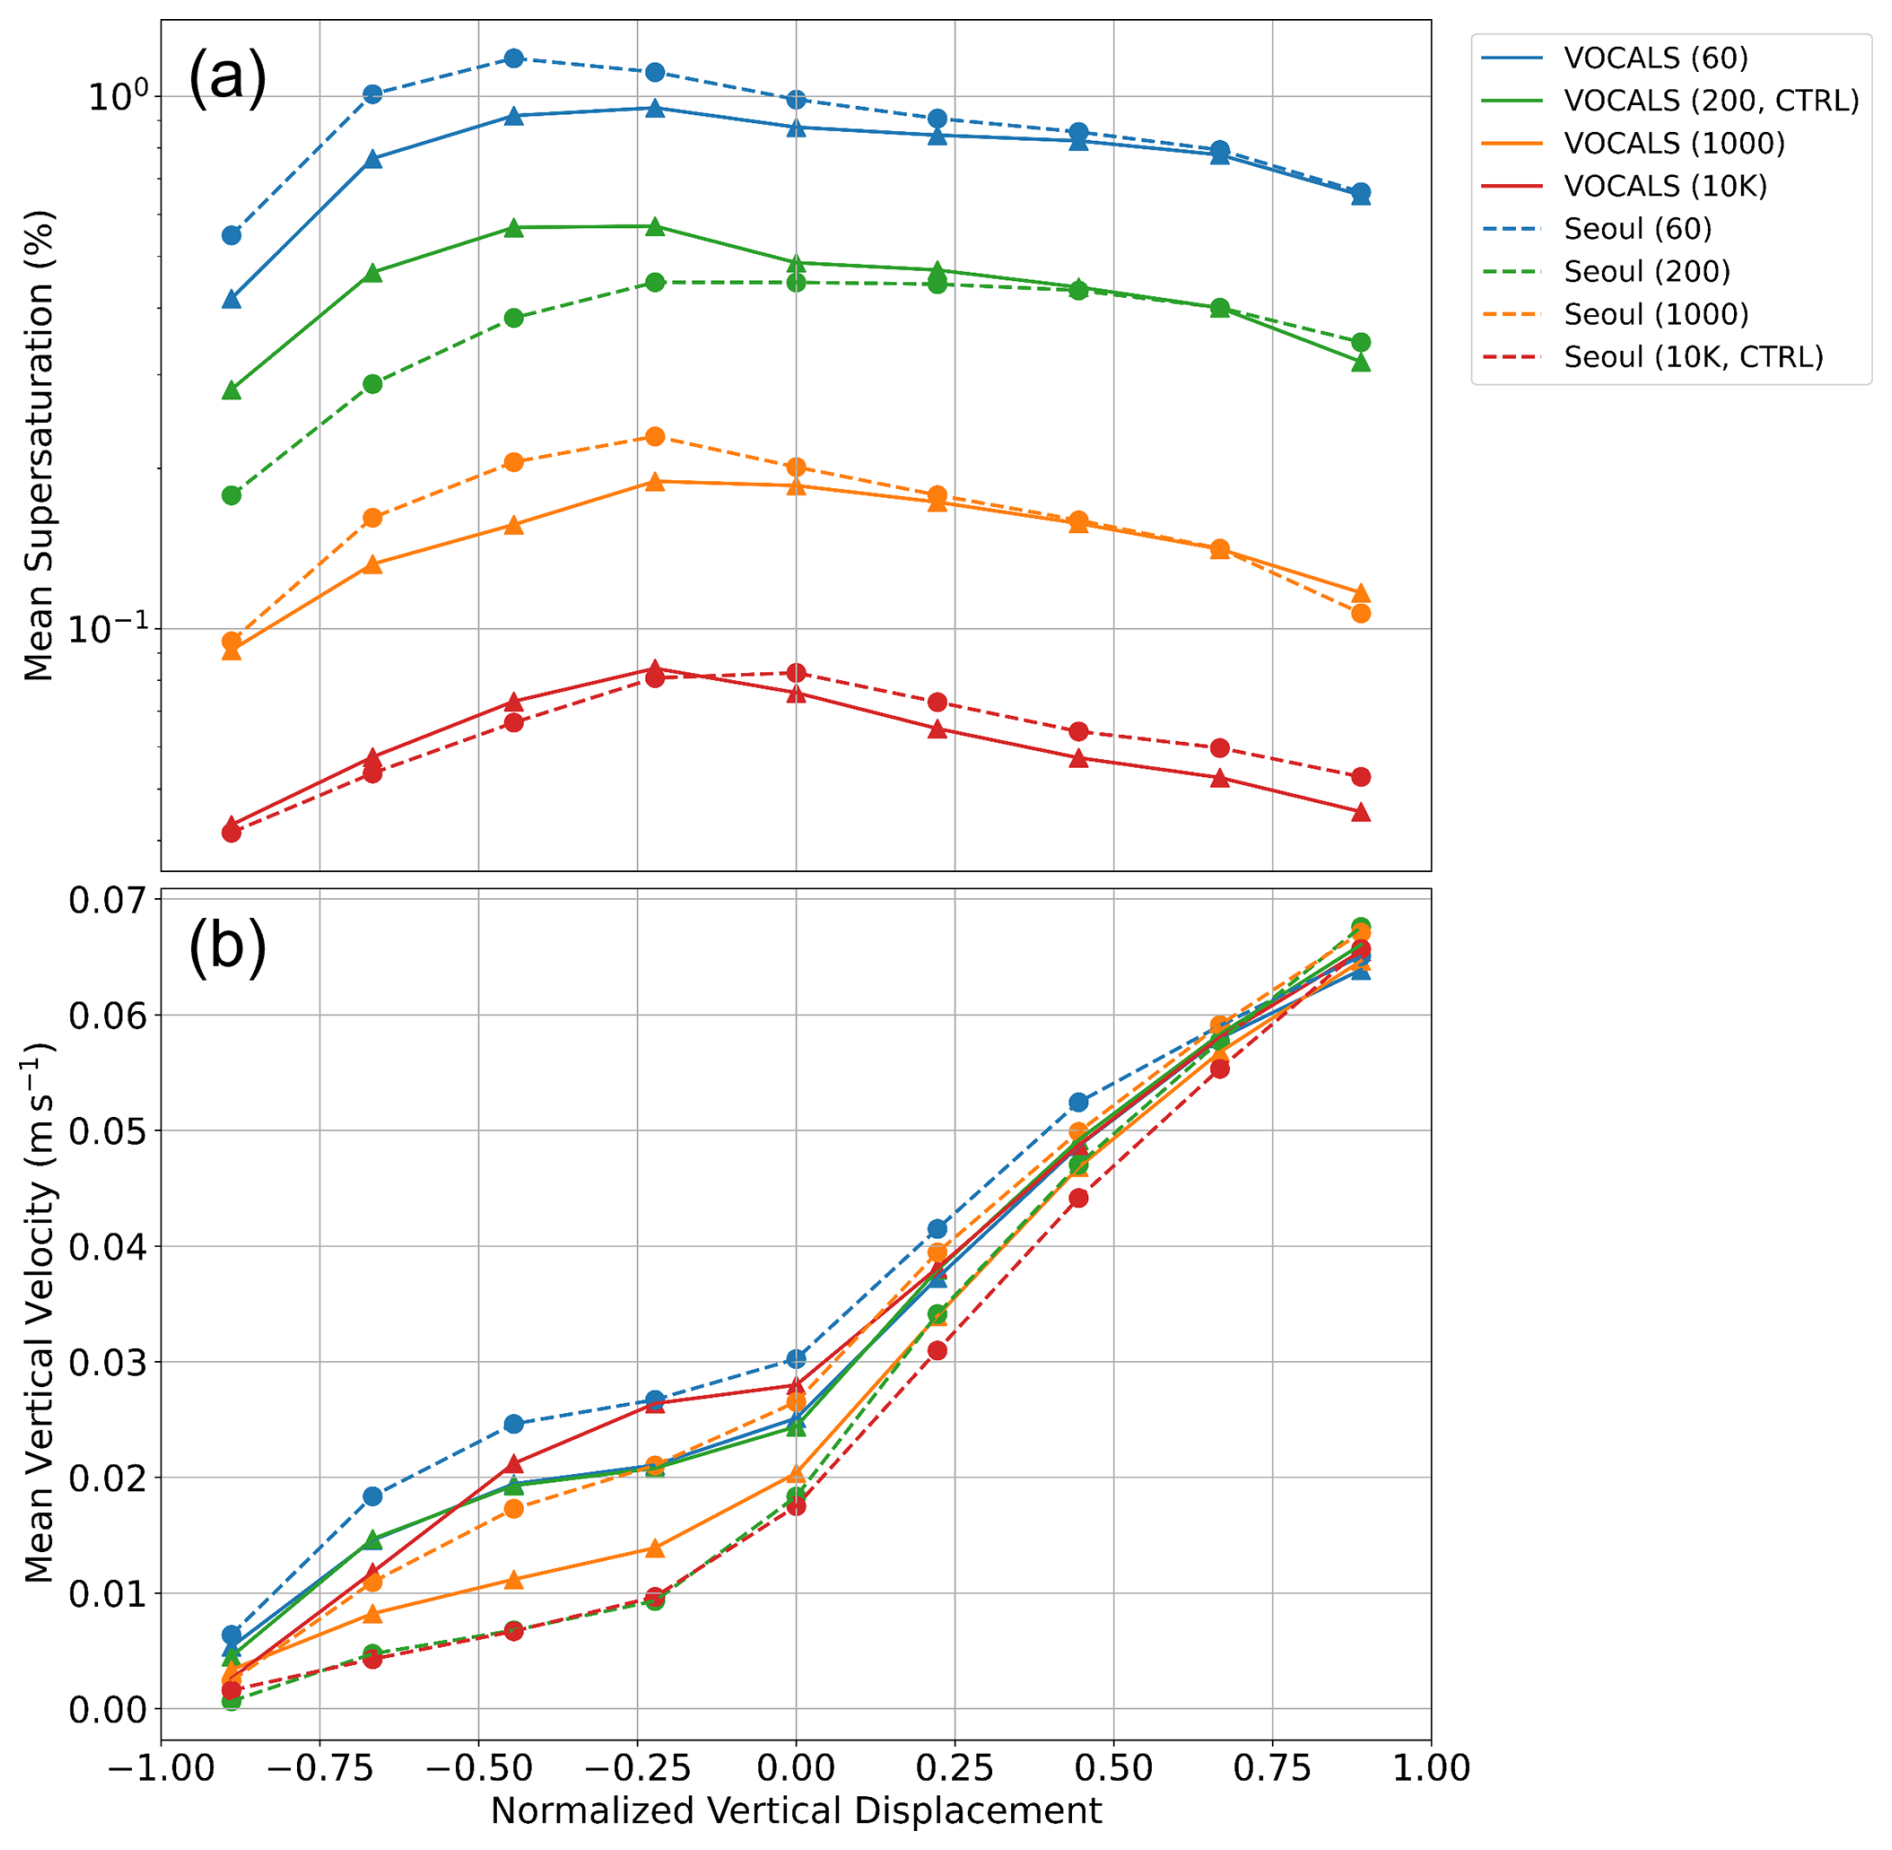
To better understand the dynamical origin of this suppressed variability, we examine how S interacts with vertical motion. Figure 7 illustrates a significant linear correlation (R2=0.93) between σS and the correlation coefficient between S and vertical velocity (W). This suggests that σS is closely tied to the interaction between W and S. Before interpreting this relationship, we address a potential concern raised by the mean supersaturation profiles in Fig. 5a and b, which exhibit oscillations near the lower and upper rigid boundaries. Two factors likely contribute to these near-wall oscillations. First, resolved transport and mixing are inefficient near rigid boundaries in ILES, which can allow sharp gradients to persist. Second, supersaturation is a diagnosed quantity, so small grid-scale perturbations in temperature and water vapor can translate into comparatively large fluctuations in S because of the nonlinear saturation relationship and advection–condensation coupling (Grabowski and Smolarkiewicz, 1990). Importantly, the W–S correlations reported in Fig. 7 are computed over the interior region away from the plates, and the aerosol-dependent trends in Fig. 7 remain unchanged when the boundary-adjacent layers are included (not shown). With this in mind, we interpret the aerosol dependence of W–S coupling as follows. In cleaner conditions, the longer phase relaxation time allows S to respond more directly to vertical motions, as vapor is not quickly depleted by condensation. However, in polluted conditions, the short phase relaxation time causes supersaturation to relax rapidly toward its quasi-steady value, so supersaturation responds only weakly to fluctuations in vertical velocity W. In other words, the rapid vapor consumption reduces S response to W variations, effectively decoupling S from W. This explains the weakened W–S coupling under high aerosol concentrations. To illustrate this W–S coupling more directly, Fig. 8 shows the scatterplot of supersaturation and vertical velocity. The scatterplots show that positive S values are preferentially associated with updrafts (W>0), whereas negative S occurs mainly in downdrafts (W<0), consistent with condensation being most effective during ascent. As aerosol concentration increases, both the positive and negative S tails contract toward zero, making the W–S relationship more symmetric and thereby weakening the W–S coupling. As noted by Grabowski et al. (2024), this positive correlation between S and W in the chamber arises not from adiabatic cooling driven by the updraft itself, but rather from the mixing of air volumes (parcels) with different thermodynamic properties originating from the lower and upper boundaries. Under constant-pressure conditions, upward motions near the lower boundary transport warmer and moister air there into the chamber, producing positive S perturbations. Conversely, downward motions transport air that is saturated at the cold upper boundary (low absolute qv) into the warmer chamber interior; as this air warms and mixes, saturation vapor mixing ratio increases faster than qv, so the local relative humidity decreases and subsaturation (S<0) can occur. This behavior is consistent with observations from laboratory chamber experiments, which report the most negative S in downdrafts (Anderson et al., 2021), accelerated vapor consumption reduces droplets' responsiveness to vertical S fluctuations, weakening the coupling between S and W (small W–S correlation) and reducing the variability of S (small σS). The physical explanation for this is: as aerosol concentration increases, the total droplet surface area also increases, facilitating faster water vapor consumption; Consequently, positive S in regions of upward motion is rapidly reduced toward zero; Meanwhile, in regions of downward vertical velocity, the increased droplet surface area accelerates evaporation, supplying water vapor efficiently and thereby driving negative S values toward zero fast. Notably, our simulations show clear sensitivity of both positive and negative S distributions to aerosol concentration (Fig. 8), whereas Grabowski et al. (2024) reported negligible sensitivity of negative S values to aerosol concentration. This discrepancy is likely attributable to differences in aerosol injection methodologies. Repeating the analysis over the full domain, including the boundary-adjacent layers, reduces the absolute magnitude of the W–S correlation but does not change the aerosol-dependent trends or the tight relationship between σS and the W–S correlation (not shown).
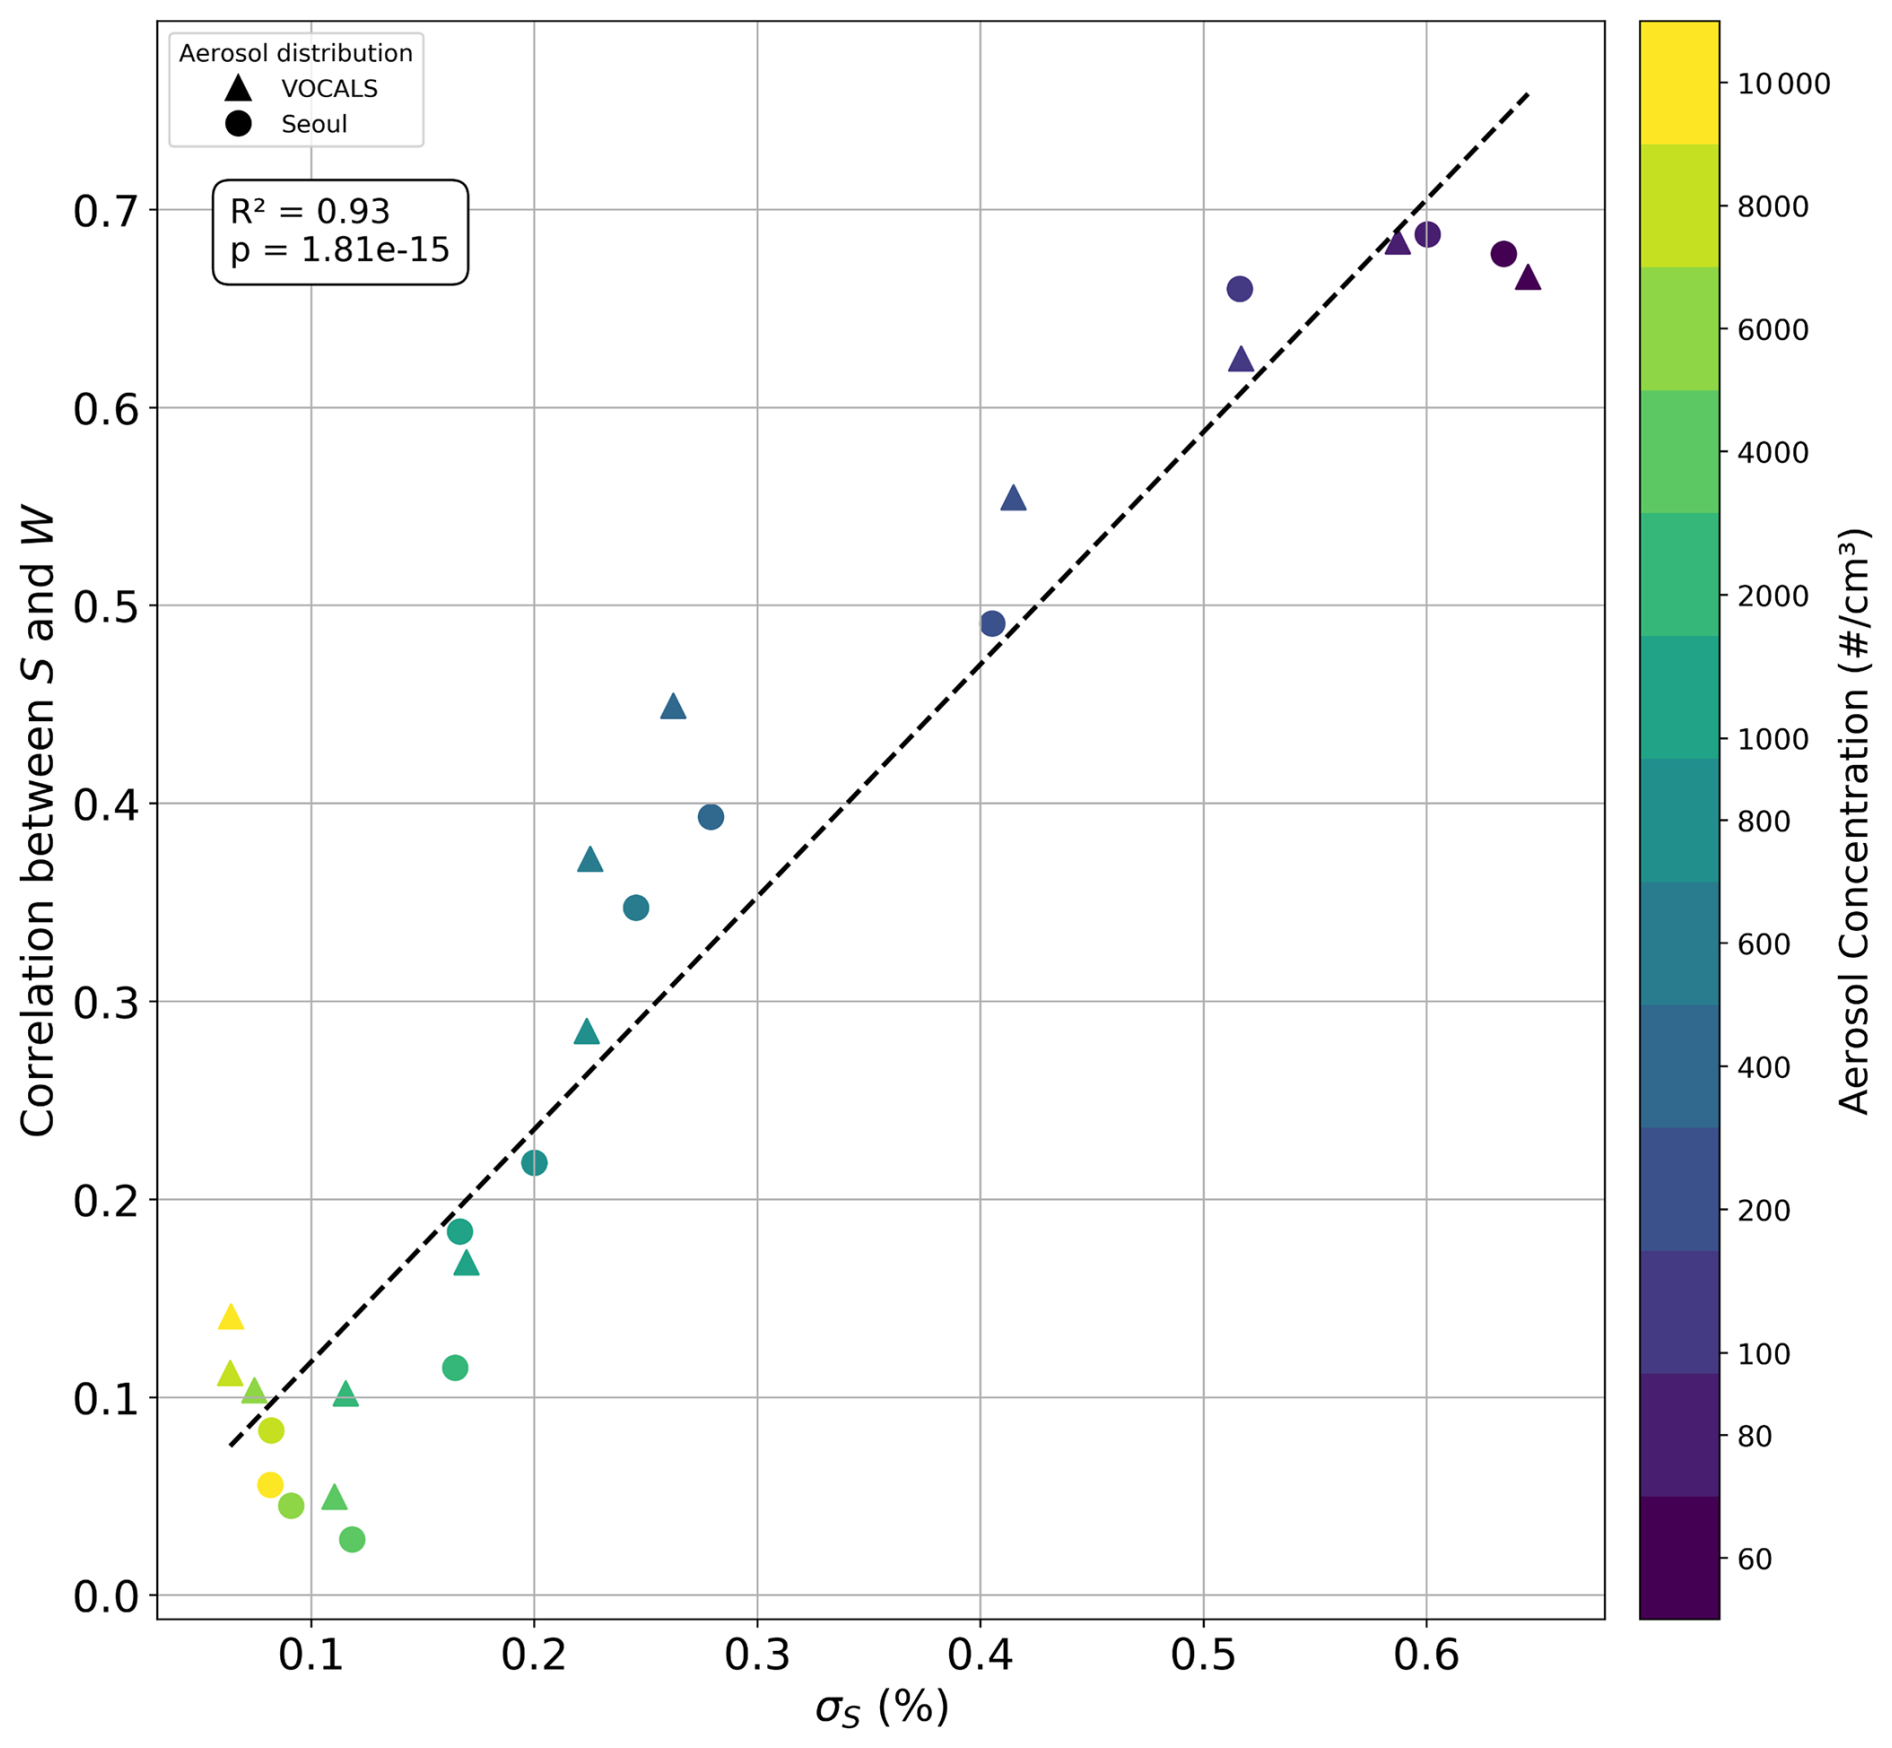
Figure 7Similar to Fig. 4, except showing the relationship between the domain-averaged supersaturation standard deviation (σS) and the correlation coefficient between supersaturation (S) and vertical velocity (W), computed at the chamber mid-level (z=1.0 m).
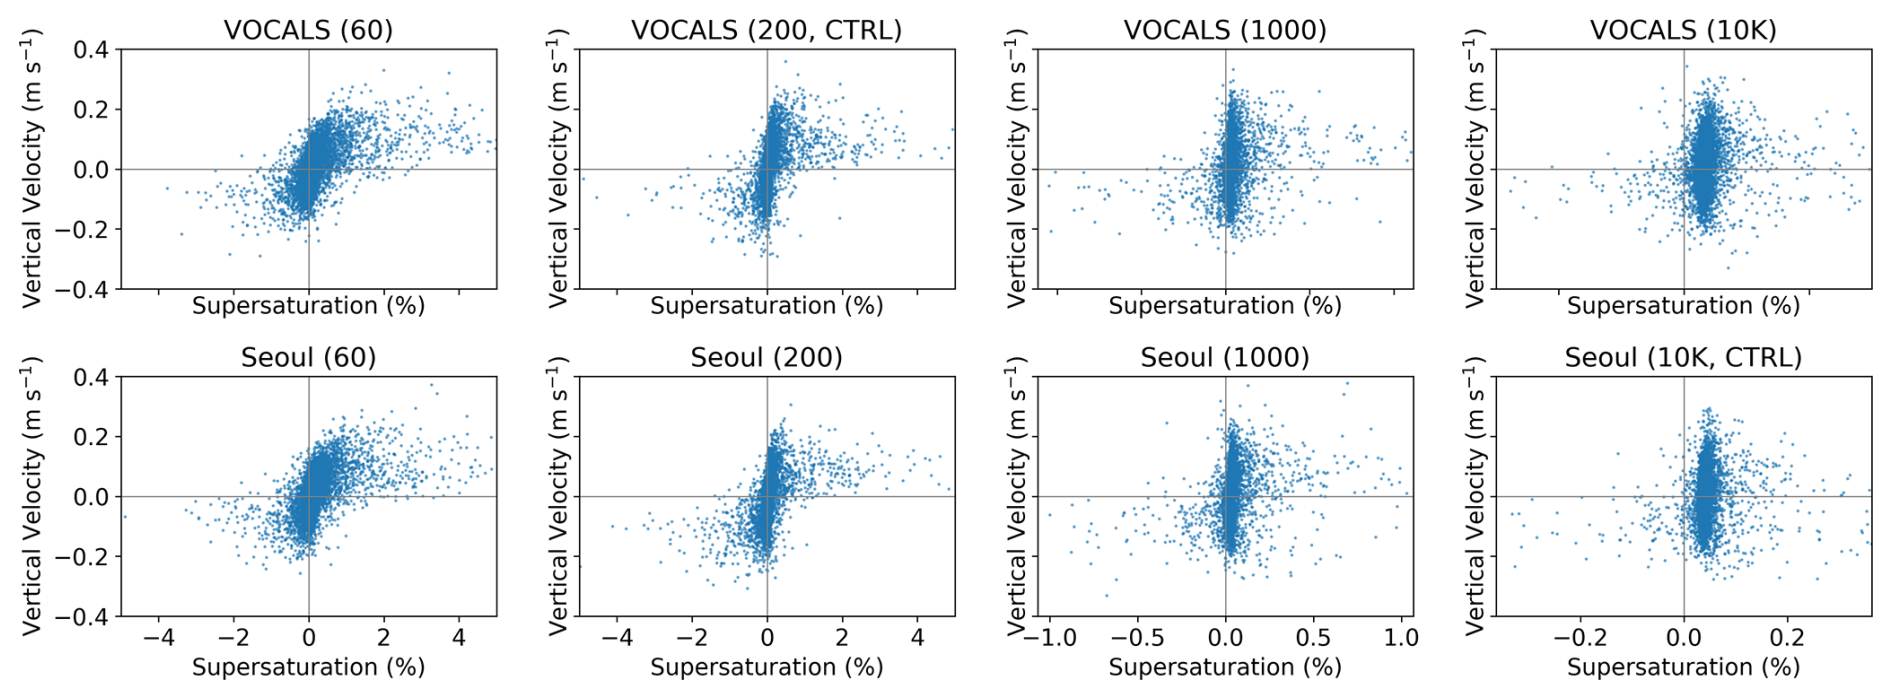
Figure 8Scatterplot of the vertical velocity as a function of the supersaturation for the last 15 min of the simulations. Only 0.1 % of randomly selected grid points away from chamber boundaries are included in the plot.
The simulated suppression of vertical gradients in qc under high aerosol concentrations is most plausibly explained by constraints imposed by τp. In polluted environments, the high number of activated droplets dramatically increases the total surface area available for condensation, which shortens τp and allows the condensational sink to balance the turbulent source of supersaturation over a short timescale. As a result, supersaturation remains small away from the production region near the lower boundary, and most condensational growth occurs there rather than being sustained throughout the full depth of the chamber. Consequently, droplets complete their growth before experiencing the full extent of vertical S variability typically encountered during upward transport. As a result, the effect of vertical motion on condensational growth is diminished, leading to a vertically uniform qc structure regardless of height within the convection chamber. This mechanism highlights how fast microphysical adjustment, rather than turbulent dynamics, primarily governs the vertical distribution of cloud condensate under polluted conditions. To further evaluate this interpretation, the next section presents a Lagrangian analysis that directly compares the characteristic timescales of condensation and turbulent mixing using parcel trajectories, providing a more quantitative framework for understanding the suppression of vertical microphysical variability.
4.1 Trajectory Analysis of Super-Droplets
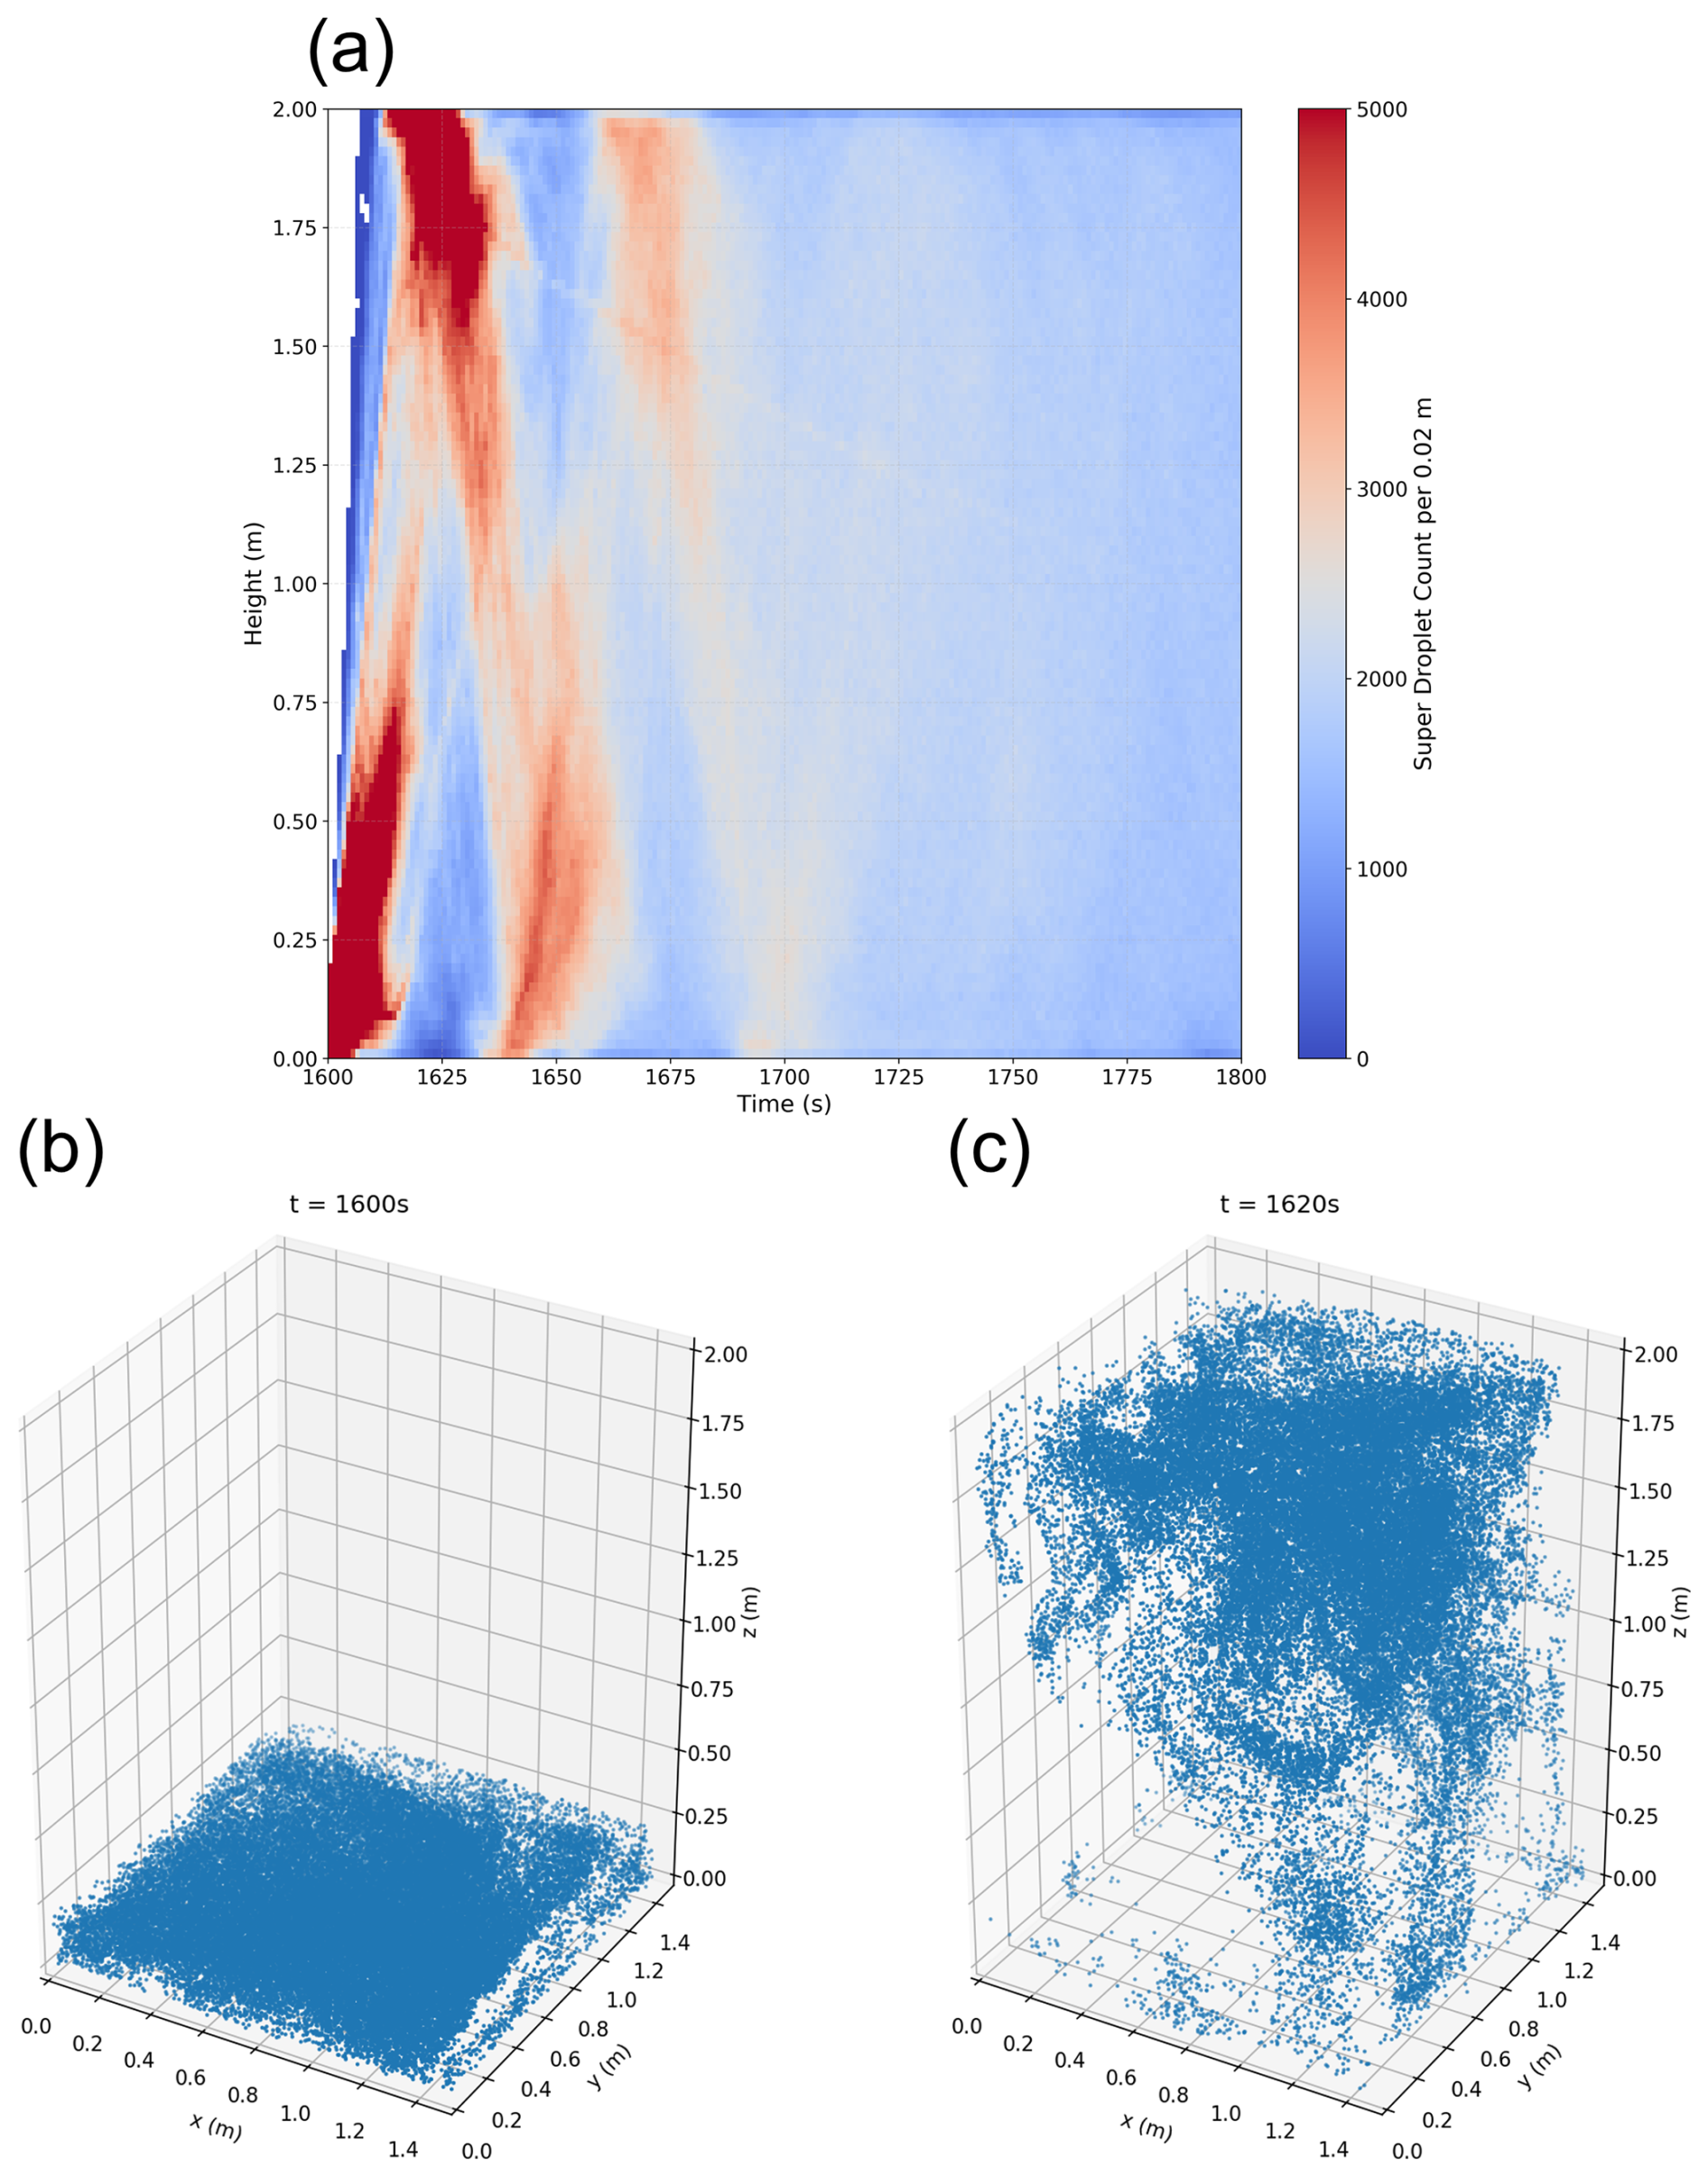
To investigate how SDs near the chamber base are vertically transported and dispersed, we performed Lagrangian tracking of all SDs residing within the lowest 0–0.2 m layer of the chamber at a certain point of time. Rather than analyzing a single case, we repeated this tracking procedure across multiple start times during the quasi-equilibrium period, specifically from 900–1780 s at 20 s intervals, to ensure statistical robustness and account for temporal variability of the flow field. Figures 9 and 10 present representative results for two tracking initiation times: 900 and 1600 s, respectively. Panel (a) in each figure shows time–height histograms of SD counts, revealing how SDs rapidly ascend from near the chamber base toward the upper region, subsequently descending and ascending again, with the total count decreasing due to wall losses. Panel (b) in each figure illustrates the spatial distributions of SDs at the initial moments (t=900 s for Fig. 9, and 1600 s for Fig. 10), while panel (c) depict their positions 20 s later (t=920 and 1620 s, respectively). These figures clearly illustrate that most SDs ascend to heights above 1.5 m within approximately 20 s (panel a), although the detailed spatial distribution and vertical extent differ depending on the tracking initiation time (panel c).
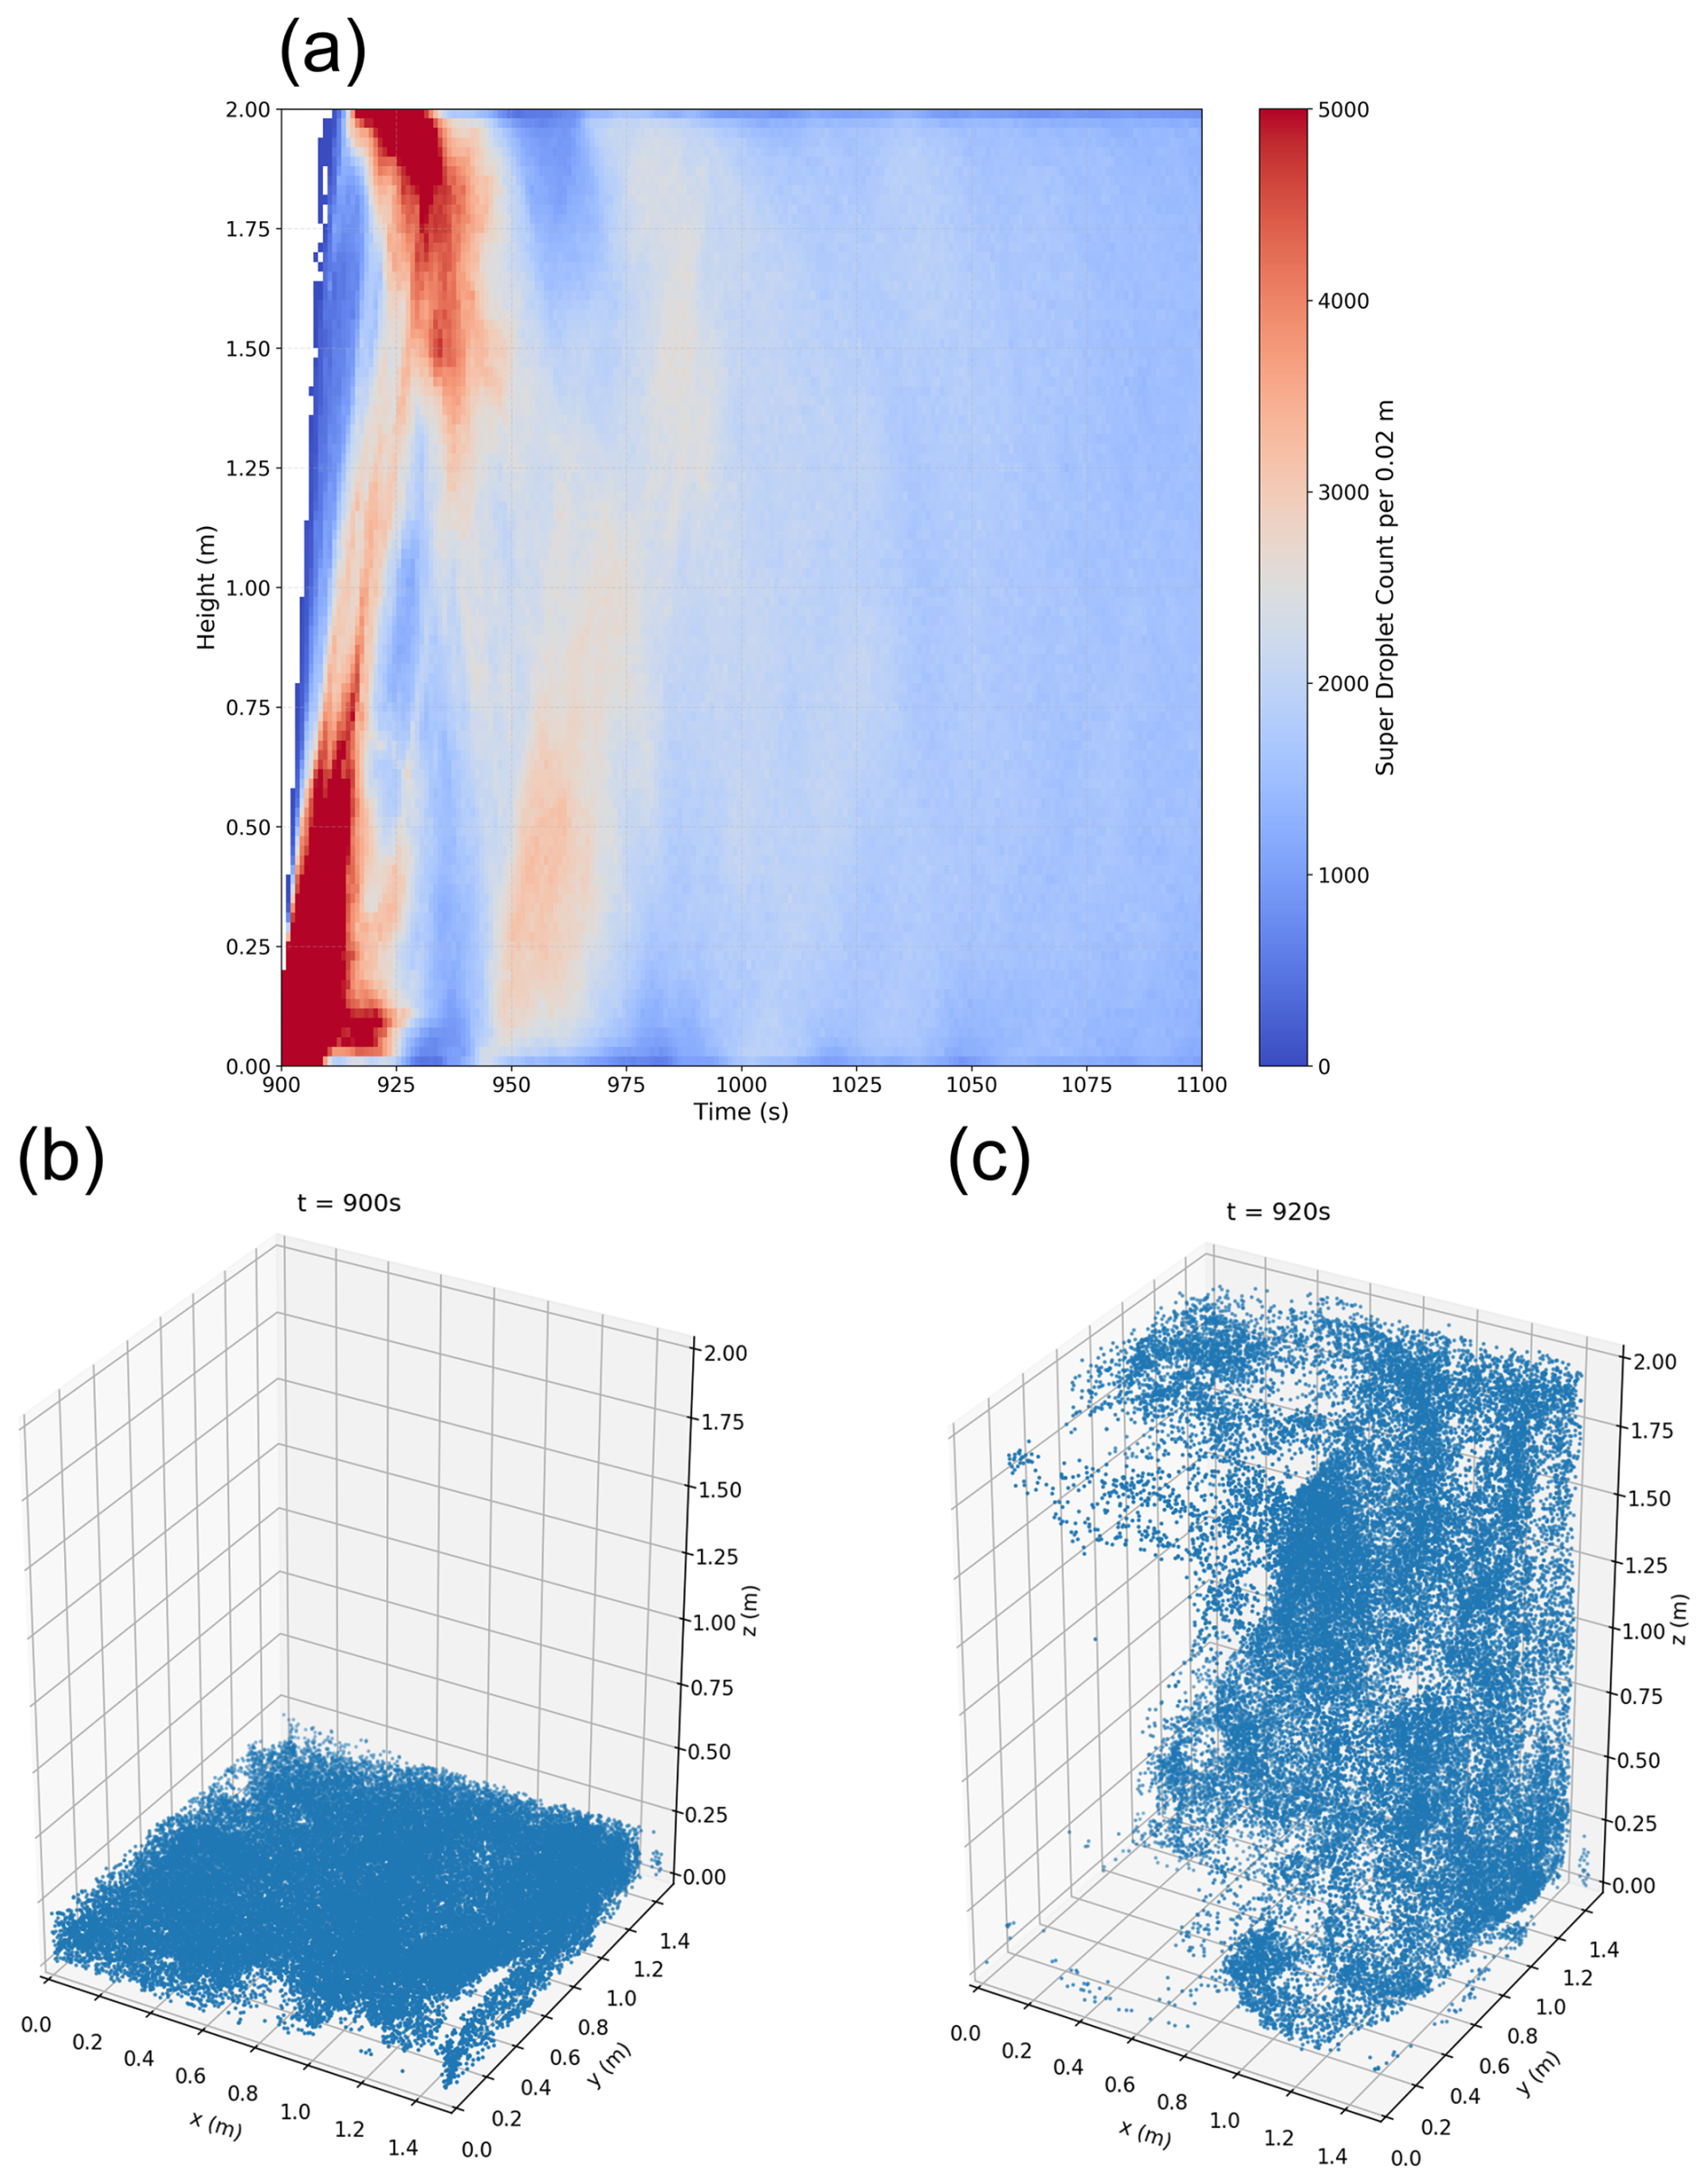
Figure 9Vertical trajectories of all SDs initiated near the chamber base () and tracked forward in time from t=900 s in the VOCALS (200, CTRL) case. (a) Time–height histograms showing the temporal evolution of SD vertical positions for the 900 s. (b) 3D spatial distributions of 50 000 randomly selected SDs at the corresponding start times, t=900 s. Snapshots at t=920 s showing the same tracked SDs from (b) 20 s after start times.
Given that most SDs ascend from the chamber base to the upper region (z>1.5 m) within approximately 20 s, this ascent time serves as a proxy for the turbulent mixing timescale (τm), that is, the characteristic time over which the supersaturation field changes due to turbulent advection and mixing, in contrast to the phase relaxation time (τp), which characterizes changes in supersaturation due to condensational growth. The turbulent mixing timescale can also be independently estimated from the upper height of the chamber (1.5 m) and a characteristic turbulent velocity scale (), interpreted as the rms turbulent velocity, derived from the mean turbulent kinetic energy () as . This calculation yields a mixing timescale of approximately 28 s, which is longer than the previously mentioned ascent timescale of ∼20 s, likely because the 20 s estimate primarily considers SDs strongly influenced by ascending motion. In contrast, τp becomes significantly shorter under high aerosol concentrations, decreasing from about 14 s in clean cases to around 1 s in polluted conditions (Fig. 4). This disparity can be expressed by the Damköhler number (), which quantifies the relative pace of condensation versus turbulent mixing. In polluted environments, Da≫1, which indicates that condensation adjusts much faster than vertical mixing, so the condensational sink rapidly balances the turbulent source and maintains a low quasi-steady supersaturation. As a result, supersaturation fluctuations and additional condensational growth aloft are strongly reduced, and qc becomes nearly uniform with height. This behavior is consistent with the quasi-steady supersaturation framework of Chandrakar et al. (2018), in which both the mean supersaturation and its variance decrease as the system timescale ) becomes smaller. This decoupling between vertical motion and S evolution explains the weakened vertical gradients of qc observed under high aerosol loading. To further investigate how vertical motion influences droplet behavior under these conditions, we analyzed the trajectories of SDs within the lowest 0–0.2 m layer based on their normalized vertical displacement, using the VOCALS (200, CTRL) case as a representative example. Normalized vertical displacement is quantified for each SD over the 20 s tracking interval by comparing its height at a certain second to that of the previous second. If the SD ascended, score of +1 was assigned; if it descended, −1; and if there was no change, 0. These 20 values were summed and divided by 20, yielding a normalized score between −1 (entirely descending) and +1 (entirely ascending). Figure 11a shows the evolution over time (0–20 s) of the mean height of all SDs grouped by their normalized vertical displacement bins: each line represents the mean height of SDs and shaded bands indicate the 25th–75th percentile range. The results demonstrate a clear trend that shows SDs with higher normalized vertical displacement tending to reach significantly higher heights. Despite this trend, turbulent motions in the convection chamber allow some SDs with lower normalized vertical displacement to reach relatively elevated heights. Figure 11b presents the results averaged over all tracking start times (900–1780 s). For each start time, the mean SD height was calculated for each normalized vertical displacement bin, and the shaded bands represent the 25th–75th percentile range of these mean height lines across all start times. The overall trend closely resembles that of the single case shown in Fig. 11a, confirming the robustness of the normalized vertical displacement metric in capturing vertical transport pathways in the convection chamber.
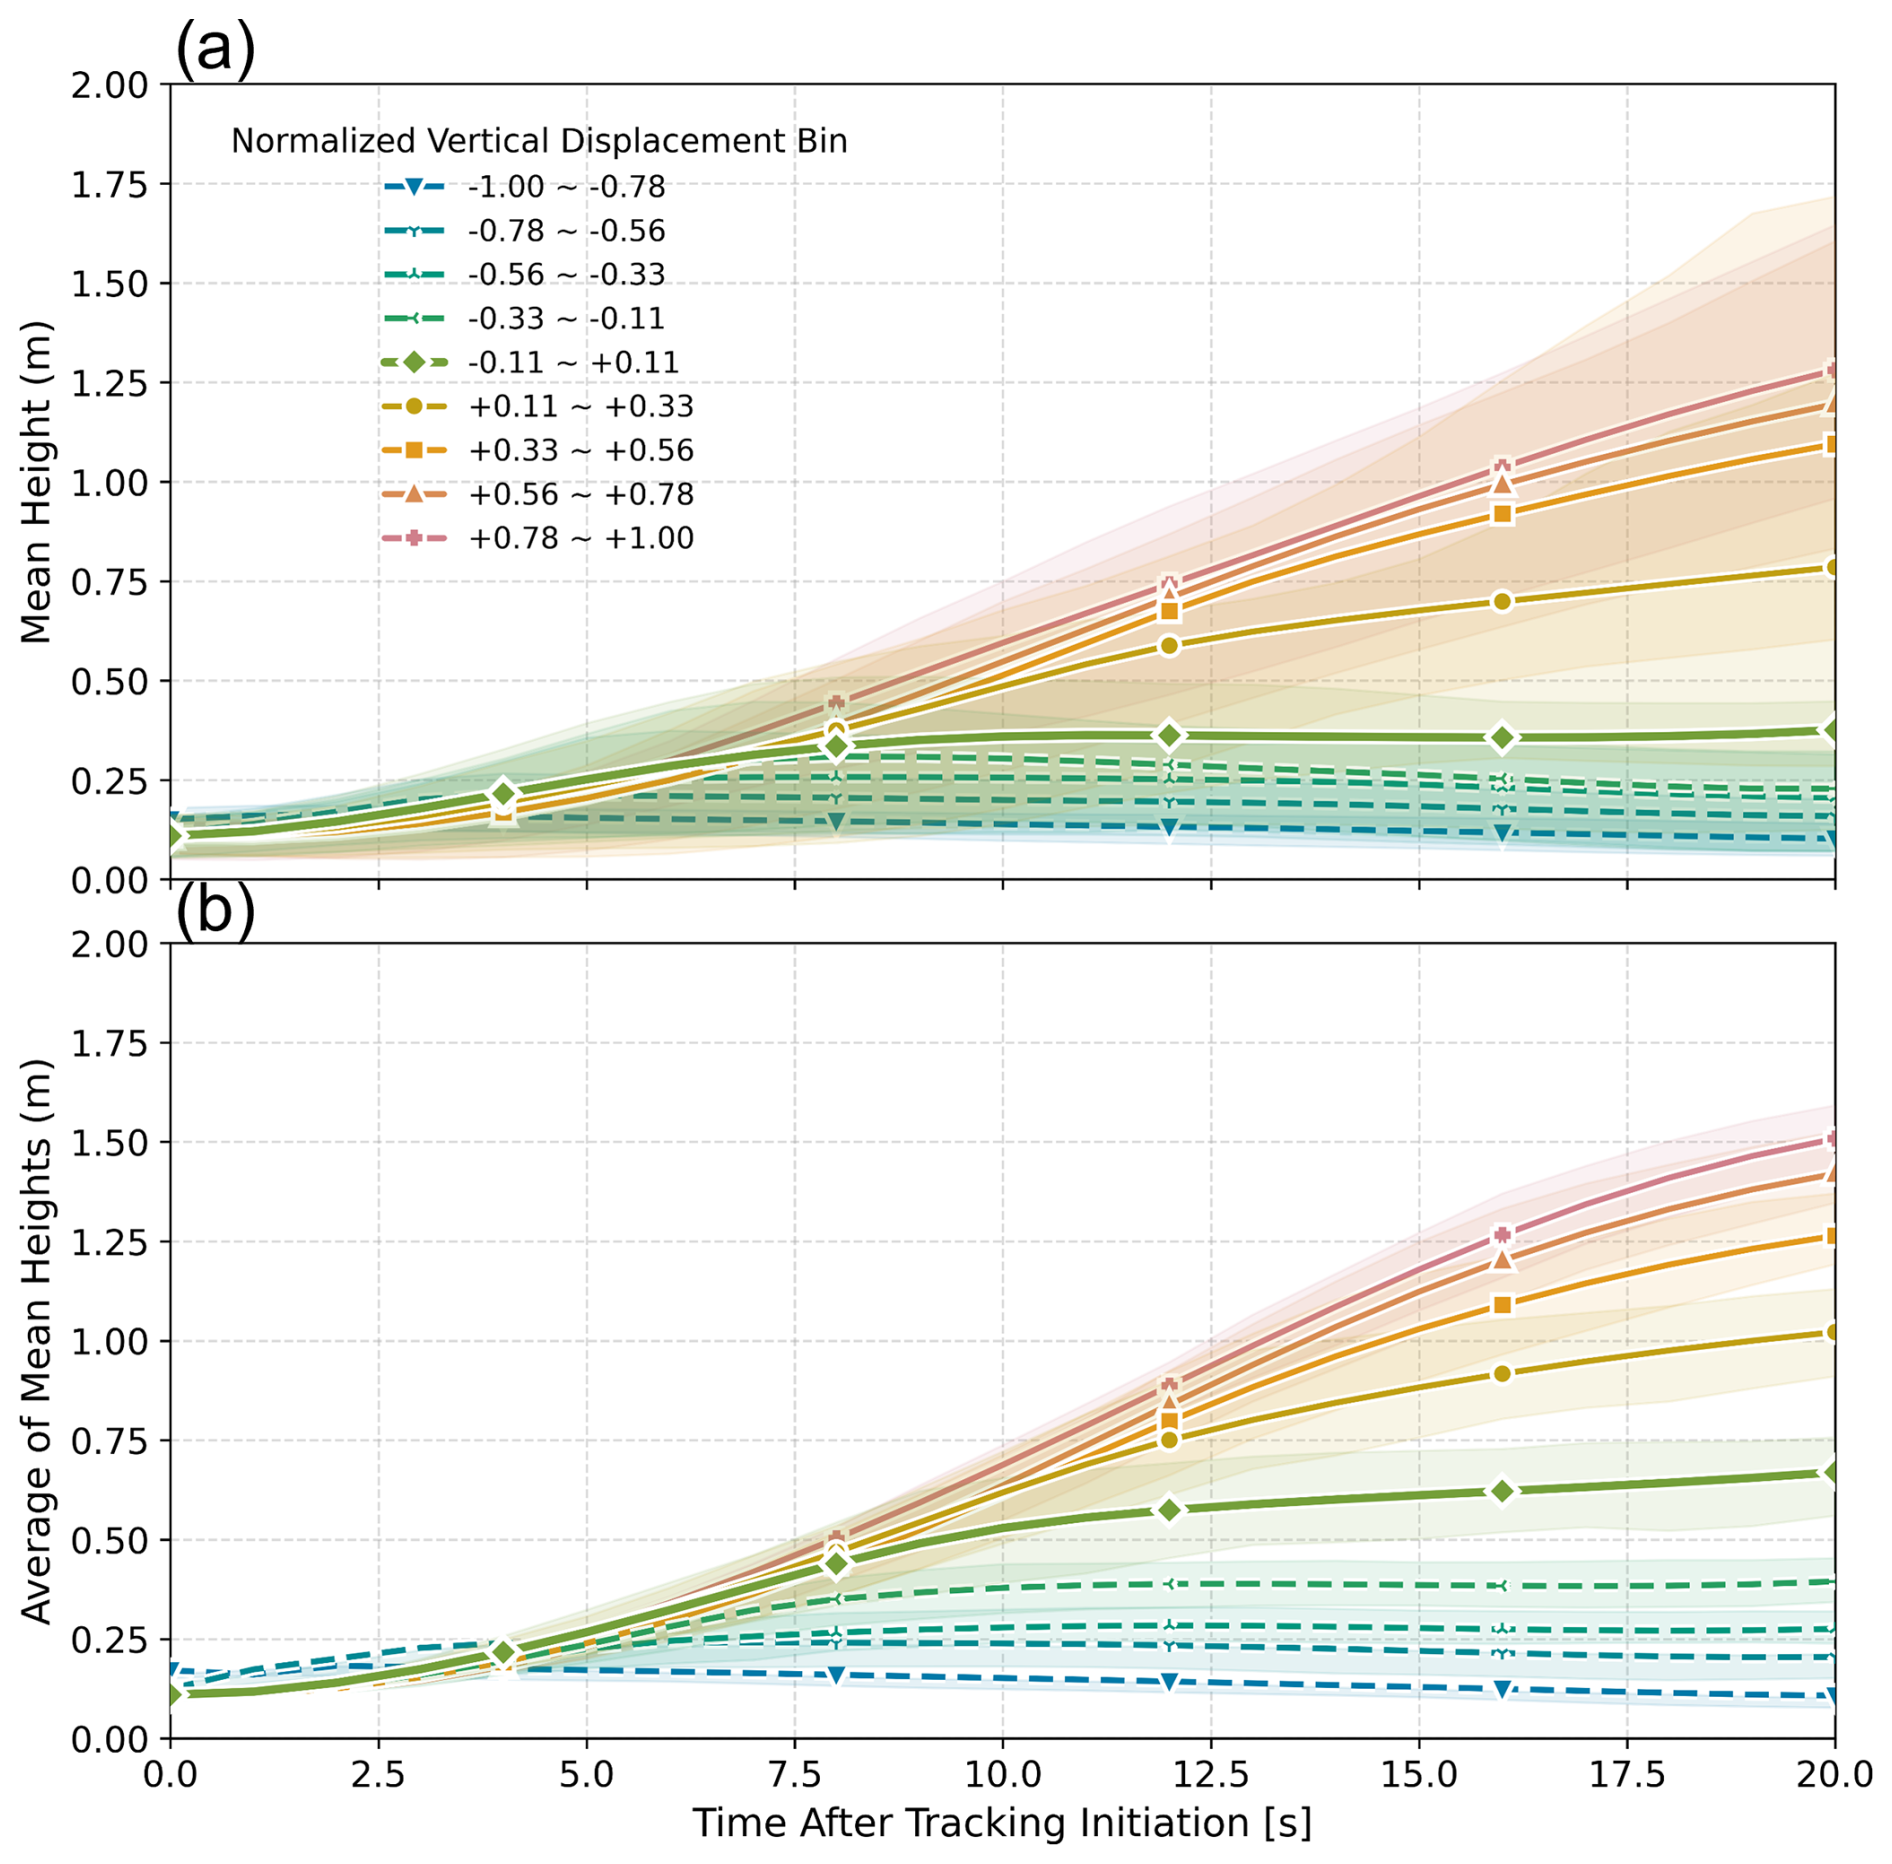
Figure 11(a) Mean SD height as a function of time (0–20 s) after tracking initiation at the single start time of 900 s, computed for each normalized vertical displacement bin in the VOCALS (200, CTRL) case. Shaded bands represent the 25th–75th percentile range of all individual SD trajectories within each bin. (b) Average of mean SD heights of all start times (900, 920, …, 1780 s) for the same case. Shaded bands represent the 25th–75th percentile range of the mean height lines across all start times. Line colors indicate normalized vertical displacement bins.
Building on the Lagrangian tracking framework introduced above, we further investigate how vertical motion influences droplet growth under varying aerosol conditions. Specifically, we analyze the size evolution of individual SDs over 20 s as a function of their normalized vertical displacement. Again, this analysis focuses on SDs initially located near the chamber base (0–0.2 m layer) and tracked upward through turbulent mixing. Tracking was initiated at multiple start times during the quasi-equilibrium period (from t=900 to 1780 s, every 20 s), and the results were averaged across these intervals. Figure 12a presents the mean normalized droplet growth (dr) of each SD as a function of its normalized vertical displacement. The droplet growth is calculated using:
where rstart and rend are the radius of each SD at the beginning and end of the 20 s interval, respectively. It is clear that SDs with higher normalized vertical displacement generally exhibit larger dr compared to those in the lowest normalized vertical displacement bin (−1.0 to −0.78), particularly for normalized vertical displacement bins up to approximately −0.56 to −0.33, across most aerosol concentrations. This indicates that trajectories that spend more time moving upward within the supersaturation source region near the chamber base tend to experience enhanced condensational growth. Under such conditions, ascending SDs experience more favorable thermodynamic environments for condensational growth. However, as aerosol concentration increases, dr for ascending SDs becomes less pronounced. In particular, the VOCALS (10 K) and Seoul (10 K, CTRL) cases show significantly reduced differences in growth between ascending and descending SDs, suggesting that condensational growth becomes less sensitive to vertical motion because S is rapidly buffered near a low quasi-steady value set by the balance between the boundary-forced vapor supply (transport) and the enhanced condensational sink at high aerosol loading (short τp). Figure 12b presents the mean count of SDs in each normalized vertical displacement bin. SDs that were removed due to wall-loss were excluded from the count. Notably, the total SD count tends to increase with aerosol number concentration. This is because higher aerosol loading generally leads to smaller activated droplets with lower fall velocities, thereby reducing sedimentation-driven wall losses and allowing more SDs to remain within the domain throughout the tracking period.
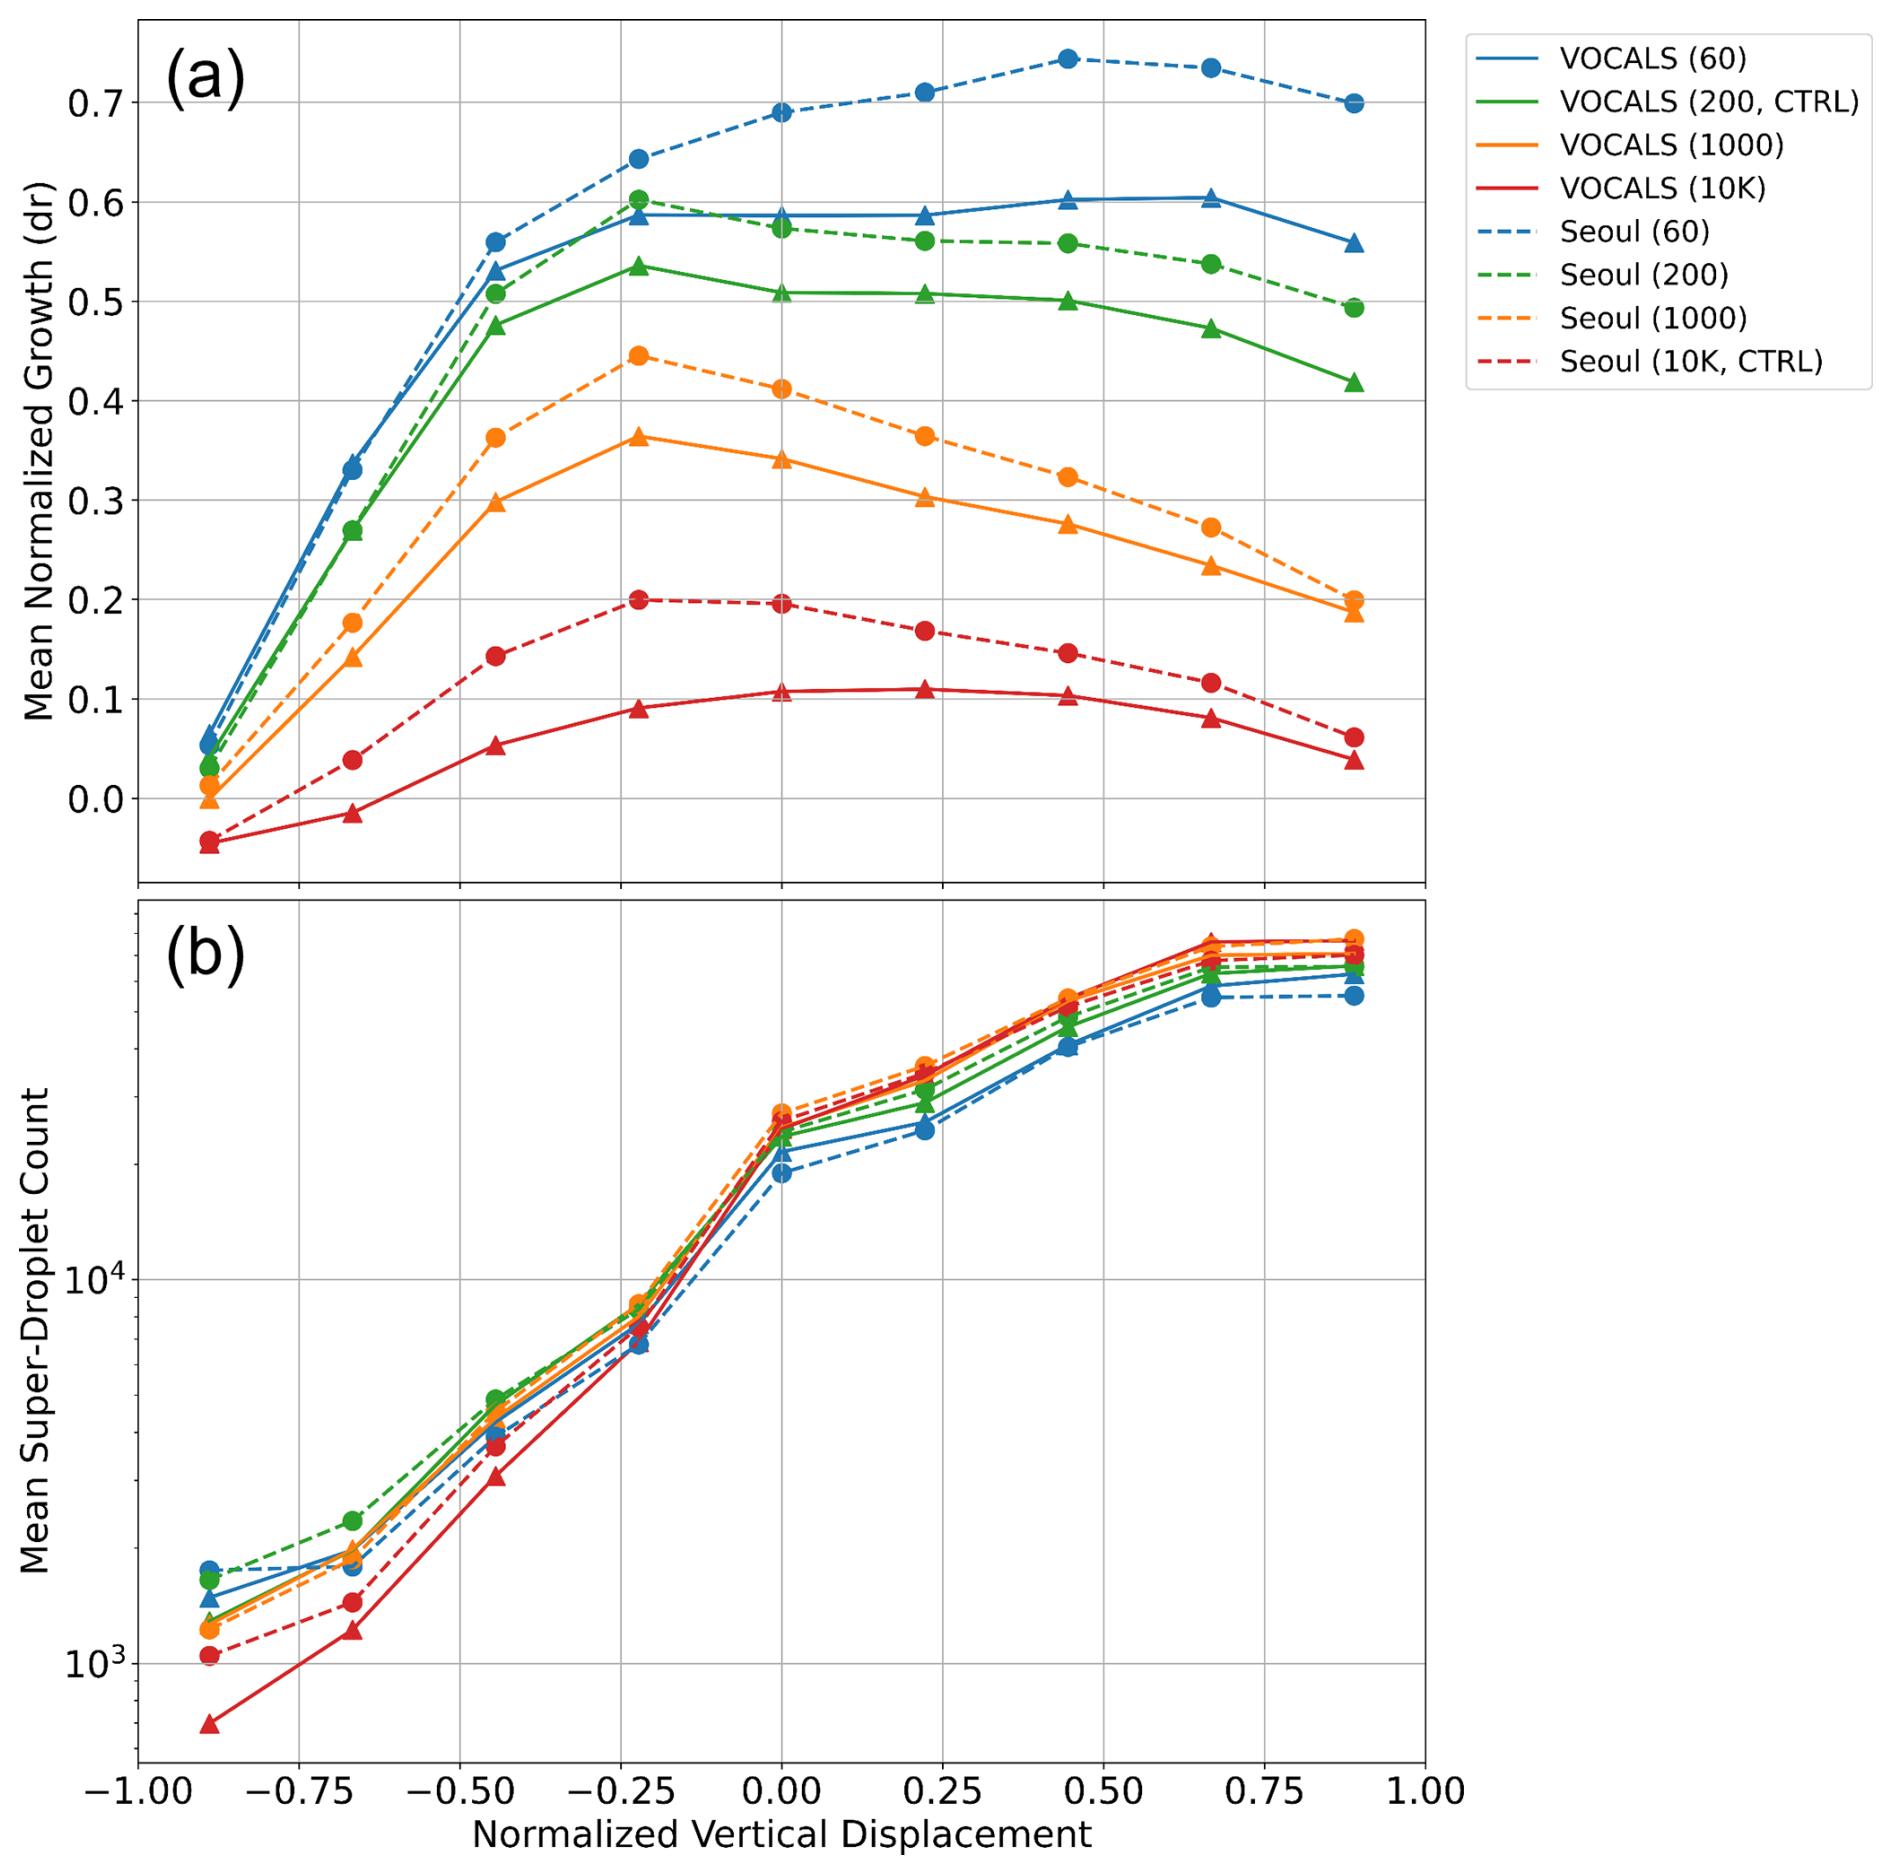
Figure 12Relationship between droplet growth and vertical motion behavior over a 20 s period for SDs initially located within 0–0.2 m of the chamber base at each start time. The analysis is averaged over multiple start times (900–1780 s, every 20 s) during the quasi-equilibrium period. (a) Mean dr as a function of normalized vertical displacement, which quantifies the fraction of time each SD spent ascending. (b) SD count within each normalized vertical displacement bin.
A particularly notable feature in Fig. 12a is that the maximum dr does not occur at the highest normalized vertical displacement bin but instead peaks near −0.25, for polluted conditions. This counterintuitive result can be explained by the vertical structure of the S field within the chamber. As shown in Fig. 5a and b, S is high near the bottom boundary, where warm and moist air perturbations are introduced via wall forcing. Consequently, S is spatially confined to the lower region of the chamber and becomes progressively depleted with height. SDs with moderate normalized vertical displacement (around −0.25) tend to remain within this lower region (z≲0.5 m; see Fig. 11) and are repeatedly exposed to grid cells containing higher S. In contrast, SDs with higher normalized vertical displacement ascend more rapidly and move beyond the S-generating layer, entering S-depleted regions where further growth is limited. This mechanism explains the turnover in dr (except VOCALS (60) and Seoul (60)) in Fig. 12a: droplets that ascend too quickly exit the favorable growth environment before maximizing condensational growth. This interpretation is further supported by the normalized vertical displacement-binned mean S values shown in Fig. 13a, which represent the average S encountered by SDs along their trajectories. In all cases, S reaches its maximum at a normalized vertical displacement near −0.25 and steadily declines at higher bins. This trend reflects the spatial confinement of the S production zone near the chamber base and the lack of its regeneration at higher heights. Under clean conditions, where vapor competition is weak and the S field persists longer due to slower depletion, dr continues to increase with normalized vertical displacement. In contrast, under polluted conditions, rapid vapor consumption depletes S more efficiently near the base, limiting droplet growth even for strongly ascending SDs. Figure 13b confirms the positive correlation between normalized vertical displacement and vertical velocity.
4.2 Dependence of Droplet Activation on Vertical Dynamics
To further investigate how vertical dynamics influence cloud microphysical evolution, we analyze the activation behavior of unactivated SDs initially located near the chamber base () under varying aerosol conditions. Rather than focusing on a single time, we apply this analysis across multiple start times during the quasi-equilibrium period (900–1780 s, every 20 s). The activation fraction is defined as the ratio of the number concentration of SDs that become activated during the 20 s tracking interval to the total number concentration of initially unactivated SDs located near the chamber base (). Figure 14a shows the activation fraction of SDs binned by normalized vertical displacement, averaged for all start times. Each SD was tracked for 20 s after its respective start time, and its activation status was evaluated. The activation fraction increases from the mostly descending trajectories toward moderately ascending ones and typically peaks near a normalized vertical displacement of about −0.25, then decreases or changes only weakly at higher normalized vertical displacements. This pattern closely resembles dr trends discussed earlier (Fig. 12), where SDs with moderate normalized vertical displacement experienced the largest size increase. In both the dr (Fig. 12) and activation fraction (Fig. 14) analyses, the key factor is that SDs whose normalized vertical displacement lies near −0.25 remain longer within the lower chamber layer (z≲0.5 m), where S is locally enhanced by mixing of air parcels with contrasting temperature and humidity from the upper and lower boundaries. As shown in Fig. 5, horizontally averaged S tends to be the highest near the bottom boundary and decreases toward zero with height. Trajectories in this normalized vertical displacement range around −0.25 are repeatedly exposed to this supersaturation source region, which increases both their probability of activation and their condensational growth. In contrast, SDs with larger normalized vertical displacement ascend more quickly out of the lower layer and spend more time in regions where S has already been depleted, so both their activation fraction and dr are reduced. As aerosol concentration increases, the overall activation fraction declines due to intensified vapor competition. In highly polluted cases such as VOCALS (10 K) and Seoul (10 K, CTRL), even strongly ascending SDs show limited activation, and the difference between ascending and descending SDs becomes small. This suggests that condensational growth depletes vapor faster than it can be replenished by turbulent mixing, reducing S variability and diminishing the impact of vertical motion. Figure 14b shows the mean number of unactivated SDs near the chamber base that remained within the simulation domain and were fully tracked for 20 s after each start time (, every 20 s), binned by normalized vertical displacement. Figure 15a and c show the three-dimensional locations of the first activation events for 50 000 SDs that were randomly selected from the population of unactivated SDs located between 0 and 0.2 m at 1600 s for VOCALS (200, CTRL) and VOCALS (10 K) cases, respectively. Figure 15b and d present the corresponding vertical histograms using 0.02 m height bins. For VOCALS (200, CTRL), 24 423 of the tracked SDs activate between 1600 and 1620 s, and a substantial fraction of these activation events occur well above the source layer near the lower boundary, with activation locations extending through much of the chamber depth. For VOCALS (10 K), only 6512 SDs activate, and these activation events are almost entirely confined to heights below about 0.3 m, with a weaker secondary maximum near the chamber top where S is also elevated, consistent with the vertical structure of S, as shown in Fig. 5a. As discussed in Sect. 3.2, the present simulations exhibit supersaturation oscillations near the lower and upper rigid boundaries, and in Fig. 15c and d much of the polluted-case activation occurs within the near-bottom layer where the positive supersaturation oscillation is the strongest. This indicates that activation in polluted conditions is indeed concentrated in a shallow near-bottom region in the chamber, although the local magnitude of activation in this boundary-adjacent layer may be enhanced by the numerical oscillation. We therefore interpret Fig. 15 primarily as evidence for the vertical confinement of activation under polluted conditions, rather than as a precise quantitative measure of the absolute activation magnitude near the boundary. Importantly, the main conclusions of this study do not rely on this near-wall feature alone, because the weakening of the dependence of droplet growth and activation on vertical motion is also supported by the interior W–S diagnostics and the trajectory-based statistics shown in Figs. 7, 12, and 14. Reducing these near-boundary supersaturation oscillations is an important priority for future chamber simulations.
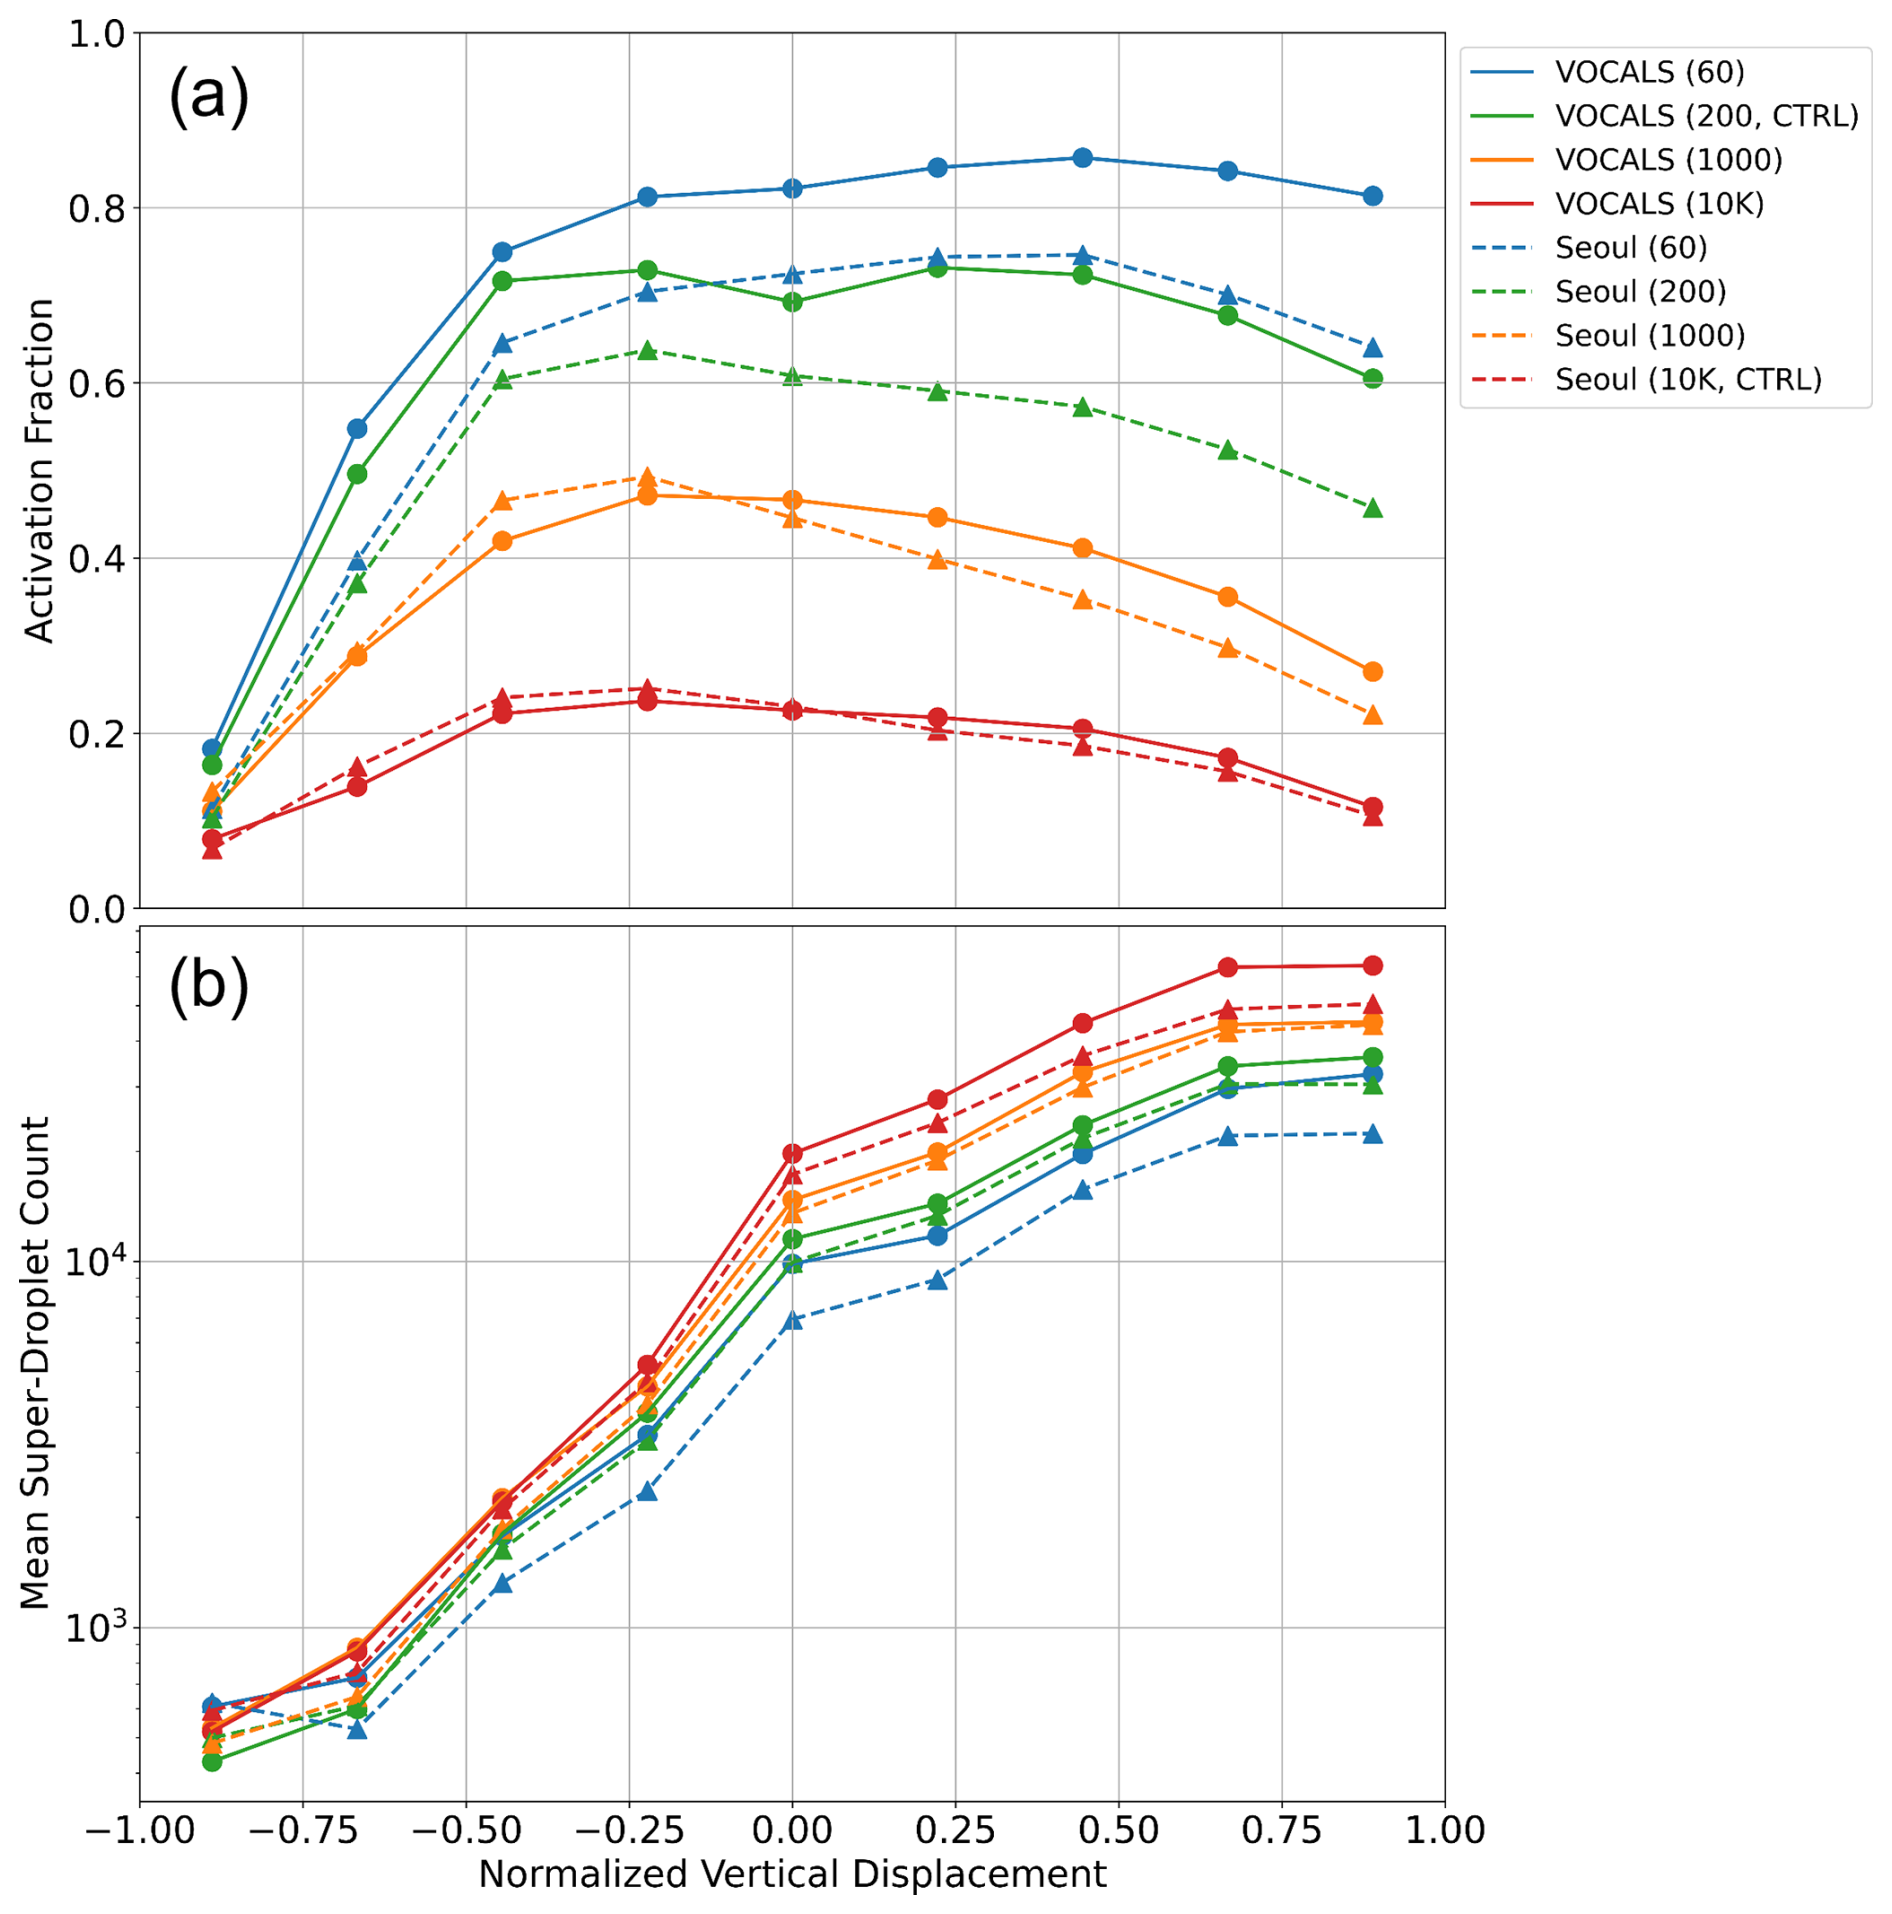
Figure 14(a) Activated droplet fraction over a 20 s interval, binned by normalized vertical displacement. The fraction is calculated by dividing Nc of SDs that are in the activated state at by the Nc of unactivated SDs initially located near the chamber base () at each start time. The analysis is averaged over multiple start times during the quasi-equilibrium period. (b) Mean count of SDs that were successfully tracked over each 20 s interval (starting from every 20 s), binned by normalized vertical displacement.
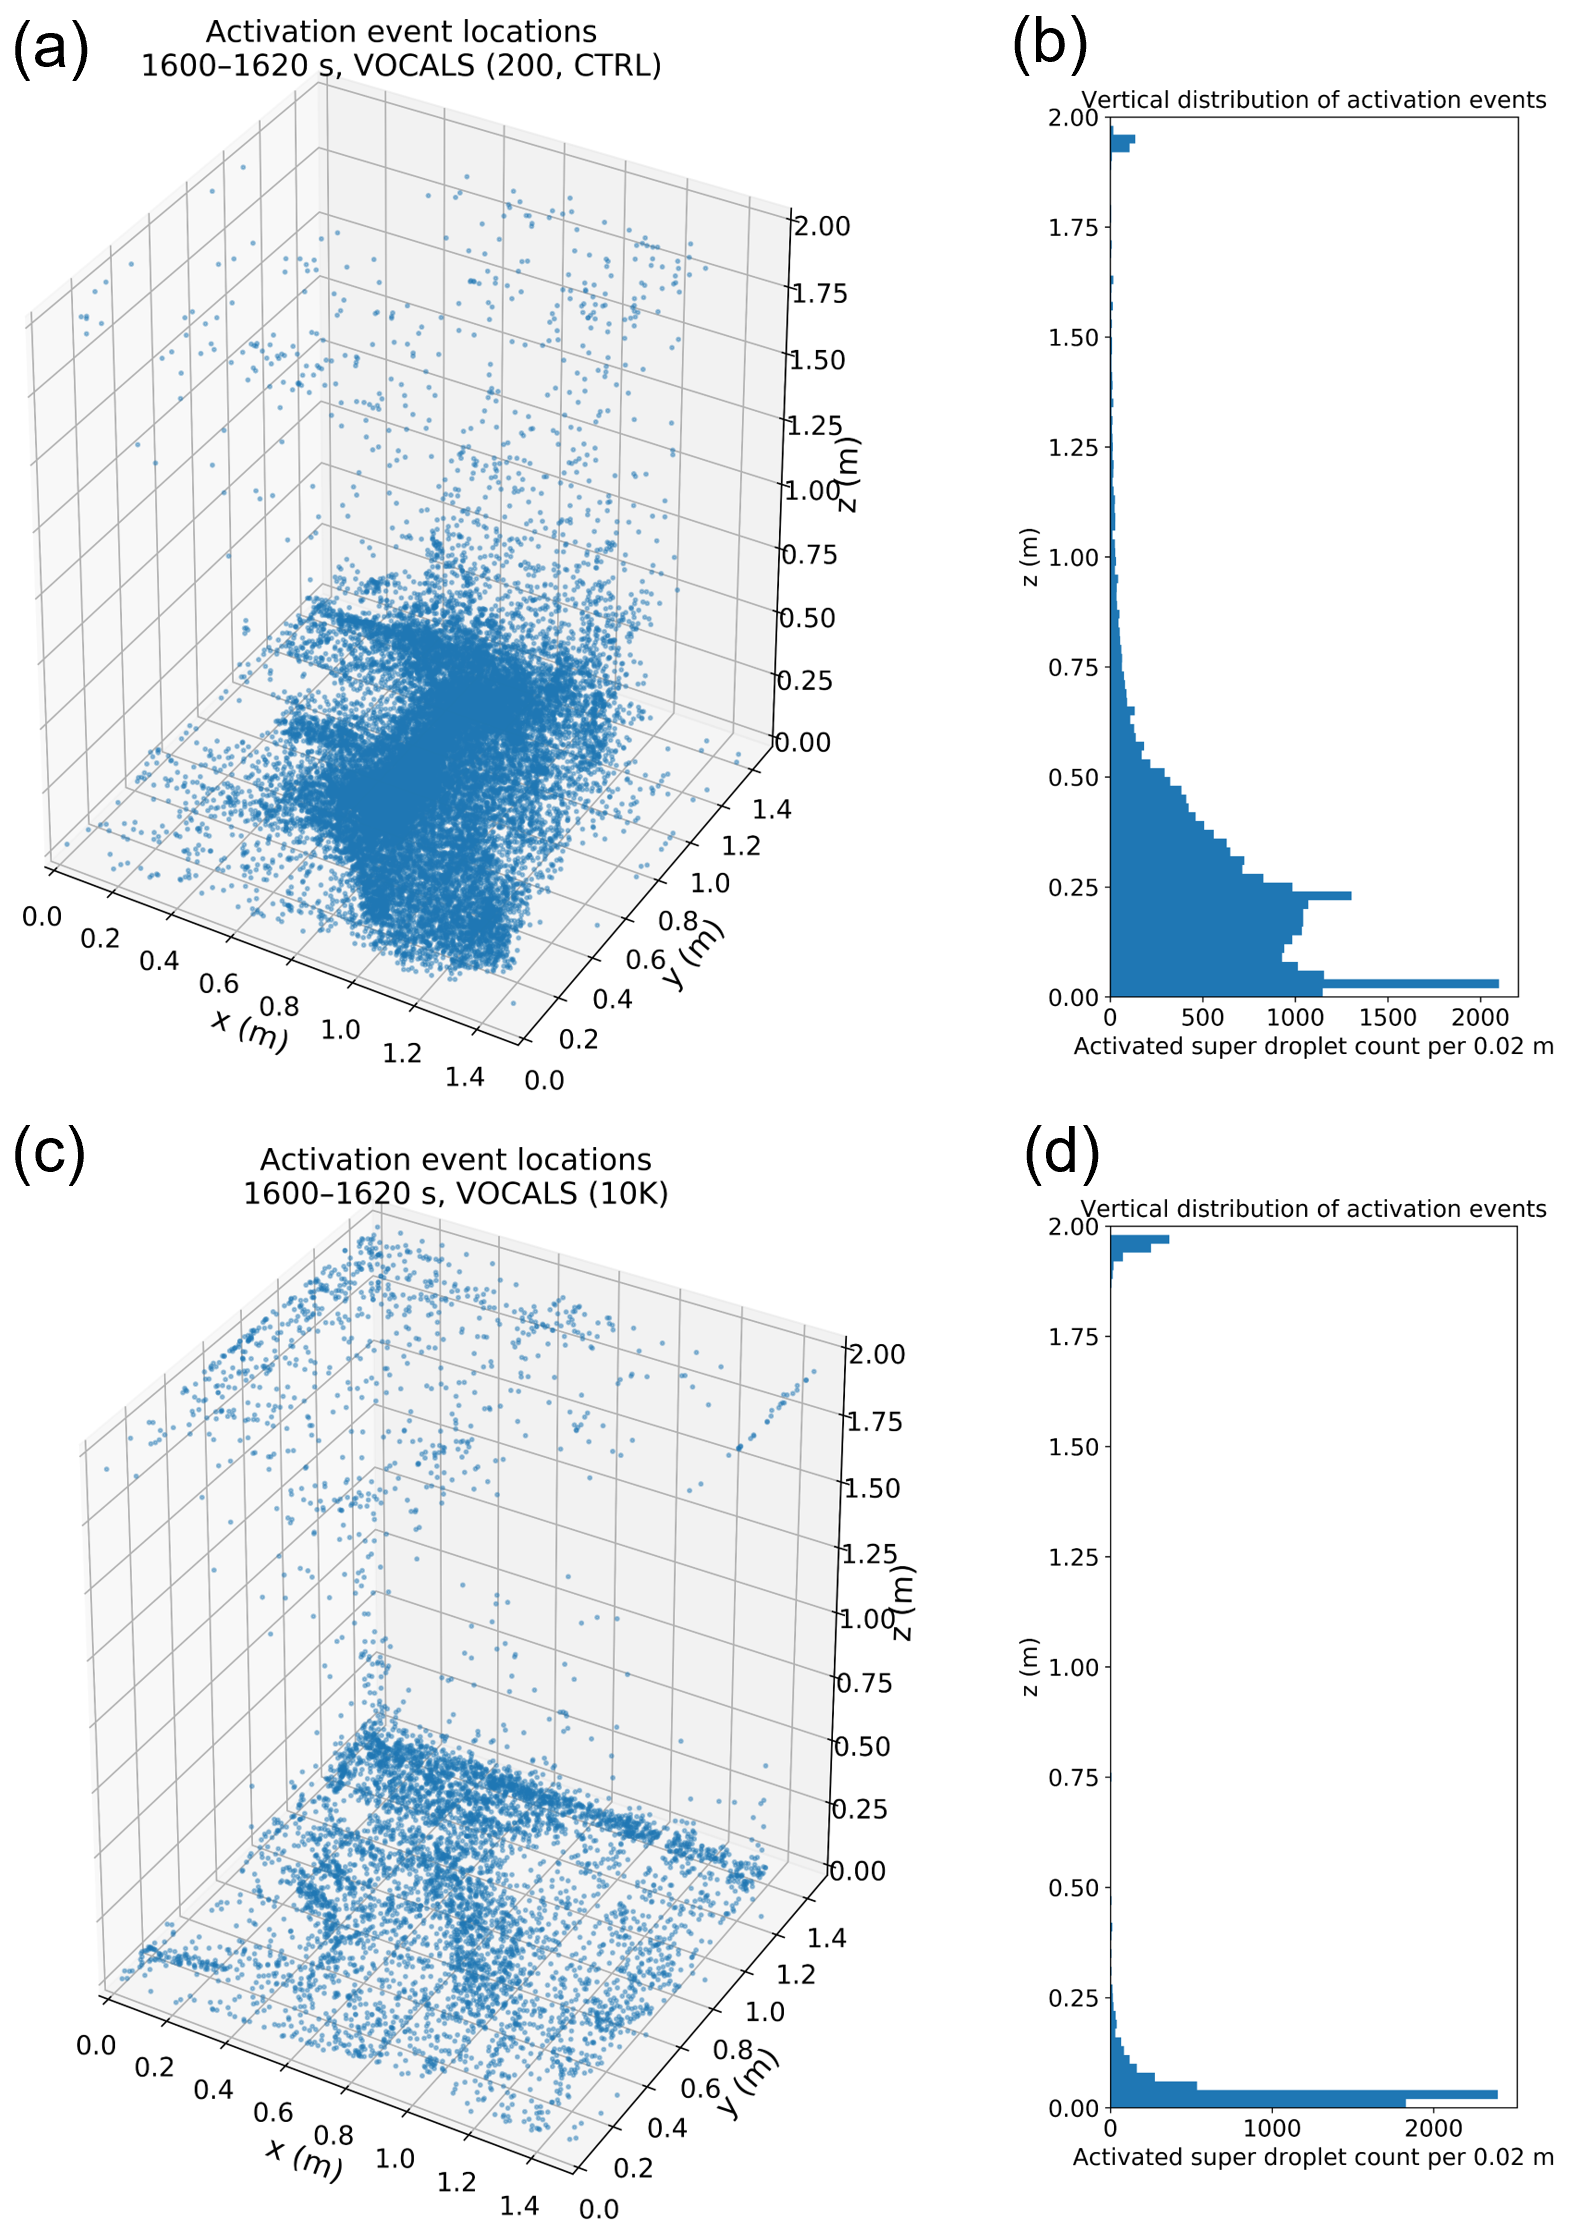
Figure 15Spatial distribution and vertical frequency of activation events between 1600 and 1620 s. Panels (a), (c) show three-dimensional locations of the first activation events for 50 000 SDs that were randomly selected from the population of unactivated SDs located between 0 and 0.2 m at 1600 s for VOCALS (200, CTRL) and VOCALS (10 K) cases, respectively. Panels (b), (d) show the corresponding vertical distributions of activation events, expressed as the number of activated super droplets per 0.02 m height bin.
These results collectively suggest that, under high aerosol loading, droplet activation becomes increasingly independent of vertical motion due to limited thermodynamic potential for nucleation. These Lagrangian findings reinforce the τm−τp perspective. Under polluted conditions (Da≫1), intensified vapor competition rapidly depletes available water vapor, leading to early saturation of condensational growth at lower heights. This process not only reduces the overall magnitude of droplet growth and activation fraction, as shown in Figs. 12 and 14, but also weakens the dependence of these microphysical processes on vertical transport, as quantified by normalized vertical displacement. As a result, the qc structure becomes increasingly uniform in the vertical. This highlights that the homogenization of cloud condensate in the vertical direction under polluted conditions might be primarily driven by microphysical timescale constraints
In comparing VOCALS and Seoul cases for the same aerosol concentrations, dr is greater for Seoul cases, whereas the activation fraction is higher for VOCALS cases (Figs. 12 and 14). This difference arises because VOCALS aerosols contain more large particles that readily activate, resulting in higher Nc and activation fractions. In contrast, Seoul aerosols include more small particles that activate less efficiently, leading to fewer activated droplets. Consequently, these fewer droplets face reduced competition for water vapor, promoting greater individual growth compared to VOCALS.
From a Lagrangian perspective, we interpret our diagnostics as follows. At a given time, the super droplets within the lowest 0.2 m can be viewed as originating from a common near-bottom air mass. Turbulent motions then disperse these droplets along trajectories that differ in their net ascent and in their residence time within the near-bottom supersaturation source region. These differences produce distinct time-integrated supersaturation exposures, and therefore distinct condensational growth histories, even for droplets that start from the same near-bottom layer. In the clean (low-CCN) cases, supersaturation fluctuations are relatively large, so growth becomes strongly history dependent and the normalized radius increment, dr, varies substantially across trajectories. In the polluted (high-CCN) cases, supersaturation fluctuations are damped, so droplets experience more similar effective supersaturation histories and dr becomes more uniform. In our simulations, this transition is accompanied by a weakening of the vertical gradient in qc, consistent with reduced contrasts between strongly ascending and weakly ascending trajectories as CCN increases.
This study investigated how varying aerosol concentrations influence cloud microphysical evolution and vertical structure using idealized simulations of a turbulent moist convection cloud chamber. The simulations employed a large-eddy simulation (LES) coupled with a Lagrangian super droplet method (SDM), configured to represent turbulent convection-mixing processes in a laboratory-scale chamber currently under construction at the Korea Institute of Science and Technology (KIST).
Differences emerged in the vertical distribution of cloud water mixing ratio under varying aerosol conditions. At low aerosol concentrations, droplets experienced sustained condensational growth during ascent, producing significant vertical gradients in cloud water mixing ratio due to prolonged exposure to supersaturation (S). Conversely, at high aerosol concentrations, the short phase relaxation time induces a low quasi-steady supersaturation throughout the chamber, so condensational growth changes little with height and the cloud water mixing ratio profile becomes nearly vertically uniform. The Damköhler number (), defined as the ratio of turbulent mixing timescales (τm) to microphysical timescales (τp), provides a useful framework for interpreting this transition: under clean conditions, Da is of order unity, so condensation and vertical mixing act on comparable timescales, allowing vertical transport to imprint supersaturation variability on droplet growth. In contrast, polluted conditions correspond to large Da (≫1), indicating that condensation depletes supersaturation more rapidly than mixing can regenerate it. Lagrangian trajectory analyses further show that in clean cases, droplet growth and activation are maximized for trajectories with moderate upward displacement (normalized vertical displacement) that remain long within the supersaturation source region near the chamber base. In contrast, in polluted cases, the dependence of growth and activation on normalized vertical displacement is much weaker, consistent with the more uniform and strongly damped supersaturation field. However, at elevated aerosol concentrations, this correlation weakened significantly due to intensified vapor competition, limiting S variability. Thus, under polluted conditions, droplet activation became increasingly independent of vertical motion, reinforcing the vertical homogenization of cloud water mixing ratio. These simulation results offer several practical implications for cloud chamber experiments. First, the identified transition in cloud water mixing ratio vertical structure, governed by the relative timescales of condensation and mixing, provides a robust diagnostic framework to interpret experimental observations. Second, specific microphysical signatures, particularly vertical uniformity in cloud water mixing ratio under polluted conditions, serve as clear observational markers to diagnose aerosol effects within controlled laboratory settings. Accordingly, the design and interpretation of future chamber experiments may benefit from considering these mechanisms, as they could fundamentally influence how droplet activation and condensational growth manifest under varying aerosol conditions.
Moreover, this study enhances process-level understanding of cloud microphysics by elucidating how aerosol-induced changes in S variability and droplet activation mechanisms directly impact the vertical distribution of cloud condensate. Although the S generation mechanism in the chamber differs fundamentally from atmospheric clouds, being driven by the mixing of air parcels originating from both lower and upper boundaries with contrasting thermodynamic properties rather than adiabatic cooling, the interplay between microphysical timescales and turbulent dynamics remains broadly relevant, offering valuable insights into aerosol-cloud interactions. Importantly, this is the first study to identify the mechanisms governing the aerosol-dependent vertical distribution of cloud condensate in a laboratory convection chamber using Lagrangian super droplet tracking. This novel approach reveals how vertical motion and vapor competition jointly modulate droplet growth, offering a new process-based framework for interpreting chamber experiments and guiding cloud parameterizations.
This behavior can be summarized by a timescale perspective in which Da () compares a chamber-scale transport time, τm, to the phase relaxation time, τp. As CCN loading increases, the total droplet surface area increases, τp shortens, and supersaturation perturbations are relaxed more rapidly toward quasi-equilibrium. The resulting reduction in supersaturation variance and narrowing of growth histories is consistent with laboratory evidence from the Pi Chamber (Chandrakar et al., 2016). Our simulations extend this picture by showing, in a fully three-dimensional Lagrangian framework, how the same mechanism links supersaturation damping to both the vertical structure of qc and the sensitivity of condensational growth to vertical history for droplets originating from the same near-bottom air mass.
In atmospheric clouds, this timescale view is closely related to eddy-hopping and stochastic parcel frameworks for condensational broadening in shallow cumulus and stratocumulus. When Da is unity, droplets adjust slowly enough that differences in Lagrangian residence time within regions of enhanced supersaturation are efficiently translated into differences in condensational growth, favoring spectral broadening. When Da is large, supersaturation is homogenized more rapidly, so droplets following distinct trajectories can nevertheless experience similar effective supersaturation histories and grow by comparable amounts. This suggests that higher CCN loading can weaken the imprint of turbulent history on condensational broadening in cloud interiors, consistent with stochastic entraining parcel studies (e.g., Abade et al., 2018). This interpretation is also consistent with recent adiabatic cloud simulations based primarily on 1D turbulent-parcel modeling, complemented by 3D LES cloud simulations, showing that eddy hopping effect and the associated turbulence-driven condensational broadening are stronger under pristine conditions because a longer phase relaxation time allows larger supersaturation fluctuations for the same turbulent vertical-velocity variability, and a larger peak cloud-base supersaturation activates a broader range of CCN (Grabowski et al., 2026).
We note that the Da used here differs from the Da commonly adopted in entrainment-mixing studies at cloud edges, where Da often compares a microphysical adjustment time (frequently evaporation in subsaturated entrained air) to a small-scale turbulent mixing time across cloudy and environmental filaments. In that framework, large Da implies microphysics can act faster than mixing, promoting inhomogeneous mixing signatures. By contrast, our Da compares phase relaxation to a chamber scale transport time in a near-saturated, quasi-closed environment where condensational relaxation dominates. There, a shorter τp strengthens the negative feedback on supersaturation perturbations, so increasing CCN primarily damps supersaturation fluctuations and homogenizes condensational growth histories in the chamber interior. In atmospheric clouds, both behaviors can coexist, with CCN damping interior supersaturation variability while entrainment at cloud edges can still drive locally inhomogeneous mixing depending on humidity deficits and mixing scales.
In addition, pi-chamber studies using flux-based boundary conditions derived from Monin–Obukhov similarity theory report qualitatively similar aerosol-driven weakening of the vertical gradient of qc (Yang et al., 2023; Thomas et al., 2022; Wang et al., 2024a), supporting the robustness of our interpretation. Nevertheless, boundary conditions for laboratory convection chambers are not yet standardized and can influence near-wall supersaturation variability and activation statistics; coordinated intercomparisons of specified-state versus flux-based plate thermodynamics and lateral-wall treatments, validated against measurements, are needed.
The presented data are available from the corresponding author upon request (inyeob.la@gsis.u-hyogo.ac.jp).
The supplement related to this article is available online at https://doi.org/10.5194/acp-26-5213-2026-supplement.
IL wrote the original manuscript draft; SSY acquired funding and administered the project; IL and SK conducted the investigation; WWG and YK developed software; SSY supervised the research; IL, WWG, SK, and SSY reviewed and edited the manuscript.
The contact author has declared that none of the authors has any competing interests.
Publisher's note: Copernicus Publications remains neutral with regard to jurisdictional claims made in the text, published maps, institutional affiliations, or any other geographical representation in this paper. The authors bear the ultimate responsibility for providing appropriate place names. Views expressed in the text are those of the authors and do not necessarily reflect the views of the publisher.
This work was supported by KIST Institutional Grant 26E0111 and by the Yonsei Signature Research Cluster Program of 2024 (2024-22-0162).
This work was supported by the Korea Institute of Science and Technology (KIST) Institutional Grant 26E0111 and by the Yonsei Signature Research Cluster Program of 2024 (2024-22-0162).
This paper was edited by Annele Virtanen and reviewed by three anonymous referees.
Abade, G. C., Grabowski, W. W., and Pawlowska, H.: Broadening of cloud droplet spectra through eddy hopping: turbulent entraining parcel simulations, J. Atmos. Sci., 75, 3365–3379, https://doi.org/10.1175/JAS-D-18-0078.1, 2018.
Anderson, J. C., Thomas, S., Prabhakaran, P., Shaw, R. A., and Cantrell, W.: Effects of the large-scale circulation on temperature and water vapor distributions in the Π Chamber, Atmos. Meas. Tech., 14, 5473–5485, https://doi.org/10.5194/amt-14-5473-2021, 2021.
Arabas, S. and Shima, S. I.: Large-eddy simulations of trade wind cumuli using particle-based microphysics with monte Carlo coalescence, J. Atmos. Sci., 70, 2768–2777, https://doi.org/10.1175/JAS-D-12-0295.1, 2013.
Arabas, S., Jaruga, A., Pawlowska, H., and Grabowski, W. W.: libcloudph++ 1.0: a single-moment bulk, double-moment bulk, and particle-based warm-rain microphysics library in C++, Geosci. Model Dev., 8, 1677–1707, https://doi.org/10.5194/gmd-8-1677-2015, 2015.
Carslaw, K. S., Lee, L. A., Reddington, C. L., Pringle, K. J., Rap, A., Forster, P. M., Mann, G. W., Spracklen, D. V., Woodhouse, M. T., Regayre, L. A., and Pierce, J. R.: Large contribution of natural aerosols to uncertainty in indirect forcing, Nature, 503, 67–71, https://doi.org/10.1038/nature12674, 2013.
Chandrakar, K. K., Cantrell, W., Chang, K., Ciochetto, D., Niedermeier, D., Ovchinnikov, M., Shaw, R. A., and Yang, F.: Aerosol indirect effect from turbulence-induced broadening of cloud-droplet size distributions, P. Natl. Acad. Sci. USA, 113, 14243–14248, https://doi.org/10.1073/pnas.1612686113, 2016.
Chandrakar, K. K., Cantrell, W., and Shaw, R. A.: Influence of turbulent fluctuations on cloud droplet size dispersion and aerosol indirect effects, J. Atmos. Sci., 75, 3191–3209, https://doi.org/10.1175/JAS-D-18-0006.1, 2018.
Chandrakar, K. K., Cantrell, W., Krueger, S., Shaw, R. A., and Wunsch, S.: Supersaturation fluctuations in moist turbulent Rayleigh–Bénard convection: a two-scalar transport problem, J. Fluid Mech., 884, A19, https://doi.org/10.1017/jfm.2019.895, 2020.
Chandrakar, K. K., Morrison, H., and Witte, M.: Evolution of Droplet Size Distributions During the Transition of an Ultraclean Stratocumulus Cloud System to Open Cell Structure: An LES Investigation Using Lagrangian Microphysics, Geophys. Res. Lett., 49, 1–10, https://doi.org/10.1029/2022GL100511, 2022.
Dziekan, P., Jensen, J. B., Grabowski, W. W., and Pawlowska, H.: Impact of Giant Sea Salt Aerosol Particles on Precipitation in Marine Cumuli and Stratocumuli: Lagrangian Cloud Model Simulations, J. Atmos. Sci., 78, 4127–4142, https://doi.org/10.1175/JAS-D-21-0041.1, 2021.
Grabowski, W. W.: Comparison of Eulerian bin and Lagrangian particle-based schemes in simulations of PI chamber dynamics and microphysics, J. Atmos. Sci., 77, 1151–1165, https://doi.org/10.1175/JAS-D-19-0216.1, 2020.
Grabowski, W. W. and Pawlowska, H.: Technical note: Phase space depiction of cloud condensation nuclei activation and cloud droplet diffusional growth, Atmos. Chem. Phys., 25, 5273–5285, https://doi.org/10.5194/acp-25-5273-2025, 2025.
Grabowski, W. W. and Smolarkiewicz, P. K.: Monotone finite-difference approximations to the advection-condensation problem, Mon. Weather Rev., 118, 2082–2098, https://doi.org/10.1175/1520-0493(1990)118<2082:MFDATT>2.0.CO;2, 1990.
Grabowski, W. W., Andrejczuk, M., and Wang, L. P.: Droplet growth in a bin warm-rain scheme with Twomey CCN activation, Atmos. Res., 99, 290–301, https://doi.org/10.1016/j.atmosres.2010.10.020, 2011.
Grabowski, W. W., Morrison, H., Shima, S. I., Abade, G. C., Dziekan, P., and Pawlowska, H.: Modeling of cloud microphysics: Can we do better?, B. Am. Meteorol. Soc., 100, 655–672, https://doi.org/10.1175/BAMS-D-18-0005.1, 2019.
Grabowski, W. W., Kim, Y., and Yum, S. S.: CCN Activation and Droplet Growth in Pi Chamber Simulations with Lagrangian Particle–Based Microphysics, J. Atmos. Sci., 81, 1201–1212, https://doi.org/10.1175/JAS-D-24-0004.1, 2024.
Grabowski, W. W., Chandrakar, K. K., and Morrison, H.: Broadening of adiabatic droplet spectra through eddy hopping: Polluted versus pristine environments, J. Atmos. Sci., https://doi.org/10.1175/JAS-D-25-0148.1, 2026.
Hansen, J. E., Kharecha, P., Sato, M., Tselioudis, G., Kelly, J., Bauer, S. E., Ruedy, R., Jeong, E., Jin, Q., Rignot, E., Velicogna, I., Schoeberl, M. R., von Schuckmann, K., Amponsem, J., Cao, J., Keskinen, A., Li, J., and Pokela, A.: Global Warming Has Accelerated: Are the United Nations and the Public Well-Informed?, Environ. Sci. Policy Sustain. Dev., 67, 6–44, https://doi.org/10.1080/00139157.2025.2434494, 2025.
Hoffmann, F. and Feingold, G.: Cloud microphysical implications for marine cloud brightening: The importance of the seeded particle size distribution, J. Atmos. Sci., 78, 3247–3262, https://doi.org/10.1175/JAS-D-21-0077.1, 2021.
Intergovernmental Panel on Climate Change (IPCC): Climate Change 2021 – The Physical Science Basis, Cambridge, United Kingdom, https://doi.org/10.1017/9781009157896, 2021.
Morrison, H., Chandrakar, K. K., Shima, S.-I., Dziekan, P., and Grabowski, W. W.: Impacts of Stochastic Coalescence Variability on Warm Rain Initiation Using Lagrangian Microphysics in Box and Large-Eddy Simulations, J. Atmos. Sci., 81, 1067–1093, https://doi.org/10.1175/jas-d-23-0132.1, 2024.
Park, M., Yum, S. S., Seo, P., Ahn, C., Kim, N., Anderson, B. E., and Thornhill, K. L.: A New CCN Number Concentration Prediction Method Based on Multiple Linear Regression and Non-Negative Matrix Factorization: 2. Application to Obtain CCN Spectra in and Around the Korean Peninsula, J. Geophys. Res.-Atmos., 128, https://doi.org/10.1029/2023JD039234, 2023a.
Park, M., Yum, S. S., Seo, P., Kim, N., and Ahn, C.: A New CCN Number Concentration Prediction Method Based on Multiple Linear Regression and Non-Negative Matrix Factorization: 1. Development, Validation, and Comparison Using the Measurement Data Over the Korean Peninsula, J. Geophys. Res.-Atmos., 128, https://doi.org/10.1029/2023JD039189, 2023b.
Prabhakaran, P., Thomas, S., Cantrell, W., Shaw, R. A., and Yang, F.: Sources of Stochasticity in the Growth of Cloud Droplets: Supersaturation Fluctuations versus Turbulent Transport, J. Atmos. Sci., 79, 3145–3162, https://doi.org/10.1175/JAS-D-22-0051.1, 2022.
Seinfeld, J. H., Bretherton, C., Carslaw, K. S., Coe, H., DeMott, P. J., Dunlea, E. J., Feingold, G., Ghan, S., Guenther, A. B., Kahn, R., Kraucunas, I., Kreidenweis, S. M., Molina, M. J., Nenes, A., Penner, J. E., Prather, K. A., Ramanathan, V., Ramaswamy, V., Rasch, P. J., Ravishankara, A. R., Rosenfeld, D., Stephens, G., and Wood, R.: Improving our fundamental understanding of the role of aerosol-cloud interactions in the climate system, P. Natl. Acad. Sci. USA, 113, 5781–5790, https://doi.org/10.1073/pnas.1514043113, 2016.
Shaw, R. A., Thomas, S., Prabhakaran, P., Cantrell, W., Ovchinnikov, M., and Yang, F.: Fast and slow microphysics regimes in a minimalist model of cloudy Rayleigh–Bénard convection, Phys. Rev. Res., 5, 1–14, https://doi.org/10.1103/PhysRevResearch.5.043018, 2023.
Shima, S., Kusano, K., Kawano, A., Sugiyama, T., and Kawahara, S.: The super-droplet method for the numerical simulation of clouds and precipitation: A particle-based and probabilistic microphysics model coupled with a non-hydrostatic model, Q. J. Roy. Meteor. Soc., 135, 1307–1320, https://doi.org/10.1002/qj.441, 2009.
Thomas, S., Ovchinnikov, M., Yang, F., van der Voort, D., Cantrell, W., Krueger, S. K., and Shaw, R. A.: Scaling of an Atmospheric Model to Simulate Turbulence and Cloud Microphysics in the Pi Chamber, J. Adv. Model. Earth Sy., 11, 1981–1994, https://doi.org/10.1029/2019MS001670, 2019.
Thomas, S., Prabhakaran, P., Yang, F., Cantrell, W. H., and Shaw, R. A.: Dimensionless parameters for cloudy Rayleigh–Bénard convection: Supersaturation, Damköhler, and Nusselt numbers, Phys. Rev. Fluids, 7, 1–15, https://doi.org/10.1103/PhysRevFluids.7.010503, 2022.
Thomas, S., Yang, F., Ovchinnikov, M., Cantrell, W., and Shaw, R. A.: Scaling of Turbulence and Microphysics in a Convection–Cloud Chamber of Varying Height, J. Adv. Model. Earth Sy., 15, https://doi.org/10.1029/2022MS003304, 2023.
Wang, A., Ovchinnikov, M., Yang, F., Cantrell, W., Yeom, J., and Shaw, R. A.: The Dual Nature of Entrainment-Mixing Signatures Revealed through Large-Eddy Simulations of a Convection-Cloud Chamber, J. Atmos. Sci., 81, 2017–2039, https://doi.org/10.1175/JAS-D-24-0043.1, 2024a.
Wang, A., Yang, X. I., and Ovchinnikov, M.: An investigation of LES wall modeling for Rayleigh–Bénard convection via interpretable and physics-aware feedforward neural networks with DNS, J. Atmos. Sci., 81, 435–458, 2024b.
Yang, F., Hoffmann, F., Shaw, R. A., Ovchinnikov, M., and Vogelmann, A. M.: An Intercomparison of Large-Eddy Simulations of a Convection Cloud Chamber Using Haze-Capable Bin and Lagrangian Cloud Microphysics Schemes, J. Adv. Model. Earth Sy., 15, 1–20, https://doi.org/10.1029/2022MS003270, 2023.
Yang, F., Sadi, H. F., Shaw, R. A., Hoffmann, F., Hou, P., Wang, A., and Ovchinnikov, M.: Microphysics regimes due to haze–cloud interactions: cloud oscillation and cloud collapse, Atmos. Chem. Phys., 25, 3785–3806, https://doi.org/10.5194/acp-25-3785-2025, 2025.