the Creative Commons Attribution 4.0 License.
the Creative Commons Attribution 4.0 License.
 | 03 Feb 2026
Aerosol organic nitrogen across the global marine boundary layer: distribution patterns and controlling factors
Ningning Sun
Xu Yu
Bo Zhang
Yilan Li
Zhe Li
Zhenlou Chen
Organic nitrogen (ON) is an important yet poorly constrained component of aerosol total nitrogen (TN), particularly over remote oceans. We quantified aerosol ON in 92 total suspended particulate samples collected across approximately 160° of latitude in the marine atmospheric boundary layer (MABL) during Chinese Antarctic and Arctic expeditions (2019–2024), using a newly developed method that simultaneously determines ON and inorganic nitrogen. A significant latitudinal gradient was observed, with significantly higher ON concentrations (expressed as N) in the Northern Hemisphere (83.3 ± 141.4 ng m−3) than in the Southern Hemisphere (15.4 ± 12.4 ng m−3). Regionally, coastal East Asia recorded the highest ON levels (164.6 ± 179.1 ng m−3) but a lower ratio (21.1 ± 7.9 %), indicating strong terrestrial and anthropogenic influence. In contrast, the Arctic Ocean had lower ON concentrations (19.1 ± 19.0 ng m−3) but the highest ratio (38.6 ± 12.4 %), suggesting dominant marine biogenic sources. The Southern Ocean showed the lowest ON concentration (12.0 ± 7.1 ng m−3) yet a relatively high ratio (27.8 ± 11.0 %), also pointing to oceanic origins. Near Antarctica, samples influenced by sea-ice air masses displayed markedly elevated ON and ratios. These increases were strongly correlated with sea ice concentration and chlorophyll a exposure, indicating enhanced biogenic emissions from sea-ice-associated ecosystems. This study offers the first direct ON measurements along a global MABL transect, revealing distinct latitudinal and regional patterns, and emphasizing the combined roles of continental inputs and marine sources. It also identifies sea-ice dynamics as a key factor influencing ON in Antarctic regions, providing crucial data for improving atmospheric and climate models.
- Article
(3334 KB) - Full-text XML
-
Supplement
(2083 KB) - BibTeX
- EndNote


Marine atmospheric boundary layer (MABL) aerosol particles contain significant amounts of organic nitrogen (ON) and inorganic nitrogen (IN), both recognized as major components of atmospheric particulate matter (Li et al., 2023). ON may account for roughly 20 %–80 % of total reactive nitrogen deposition to the surface ocean, implying a potentially large, yet uncertain, role in marine nitrogen cycling and climate (Altieri et al., 2016, 2021). ON affects climate and biogeochemistry by supplying bioavailable nitrogen, modifying cloud condensation nuclei and ice-nucleating particle populations, and contributing to aerosol light absorption. Hygroscopic ON compounds (e.g., amino acids, amines, sugars) enhance water uptake and cloud condensation nuclei (CCN) activity; some proteinaceous organics act as efficient ice nuclei (Alsante et al., 2024; Chan et al., 2005). Marine alkylamines can form salts with sulfuric acid, promoting new particle formation and growth, thereby linking ON to aerosol number and radiative forcing (Almeida et al., 2013; Brean et al., 2021). Nitrogen-containing chromophores (brown nitrogen) can dominate the absorptive properties of organic aerosol regionally and contribute substantially to global absorption by carbonaceous aerosol (Li et al., 2025).
However, ON remains poorly constrained due to analytical limitations (Baker et al., 2017). Previous studies focused on the water-soluble fraction of aerosol ON (WSON) inferred indirectly by subtracting IN from total nitrogen (TN) (ON = TN − IN), while the water-insoluble organic nitrogen (WION) fraction has been largely unquantified (Cornell, 1999; Mace et al., 2003). The subtraction approach is prone to errors and artifacts, especially when TN and IN concentrations are similar, leading to underestimation and large uncertainties in ON burdens and fluxes. A novel method developed by Yu et al. (2021) addressed these limitations. Based on thermal evolution and chemiluminescence detection, this approach measures aerosol IN and ON simultaneously, eliminating subtraction-based biases and capturing both WSON and WION.
Aerosol ON arises from diverse sources. Marine pathways include primary emissions via sea spray enriched with organic matter from the sea surface microlayer and secondary formation from marine precursors (e.g., alkylamines) reacting with acidic species (Facchini et al., 2008; Miyazaki et al., 2011). Continental pathways include long-range transport of organic emissions from fossil fuel combustion, biomass burning, soils, and vegetation (Cape et al., 2011; Jickells et al., 2013; Luo et al., 2018). Primary marine emissions inject large amounts of particulate matter annually, carrying organic carbon and nitrogen from plankton, bacteria, and surface films (Violaki et al., 2015). Observations have shown that sea spray can carry substantial ON and that WION can dominate ocean-influenced aerosol ON (Miyazaki et al., 2011).
While marine aerosol ON has been the subject of several studies, its sources in remote oceanic regions remain a matter of debate. Some studies implicate continental transport (e.g., dust, anthropogenic emissions), whereas others point to direct sea spray emissions or secondary formation from marine-derived alkylamines (Altieri et al., 2016; Lesworth et al., 2010; Zamora et al., 2011). Correlations between ON and ocean biological proxies (e.g., chlorophyll a) suggest in situ marine production, particularly during phytoplankton blooms (Altieri et al., 2016; Dall'Osto et al., 2019). Yet open-ocean and polar regions, where sea ice variability can strongly modulate primary productivity and thus potentially influence ON emissions, remain sparsely observed, limiting constraints on potential sea ice linked controls on ON, especially for high latitudes (Altieri et al., 2016; Matsumoto et al., 2022). Around Antarctica in particular, the paucity of direct ON measurements – especially of WION – limits understanding of ON sources, seasonality, and impacts on high-latitude atmospheric chemistry.
To address these gaps, we measured aerosol ON and IN using samples collected during four Chinese Arctic and Antarctic research expedition campaigns, spanning ∼ 160° of latitude from the Arctic to Antarctica. The dataset, determined by the newly developed analyzer by Yu et al. (2021), enables evaluation of hemispheric and regional patterns, assessment of controlling factors (e.g., continental influence, marine biological activity), and explicit investigation of sea-ice–associated processes near Antarctica. The results provide observational constraints that can be used to refine the representation of nitrogen cycling and atmosphere–ocean interactions in climate and atmospheric chemistry models.
2.1 Sample Collection
A total of 92 total suspended particulate (TSP) samples were collected during three Chinese Antarctic research expeditions and one Arctic expedition aboard the icebreaker R/V Xuelong. Sampling spanned a latitudinal range of approximately 160° (86° N to 75° S), encompassing polar and mid-latitude marine regions. The Antarctic samplings were conducted in October to November in 2019 (SP2019, 14 samples), November 2021 to March 2022 (SP2021, 23 samples), and October 2023 to April 2024 (SP2023, 15 samples), while the Arctic campaign occurred in July to September in 2021 (40 samples).
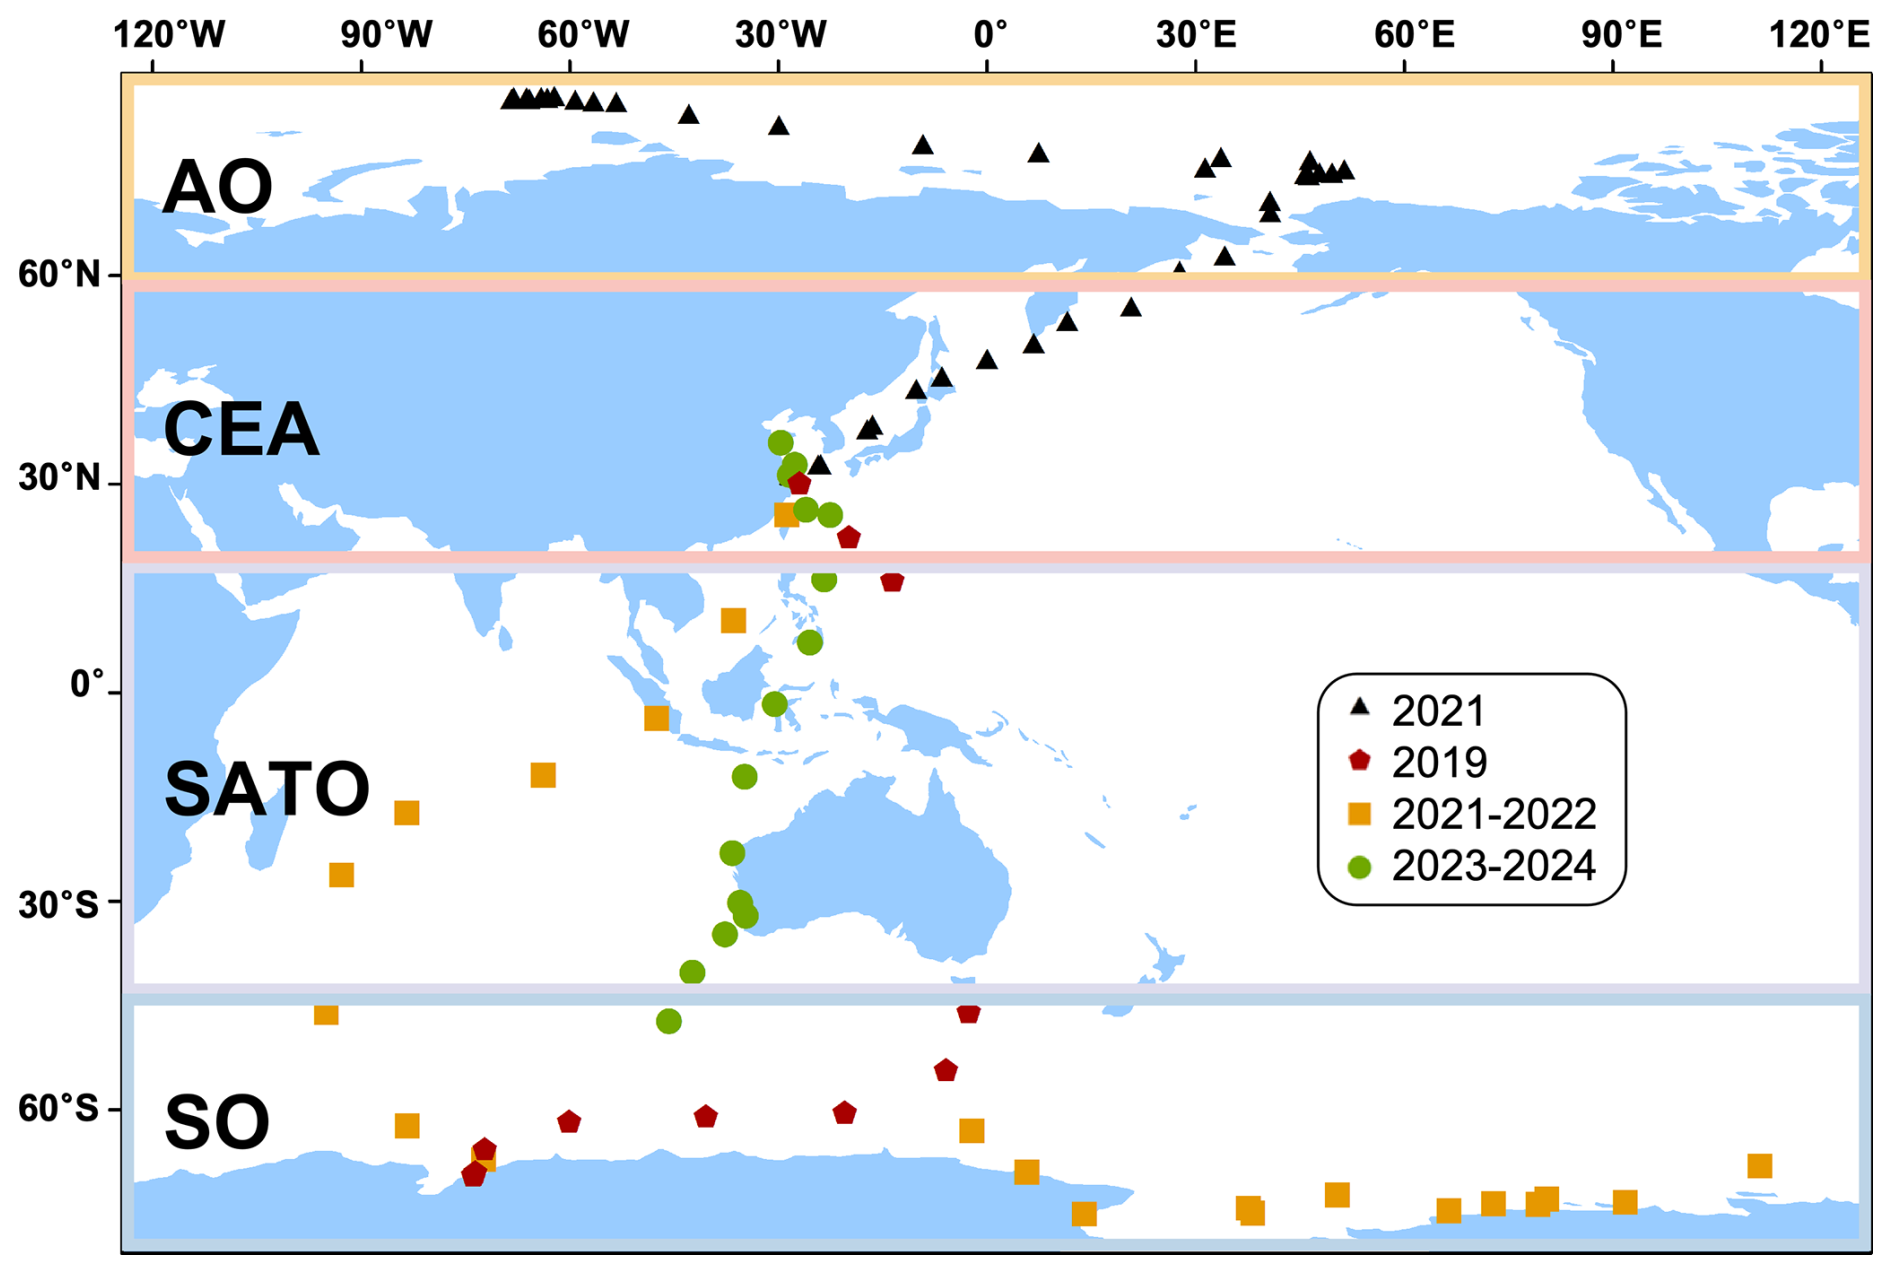
Figure 1Total suspended particulate (TSP) aerosol sampling locations along the cruises path from Shanghai, China to Antarctica and Arctic. Note that each sampling location corresponds to the average geographic position along its respective cruise track.
During the Antarctic campaigns, aerosols were collected using a high-volume air sampler (HVAS, TISCH Environmental, USA; flow rate: 1.2 m3 min−1) equipped with pre-baked (500 °C, 24 h) Whatman quartz filters (20.3 cm × 25.4 cm; Whatman Ltd., UK). For Arctic sampling, a DIGITEL DHA-80 sampler (flow rate: 500 L min−1) with 14.2 cm diameter Whatman quartz filters was employed. Each sample represented a 48 h integrated collection period, corresponding to 2–4° latitude traversed during ship transits. To minimize contamination from ship emissions, a wind sector controller restricted sampling to air masses within 120° of the ship's heading. Filters were handled using nitrile gloves and masks to avoid potential contamination. Post-sampling, filters were folded with the collection surface inward, wrapped in pre-cleaned aluminum foil, sealed in polyethylene bags, labeled with sampling time and location, and stored at −20 °C. Detailed protocols followed established methodologies (Shi et al., 2021). Following expeditions, samples were transported to the laboratory under frozen conditions and maintained at −20 °C until analysis. The sampling locations for the Antarctic and Arctic campaigns are illustrated in Fig. 1.
2.2 Chemistry Analysis for major ions, EC and OC
Major ions were quantified through ion chromatographic analysis of water extracts of the aerosol samples. The extraction of filters in the laboratory followed protocols comparable to those described in the previous study (Shi et al., 2021). Prior to measurement, three-quarters of each filter was sectioned into small pieces using acid-cleaned Teflon-coated scissors and transferred into high-purity Milli-Q water (18.2 MΩ). The suspensions were subjected to ultrasonic treatment for 30 min, followed by continuous shaking at 120 rpm for 12 h to ensure thorough extraction of water-soluble components. The extracts were subsequently filtered through 0.22 µm polytetrafluoroethylene (PTFE) membranes prior to ion analysis. The concentrations of the main ions (, , Na+, , K+, and Ca2+) in the sample were determined by an ion chromatograph (AQ1100, RFIC, equipped with a CS12 column (2 mm × 250 mm) for cation analysis, AS11 column (2 mm × 250 mm) for anion analysis, Thermo Scientific, USA), and the eluents of cation and anion were 18.00 mM methylsulfonic acid (MSA) and potassium hydroxide (KOH), respectively. During sample analysis, the relative deviation of repeated assays (n = 5) of all ions is usually less than 5 %. We used the following formula to calculate non-sea salt (), non-sea salt Ca2+ (nssCa2+) and non-sea salt K+ (nssK+):
where 0.252, 0.038, and 0.037 in the above expressions are the ratios of (Quinby-Hunt and Turehian, 1983), Ca2+/Na+ (Anonymous, 1997), and K+/Na+ (Keene et al., 1986) in the sea water, respectively.
OC and EC concentrations were determined using a Thermal/Optical Carbon Analyzer (DRI, Model 2001, Atmoslytic Inc., USA) following the IMPROVE protocol as implemented by Wu et al. (2024). OC and EC measurements were conducted only for aerosol filters collected during the 2021 Arctic and 2019 Antarctic cruises.
2.3 ON measurement
Aerosol ON and IN were simultaneously measured using the recently developed Aerosol Nitrogen Analyzer system, which enables sensitive quantification directly from filter samples without pretreatment. Detailed descriptions of the method are provided in Yu et al. (2021). Briefly, the method detection limit is 96 ng N. Because the detection limit scales inversely with the analyzed filter area, it can be readily lowered by analyzing a larger aliquot. In this study, 4–6 cm2 of filter material was typically analyzed for each sample, yielding a proportionally lower effective detection limit and ensuring stable and reliable quantification for low-concentration marine aerosol samples. Compared with traditional IC-based approaches, this analyzer provides a clear advantage by determining IN and ON simultaneously on the same filter aliquot, thereby avoiding the subtraction-based “difference method” (ON = TN − IN) and the associated uncertainty propagation when TN and IN are similar in magnitude.
The analyzer integrates a thermal aerosol carbon analyzer and a chemiluminescence NOx analyzer. Aerosol samples collected on quartz fiber filters were thermally evolved under a programmed 6-step temperature protocol (150, 180, 300, 400, 500, and 800 °C) in a 1 % O2/99 % He carrier gas. The evolved materials were catalytically oxidized to CO2 and nitrogen oxides (NOy), with the C signal monitored via methanator-FID detection and the N signal recorded through chemiluminescence after converting NOy to NO. The C signal assists in differentiating IN and ON components, as ON aerosols produce both C and N signals while the IN fraction only yields a N signal. The programmed thermal evolution facilitates separation of aerosol IN and ON due to their distinct thermal characteristics. Specifically, IN and ON discrimination is achieved by jointly interpreting the C and N thermograms: ON is identified by co-evolving C and N signals across the temperature steps, whereas IN is characterized by N-only evolution without a corresponding C signal. The separation of overlapping thermal features and the subsequent quantification of IN and ON were achieved through multivariate curve resolution (MCR) of the C and N thermograms, implemented using the USEPA positive matrix factorization (PMF) model (version 5.0).
2.4 Backward Trajectory Analysis
To study air mass origins, air mass backward trajectories have been calculated using the Hybrid Single-Particle Lagrangian Integrated Trajectories (HYSPLIT) model with meteorological fields from the National Oceanic and Atmospheric Administration (NOAA) air resources laboratory GDAS database. 5 d backward trajectories were calculated in order to reveal the history of the air masses arriving at the sampling site (Stein et al., 2015). Each trajectory originated at the vessel's real-time position with an arrival height of 20 m, capturing boundary layer transport while minimizing local ship influence. Given that the ship was continuously moving and each sample integrates air masses over approximately 2–4° of latitude, we applied a nested strategy to account for spatiotemporal variability. For the initial characterization of the entire dataset, a representative sampling location was defined for each sample using the average latitude and longitude of its start and end positions, with backward trajectories simulated at 6 h intervals anchored to this midpoint to identify dominant air–mass categories (Fig. 3). In Antarctica, to precisely investigate the influence of sea ice on ON in the Southern Ocean and Antarctic marginal regions (Sect. 4.2), a targeted high-resolution analysis was performed on this subset of samples. For each Antarctic sample, the actual cruise track was equally divided into 48 points corresponding to the hourly intervals of the 48 h sampling period, and a 120 h backward trajectory was calculated for each of these 48 coordinates (Fig. S3a and b in the Supplement).
To determine whether the backward trajectories of the MABL samples were mainly influenced by the open ocean, sea-ice-covered regions, or the continental area, we calculated the time-weighted residence-time ratios of air masses over sea ice (RS), open ocean (RO), and the continental area (RC) using the following equation:
where Ntotal denotes the total number of trajectory endpoints; NS, NO, and NC represent the numbers of endpoints located over sea ice, the open ocean, and the Antarctic continent, respectively. ti is the backward-trajectory time (in hours), and is a time-weighting factor (Zhou et al., 2021). This factor accounts for air–mass dispersion during transport and aerosol removal by particle deposition; thus, areas with longer backward trajectory times exert a weaker influence on the sampling point location compared to nearby areas. Accordingly, higher values of RS, RO and RC indicate greater influences from sea ice, the open ocean, and the Antarctic ice sheet, respectively.
2.5 Potential Source Contribution Function (PSCF) analysis
Potential Source Contribution Function (PSCF) analysis was implemented to identify source regions of ON observed during the sampling period (Ashbaugh et al., 1985). A higher PSCF value indicates a greater potential source contribution to the receptor site. In our study, the PSCF domain was established within a grid cell encompassing all backward trajectories. The cruises were discretized into 1° latitude × 1° longitude grid cells. The PSCF value for cell ij was calculated as:
where, nij = total trajectory endpoints within cell ij; mij = subset of endpoints associated with aerosol component concentrations exceeding the 75th percentile of cruise measurements. To mitigate uncertainty in cells with sparse trajectory density, a latitude-dependent weighting function (W) was applied:
where nij is the number of trajectories passing for each cell in the study period and N1 = 60 × cos(latitude), and N2 = 300 × cos(latitude). The cosine factor is used to account for the changing grid cell size with varying latitude.
2.6 Air–mass exposure to chlorophyll a
The Air–mass Exposure to Chlorophyll a (Chl a) index (AEC) serves as a quantitative metric to assess the influence of marine biogenic emissions on a target region through air mass transport (Blazina et al., 2017; Choi et al., 2019). This approach is grounded in the well-established correlation between ocean surface phytoplankton biomass and marine biogenic emissions, particularly dimethyl sulfide (DMS), where Chl a concentration acts as a robust proxy for phytoplankton abundance (Siegel et al., 2013). The AEC index estimates the integrated exposure of an air mass to oceanic DMS source regions along its trajectory by accounting for both spatial distribution of Chl a and atmospheric vertical mixing dynamics (Zhou et al., 2023).
For each trajectory point, Chl a concentrations (Chlai) were obtained from satellite remote sensing products (Aqua-MODIS, OCI algorithm; 8 d composite, 4 km × 4 km resolution; https://oceancolor.gsfc.nasa.gov/l3/, last access: 31 October 2025) within a 20 km radius to reduce the influence of missing/cloud-contaminated pixels and pixel-scale noise, while remaining small enough to preserve local marine biological variability relevant to each trajectory point. The 20 km radius approach has been widely adopted in previous studies to mitigate the uncertainty of trajectory endpoints and ensure robust matching with satellite data coverage in previous research (Park et al., 2018; Zhou et al., 2021, 2023). Trajectory endpoints over Antarctica, sea-ice-covered areas, or at pressures < 850 hPa were assigned Chl a = 0 because air masses at these altitudes are generally decoupled from local ocean surface biological activity (Zhou et al., 2023). Points without valid Chl a data were excluded. The AEC for a single trajectory was computed as:
where ti denotes time backward along the trajectory (hours), and n is the total number of valid trajectory points. The time points when the air mass passed over the continent or regions covered by sea ice were assigned a zero chlorophyll value. To ensure robustness, trajectories with n < 90 (75 % of 120 h data points at hourly resolution) were discarded. For each sample, the final AEC value was derived from the arithmetic mean of all valid trajectories during the sampling period (Yan et al., 2024).
2.7 Sea ice concentration
In this study, remote sensing data are utilized to illustrate the spatiotemporal distribution of sea ice concentrations (SICs) in the Southern Ocean. For regional-scale visualization of sea-ice extent (SIE) and SIC variability, we used the Sea Ice Index (Version 3) distributed by the National Snow and Ice Data Center (NSIDC) (Fetterer et al., 2017), which is derived from passive-microwave observations from DMSP SSM/I and SSMIS sensors (Cavalieri et al., 1997).
Sea-ice concentrations used here are derived from daily gridded passive-microwave SIC products, which provide all-weather coverage and are widely used for polar sea-ice monitoring. The SIC of each sample is calculated using the following formula:
where SICi represents the average sea ice density at the endpoint of the specified track. Ns represents the total number of trajectory endpoints located on the sea ice area. For each trajectory endpoint, the SIC value was extracted by collocating the endpoint latitude/longitude and the corresponding day with the daily SIC grid; the SICi for each sample was then calculated as the mean SIC across all sea-ice-covered endpoints (Ns). Sea ice concentration data are from the AMSR2 dataset (Version 5.4. University of Bremen, Germany. Index of /amsr2/asi_daygrid_swath/s3125).
Table 1Measured concentrations of WSON from published reports in the marine atmospheric boundary layer.
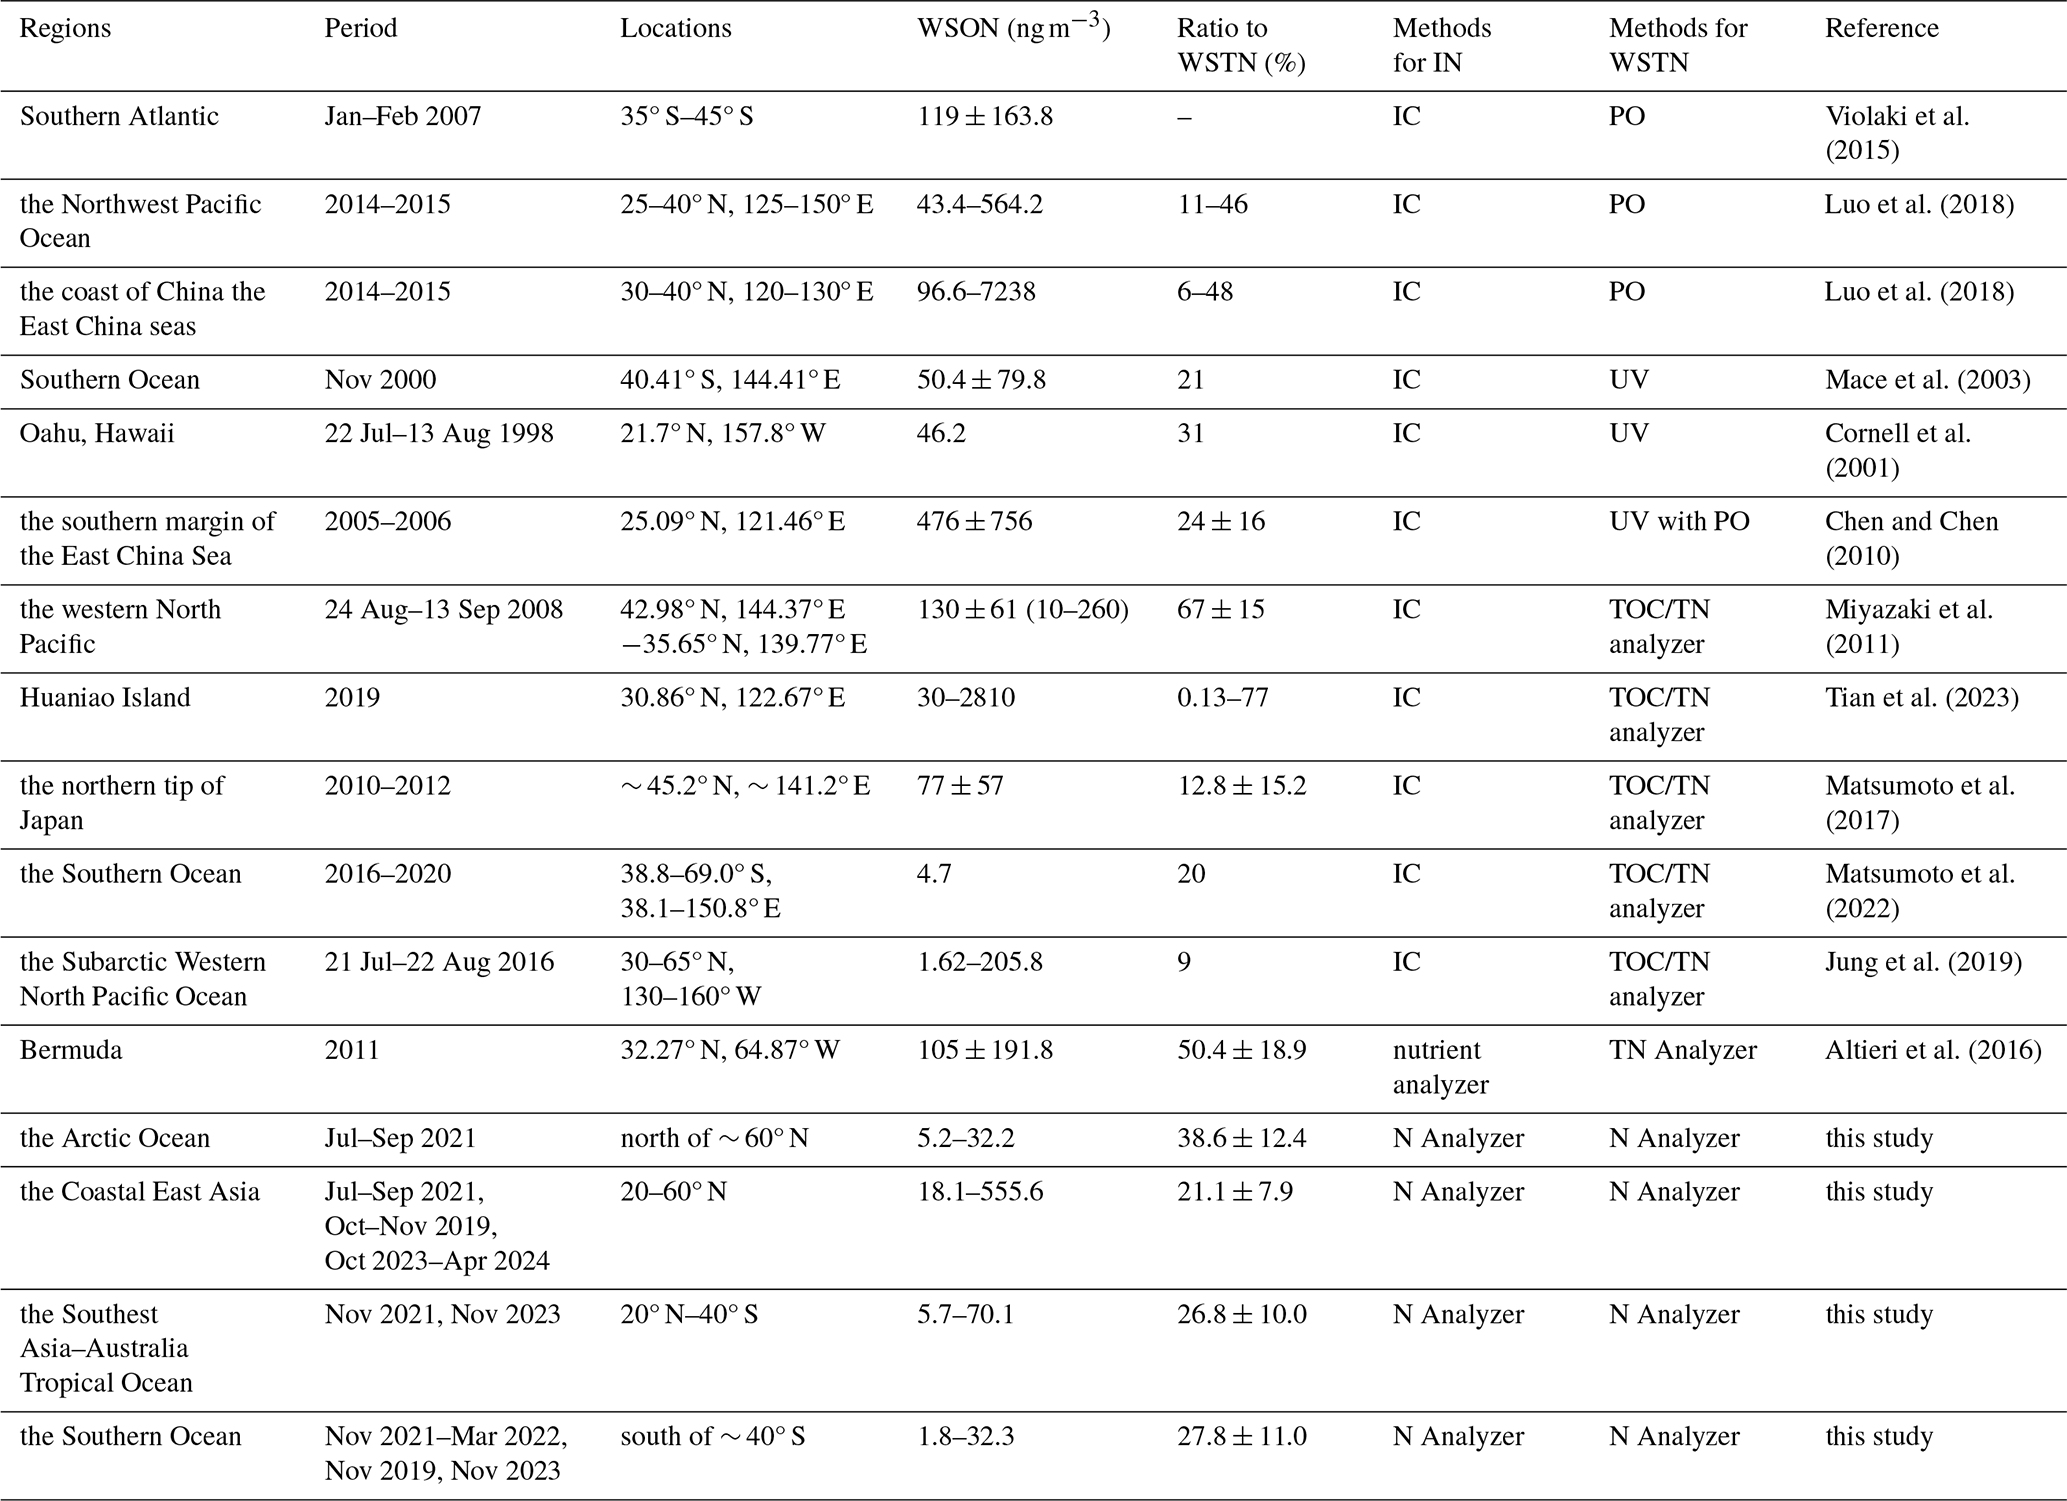
PO: the persulfate oxidation (PO) method. UV: ultraviolet photo-oxidation. TN analyzer: a total organic carbon (TOC) analyzer with a TN unit. Nutrient analyzer: automated nutrient analyzer and standard colorimetric method.
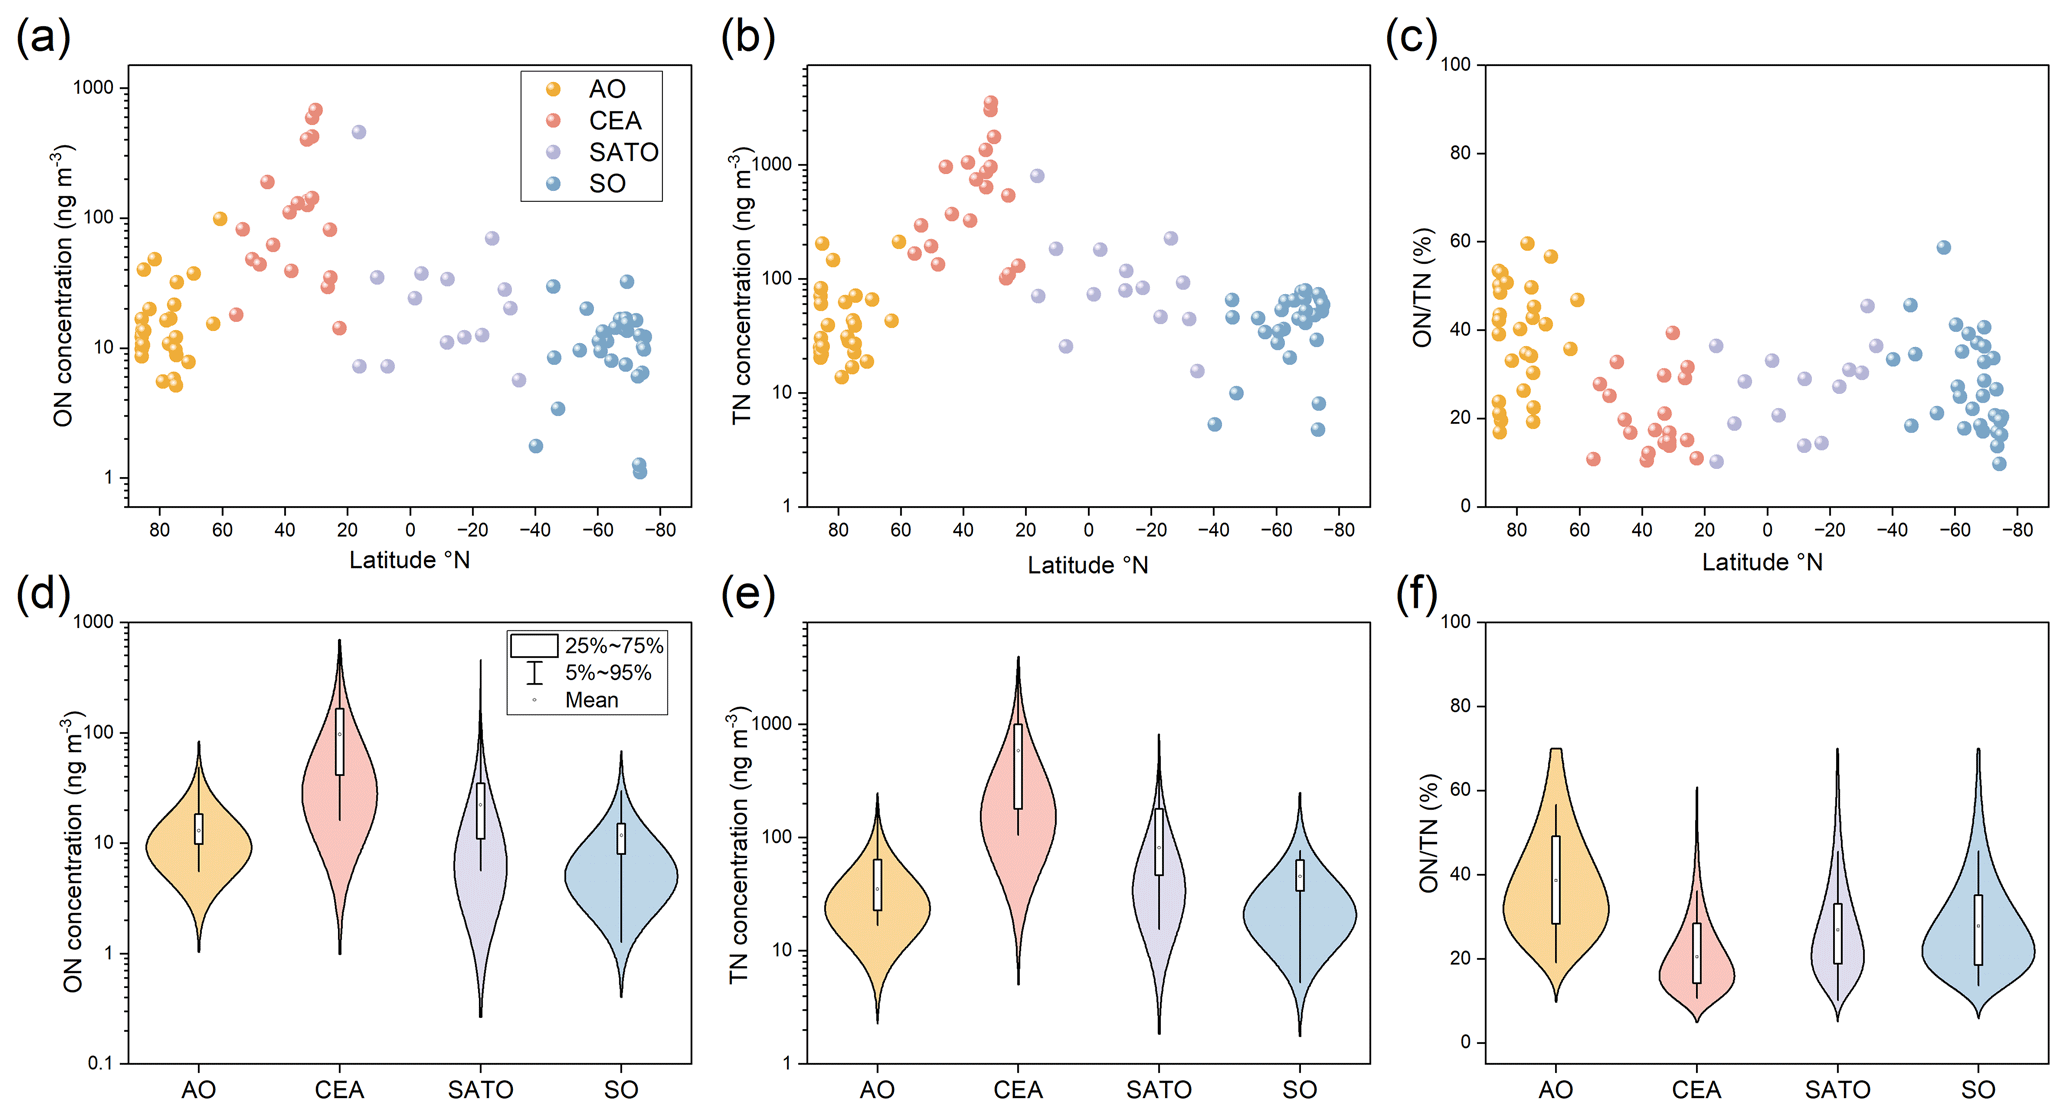
Figure 2Latitudinal distributions of ON concentration, TN concentration and ratio (a–c), and the statistics (d–f) over the the Arctic Ocean region (AO), the Coastal East Asia region (CEA), the Southeast Asia-Australia Tropical Ocean region (SATO) and the Southern Ocean region (SO), respectively.
Atmospheric ON concentrations (expressed as N, the same hereafter) exhibited significant hemispheric differences (p < 0.001; Mann–Whitney U test; Table S1 in the Supplement), with values in the Northern Hemisphere (NH: 83.3 ± 141.4 ng m−3, N = 55) being approximately five times higher than those in the Southern Hemisphere (SH: 15.4 ± 12.4 ng m−3, N = 37). The ratios showed broadly similar magnitudes between hemispheres, with slightly higher in the NH (30.4 ± 13.6 %) compared to the SH (27.9 ± 10.6 %). Samples from three Antarctic cruises – SP2019 (mean = 19.4 ng m−3; range: 9.5–555.6 ng m−3), SP2021 (mean = 20.4 ng m−3; range: 1.3–81.3 ng m−3), and SP2023 (mean = 18.3 ng m−3; range: 1.8–457.0 ng m−3) showed no significant variation (one-way ANOVA; p > 0.2), indicating that interannual variation was rather minor. A clear latitudinal gradient in ON concentrations was observed along the Antarctic-to-Arctic transect, with peak values in the 20–40° N zone and a gradual decline toward both polar regions (Fig. 2a). Based on spatial distribution patterns, the study transect can be divided into four regions (Fig. 1): (1) the Arctic Ocean region (AO, north of ∼ 60° N); (2) the Coastal East Asia region (CEA, 20–60° N); (3) the Southeast Asia-Australia Tropical Ocean region (SATO, ∼ 20° N–40° S); and (4) the Southern Ocean region (SO, south of ∼ 40° S).
The CEA region exhibited the highest ON concentrations (mean = 164.6 ng m−3) but the lowest ratio (mean = 21.1 ± 7.9 %). In contrast, the SO region showed the lowest ON concentrations (mean = 12.0 ng m−3; range: 1.8–32.3 ng m−3) and higher ratios (mean = 27.8 ± 11.0 %). Notably, the AO region displayed the highest ratios (mean = 38.6 ± 12.4 %) despite relatively low ON concentrations (mean = 19.1 ng m−3; range: 5.2–32.2 ng m−3). The ratio in SATO region (26.8 ± 10.0 %) is similar to that of SO but with a lower ON concentration (mean = 23.4 ng m−3; range: 5.7–70.1 ng m−3), which is much lower than the CEA region, but higher than the high latitude two polar regions.
Since direct measurement data of total ON in global MABL are limited, WSON data were summarized for comparison (Table 1). Overall, the previous results are consistent with the spatial trends of ON in our study. WSON concentrations exhibit significant spatial variation, generally higher in the NH than in the SH, highlighting the substantial contribution of anthropogenic sources (Violaki et al., 2015). In addition, WSON concentrations tend to be higher closer to land, while in remote ocean areas, WSON levels are generally lower. The reported ratios of in previous studies vary significantly across different investigation sites. Moreover, in remote marine environments, the ratio is relatively high, suggesting that WSON plays a substantial role in the biogeochemical cycle of nitrogen within these remote regions. It is important to note that most previous studies over the remote ocean measured only WSON, without accounting for the WION. As a result, the ratios in this region were likely underestimated. Based on our comparison, the total ON concentration in the Southern Ocean may have been underestimated by approximately 40 %, hinting the significant contribution of the insoluble organic fraction that has been largely overlooked in earlier datasets due to measurement method limitations.
4.1 Source identification of ON
ON in the MABL primarily originates from two main source pathways: marine emissions and long-distance continental transport. Marine sources include primary ON, predominantly associated with sea-spray particles enriched in biological material from the ocean surface microlayer, and secondary ON. The latter not only derives from marine precursors such as alkylamines that react with acidic species (Altieri et al., 2016; Facchini et al., 2008), but also significantly involves the atmospheric oxidation of marine-derived biogenic volatile organic compounds (BVOCs). Specifically, isoprene and monoterpenes emitted from the ocean can react with hydroxyl (OH) or nitrate radicals (NO3) to form secondary organic nitrates (Fisher et al., 2016; Ng et al., 2017). Additionally, direct sea-to-air emissions of light alkyl nitrates produced photochemically in the surface water contribute to the MABL ON pool (Chuck et al., 2002). Continental sources involve the long-range transport of organic emissions – including combustion byproducts, soil- and vegetation-derived compounds, and biomass burning aerosols. It is important to note that these continental inputs include both ON formed directly over land and ON produced from continental precursors during transport (Duce et al., 2008; Li et al., 2025). This transport can significantly influence remote ocean regions (Cape et al., 2011; Jickells et al., 2013).
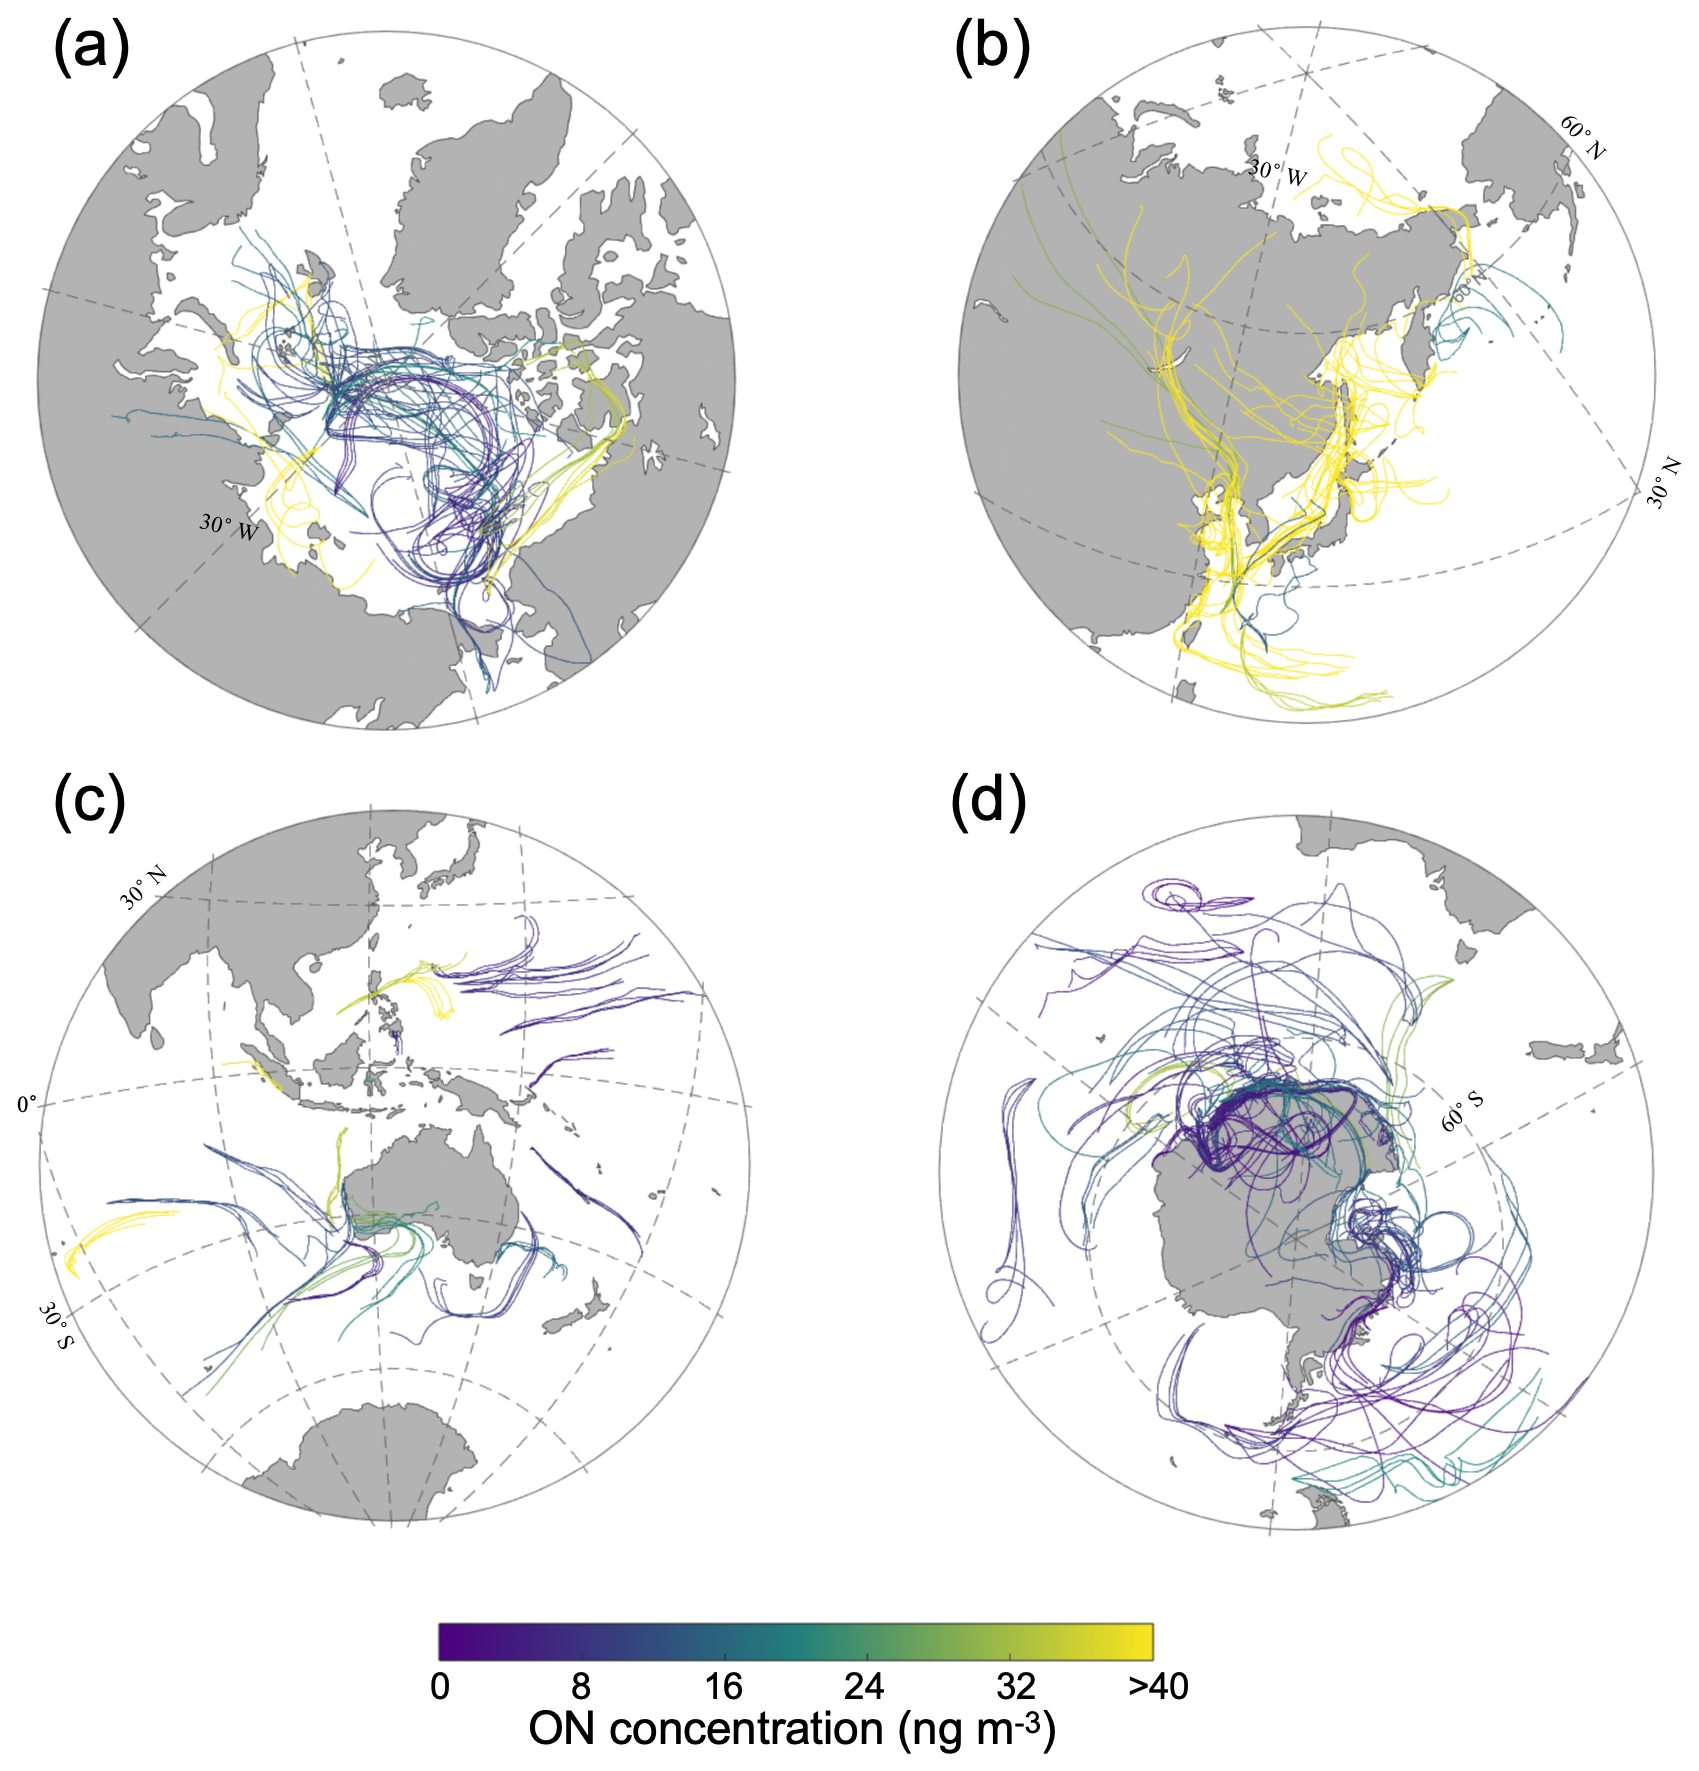
Figure 35 d air–mass backward trajectories with ON concentrations and ratios along the Chinese Arctic/Antarctic expedition voyage over the Arctic Ocean (a), the coastal East Asia (b), the Southeast Asia-Australia Tropical Ocean (c), and the Southern Ocean (d).
ON concentrations in the CEA region were the highest among all study regions, with air masses spending 22.6 % of their 5 d trajectories over continental areas (Fig. 3b). A significant correlation between ON and crustal elements such as nssCa2+ (r = 0.75, p < 0.01; Fig. 4) likely suggests the influences of continental transport of particles on the ON levels in this region (Xiao et al., 2017). A significant correlation between ON and the anthropogenic tracer EC (r = 0.81, p < 0.01; Fig. 4) indicates that fossil fuel combustion and biomass burning are important ON sources (Shubhankar and Ambade, 2016; Wu and Yu, 2016). Similarly, the robust association between ON and nssK+ (r = 0.78, p < 0.01; Fig. 4), a tracer of biomass burning, also supports contributions from agricultural and residential biomass burning (Song et al., 2018). Despite the high absolute ON concentrations, the relatively low ratio (21.1 %) likely reflects disproportionately elevated IN emissions from intensive human activities, particularly NH3 volatilization from agriculture and vehicular NOx emissions (Pavuluri et al., 2015). This interpretation aligns with emission inventories that identify the CEA as a global nitrogen pollution hotspot, where ON is co-emitted or formed from precursors that share common sources with EC and other combustion-related pollutants, originating from incomplete combustion and industrial processes (Deng et al., 2024).
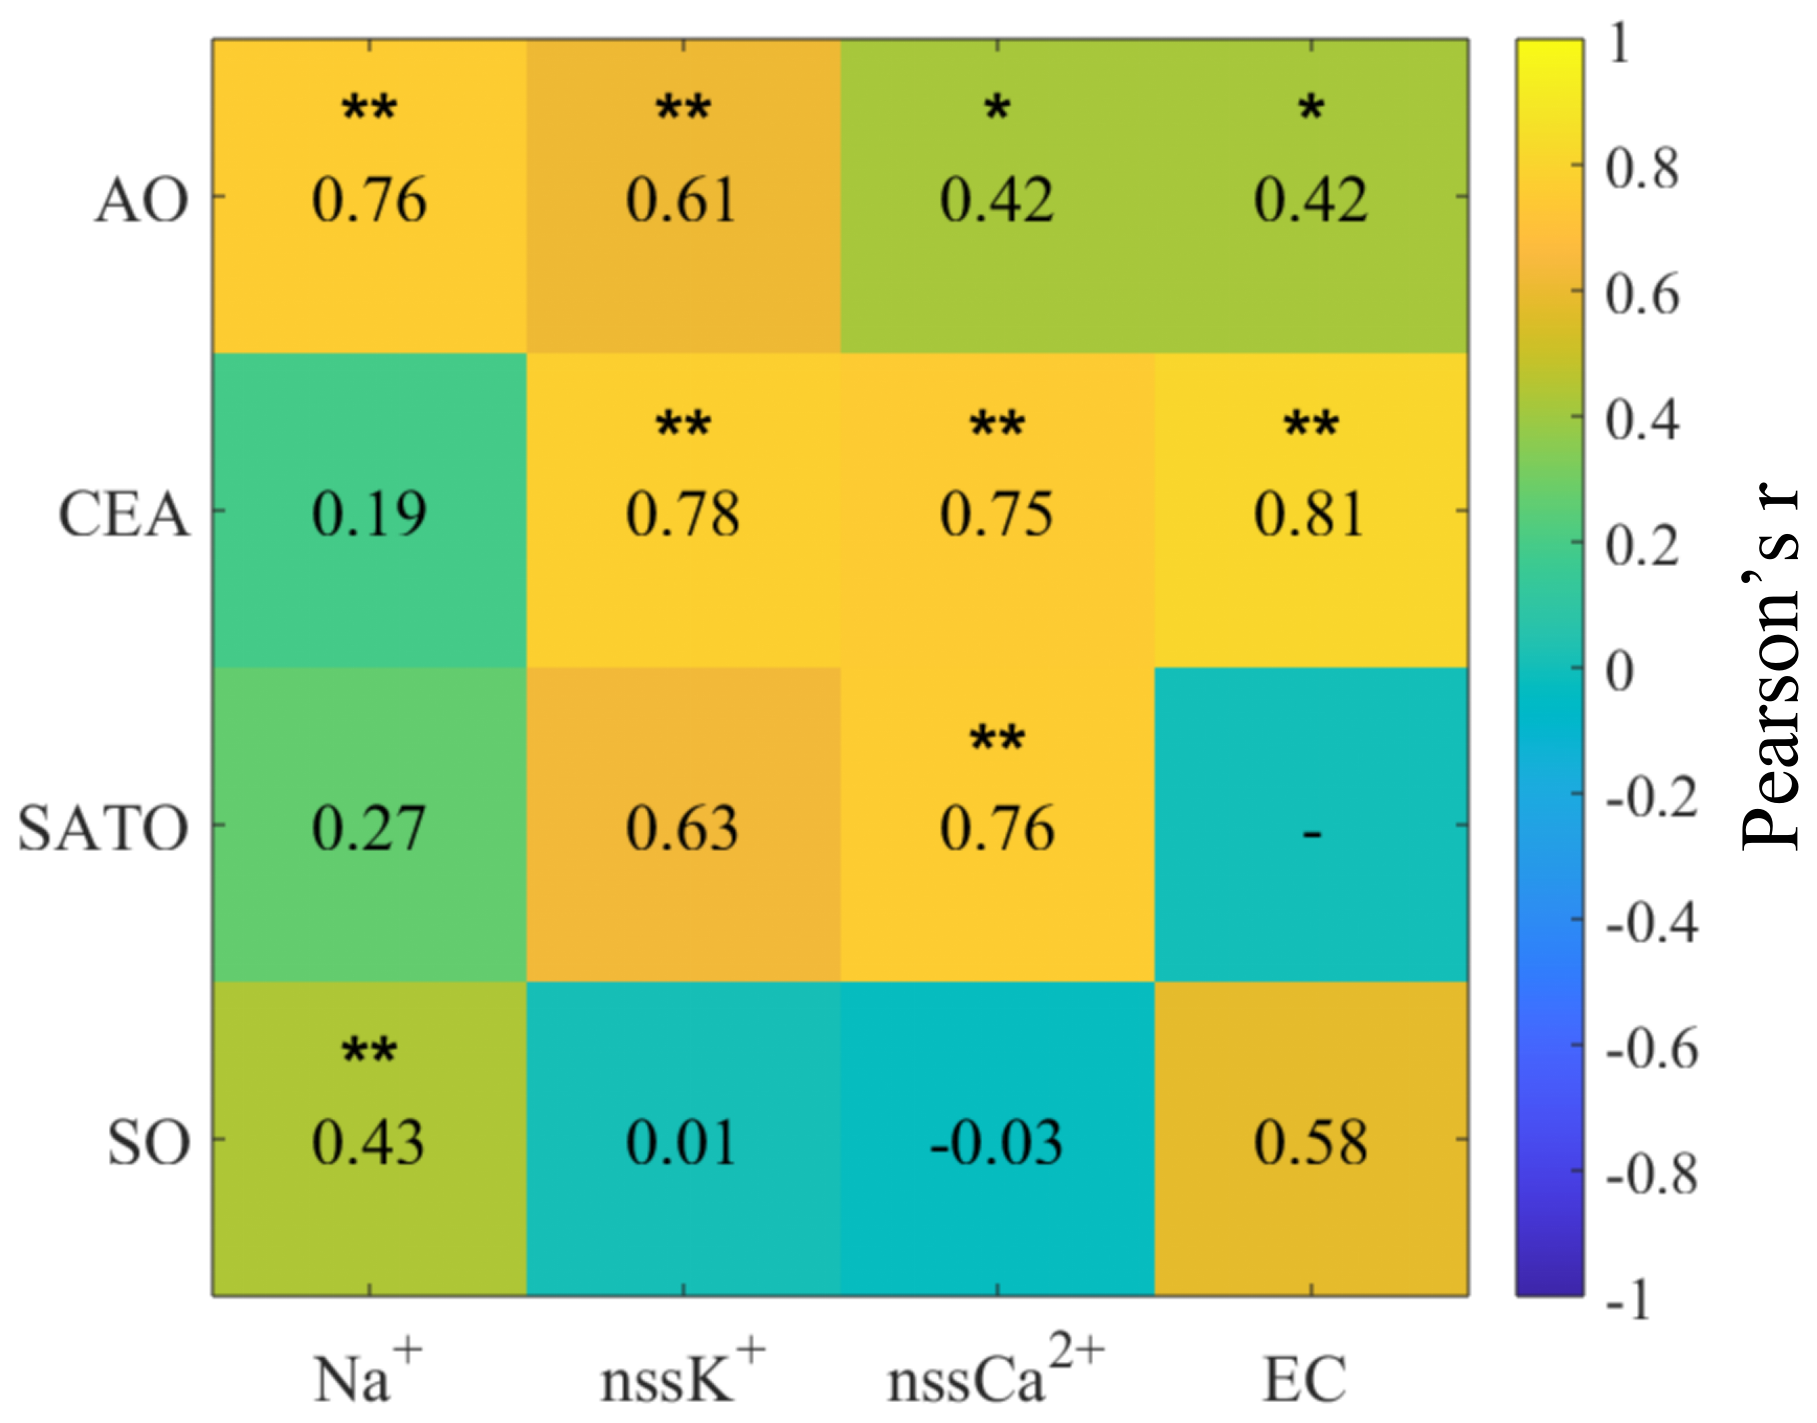
Figure 4Spatial variations in the correlation coefficient between ON and chemical species across four regions (with “” indicating p < 0.01 and “∗” indicating p < 0.05).
The SATO region exhibits intermediate level of ON concentrations (mean = 23.4 ± 18.0 ng m−3), lower than those influenced by anthropogenic activities in CEA but higher than in polar regions. In this region, ON shows a significant positive correlation with nssCa2+ (Fig. 4; r = 0.76, p < 0.01), suggesting that terrestrial mineral inputs (e.g., dust) influence ON levels, rather than purely marine sources. In addition, backward trajectory analysis showed that samples affected by continental air masses have significantly higher ON concentrations than those exposed solely to marine air (Fig. 3c), suggesting the influences of continental sources. However, ON does not exhibit significant correlations with nssK+ or with EC (p > 0.05), indicating that combustion emissions may not be the primary drivers. These findings suggest that the variability of ON in the SATO region results from a mixture of marine-terrestrial interactions, primarily modulated by episodic terrestrial mineral influence rather than continuous marine emissions. Notably, this region displays an elevated ratio (Fig. 2), primarily due to its very low IN levels – approximately 85 % lower than in the CEA region – which amplifies the relative contribution of ON within TN.
In the AO region, ON concentrations were slightly lower than in the SATO region and significantly lower than in the CEA region. In this area, ON exhibited a significant positive correlation with Na+, which suggests the sea salts inputs (Fig. 4; r = 0.43, p < 0.01), and also showed significant correlations with nssK+ (r = 0.61, p < 0.01). Its correlations with nssCa2+ (r = 0.42) and EC (r = 0.42) were weaker but still significant (p < 0.05). These patterns suggest that ON in the AO region may originate not only from primary sea-salt aerosols but may also be linked to biomass burning. However, the backward trajectory analysis shows no significant difference in ON concentrations between air masses influenced by continental sources and those transported solely over the ocean (Fig. S1b; independent samples t-test, p = 0.16), likely suggesting the limited role of terrestrial inputs in this region. Unlike the SATO region, where ON showed no correlation with AEC (Fig. S2b; p > 0.05), ON concentrations in the AO exhibited a strong positive correlation with the AEC (Fig. S2a; p < 0.01), suggesting that marine biological activity is a key driver of ON variability in this region (Creamean et al., 2022). Collectively, these results demonstrate that the AO region is primarily governed by marine processes, with ON derived from both sea-spray organic enrichment and biogenic aerosol precursors, while terrestrial influences remain secondary (Nøjgaard et al., 2022).
In the SO region, ON concentrations were the lowest among all regions (mean = 12.0 ± 7.1 ng m−3), yet the ratio was relatively high (27.8 ± 11.0 %). Backward trajectory analysis indicates that air masses predominantly originated from the open ocean and Antarctic continent (Fig. 3d), with minimal anthropogenic influence. ON here exhibited a significant positive correlation with Na+ (Fig. 4; r = 0.43, p < 0.01), but no significant relationships with nssK+, nssCa2+ or EC. While long-range transport events may deliver stable continental tracers like EC to this remote region, the lack of correlation between ON and these markers suggests that continental inputs are not the primary driver of ON variability. This pattern, combined with the association with Na+ suggests that primary sea-salt emissions are an important pathway for ON in the SO atmosphere (Matsumoto et al., 2022), likely through the incorporation of marine-derived organic matter into sea-spray aerosols. Meanwhile, the absence of associations with terrestrial tracers further supports the notion that ON in this remote region is likely influenced more significantly by natural marine processes rather than continental or anthropogenic sources.
4.2 Role of sea-ice–associated biogenic processes in shaping Antarctic aerosol ON
Sea-ice and open-ocean environments create distinct conditions for the production and emission of ON. While sea ice restricts direct air–sea exchange, it hosts specialized microbial communities and accumulates organic matter within brine channels. During melt and ice-edge retreat, this organic material is released into waters characterized by high primary productivity (Arrigo et al., 2008). This biological intensification enriches the surface microlayer and supplies precursors for aerosolization via sea spray and secondary formation (Dall'Osto et al., 2017; DeMott et al., 2016; Galgani et al., 2016; Wilson et al., 2015).

Figure 5Comparison of measured ON concentrations (a) and ratio (b) between SI and OO aerosol samples (“” indicating p < 0.01). And correlations between SIC (c), AEC (d) and ON concentration in SI aerosol samples. The sample sizes are n = 10 for (c) and n = 6 for (d). These reduced sample sizes are due to unavailable satellite SIC/Chl a data along the trajectories, and in this study SIC or Chl a is used only when ≥ 75 % of the trajectory points have valid satellite values (see Sects. 2.6 and 2.7).
Along the Antarctic coast, we classified samples into two groups based on air–mass histories: open ocean (OO), influenced almost exclusively by open-ocean trajectories, and sea ice (SI), with air masses residing over sea ice for extended periods. SI samples exhibited significantly higher ON concentrations and ratios than OO samples (p < 0.001; Mann–Whitney U test; Fig. 5a and b). Multiple lines of evidence point to sea-ice–associated biological processes as the driver of these enhancements: (1) Strong positive correlations of ON with sea-ice concentration (SIC; r = 0.86, p < 0.01) and with air–mass exposure to chlorophyll a (AEC; r = 0.91, p < 0.01) in the SI group indicate that both ice cover and associated biological activity elevate ON (Fig. 5c and d); (2) PSCF analysis identifies high-probability source regions (PSCF > 0.8) over sea ice and its marginal zone for SI samples (Fig. S3c), consistent with an ice-edge origin; and (3) In contrast, ON shows no significant correlation with Na+ (r = −0.22, p > 0.05) or with IN (p > 0.05) for SI samples (Fig. S4a and b), suggesting that primary sea-salt emissions and purely abiotic inorganic pathways are not the dominant contributors.
These observations support a mechanistic pathway whereby organic matter released from sympagic (ice-associated) communities during melt enriches the surface microlayer and is transferred to the atmosphere via sea spray as ON-rich particles (DeMott et al., 2016; Wilson et al., 2015). Concurrently, a portion of this organic nitrogen is rapidly microbially degraded to volatile alkylamines (e.g., methylamines) (Taubert et al., 2017), which then form aminium salts through acid–base reactions with marine emissions-derived acids (e.g., H2SO4, MSA), contributing to both ON and IN in SI conditions (Brean et al., 2021; Dawson et al., 2012; Fitzsimons et al., 2023). This process results in the formation of both organic (amine salts, contributing to ON) and inorganic nitrogen aerosol species ( and ), which explains their elevated levels in the SI group samples (Fig. S5). The elevated ratios in SI samples (31.0 %) relative to OO samples (20.8 %) further indicate a greater fractional contribution of ON under sea-ice influence (Fig. 5b), consistent with reported releases of organic species from the sympagic ecosystem during melt (Jang et al., 2023; Mirrielees et al., 2024; Yan et al., 2020).
For OO samples, PSCF hotspots (PSCF > 0.8) shift toward the offshore Southern Ocean (Fig. S3d), in line with trajectories dominated by open-ocean air masses. The positive association between ON and oceanic residence time (r = 0.66, p < 0.01; Fig. S6) suggests that, as sea-ice influence diminishes, ON variability becomes increasingly governed by open-ocean biological processes and long-range marine aerosol transport.
Overall, these results establish the ice-edge/sympagic environment as an important regulator of Antarctic aerosol ON. Sea-ice dynamics modulate both the magnitude (higher ON and ) and sources (biogenic enrichment and amine-driven secondary formation) of ON, underscoring the need to represent sea-ice–associated processes in polar atmospheric chemistry and climate models.
Taking advantage of a new analytical tool for ON and aerosol samples collected from three Antarctic and Arctic expeditions from 2019 to 2024, we quantified aerosol ON and IN in 92 TSP samples spanning 160° of latitude in the MABL. This dataset provides the first direct, subtraction-free ON measurements along a global-scale marine transect, capturing both water-soluble and water-insoluble fractions.
We observed a pronounced hemispheric and latitudinal gradient in ON, with substantially higher concentrations in the Northern Hemisphere (83.3 ± 141.4 ng m−3) than in the Southern Hemisphere (15.4 ± 12.4 ng m−3). Regionally, Coastal East Asia exhibited the highest ON (164.6 ± 179.1 ng m−3) but a low ratio (21.1 %), consistent with strong terrestrial and anthropogenic influences that elevate IN. The Southeast Asia–Australia Tropical Ocean showed intermediate ON and a relatively high ratio due to low IN. The Arctic Ocean had lower ON but the highest ratio (38.6 %), indicating prominent marine biogenic contributions. The Southern Ocean showed the lowest ON (12.0 ± 7.0 ng m−3) yet a relatively high ratio (27.8 %), also suggestive of oceanic sources. Interannual variability across the three Antarctic campaigns was minor.
Multiple lines of evidence, including correlations with tracers, back-trajectory analysis, and PSCF, indicate that ON in CEA is dominated by continental inputs from combustion and dust, whereas ON in AO and SO is primarily controlled by marine processes. Along the Antarctic coast, air masses influenced by sea ice exhibited significantly higher ON and than those influenced by the open ocean, with strong positive relationships to sea-ice concentrations and air–mass exposure to chlorophyll a. These patterns point to sympagic and ice-edge biogenic activity – through organic enrichment of sea spray and the secondary formation – as key regulators of ON near Antarctica.
Comparison with prior WSON-only datasets suggests that earlier studies likely underestimated total ON – by approximately 40 % in the Southern Ocean – due to omission of WION. Accounting for both soluble and insoluble phases is therefore essential for constraining nitrogen deposition to the oceans and for representing ON's roles in atmospheric processes. Specifically, given that WION may significantly influence cloud condensation nuclei activity and cloud droplet formation, overlooking this fraction could lead to substantial uncertainties in assessing the radiative forcing and climate effects of marine aerosols.
These findings fill a critical observational gap, establish robust hemispheric and regional patterns of marine aerosol ON, and provide essential constraints for atmospheric chemistry and climate models. Future efforts should explicitly represent ON sources, including sea-ice–associated biogenic processes and amine chemistry, and expand year-round, size-resolved, and composition-resolved measurements paired with isotopic and molecular tracers to refine source apportionment and evaluate model parameterizations across regions and seasons.
The data on organic nitrogen concentrations in aerosol are available at National Tibetan Plateau/Third Pole Environment Data Center, DOI: https://doi.org/10.11888/Atmos.tpdc.303043 (Sun, 2025).
The supplement related to this article is available online at https://doi.org/10.5194/acp-26-1699-2026-supplement.
Ningning Sun: Data curation, Writing-original draft. Yu Xu: Methodology. Bo Zhang and Ye Hu: Visualization, Software. Zhe Li: Methodology. Yilan Li: Carried out data analysis. Zhenlou Chen: Review. Jian Zhen Yu: Supervision, Writing – review and editing. Guitao Shi: Supervision, Writing – review and editing.
The contact author has declared that none of the authors has any competing interests.
Publisher's note: Copernicus Publications remains neutral with regard to jurisdictional claims made in the text, published maps, institutional affiliations, or any other geographical representation in this paper. The authors bear the ultimate responsibility for providing appropriate place names. Views expressed in the text are those of the authors and do not necessarily reflect the views of the publisher.
The authors are grateful to CHINARE members for their support and assistance in sampling. The authors acknowledge the availability of the Hybrid Single-Particle Lagrangian Integrated Trajectory (HYSPLIT) model (available at https://www.arl.noaa.gov/hysplit/, last access: 31 October 2025).
This work was supported by the National Science Foundation of China (grant nos. 42276243 and 41922046), the Fundamental Research Funds for the Central Universities, and the Hong Kong Research Grants Council (grant nos. 1621322, 16304924, and CRS_HKUST605/24).
This paper was edited by James Allan and reviewed by two anonymous referees.
Almeida, J., Schobesberger, S., Kürten, A., Ortega, I. K., Kupiainen-Määttä, O., Praplan, A. P., Adamov, A., Amorim, A., Bianchi, F., Breitenlechner, M., David, A., Dommen, J., Donahue, N. M., Downard, A., Dunne, E., Duplissy, J., Ehrhart, S., Flagan, R. C., Franchin, A., Guida, R., Hakala, J., Hansel, A., Heinritzi, M., Henschel, H., Jokinen, T., Junninen, H., Kajos, M., Kangasluoma, J., Keskinen, H., Kupc, A., Kurtén, T., Kvashin, A. N., Laaksonen, A., Lehtipalo, K., Leiminger, M., Leppä, J., Loukonen, V., Makhmutov, V., Mathot, S., McGrath, M. J., Nieminen, T., Olenius, T., Onnela, A., Petäjä, T., Riccobono, F., Riipinen, I., Rissanen, M., Rondo, L., Ruuskanen, T., Santos, F. D., Sarnela, N., Schallhart, S., Schnitzhofer, R., Seinfeld, J. H., Simon, M., Sipilä, M., Stozhkov, Y., Stratmann, F., Tomé, A., Tröstl, J., Tsagkogeorgas, G., Vaattovaara, P., Viisanen, Y., Virtanen, A., Vrtala, A., Wagner, P. E., Weingartner, E., Wex, H., Williamson, C., Wimmer, D., Ye, P., Yli-Juuti, T., Carslaw, K. S., Kulmala, M., Curtius, J., Baltensperger, U., Worsnop, D. R., Vehkamäki, H., and Kirkby, J.: Molecular understanding of sulphuric acid–amine particle nucleation in the atmosphere, Nature, 502, 359–363, https://doi.org/10.1038/nature12663, 2013.
Alsante, A. N., Thornton, D. C. O., and Brooks, S. D.: Effect of Aggregation and Molecular Size on the Ice Nucleation Efficiency of Proteins, Environ. Sci. Technol., 58, 4594–4605, https://doi.org/10.1021/acs.est.3c06835, 2024.
Altieri, K. E., Fawcett, S. E., Peters, A. J., Sigman, D. M., and Hastings, M. G.: Marine biogenic source of atmospheric organic nitrogen in the subtropical North Atlantic, Proc. Natl. Acad. Sci. USA, 113, 925–930, https://doi.org/10.1073/pnas.1516847113, 2016.
Altieri, K. E., Fawcett, S. E., and Hastings, M. G.: Reactive Nitrogen Cycling in the Atmosphere and Ocean, Annu. Rev. Earth Planet. Sci., 49, 523–550, https://doi.org/10.1146/annurev-earth-083120-052147, 2021.
Anonymous: A fresh look at element distribution in the North Pacific Ocean, Eos Trans. Am. Geophys. Union, 78, 221–221, https://doi.org/10.1029/97EO00148, 1997.
Arrigo, K. R., Van Dijken, G. L., and Bushinsky, S.: Primary production in the Southern Ocean, 1997–2006, J. Geophys. Res., 113, 2007JC004551, https://doi.org/10.1029/2007JC004551, 2008.
Ashbaugh, L. L., Malm, W. C., and Sadeh, W. Z.: A residence time probability analysis of sulfur concentrations at grand Canyon National Park, Atmos. Environ., 19, 1263–1270, https://doi.org/10.1016/0004-6981(85)90256-2, 1985.
Baker, A. R., Kanakidou, M., Altieri, K. E., Daskalakis, N., Okin, G. S., Myriokefalitakis, S., Dentener, F., Uematsu, M., Sarin, M. M., Duce, R. A., Galloway, J. N., Keene, W. C., Singh, A., Zamora, L., Lamarque, J.-F., Hsu, S.-C., Rohekar, S. S., and Prospero, J. M.: Observation- and model-based estimates of particulate dry nitrogen deposition to the oceans, Atmos. Chem. Phys., 17, 8189–8210, https://doi.org/10.5194/acp-17-8189-2017, 2017.
Blazina, T., Läderach, A., Jones, G. D., Sodemann, H., Wernli, H., Kirchner, J. W., and Winkel, L. H. E.: Marine Primary Productivity as a Potential Indirect Source of Selenium and Other Trace Elements in Atmospheric Deposition, Environ. Sci. Technol., 51, 108–118, https://doi.org/10.1021/acs.est.6b03063, 2017.
Brean, J., Dall'Osto, M., Simó, R., Shi, Z., Beddows, D. C. S., and Harrison, R. M.: Open ocean and coastal new particle formation from sulfuric acid and amines around the Antarctic Peninsula, Nat. Geosci., 14, 383–388, https://doi.org/10.1038/s41561-021-00751-y, 2021.
Cape, J. N., Cornell, S. E., Jickells, T. D., and Nemitz, E.: Organic nitrogen in the atmosphere – Where does it come from? A review of sources and methods, Atmos. Res., 102, 30–48, https://doi.org/10.1016/j.atmosres.2011.07.009, 2011.
Cavalieri, D. J., Gloersen, P., Parkinson, C. L., Comiso, J. C., and Zwally, H. J.: Observed Hemispheric Asymmetry in Global Sea Ice Changes, Science, 278, 1104–1106, https://doi.org/10.1126/science.278.5340.1104, 1997.
Chan, M. N., Choi, M. Y., Ng, N. L., and Chan, C. K.: Hygroscopicity of Water-Soluble Organic Compounds in Atmospheric Aerosols: Amino Acids and Biomass Burning Derived Organic Species, Environ. Sci. Technol., 39, 1555–1562, https://doi.org/10.1021/es049584l, 2005.
Chen, H. Y. and Chen, L.-D.: Occurrence of water soluble organic nitrogen in aerosols at a coastal area, J. Atmos. Chem., 65, 49–71, https://doi.org/10.1007/s10874-010-9181-y, 2010.
Choi, J. H., Jang, E., Yoon, Y. J., Park, J. Y., Kim, T.-W., Becagli, S., Caiazzo, L., Cappelletti, D., Krejci, R., Eleftheriadis, K., Park, K.-T., and Jang, K. S.: Influence of Biogenic Organics on the Chemical Composition of Arctic Aerosols, Global Biogeochem. Cycles, 33, 1238–1250, https://doi.org/10.1029/2019GB006226, 2019.
Chuck, A. L., Turner, S. M., and Liss, P. S.: Direct Evidence for a Marine Source of C1 and C2 Alkyl Nitrates, Science, 297, 1151–1154, https://doi.org/10.1126/science.1073896, 2002.
Cornell, S.: Water-soluble organic nitrogen in atmospheric aerosol: a comparison of UV and persulfate oxidation methods, Atmos. Environ., 33, 833–840, https://doi.org/10.1016/S1352-2310(98)00139-3, 1999.
Cornell, S., Mace, K., Coeppicus, S., Duce, R., Huebert, B., Jickells, T., and Zhuang, L.-Z.: Organic nitrogen in Hawaiian rain and aerosol, J. Geophys. Res., 106, 7973–7983, https://doi.org/10.1029/2000JD900655, 2001.
Creamean, J. M., Barry, K., Hill, T. C. J., Hume, C., DeMott, P. J., Shupe, M. D., Dahlke, S., Willmes, S., Schmale, J., Beck, I., Hoppe, C. J. M., Fong, A., Chamberlain, E., Bowman, J., Scharien, R., and Persson, O.: Annual cycle observations of aerosols capable of ice formation in central Arctic clouds, Nat. Commun., 13, 3537, https://doi.org/10.1038/s41467-022-31182-x, 2022.
Dall'Osto, M., Ovadnevaite, J., Paglione, M., Beddows, D. C. S., Ceburnis, D., Cree, C., Cortés, P., Zamanillo, M., Nunes, S. O., Pérez, G. L., Ortega-Retuerta, E., Emelianov, M., Vaqué, D., Marrasé, C., Estrada, M., Sala, M. M., Vidal, M., Fitzsimons, M. F., Beale, R., Airs, R., Rinaldi, M., Decesari, S., Cristina Facchini, M., Harrison, R. M., O'Dowd, C., and Simó, R.: Antarctic sea ice region as a source of biogenic organic nitrogen in aerosols, Sci. Rep., 7, 6047, https://doi.org/10.1038/s41598-017-06188-x, 2017.
Dall'Osto, M., Airs, R. L., Beale, R., Cree, C., Fitzsimons, M. F., Beddows, D., Harrison, R. M., Ceburnis, D., O'Dowd, C., Rinaldi, M., Paglione, M., Nenes, A., Decesari, S., and Simó, R.: Simultaneous Detection of Alkylamines in the Surface Ocean and Atmosphere of the Antarctic Sympagic Environment, ACS Earth Space Chem., 3, 854–862, https://doi.org/10.1021/acsearthspacechem.9b00028, 2019.
Dawson, M. L., Varner, M. E., Perraud, V., Ezell, M. J., Gerber, R. B., and Finlayson-Pitts, B. J.: Simplified mechanism for new particle formation from methanesulfonic acid, amines, and water via experiments and ab initio calculations, Proc. Natl. Acad. Sci. USA, 109, 18719–18724, https://doi.org/10.1073/pnas.1211878109, 2012.
DeMott, P. J., Hill, T. C. J., McCluskey, C. S., Prather, K. A., Collins, D. B., Sullivan, R. C., Ruppel, M. J., Mason, R. H., Irish, V. E., Lee, T., Hwang, C. Y., Rhee, T. S., Snider, J. R., McMeeking, G. R., Dhaniyala, S., Lewis, E. R., Wentzell, J. J. B., Abbatt, J., Lee, C., Sultana, C. M., Ault, A. P., Axson, J. L., Diaz Martinez, M., Venero, I., Santos-Figueroa, G., Stokes, M. D., Deane, G. B., Mayol-Bracero, O. L., Grassian, V. H., Bertram, T. H., Bertram, A. K., Moffett, B. F., and Franc, G. D.: Sea spray aerosol as a unique source of ice nucleating particles, Proc. Natl. Acad. Sci. USA, 113, 5797–5803, https://doi.org/10.1073/pnas.1514034112, 2016.
Deng, O., Wang, S., Ran, J., Huang, S., Zhang, X., Duan, J., Zhang, L., Xia, Y., Reis, S., Xu, J., Xu, J., De Vries, W., Sutton, M. A., and Gu, B.: Managing urban development could halve nitrogen pollution in China, Nat. Commun., 15, 401, https://doi.org/10.1038/s41467-023-44685-y, 2024.
Duce, R. A., LaRoche, J., Altieri, K., Arrigo, K. R., Baker, A. R., Capone, D. G., Cornell, S., Dentener, F., Galloway, J., Ganeshram, R. S., Geider, R. J., Jickells, T., Kuypers, M. M., Langlois, R., Liss, P. S., Liu, S. M., Middelburg, J. J., Moore, C. M., Nickovic, S., Oschlies, A., Pedersen, T., Prospero, J., Schlitzer, R., Seitzinger, S., Sorensen, L. L., Uematsu, M., Ulloa, O., Voss, M., Ward, B., and Zamora, L.: Impacts of Atmospheric Anthropogenic Nitrogen on the Open Ocean, Science, 320, 893–897, https://doi.org/10.1126/science.1150369, 2008.
Facchini, M. C., Decesari, S., Rinaldi, M., Carbone, C., Finessi, E., Mircea, M., Fuzzi, S., Moretti, F., Tagliavini, E., Ceburnis, D., and O'Dowd, C. D.: Important Source of Marine Secondary Organic Aerosol from Biogenic Amines, Environ. Sci. Technol., 42, 9116–9121, https://doi.org/10.1021/es8018385, 2008.
Fetterer, F., Knowles, K., Meier, W. N., Savoie, M., and Windnagel, A. K.: Sea Ice Index. (G02135, Version 3), National Snow and Ice Data Center, Boulder, Colorado USA [data set], https://doi.org/10.7265/N5K072F8, 2017.
Fisher, J. A., Jacob, D. J., Travis, K. R., Kim, P. S., Marais, E. A., Chan Miller, C., Yu, K., Zhu, L., Yantosca, R. M., Sulprizio, M. P., Mao, J., Wennberg, P. O., Crounse, J. D., Teng, A. P., Nguyen, T. B., St. Clair, J. M., Cohen, R. C., Romer, P., Nault, B. A., Wooldridge, P. J., Jimenez, J. L., Campuzano-Jost, P., Day, D. A., Hu, W., Shepson, P. B., Xiong, F., Blake, D. R., Goldstein, A. H., Misztal, P. K., Hanisco, T. F., Wolfe, G. M., Ryerson, T. B., Wisthaler, A., and Mikoviny, T.: Organic nitrate chemistry and its implications for nitrogen budgets in an isoprene- and monoterpene-rich atmosphere: constraints from aircraft (SEAC4RS) and ground-based (SOAS) observations in the Southeast US, Atmos. Chem. Phys., 16, 5969–5991, https://doi.org/10.5194/acp-16-5969-2016, 2016.
Fitzsimons, M. F., Tilley, M., and Cree, C. H. L.: The determination of volatile amines in aquatic marine systems: A review, Anal. Chim. Acta, 1241, 340707, https://doi.org/10.1016/j.aca.2022.340707, 2023.
Galgani, L., Piontek, J., and Engel, A.: Biopolymers form a gelatinous microlayer at the air-sea interface when Arctic sea ice melts, Sci. Rep., 6, 29465, https://doi.org/10.1038/srep29465, 2016.
Jang, J., Park, J., Park, J., Yoon, Y. J., Dall'Osto, M., Park, K.-T., Jang, E., Lee, J. Y., Cho, K. H., and Lee, B. Y.: Ocean-atmosphere interactions: Different organic components across Pacific and Southern Oceans, Sci. Total Environ., 878, 162969, https://doi.org/10.1016/j.scitotenv.2023.162969, 2023.
Jickells, T., Baker, A. R., Cape, J. N., Cornell, S. E., and Nemitz, E.: The cycling of organic nitrogen through the atmosphere, Philos. Trans. R. Soc. B, 368, 20130115, https://doi.org/10.1098/rstb.2013.0115, 2013.
Jung, J., Han, B., Rodriguez, B., Miyazaki, Y., Chung, H. Y., Kim, K., Choi, J.-O., Park, K., Kim, I.-N., Kim, S., Yang, E. J., and Kang, S.-H.: Atmospheric Dry Deposition of Water-Soluble Nitrogen to the Subarctic Western North Pacific Ocean during Summer, Atmosphere, 10, 351, https://doi.org/10.3390/atmos10070351, 2019.
Keene, W. C., Pszenny, A. A. P., Galloway, J. N., and Hawley, M. E.: Sea-salt corrections and interpretation of constituent ratios in marine precipitation, J. Geophys. Res., 91, 6647–6658, https://doi.org/10.1029/JD091iD06p06647, 1986.
Lesworth, T., Baker, A. R., and Jickells, T.: Aerosol organic nitrogen over the remote Atlantic Ocean, Atmos. Environ., 44, 1887–1893, https://doi.org/10.1016/j.atmosenv.2010.02.021, 2010.
Li, Y., Fu, T.-M., Yu, J. Z., Yu, X., Chen, Q., Miao, R., Zhou, Y., Zhang, A., Ye, J., Yang, X., Tao, S., Liu, H., and Yao, W.: Dissecting the contributions of organic nitrogen aerosols to global atmospheric nitrogen deposition and implications for ecosystems, Natl. Sci. Rev., 10, nwad244, https://doi.org/10.1093/nsr/nwad244, 2023.
Li, Y., Fu, T.-M., Yu, J. Z., Zhang, A., Yu, X., Ye, J., Zhu, L., Shen, H., Wang, C., Yang, X., Tao, S., Chen, Q., Li, Y., Li, L., Che, H., and Heald, C. L.: Nitrogen dominates global atmospheric organic aerosol absorption, Science, 387, 989–995, https://doi.org/10.1126/science.adr4473, 2025.
Luo, L., Kao, S.-J., Bao, H., Xiao, H., Xiao, H., Yao, X., Gao, H., Li, J., and Lu, Y.: Sources of reactive nitrogen in marine aerosol over the Northwest Pacific Ocean in spring, Atmos. Chem. Phys., 18, 6207–6222, https://doi.org/10.5194/acp-18-6207-2018, 2018.
Mace, K. A., Duce, R. A., and Tindale, N. W.: Organic nitrogen in rain and aerosol at Cape Grim, Tasmania, Australia, J. Geophys. Res., 108, 2002JD003051, https://doi.org/10.1029/2002JD003051, 2003.
Matsumoto, K., Yamamoto, Y., Nishizawa, K., Kaneyasu, N., Irino, T., and Yoshikawa-Inoue, H.: Origin of the water-soluble organic nitrogen in the maritime aerosol, Atmos. Environ., 167, 97–103, https://doi.org/10.1016/j.atmosenv.2017.07.050, 2017.
Matsumoto, K., Kobayashi, H., Hara, K., Ishino, S., and Hayashi, M.: Water-soluble organic nitrogen in fine aerosols over the Southern Ocean, Atmos. Environ., 287, 119287, https://doi.org/10.1016/j.atmosenv.2022.119287, 2022.
Mirrielees, J. A., Kirpes, R. M., Costa, E. J., Porter, G. C. E., Murray, B. J., Lata, N. N., Boschi, V., China, S., Grannas, A. M., Ault, A. P., Matrai, P. A., and Pratt, K. A.: Marine aerosol generation experiments in the High Arctic during summertime, Elementa Sci. Anth., 12, 00134, https://doi.org/10.1525/elementa.2023.00134, 2024.
Miyazaki, Y., Kawamura, K., Jung, J., Furutani, H., and Uematsu, M.: Latitudinal distributions of organic nitrogen and organic carbon in marine aerosols over the western North Pacific, Atmos. Chem. Phys., 11, 3037–3049, https://doi.org/10.5194/acp-11-3037-2011, 2011.
Ng, N. L., Brown, S. S., Archibald, A. T., Atlas, E., Cohen, R. C., Crowley, J. N., Day, D. A., Donahue, N. M., Fry, J. L., Fuchs, H., Griffin, R. J., Guzman, M. I., Herrmann, H., Hodzic, A., Iinuma, Y., Jimenez, J. L., Kiendler-Scharr, A., Lee, B. H., Luecken, D. J., Mao, J., McLaren, R., Mutzel, A., Osthoff, H. D., Ouyang, B., Picquet-Varrault, B., Platt, U., Pye, H. O. T., Rudich, Y., Schwantes, R. H., Shiraiwa, M., Stutz, J., Thornton, J. A., Tilgner, A., Williams, B. J., and Zaveri, R. A.: Nitrate radicals and biogenic volatile organic compounds: oxidation, mechanisms, and organic aerosol, Atmos. Chem. Phys., 17, 2103–2162, https://doi.org/10.5194/acp-17-2103-2017, 2017.
Nøjgaard, J. K., Peker, L., Pernov, J. B., Johnson, M. S., Bossi, R., Massling, A., Lange, R., Nielsen, I. E., Prevot, A. S. H., Eriksson, A. C., Canonaco, F., and Skov, H.: A local marine source of atmospheric particles in the High Arctic, Atmos. Environ., 285, 119241, https://doi.org/10.1016/j.atmosenv.2022.119241, 2022.
Park, K., Lee, K., Kim, T., Yoon, Y. J., Jang, E., Jang, S., Lee, B., and Hermansen, O.: Atmospheric DMS in the Arctic Ocean and Its Relation to Phytoplankton Biomass, Global Biogeochemical Cy., 32, 351–359, https://doi.org/10.1002/2017GB005805, 2018.
Pavuluri, C. M., Kawamura, K., and Fu, P. Q.: Atmospheric chemistry of nitrogenous aerosols in northeastern Asia: biological sources and secondary formation, Atmos. Chem. Phys., 15, 9883–9896, https://doi.org/10.5194/acp-15-9883-2015, 2015.
Quinby-Hunt, M. S. and Turehian, K. K.: Distribution of elements in sea water, EoS Trans. Am. Geophys. Union, 64, 130–130, https://doi.org/10.1029/EO064i014p00130, 1983.
Shi, G., Ma, H., Zhu, Z., Hu, Z., Chen, Z., Jiang, S., An, C., Yu, J., Ma, T., Li, Y., Sun, B., and Hastings, M. G.: Using stable isotopes to distinguish atmospheric nitrate production and its contribution to the surface ocean across hemispheres, Earth Planet. Sci. Lett., 564, 116914, https://doi.org/10.1016/j.epsl.2021.116914, 2021.
Shubhankar, B. and Ambade, B.: Chemical characterization of carbonaceous carbon from industrial and semi urban site of eastern India, SpringerPlus, 5, 837, https://doi.org/10.1186/s40064-016-2506-9, 2016.
Siegel, D. A., Behrenfeld, M. J., Maritorena, S., McClain, C. R., Antoine, D., Bailey, S. W., Bontempi, P. S., Boss, E. S., Dierssen, H. M., Doney, S. C., Eplee, R. E., Evans, R. H., Feldman, G. C., Fields, E., Franz, B. A., Kuring, N. A., Mengelt, C., Nelson, N. B., Patt, F. S., Robinson, W. D., Sarmiento, J. L., Swan, C. M., Werdell, P. J., Westberry, T. K., Wilding, J. G., and Yoder, J. A.: Regional to global assessments of phytoplankton dynamics from the SeaWiFS mission, Remote Sens. Environ., 135, 77–91, https://doi.org/10.1016/j.rse.2013.03.025, 2013.
Song, J., Zhao, Y., Zhang, Y., Fu, P., Zheng, L., Yuan, Q., Wang, S., Huang, X., Xu, W., Cao, Z., Gromov, S., and Lai, S.: Influence of biomass burning on atmospheric aerosols over the western South China Sea: Insights from ions, carbonaceous fractions and stable carbon isotope ratios, Environ. Pollut., 242, 1800–1809, https://doi.org/10.1016/j.envpol.2018.07.088, 2018.
Stein, A. F., Draxler, R. R., Rolph, G. D., Stunder, B. J. B., Cohen, M. D., and Ngan, F.: NOAA's HYSPLIT Atmospheric Transport and Dispersion Modeling System, B. Am. Meteorol. Soc., 96, 2059–2077, https://doi.org/10.1175/BAMS-D-14-00110.1, 2015.
Sun, N.: Spatial distribution of organic nitrogen in the global marine boundary layer from Arctic to Antarctic, National Tibetan Plateau/Third Pole Environment Data Center [data set], https://doi.org/10.11888/Atmos.tpdc.303043, 2025.
Taubert, M., Grob, C., Howat, A. M., Burns, O. J., Pratscher, J., Jehmlich, N., Von Bergen, M., Richnow, H. H., Chen, Y., and Murrell, J. C.: Methylamine as a nitrogen source for microorganisms from a coastal marine environment, Environ. Microbiol., 19, 2246–2257, https://doi.org/10.1111/1462-2920.13709, 2017.
Tian, M., Li, H., Wang, G., Fu, M., Qin, X., Lu, D., Liu, C., Zhu, Y., Luo, X., Deng, C., Abdullaev, S. F., and Huang, K.: Seasonal source identification and formation processes of marine particulate water soluble organic nitrogen over an offshore island in the East China Sea, Sci. Total Environ., 863, 160895, https://doi.org/10.1016/j.scitotenv.2022.160895, 2023.
Violaki, K., Sciare, J., Williams, J., Baker, A. R., Martino, M., and Mihalopoulos, N.: Atmospheric water-soluble organic nitrogen (WSON) over marine environments: a global perspective, Biogeosciences, 12, 3131–3140, https://doi.org/10.5194/bg-12-3131-2015, 2015.
Wilson, T. W., Ladino, L. A., Alpert, P. A., Breckels, M. N., Brooks, I. M., Browse, J., Burrows, S. M., Carslaw, K. S., Huffman, J. A., Judd, C., Kilthau, W. P., Mason, R. H., McFiggans, G., Miller, L. A., Nájera, J. J., Polishchuk, E., Rae, S., Schiller, C. L., Si, M., Temprado, J. V., Whale, T. F., Wong, J. P. S., Wurl, O., Yakobi-Hancock, J. D., Abbatt, J. P. D., Aller, J. Y., Bertram, A. K., Knopf, D. A., and Murray, B. J.: A marine biogenic source of atmospheric ice-nucleating particles, Nature, 525, 234–238, https://doi.org/10.1038/nature14986, 2015.
Wu, C. and Yu, J. Z.: Determination of primary combustion source organic carbon-to-elemental carbon () ratio using ambient OC and EC measurements: secondary OC-EC correlation minimization method, Atmos. Chem. Phys., 16, 5453–5465, https://doi.org/10.5194/acp-16-5453-2016, 2016.
Wu, G., Hu, Y., Gong, C., Wang, D., Zhang, F., Herath, I. K., Chen, Z., and Shi, G.: Spatial distribution, sources, and direct radiative effect of carbonaceous aerosol along a transect from the Arctic Ocean to Antarctica, Sci. Total Environ., 916, 170136, https://doi.org/10.1016/j.scitotenv.2024.170136, 2024.
Xiao, H.-W., Xiao, H.-Y., Luo, L., Shen, C.-Y., Long, A.-M., Chen, L., Long, Z.-H., and Li, D.-N.: Atmospheric aerosol compositions over the South China Sea: temporal variability and source apportionment, Atmos. Chem. Phys., 17, 3199–3214, https://doi.org/10.5194/acp-17-3199-2017, 2017.
Yan, J., Jung, J., Lin, Q., Zhang, M., Xu, S., and Zhao, S.: Effect of sea ice retreat on marine aerosol emissions in the Southern Ocean, Antarctica, Sci. Total Environ., 745, 140773, https://doi.org/10.1016/j.scitotenv.2020.140773, 2020.
Yan, S., Xu, G., Zhang, H., Wang, J., Xu, F., Gao, X., Zhang, J., Wu, J., and Yang, G.: Factors Controlling DMS Emission and Atmospheric Sulfate Aerosols in the Western Pacific Continental Sea, J. Geophys. Res., 129, e2024JC020886, https://doi.org/10.1029/2024JC020886, 2024.
Yu, X., Li, Q., Ge, Y., Li, Y., Liao, K., Huang, X. H., Li, J., and Yu, J. Z.: Simultaneous Determination of Aerosol Inorganic and Organic Nitrogen by Thermal Evolution and Chemiluminescence Detection, Environ. Sci. Technol., 55, 11579–11589, https://doi.org/10.1021/acs.est.1c04876, 2021.
Zamora, L. M., Prospero, J. M., and Hansell, D. A.: Organic nitrogen in aerosols and precipitation at Barbados and Miami: Implications regarding sources, transport and deposition to the western subtropical North Atlantic, J. Geophys. Res., 116, D20309, https://doi.org/10.1029/2011JD015660, 2011.
Zhou, S., Chen, Y., Paytan, A., Li, H., Wang, F., Zhu, Y., Yang, T., Zhang, Y., and Zhang, R.: Non-Marine Sources Contribute to Aerosol Methanesulfonate Over Coastal Seas, J. Geophys. Res.: Atmospheres, 126, e2021JD034960, https://doi.org/10.1029/2021JD034960, 2021.
Zhou, S., Chen, Y., Wang, F., Bao, Y., Ding, X., and Xu, Z.: Assessing the Intensity of Marine Biogenic Influence on the Lower Atmosphere: An Insight into the Distribution of Marine Biogenic Aerosols over the Eastern China Seas, Environ. Sci. Technol., 57, 12741–12751, https://doi.org/10.1021/acs.est.3c04382, 2023.