
the Creative Commons Attribution 4.0 License.
the Creative Commons Attribution 4.0 License.
 | 09 Nov 2026
Characterisation of hygroscopic aerosol processes using remote sensing and in situ techniques at the MeteoSwiss Payerne station
Arlett Díaz-Zurita
Simone Brunamonti
Alexander Haefele
Martine Collaud Coen
Giovanni Martucci
Benjamin Tobias Brem
Martin Gysel-Beer
Hassan Lyamani
Gloria Titos
Daniel Pérez-Ramírez
Christoph Hüglin
Lucas Alados-Arboledas
Alejandro Keller
Frank Gunther Wienhold
Maxime Hervo

This study presents a comprehensive assessment of aerosol hygroscopicity during the HYGRO19 field campaign conducted at the MeteoSwiss station in Payerne (Switzerland) from June to December 2019. Continuous profiles of aerosol backscatter, water vapour mixing ratio, and temperature provided by the Raman Lidar for Meteorological Observations (RALMO) during both daytime and nighttime allowed aerosol hygroscopic growth to be investigated temporally and vertically under different atmospheric conditions. The campaign also provided a unique experimental framework by combining continuous Raman lidar observations with vertically resolved in situ measurements from the balloon-borne Compact Backscatter Aerosol Detector coupled with Vaisala RS41 radiosondes (COBALD-RS41), ground-based tandem nephelometers, and complementary surface aerosol chemical analyses, enabling aerosol hygroscopicity to be evaluated using three complementary approaches. Two contrasting aerosol regimes were observed: a summer period characterised by relatively high aerosol loading and frequent influence from long-range transported particles, and a second period dominated by low-pressure systems, persistent cloudiness, and reduced aerosol concentrations. Through these different atmospheric conditions, more than 200 well-mixed hygroscopic aerosol layers were identified with RALMO, with median hygroscopicity parameters of fβ (355 nm) and γβ (355 nm) . Statistical analyses revealed no systematic dependence of aerosol hygroscopicity on altitude, with comparable values in the atmospheric boundary layer and free troposphere. Multi-instrument comparisons showed generally consistent hygroscopic behaviour among RALMO, COBALD-RS41, and tandem nephelometer observations in the analysed cases, despite differences between the techniques. Surface chemical analyses showed a predominance of organic matter, with inorganic species accounting for approximately 11 % of the aerosol mass. No clear dependence of aerosol hygroscopicity on particle size was identified. These results show that continuous Raman lidar observations, complemented by vertically resolved and ground-based in situ measurements, provide a robust framework for characterising aerosol hygroscopicity under ambient atmospheric conditions.
- Article
(8449 KB) - Full-text XML
-
Supplement
(24075 KB) - BibTeX
- EndNote


Atmospheric aerosols have a significant impact on Earth's radiative balance both directly, through the scattering and absorption of solar radiation, and indirectly, by modifying the microphysical properties of clouds due to their ability to act as cloud condensation nuclei (CCN) or ice nucleating particles (INPs) (Seinfeld et al., 2016). According to the last Intergovernmental Panel on Climate Change (IPCC), the largest uncertainty in the net radiative forcing is primarily dominated by uncertainties associated with the aerosol component (Douville et al., 2021). These uncertainties are mainly associated with the high temporal and spatial variability of aerosol distribution and composition, as well as their complex interactions with clouds (aerosol-cloud interactions, ACI) and precipitation processes (Bindoff et al., 2013; Chen et al., 2020). One of the key aspects contributing to these uncertainties is aerosol hygroscopicity, which refers to the ability of particles to take up water vapour, thereby altering particle size, chemical composition and optical properties (Chen et al., 2020). Aerosol hygroscopic growth can influence the direct radiative effect by modifying particle size and consequently the light scattering pattern (i.e. the phase function). Moreover, the hygroscopic growth represents a fundamental aerosol parameter leading to indirect radiative effect, as the ability of aerosols to act as CCN is directly related to their affinity for water vapour uptake (Hänel, 1976; Seinfeld et al., 2016).
Several studies have addressed the effects of hygroscopic growth on aerosol optical and microphysical properties using ground-based in situ measurements. Techniques such as the Humidified Tandem Differential Mobility Analyser (HT-DMA) (e.g., Liu et al., 2018; Swietlicki et al., 2008; Pariyothon et al., 2023; Deshmukh et al., 2025; Zhang et al., 2025) and Humidified Tandem Nephelometers (e.g., Titos et al., 2014b; Alonso-Blanco et al., 2019; Burgos et al., 2019; Mouton et al., 2023; Yuan and Zhao, 2023) have been extensively used to quantify changes in particle diameter or aerosol optical properties due to water vapour uptake. However, these techniques also have certain limitations. Most in situ techniques alter the ambient conditions and are subject to particle losses in the sampling lines, which can modify aerosol properties relative to ambient conditions (e.g., particle number concentration, size distribution, chemical composition, scattering, and absorption; Hermann et al., 2001; Bedoya-Velásquez et al., 2018). For humidified nephelometer measurements, uncertainties in the scattering enhancement factor (f(RH)) can be substantial at high relative humidity (RH), with values of approximately 20 %–40 % reported for moderately hygroscopic aerosols (Titos et al., 2016). However, the most relevant issue is that these measurements are representative of only a few metres above the ground and do not allow for a complete understanding of aerosol hygroscopicity in the vertical.
Remote sensing techniques can complement observations of aerosol hygroscopicity by providing independent measurements of aerosol properties and relative humidity. Furthermore, these measurements can be obtained at high RH without altering the aerosol sample (Feingold and Morley, 2003). Measurements with ground-based Aerosol Robotic Network (AERONET; Holben et al., 1998) can estimate aerosol hygroscopicity through studying changes in aerosol size distributions in relation to column precipitable water vapour (PWV) (Schafer et al., 2008), and also in connection with the dissipation of fog or low-altitude clouds (Eck et al., 2012). However, AERONET measurements are representative of the entire atmospheric column. In contrast, lidar measurements provide vertically resolved aerosol information, which make such measurements suitable for investigating aerosol hygroscopicity within well-mixed aerosol layers (Ferrare et al., 1998). To achieve this, well-mixed atmospheric conditions are required to isolate the effect of hygroscopic growth from other aerosol processes (Wulfmeyer and Feingold, 2000; Feingold and Morley, 2003). Nevertheless, as these measurements are performed under real atmospheric conditions, neither the sample nor the ambient conditions can be controlled, limiting their applicability (Granados-Muñoz et al., 2015), and obtaining RH profiles with high vertical and temporal resolution remains challenging. Furthermore, lidar system quantifies the impact of RH on the backscatter coefficient at a polar angle of 180°, which requires assumptions and calculations to translate it to, for example, the RH effect on the hemispheric backscatter coefficient. Some studies relied on thermodynamic profiles from collocated radiosondes (RS) (Veselovskii et al., 2009, 2025; Sicard et al., 2022; Jing et al., 2026), which limited the application of lidar measurements for aerosol hygroscopicity investigations. To extend the applicability of the technique to other studies, RH profiles have been derived by combining temperature (T) profiles from microwave radiometers (MWR) with water vapour mixing ratio profiles from Raman lidar observations (Navas-Guzmán et al., 2014; Bedoya-Velásquez et al., 2018; Miri et al., 2024). However, uncertainties in the MWR temperature profiles, due to their lower spatial resolution, can affect the accuracy in the derived RH (Navas-Guzmán et al., 2016) and in the retrieved aerosol hygroscopicity parameters (Pérez-Ramírez et al., 2021). Despite these approaches having served as useful benchmarks, long-term vertically resolved analyses of aerosol hygroscopicity remain limited (Sicard et al., 2022; Jing et al., 2026). Indeed, most previous studies have been conducted during specific field campaigns or have focused on only a few case studies, often based on nighttime observations. Furthermore, comprehensive aerosol hygroscopicity studies require simultaneous measurements of aerosol chemical composition and particle size (Pérez-Ramírez et al., 2021; Laly et al., 2025), which are not always available.
The Raman Lidar for Meteorological Observations (RALMO) system, operating at the MeteoSwiss aerological station in Payerne, Switzerland, can overcome some of the previously mentioned limitations in aerosol hygroscopicity studies. Its capability to provide high-vertical-resolution profiles of aerosol backscatter, temperature, and water vapour mixing ratio and to operate continuously during both daytime and nighttime (Dinoev et al., 2013) makes it particularly suitable for aerosol hygroscopicity studies (Navas-Guzmán et al., 2019). In this context, the HYGRO19 field campaign, conducted from June to December 2019 in Payerne, represented a unique opportunity to combine continuous RALMO observations with complementary in situ techniques to characterise aerosol hygroscopicity under ambient atmospheric conditions. Furthermore, vertical aerosol measurements performed with the Compact Backscatter Aerosol Detector (COBALD, Brunamonti et al., 2018), alongside RH profiles from operational RS41 radiosondes, permitted the direct comparison of aerosol hygroscopicity parameters retrieved from RALMO with those derived from vertically resolved in situ observations. This makes HYGRO19 one of the few studies in which aerosol hygroscopicity has been characterised vertically using balloon-borne COBALD-RS41 measurements. Additionally, complementary in situ measurements, including tandem nephelometers, were performed at ground level, enabling the evaluation of lidar retrievals in selected cases where the sampled layers were connected to the surface under well-mixed conditions. Nevertheless, some limitations arise from the different approaches and wavelengths used to obtain aerosol hygroscopicity parameters, since lidars rely solely on backscatter measurements, whereas tandem nephelometers use the scattering coefficient. Differences in sampling time and vertical representativeness further limit the direct comparability of the retrieved parameters.
This work focuses on the characterisation of aerosol hygroscopicity during the HYGRO19 field campaign using complementary remote sensing and in situ techniques, and on assessing the consistency and limitations of their comparisons. Selected multi-instrument comparisons are performed between RALMO-derived hygroscopicity parameters and those obtained from vertically resolved in situ observations from COBALD-RS41 sondes and ground-based tandem nephelometer measurements. Continuous RALMO observations additionally provide a statistical characterisation of the temporal and vertical variability of aerosol hygroscopicity within the conditions that fulfil the retrieval criteria. Complementary aerosol and meteorological observations support the interpretation of the observed hygroscopic behaviour.
The paper is structured as follows: Sect. 2 describes the experimental site and instrumentation, Sect. 3 details the methodologies used, Sect. 4 reports the main results and their discussion, and Sect. 5 summarises the conclusions and provides perspectives for future work.
2.1 The HYGRO19 field campaign
The intercomparison campaign of hygroscopic aerosol properties using remote sensing and in situ techniques (HYGRO19 campaign) was carried out from June to December 2019 at the MeteoSwiss aerological station in Payerne, Switzerland (46.82° N, 6.95° E, 49 m above sea level (a.s.l.)), which forms part of ACTRIS (Aerosol, Clouds and Trace Gases Research Infrastructure), EARLINET (European Aerosol Research Lidar Network), E-PROFILE (European Profiling Network), and GRUAN (GCOS Reference Upper-Air Network). The HYGRO19 campaign focused on the characterisation of hygroscopic aerosol growth under ambient atmospheric conditions using three complementary approaches: remote sensing measurements from the RALMO Raman lidar, ground-based in situ measurements from tandem nephelometers, and vertically resolved in situ measurements from COBALD sondes operated alongside RS41 radiosondes (COBALD-RS41). A central objective was to assess the consistency and limitations of the hygroscopicity parameters obtained with these techniques, accounting for their different optical properties, wavelengths, and sampling conditions. Continuous RALMO measurements of aerosol backscatter, temperature, and water vapour mixing ratio also enabled the temporal and vertical variability of aerosol hygroscopicity to be investigated within selected well-mixed layers. Additional aerosol and meteorological observations were used to characterise the atmospheric conditions and support the interpretation of the observed hygroscopic behaviour. The experimental station is located in a rural area of the Swiss Plateau, between the Jura Mountains (25 km to the Northwest) and the Alpine foothills (20 km to the Southeast). The site is characterised by a mid latitude continental climate with some influence of long-range transported pollution (Navas-Guzmán et al., 2019).
2.2 The RALMO Raman lidar system
The RAman Lidar for Meteorological Observations (RALMO) system is a custom-designed instrument developed by the Swiss Federal Institute of Technology (EPFL) in collaboration with MeteoSwiss. It has been operating in the Payerne station since August 2008 and joined EARLINET the same year. The RALMO system uses a Nd:YAG laser source that emits pulses at 355 nm (400 mJ), with a repetition rate of 30 Hz and a pulse duration of 8 ns. Before the laser emits to the atmosphere it is expanded to a diameter of 14 cm to reduce beam divergence (to 0.1 mrad). The receiving system consists of four telescopes with 30 cm parabolic mirrors symmetrically arranged with the vertically mounted beam expander to collect the backscattered photons, giving a field of views (FOV) of 0.2 mrad. These characteristics enable RALMO to operate during both daytime and nighttime. Optical fibres connect the telescope mirrors to two grating polychromators, which isolate the rotational-vibrational (VR) and pure-rotational (RR) signals. A detailed description of RALMO can be found in Dinoev et al. (2013).
The system optimises its operability in the incomplete overlap region because the Raman backscatter is excited by a single monochromatic beam and the designed reflective-type lidar telescopes minimise chromatic aberrations. Moreover, the fibre-coupled diffraction grating-based polychromator further reduces uncertainties induced by range-dependent optical imperfections of the lidar receiver to a negligible level (Dinoev et al., 2013). The water vapour mixing ratio is computed from VR measurements of nitrogen and water vapour at wavelengths of 386.7 and 407.5 nm. The accuracy of RALMO water vapour measurements has been validated by Brocard et al. (2013), showing good agreement with radiosonde observations and integrated water vapour retrieved from the Global Positioning System (GPS) and MWR.
Temperature measurements with RALMO are obtained using four sections of the RR Raman spectrum around 355 nm, which relies on the rotational Raman scattering of oxygen and nitrogen molecules. The RR signal is separated from the elastic (Rayleigh and Mie) scattering using a two-stage temperature polychromator, which isolates specific rotational Raman lines while guiding the elastic signal through optical fibres to the detector. High-efficiency parabolic mirrors collect the signals, which are then filtered, fibre-coupled, and diffracted by a reflective holographic grating to resolve Stokes and anti-Stokes lines from different rotational quantum numbers. This configuration enables accurate and stable retrieval of atmospheric temperature profiles. Further details and a complete validation of the RALMO temperature channel are provided by Martucci et al. (2021). The system also registers the backscattered signal at 355 nm backscattered signal, which combined with one RR measurement allows the retrieval of independent aerosol backscatter and extinction measurements (Veselovskii et al., 2015).
For water vapour, nitrogen, and oxygen, the interference filters are centred at 407.5, 386.7 and 375.4 nm, respectively, each with a full width at half maximum (FWHM) of 0.33 nm. This configuration ensures minimal temperature sensitivity of the Raman scattering signal, with a relative change in transmitted intensity of 0.4 % per 100 K (Dinoev et al., 2013), in agreement with values reported in the literature (Whiteman, 2003). It also minimises spectral differences between the laser emission and Raman channels (Veselovskii et al., 2013, 2015).
2.3 The COBALD-RS41 sondes
COBALD is a lightweight (500 g) aerosol backscatter detector for balloon-borne measurements developed at the Swiss Federal Institute of Technology (ETH Zürich) based on the original prototype by Rosen and Kjome (1991). Using two light-emitting diodes (LEDs) as light sources and a photodiode detector with FOV of 6°, COBALD provides aerosol backscatter at 455 and 940 nm with an accuracy of 5 % and a precision of 1 % for both channels, and temporal and spatial resolutions of 1 s and 5 m, respectively (Vernier et al., 2015). During the HYGRO19 field campaign, COBALD was combined with an additional meteorological radiosonde (RS41, Vaisala) to obtain measurements of temperature, pressure, and relative humidity. The RS41 sonde specifications for nominal measurement uncertainties, as provided by the manufacturer, are 0.3 °C for temperature below 16 km and 0.4 °C above that altitude, 0.01 hPa (decreasing with altitude) for pressure, and 4 % RH (Vaisala, 2017).
The COBALD measurements are typically expressed as the backscatter ratio (BSR, Eq. 1), defined as the ratio of the total measured signal (normalised to the altitude-dependent LED power) to its molecular contribution (Brunamonti et al., 2021). The molecular contribution is computed following Bucholtz (1995) using the atmospheric number density of molecules derived from the collocated RS (Cirisan et al., 2014). A molecular extinction-to-backscatter ratio of sr is assumed.
During the HYGRO19 field campaign, the COBALD–RS41 sonde was used to obtain vertically resolved in situ observations of aerosol hygroscopicity parameters, providing the reference measurements for direct comparison with those retrieved from RALMO. However, the COBALD and RALMO systems differ in receiver FOV (0.01° for RALMO), which results in systematic differences in backscatter measurements that are corrected using Mie scattering simulations (Brunamonti et al., 2021).
2.4 The tandem nephelometers
The tandem nephelometers consisted of two integrating nephelometers operating in parallel and measuring the same air sample. One instrument operated at RH lower than 40 % (dry conditions), whereas the second was equipped with a humidification system allowing measurements at different RH conditions from 40 % to 90 % (wet conditions) (Titos et al., 2014a). The dry scattering coefficients () were measured using an Ecotech Aurora 3000 nephelometer at three wavelengths (450, 525, and 635 nm) with a 1 min sampling interval. The scattering coefficients under wet conditions were measured using a TSI 3563 integrating nephelometer at 450, 550, and 700 nm, recording data every 1 min. The nephelometer data were corrected to account for angular truncation errors and instrument non-idealities, following the method of Anderson and Ogren (1998) for the TSI instrument and Müller et al. (2011) for the Ecotech nephelometer. The setup consisted of a 30 min cycle beginning with a baseline (zero) measurement, followed by gradual increases of RH up to approximately 85 %–90 %. For the computations of the hygroscopicity parameters, the dry scattering coefficient measured at 525 nm by the Ecotech instrument was corrected to 550 nm using the Ångström exponent (Ångström, 1929).
2.5 Complementary instrumentation
During the HYGRO19 campaign, complementary instruments were also employed to provide a comprehensive characterisation of aerosols. Continuous measurements of aerosol optical depth (AOD) and column-integrated extinction Ångström exponent (AOD-AE) were obtained from an AERONET sun photometer (SP) operating at Payerne since 2000 (Level 2 Version 3, Giles et al., 2019). The station is also part of the European E‑PROFILE network (Haefele et al., 2016) since 2008 and operates a CHM15k ceilometer (Lufft) emitting at 1064 nm, which continuously records aerosol attenuated backscatter. Furthermore, within the framework of E‑PROFILE, a Doppler wind lidar profiler operates to measure horizontal and vertical wind components every 10 min, typically covering altitudes from 150 m to about 5 km above ground level (a.g.l.) (Nowak, 2008).
Ground-based in situ measurements included an Aethalometer (AE31), operated by the Centre for Energy and Environmental Sciences at the Paul Scherrer Institute (PSI), capable of providing aerosol absorption coefficients (σab) at seven wavelengths (from 370 to 950 nm). The Aethalometer can also estimate equivalent black carbon (EBC) concentrations using wavelength-dependent mass absorption cross sections (Petzold et al., 2013). Data processing followed Global Atmosphere Watch (GAW)/ACTRIS recommendations, including corrections for filter-loading and multiple-scattering effects and was harmonised as described in Zanatta et al. (2016).
Additional in situ measurements of aerosol properties were conducted by the Swiss Federal Laboratories for Materials Science and Technology (EMPA) as part of the NABEL (National Air Pollution Monitoring Network) programme (EMPA, 2025). Particle mass concentrations of PM2.5 and PM10 were determined in real time with a Fidas 200 optical aerosol spectrometer and corrected versus gravimetric reference data (Hüglin and Schwarzenbach, 2016). Elemental carbon (EC) in PM2.5 was obtained in the laboratory from PM2.5 filter samples using a thermal optical EC analyser (Sunset Laboratory Inc.) following the EUSAAR2 protocol (Cavalli et al., 2010). The concentrations of sulphate (SO) and nitrate (NO) in PM10 were determined from PM10 filter samples using ion chromatography (Hüglin et al., 2024). Ammonium (NH) was estimated assuming complete neutralisation of sulphate and nitrate (Jones et al., 2021; Liu et al., 2021), and organic matter (OM) was derived from PM mass closure (PM = inorganic species + black carbon (BC) + OM). Furthermore, total carbon (TC) concentrations were obtained using the novel FATCAT (Fast Thermal Carbon Totalizer) system, developed by the University of Applied Sciences and Arts Northwestern Switzerland (FHNW), with a detection limit of 0.16 µg-C (micrograms of carbon) for a sampling interval of 2 h (Keller et al., 2023). Additionally, aerosol size distributions in the range 10 to 487 nm, were measured using a scanning mobility particle sizer (SMPS, TSI 3034) (PSI, Durand et al., 2023).
3.1 Aerosol optical properties from Raman lidar measurements
The combined use of elastic (Klett, 1981, 1985) and Raman (Ansmann et al., 1990) backscattered signals allows the independent calculation of the aerosol backscatter coefficient (βaer) as described by Ansmann et al. (1990) and Whiteman (2003):
where the sub-index i indicates the Raman molecular species, βmol (z,λL) is the molecular backscatter coefficient, k is the calibration constant, and P (z,λ) is the backscattered signal from range z at either the elastic (λL) or the Raman shifted λi wavelengths. Stokes and anti-Stokes portions of the pure-rotational spectrum with opposite temperature dependence are summed, giving in good approximation a temperature-independent inelastic signal (Dinoev et al., 2013). The RALMO system provide accurate aerosol backscattered and extinction coefficients at 355 nm with a bias of −2 % ± 37 % ( Mm−1 sr−1) compared with COBALD at 455 nm (Brunamonti et al., 2021).
3.2 Water vapour mixing ratio, temperature and relative humidity profiles from Raman lidar measurements
Water vapour mixing ratio (r) is defined as the ratio of the mass of water vapour to the mass of dry air in a sample of the atmosphere (Goldsmith, 1998). Consequently, the ratio (z) (z) is proportional to the water vapour mixing ratio (Whiteman et al., 1992, 2006). Assuming identical overlap factors and the range-independent Raman backscatter cross sections for the two signals, this ratio can be expressed as (Whiteman et al., 2006):
and thus,
where the term represents the backscattered signal ratio, is the ratio of the temperature-dependent functions for the Raman nitrogen and water vapour channels, and K is the instrument calibration constant. For RALMO the calibration constant was determined by combining absolute calibration using collocated radiosondes with relative calibration based on the solar background (Martucci et al., 2018). The passband filter employed in RALMO allows the ratio to be reasonably approximated as 1 (Sect. 3.1), resulting in essentially temperature-independent measurements (Whiteman, 2003).
The exponential term (Eq. 4) accounts for the difference in atmospheric transmission between the nitrogen and water vapour Raman wavelengths, mainly due to the λ−4 dependence of Rayleigh scattering by molecules and an additional contribution from wavelength-dependent Mie scattering by aerosols. Molecular extinction can be estimated assuming US Standard Atmosphere, while the differential aerosol extinction is generally negligible under typical Payerne conditions (Dinoev et al., 2013), though it can reach up to 10 % in hazy conditions (Whiteman, 2003; Díaz-Zurita et al., 2025).
Temperature measurements with RALMO are obtained using RR Raman lidar signals (Martucci et al., 2021), and combining these with water vapour mixing ratio measurements, it is possible to obtain RH profiles following Yau and Rogers (1996):
where e(z) is the water vapour pressure, and ew(z) denotes the saturation vapour pressure. The water vapour pressure is related to the water vapour mixing ratio through:
where p(z) represents the air pressure profile, estimated from the closest RS41 operational at Payerne. The saturation vapour pressure ew(z) is computed using the empirical formulation:
where the constants MA and MB are 17.08 and 234.2, for temperature above 273 K (List, 1951). RALMO relative humidity profiles have been validated against collocated RS41 radiosondes (Navas-Guzmán et al., 2019; Martucci et al., 2021), demonstrating strong performance. These capabilities make RALMO one of the few instruments worldwide capable of providing continuous daytime and nighttime profiles of water vapour mixing ratio, temperature, and relative humidity.
3.3 Aerosol hygroscopicity with tandem nephelometers
Aerosol hygroscopicity refers to the equilibrium water content of water-soluble particulate matter at RH below 100 % and, thereby altering particle size, shape and optical properties. Particularly, the impact of hygroscopic growth on aerosol optical properties is commonly studied using the enhancement factor, fζ (RH), defined by Hänel (1976):
where ζ(λ,RH) denotes an optical or microphysical aerosol property at RH, while the reference value, RHref, corresponds to the lowest value within the analysed layer or time interval.
In the case of laboratory measurements, when RH can be controlled, the scattering enhancement factor can be determined using two instruments that measure the same aerosol optical property, such as the aerosol scattering coefficient. One instrument operates at RH below 40 % (dry conditions), whereas the second is equipped with a humidification system that enables measurements over an RH range from 40 % to 90 % (wet conditions). This configuration, known as a tandem nephelometer (Titos et al., 2014a), allows the scattering enhancement factor to be determined using the following two-parameter equation (Clarke et al., 2002; Carrico et al., 2003):
where a is the value at RH = 0 % and γσ is the Hänel parameter characterising the magnitude of hygroscopic growth for the scattering enhancement. In the case of laboratory measurements, different RH ranges can be controlled, allowing measurements over a wide RH range from 40 % to 90 %. This enables a more robust determination of a through linear fitting. Moreover, the use of the same measurement approach at different sites allows a direct intercomparison of the scattering enhancement factor fσ ( %). Hereafter, fσ(λ) for simplicity.
3.4 Aerosol hygroscopicity with lidar measurements
For lidar measurements, the aerosol optical parameter used to study aerosol hygroscopicity is the aerosol backscatter coefficient (βaer) and the backscatter enhancement factor is described as Veselovskii et al. (2009):
In the particular case of the RALMO system, the Hänel parameter (γβ) can only be obtained at 355 nm. Since ambient RH cannot be controlled, it must be ensured that changes in aerosol optical properties are solely related to changes in RH. This is achieved by assuming a well-mixed atmospheric layer that typically occurs when water vapour mixing ratio and potential temperature profiles remain nearly constant with altitude (Feingold and Morley, 2003). Additionally, following Navas-Guzmán et al. (2019), potential changes in air-mass origin with altitude should be assessed using backward trajectories as complementary information to the thermodynamic profiles. When these conditions are fulfilled, RHref is selected as the point with the lowest RH, typically corresponding to the lowest altitude, as RH and βaer increase simultaneously with altitude (Veselovskii et al., 2009). Consequently, humidograms (fζ(RH) versus RH) can be computed, and the Hänel parameter is obtained as the slope of the linear fit between the natural logarithms of βaer and RH. Note that, for comparison with tandem nephelometers and previous studies, the backscatter enhancement factor is extrapolated or interpolated to the 40 %–85 % range (fβ ( %)), depending on the measured RH range. In the following, it is denoted as fβ(λ).
It should be highlighted that the Hänel parameter may depend on the aerosol optical property for its computation. Consequently, γ values derived from aerosol backscatter measurements are not directly comparable to those obtained from total scattering measurements from tandem nephelometers. Moreover, the spectral dependence of hygroscopic growth can vary with particle size, as shown by Mie simulations in previous studies (Zieger et al., 2013; Navas-Guzmán et al., 2019). Therefore, the enhancement factor for the same RH may differ between wavelengths and particle sizes, which further complicates comparisons between the different techniques. In addition, uncertainties associated with the retrieval of aerosol hygroscopicity parameters should also be considered. In the case of lidar-derived parameters, these uncertainties can reach up to 20 % for RH uncertainties below 10 % (Pérez-Ramírez et al., 2021).
4.1 Overview of the HYGRO19 field campaign
Continuous measurements of AOD and extinction AE (AOD-AE) obtained from the AERONET sun photometer during the HYGRO19 campaign in Payerne were analysed to characterise the columnar aerosol properties (Fig. 1). Two clearly different periods were identified: the first, from June to August, characterised by relatively high aerosol loading, and the second, from September to December, dominated by low-pressure systems, persistent cloudiness, and lower aerosol concentrations (MeteoSwiss, 2026b). During the first period, a large number of measurements were available, with a median AOD (500 nm) of 0.24 ± 0.09, where the uncertainty is expressed as half of the interquartile range (IQR/2 = (Q3–Q1)/2)). Fine-mode particles predominated, as indicated by the median AOD-AE (440–870 nm) value of 1.50 ± 0.19. Backward trajectory analyses using the HYSPLIT model (not shown) revealed that most air masses originated over mainland Europe, a major source of anthropogenic aerosols. However, on 26 and 27 June, an event influenced by North African air masses was observed, with high aerosol load (AOD (500 nm) up to 0.3) and low AOD-AE (reaching 0.4), typical of long-range transport of Saharan dust. In contrast, fewer measurements were available during the second period. The median AOD (500 nm) and AOD-AE (440–870 nm) values were 0.07 ± 0.02 and 1.15 ± 0.13, respectively, characteristic of continental background aerosol.
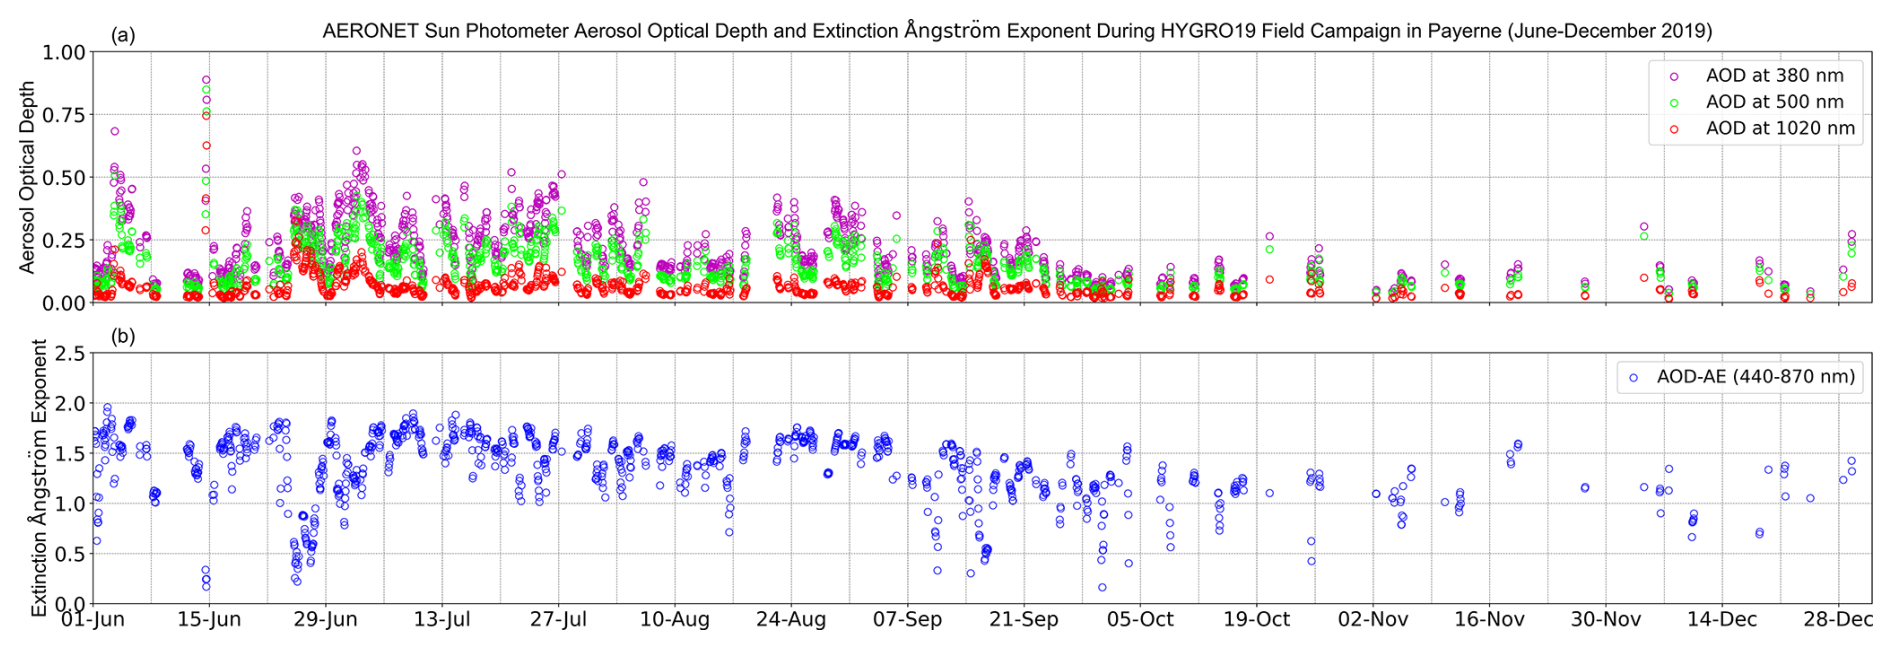
Figure 1Hourly time series of AERONET observations during the HYGRO19 campaign from June–December 2019: (a) aerosol optical depth (AOD) at 380, 500, and 1020 nm, and (b) extinction Ångström exponent (AOD-AE (440–870 nm)).
Figure 2 shows the temporal evolution of in situ ground-based measurements of aerosol scattering (σsp, a) and absorption (σab, c) coefficients at different wavelengths, scattering Ångström exponent (SAE, b), absorption Ångström exponent (AAE, d), single scattering albedo (SSA, e), particulate matter (f), and chemical composition (g–h). Data are hourly values, except for TC concentrations and chemical compositions that correspond to 2-hourly and daily measurements, respectively (panels g and h). Unfortunately, during the HYGRO19 campaign, data from the Aurora dry nephelometer and the Aethalometer AE31 were available only since 6–8 August (a–e, g), whereas FATCAT data date since 27 July 2019 (g). The main statistical parameter for the entire campaign, as well as for the first and second periods separately, are summarised in Table 1.
During the campaign, the temporal evolution of the scattering coefficient (Fig. 2a) shows remarkable day-to-day variability, with values ranging from 0.97 to 206 Mm−1, and median values of 28 ± 21 Mm−1 and 19 ± 14 Mm−1 at 450 and 550 nm, respectively. Several intense events with higher scattering coefficients values were observed between 21 August and 21 September, 17 October and 1, 9, 26, 30 November and 7 December 2019, coinciding with increases in aerosol loading (Fig. 1) and particulate matter (Fig. 2f). Concurrently, the analysis of the SAE (450–635 nm, Fig. 2b) suggests a predominance of fine particles (SAE ), although some outliers are observed. Separately, the AERONET AOD-AE measurements (Fig. 1b) also suggest a general predominance of fine particles in the atmospheric column, with a median AOD-AE (440–870 nm) value of 1.46 ± 0.21 for the entire campaign. These observations refer to different temporal coverage and sampling conditions and should not be interpreted as a quantitative agreement between the two datasets. The predominance of fine particles near the surface is also supported by the small difference observed between PM10 and PM2.5 (PM µg m−3, Fig. 2f). The low PM concentrations (PM10=13.2 µg m−3 and PM2.5=9.2 µg m−3, (Hüglin and Grange, 2021)), characterised by a predominance of fine-mode (PM2.5) over coarse-mode (PM10−2.5) mass, are typical of a rural site such as Payerne. Previous studies have reported that Payerne is usually influenced by local and Swiss Plateau emissions, as well as by the transport of anthropogenic pollution from mainland Europe (Minguillón et al., 2012; Dada et al., 2025). This description provides background information on the site and does not constitute a source attribution for individual episodes during HYGRO19.
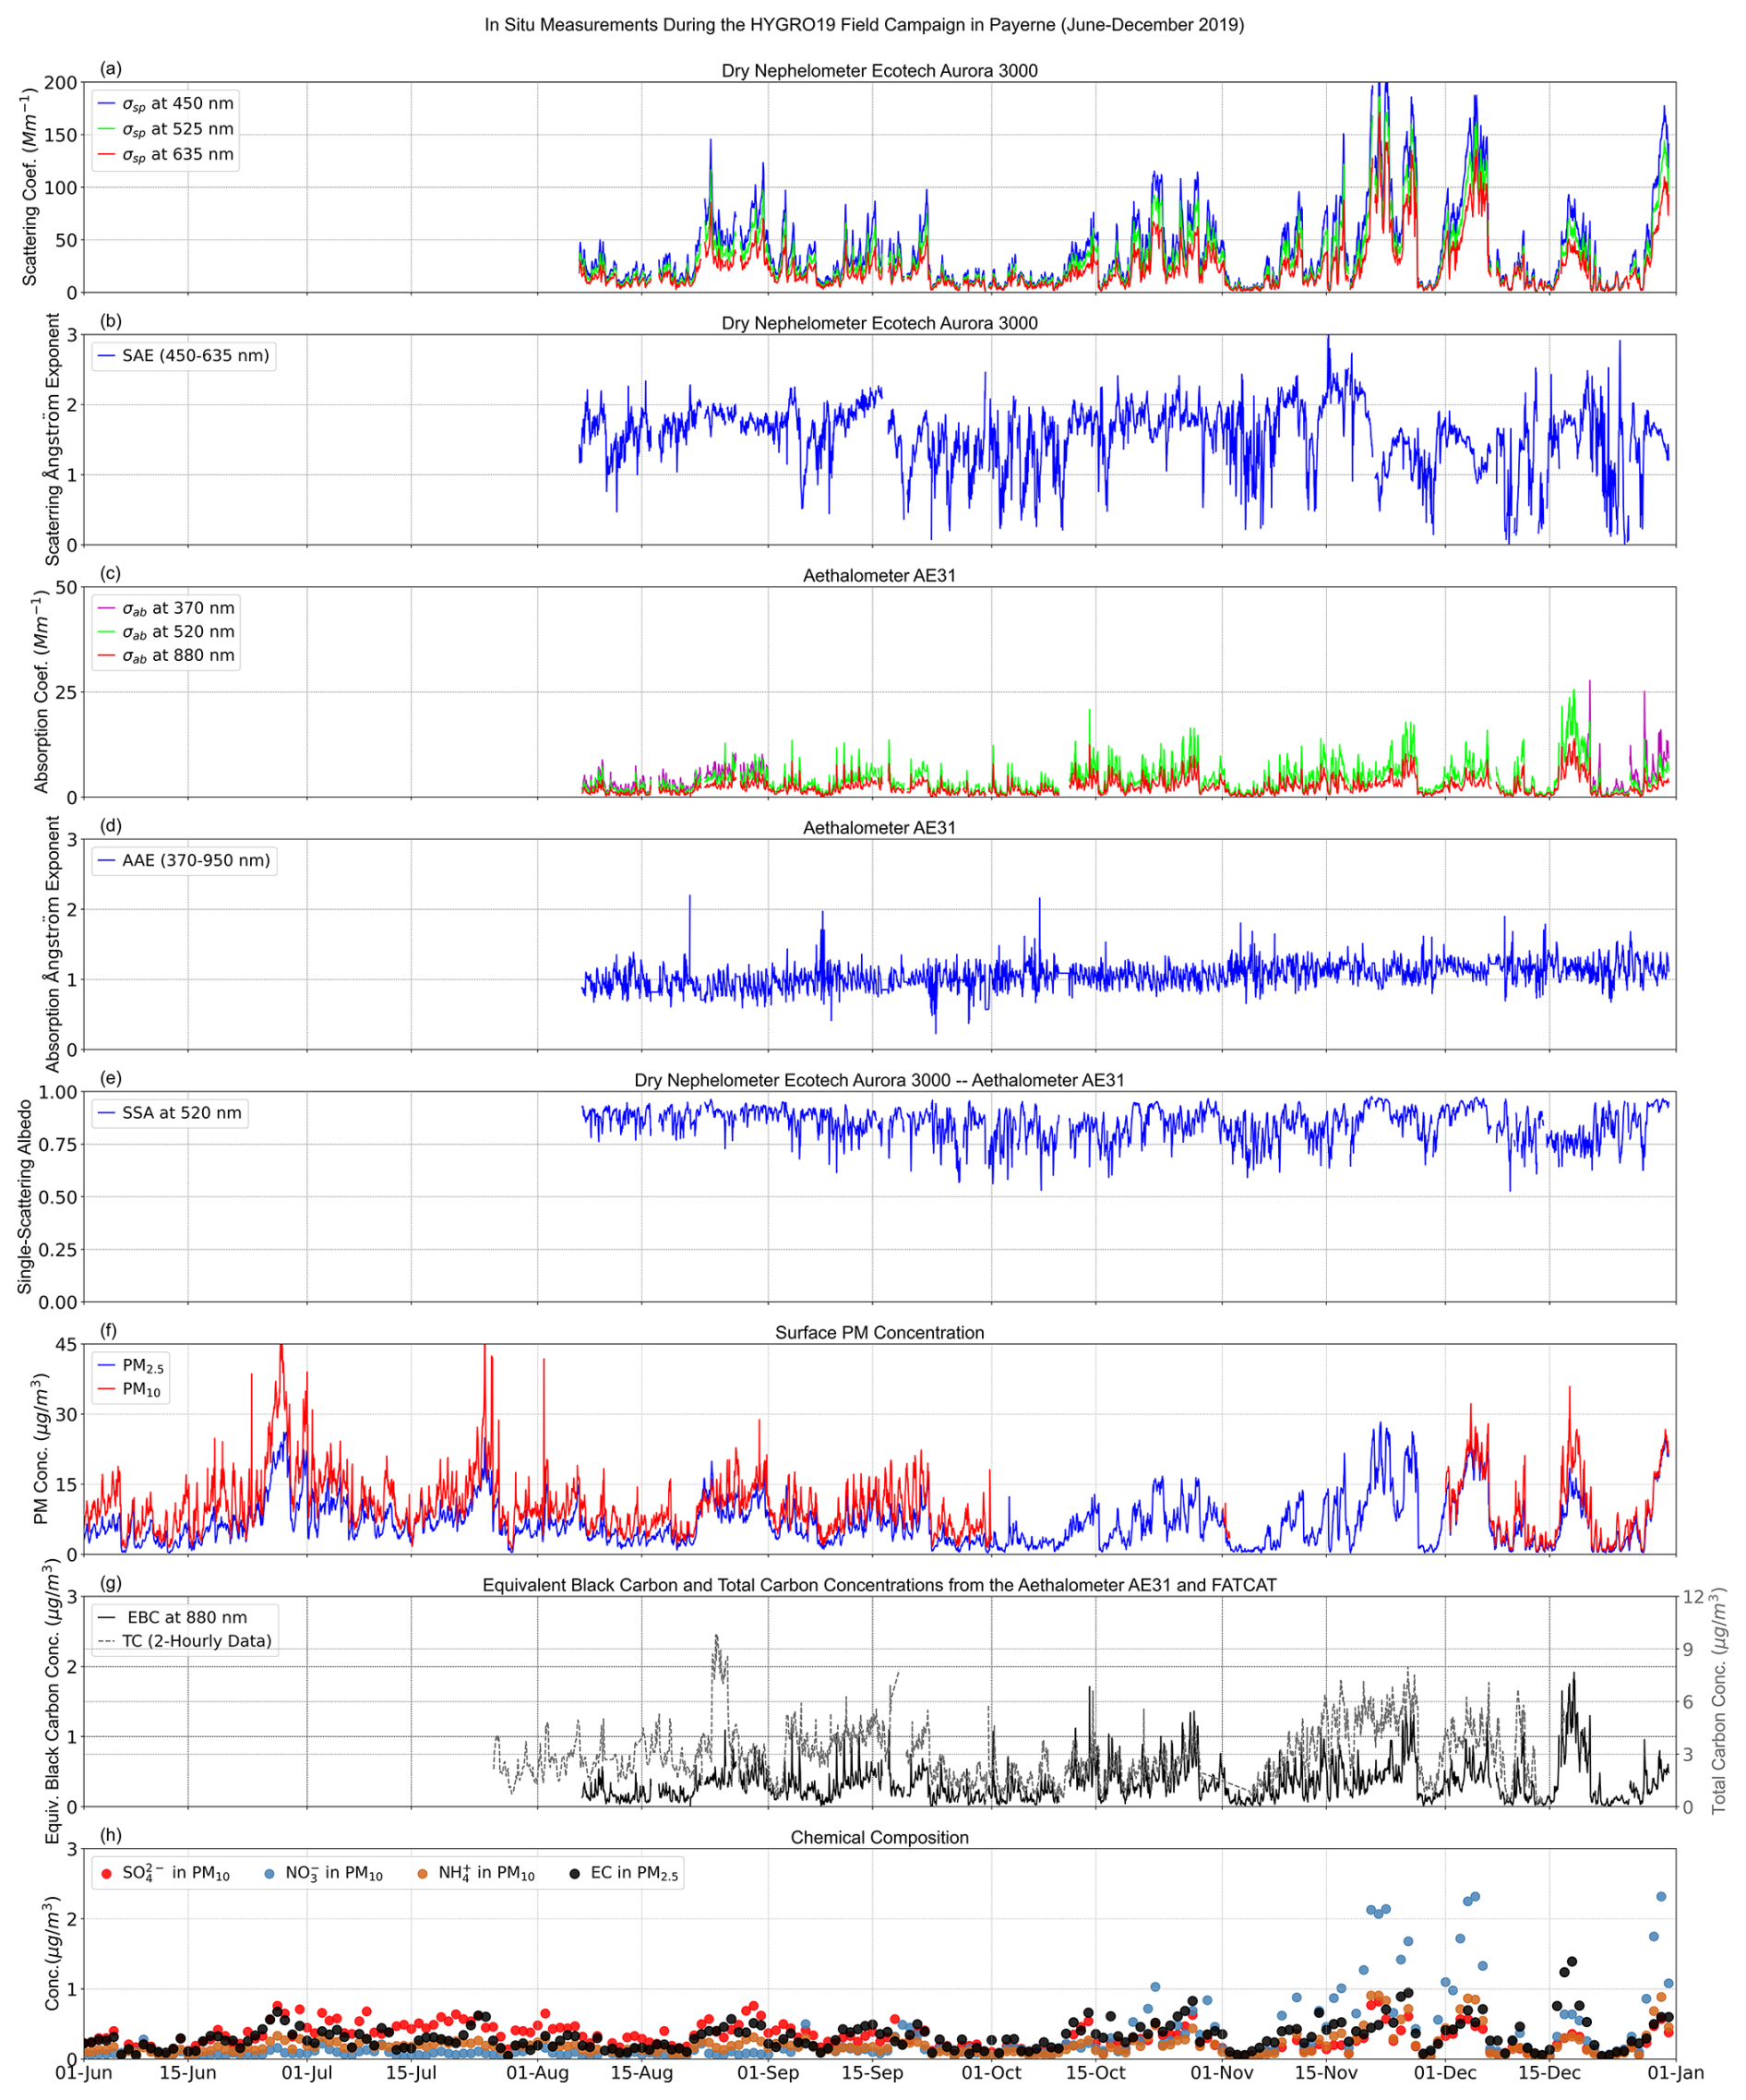
Figure 2Time series of in situ ground-based measurements of (a) aerosol scattering coefficient at 450, 525, and 635 nm and (b) scattering Ångström exponent (SAE (450–635 nm)) from the Aurora 3000 dry nephelometer; (c) absorption coefficient at 370, 520, and 880 nm and (d) absorption Ångström exponent (AAE (370–950 nm)) from the aethalometer AE31; (e) single scattering albedo (SSA (520 nm)) derived from the dry nephelometer and aethalometer data, (f) PM concentrations, (g) equivalent black carbon at 880 nm from the aethalometer and total carbon concentrations from FATCAT; and (h) chemical composition. The data represent hourly mean values, except for TC concentrations and chemical compositions that are 2-hourly and daily measurements.
Table 1Statistical summary of the aerosol scattering and absorption coefficients at 450 and 520 nm, the scattering Ångström exponent (SAE (450–635 nm)) and absorption Ångström exponent coefficient (AAE (370–950 nm)), single scattering albedo (SSA (520 nm)), PM, equivalent and total black carbon concentrations, as well as chemical composition. Note that ammonium was derived assuming complete neutralisation and OM was estimated from PM mass closure.
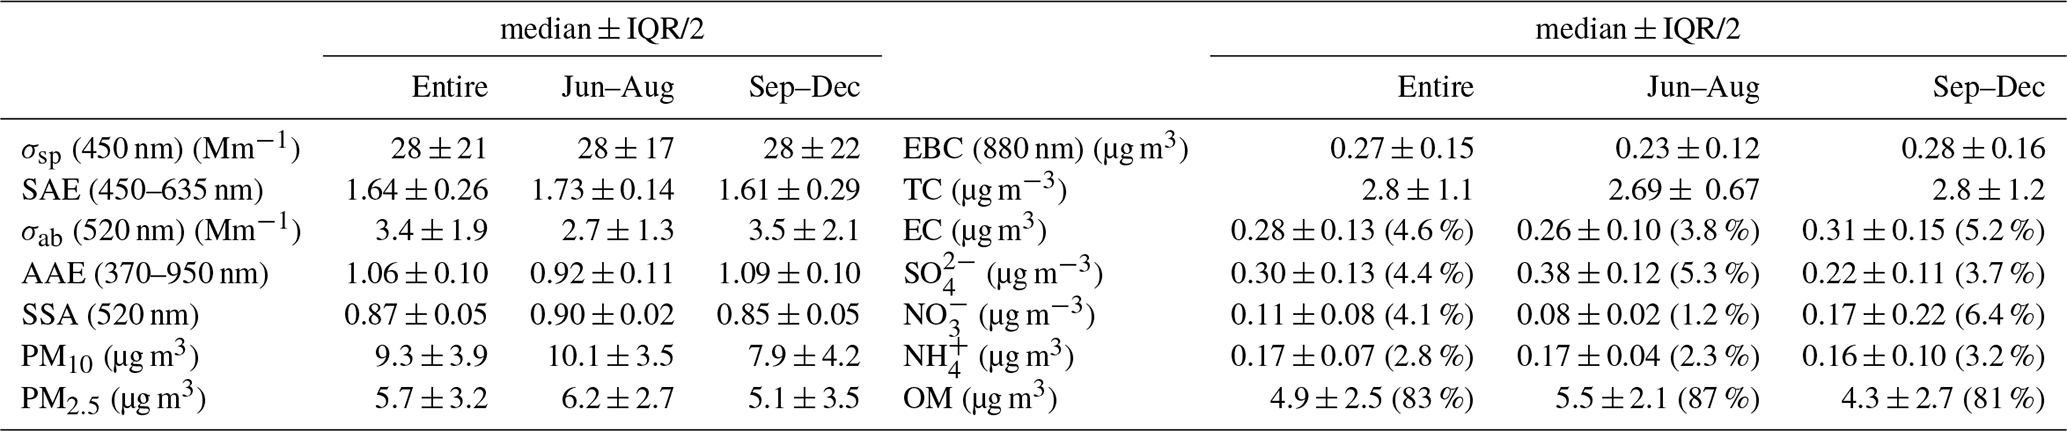
The analysis of the aerosol absorption coefficient (Fig. 2c) exhibits values ranging from 0.06 to 26 Mm−1, with a median of 3.4 ± 1.9 Mm−1 at 520 nm, indicating substantial temporal variability but generally low absorption levels compared with values typically reported for suburban, urban, and traffic sites (Rovira et al., 2025). This is consistent with the single scattering albedo values (SSA (520 nm) , Fig. 2e). However, differences were observed between the two periods, with larger presence of absorbing particles during the second (, SSA and AAE ) than in the first period (, SSA and AAE ). The analysis of carbonaceous measurements further suggests that these changes can be associated with a higher frequency of local wood burning (Fig. 2g–h). Regarding chemical composition (Fig. 2h), inorganic species (sulphate, ammonium, and nitrate) show an important contribution to particulate matter, accounting for 11 %. However, the TC values compared with measured inorganic species and PM2.5 support that organic matter is the main fraction (83 %), which is typically the largest fraction in summer (OM =87 %), compared with the second part of the campaign (OM =81 %). The predominance of organic aerosol and its larger contribution during summer (55 %–60 %) than in winter (30 %–40 %) have also been reported at Payerne (Aksoyoglu et al., 2011; Minguillón et al., 2012; Bozzetti et al., 2016; Hüglin and Grange, 2021; Nowak et al., 2023–2025; Dada et al., 2025).
Figure 3 shows the temporal evolution of vertical profiles of the aerosol backscatter coefficient at 355 nm, temperature, water vapour mixing ratio, relative humidity, and the backscatter enhancement factor (fβ (355 nm)) obtained with the RALMO system during the HYGRO19 campaign. For simplicity, the data are shown only in the lower troposphere (0–6 km a.g.l.). The temporal and spatial resolutions were 30 min and 30 m, respectively. Note that the white regions in the figure correspond to areas where retrievals were not possible due to cloudy conditions.
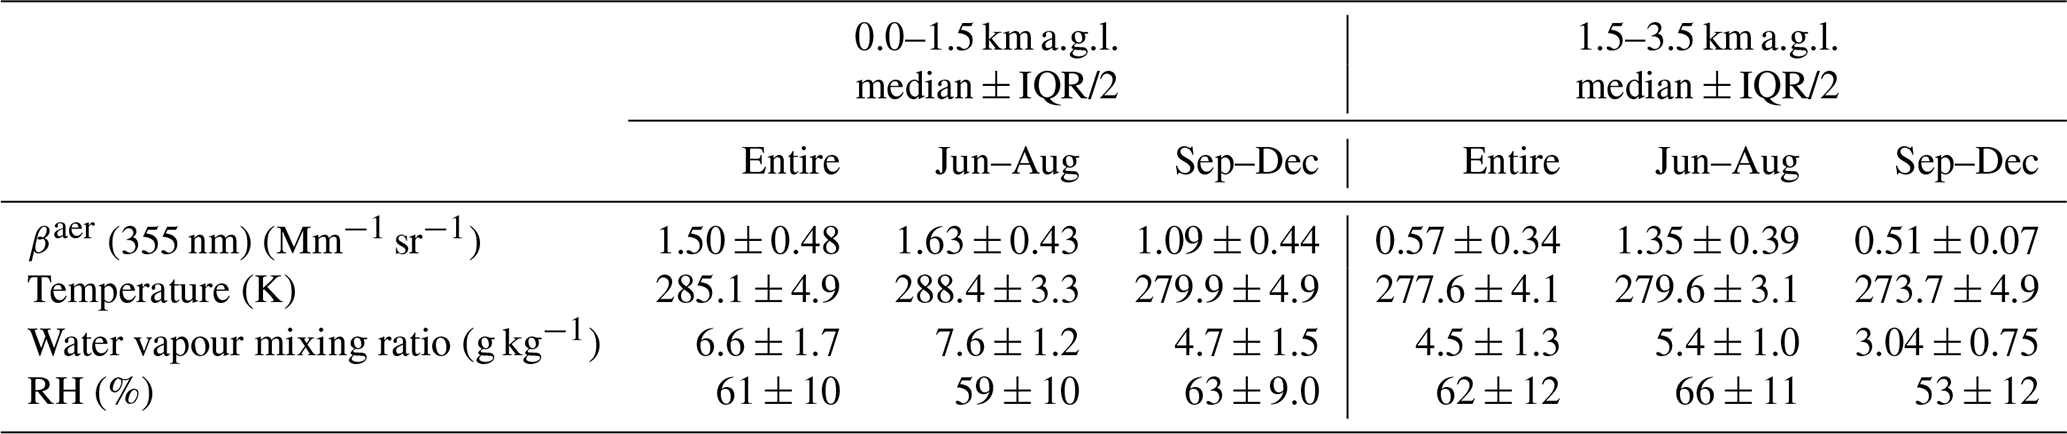
The key result from Fig. 3 is the capability of RALMO to provide continuous daytime and nighttime observations with high temporal and vertical resolution, enabling continuous monitoring of atmospheric vertical profiles and aerosol hygroscopic parameters (panel e). Temperature and water vapour mixing ratio (Fig. 3b–c) show a similar temporal evolution over the campaign period, with higher values in summer and lower values towards winter, and generally decreasing with altitude. Both parameters exhibited higher values during late June to early August, reaching maxima of 305.6 K and 15.2 g kg−1 below 1.5 km a.g.l., respectively. Later, both temperature and water vapour mixing ratio decrease, reaching their minimum values in December. These behaviours correspond to the typical seasonal evolution of atmospheric conditions in Payerne (Bader et al., 2020; Hicks-Jalali et al., 2020). The median and half of the interquartile range of these parameters for the entire period, as well as for the aforementioned sub-periods, are summarised in Table 2. The values are separated below 1.5 km a.g.l. and above that, because aerosol, temperature, and water vapour profiles (Fig. 3a–c) reveal the highest values within the first 1.5 km a.g.l. corresponding approximately to the mean atmospheric boundary layer (a.b.l.) height (Collaud Coen et al., 2014).
The analysis of βaer (355 nm) (Fig. 3a) reveals again two very distinct periods. The first corresponds to June–August, when the highest values are observed, while the second period is from September–December and exhibits considerably lower values. This is consistent with the analysis of AERONET measurements (Fig. 1a). During the first period, aerosol is frequently present throughout the entire ABL and even within the free troposphere (FT). However, on some days, aerosol layers are observed above and decoupled from the ABL (e.g. 2–5 and 17–19 July). In the second period, aerosol backscatter is generally lower (Table 2), and aerosol is typically confined below 1.0 km a.g.l., consistent with a lower ABL height (Collaud Coen et al., 2014). However, an episode of relatively enhanced aerosol backscatter extending into the FT is observed around 1 December.
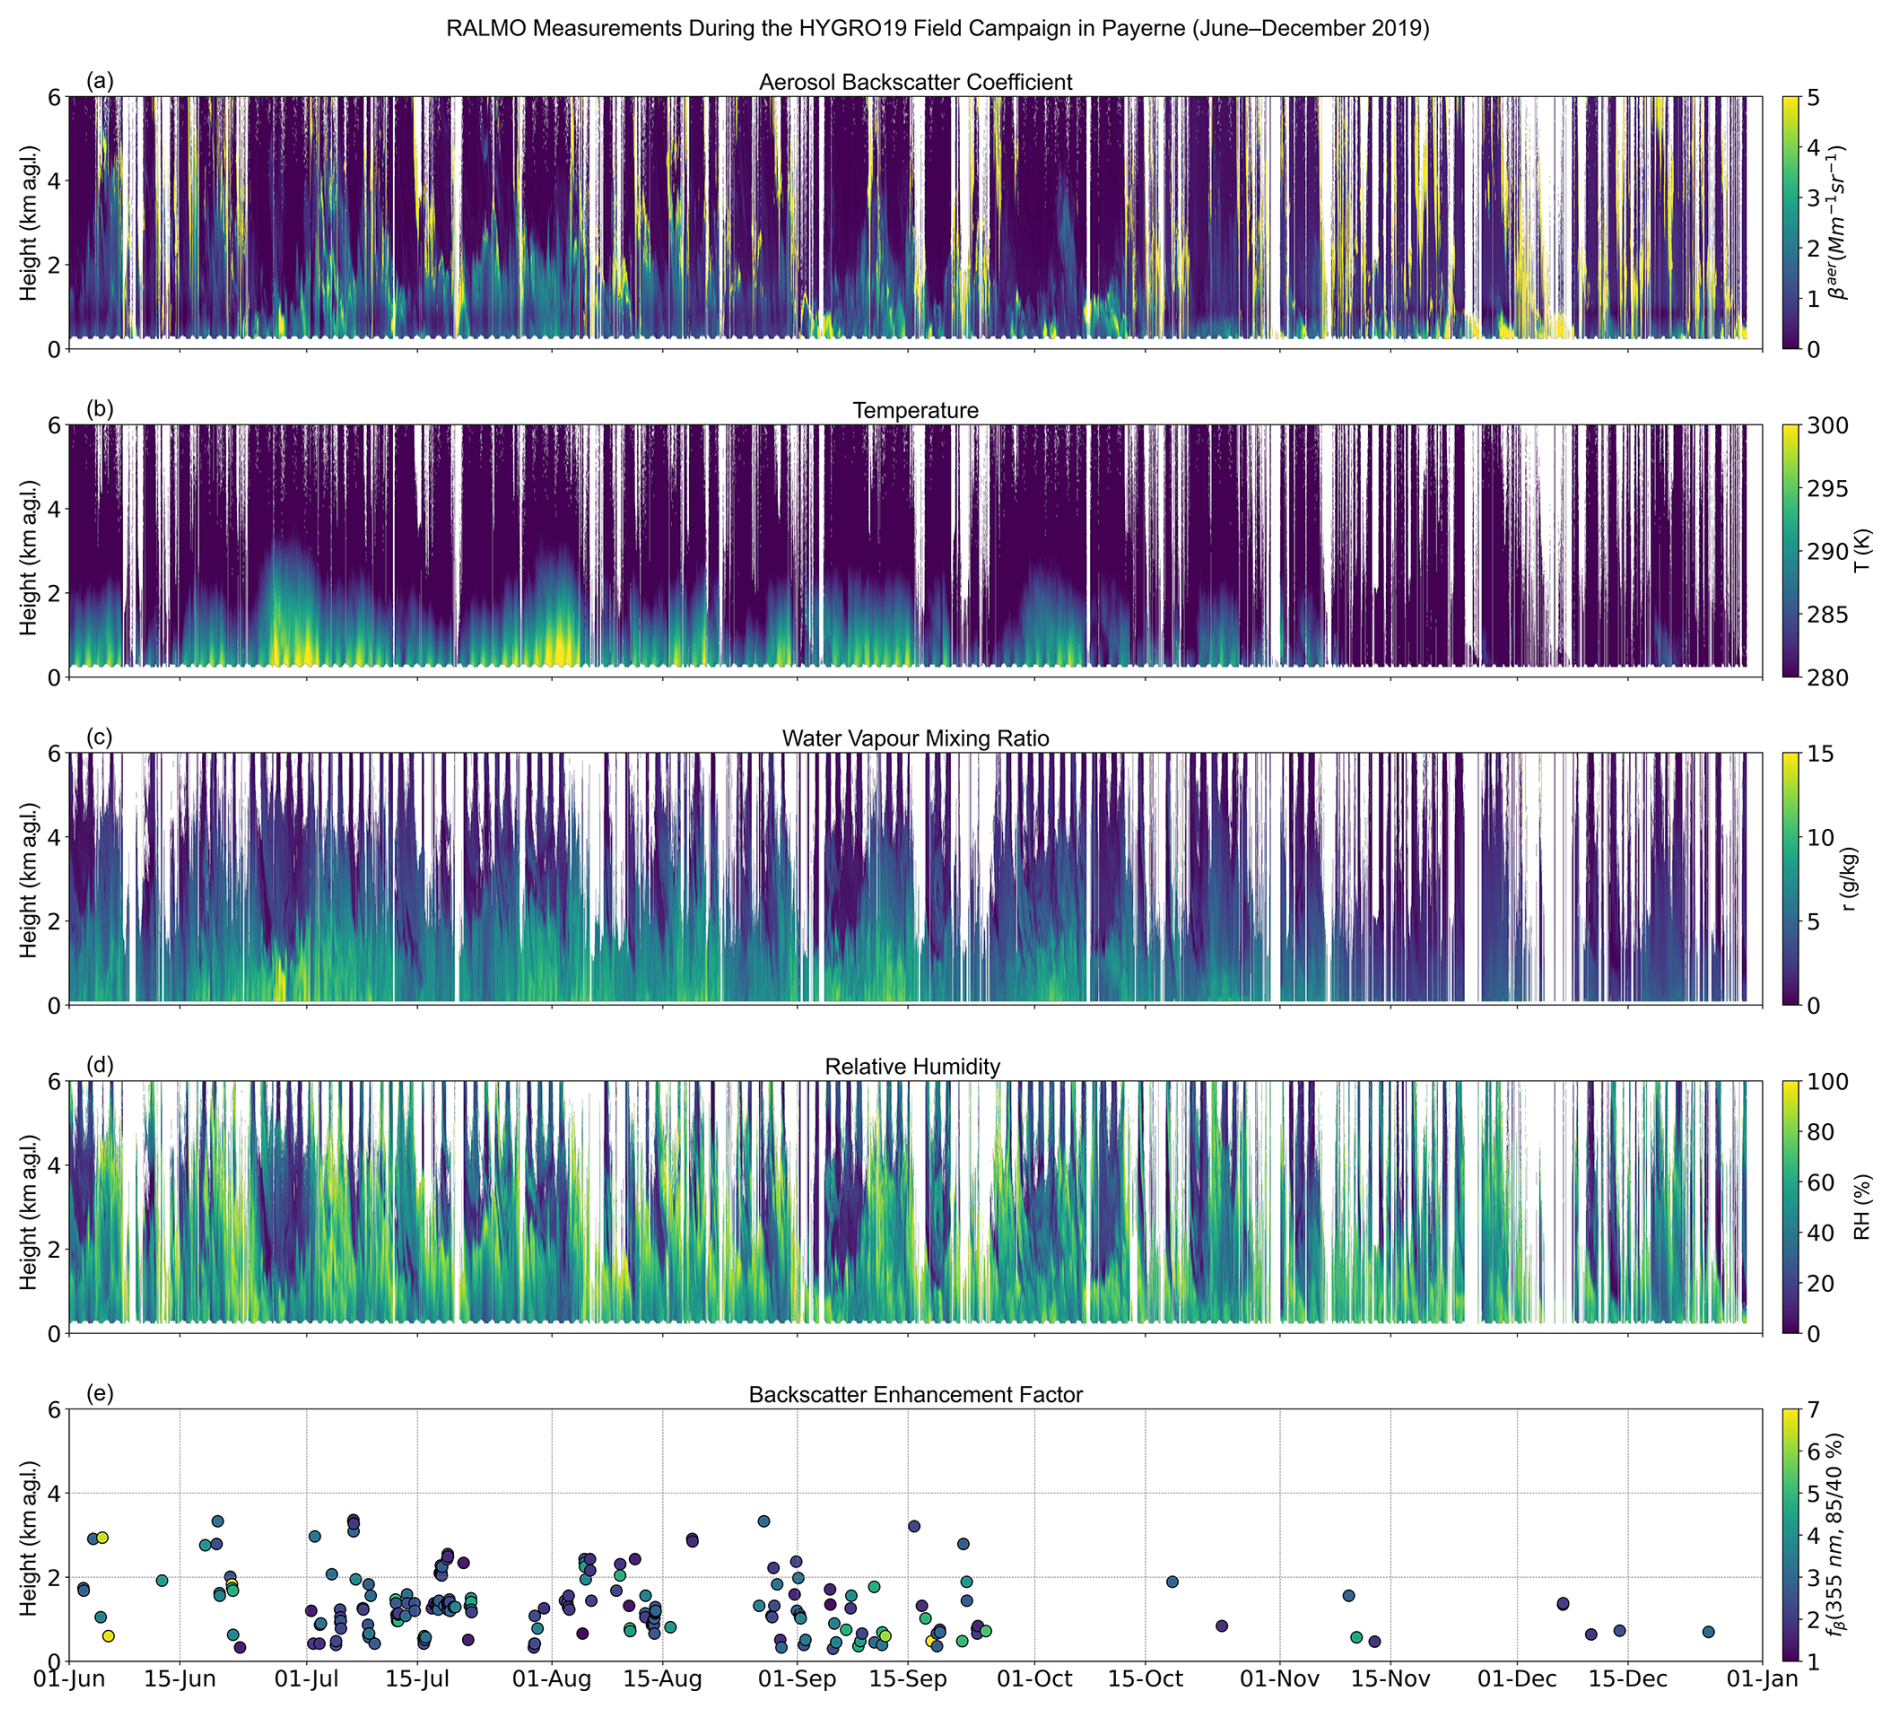
Figure 3Temporal and vertical evolution of RALMO measurements during the HYGRO19 field campaign at the MeteoSwiss station in Payerne from June to December 2019. (a) Aerosol backscatter coefficient at 355 nm, (b) temperature, (c) water vapour mixing ratio, (d) relative humidity, and (e) backscatter enhancement factor at 355 nm and 85 % RH, normalised to 40 % RH.
Table 2Statistical analysis of the aerosol backscatter coefficient, temperature, water vapour mixing ratio, relative humidity retrieved with RALMO during the HYGRO19 campaign at different height ranges.
4.2 Aerosol hygroscopicity analyses using remote sensing techniques
The backscatter enhancement factor retrieved with RALMO (fβ (355 nm)) during the campaign was computed within the layers fulfilling the criteria described in Sect. 3.4. To assess potential changes in air-mass origin with altitude, as reported by Navas-Guzmán et al. (2019), 5 d (120 h) backward trajectories arriving over Payerne were calculated for each investigated hygroscopic aerosol layer using the Hybrid Single-Particle Lagrangian Integrated Trajectory (HYSPLIT model 5.4.0; Stein et al., 2015; Rolph et al., 2017). The trajectory analysis considered arrival times corresponding to the RALMO observations and arrival heights at the lower and upper boundaries of the investigated layers. A detailed comparison of the trajectories arriving at both boundaries is provided in the Supplement (Sect. S1 and Fig. S1). For comparison with parameters derived with others instruments, fβ (355 nm) was interpolated or extrapolated to the 40 %–85 % RH range (Fig. 3e). A total of 227 hygroscopic aerosol growth cases were recorded, with fβ (355 nm) values ranging from 1.2 to 7.2 and a median of 2.64 ± 0.64, corresponding to γβ (355 nm) of 0.70 ± 0.18. Most hygroscopic layers were observed in summer (177 hygroscopic layers, 78 %), whereas only a few cases were detected during October–December, not permitting a robust statistical comparison between the two periods.
Frequency histograms of the fβ (355 nm) and γβ are shown in Fig. 4. To study differences with altitude, two layers were distinguished: one below 1.5 km a.g.l. (orange line in Fig. 4), typically below the ABL, where most aerosol particles are found, and the other one above 1.5 km a.g.l. (red line), generally associated with the FT at the Payerne station. To evaluate whether the differences with altitude are statistically significant, the non-parametric Kruskal-Wallis and Mann–Whitney U tests were applied. The Kruskal-Wallis test determines whether three or more independent groups differ significantly based on ranked data, while the Mann–Whitney U test assesses differences between two independent groups based on ranked observations using the sum of ranks (Chicco et al., 2025).
For the backscatter enhancement factor (Fig. 4a), no significant differences were observed between all data and the different layer base heights (Kruskal-Wallis p-value =0.99 and Mann–Whitney U p-values ≈1.0; at the 95 % confidence level), with the frequency distribution skewed towards values lower than 4.0. The Hänel parameter (Fig. 4b), however, follows an approximately normal frequency distribution, and the differences between layers are small and not statistically significant (Kruskal-Wallis p-value =0.98). In general, the retrieved values indicated significant aerosol hygroscopicity, with 64 % of the cases exhibiting fβ (355 nm) values between 2.0 and 4.0, and γβ (355 nm) values in the range 0.50–0.99. The most frequent hygroscopic aerosol layers were observed below 1.5 km a.g.l., with 162 layers (71.4 %) and retrieved hygroscopicity parameters of fβ (355 nm) and γβ (355 nm) . Layers above 1.5 km a.g.l. were less frequent but exhibited similar hygroscopicity (fβ (355 nm) and γβ (355 nm) ).
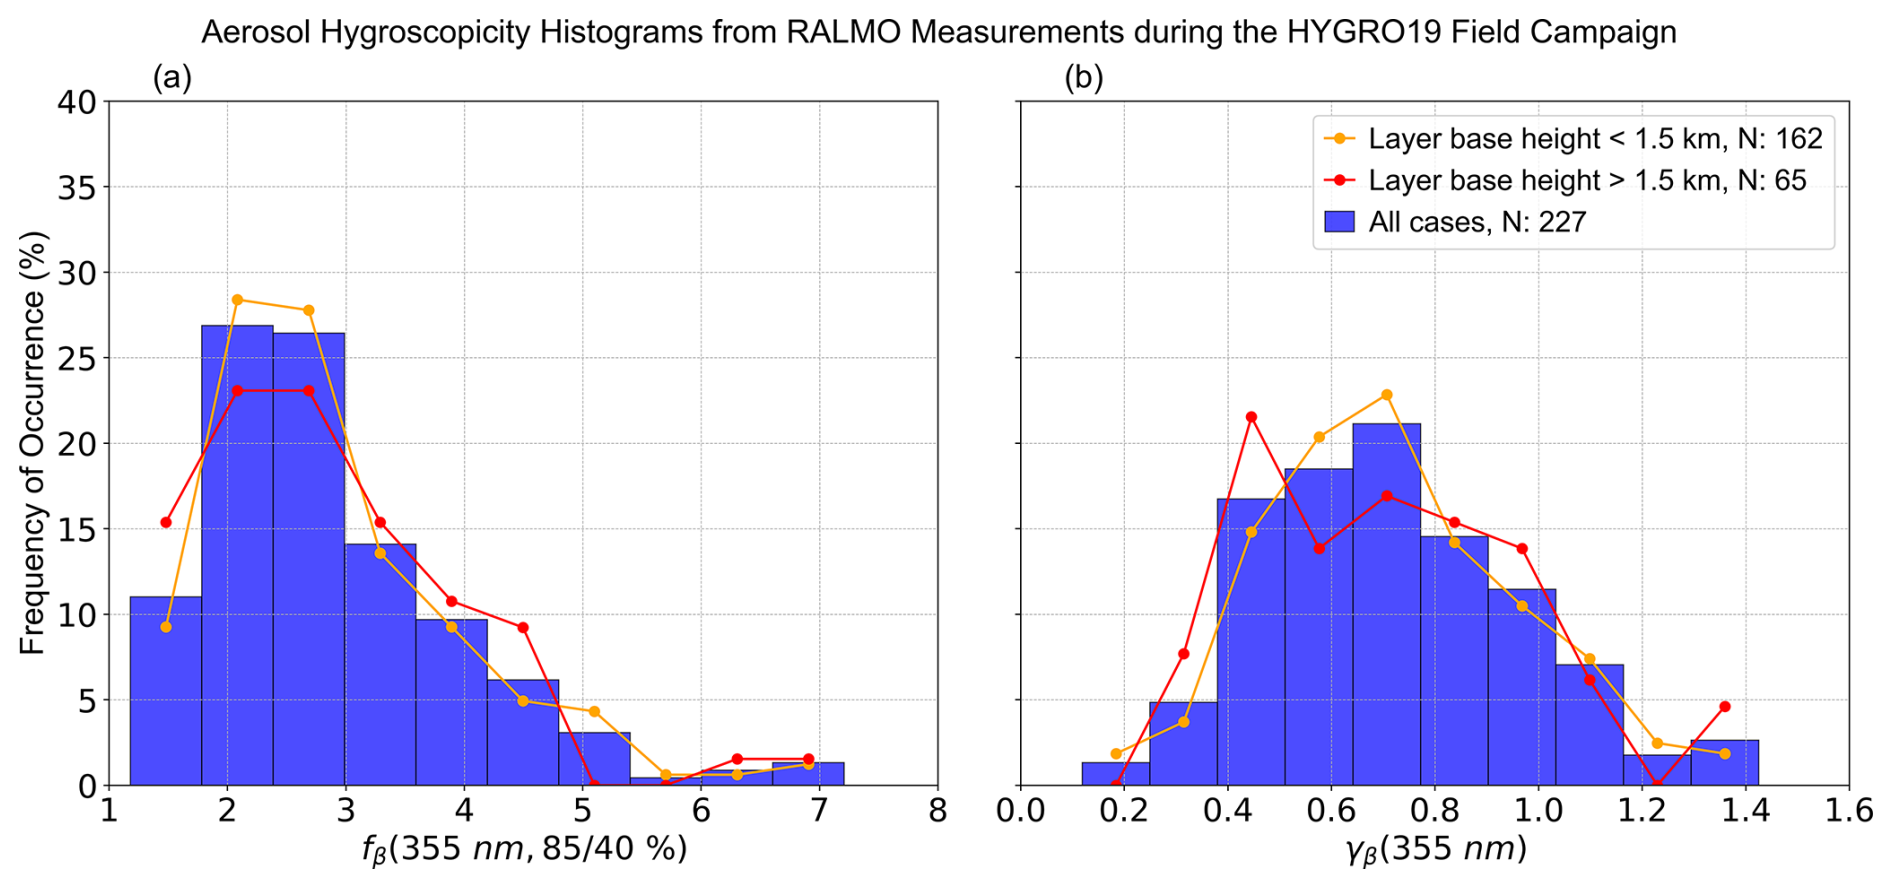
Figure 4Frequency of occurrence of (a) fβ (355 nm, 85 % 40 %) and (b) γβ (355 nm) obtained from RALMO measurements during the HYGRO19 field campaign from June to December 2019. The analysis includes all detected aerosol hygroscopicity layers, as well as cases recorded below and above 1.5 km a.g.l. N represents the number of cases.
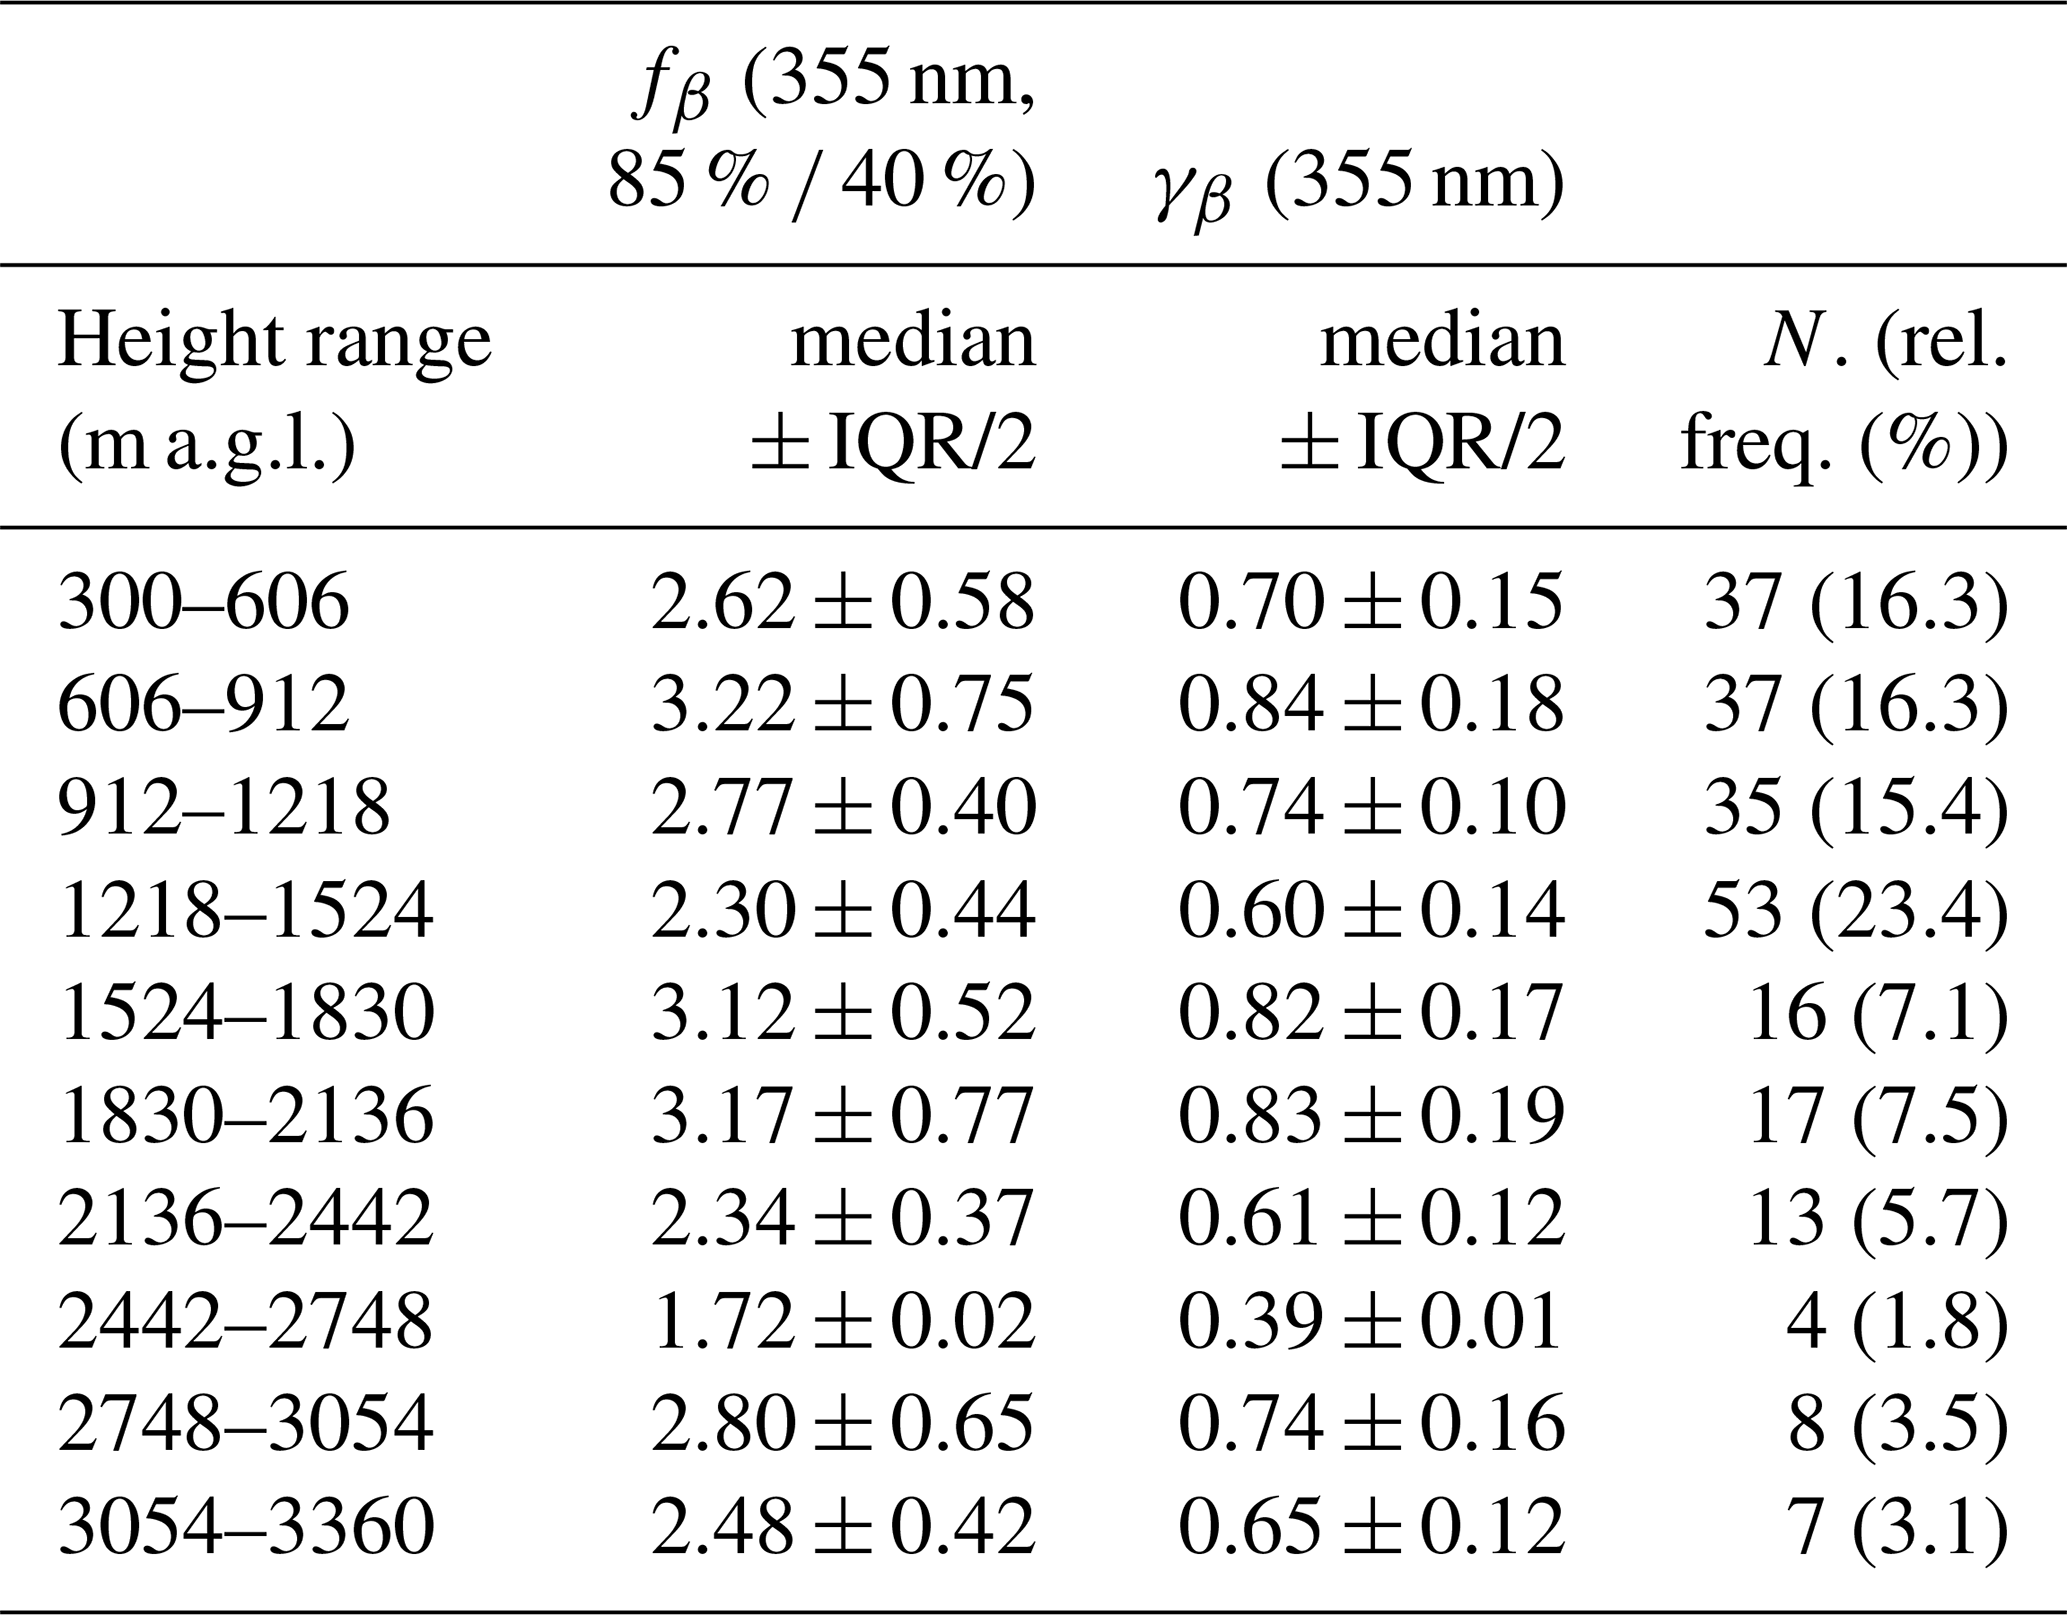
The large database of aerosol hygroscopic cases during the HYGRO19 campaign allows for an investigation of fβ (355 nm) and γβ (355 nm) with height. In this context, Fig. 5 shows box–whisker plots of these parameters for different height ranges, which were determined by optimising the number of bins in the vertical histograms using established statistical rules for histogram bin selection (Doane’s rule Doane, 1976, Rice’s rule Rubia, 2024, and Scott’s normal reference rule Scott, 2010). These methods account for different characteristics of the data distribution, including the number of observations, variability, and skewness. The analyses are also presented separately for the convective boundary layer (CBL), the residual layer (RL), and the FT, using the ABL operational products at Payerne station developed by Collaud Coen et al. (2014). Additionally, the statistical parameters and the frequency of occurrence (rel. freq.) derived are summarised in Table 3.
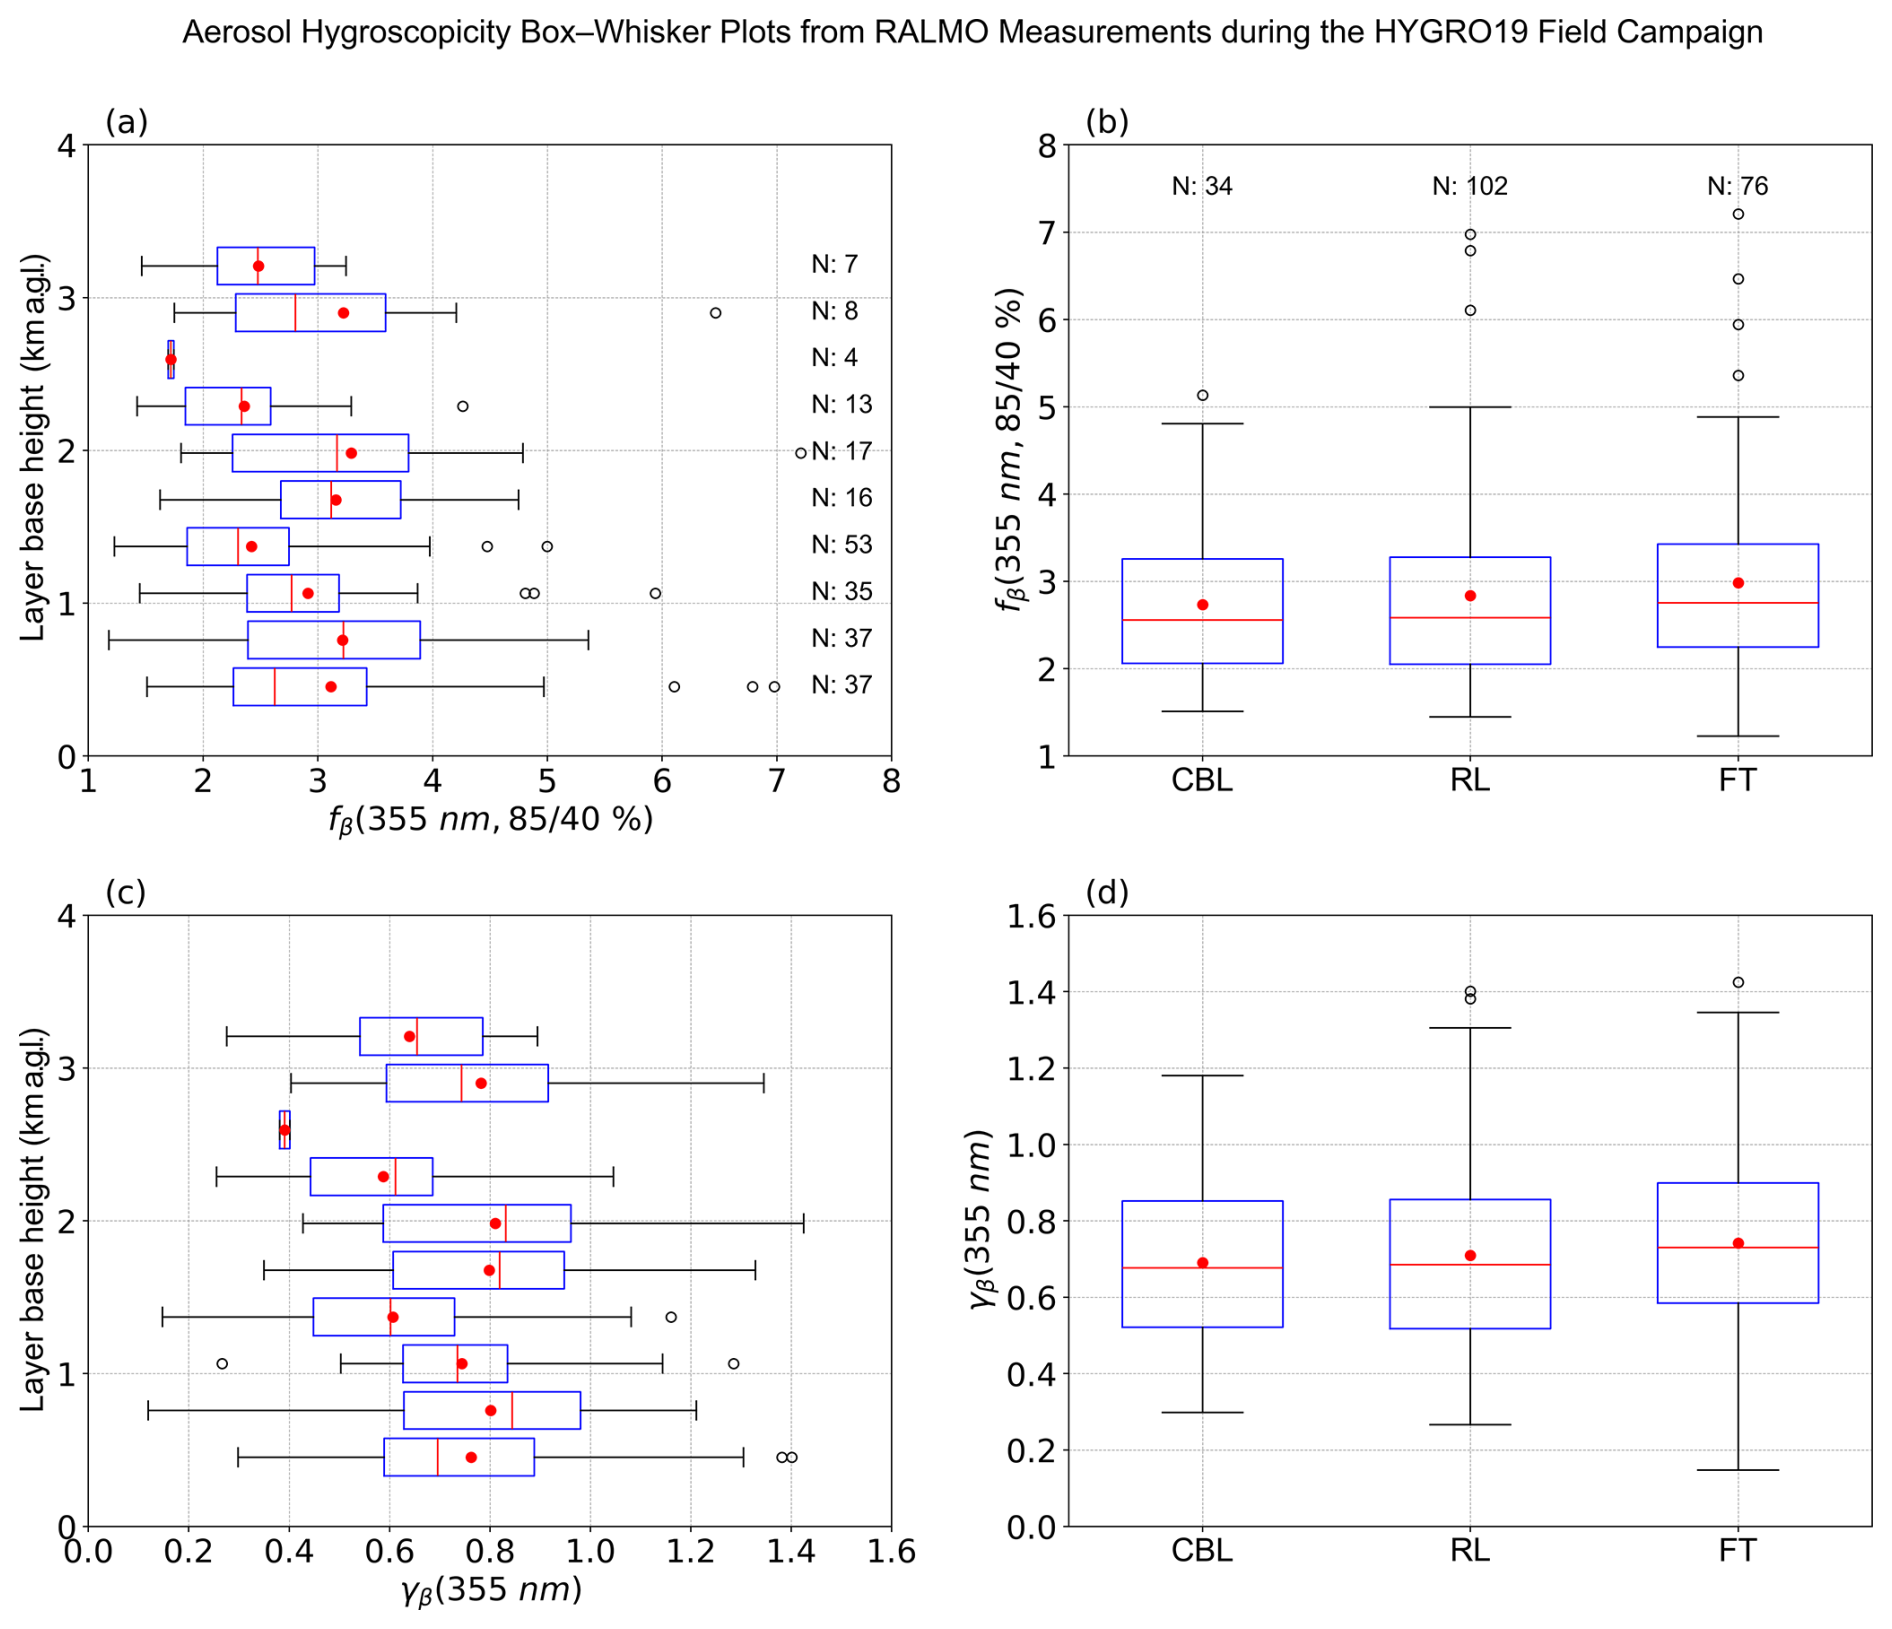
Figure 5Box-whisker plots of (a) fβ (355 nm, 85 % 40 %) and (c) γβ (355 nm) by different height ranges. The analyses are also presented for the CBL, RL, and FT (b, d). In each box plot, the central mark represents the median, the red point indicates the mean, and the box extends vertically from the 25th to the 75th percentiles. N represents the number of cases.
Results from Fig. 5a, c and Table 3 show the vertical variability of aerosol hygroscopicity parameters. In general, some vertical variability is observed, with the highest hygroscopicity parameters found between 606–912 m a.g.l. (fβ (355 nm) 0.75 and γβ (355 nm) 0.18), and between 1830 and 2136 m a.g.l. (fβ (355 nm) 0.77 and γβ (355 nm) 0.19). Some height ranges show appreciable differences (e.g., between 606–912 m a.g.l., and between 1218–1524 m a.g.l.), for which the Mann–Whitney U test yielded a p-value of 0.01. However, the low number of data, particularly for the highest layers, and the range of variability of median values are below 20 %, which is within the uncertainties of the methodology. The most important point to remark is the large variability of the hygroscopicity parameters, as reflected by the large standard deviations and percentile ranges. Grouping fβ (355 nm) and γβ (355 nm) into the CBL, RL and FT (Fig. 5b, d) increases the number of data and makes the statistics more robust. Nevertheless, the analysis did not reveal any significant differences, as the mean, median and percentile values are very similar. Particularly, slightly higher hygroscopicity was observed in the FT (fβ (355 nm) and γβ (355 nm) 0.16), lower values were obtained in the CBL (fβ (355 nm) 0.60 and γβ (355 nm) 0.17) and the highest frequency of occurrence was found in the RL. Overall, these results suggest no clear vertical dependence of aerosol hygroscopicity, and the observed height-dependent patterns should be interpreted with caution, since apparent differences may be amplified by the limited number of observations per layer or by inherent methodological limitations. For instance, the different RH ranges used to compute fβ (355 nm) and γβ (355 nm) in the humidograms (not all experimental cases cover the same minimum-to-maximum RH range), along with uncertainties in RH measurements, can affect the retrieval (Pérez-Ramírez et al., 2021).
Table 3Statistical analysis of hygroscopic aerosol layers retrieved with RALMO during the HYGRO19 campaign at different height ranges.
To further investigate temporal changes in aerosol hygroscopicity, Fig. 6 shows the monthly evolutions of fβ (355 nm) and γβ (355 nm) during the HYGRO19 campaign. Results are presented as box-whisker plots, with the most important statistical parameters summarised in Table 4, which also includes surface chemical composition (Sect. 2.5). Note that chemical composition data are available at daily resolution and correspond to surface measurements, whereas hygroscopicity parameters are derived from RALMO measurements at higher temporal resolution and at different altitudes. These hygroscopicity studies require well-mixed conditions within the analysed layers, which may be decoupled from the surface, particularly when located in the free troposphere. Therefore, thermodynamic homogeneity within a selected layer does not establish that it is mixed with the surface or that its aerosol chemical composition is represented by surface measurements. Additionally, these conditions are met during specific periods and may not persist throughout the day to which the surface chemical composition measurements correspond. Therefore, the surface chemical measurements are used to characterise near-surface aerosol composition, rather than to attribute the hygroscopicity of individual elevated layers to specific chemical components. Such attribution would require vertically resolved chemical measurements, and the uncertainty associated with extrapolating surface composition cannot be quantified here.
The largest number of cases for studying aerosol hygroscopicity was in July (104 layers, 45.8 %), followed by August (55 layers, 24.3 %) and September (40 layers, 17.6 %), whereas fewer cases were recorded from October to December (Table 4). The most hygroscopic layers occurred in June (fβ (355 nm) 0.70 and γβ (355 nm) 0.15), while lower hygroscopicity was observed in October and December (fβ (355 nm) 0.26 and γβ (355 nm) 0.08), as well as in July (fβ (355 nm) 0.49 and γβ (355 nm) 0.15). Consistent with these differences, the Mann–Whitney U test revealed statistically significant differences between June and July (p-value =0.001). High values were also recorded in September, which likewise showed statistically significant differences compared with July. High hygroscopicity was also observed in November, although only three cases were identified (Fig. 6 and Table 4).
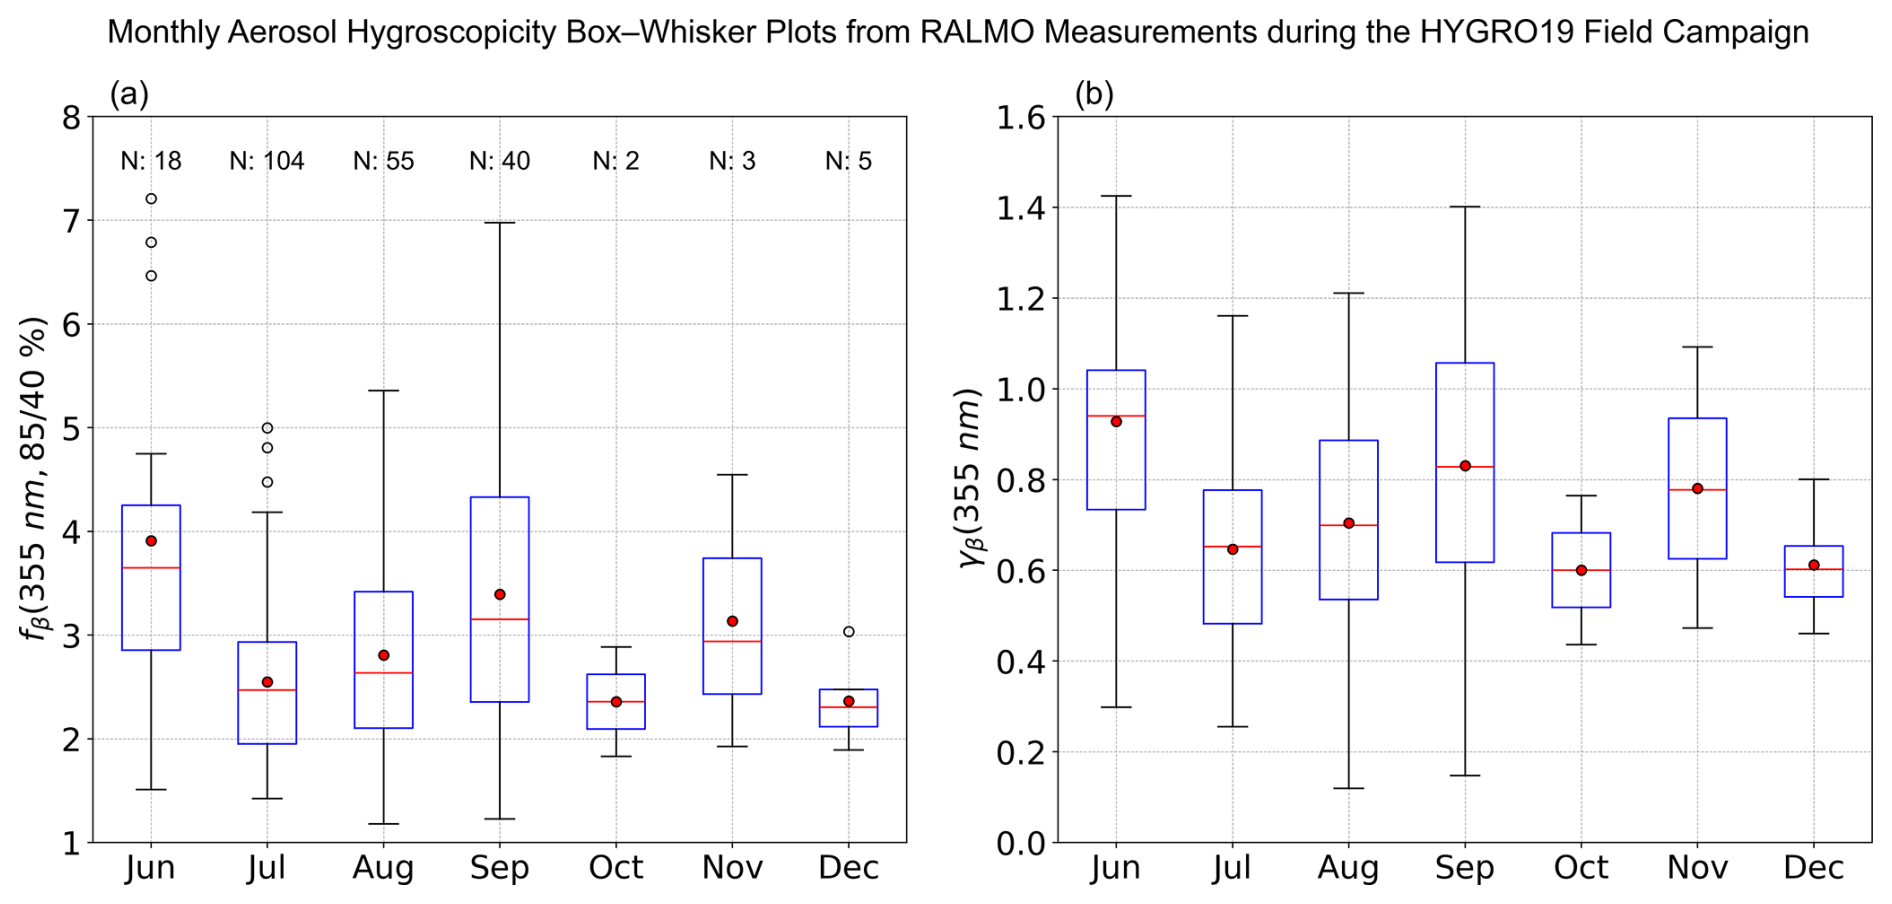
Figure 6Box-whisker plots of (a) fβ (355 nm, 85 % 40 %) and (b) γβ (355 nm) from RALMO measurements for every month during the HYGRO19 field campaign. In each box plot, the central mark represents the median, the red point indicates the mean, and the box extends vertically from the 25th to the 75th percentiles. N represents the number of cases.
Table 4Statistical analysis of aerosol hygroscopicity parameters retrieved from RALMO measurements and surface chemical composition obtained during the HYGRO19 campaign for hygroscopic aerosol cases detected during each month.
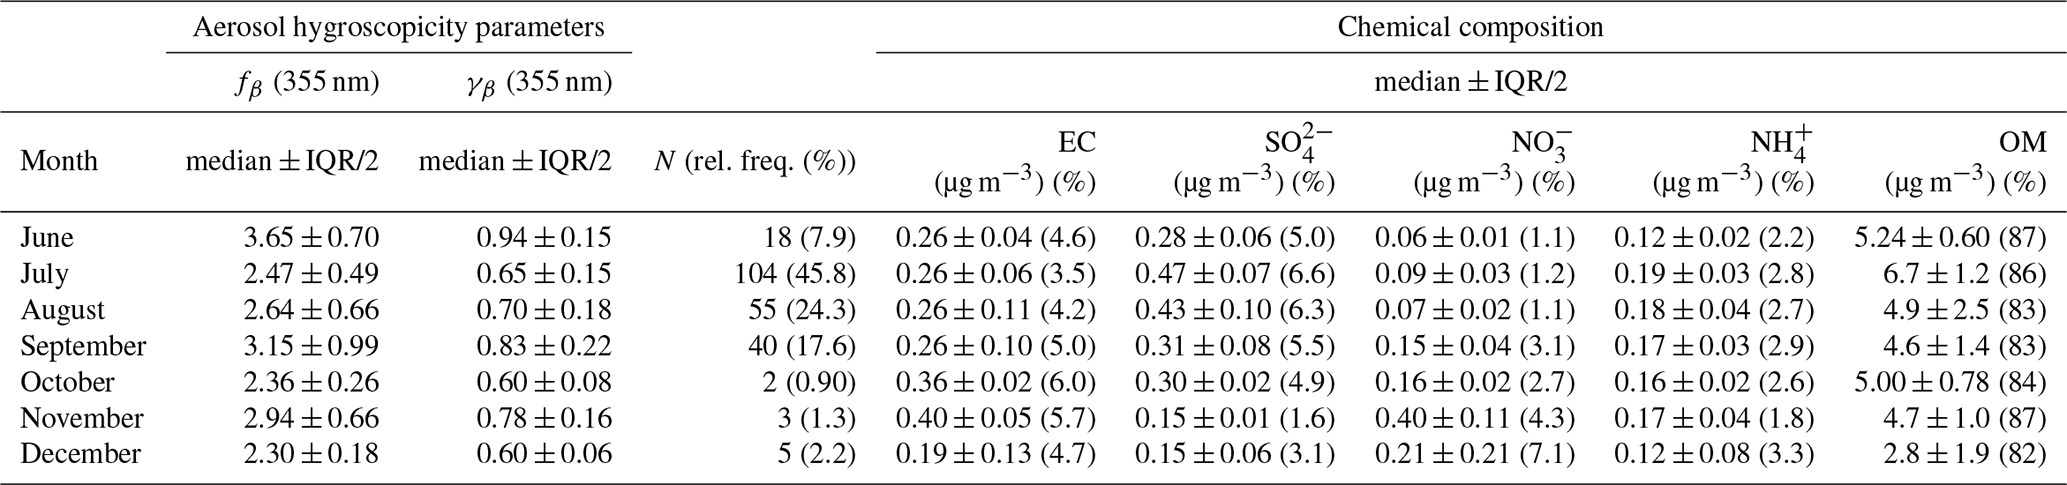
Results from Tables 1 and 4 show that organic matter was the dominant component of the near-surface aerosol (4.9 ± 2.5 µg m−3 (83 %)), whereas inorganic species accounted for approximately 11 % of the aerosol composition. The inorganic fraction was mainly composed of sulphate (0.30 ± 0.13 µg m−3 (4.4 %)), nitrate (0.11 ± 0.08 µg m−3 (4.1 %)) and ammonium (0.17 ± 0.07 µg m−3 (2.8 %)). Elemental carbon showed a low concentration (0.28 ± 0.13 µg m−3 (4.6 %)). Previous studies have also reported an important contribution of organic aerosol at Payerne (e.g., Minguillón et al., 2012; Hüglin and Grange, 2021; Dada et al., 2025). During the campaign, this contribution was particularly high in summer, especially in June (Tables 1 and 4), and may partly reflect enhanced photochemical activity during this season (Kammermann et al., 2010). In contrast, during autumn and winter, black carbon concentrations increase due to greater residential wood burning and a shallower boundary layer in the region (Minguillón et al., 2012; Dada et al., 2025), and these particles are typically less hygroscopic (Deshmukh et al., 2025; Lorenzo et al., 2025). The predominance of scattering and fine particles, together with lower concentrations of carbonaceous species during summer, may be associated with the higher hygroscopicity observed during this period compared with the second part of the campaign (Fig. 2 and Table 1). However, the surface composition does not establish the chemical composition of the layers analysed with RALMO and cannot, by itself, explain their retrieved hygroscopicity.
Changes in the light-scattering and backscatter due to hygroscopic water uptake at a given RH also depend on particle size. This effect was assessed using the extinction AE from sun photometer measurements. The relationship between particle size and the enhancement factor shows no clear dependence on particle size, with differences not being statistically significant. Fine particles yielded fβ (355 nm) 0.49 and γβ (355 nm) 0.14, compared to fβ (355 nm) 0.80 and γβ (355 nm) 0.22 for larger particles. The corresponding analysis is shown in Fig. S3 in the Supplement. Previous studies have also reported no clear dependence of aerosol hygroscopicity on particle size, with different size-dependent hygroscopic behaviours observed depending on aerosol properties and atmospheric conditions (Kammermann et al., 2010; Zieger et al., 2013; Titos et al., 2014b; Jefferson et al., 2017; Sicard et al., 2022).
Wind speed and wind direction allow investigating the relationship between air-mass origin and aerosol hygroscopic behaviour. The profile data were obtained using a Doppler wind lidar. Figure 7 illustrates the temporal evolution of wind direction for the detected hygroscopic aerosol layers (a), monthly wind-rose diagrams as a function of wind speed (b) and the corresponding fβ (355 nm) (c). Data from Fig. 7 show that during summer more wind profiles could be monitored due to lower cloud cover, allowing the observation of distinct vertical wind structures. Near the surface, Northeast (NE) winds were frequently observed, while above that winds predominantly originated from the Southwest (SW) and West (W). Wind speeds were around 5 to 8 m s−1 (inset in Fig. 7a), with a median value of 4.2 ± 1.9 m s−1, corresponding to a moderate breeze (WMO, 2008). These conditions are typical of high-pressure systems, which occur more frequently in summer over central Europe (MeteoSwiss, 2026a). In contrast, during autumn and winter months, layers were mostly monitored below 1.5 km a.g.l., predominantly due to instrumental limitations under cloudy conditions associated with more frequent presence of low-pressure systems (MeteoSwiss, 2026b). Southwestern and Western air masses, originating in the Atlantic, travel through France before reaching Payerne, suggesting a possible mixture of particles (backward trajectories computed with HYSPLIT are not shown for clarity). Similar results were found by Kammermann et al. (2010) at the Jungfraujoch alpine site (Switzerland), where higher hygroscopicity was observed for winds from the SW or W and lower for other wind directions. Layers with fβ (355 nm) >3 in July–September also showed SW–W winds above 5 m s−1. Lower hygroscopicity in late June and July can be associated to the presence of dust particles, due to the influence of air masses from Southern Europe and North Africa, consistent with other studies in Switzerland (Fierz-Schmidhauser et al., 2010; Navas-Guzmán et al., 2019; Eirund et al., 2022; Collaud Coen et al., 2026). Northeast winds are observed mostly at surface level, with wind speeds of 3–6 m s−1, suggesting the influence of Central European urban and industrial emissions, containing less hygroscopic black carbon and organic matter.
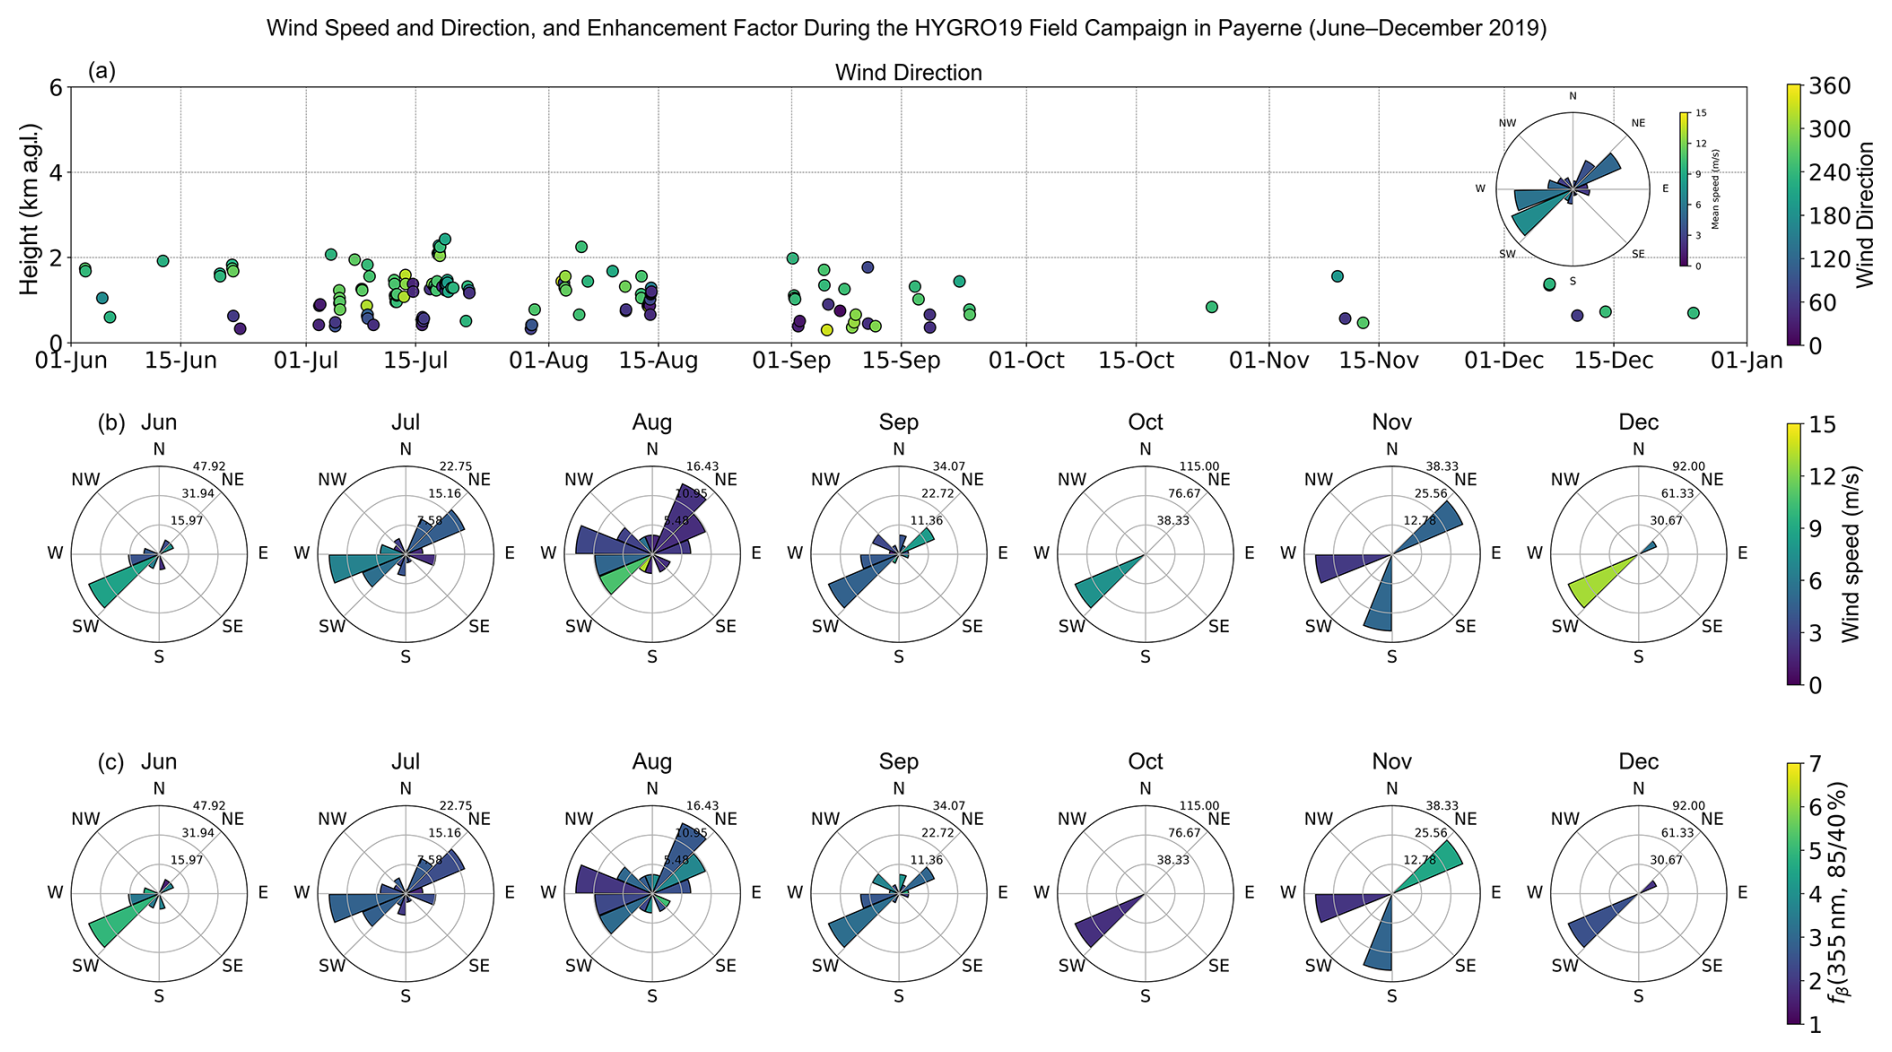
Figure 7Temporal and vertical evolution of wind direction (a) for the hygroscopic aerosol layers from wind profiler measurements during the HYGRO19 field campaign (June–December 2019). The inset in panel (a) shows the wind rose. Monthly wind rose plots depicting wind speed (b) and the fβ (355 nm, 85 % 40 %) from RALMO measurements (c).
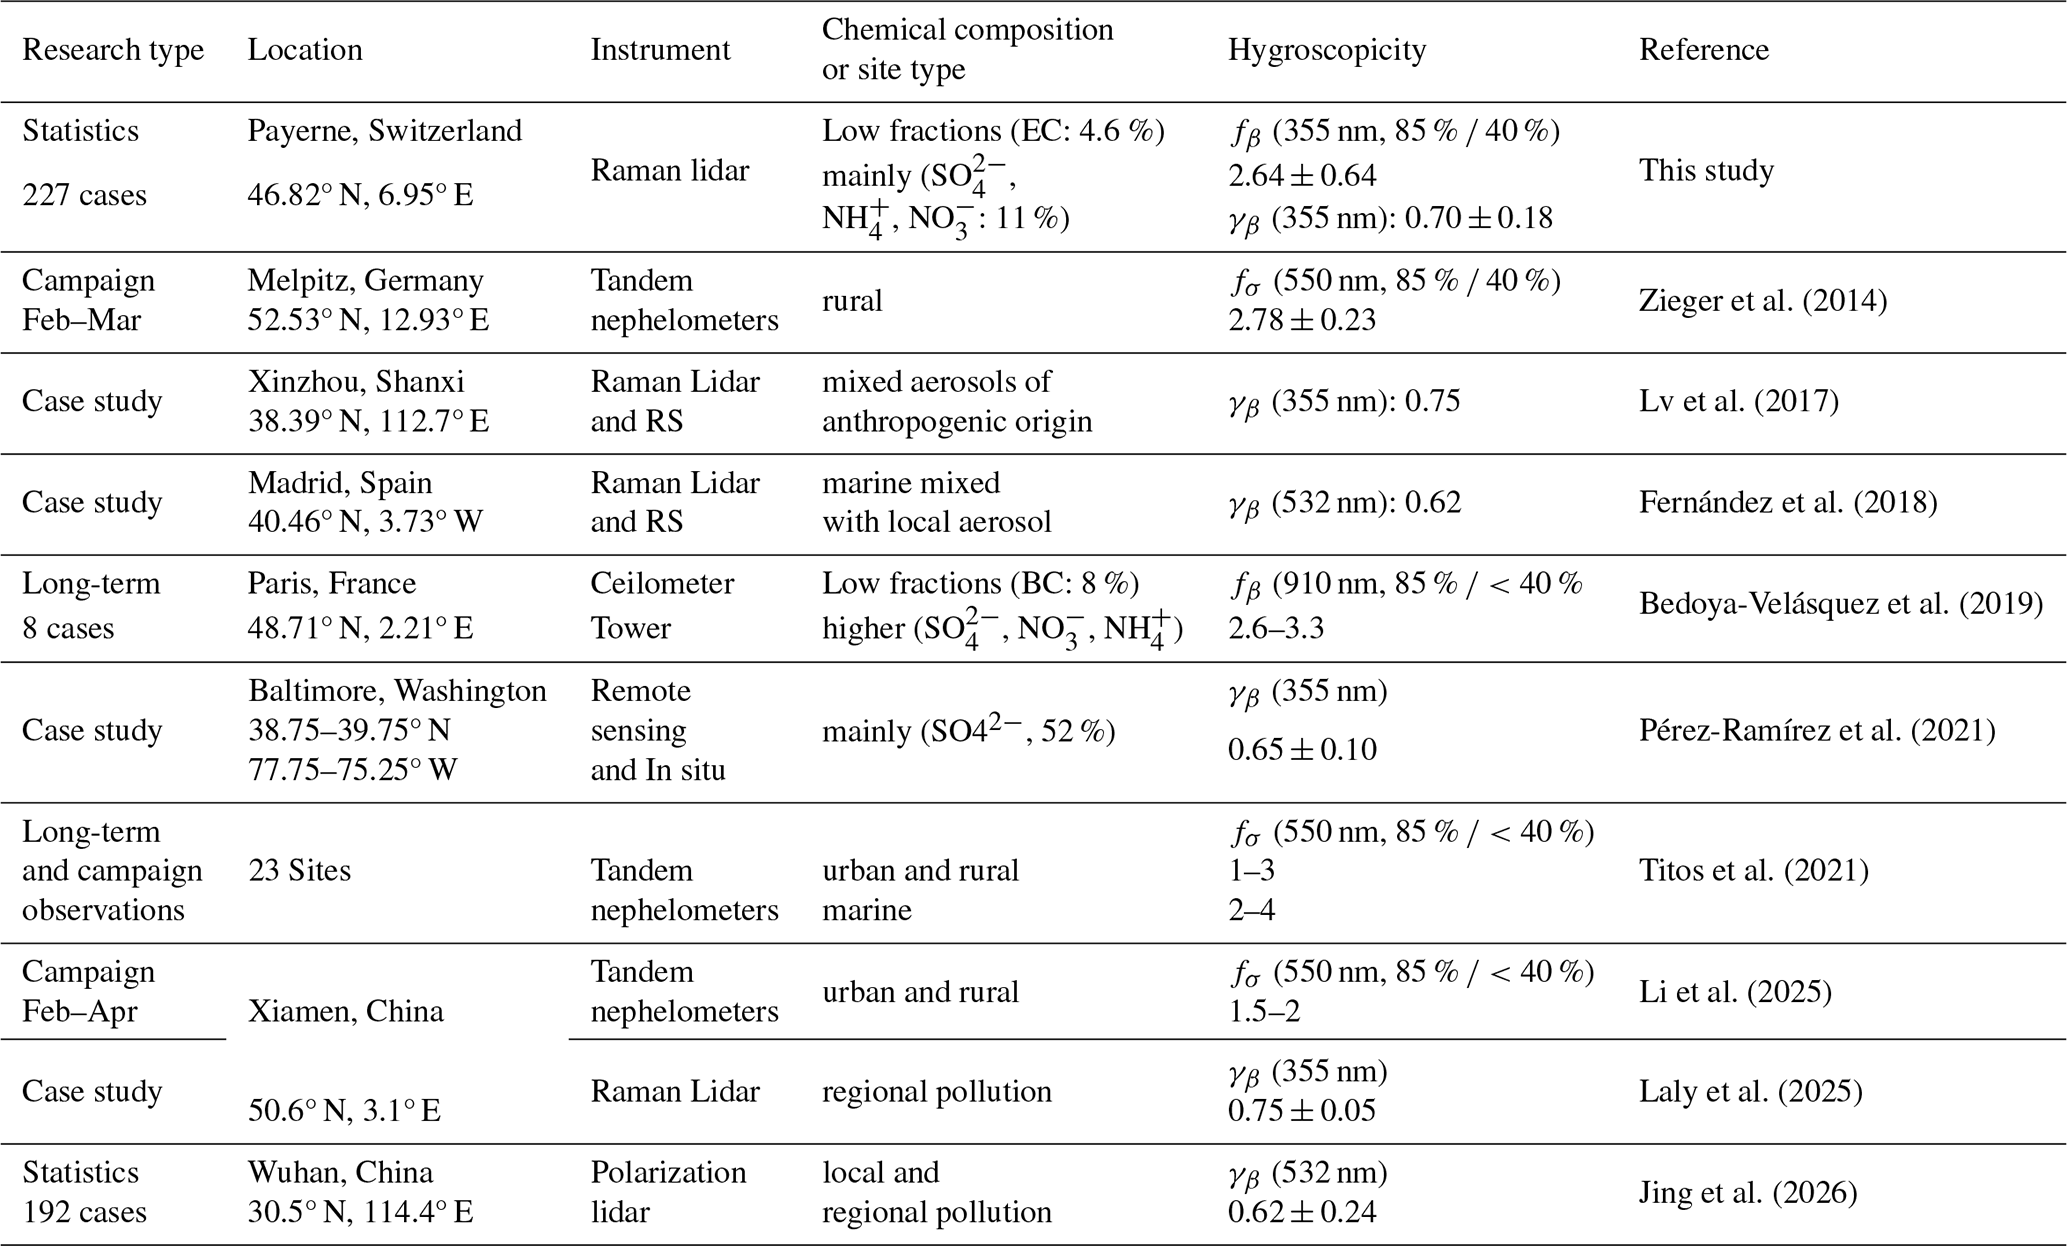
Table 5 summarises some of the most relevant studies on aerosol hygroscopicity based on aerosol optical properties. When reported, aerosol chemical composition is provided; otherwise, site classification (e.g., urban, rural, marine) is used as a proxy for aerosol type. These studies are also classified according to whether they are based on remote sensing (lidar and ceilometer) or in situ (tandem nephelometers) techniques. Note that RALMO hygroscopicity parameters are provided at 355 nm for the 40 %–85 % RH range, whereas for some other studies, values are provided at different wavelengths and RH ranges due to differences in system configurations and experimental conditions. The main advance provided by the HYGRO19 campaign is the investigation of the temporal and vertical variability of the hygroscopicity parameters. Long-term analyses using remote sensing techniques have been reported in only a few studies (e.g., Bedoya-Velásquez et al., 2019; Sicard et al., 2022; Jing et al., 2026), whereas most studies are limited to a small number of case studies or were conducted during specific field campaigns (e.g., Lv et al., 2017; Fernández et al., 2018; Chen et al., 2019; Navas-Guzmán et al., 2019; Pérez-Ramírez et al., 2021; Laly et al., 2025). On the other hand, for tandem nephelometers (fσ and γσ), the results of this work are also comparable to those reported in previous studies based on in situ techniques (e.g., Zieger et al., 2014; Titos et al., 2021; Li et al., 2025), with the differences being within the uncertainties associated with each technique.
Zieger et al. (2014)Lv et al. (2017)Fernández et al. (2018)Bedoya-Velásquez et al. (2019)Pérez-Ramírez et al. (2021)Titos et al. (2021)Li et al. (2025)Laly et al. (2025)Jing et al. (2026)Table 5Aerosol hygroscopicity parameters derived from aerosol light-scattering enhancement factors (in situ measurements) and aerosol backscatter enhancement factors (remote sensing observations) from this study and previous studies. Values are expressed as median ± half of the interquartile range for this study and Zieger et al. (2014), and as mean ± standard deviation for Jing et al. (2026).
4.3 Assessment of different techniques for studying aerosol hygroscopic growth
Hygroscopic growth retrievals depend on both the measurement wavelength and the aerosol optical property, while chemical composition may also play an important role (Gysel et al., 2007). Consequently, fζ and γζ values derived from aerosol backscatter measurements (e.g. lidar or COBALD) are not directly comparable to those obtained from total scattering measurements using tandem nephelometers. In addition, previous studies based on Mie simulations have shown that the spectral dependence of hygroscopic growth can depend on particle size (Zieger et al., 2013; Navas-Guzmán et al., 2019). Therefore, enhancement factors for the same RH may differ between wavelengths and particle sizes, and values obtained from different techniques are expected to correlate in their variability, whereas their absolute values are not expected to be directly comparable.
4.3.1 RALMO retrievals versus ground-based tandem nephelometers
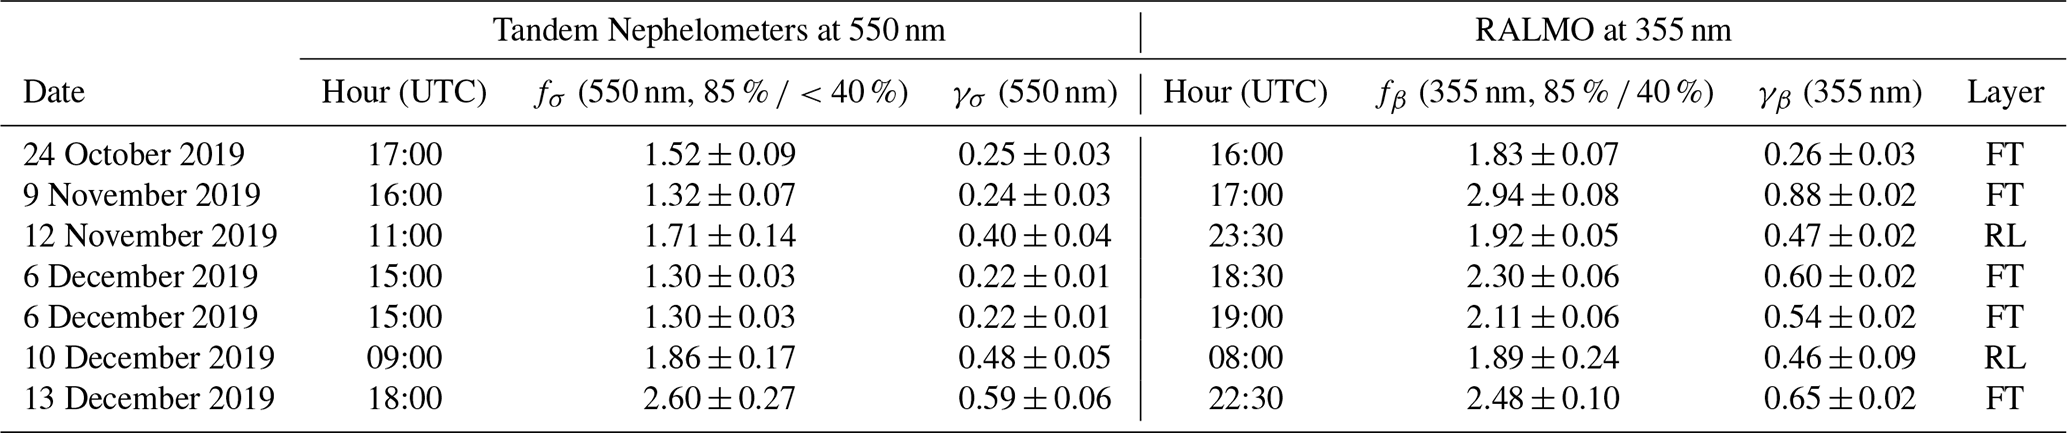
During the HYGRO19 campaign, tandem nephelometers operated from October to December, providing the enhancement factor at 550 nm (fσ (550 nm)) derived from scattering coefficient measurements over a relative humidity range from below 40 % to 85 % (Sect. 3.3). Note that the tandem nephelometer measurements are representative only of near-surface conditions (approximately 3 m a.g.l.). Figure 8 shows the temporal evolution of fσ (550 nm) retrieved with the tandem (cyan curve) and those values obtained with the RALMO system (fβ (355 nm), differentiating between cases detected within RL or FT (purple points and diamonds, respectively). Unfortunately no layers were detected in the CBL. Only seven hygroscopic aerosol layers could be identified using the RALMO data during this period, primarily due to the frequent presence of cloud, fog, and precipitation. The aerosol hygroscopicity parameters for coincident measurements between both methodologies are summarised in Table 6. During the period when tandem nephelometer measurements were available, fine (SAE = 1.71 ± 0.22) and large particles (SAE 0.20) exhibited very similar hygroscopic enhancement factors, with median fσ (550 nm) values of 1.34 in both cases and IQR/2 values of 0.07 and 0.06, respectively. Similarly, γσ values showed negligible differences (0.25 ± 0.03 and 0.26 ± 0.03, respectively).
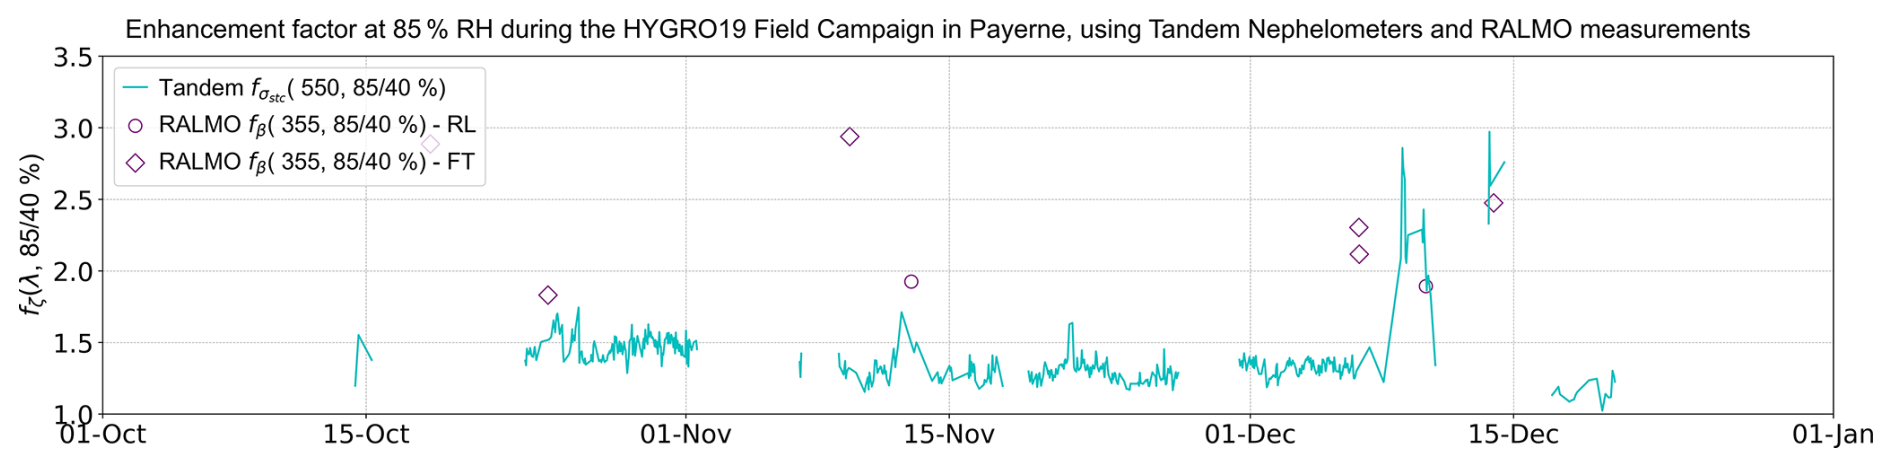
Figure 8Temporal evolution of fσ (550 nm, 85 % %) obtained using a tandem nephelometers during the HYGRO19 field campaign. The purple points and diamonds indicate fβ (355 nm, 85 % 40 %) from RALMO measurements in the RL and FT, respectively. Note that the values for RALMO were normalised to 40 % RH, whereas the tandem measurements correspond to RH values below 40 %.
Figure 8 shows an approximately constant value of fσ (550 nm) below 1.5, with a median of 1.34 ± 0.07. A similar behaviour is observed for γσ (550 nm), with a median of 0.26 ± 0.03 (graph not shown for clarity). However, clear outliers were observed on 8 December, coinciding with a marked increase in the aerosol scattering coefficient, PM2.5 concentrations, and scattering AE (values greater than 2.0), along with increases in EBC and TC concentrations (Fig. 2). For this day, HYSPLIT backward trajectories showed long-range transport from the North Atlantic and North America (Fig. S5a in the Supplement), where numerous fire hotspots were detected by the NASA/NOAA Suomi National Polar-orbiting Partnership satellite (https://firms.modaps.eosdis.nasa.gov/, last access: 5 November 2026, Fig. S5b in the Supplement). For the cases within the RL (12 November and 10 December 2019), good agreement was obtained between both techniques (Table 6). In contrast, the agreement for the FT cases was poorer, which is expected since aerosol layers in the free troposphere are largely decoupled from the boundary layer and typically exhibit different microphysical and optical properties than those near the surface. Nevertheless, the cases detected on 24 October and 13 December showed good agreement with the tandem nephelometers values, which can be explained by the presence of a well-mixed layer extending from the boundary layer into the lower free troposphere, allowing the hygroscopic layers to be representative of ground-based measurements.
Overall, the comparisons of lidar-derived aerosol hygroscopicity parameters with those from the tandem nephelometers show good agreement for layers below the ABL, as expected because lidar techniques require a well-mixed layer. The slightly lower values obtained from the tandem nephelometers compared with RALMO can be attributed to differences in the sampled aerosol populations, the specific optical quantities measured (scattering coefficient vs. backscatter coefficient) and the different wavelengths used by each instrument. This comparison should be interpreted with caution, since the retrievals are based on different wavelengths and optical properties, and the limited number of available RALMO cases should also be considered. To provide a preliminary physical baseline for assessing the effects of wavelength and the optical property considered under a common set of surface-based aerosol assumptions, Mie simulations were performed (Bohren and Huffman, 2007) and are discussed later in Sect. 4.3.5. Particularly, particle-size effects on aerosol hygroscopicity for near-surface measurements were also investigated using the scattering Ångström exponent (SAE (450–635 nm)) from the Aurora 3000 dry nephelometer. The results (not shown for clarity) indicate a weak dependence of the hygroscopic enhancement on particle size, with no statistically significant differences between small and large particles.
Table 6Values of the enhancement factor and Hänel parameter retrieved using the tandem nephelometers and RALMO instruments. Note that the values for RALMO were normalised to 40 % RH, whereas the tandem measurements correspond to RH values below 40 %.
4.3.2 Intercomparisons with COBALD-RS41 sondes I: 17 September 2019
The COBALD-RS41 sondes, which provide a unique opportunity to validate lidar-derived hygroscopicity parameters, were launched sporadically during the HYGRO19 campaign between 23:00 and 23:30 UTC. Comparisons with RALMO are performed using 30 m vertical intervals, resulting in a 6 s temporal resolution for the COBALD sondes. A key difference between remote sensing and balloon-borne techniques is that lidars probe the vertical air column directly above the laser, whereas balloon sondes can suffer of horizontal drifts with altitude due to winds. Consequently, in the presence of wind shear, the two instruments may sample different air masses, with the horizontal separation generally increasing with altitude. The COBALD and lidar systems also differ in receiver FOV (0.01° for RALMO and 6° for COBALD), resulting in systematic differences in backscatter measurements, which are corrected using Mie theory scattering simulations (Brunamonti et al., 2021).
The first case study focuses on 17 September 2019, when the region was affected by air masses originating from Northwestern Europe, passing over the Swiss Plateau and arriving at Payerne (backward trajectories shown in Fig. S2a in the Supplement). These air masses can transport anthropogenic and biogenic aerosols, especially considering that they travel at very low altitudes within the ABL. In situ measurements (graphs shown in Fig. S6 in the Supplement) indicate that scattering processes were dominated by fine particles (SAE (450–635 nm) 0.17), while absorbing particles also contributed notably (SSA (520 nm) 0.08 and AAE (370–950 nm) 0.05, Fig. S6a–d), suggesting the presence of a mixture of anthropogenic and biogenic particles. These observations are consistent with HYSPLIT backward trajectories, wind profiler measurements (wind speeds between 3 to 6 m s−1 from the NE) and PM concentrations (Fig. S6e). Consistently, the daily surface aerosol chemical composition was dominated by OM (5.6 µg m−3 (85 %)), followed by EC (0.39 µg m−3 (5.9 %)), SO (0.31 µg m−3 (4.7 %)), NH (0.15 µg m−3 (2.3 %)), and NO (0.12 µg m−3 (1.8 %)), suggesting minor contributions from local traffic emissions (Dada et al., 2025). Surface size distribution from SMPS (Fig. S6, right panels) confirmed the dominance of fine-mode particles (diameter lower than 2.5 µm), with a pronounced increase in Aitken-mode particles during the afternoon of 17 September (red curve, Fig. S6h), along with a slight enhancement in coarse mode particles (D>2.5 µm). In contrast, particle number concentrations on 18 September decreased from the first half of the day (00:00–12:00 UTC) to the second half (12:00–24:00 UTC), particularly for particles smaller than 100 nm (green curve). The two-hourly mean particle size distributions on 17 September (Fig. S6i), revealed nearly constant particle number concentrations between 12:00 and 14:00 UTC, followed by a progressive increase in fine particles during the afternoon.
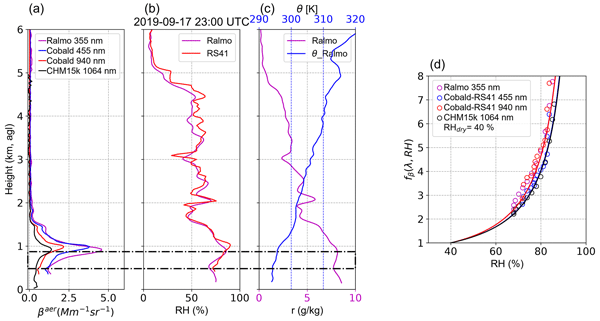
The temporal evolutions of aerosol backscatter coefficient, water vapour mixing ratio, and relative humidity on 17 September 2019 are illustrated in Fig. 9a–c. Ceilometer data were also available, which permits the retrieval of βaer at 1064 nm but with βaer derived with the Klett inversion algorithm (Klett, 1981, 1985) at constant lidar ratio of 50 sr. Aerosol particles are observed up to approximately 3.5 km a.g.l. until 03:00 UTC, with peak of concentration below 2.5 km a.g.l.. Low clouds are also observed around 3.0–4.0 km a.g.l. between 07:00 and 11:00 UTC (Fig. 9a). During nighttime, there is a considerable increase in the aerosol backscatter coefficient after 21:00 UTC, which became even more pronounced after 23:30 UTC within the 0.48–0.87 km a.g.l. layer. For this time interval, the RH values (Fig. 9c) show a strong correlation with βaer. At the same time, the water vapour mixing ratio (Fig. 9b) exhibited greater homogeneity, suggesting a well-mixed layer. Therefore, these measurements (dashed lines in Fig. 9a–c) fulfil the criterion for aerosol hygroscopicity studies and coincides with COBALD-RS41 sonde launch. The vertical profiles of aerosol backscatter, water vapour mixing ratio, and RH retrieved from RALMO, the ceilometer, and the COBALD-RS41 sonde are shown in Fig. 9d–f.
The vertical profiles of βaer between 23:00 and 23:59 UTC on 17 September show very similar patterns for the different instruments (RALMO, COBALD and ceilometer). RALMO recording the highest βaer values, while the lowest values were registered by ceilometer. COBALD, however, revealed intermediate values. This pattern is consistent with the spectral dependence of light scattering using Mie theory for spherical particles, which indicates stronger backscattering in the ultraviolet than in the infrared region. Particularly, within the 0.48–0.87 km a.g.l. layer, a marked increase in βaer (Δβ=2.3 Mm−1 sr−1, Fig. 9d) was observed in coincidence with an increase in RH from 69 % to 86 % (Fig. 9e). The potential temperature and water vapour mixing ratio profiles (Fig. 9f) exhibited relatively constant values within this layer, with 0.05 K and 0.25 g kg−1, suggesting a well-mixed atmosphere.
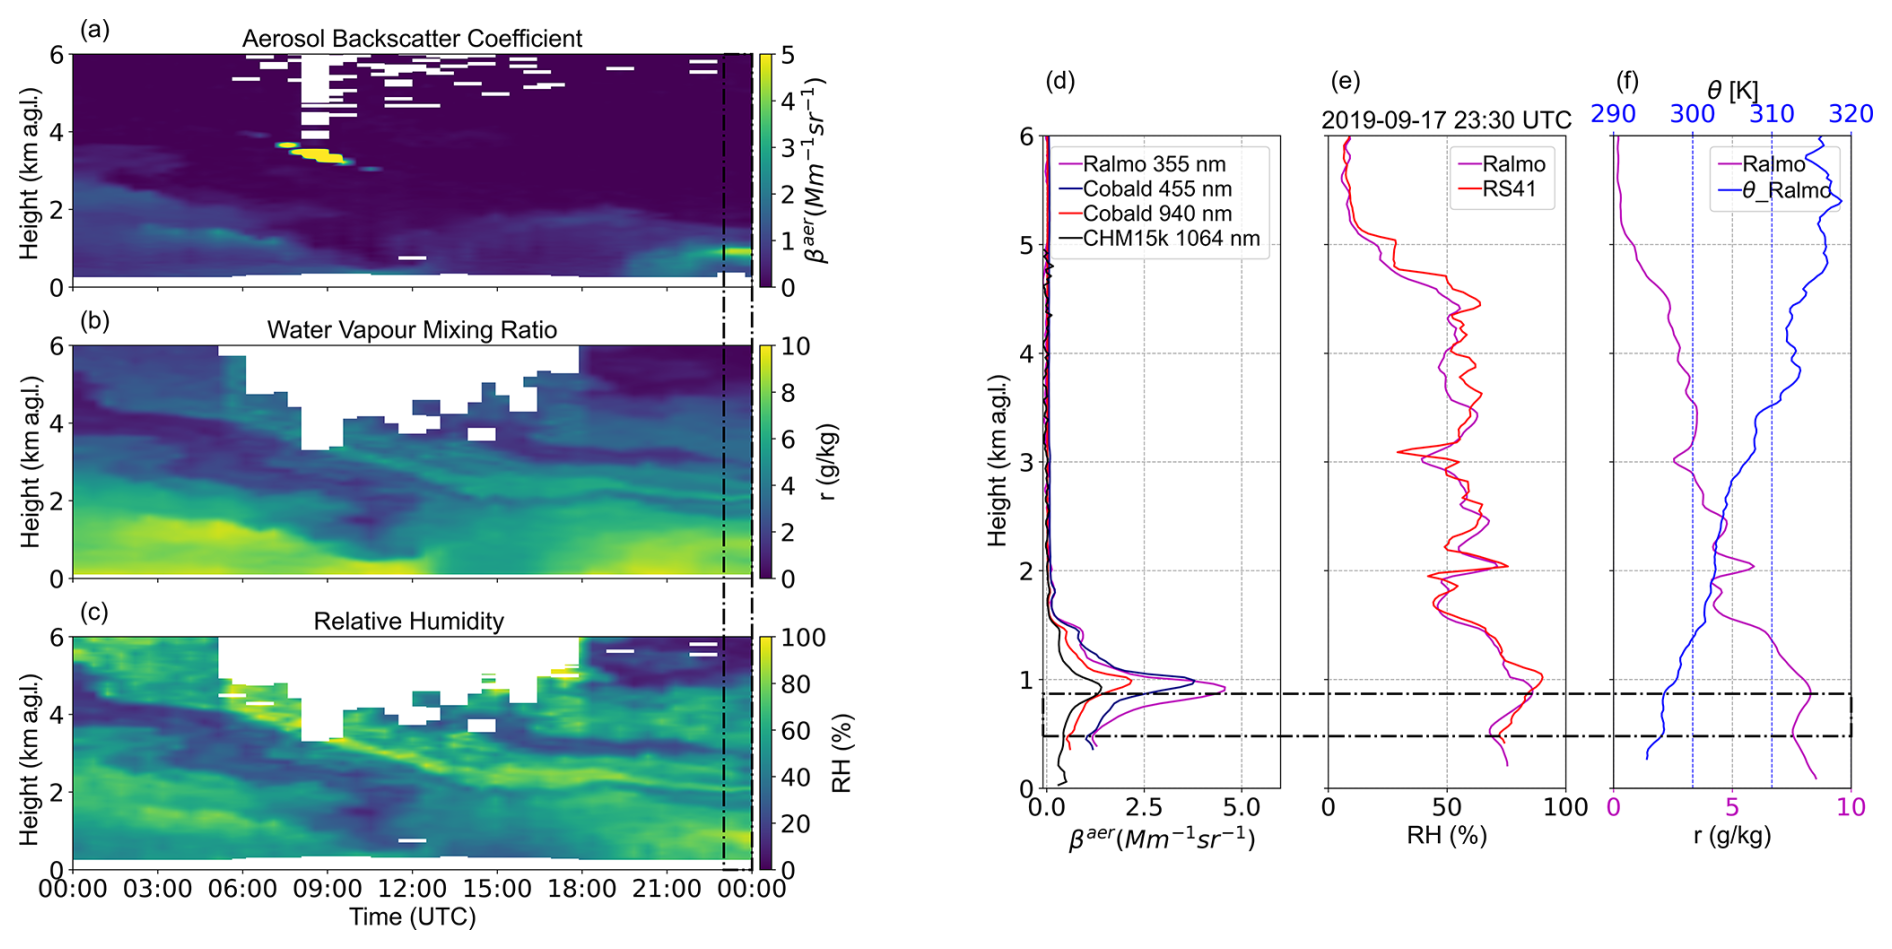
Figure 9Temporal evolution of (a) βaer (355 nm), (b) water vapour mixing ratio, and (c) RH profiles from RALMO on 17 September 2019. (d) βaer profiles from RALMO at 355 nm (purple), COBALD at 455 and 940 nm (blue and red), and ceilometer at 1064 nm (black). (e) RH profiles from RALMO (purple) and RS41 (red). (f) Water vapour mixing ratio (purple) and potential temperature (blue) profiles from RALMO. The vertical profiles correspond to 23:30–23:59 UTC for RALMO and ceilometer, and 23:00–23:30 UTC for COBALD-RS41.
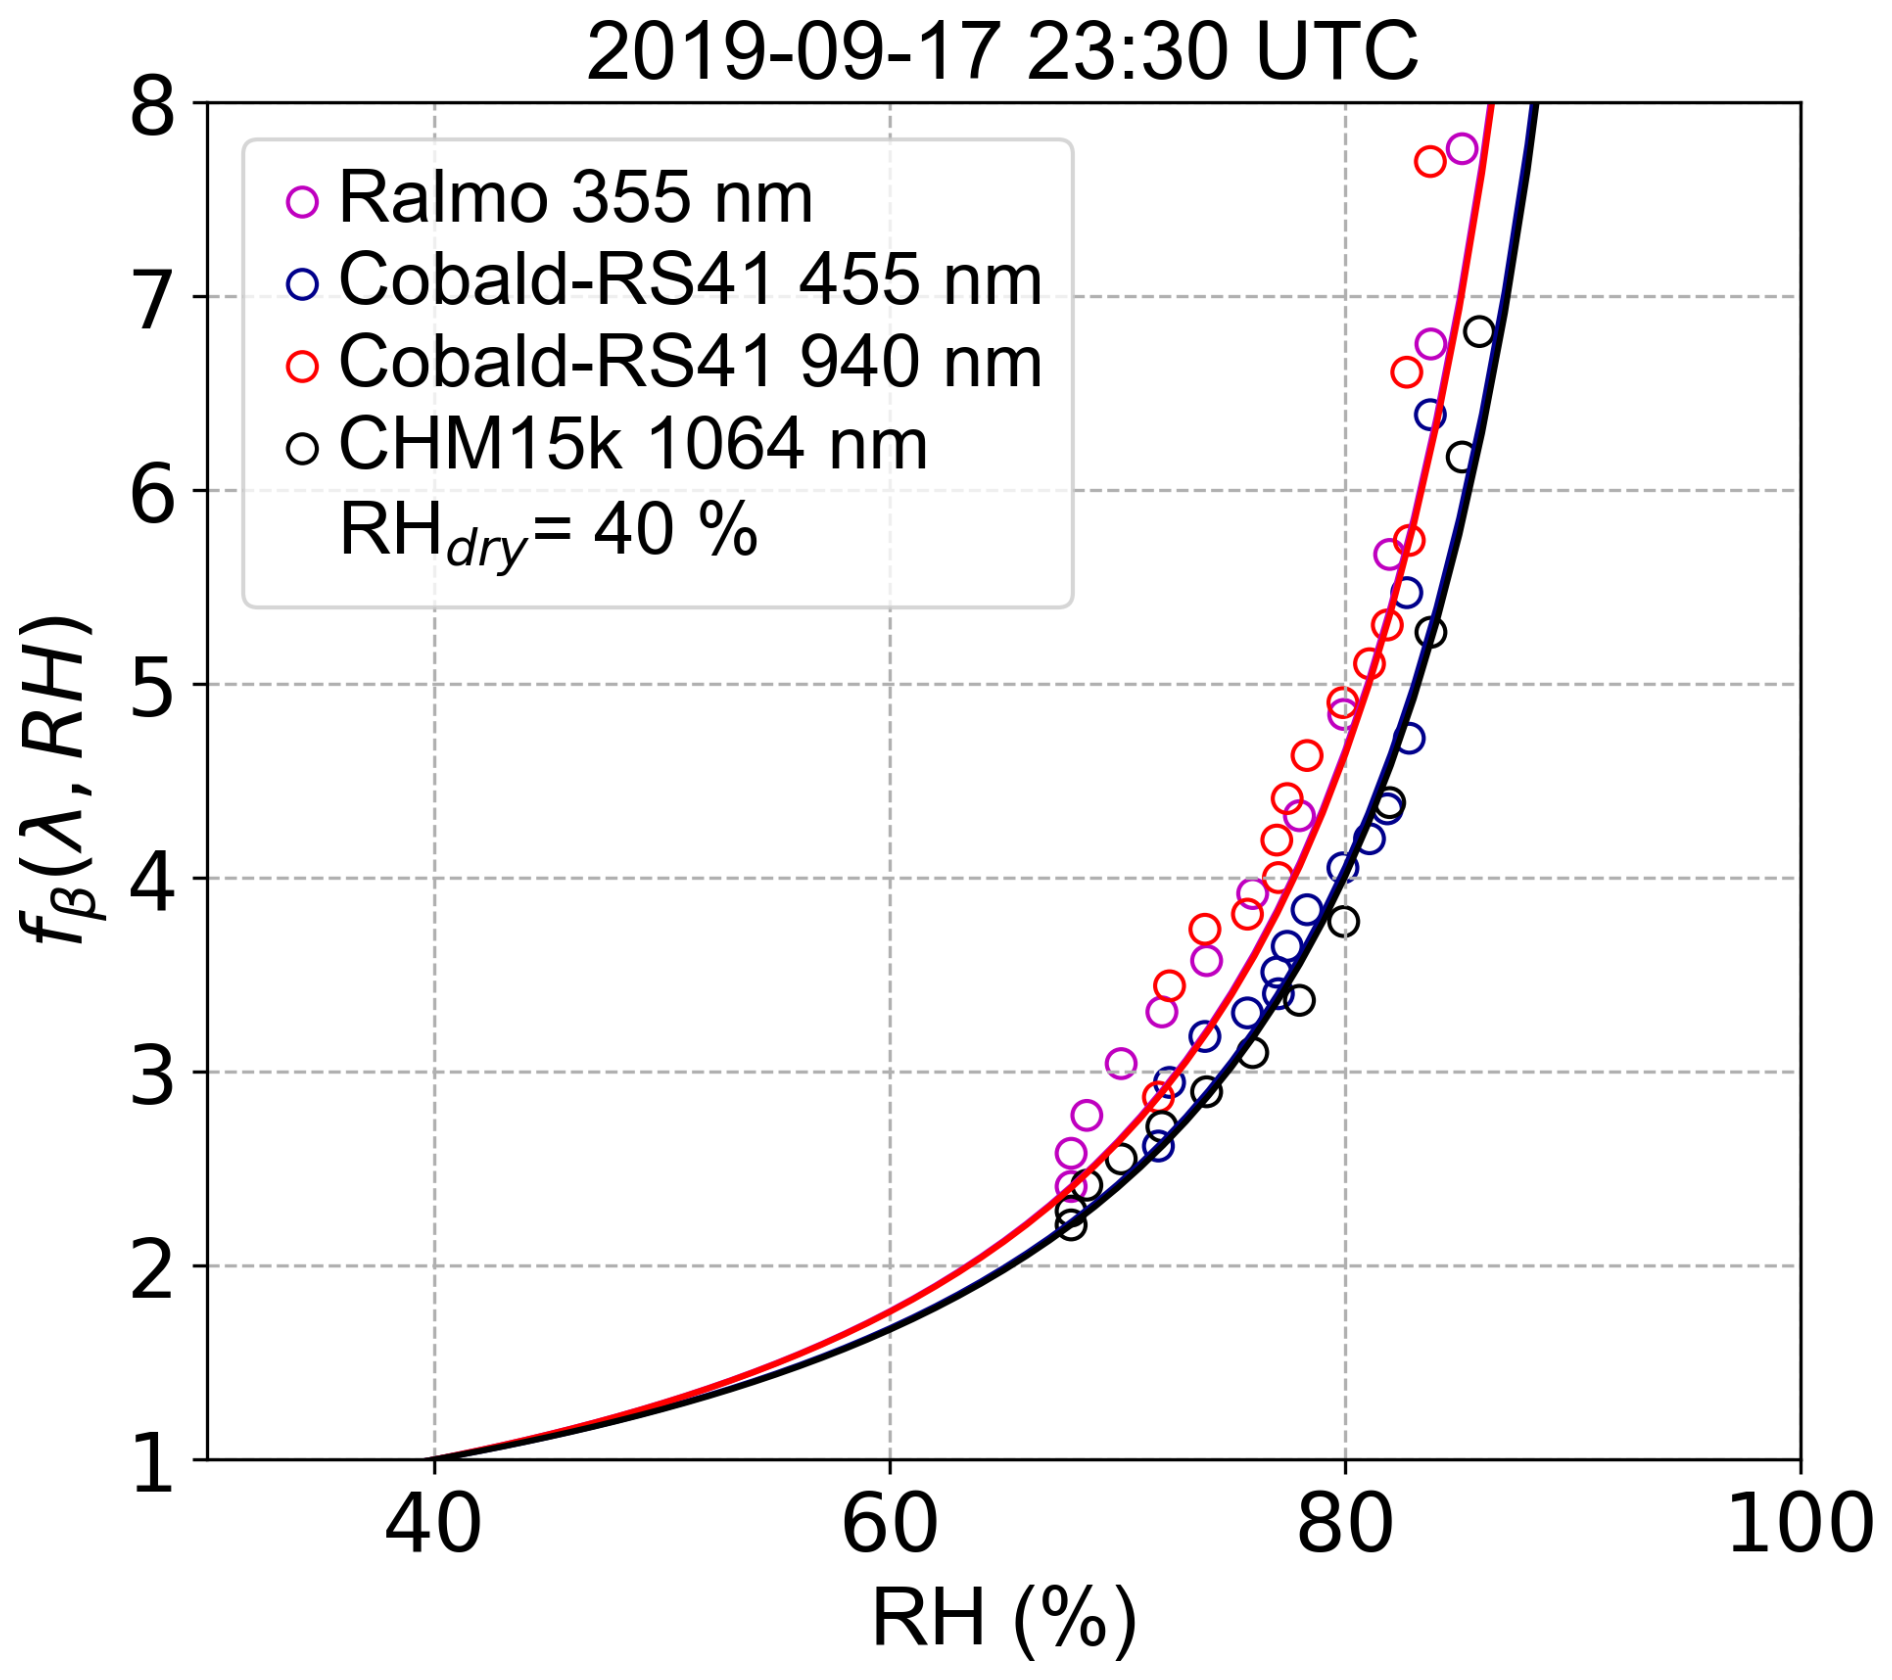
Figure 10 shows the humidograms (dependency of fζ (λ) with RH) for RALMO (355 nm), COBALD-RS41 (455 and 940 nm), and the ceilometer (1064 nm) within the selected 0.48–0.87 km a.g.l. layer. Note that for homogeneity all the derived hygroscopicity parameters were normalised to the 40 %–85 % RH range. These parameters obtained using the different techniques for the three case studies are summarised in Table 7. It should be noted that different wavelengths were used in the retrievals.
Overall, there is good agreement between remote sensing (RALMO and ceilometer) and in situ vertical measurements (COBALD-RS41), with the differences being within the uncertainties of each method. In particular, the slight differences can be attributed to balloon drift with altitude, differences in integration time, and the high spatial and temporal variability of aerosol optical properties, which can lead to discrepancies between both techniques (Brunamonti et al., 2021). More specifically, RALMO observed an increase in βaer at 355 nm by a factor of 3.5, while RH increased from 68 % (reference RH) to 86 %, with the retrieved hygroscopicity parameters of γβ (355 nm) 0.04 and fβ (355 nm, 85 % 40 %) 0.37, indicating high aerosol hygroscopicity. The ceilometer retrieval, however, yielded lower hygroscopicity parameters, with γβ (1064 nm) 0.05 and fβ (1064 nm) 0.37. Using the in situ vertical technique with COBALD-RS41 sondes, the values obtained were γβ (455 nm) 0.11 and fβ (455 nm) 0.88, and γβ (940 nm) 0.11 and fβ (940 nm) 1.06, showing no clear spectral dependence. The apparent differences in the spectral behaviour of γβ are between instruments uncertainties and do not clearly indicate a consistent wavelength dependence.
4.3.3 Intercomparisons with COBALD-RS41 sondes II and aerosol hygroscopicity near clouds: 12 November 2019
The second case study of aerosol hygroscopicity using RALMO and COBALD-RS41 sondes was conducted on 12 November 2019, when air masses originated over the North Atlantic Ocean, passed through France, and reached Payerne (backward trajectories shown in Fig. S2b in the Supplement). Wind profiler data at the height of this layer indicated relatively low wind speeds of 2.6 m s−1 from the South (265°), suggesting local and regional aerosol influence. In situ measurements (graphs shown in Fig. S7 in the Supplement) during the period 11–13 November 2019 exhibited characteristics that could be attributed to local anthropogenic particles. On 11 November, both the scattering coefficient (a) and SSA (d) reached relatively high values (σsp (450 nm) 5.1 Mm−1 and SSA (520 nm) 0.06, respectively), indicating a clear predominance of scattering processes over absorption (Fig. S7b, σab (520 nm) 1.6 Mm−1). From 12 November onwards, scattering and absorbing coefficients decreased markedly, coinciding with an increase in SAE (>1.5, Fig. S7c), and a decrease in the albedo (SSA (520 nm) 0.35) suggesting a greater contribution of absorbing aerosol and increased anthropogenic influence. Daily surface aerosol chemical measurements exhibited higher EC concentrations (0.23 µg m3 (7.0 %)) than NO, SO, and NH4 (5.2 %, 3.7 % and 2.9 %, respectively) and slightly higher values than in the previous case study (EC =5.9 %). Nevertheless, OM remained the dominant aerosol component (2.7 µg m−3 (81 %)).
Analysis of the temporal and vertical evolution of RALMO measurements in the lower troposphere (Fig. S8 in the Supplement, left panel) shows that the conditions required to investigate aerosol hygroscopicity were fulfilled between 23:30 and 23:59 UTC within the 0.47–0.99 km a.g.l. layer. Vertical profiles of aerosol and thermodynamic parameters for this layer (Fig. S8, right panel) show an increase in βaer from 0.15 to 0.30 Mm−1 sr−1 (Fig. S8d) and in RH from 65 % to 90 % (Fig. S8e). Meanwhile, the potential temperature and water vapour mixing ratio profiles (Fig. S8f) remained relatively constant ( 0.14 K and 0.03 g kg−1). High values in backscatter above the hygroscopic aerosol layer were associated with the presence of clouds, suggesting that hygroscopic conditions near the cloud base could facilitate particle activation as cloud condensation nuclei (Pérez-Ramírez et al., 2021).
The uniqueness of the observations on this day is that a comprehensive assessment of aerosol hygroscopicity can be performed using all available techniques (RALMO, ceilometer, COBALD-RS41 sondes, and tandem nephelometers). RALMO humidogram (purple curve, panel a) reveals that βaer at 355 nm increased by a factor of 2.0 (fβ (355 nm, 90 % 65 %) =2.0), corresponding to a Hänel parameter of γβ (355 nm) 0.02 and fβ (355 nm, 85 % 40 %) 0.05, indicating lower aerosol hygroscopicity compared with the case on 17 September (fβ (355 nm, 85 % 40 %) 0.37). Ceilometer humidogram (black curve, panel a) showed slightly lower hygroscopicity, with γβ (1064 nm) 0.04 and fβ (1064 nm) 0.05. By contrast, COBALD-RS41 sondes (blue and red curves, panel a) yielded γβ (455 nm) 0.04 and fβ (455 nm) 0.10 and γβ (940 nm) 0.05 and fβ (940 nm) 0.17 (Fig. 11a). Despite these slight differences, the results indicate good agreement between the different techniques.
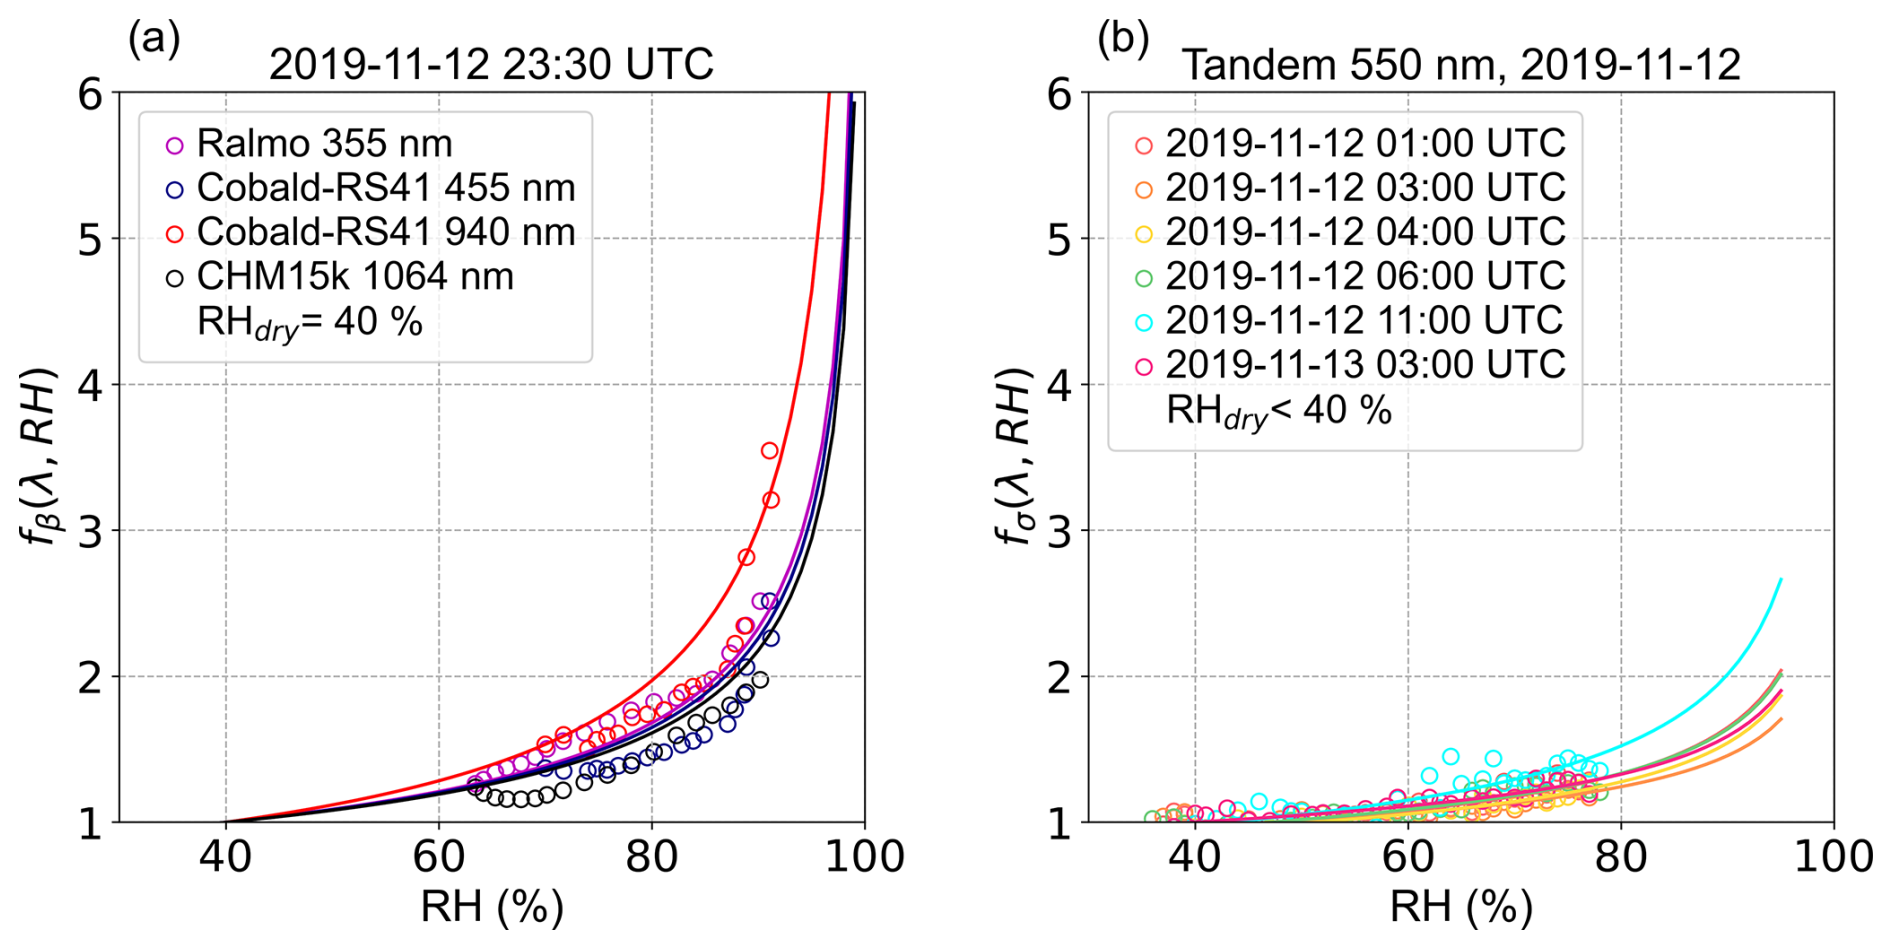
Figure 11Enhancement factor (fζ (λ,RH)) retrieved from (a) RALMO, COBALD-RS41 and ceilometer within the 0.47–0.99 km a.g.l. layer, and (b) from tandem nephelometers at different times on 12 November 2019. The parameters are summarised in Table 7. Note that the values in the left panel were normalised to dry conditions at 40 % RH, whereas the tandem measurements correspond to RH values below 40 %.
On the other hand, hygroscopic values obtained with the tandem nephelometers (Fig. 11b) closest in time to the RALMO retrievals on the same day (12 November 2019 at 11:00 UTC) show consistent values, with γσ (550 nm) 0.04 and fσ (550 nm) 0.14, regardless of differences in sampling time, sampled aerosol, and specific optical properties (Table 7). The analyses of different humidograms with time for this day (Fig. 11b) indicate an increase in aerosol hygroscopicity over time, reaching maximum values at 11:00 UTC (cyan curve), whereas the subsequent available humidogram at 03:00 UTC (pink curve) shows that these processes were decreasing. From these results, it can be concluded that the different techniques are in good agreement within the uncertainties of each method, and may be attributable to differences in wavelength and sampling methods. Overall, no consistent spectral dependence of the retrieved hygroscopic parameters was identified across the different instruments.
4.3.4 Aerosol hygroscopicity and clouds: 10 December 2019
The last case study corresponds to 10 December 2019. HYSPLIT backward trajectories calculated at 500, 1000, and 1500 m a.g.l. (Fig. S2c in the Supplement) were nearly identical within the first 2 km a.g.l., suggesting that the origin and transport pathways of the air masses were independent of altitude. The air masses originated over the North Atlantic Ocean and travelled across France before reaching Payerne; therefore, the influence of a mixture of aerosol types is expected.
In situ measurements from 9 to 11 December 2019 (shown in Fig. S9 in the Supplement) revealed a marked increase in EBC concentrations (f) from 10 December onwards, suggesting large influence of heavily polluted anthropogenic aerosols from local emissions. The concurrent increase in scattering and absorption further indicates enhanced aerosol loading, and the low values of single scattering albedo (SSA 0.08, Fig. S9d) suggest large influence of absorbing particles. Consistently, the daily surface aerosol chemical composition revealed similar concentrations of EC and NO (0.26 µg m−3 (6.3 %) and 0.27 µg m−3 (6.4 %), respectively), both higher than SO (0.17 µg m−3 (4.1 %)) and NH4 (0.14 µg m−3 (3.4 %)). This indicates a higher contribution of EC compared with 17 September (6.3 vs. 5.9 %), although lower than on 12 November (7.0 %).
Figure S10a–c (in the Supplement) shows the temporal evolution of βaer (355 nm), water vapour mixing ratio and RH profiles. The most relevant feature is the presence of clouds before 15:00 UTC as can be seen by the strong backscattering signal (Fig. S10a). Consequently, there are regions where retrievals were not possible. Later, low clouds dissipate and retrievals could be performed. From 08:00 to 08:30 UTC within the layer 0.70–0.97 km a.g.l. the requirements to study aerosol hygroscopicity are meet (dashed line in Fig. S10). Aerosol backscatter coefficients (Fig. S10d) showed an increase from 1.8 to 2.1 Mm−1 sr−1 at 355 nm, simultaneous with an increase in RH from 53 % to 66 % (Fig. S10e), while the potential temperature ( 0.29 K) and water vapour mixing ratio ( 0.01 g kg−1) profiles remained relatively constant (Fig. S10f).
Figure 12a shows the humidograms obtained with RALMO (purple) and ceilometer (black) measurements. Humidograms retrieved with the tandem nephelometers at different times are also illustrated in Fig. 12b. Results from RALMO showed that βaer at 355 nm increased by a factor of 1.2, corresponding to a Hänel parameter of γβ (355 nm) 0.09, and fβ (355 nm, 85 % 40 %) 0.24, indicating lower aerosol hygroscopicity compared to those obtained on 17 September (fβ (355 nm) 0.37) and similar to that retrieved on 12 November (fβ (355 nm) 0.05). Values calculated using ceilometer measurements showed less agreement, which may be related to the lower signal-to-noise ratio (SNR) due to the cloud presence, yielding γβ (1064 nm) 0.01 and fβ (1064 nm) 0.03. Data from the tandem nephelometers at 09:00 UTC (cyan curve in Fig. 12b) were of γσ (550 nm) 0.05 and fσ (550 nm) 0.17, in strong agreement with the RALMO values (Table 7).
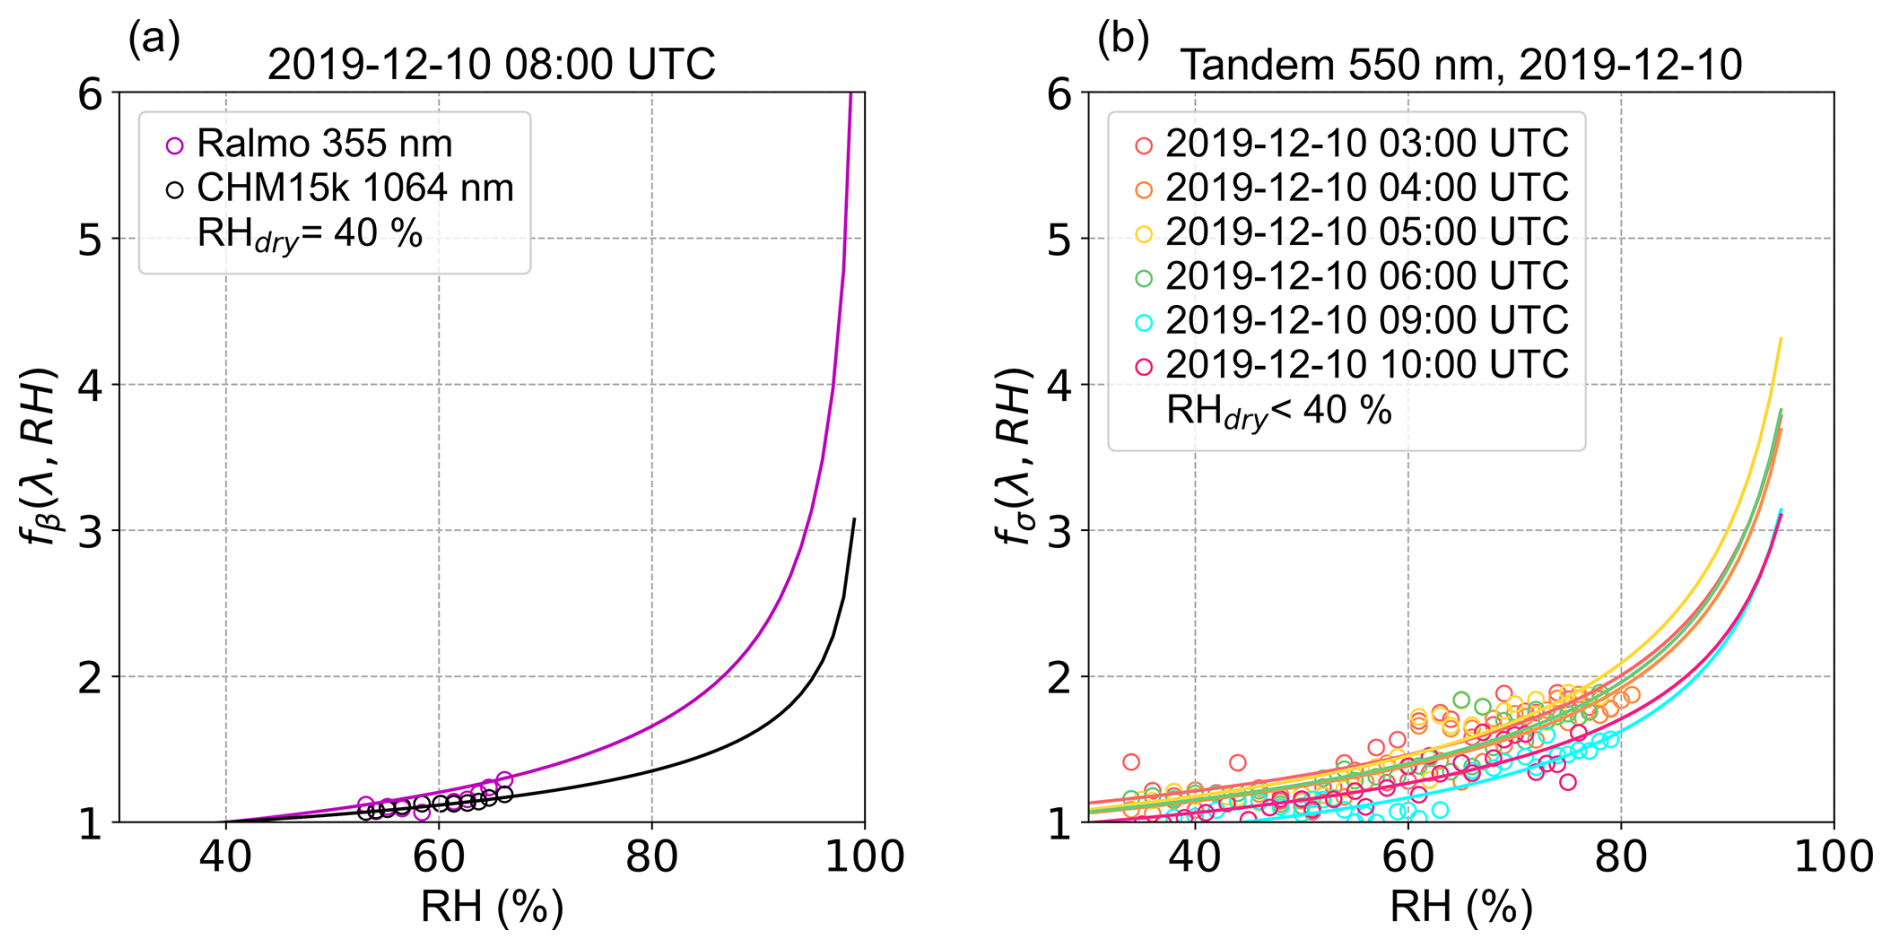
Figure 12Enhancement factor (fζ (λ,RH)) retrieved from (a) RALMO and ceilometer within the 0.70–0.97 km a.g.l. layer, and from (b) tandem nephelometers at different times on 10 December 2019. The parameters are summarised in Table 7. Note that the humidograms in the left panel were normalised to dry conditions at 40 % RH, whereas the tandem measurements correspond to RH values below 40 %.
Table 7Values of the enhancement factor and Hänel parameter retrieved using remote sensing and in situ techniques. Note that the values for RALMO, COBALD-RS41 and ceilometer were normalised to 40 % RH, whereas the tandem measurements correspond to RH values below 40 %. Values from different techniques are expected to correlate, whereas their absolute values are not directly comparable.
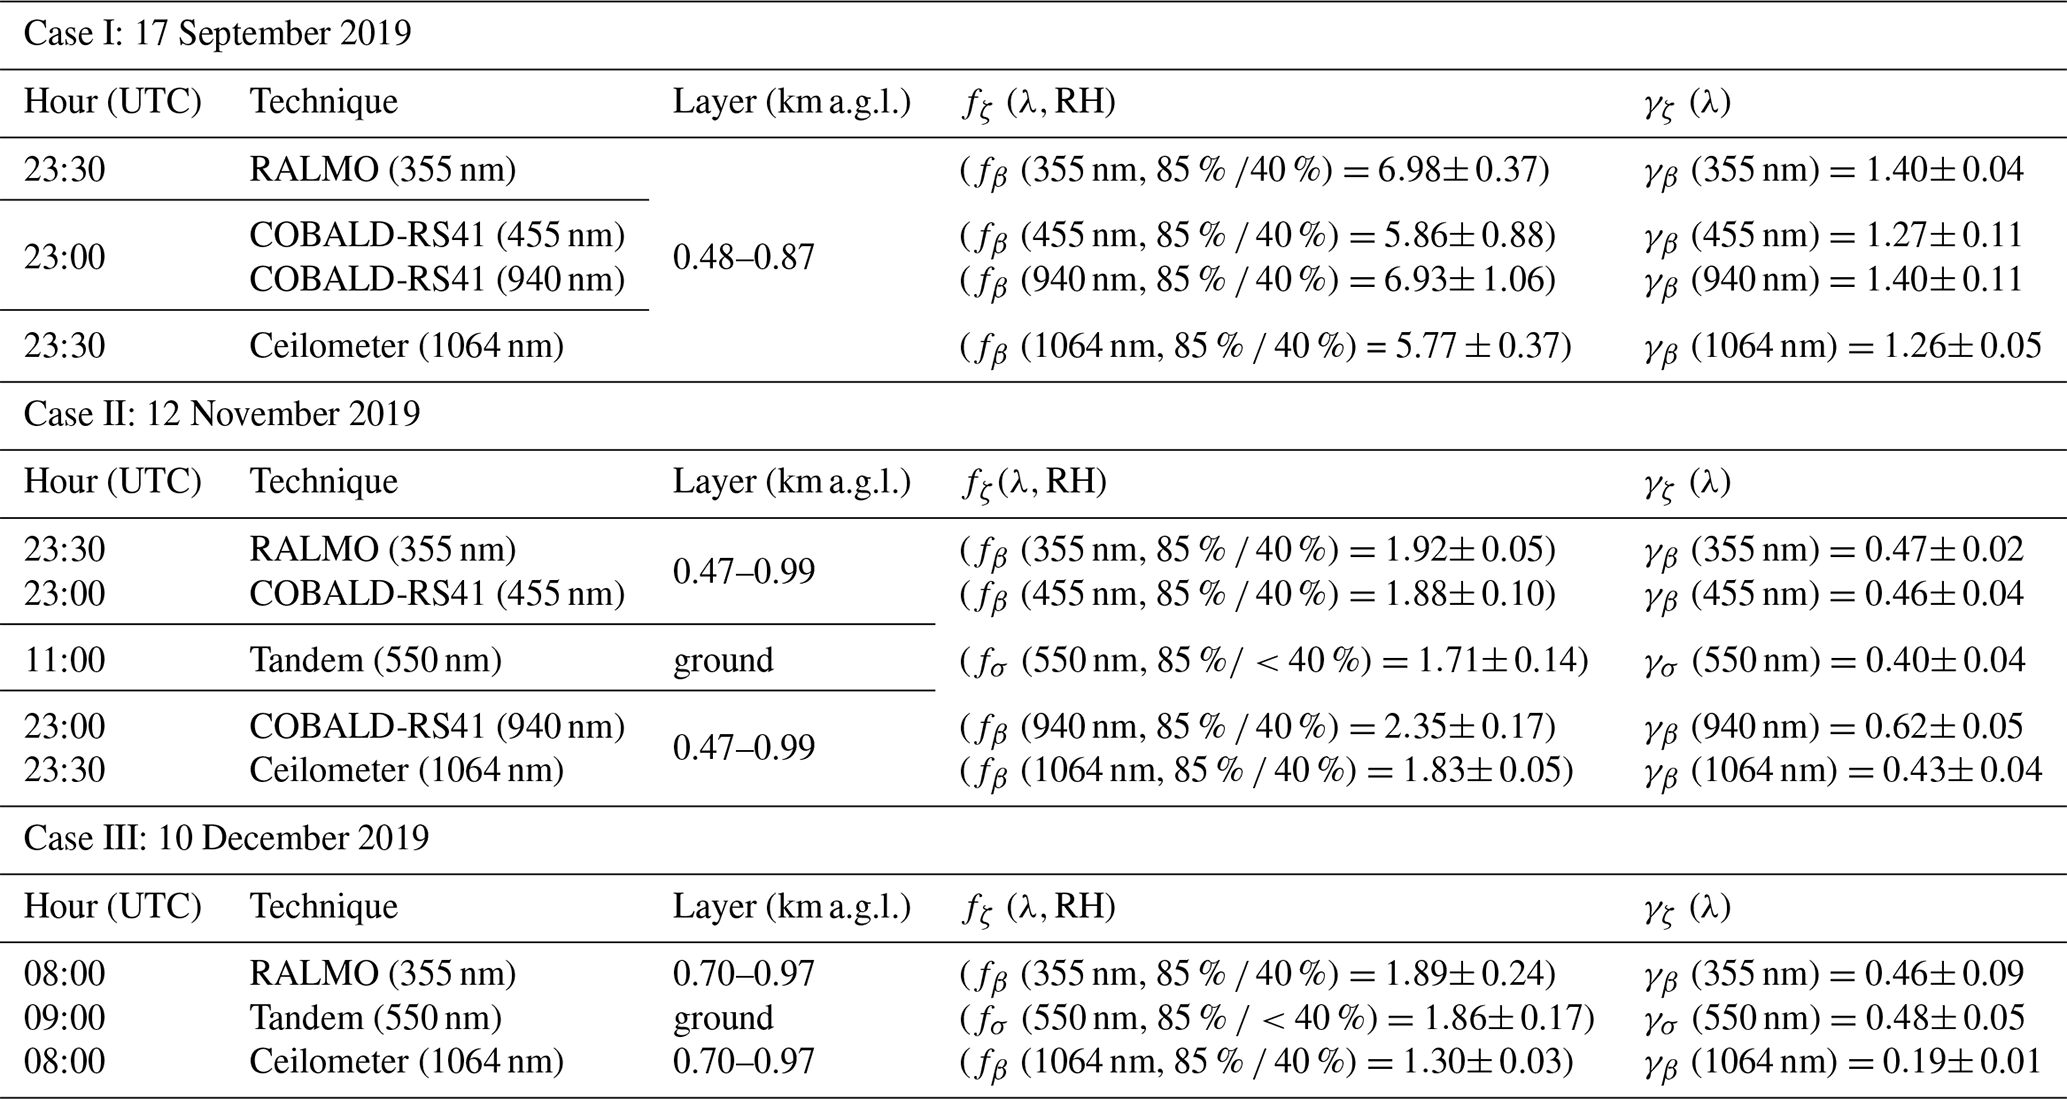
Regarding the surface chemical measurements, used here to characterise the near-surface aerosol chemical composition, the enhanced EC content combined with the lower SO concentration (4.1 vs 4.7 %) may explain why this case exhibited lower hygroscopicity (fβ (355 nm) 0.24) than on 17 September (fβ (355 nm) 0.37). Actually, previous studies have also reported that particles with high EC concentrations tend to exhibit lower hygroscopicity, while those primarily composed of sulphuric acid and ammonia show higher hygroscopicity (Zieger et al., 2014; Jefferson et al., 2017; Bedoya-Velásquez et al., 2019; Chen et al., 2019; Pérez-Ramírez et al., 2021; Cedeño et al., 2023; Deshmukh et al., 2025; Li et al., 2025; Lorenzo et al., 2025). But the key aspect here is the close proximity to clouds, suggesting how aerosol hygroscopicity can facilitate particle activation as cloud condensation nuclei under favourable thermodynamic and dynamical conditions (Pérez-Ramírez et al., 2021).
4.3.5 Assessment of aerosol hygroscopicity using Mie simulations
To assess the effects of wavelength and optical property on the retrieved hygroscopicity parameters, a quantitative comparison was performed using preliminary, surface-based Mie simulations (Bohren and Huffman, 2007). Aerosol backscatter coefficients at the RALMO and COBALD wavelengths (355 and 455 nm, respectively) and aerosol scattering coefficients at the tandem nephelometer wavelength (550 nm) were simulated using the Mie code (Prahl, 2026). For these simulations, daily surface aerosol chemical composition measurements (Sect. 2.5) were used to estimate the effective dry-particle refractive index (mdry) using a volume-weighted mixing rule (Liu and Daum, 2008), as well as the hygroscopicity parameter (κ; Petters and Kreidenweis, 2007). The refractive indices of the individual dry aerosol components used as inputs to the Mie simulations are provided in Table S1 of the Supplement. Hygroscopic particle growth and the corresponding wet particle size distributions were then calculated from the measured dry SMPS size distributions using the κ-Köhler theory (Petters and Kreidenweis, 2007). Finally, the change in refractive index due to water vapour uptake was calculated by volume-weighting mdry with the refractive index of water (; Hale and Querry, 1973).
Based on these calculations, the dependence of fζ (λ) on RH (Fig. 13) was obtained for the study cases with available SMPS size distributions. The simulated hygroscopicity parameters (Table 8) suggest that differences in wavelength and optical property alone may not explain the differences observed between the RALMO and tandem-nephelometer hygroscopicity retrievals (Table 7). Under the assumption of the same aerosol population, surface chemical composition, and hygroscopic growth, the Mie simulations yielded similar or larger hygroscopicity parameters for scattering at 550 nm than for backscatter at 355 nm, with γσ (550 nm) ranging from 0.31 to 0.41 and γβ (355 nm) from 0.30 to 0.32. Differences among the dry size distributions (Fig. S4 in the Supplement) could partly account for the range of values obtained for the simulated hygroscopicity parameters. Since the Mie size parameter depends on both particle size and wavelength, hygroscopic growth can modify the relative scattering and backscatter behaviour at the different wavelengths. Therefore, the larger γσ (550 nm) values should not be interpreted as a general increase in aerosol hygroscopicity with wavelength. Conversely, the simulations yielded greater γβ values at 355 than at 455 nm, in qualitative agreement with the RALMO and COBALD-RS41 retrievals (Table 7).
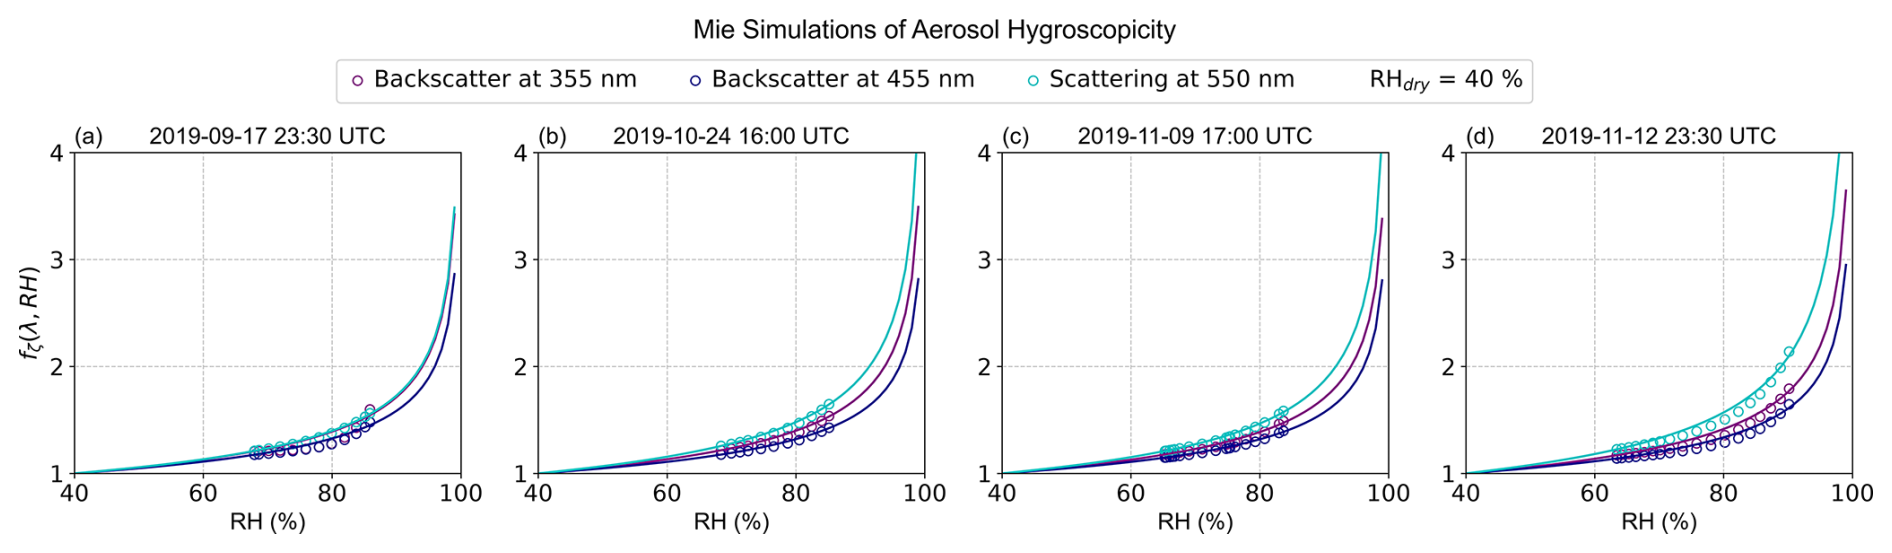
Figure 13Enhancement factor (fζ(λ,RH)) retrieved from Mie simulations for (a) 17 September 2019 at 23:30 UTC, (b) 24 October 2019 at 16:00 UTC, (c) 9 November 2019 at 17:00 UTC, and (d) 12 November 2019 at 23:30 UTC. Backscattering simulations are shown at 355 and 455 nm, and scattering simulations at 550 nm. Note that the humidograms were normalised to 40 % RH.
Table 8Values of the enhancement factor (fζ (λ,RH)) and Hänel parameter (γζ(λ)) retrieved from Mie simulations at 355 and 455 nm for aerosol backscatter and at 550 nm for aerosol scattering. Note that all values are normalised to 40 % RH. and denote the ratios between the corresponding enhancement factors and Hänel parameters at the indicated wavelengths, respectively.
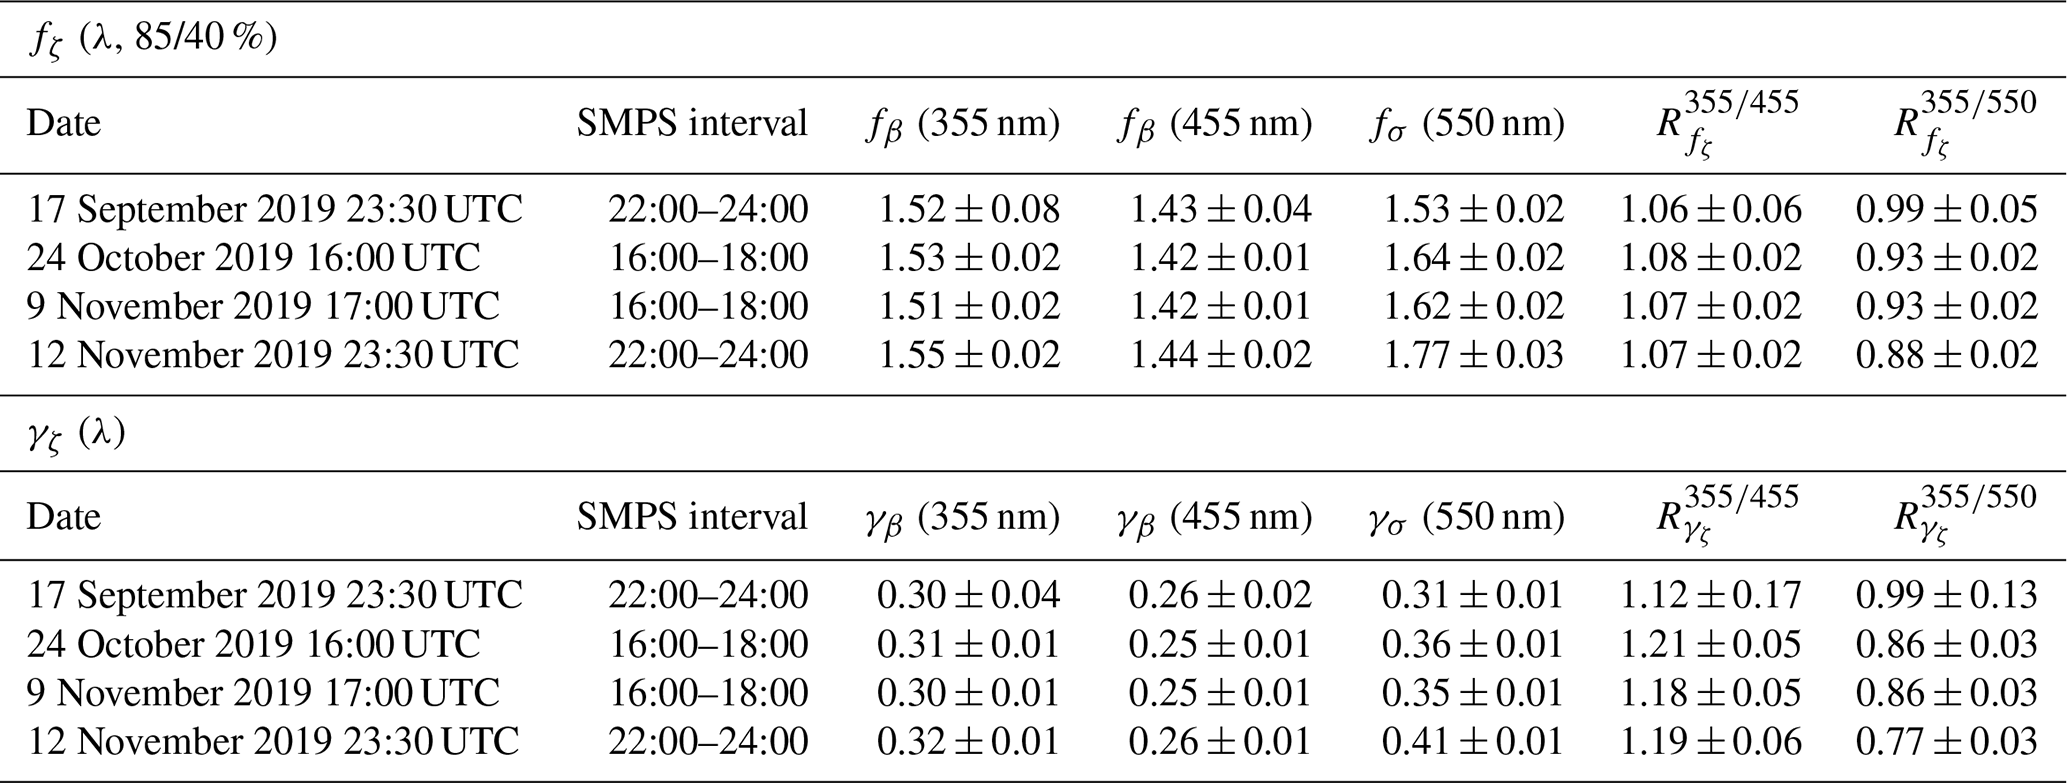
Results from Table 8 also show that the simulated hygroscopicity parameters are generally closer to those obtained with the surface tandem nephelometers (Table 6). This numerical similarity should not be interpreted as a quantitative closure, since the sampling times and reference RH conditions are not identical in all comparisons. Nevertheless, it may partly result from the fact that both the SMPS size distributions and the chemical composition used as inputs to the Mie calculations are measured at the surface. This subsection clarifies the surface-based nature of the simulations and the limitations of their comparison with vertically resolved retrievals. Consequently, differences between the simulated and RALMO-derived hygroscopicity may also reflect changes in aerosol size distribution, composition, morphology, and refractive index with altitude, particularly for decoupled aerosol layers. These results are consistent with previous Mie studies (e.g., Zieger et al., 2013; Bedoya-Velásquez et al., 2018; Navas-Guzmán et al., 2019), which showed that aerosol hygroscopicity derived from scattering and backscatter can depend on particle size, chemical composition, and wavelength.
This study has focused on aerosol hygroscopicity during the intercomparison campaign of hygroscopic aerosol properties using remote sensing and in situ techniques (HYGRO19 campaign), which was carried out at the MeteoSwiss aerological station in Payerne, Switzerland (46.82° N, 6.95° E, 491 m a.s.l.) from June to December 2019. The continuous operation of the RAman Lidar for Meteorological Observations (RALMO), which provides measurements of temperature, water vapour mixing ratio, and aerosol backscatter during both daytime and nighttime, enabled aerosol hygroscopicity to be investigated under different atmospheric conditions over a 6-month period. More than 200 hygroscopic aerosol layers were identified, constituting one of the largest databases available for Raman lidar aerosol hygroscopicity studies. The use of balloon-borne Compact Backscatter Aerosol Detectors coupled with Vaisala RS41 radiosondes (COBALD-RS41) provided unique vertically resolved in situ observations for direct comparison with RALMO retrievals. Additionally, tandem nephelometer measurements allowed aerosol hygroscopicity to be evaluated under well-mixed near-surface conditions. Complementary in situ and remote sensing observations were also used to provide a comprehensive characterisation of aerosol and atmospheric conditions.
Two contrasting aerosol regimes were observed during the campaign. The first, from June to August 2019, was characterised by relatively high aerosol loading and frequent clear-sky conditions, whereas the second, from September to December, was dominated by low-pressure systems, persistent cloudiness, and reduced aerosol concentrations. The median values of Aerosol Optical Depth (AOD) at 500 nm and extinction Ångström exponent (AOD-AE) between 440–870 nm were 0.24 ± 0.09 and 1.50 ± 0.19, respectively, during the first period, representing a considerable aerosol load for a rural background site such as Payerne. Backward-trajectory analyses indicated the influence of air masses from mainland Europe, which typically act as a source of anthropogenic pollution. However, some cases of air masses originating from Southwestern Europe and North Africa were also detected, showing higher aerosol loads (AOD (500 nm) approximately 0.3) and low AOD-AE values (approximately 0.4), suggesting the presence of dust particles. During the second period, only a few AERONET measurements were available, with median AOD (500 nm) and AOD-AE (440–870 nm) values of 0.07 ± 0.02 and 1.15 ± 0.13, respectively, more typical of a rural background site. These meteorological conditions largely limited the number of cases available for aerosol hygroscopicity studies using RALMO.
Aerosol hygroscopicity retrieved with RALMO showed high hygroscopic growth, with fβ (355 nm, 85 % 40 %) values ranging from 1.2 to 7.2 and a median of 2.64 ± 0.64, corresponding to a median γβ (355 nm) of 0.70 ± 0.18. The highest occurrence was in summer (177 layers, 78 % of all cases), with aerosols being more hygroscopic in June (fβ (355 nm) 0.70 and γβ (355 nm) 0.15). Fewer cases were detected during October–December, when lower hygroscopicity was observed (fβ (355 nm) 0.26 and γβ (355 nm) 0.08), limiting the representativeness of comparisons with summer. Complementary surface chemical measurements showed a predominance of organic matter (OM) during both campaign periods, with a higher sulphate mass fraction in June–August and higher elemental carbon (EC) and nitrate mass fractions in September–December. This contrast in surface aerosol chemical composition between the two periods may help explain the observed differences in hygroscopicity. However, the surface observations provide context for the campaign and do not establish the chemical drivers of the temporal variability in vertically resolved aerosol hygroscopicity. Regarding the vertical variability of aerosol hygroscopicity, no statistically significant differences were observed between layers below and above 1.5 km a.g.l., used as a threshold to distinguish the Atmospheric Boundary Layer (ABL) from the Free Troposphere (FT). A more detailed classification distinguishing the Convective Boundary Layer (CBL), Residual Layer (RL), and FT showed no statistically significant differences.
Multi-instrument comparisons showed generally consistent hygroscopic behaviour between RALMO, COBALD-RS41, and tandem nephelometer observations in the analysed case studies. RALMO and tandem nephelometer retrievals showed good agreement for aerosol layers within the residual layer, when well-mixed conditions extended up to the RL. For example, on 10 December 2019, γβ (355 nm) 0.09 was obtained from RALMO and γσ (550 nm) 0.05 from the tandem nephelometers. However, some discrepancies were found for some layers identified within the free troposphere, which may be due to the presence of decoupled layers, which can exhibit different optical and microphysical properties compared to those near the surface. The results obtained confirmed the capability of these techniques to robustly characterise aerosol hygroscopicity, as indicated by the close agreement between the retrieved hygroscopicity parameters and their associated uncertainties. No consistent spectral dependence was identified from the available observational case studies. The small number of cases and the differences in sampling and retrieval methodology between instruments prevent a robust assessment of a general wavelength dependence. Since the different techniques rely on different aerosol optical and microphysical properties, measurement wavelengths, sampling conditions and vertical representativeness, the comparisons were performed qualitatively and should be interpreted with caution. The Mie simulations likewise suggest no consistent spectral dependence and that near-surface aerosol conditions may not be representative of those within atmospheric layers, which may partly contribute to the differences observed between surface and vertically resolved hygroscopicity retrievals.
Further investigation of the relationship between aerosol chemical composition and hygroscopicity would require the combination of remote sensing observations with real-time, vertically resolved aerosol chemical composition measurements. Furthermore, Raman lidar measurements revealed high aerosol hygroscopicity in the vicinity of clouds, suggesting that aerosol hygroscopicity may facilitate particle activation as cloud condensation nuclei under favourable thermodynamic and dynamical conditions. Additional studies using numerical weather prediction models capable of accurately reproducing both clouds and the evolution of aerosol hygroscopicity are needed.
RALMO data can be accessed through the EARLINET network (https://data.earlinet.org/earlinet/, last access: 5 November 2026), while ceilometer and Doppler wind lidar data can be obtained via the E-PROFILE network (https://data.ceda.ac.uk/badc/eprofile/data/switzerland/payerne, last access: 5 November 2026). Co-author Alexander Haefele can be contacted for access to raw RALMO and radiosonde measurements (alexander.haefele@meteoswiss.ch). Sun photometer data can be retrieved from the AERONET network (https://aeronet.gsfc.nasa.gov/, last access: 5 November 2026). In situ aerosol data can be requested from co-author Benjamin T. Brem (benjamin.brem@psi.ch), while chemical composition data from the NABEL station can be accessed at https://www.bafu.admin.ch/en/data-query-nabel (last access: 5 November 2026). The HYSPLIT backward-trajectory files and corresponding maps are available for download from Zenodo (https://doi.org/10.5281/zenodo.23010868; Díaz-Zurita et al., 2026).
The supplement related to this article is available online at https://doi.org/10.5194/acp-26-15653-2026-supplement.
FN-G, SB and AH conceptualised the study. AD-Z, FN-G and all co-authors contributed to the analysis of the results and the discussion. AD-Z prepared the original draft of the manuscript, which was reviewed and edited by all authors. FN-G supervised the study and acquired funding.
The contact author has declared that none of the authors has any competing interests.
Publisher's note: Copernicus Publications remains neutral with regard to jurisdictional claims made in the text, published maps, institutional affiliations, or any other geographical representation in this paper. The authors bear the ultimate responsibility for providing appropriate place names. Views expressed in the text are those of the authors and do not necessarily reflect the views of the publisher.
This research was funded by Grant PID2024-162154OB-I00 funded by MICIU/AEI/10.13039/501100011033 and by ERDF/EU. This work was also supported by the Swiss National Science Foundation (project no. PZ00P2 168114) and the Spanish national projects (grant nos. PID2021-128008OB-I00, PID2023-151817OA-I00, CNS2023-145435), and by the Horizon Europe program under the Marie Skłodowska-Curie Staff Exchange Actions with the project GRASP-SYNERGY (grant agreement no. 101131631). This article is based upon work from COST Action EARLICOST (CA24135), supported by COST (European Cooperation in Science and Technology). The work made use of the strategic networks RED2022-134824-E and RED2024-153821-E and infrastructure (grant nos. EQC2019-006192-P and EQC2019-006423-P) funded by MCIN/AEI/10.13039/501100011033, ATMO-ACCESS (grant agreement no. 101008004), ACTRIS-IMP (grant agreement no. 871115), and Scientific Unit of Excellence: Earth System (grant no. UCE-PP2017-02).
This research was funded by Grant PID2024-162154OB-I00 funded by MICIU/AEI/10.13039/501100011033 and by ERDF/EU.
This paper was edited by Markus Petters and reviewed by two anonymous referees.
Aksoyoglu, S., Keller, J., Barmpadimos, I., Oderbolz, D., Lanz, V. A., Prévôt, A. S. H., and Baltensperger, U.: Aerosol modelling in Europe with a focus on Switzerland during summer and winter episodes, Atmos. Chem. Phys., 11, 7355–7373, https://doi.org/10.5194/acp-11-7355-2011, 2011. a
Alonso-Blanco, E., Gómez-Moreno, F. J., and Artíñano, B.: Size-resolved hygroscopicity of ambient submicron particles in a suburban Atmos, Atmos. Environ., 213, 349–358, https://doi.org/10.1016/j.atmosenv.2019.05.065, 2019. a
Anderson, T. L. and Ogren, J. A.: Determining Aerosol Radiative Properties Using the TSI 3563 Integrating Nephelometer, Aerosol Sci. Technol., 29, 57–69, https://doi.org/10.1080/02786829808965551, 1998. a
Ångström, A.: On the Atmospheric Transmission of Sun Radiation and on Dust in the Air, Geogr. Ann. B, 11, https://doi.org/10.2307/519399, 1929. a
Ansmann, A., Riebesell, M., and Weitkamp, C.: Measurement of atmospheric aerosol extinction profiles with a Raman lidar, Opt. Lett., 15, https://doi.org/10.1364/ol.15.000746, 1990. a, b
Bader, S., Collaud Coen, M., Duguay-Tetzlaff, A., Frei, C., Fukutome, S., Gehrig, R., Maillard Barras, E., Martucci, G., Romanens, G., Scherrer, S., Schlegel, T., Spirig, C., Stübi, R., Vuilleumier, L., and Zubler, E.: Rapport climatologique 2019, Rapports et Bulletins 313.008.f, MeteoSwiss and OFCL, Vente des publications fédérales, CH-3303 Berne, Switzerland, ISSN 2296-1496, https://www.meteosuisse.admin.ch/services-et-publications/publications/rapports-et-bulletins/2016/2020/rapport-climatologique-2019.html (last access: 5 November 2026), 2020. a
Bedoya-Velásquez, A. E., Navas-Guzmán, F., Granados-Muñoz, M. J., Titos, G., Román, R., Casquero-Vera, J. A., Ortiz-Amezcua, P., Benavent-Oltra, J. A., de Arruda Moreira, G., Montilla-Rosero, E., Hoyos, C. D., Artiñano, B., Coz, E., Olmo-Reyes, F. J., Alados-Arboledas, L., and Guerrero-Rascado, J. L.: Hygroscopic growth study in the framework of EARLINET during the SLOPE I campaign: synergy of remote sensing and in situ instrumentation, Atmos. Chem. Phys., 18, 7001–7017, https://doi.org/10.5194/acp-18-7001-2018, 2018. a, b, c
Bedoya-Velásquez, A. E., Titos, G., Bravo-Aranda, J. A., Haeffelin, M., Favez, O., Petit, J.-E., Casquero-Vera, J. A., Olmo-Reyes, F. J., Montilla-Rosero, E., Hoyos, C. D., Alados-Arboledas, L., and Guerrero-Rascado, J. L.: Long-term aerosol optical hygroscopicity study at the ACTRIS SIRTA observatory: synergy between ceilometer and in situ measurements, Atmos. Chem. Phys., 19, 7883–7896, https://doi.org/10.5194/acp-19-7883-2019, 2019. a, b, c
Bindoff, N. L., Stott, P., AchutaRao, K., Allen, M., Gillett, N., Gutzler, D., Hansingo, K., Hegerl, G., Hu, Y., Jain, S., Mokhov, I., Overland, J., Perlwitz, J., Sebbari, R., and Zhang, X.: IPCC 2013 AR5 – Chapter 10: Detection and Attribution of Climate Change: From Global to Regional, Climate Change 2013: The Physical Science Basis – Working Group I Contribution to the Fifth Assessment Report of the Intergovernmental Panel on Climate Change 2013, Change, edited by: Stocker, T. F., Qin, D., Plattner, G.-K., Tignor, M., Allen, S. K., Boschung, J., Nauels, A., Xia, Y., Bex, V., and Midgley, P. M., Cambridge University Press, Cambridge, UK, New York, NY, USA, ISBN 9781107057999, 867–952, https://doi.org/10.1017/CBO9781107415324.022, 2013. a
Bohren, C. F. and Huffman, D. R.: Absorption and Scattering of Light by Small Particles, Wiley, https://doi.org/10.1002/9783527618156, 2007. a, b
Bozzetti, C., Daellenbach, K. R., Hüglin, C., Fermo, P., Sciare, J., Kasper-Giebl, A., Mazar, Y., Abbaszade, G., Kazzi, M. E., Gonzalez, R., Shuster-Meiseles, T., Flasch, M., Wolf, R., Křepelová, A., Canonaco, F., Schnelle-Kreis, J., Slowik, J. G., Zimmermann, R., Rudich, Y., Baltensperger, U., Haddad, I. E., and Prévôt, A. S.: Size-Resolved Identification, Characterization, and Quantification of Primary Biological Organic Aerosol at a European Rural Site, Environ. Sci. Technol., 50, https://doi.org/10.1021/acs.est.5b05960, 2016. a
Brocard, E., Philipona, R., Haefele, A., Romanens, G., Mueller, A., Ruffieux, D., Simeonov, V., and Calpini, B.: Raman Lidar for Meteorological Observations, RALMO – Part 2: Validation of water vapor measurements, Atmos. Meas. Tech., 6, 1347–1358, https://doi.org/10.5194/amt-6-1347-2013, 2013. a
Brunamonti, S., Jorge, T., Oelsner, P., Hanumanthu, S., Singh, B. B., Kumar, K. R., Sonbawne, S., Meier, S., Singh, D., Wienhold, F. G., Luo, B. P., Boettcher, M., Poltera, Y., Jauhiainen, H., Kayastha, R., Karmacharya, J., Dirksen, R., Naja, M., Rex, M., Fadnavis, S., and Peter, T.: Balloon-borne measurements of temperature, water vapor, ozone and aerosol backscatter on the southern slopes of the Himalayas during StratoClim 2016–2017, Atmos. Chem. Phys., 18, 15937–15957, https://doi.org/10.5194/acp-18-15937-2018, 2018. a
Brunamonti, S., Martucci, G., Romanens, G., Poltera, Y., Wienhold, F. G., Hervo, M., Haefele, A., and Navas-Guzmán, F.: Validation of aerosol backscatter profiles from Raman lidar and ceilometer using balloon-borne measurements, Atmos. Chem. Phys., 21, 2267–2285, https://doi.org/10.5194/acp-21-2267-2021, 2021. a, b, c, d, e
Bucholtz, A.: Rayleigh-scattering calculations for the terrestrial Atmos, Appl. Opt., 34, 2765–2773, https://doi.org/10.1364/ao.34.002765, 1995. a
Burgos, M. A., Andrews, E., Titos, G., Alados-Arboledas, L., Baltensperger, U., Day, D., Jefferson, A., Kalivitis, N., Mihalopoulos, N., Sherman, J., Sun, J., Weingartner, E., and Zieger, P.: A global view on the effect of water uptake on aerosol particle light scattering, Sci. Data, 6, https://doi.org/10.1038/s41597-019-0158-7, 2019. a
Carrico, C. M., Kus, P., Rood, M. J., Quinn, P. K., and Bates, T. S.: Mixtures of pollution, dust, sea salt, and volcanic aerosol during ACE-Asia: Radiative properties as a function of relative humidity, J. Geophys. Res.-Atmos., 108, https://doi.org/10.1029/2003jd003405, 2003. a
Cavalli, F., Viana, M., Yttri, K. E., Genberg, J., and Putaud, J.-P.: Toward a standardised thermal-optical protocol for measuring atmospheric organic and elemental carbon: the EUSAAR protocol, Atmos. Meas. Tech., 3, 79–89, https://doi.org/10.5194/amt-3-79-2010, 2010. a
Cedeño, E., Sun, Z., Hong, Z., and Du, J.: Raman spectroscopy for profiling physical and chemical properties of atmospheric aerosol particles: A review, Ecotoxicol. Environ. Saf., 249, https://doi.org/10.1016/j.ecoenv.2022.114405, 2023. a
Chen, J., Li, Z., Lv, M., Wang, Y., Wang, W., Zhang, Y., Wang, H., Yan, X., Sun, Y., and Cribb, M.: Aerosol hygroscopic growth, contributing factors, and impact on haze events in a severely polluted region in northern China, Atmos. Chem. Phys., 19, 1327–1342, https://doi.org/10.5194/acp-19-1327-2019, 2019. a, b
Chen, X., Chu, Y., Chu, Y., Lee, A. K., Gen, M., Kasthuriarachchi, N. Y., Chan, C. K., and Li, Y. J.: Relative Humidity History Affects Hygroscopicity of Mixed Particles of Glyoxal and Reduced Nitrogenous Species, Environ. Sci. Technol., 54, https://doi.org/10.1021/acs.est.0c00680, 2020. a, b
Chicco, D., Sichenze, A., and Jurman, G.: A simple guide to the use of Student’s t-test, Mann-Whitney U test, Chi-squared test, and Kruskal-Wallis test in biostatistics, BioData Mining, 18, https://doi.org/10.1186/s13040-025-00465-6, 2025. a
Cirisan, A., Luo, B. P., Engel, I., Wienhold, F. G., Sprenger, M., Krieger, U. K., Weers, U., Romanens, G., Levrat, G., Jeannet, P., Ruffieux, D., Philipona, R., Calpini, B., Spichtinger, P., and Peter, T.: Balloon-borne match measurements of midlatitude cirrus clouds, Atmos. Chem. Phys., 14, 7341–7365, https://doi.org/10.5194/acp-14-7341-2014, 2014. a
Clarke, A. D., Howell, S., Quinn, P. K., Bates, T. S., Ogren, J. A., Andrews, E., Jefferson, A., Massling, A., Mayol-Bracero, O., Maring, H., Savoie, D., and Cass, G.: INDOEX aerosol: A comparison and summary of chemical, microphysical, and optical properties observed from land, ship, and aircraft, J. Geophys. Res.-Atmos., 107, https://doi.org/10.1029/2001JD000572, 2002. a
Collaud Coen, M., Praz, C., Haefele, A., Ruffieux, D., Kaufmann, P., and Calpini, B.: Determination and climatology of the planetary boundary layer height above the Swiss plateau by in situ and remote sensing measurements as well as by the COSMO-2 model, Atmos. Chem. Phys., 14, 13205–13221, https://doi.org/10.5194/acp-14-13205-2014, 2014. a, b, c
Collaud Coen, M., Brem, B. T., Gysel-Beer, M., Modini, R., Henne, S., Steinbacher, M., Putero, D., Gini, M. I., and Eleftheriadis, K.: Detection and climatology of Saharan dust frequency and mass at the Jungfraujoch (3580 m a.s.l., Switzerland), Atmos. Chem. Phys., 26, 1623–1645, https://doi.org/10.5194/acp-26-1623-2026, 2026. a
Dada, L., Brem, B. T., Amarandi-Netedu, L.-M., Collaud Coen, M., Evangeliou, N., Hueglin, C., Nowak, N., Modini, R., Steinbacher, M., and Gysel-Beer, M.: Sources of ultrafine particles at a rural midland site in Switzerland, Aerosol Research, 3, 315–336, https://doi.org/10.5194/ar-3-315-2025, 2025. a, b, c, d, e
Deshmukh, S., Poulain, L., Wehner, B., Henning, S., Petit, J.-E., Fombelle, P., Favez, O., Herrmann, H., and Pöhlker, M.: External particle mixing influences hygroscopicity in a sub-urban area, Atmos. Chem. Phys., 25, 741–758, https://doi.org/10.5194/acp-25-741-2025, 2025. a, b, c
Díaz-Zurita, A., Naval-Hernández, V. M., Whiteman, D. N., Rodríguez-Navarro, O., Muñiz-Rosado, J., Pérez-Ramírez, D., Alados-Arboledas, L., and Navas-Guzmán, F.: Sensitivity Analysis of the Differential Atmospheric Transmission in Water Vapour Mixing Ratio Retrieval from Raman Lidar Measurements, Remote Sens, 17, 3444, https://doi.org/10.3390/rs17203444, 2025. a
Díaz-Zurita, A., Navas-Guzmán, F., and Pérez-Ramírez, D.: Five-day NOAA HYSPLIT backward trajectories for hygroscopic aerosol layers over Payerne, Zenodo [data set], https://doi.org/10.5281/zenodo.23010868, 2026. a
Dinoev, T., Simeonov, V., Arshinov, Y., Bobrovnikov, S., Ristori, P., Calpini, B., Parlange, M., and van den Bergh, H.: Raman Lidar for Meteorological Observations, RALMO – Part 1: Instrument description, Atmos. Meas. Tech., 6, 1329–1346, https://doi.org/10.5194/amt-6-1329-2013, 2013. a, b, c, d, e, f
Doane, D. P.: Aesthetic frequency classifications, Am. Stat., 30, https://doi.org/10.1080/00031305.1976.10479172, 1976. a
Douville, H., Raghavan, K., Renwick, J., Allan, R., Arias, P., Barlow, M., Cerezo-Mota, R., Cherchi, A., Gan, T., Gergis, J., Jiang, D., Khan, A., Pokam Mba, W., Rosenfeld, D., Tierney, J., and Zolina, O.: Water Cycle Changes, in: Climate Change 2021: The Physical Science Basis. Contribution of Working Group I to the Sixth Assessment Report of the Intergovernmental Panel on Climate Change, edited by: Masson-Delmotte, V., Zhai, P., Pirani, A., Connors, S., Péan, C., Berger, S., Caud, N., Chen, Y., Goldfarb, L., Gomis, M., Huang, M., Leitzell, K., Lonnoy, E., Matthews, J., Maycock, T., Waterfield, T., Yelekçi, O., Yu, R., and Zhou, B., chap. 8, pp. 1055–1210, Cambridge University Press, Cambridge, United Kingdom and New York, NY, USA, https://doi.org/10.1017/9781009157896.010, 2021. a
Durand, E., Durdina, L., Smallwood, G., Johnson, M., Spirig, C., Edebeli, J., Roth, M., Brem, B., Sevcenco, Y., and Crayford, A.: Correction for particle loss in a regulatory aviation nvPM emissions system using measured particle size, J. Aerosol. Sci., 169, https://doi.org/10.1016/j.jaerosci.2023.106140, 2023. a
Eck, T. F., Holben, B. N., Reid, J. S., Giles, D. M., Rivas, M. A., Singh, R. P., Tripathi, S. N., Bruegge, C. J., Platnick, S., Arnold, G. T., Krotkov, N. A., Carn, S. A., Sinyuk, A., Dubovik, O., Arola, A., Schafer, J. S., Artaxo, P., Smirnov, A., Chen, H., and Goloub, P.: Fog- and cloud-induced aerosol modification observed by the aerosol robotic network (AERONET), J. Geophys. Res.-Atmos., 117, https://doi.org/10.1029/2011JD016839, 2012. a
Eirund, G. K., Drossaart van Dusseldorp, S., Brem, B. T., Dedekind, Z., Karrer, Y., Stoll, M., and Lohmann, U.: Aerosol–cloud–precipitation interactions during a Saharan dust event–A summertime case-study from the Alps, Q. J. R. Meteorol. Soc., 148, 943–961, https://doi.org/10.1002/qj.4240, 2022. a
EMPA: Technischer Bericht zum Nationalen Beobachtungsnetz für Luftfremdstoffe (NABEL) 2025, Tech. rep., EMPA, Dübendorf, Switzerland, https://www.empa.ch/documents/d/s503/technischer-bericht-nabel-2025 (last access: 16 October 2026), 2025. a
Feingold, G. and Morley, B.: Aerosol hygroscopic properties as measured by lidar and comparison with in situ measurements, J. Geophys. Res.-Atmos, 108, https://doi.org/10.1029/2002jd002842, 2003. a, b, c
Fernández, A. J., Molero, F., Becerril-Valle, M., Coz, E., Salvador, P., Artíñano, B., and Pujadas, M.: Application of Remote Sens techniques to study aerosol water vapour uptake in a real Atmos, Atmos. Res., 202, 112–127, https://doi.org/10.1016/j.atmosres.2017.11.020, 2018. a, b
Ferrare, R. A., Melfi, S. H., Whiteman, D. N., Evans, K. D., Poellot, M., and Kaufman, Y. J.: Raman lidar measurements of aerosol extinction and backscattering 2. Derivation of aerosol real refractive index, single-scattering albedo, and humidification factor using Raman lidar and aircraft size distribution measurements, J. Geophys. Res.-Atmos., 103, https://doi.org/10.1029/98JD01647, 1998. a
Fierz-Schmidhauser, R., Zieger, P., Gysel, M., Kammermann, L., DeCarlo, P. F., Baltensperger, U., and Weingartner, E.: Measured and predicted aerosol light scattering enhancement factors at the high alpine site Jungfraujoch, Atmos. Chem. Phys., 10, 2319–2333, https://doi.org/10.5194/acp-10-2319-2010, 2010. a
Giles, D. M., Sinyuk, A., Sorokin, M. G., Schafer, J. S., Smirnov, A., Slutsker, I., Eck, T. F., Holben, B. N., Lewis, J. R., Campbell, J. R., Welton, E. J., Korkin, S. V., and Lyapustin, A. I.: Advancements in the Aerosol Robotic Network (AERONET) Version 3 database – automated near-real-time quality control algorithm with improved cloud screening for Sun photometer aerosol optical depth (AOD) measurements, Atmos. Meas. Tech., 12, 169–209, https://doi.org/10.5194/amt-12-169-2019, 2019. a
Goldsmith, J. E.: Turn-key Raman lidar for profiling atmospheric water vapor, clouds, and aerosols, Appl. Opt., 37, https://doi.org/10.1364/ao.37.004979, 1998. a
Granados-Muñoz, M. J., Navas-Guzmán, F., Bravo-Aranda, J. A., Guerrero-Rascado, J. L., Lyamani, H., Valenzuela, A., Titos, G., Fernández-Gálvez, J., and Alados-Arboledas, L.: Hygroscopic growth of atmospheric aerosol particles based on active remote sensing and radiosounding measurements: selected cases in southeastern Spain, Atmos. Meas. Tech., 8, 705–718, https://doi.org/10.5194/amt-8-705-2015, 2015. a
Gysel, M., Crosier, J., Topping, D. O., Whitehead, J. D., Bower, K. N., Cubison, M. J., Williams, P. I., Flynn, M. J., McFiggans, G. B., and Coe, H.: Closure study between chemical composition and hygroscopic growth of aerosol particles during TORCH2, Atmos. Chem. Phys., 7, 6131–6144, https://doi.org/10.5194/acp-7-6131-2007, 2007. a
Haefele, A., Hervo, M., Turp, M., Lampin, J.-L., Haeffelin, M., Lehmann, V., the E-PROFILE team, and the TOPROF team: The E-PROFILE network for the operational measurement of wind and aerosol profiles over Europe, in: Proceedings of TECO, Madrid, Spain, https://www.eumetnet.eu/wp-content/uploads/2016/10/E-PROFILE_TECO_Madrid_2016.pdf (last access: 5 November 2026), 2016. a
Hale, G. M. and Querry, M. R.: Optical Constants of Water in the 200-nm to 200-µm Wavelength Region, Appl. Opt., 12, 555–563, https://doi.org/10.1364/AO.12.000555, 1973. a
Hänel, G.: The properties of atmospheric aerosol particles as functions of the relative humidity at thermodynamic equilibrium with the surrounding moist air, Adv. Geophys., 19, https://doi.org/10.1016/S0065-2687(08)60142-9, 1976. a, b
Hermann, M., Stratmann, F., Wilck, M., and Wiedensohler, A.: Sampling characteristics of an aircraft-borne aerosol inlet system, J. Atmos. Ocean Tech., 18, https://doi.org/10.1175/1520-0426(2001)018<0007:SCOAAB>2.0.CO;2, 2001. a
Hicks-Jalali, S., Sica, R. J., Martucci, G., Maillard Barras, E., Voirin, J., and Haefele, A.: A Raman lidar tropospheric water vapour climatology and height-resolved trend analysis over Payerne, Switzerland, Atmos. Chem. Phys., 20, 9619–9640, https://doi.org/10.5194/acp-20-9619-2020, 2020. a
Holben, B. N., Eck, T. F., Slutsker, I., Tanré, D., Buis, J. P., Setzer, A., Vermote, E., Reagan, J. A., Kaufman, Y. J., Nakajima, T., Lavenu, F., Jankowiak, I., and Smirnov, A.: AERONET – A federated instrument network and data archive for aerosol characterization, Remote Sens. Environ., 66, https://doi.org/10.1016/S0034-4257(98)00031-5, 1998. a
Hüglin, C. and Grange, S. K.: Chemical Characterisation and Source Identification of PM10 and PM2.5 in Switzerland, Project report, Empa, Swiss Federal Laboratories for Materials Science and Technology, Dübendorf, Switzerland, https://www.bafu.admin.ch/dam/en/sd-web/oyMXRQizcq24 (last access: 5 November 2026), 2021. a, b, c
Hüglin, C. and Schwarzenbach, B.: Feinstaubmessungen (PM10 und PM2.5) mit dem Fidas 200 der Firma Palas im NABEL, Tech. rep., Empa, Abteilung für Luftfremdstoffe und Umwelttechnik, https://www.empa.ch/documents/56101/246436/Fidas_200_NABEL.pdf/93790947-135a-4575-a718-370316f506c5 (last access: 5 November 2026), 2016. a
Hüglin, C., Buchmann, B., Steinbacher, M., and Emmenegger, L.: The Swiss National Air Pollution Monitoring Network (NABEL) – Bridging Science and Environmental Policy, Chimia, 78, 722–727, https://doi.org/10.2533/chimia.2024.722, 2024. a
Jefferson, A., Hageman, D., Morrow, H., Mei, F., and Watson, T.: Seven years of aerosol scattering hygroscopic growth measurements from SGP: Factors influencing water uptake, J. Geophys. Res.-Atmos., 122, https://doi.org/10.1002/2017JD026804, 2017. a, b
Jing, D., He, Y., Yin, Z., Müller, D., Huang, K., and Yi, F.: Hygroscopic growth characteristics of anthropogenic aerosols over central China revealed by lidar observations, Atmos. Meas. Tech., 19, 389–403, https://doi.org/10.5194/amt-19-389-2026, 2026. a, b, c, d, e
Jones, A. C., Hill, A., Remy, S., Abraham, N. L., Dalvi, M., Hardacre, C., Hewitt, A. J., Johnson, B., Mulcahy, J. P., and Turnock, S. T.: Exploring the sensitivity of atmospheric nitrate concentrations to nitric acid uptake rate using the Met Office's Unified Model, Atmos. Chem. Phys., 21, 15901–15927, https://doi.org/10.5194/acp-21-15901-2021, 2021. a
Kammermann, L., Gysel, M., Weingartner, E., and Baltensperger, U.: 13-month climatology of the aerosol hygroscopicity at the free tropospheric site Jungfraujoch (3580 m a.s.l.), Atmos. Chem. Phys., 10, 10717–10732, https://doi.org/10.5194/acp-10-10717-2010, 2010. a, b, c
Keller, A., Specht, P., Steigmeier, P., and Weingartner, E.: A novel measurement system for unattended, in situ characterization of carbonaceous aerosols, Aerosol Research, 1, 65–79, https://doi.org/10.5194/ar-1-65-2023, 2023. a
Klett, J. D.: Stable analytical inversion solution for processing lidar returns, Appl. Opt., 20, 211–220, https://doi.org/10.1364/ao.20.000211, 1981. a, b
Klett, J. D.: Lidar inversion with variable backscatter/extinction ratios, Appl. Opt., 24, 1638–1643, https://doi.org/10.1364/ao.24.001638, 1985. a, b
Laly, F., Chazette, P., Totems, J., Crenn, V., Ledur, D., and Marpillat, A.: How does humidity affect lidar-derived aerosol optical properties, and how do they compare with CAMS?, Atmos. Meas. Tech., 18, 7629–7649, https://doi.org/10.5194/amt-18-7629-2025, 2025. a, b, c
Li, L., Li, M., Fan, X., Chen, Y., Lin, Z., Hou, A., Zhang, S., Zheng, R., and Chen, J.: Measurement report: The variation properties of aerosol hygroscopic growth related to chemical composition during new particle formation days in a coastal city of Southeast China, Atmos. Chem. Phys., 25, 3669–3685, https://doi.org/10.5194/acp-25-3669-2025, 2025. a, b, c
List, R. J.: Smithsonian Meteorological Tables, vol. 114 of Smithsonian Miscellaneous Collections, Smithsonian Institution, Washington, DC, 6th revised edn., https://repository.si.edu/handle/10088/23746 (last access: 5 November 2026), 1951. a
Liu, L., Tan, H., Fan, S., Cai, M., Xu, H., Li, F., and Chan, P.: Influence of aerosol hygroscopicity and mixing state on aerosol optical properties in the Pearl River Delta region, China, Sci. Total Environ., 627, https://doi.org/10.1016/j.scitotenv.2018.01.199, 2018. a
Liu, Y. and Daum, P. H.: Relationship of refractive index to mass density and self-consistency of mixing rules for multicomponent mixtures like ambient aerosols, J. Aerosol Sci., 39, https://doi.org/10.1016/j.jaerosci.2008.06.006, 2008. a
Liu, Y., Feng, Z., Zheng, F., Bao, X., Liu, P., Ge, Y., Zhao, Y., Jiang, T., Liao, Y., Zhang, Y., Fan, X., Yan, C., Chu, B., Wang, Y., Du, W., Cai, J., Bianchi, F., Petäjä, T., Mu, Y., He, H., and Kulmala, M.: Ammonium nitrate promotes sulfate formation through uptake kinetic regime, Atmos. Chem. Phys., 21, 13269–13286, https://doi.org/10.5194/acp-21-13269-2021, 2021. a
Lorenzo, G. R., Ziemba, L. D., Arellano, A. F., Barth, M. C., Crosbie, E. C., DiGangi, J. P., Diskin, G. S., Ferrare, R., Hilario, M. R. A., Shook, M. A., Tilmes, S., Wang, J., Xiao, Q., Zhang, J., and Sorooshian, A.: Measurement report: Characterization of aerosol hygroscopicity over Southeast Asia during the NASA CAMP2Ex campaign, Atmos. Chem. Phys., 25, 5469–5495, https://doi.org/10.5194/acp-25-5469-2025, 2025. a, b
Lv, M., Liu, D., Li, Z., Mao, J., Sun, Y., Wang, Z., Wang, Y., and Xie, C.: Hygroscopic growth of atmospheric aerosol particles based on lidar, radiosonde, and in situ measurements: Case studies from the Xinzhou field campaign, J. Quant. Spectrosc. Ra., 188, https://doi.org/10.1016/j.jqsrt.2015.12.029, 2017. a, b
Martucci, G., Voirin, J., Simeonov, V., Renaud, L., and Haefele, A.: A novel automatic calibration system for water vapor Raman LIDAR, in: EPJ Web of Conferences, vol. 176, p. 05008, EDP Sciences, ISSN 2100014X, https://doi.org/10.1051/epjconf/201817605008, 2018. a
Martucci, G., Navas-Guzmán, F., Renaud, L., Romanens, G., Gamage, S. M., Hervo, M., Jeannet, P., and Haefele, A.: Validation of pure rotational Raman temperature data from the Raman Lidar for Meteorological Observations (RALMO) at Payerne, Atmos. Meas. Tech., 14, 1333–1353, https://doi.org/10.5194/amt-14-1333-2021, 2021. a, b, c
MeteoSwiss: Air Pressure and Anticyclone Overview, https://www.meteoswiss.admin.ch/weather/weather-and-climate-from-a-to-z/anticyclone-high-pressure.html (last access: 12 January 2026), 2026a. a
MeteoSwiss: Air Pressure and Anticyclone Overview, https://www.meteoswiss.admin.ch/weather/weather-and-climate-from-a-to-z/low-pressure-situation.html (last access: 12 January 2026), 2026b. a, b
Minguillón, M. C., Querol, X., Baltensperger, U., and Prévôt, A. S.: Fine and coarse PM composition and sources in rural and urban sites in Switzerland: Local or regional pollution?, Sci. Total Environ., 427-428, https://doi.org/10.1016/j.scitotenv.2012.04.030, 2012. a, b, c, d
Miri, R., Pujol, O., Hu, Q., Goloub, P., Veselovskii, I., Podvin, T., and Ducos, F.: Innovative aerosol hygroscopic growth study from Mie–Raman–fluorescence lidar and microwave radiometer synergy, Atmos. Meas. Tech., 17, 3367–3375, https://doi.org/10.5194/amt-17-3367-2024, 2024. a
Mouton, M., Malek, K. A., James, M. H., Pokhrel, R. P., Fiddler, M. N., Asa-Awuku, A. A., and Bililign, S.: The hygroscopic properties of biomass burning aerosol from Eucalyptus and cow dung under different combustion conditions, Aerosol Sci. Technol., 57, 665–677, https://doi.org/10.1080/02786826.2023.2198587, 2023. a
Müller, T., Laborde, M., Kassell, G., and Wiedensohler, A.: Design and performance of a three-wavelength LED-based total scatter and backscatter integrating nephelometer, Atmos. Meas. Tech., 4, 1291–1303, https://doi.org/10.5194/amt-4-1291-2011, 2011. a
Navas-Guzmán, F., Fernández-Gálvez, J., Granados-Muñoz, M. J., Guerrero-Rascado, J. L., Bravo-Aranda, J. A., and Alados-Arboledas, L.: Tropospheric water vapour and relative humidity profiles from lidar and microwave radiometry, Atmos. Meas. Tech., 7, 1201–1211, https://doi.org/10.5194/amt-7-1201-2014, 2014. a
Navas-Guzmán, F., Kämpfer, N., and Haefele, A.: Validation of brightness and physical temperature from two scanning microwave radiometers in the 60 GHz O2 band using radiosonde measurements, Atmos. Meas. Tech., 9, 4587–4600, https://doi.org/10.5194/amt-9-4587-2016, 2016. a
Navas-Guzmán, F., Martucci, G., Collaud Coen, M., Granados-Muñoz, M. J., Hervo, M., Sicard, M., and Haefele, A.: Characterization of aerosol hygroscopicity using Raman lidar measurements at the EARLINET station of Payerne, Atmos. Chem. Phys., 19, 11651–11668, https://doi.org/10.5194/acp-19-11651-2019, 2019. a, b, c, d, e, f, g, h, i, j
Nowak, D.: Radiation and clouds: observations and model calculations for Payerne BSRN site, Ph.D. thesis, ETH Zurich, https://doi.org/10.3929/ethz-a-005694186, 2008. a
Nowak, N., Brem, B., Gysel-Beer, M., and Simon, L.: Inorganics in air and particle phase at Payerne, EBAS at NILU, https://doi.org/10.48597/HB8T-9C9B, 2023–2025. a
Pariyothon, J., Bualert, S., Choomanee, P., Rungratanaubon, T., Thongyen, T., Fakkaew, N., Phuetfoo, C., Phupijit, J., and Szymanski, W. W.: Hygroscopic Growth Factors of Sub-micrometer Atmospheric Aerosols at Four Selected Sites in Thailand, Aerosol Air Qual. Res., 23, https://doi.org/10.4209/aaqr.220374, 2023. a
Petters, M. D. and Kreidenweis, S. M.: A single parameter representation of hygroscopic growth and cloud condensation nucleus activity, Atmos. Chem. Phys., 7, 1961–1971, https://doi.org/10.5194/acp-7-1961-2007, 2007. a, b
Petzold, A., Ogren, J. A., Fiebig, M., Laj, P., Li, S.-M., Baltensperger, U., Holzer-Popp, T., Kinne, S., Pappalardo, G., Sugimoto, N., Wehrli, C., Wiedensohler, A., and Zhang, X.-Y.: Recommendations for reporting ”black carbon” measurements, Atmos. Chem. Phys., 13, 8365–8379, https://doi.org/10.5194/acp-13-8365-2013, 2013. a
Pérez-Ramírez, D., Whiteman, D. N., Veselovskii, I., Ferrare, R., Titos, G., Granados-Muñoz, M. J., Sánchez-Hernández, G., and Navas-Guzmán, F.: Spatiotemporal changes in aerosol properties by hygroscopic growth and impacts on radiative forcing and heating rates during DISCOVER-AQ 2011, Atmos. Chem. Phys., 21, 12021–12048, https://doi.org/10.5194/acp-21-12021-2021, 2021. a, b, c, d, e, f, g, h, i
Prahl, S.: miepython: Pure Python calculation of Mie scattering, Zenodo, https://doi.org/10.5281/zenodo.7949264, 2026. a
Rolph, G., Stein, A., and Stunder, B.: Real-time Environmental Applications and Display sYstem: READY, Environ. Model Softw., 95, https://doi.org/10.1016/j.envsoft.2017.06.025, 2017. a
Rosen, J. M. and Kjome, N. T.: Backscattersonde: a new instrument for atmospheric Aerosol Res, Appl. Opt., 30, 1552–1561, https://doi.org/10.1364/ao.30.001552, 1991. a
Rovira, J., Savadkoohi, M., Chen, G. I., Močnik, G., Aas, W., Alados-Arboledas, L., Artiñano, B., Aurela, M., Backman, J., Banerji, S., Beddow, D., Brem, B., Chazeau, B., Coen, M. C., Colombi, C., Conil, S., Costabile, F., Coz, E., de Brito, J. F., Eleftheriadis, K., Favez, O., Flentje, H., Freney, E., Gregorič, A., Gysel-Beer, M., Harrison, R., Hüglin, C., Hyvärinen, A., Ivančič, M., Kalogridis, A. C., Keernik, H., Konstantinos, G., Laj, P., Liakakou, E., Lin, C., Listrani, S., Luoma, K., Maasikmets, M., Manninen, H. E., Marchand, N., dos Santos, S. M., Mbengue, S., Mihalopoulos, N., Nicolae, D., Niemi, J. V., Norman, M., Ovadnevaite, J., Petit, J. E., Platt, S., Prévôt, A. S., Pujadas, M., Putaud, J. P., Riffault, V., Rigler, M., Rinaldi, M., Schwarz, J., Silvergren, S., Teinemaa, E., Teinilä, K., Timonen, H., Titos, G., Tobler, A., Vasilescu, J., Vratolis, S., Yttri, K. E., Yubero, E., Zíková, N., Alastuey, A., Petäjä, T., Querol, X., Yus-Díez, J., and Pandolfi, M.: A European aerosol phenomenology – 9: Light absorption properties of carbonaceous aerosol particles across surface Europe, Environ. Int., 195, https://doi.org/10.1016/j.envint.2024.109185, 2025. a
Rubia, J. M. D. L.: Rice University Rule to Determine the Number of Bins, Open J. Stat., 14, https://doi.org/10.4236/ojs.2024.141006, 2024. a
Schafer, J. S., Eck, T. F., Holben, B. N., Artaxo, P., and Duarte, A. F.: Characterization of the optical properties of atmospheric aerosols in Amazônia from long-term AERONET monitoring (1993–1995 and 1999–2006), J. Geophys. Res.-Atmos., 113, https://doi.org/10.1029/2007JD009319, 2008. a
Scott, D. W.: Scott's rule, Wiley Interdisciplinary Reviews: Computational Statistics, 2, https://doi.org/10.1002/wics.103, 2010. a
Seinfeld, J. H., Bretherton, C., Carslaw, K. S., Coe, H., DeMott, P. J., Dunlea, E. J., Feingold, G., Ghan, S., Guenther, A. B., Kahn, R., Kraucunas, I., Kreidenweis, S. M., Molina, M. J., Nenes, A., Penner, J. E., Prather, K. A., Ramanathan, V., Ramaswamy, V., Rasch, P. J., Ravishankara, A. R., Rosenfeld, D., Stephens, G., and Wood, R.: Improving our fundamental understanding of the role of aerosol-cloud interactions in the climate system, P. Natl. Acad. Sci. USA, 113, https://doi.org/10.1073/pnas.1514043113, 2016. a, b
Sicard, M., Fortunato dos Santos Oliveira, D. C., Muñoz-Porcar, C., Gil-Díaz, C., Comerón, A., Rodríguez-Gómez, A., and Dios Otín, F.: Measurement report: Spectral and statistical analysis of aerosol hygroscopic growth from multi-wavelength lidar measurements in Barcelona, Spain, Atmos. Chem. Phys., 22, 7681–7697, https://doi.org/10.5194/acp-22-7681-2022, 2022. a, b, c, d
Stein, A. F., Draxler, R. R., Rolph, G. D., Stunder, B. J., Cohen, M. D., and Ngan, F.: Noaa's hysplit atmospheric transport and dispersion modeling system, B. Am. Meteorol. Soc., 96, https://doi.org/10.1175/BAMS-D-14-00110.1, 2015. a
Swietlicki, E., Hansson, H. C., Hämeri, K., Svenningsson, B., Massling, A., Mcfiggans, G., Mcmurry, P. H., Petäjä, T., Tunved, P., Gysel, M., Topping, D., Weingartner, E., Baltensperger, U., Rissler, J., Wiedensohler, A., and Kulmala, M.: Hygroscopic properties of submicrometer atmospheric aerosol particles measured with H-TDMA instruments in various environments – A review, Tellus B, 60 B, https://doi.org/10.1111/j.1600-0889.2008.00350.x, 2008. a
Titos, G., Jefferson, A., Sheridan, P. J., Andrews, E., Lyamani, H., Alados-Arboledas, L., and Ogren, J. A.: Aerosol light-scattering enhancement due to water uptake during the TCAP campaign, Atmos. Chem. Phys., 14, 7031–7043, https://doi.org/10.5194/acp-14-7031-2014, 2014a. a, b
Titos, G., Lyamani, H., Cazorla, A., Sorribas, M., Foyo-Moreno, I., Wiedensohler, A., and Alados-Arboledas, L.: Study of the relative humidity dependence of aerosol light-scattering in southern Spain, Tellus B, 66, https://doi.org/10.3402/tellusb.v66.24536, 2014b. a, b
Titos, G., Cazorla, A., Zieger, P., Andrews, E., Lyamani, H., Granados-Muñoz, M. J., Olmo, F. J., and Alados-Arboledas, L.: Effect of hygroscopic growth on the aerosol light-scattering coefficient: A review of measurements, techniques and error sources, J. Atmos. Environ., https://doi.org/10.1016/j.atmosenv.2016.07.021, 2016. a
Titos, G., Burgos, M. A., Zieger, P., Alados-Arboledas, L., Baltensperger, U., Jefferson, A., Sherman, J., Weingartner, E., Henzing, B., Luoma, K., O'Dowd, C., Wiedensohler, A., and Andrews, E.: A global study of hygroscopicity-driven light-scattering enhancement in the context of other in situ aerosol optical properties, Atmos. Chem. Phys., 21, 13031–13050, https://doi.org/10.5194/acp-21-13031-2021, 2021. a, b
Vaisala: Vaisala Radiosonde RS41 Measurement Performance, Tech. rep., Vaisala, Helsinki, Finland, https://www.vaisala.com/sites/default/files/documents/WEA-MET-RS41-Performance-White-paper (last access: 5 November 2026), 2017. a
Vernier, J. P., Fairlie, T. D., Natarajan, M., Wienhold, F. G., Bian, J., Martinsson, B. G., Crumeyrolle, S., Thomason, L. W., and Bedka, K. M.: Increase in upper tropospheric and lower stratospheric aerosol levels and its potential connection with Asian pollution, J. Geophys. Res.-Atmos., 120, 1609–1619, https://doi.org/10.1002/2014JD022372, 2015. a
Veselovskii, I., Whiteman, D. N., Kolgotin, A., Andrews, E., and Korenskii, M.: Demonstration of aerosol property profiling by multiwavelength lidar under varying relative humidity conditions, J. Atmos. Ocean. Technol., 26, 1543–1557, https://doi.org/10.1175/2009JTECHA1254.1, 2009. a, b, c
Veselovskii, I., Whiteman, D. N., Korenskiy, M., Kolgotin, A., Dubovik, O., Perez-Ramirez, D., and Suvorina, A.: Retrieval of spatio-temporal distributions of particle parameters from multiwavelength lidar measurements using the linear estimation technique and comparison with AERONET, Atmos. Meas. Tech., 6, 2671–2682, https://doi.org/10.5194/amt-6-2671-2013, 2013. a
Veselovskii, I., Whiteman, D. N., Korenskiy, M., Suvorina, A., and Pérez-Ramírez, D.: Use of rotational Raman measurements in multiwavelength aerosol lidar for evaluation of particle backscattering and extinction, Atmos. Meas. Tech., 8, 4111–4122, https://doi.org/10.5194/amt-8-4111-2015, 2015. a, b
Veselovskii, I., Hu, Q., Goloub, P., Podvin, T., Dubois, G., Kolgotin, A., and Korenskii, M.: Impact of water uptake on fluorescence of atmospheric aerosols: insights from Mie–Raman–fluorescence lidar measurements, Atmos. Meas. Tech., 18, 6039–6051, https://doi.org/10.5194/amt-18-6039-2025, 2025. a
Whiteman, D. N.: Examination of the traditional Raman lidar technique I Evaluating the temperature-dependent lidar equations, Appl. Opt., 42, https://doi.org/10.1364/ao.42.002571, 2003. a, b, c, d
Whiteman, D. N., Melfi, S. H., and Ferrare, R. A.: Raman lidar system for the measurement of water vapor and aerosols in the Earth’s Atmos, Appl. Opt., 31, https://doi.org/10.1364/ao.31.003068, 1992. a
Whiteman, D. N., Demoz, B., Girolamo, P. D., Comer, J., Veselovskii, I., Evans, K., Wang, Z., Cadirola, M., Rush, K., Schwemmer, G., Gentry, B., Melfi, S. H., Mielke, B., Venable, D., and van Hove, T.: Raman lidar measurements during the International H2O Project. Part I: Instrumentation and analysis techniques, J. Atmos. Ocean Technol., 23, https://doi.org/10.1175/JTECH1838.1, 2006. a, b
WMO: Guide to Meteorological Instruments and Methods of Observation, WMO-No. 8, World Meteorological Organization, Geneva, Switzerland, 7th edn., https://www.weather.gov/media/epz/mesonet/CWOP-WMO8.pdf (last access: 5 November 2026), 2008. a
Wulfmeyer, V. and Feingold, G.: On the relationship between relative humidity and particle backscattering coefficient in the marine boundary layer determined with differential absorption lidar, J. Geophys. Res.-Atmos., 105, https://doi.org/10.1029/1999jd901030, 2000. a
Yau, M. K. and Rogers, R. R.: A short course in cloud physics, Elsevier, 3rd edn., https://shop.elsevier.com/books/a-short-course-in-cloud-physics/yau/978-0-08-057094-5 (last access: 5 November 2026), 1996. a
Yuan, L. and Zhao, C.: Quantifying particle-to-particle heterogeneity in aerosol hygroscopicity, Atmos. Chem. Phys., 23, 3195–3205, https://doi.org/10.5194/acp-23-3195-2023, 2023. a
Zanatta, M., Gysel, M., Bukowiecki, N., Müller, T., Weingartner, E., Areskoug, H., Fiebig, M., Yttri, K. E., Mihalopoulos, N., Kouvarakis, G., Beddows, D., Harrison, R. M., Cavalli, F., Putaud, J. P., Spindler, G., Wiedensohler, A., Alastuey, A., Pandolfi, M., Sellegri, K., Swietlicki, E., Jaffrezo, J. L., Baltensperger, U., and Laj, P.: A European aerosol phenomenology-5: Climatology of black carbon optical properties at 9 regional background sites across Europe, Atmos. Environ., 145, https://doi.org/10.1016/j.atmosenv.2016.09.035, 2016. a
Zhang, J., Wang, Y., Xu, J., Zuo, X., Lu, C., Zhu, B., Yang, Y., Yan, X., and Sun, Y.: Measurement report: Size-resolved and seasonal variations in aerosol hygroscopicity dominated by organic formation and aging: insights from a year-long observation in Nanjing, Atmos. Chem. Phys., 25, 17413–17428, https://doi.org/10.5194/acp-25-17413-2025, 2025. a
Zieger, P., Fierz-Schmidhauser, R., Weingartner, E., and Baltensperger, U.: Effects of relative humidity on aerosol light scattering: results from different European sites, Atmos. Chem. Phys., 13, 10609–10631, https://doi.org/10.5194/acp-13-10609-2013, 2013. a, b, c, d
Zieger, P., Fierz-Schmidhauser, R., Poulain, L., Müller, T., Birmili, W., Spindler, G., Wiedensohler, A., Baltensperger, U., and Weingartner, E.: Influence of water uptake on the aerosol particle light scattering coefficients of the Central European aerosol, Tellus B, 66, https://doi.org/10.3402/tellusb.v66.22716, 2014. a, b, c, d