
the Creative Commons Attribution 4.0 License.
the Creative Commons Attribution 4.0 License.
 | 30 Oct 2026
Source-dependent organic aerosol hygroscopicity in eastern China: observational evidence for conditional enhancement under biomass-burning influence

Jiwei Li
Zhisheng Zhang
Yunjie Xia
Liang Ran
Aerosol hygroscopicity is a key property governing aerosol water uptake and aerosol–cloud interactions, yet the hygroscopicity of organic aerosol (OA) remains poorly constrained because of its chemical complexity and diverse emission sources. Here, OA hygroscopicity (κOA) was retrieved from comprehensive field observations at a rural site in eastern China using humidified light-scattering measurements and ZSR-based closure analysis. κOA exhibited pronounced temporal variability during winter, ranging from nearly zero to 0.49 with a mean value of 0.11 ± 0.11. Although OA was generally highly oxidized, κOA was only weakly correlated with the O:C ratio, indicating that bulk oxidation state alone cannot explain its variability. Instead, κOA increased systematically with biomass-burning influence. Atmospheric aging substantially enhanced κOA under biomass-burning-dominated conditions, whereas highly oxidized OA under weak biomass-burning influence remained weakly hygroscopic. These findings demonstrate that the hygroscopic response of OA to atmospheric aging is fundamentally source dependent and indicate that source-dependent parameterizations provide a more physically realistic framework than conventional oxidation-based approaches for representing OA hygroscopicity in atmospheric models.
- Article
(3336 KB) - Full-text XML
-
Supplement
(2529 KB) - BibTeX
- EndNote


Aerosol hygroscopicity, which governs particle water uptake under ambient relative humidity (RH), is a fundamental property governing the environmental and climatic impacts of atmospheric aerosols (Wang and Chen, 2019). Hygroscopic growth modifies particle size and optical properties, thereby enhancing light extinction, reducing visibility, and altering aerosol radiative forcing. It also regulates cloud condensation nuclei (CCN) activation and cloud microphysical processes (Petters and Kreidenweis, 2007; Dusek et al., 2006). In hydrometeorologically active regions, even modest variations in aerosol hygroscopicity (κ) could alter CCN activation (Mallet et al., 2017) and thereby influence cloud microphysics, potentially modulating precipitation and extreme weather through aerosol–cloud–precipitation feedbacks (Fan et al., 2016; Rosenfeld et al., 2019). Furthermore, by increasing aerosol liquid water content, hygroscopic growth facilitates heterogeneous and multiphase chemical reactions that contribute to secondary aerosol formation (Ervens et al., 2011; Shi et al., 2024). Aerosol hygroscopicity is also a key parameter in satellite and lidar retrieval algorithms because aerosol optical and mass properties depend strongly on aerosol water uptake under ambient conditions (Zhao et al., 2017; Dawson et al., 2020). Despite its importance, however, aerosol hygroscopicity remains insufficiently constrained by observations, particularly for organic aerosol (OA).
The hygroscopicity of internally mixed aerosols is commonly described using the κ-Köhler framework (Petters and Kreidenweis, 2007), whereas bulk aerosol hygroscopicity can be predicted from individual chemical components through the Zdanovskii–Stokes–Robinson (ZSR) mixing rule (Stokes and Robinson, 1966). The hygroscopic behaviors of major inorganic species have been extensively characterized, allowing their contributions to bulk aerosol water uptake to be predicted with relatively high confidence. In contrast, OA remains much more difficult to constrain because of its extraordinary chemical complexity, diverse emission sources, and continuous atmospheric evolution (Jimenez et al., 2009). Direct measurements of ambient OA hygroscopicity (κOA) are therefore challenging, and κOA is generally inferred indirectly through closure analyses combining bulk hygroscopicity measurements with aerosol chemical composition within the ZSR framework (Kuang et al., 2021; Liu et al., 2021). Although a globally representative κOA value of approximately 0.12 has recently been suggested (Pöhlker et al., 2023), field observations reveal that κOA varies by more than one order of magnitude across different environments (Gunthe et al., 2009; Chang et al., 2010). Understanding the processes governing this variability remains a major challenge for accurately representing OA hygroscopicity in atmospheric models.
Atmospheric oxidation has traditionally been regarded as the dominant process governing OA hygroscopicity. Laboratory studies have consistently shown that oxidation increases the abundance of oxygen-containing functional groups, thereby enhancing the water solubility and hygroscopicity of secondary organic aerosol (SOA; Zhao et al., 2016). Consequently, positive relationships between κOA and oxidation metrics, particularly the elemental O:C ratio, have been widely reported for laboratory-generated SOA systems (Lambe et al., 2011), motivating the development of empirical parameterizations that predict κOA directly from oxidation state. However, under real atmospheric conditions influenced by multiple emission sources and complex chemical processing, relationships between κOA and oxidation metrics often become substantially weaker, highly nonlinear, or even inverse (Zhao et al., 2016; Kuang et al., 2021). For example, Cerully et al. (2015) found that biogenic isoprene-derived OA exhibited higher hygroscopicity than oxygenated OA despite its substantially lower oxidation level. These observations suggest that bulk oxidation state alone may not provide a universal predictor of OA hygroscopicity in the real atmosphere.
Increasing evidence suggests that emission source may substantially influence OA hygroscopicity beyond bulk oxidation state. Ambient observations have shown that OA factors originating from different emission sources or formation pathways can exhibit markedly different hygroscopic properties despite having similar oxidation levels (Kuang et al., 2021; Liu et al., 2021). Furthermore, aerosols originating from different emission sources may undergo distinct chemical evolution during atmospheric aging, resulting in distinct hygroscopic responses to atmospheric oxidation. These findings imply that emission source influences OA hygroscopicity not only through source-specific chemical composition but also by modulating its evolution during atmospheric aging. Consequently, the relative importance of emission source and atmospheric oxidation in governing OA hygroscopicity under ambient conditions remains insufficiently understood. This knowledge gap is particularly relevant in regions experiencing rapid changes in emission structure, where the relative contributions of different OA sources continue to evolve.
In eastern China, stringent emission controls over the past decade have led to substantial reductions in total aerosol loadings (Zheng et al., 2018). These changes have been associated with regional climate responses; for example, reduced aerosol loading has been shown to enhance Meiyu precipitation over the middle and lower reaches of the Yangtze River (Yang et al., 2022). Such findings highlight the sensitivity of regional climate to aerosol perturbations and underscore the importance of accurately constraining aerosol hygroscopicity. Meanwhile, the relative contribution of OA – characterized by diverse sources and complex chemical composition – has increased in fine particulate matter (Chen et al., 2024; Li et al., 2023). In addition to changes in aerosol abundance, ongoing transitions in emission structures have altered the relative importance of different OA sources and atmospheric processing pathways across eastern China, potentially leading to substantial changes in OA hygroscopic properties. Under these evolving emission scenarios, accurately representing OA hygroscopicity is becoming increasingly important for predicting aerosol radiative effects, aerosol–cloud interactions, and the associated regional climate responses.
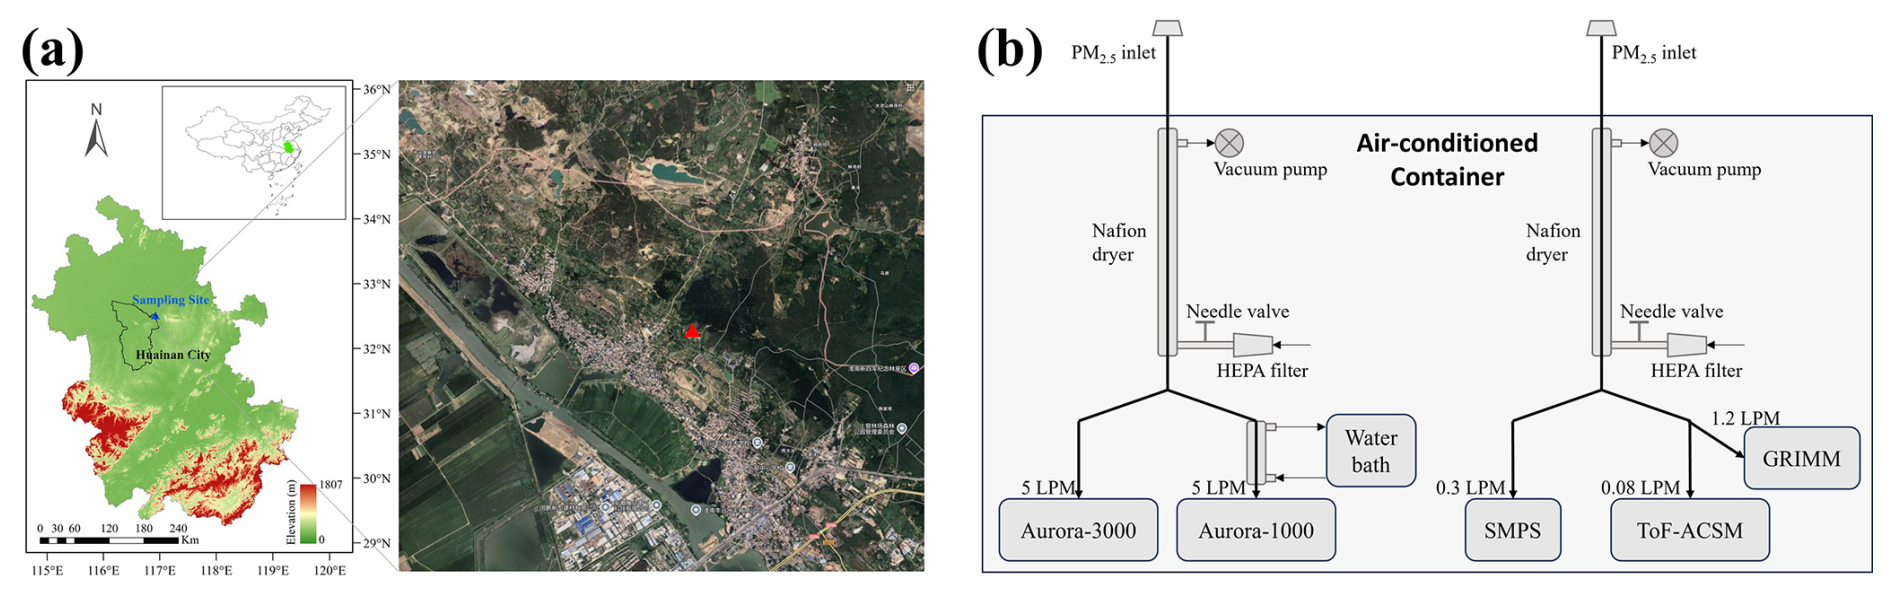
Figure 1(a) The geographic location of the Huainan Climate and Environment Observatory marked by a triangle on the topographic map; (b) schematic diagram of the hygroscopicity observation system. Map data © 2025 Google.
In this study, we conducted comprehensive field observations of aerosol hygroscopicity at a rural site in eastern China by combining humidified light-scattering measurements, particle number size distributions, and real-time aerosol chemical composition measurements. Bulk aerosol hygroscopicity was first retrieved under subsaturated conditions and subsequently used to constrain OA hygroscopicity through ZSR-based closure analysis. We then investigated whether bulk oxidation state alone adequately explains the observed variability of κOA, or whether emission source exerts a stronger control on OA hygroscopicity through its influence on atmospheric aging and chemical composition. Particular emphasis is placed on the influence of biomass-burning-related OA, whose contribution varies substantially during the observation period. Our results provide additional observational constraints on the mechanisms governing OA hygroscopicity and demonstrate that OA hygroscopicity parameterizations incorporating source-dependent information provide a more physically realistic framework than conventional oxidation-based approaches.
2.1 Observation Site
Field campaigns were conducted at the Huainan Climate and Environment Observatory, a rural research facility operated by the Institute of Atmospheric Physics, Chinese Academy of Sciences, during winter (10 January–9 February 2021) and summer (30 June–27 July 2021) seasons. Situated in Anhui Province, East China (32.74° N, 117.14° E; 70 ), the Huainan site occupies a forested hillside within a municipally maintained park located 20 km northeast of Huainan's urban core. The surrounding area exhibits mixed land-use patterns, with intensive agricultural activities dominating the northern and western sector and a residential community of approximately 7000 inhabitants bordering the southern foothills (Fig. 1a).
2.2 Measurements
2.2.1 Scattering hygroscopic growth
A humidified scattering measurement system was employed to quantify the aerosol scattering hygroscopic growth factor, denoted as f(RH), across RH ranges of ∼ 40 %–90 %. The system comprises two integrating nephelometers operating in parallel: one measures dry aerosols under controlled conditions (e.g., < 40 % RH), while the other monitors humidity-conditioned particles.
For dry-condition measurements, PM2.5 aerosols were dehydrated through a Nafion dryer (MD-700, Perma Pure LLC, USA) to residual humidity levels below 40 % RH before entering the nephelometer. The humidified channel utilized a temperature-regulated water bath coupled with a Nafion membrane humidifier (MH-700, Perma Pure LLC, USA) to implement controlled RH ramping (Fig. 1b). Gradual humidity increases from ∼ 40 % to ∼ 90 % RH were achieved through heating at 0.8 % RH min−1, followed by cooling phases at 1.2 % RH min−1 to reset baseline conditions.
To enhance temporal resolution, two water baths operated alternately: one executing RH elevation while the concurrent bath underwent cooling. This reciprocating design enabled uninterrupted measurement of humidity ramping phases, reducing complete cycle durations from ∼ 120 min (single-bath mode) to ∼ 60 min. Each humidity ramp cycle (40 %–90 % RH) provided synchronized dry and humidified scattering coefficients (Bsp,dry and Bsp,wet) for f(RH) computation.
In this study, Bsp,dry were measured at 450, 525, and 635 nm wavelengths using an Aurora 3000 multi-wavelength nephelometer (Ecotech, Australia), while Bsp,wet at 520 nm were acquired through an Aurora 1000 single-wavelength nephelometer (Ecotech, Australia). To bridge this spectral discrepancy, Bsp,dry values at 520 nm were interpolated from tri-wavelength Aurora 3000 measurements using logarithmic-scale regression between Bsp,dry and corresponding wavelength (λ):
where the coefficients α (i.e., scattering Ångström exponent) and β were determined through least-squares fitting of the 450, 525 and 635 nm spectral data. This spectral alignment protocol ensured methodological consistency for calculating the hygroscopic enhancement factor of scattering coefficient at 520 nm:
2.2.2 Aerosol size distribution
Particle number size distributions (PNSDs) were characterized using a scanning mobility particle sizer system (SMPS; TSI Inc., USA) covering dry mobility diameters (Dm) of ∼ 15–750 nm. During the winter campaign, the SMPS operated in standard scanning mode with 5 min temporal resolution, comprising a differential mobility analyzer (DMA 3081, TSI Inc., USA) and a condensation particle counter (CPC 3776, TSI Inc., USA).
For summer measurements, the system was reconfigured with a stepwise voltage protocol. The DMA executed 27 discrete voltage steps corresponding to logarithmically spaced Dm (18–750 nm), with 6- or 10 s dwell time per step (corresponding to 3- or 5 min full cycle). At each Dm, aerosol number concentrations were concurrently measured by the CPC for total particle counts and a cloud condensation nuclei counter (CCNC-100, Droplet Measurement Technologies) for CCN activation efficiency determination. This dual-detector configuration enabled simultaneous acquisition of size-resolved aerosol and CCN number concentration across the 18–750 nm Dm range. After aligning the time between DMA size selection and CPC/CCNC detection via the lag-time correction approach proposed by Wu et al. (2019), PNSD and corresponding CCN activation spectra (CCN/CN ratio vs. Dm) were inverted using a custom algorithm based on Hagen and Alofs (1983).
A Grimm 11-C laser aerosol spectrometer (GRIMM Aerosol Technik, Germany) was deployed during both campaigns to extend PNSD measurements into the coarse-particle size range. The instrument determines single-particle optical diameters (Dopt) from 0.25 to 32 µm based on 90° light-scattering detection and operated at a flow rate of 1.2 L min−1 with a temporal resolution of 1 min. Prior to deployment, the instrument was calibrated against a reference instrument maintained by the China Meteorological Administration. Owing to the PM2.5 size-selective inlet used in this study, particles larger than approximately 2 µm were largely excluded, resulting in measured Dopt distributions spanning ∼ 0.25–2 µm. The Grimm measurements were merged with the SMPS data to generate continuous PNSDs covering particle diameters from ∼ 15 nm to 2 µm, and agreement between the two instruments was verified over their overlapping size range.
2.2.3 Chemical composition
Chemical characterization of non-refractory fine particulate matter with aerodynamic diameters smaller than 2.5 µm (nrPM2.5) was conducted in real-time using a Time-of-Flight Aerosol Chemical Speciation Monitor (ToF-ACSM; Aerodyne Research Inc., USA) configured with a PM2.5 aerodynamic lens and a capture vaporizer. The instrument delivered continuous quantitative measurements of sulfate (), nitrate (), ammonium (), chloride (Cl−), and OA mass concentrations in PM2.5 at 10 min temporal resolution. Ambient aerosols were size-selected through a PM2.5 cyclone inlet and subsequently thermally vaporized at 600 °C under high vacuum in the ToF-ACSM chamber. The resulting non-refractory components were quantitatively analyzed via time-of-flight aerosol mass spectrometry. Instrument calibrations were performed before and after each month-long campaign using ammonium nitrate (AN) and ammonium sulfate (AS) reference standards with Dm of 300 nm. Wintertime OA mass spectra were resolved into four distinct components using positive matrix factorization (PMF) analysis implemented in the SoFi toolkit (Canonaco et al., 2013) using Igor Pro 6.37 (Wavemetrics Inc.). The identified factors included hydrocarbon-like OA (HOA), associated with traffic emissions; cooking-related OA (COA); biomass burning OA (BBOA); and oxygenated OA (OOA), representing secondary oxidized components. In contrast, summer OA mass spectra were adequately described by two factors, denoted as HOA and OOA (Sect. S1 in the Supplement). The spectrum of each OA factor is shown in Fig. S1 in the Supplement. Black carbon (BC) mass concentrations were continuously measured at a 1 min time resolution using an AE33 aethalometer (Aerosol d.o.o., Slovenia) equipped with a PM2.5 size-selective inlet.
2.2.4 Aerosol absorption coefficient
The AE33 measurements were also used to determine the aerosol absorption coefficient, which is expressed as
where Bap,λ is the aerosol absorption coefficient at wavelength λ; [eBC]λ is the equivalent BC mass concentration reported by the AE33 at its seven operating wavelengths (370, 470, 520, 590, 660, 880 and 950 nm); and σλ is the mass absorption cross-section provided by the manufacture. The factor C accounts for multiple scattering by the filter membrane as well as the influence of aerosol scattering on absorption measurement. In this study, a wavelength-independent value of C=3.9 was adopted, based on intercomparison between the AE33 and two photoacoustic extinctiometers (PAX, DMT, USA) with operating wavelengths of 375 and 870 nm, respectively (Fig. S2), which provides reference measurement of Bap using the photoacoustic technique and is not affected by filter-based scattering artifacts.
In regions far from major dust sources, such as Huainan in East China, Bap,λ is expected to be dominated by emissions from fossil fuel combustion and biomass burning. Accordingly, Bap,λ can be expressed as the sum of contributions from fossil fuel combustion () and biomass burning ():
The spectral dependence of both Bap,ff and Bap,bb is commonly described by a power–law relationship. Therefore, Eq. (4) can be rewritten as:
where AAEff and AAEbb are the absorption Ångström exponents (AAE) for fossil fuel combustion and biomass burning, respectively, while Kff and Kbb are fitting coefficients derived from absorption measurements of the AE33 operating wavelengths between 470 and 950 nm. Following Sandradewi et al. (2008), AAEff and AAEbb were fixed at 1.0 and 2.0, respectively. The relative contribution of biomass burning to BC (fbb) was then estimated as the fraction of biomass-burning-derived absorption to total aerosol absorption at 950 nm, where aerosol light absorption is assumed to be dominated by BC.
Bap,λ can also be decomposed into contributions from BC and non-BC components, thus can be expressed as:
where AAEBC and AAEnonBC are the AAE for BC and non-BC components, respectively, while KBC and KnonBC are fitting coefficients derived from measurements at the seven operating wavelengths of the AE33. Following common practice, AAEBC was fixed at 1.0 in this study. AAEnonBC was constrained to the range of 2–8, and the optimal value was selected by minimizing the residuals between the measured and fitted Bap,λ (Chen et al., 2015; Ran et al., 2016). Absorption by non-BC components is expected to mainly arises from light-absorbing OA (i.e., brown carbon; BrC) in this study, because the observation site is far from major dust sources.
2.2.5 Auxiliary measurements
Auxiliary measurements included meteorological parameters and trace gases. Air temperature, RH, atmospheric pressure, wind speed, and wind direction at 2 m above ground level were continuously monitored using a meteorological sensor (WXT530, Vaisala, Finland). Mixing ratios of SO2, CO, and O3 were measured using Model 43i, 48i, and 49i analyzers (Thermo Scientific, USA), respectively, whereas NO and NO2 were measured using a Model 42i analyzer (Thermo Scientific, USA). In addition, daily filter samples were collected for offline chemical analyses, including water-soluble inorganic ions, organic carbon (OC), elemental carbon (EC), and selected water-soluble organic compounds such as levoglucosan and mannosan. Detailed information on the filter sampling and chemical analyses is beyond the scope of this study and will be reported separately.
2.3 Data processing
2.3.1 Merging of aerosol size distribution
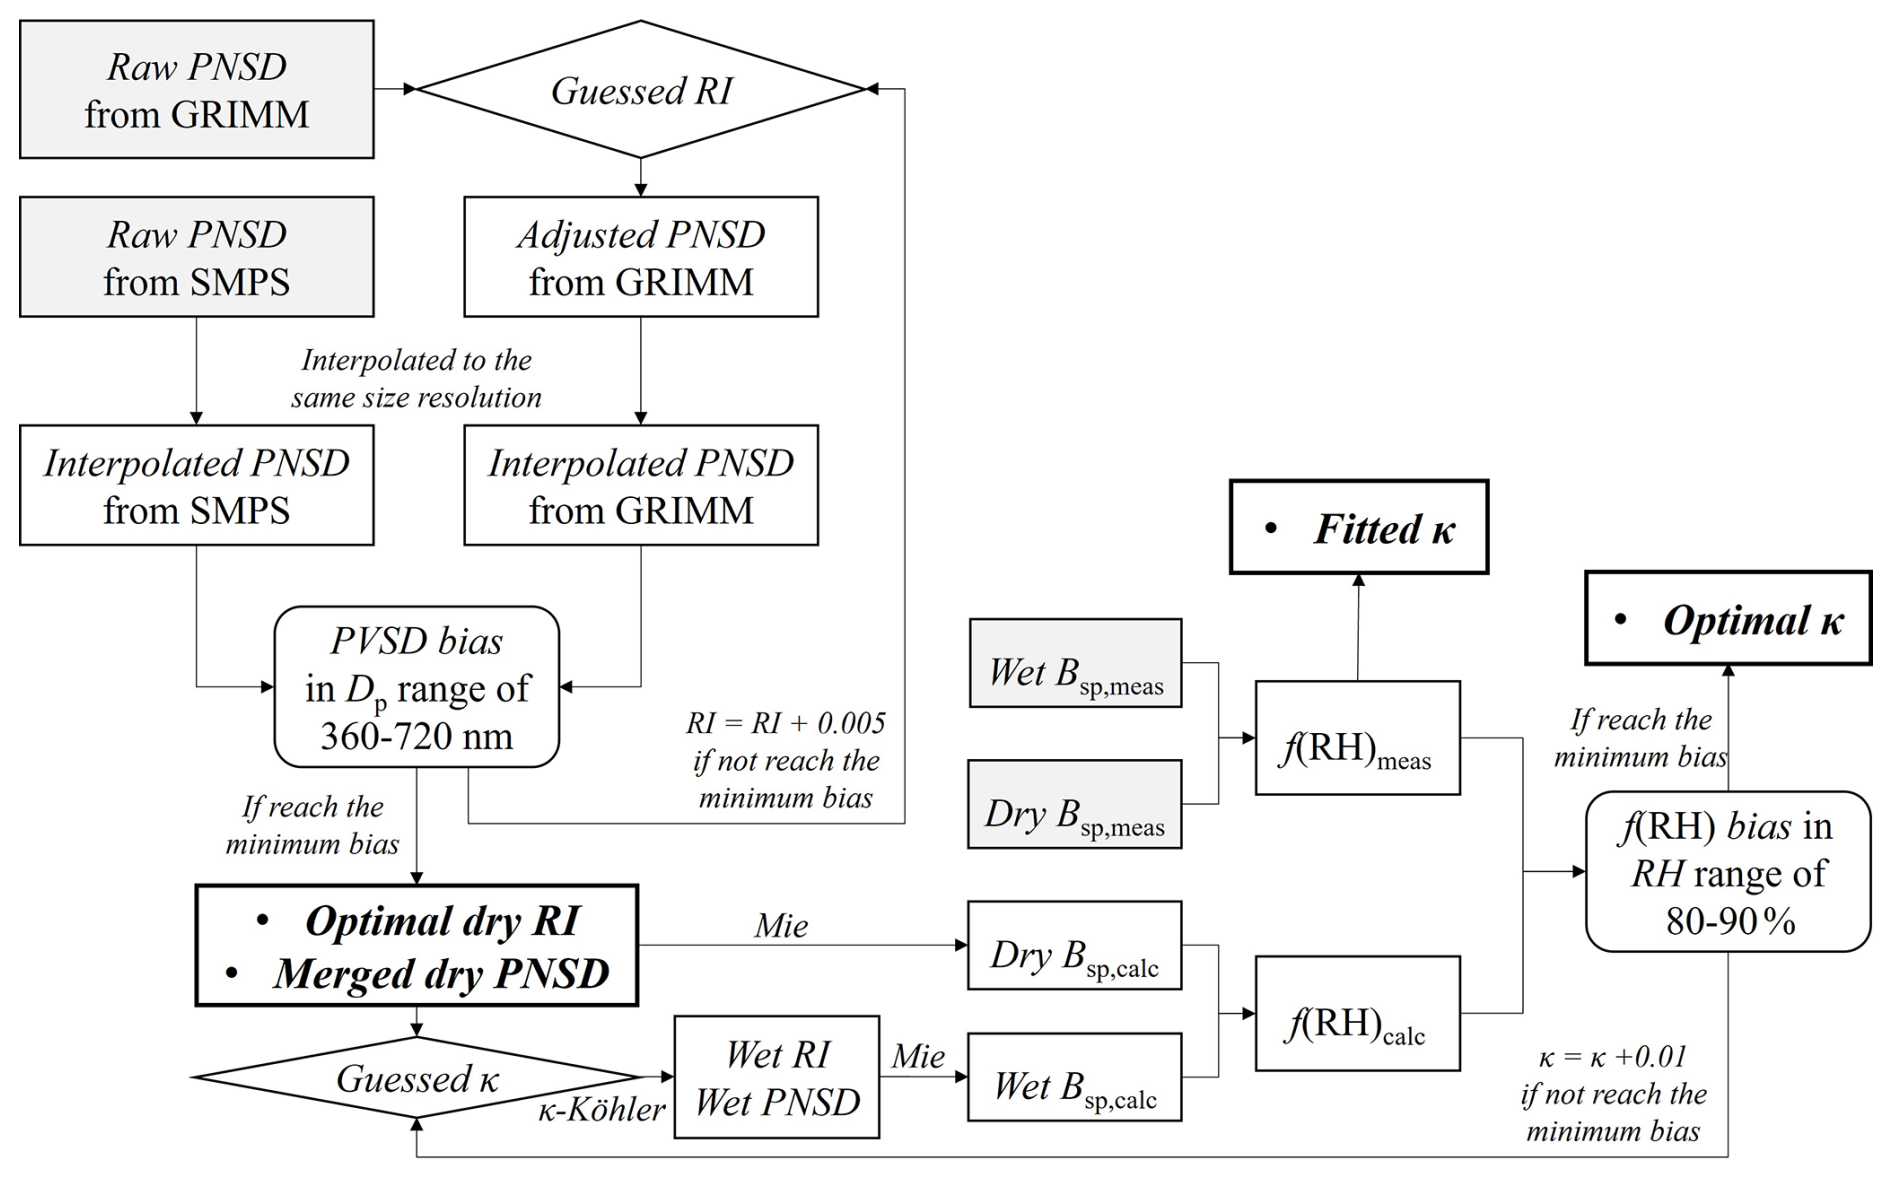
Data integration between SMPS (Dm) and Grimm 11-C (Dopt) measurements required reconciling their distinct sizing principles. As the Grimm spectrometer was factory-calibrated using polystyrene latex (PSL) spheres with a refractive index (RI) of 1.59, raw Dopt values exhibited systematic underestimation for ambient aerosols with divergent RIs, evidenced by discrepancies in particle PNSD within the overlapping size range (360–720 nm; Fig. S3). To resolve this, we developed a RI correction protocol grounded in Mie theory-derived scattering cross-section (Csp) calculations. First, the Csp value for each Grimm-reported Dopt was computed under PSL-calibrated conditions (RI = 1.59), incorporating the instrument's angular detection geometry (60–120° scattering angles). Next, we gradually adjusted the RI from 1.35 to 1.60 (ΔRI = 0.005) to calculate Csp-equivalent Dopt values and correspondingly Grimm-derived PNSD. The optimal RI was identified by minimizing the root-mean-square error (RMSE) between adjusted Grimm-derived and SMPS-measured particle volume size distributions (PVSD) over the 360–720 nm overlap range, considering the reference measurement of SMPS (Fig. 2). This procedure generated unified PNSD data spanning from ∼ 15 nm to ∼ 2 µm (Fig. S3). For the merged PNSD, the particle diameter is denoted as Dp, instead of either Dm or Dopt.
2.3.2 Inversion of hygroscopic parameter
Following the determination of optimal RI and merged dry-aerosol PNSD, the theoretical Bsp,dry was computed via Mie theory under spherical particle assumptions, incorporating Müller et al. (2011) angular response corrections for the Aurora 3000 nephelometer's non-ideal illumination geometry (e.g., 10–171° scattering angles). To distinguish model outputs from observations, calculated and measured Bsp,dry values are denoted as and , respectively. and values showed strong agreement across 450, 525, and 635 nm wavelengths (R2 > 0.99; Fig. S4), validating the RI correction and Mie computation framework.
To calculate the humidified PNSD, the κ-Köhler equation (Petters and Kreidenweis, 2007) is used. For a given κ, we calculated the diameter growth factor at arbitrary RH, denoted as g(RH), by solving the κ-Köhler equation:
where is the surface tension of solution/air interface, Mwater is the molecular weight of water, ρwater is the density of water, R is the universal gas constant, T is kelvin temperature, and Dp,dry is the dry particle diameter. Then the diameter of humidified particle diameter (Dp,wet) at arbitrary RH can be calculated as .
In practice, because the dry PNSD is measured under low RH conditions (e.g., RH < 40 %) rather than the absolutely dry condition with RH = 0, we derived the absolutely dry PNSD (RH = 0) from the measured PNSD under low RH conditions using the κ-Köhler equation first, and then calculated the humidified PNSD across the RH levels of Bsp,wet measurement. The RH of dry aerosols was recorded by the dry Aurora 3000 nephelometer. The RI of humidified particles was estimated from PNSD-merging derived RI of dry particles and RI of pure water using the Maxwell–Garnett mixing rule (Garnett, 1904). Combination the humidified PNSD and RI, the theoretical scattering coefficient of wet particles () was determined via Mie theory. Notably, the angular response correction was also applied in calculating , assuming that the Aurora 1000 shares the same angular sensitivity function as the Aurora 3000, as reported by Müller et al. (2011), owing to their similar instrument designs. Then, the theoretical f(RH), denoted as f(RH)calc, was obtained using Eq. (2) by replacing measured Bsp,dry and Bsp,wet by theoretical ones. A range of f(RH)calc values corresponding to different aerosol hygroscopic ability were acquired by changing κ in a range of 0.1–0.6 (Δκ = 0.01). The optimal κ (hereafter denoted as κinv) was identified by minimizing the RMSE between f(RH)calc and f(RH)meas over selected RH ranges (Fig. S3). The overall workflow – from PNSD merging to κ inversion – is schematized in Fig. 2. The κinv values were derived for different RH intervals (e.g., 50 %–60 %, 60 %–70 %, 70 %–80 %, 80 %–90 %) as well as for the entire 40 %–90 % RH range. Unless otherwise specified, κinv values retrieved over the 80 %–90 % RH range are used to represent bulk aerosol hygroscopicity, as the results are directly comparable with previous studies that report κinv within this RH range (Kuang et al., 2020, 2021) and are consistent with the RH conditions corresponding to the κ values adopted for well-characterized inorganic species when estimating OA hygroscopicity, as discussed below.
We also applied a single-parameter fitting to f(RH)meas, expressed as
where κfit is the fitting parameter and RHdry is the RH of dry aerosols. κfit can be used as a simple proxy for aerosol hygroscopic ability, with higher values indicating stronger water uptake; however, compared to κinv, it is also influenced by the PNSD in addition to aerosol chemical composition.
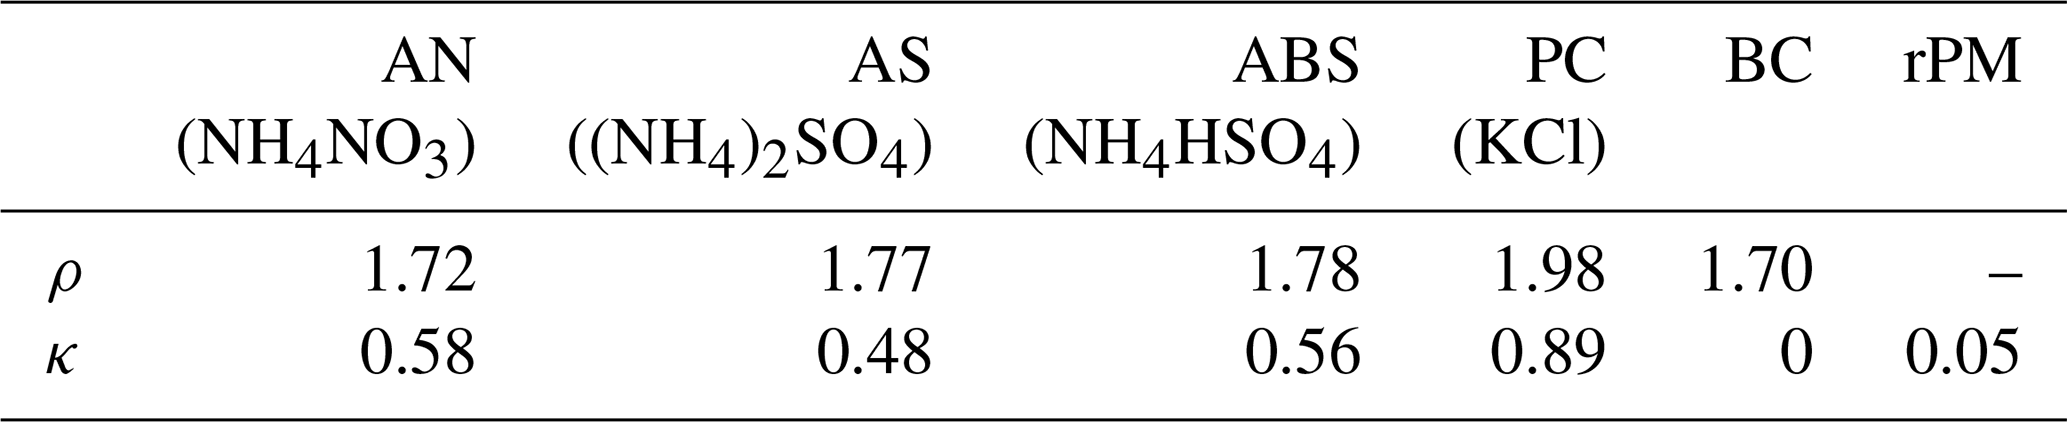
Table 1Densities (ρ) and hygroscopicity parameters (κ) of different species.
2.3.3 Hygroscopicity of OA
The bulk aerosol κ is usually chemically estimated using the ZSR volume-weighted mixing rule by assuming an internal mixture (Stokes and Robinson, 1966; Wu et al., 2016; Kuang et al., 2021):
where κi and ϵi represent the hygroscopicity parameter and volume fraction of species i, respectively. Chemical composition derived from the ToF-ACSM and AE33 measurements included AN, AS, ammonium bisulfate (ABS), potassium chloride (PC), OA, and BC. A simplified ion-pairing scheme following Gysel et al. (2007) was applied to convert the ion mass concentrations reported by the ToF-ACSM into the corresponding inorganic salt mass concentrations. Chloride was assumed to be entirely associated with potassium, forming PC, in consideration of the influence of biomass burning in the study region. The densities of the identified species, including AN, AS, ABS, PC and BC, were adopted from Gysel et al. (2007) and Kuang et al. (2021) and are summarized in Table 1. The density of OA was estimated using the governing equation developed by Kuwata et al. (2012), with the elemental ratios O:C and H:C as input parameters. The O:C and H:C ratios were calculated from f44 (the fractional ion intensity at = 44 from unit-mass-resolution data) and f43 (analogous to f44 but at = 43) using the fitted relationships established for an aerosol mass spectrometer equipped with a capture vaporizer (Fig. 5 in the Supporting Information of Hu et al., 2018). Other refractory species (rPM) were accounted for by residual volume calculation:
where total PM2.5 volume (VPM) was integrated from merged PVSD (∼ 15 nm–2.0 µm). The upper integration limit aligns with the volume-equivalent diameter (Dp) to aerodynamic diameter (Da) relationship: Da≈ (1.1–1.3) ×Dp for typical aerosol densities (1.2–1.7 g cm−3). These remaining refractory species were assumed to exhibit weak hygroscopicity and were assigned a hygroscopicity parameter of κrPM = 0.05 following Kuang et al. (2021). The κ values adopted for individual aerosol components are taken from Kuang et al. (2020, 2021) and are summarized in Table 1. Since κ is RH dependent under sub-saturation conditions (Zhao et al., 2022), the selected values are assumed to represent aerosol hygroscopicity at an RH of ∼ 85 %, consistent with the κinv values retrieved over the 80 %–90 % RH range. The consistency between κchem and κinv has been theoretically demonstrated by Kuang et al. (2020), thus OA hygroscopicity (κOA) was subsequently derived as:
The derived κOA may be subject to uncertainties in the input parameters used in the inversion, thus, we performed a Monte Carlo uncertainty propagation analysis, with 10 ,000 realizations for each data point in the κOA time series. In each realization, the input variables in Eqs. (10) and (11) were randomly perturbed according to their prescribed uncertainties. Given the similarities in the measurement and inversion methods, the uncertainties assigned to the input variables, including the mass concentrations of non-refractory aerosol species measured by the ToF-ACSM, VPM, κinv and κrPM, were based on the estimates reported in Table 2 of Kuang et al. (2021). It should be noted that the derived κOA does not account for the potential contribution of OA components lost during the drying process before the aerosol enters the measurement instruments. In addition, the potential contribution of co-condensation to aerosol hygroscopic growth (Gunthe et al., 2021) is not explicitly considered because gas-phase precursor measurements (e.g., HCl and NH3) and a dedicated thermodynamic analysis are not available in this study. These factors may introduce additional uncertainties that are not captured by the Monte Carlo analysis.
3.1 Overview of Meteorology and Aerosol
The study site is located in the temperate monsoon region of eastern China, which is characterized by relatively cold and dry winters and hot and humid summers. During the winter campaign, the mean air temperature was 6.6 ± 4.1 °C and the ambient RH averaged 54.0 ± 20.5 % (Fig. S5). In contrast, the summer campaign was considerably warmer and more humid, with a mean temperature of 27.3 ± 3.0 °C and an RH of 75.0 ± 11.2 % (Fig. S6). Prevailing winds during both campaigns were predominantly from the south, with intermittent northwesterly air masses (Fig. S7).
Pronounced seasonal differences were observed in aerosol loading and chemical composition. The mean nrPM2.5 concentration reached 58.1 ± 39.8 µg m−3 during winter, nearly three times higher than the summer average (20.8 ± 12.0 µg m−3). Wintertime aerosol loadings were comparable to those reported for heavily polluted urban areas in eastern China (e.g., Nanjing; Zhang et al., 2017), indicating that the rural Huainan site was frequently influenced by severe regional pollution. High-pollution episodes generally coincided with elevated RH (Fig. S5), suggesting favourable conditions for secondary aerosol formation through multiphase processes and potential deterioration of air quality by hygroscopic growth.
OA was the dominant constituent of nrPM2.5 during both campaigns, accounting for 44.3 % of the aerosol mass in winter and increasing to 55.2 % in summer. OOA represented the largest OA fraction, contributing 84.0 % of total OA in winter and 94.0 % in summer, indicating that ambient OA was predominantly aged throughout both observation periods. BBOA accounted for 4.3 % of OA mass during winter but was not resolved during summer, reflecting enhanced biomass-burning emissions associated with wintertime heating. In addition, wintertime BBOA showed a strong positive correlation with COA (R = 0.69, p < 0.001), implying that local biomass-burning emissions were closely associated with residential activities.
Overall, the observations reveal a polluted atmosphere characterized by persistently aged OA and frequent high-RH conditions, particularly during winter pollution episodes. Such conditions provide an ideal opportunity to investigate aerosol hygroscopicity and to evaluate the respective contributions of inorganic and organic aerosol components to bulk aerosol water uptake.
3.2 Bulk Aerosol Hygroscopicity
Bulk aerosol hygroscopicity exhibited pronounced seasonal variability. The mean κfit was 0.18 ± 0.03 during winter and 0.26 ± 0.06 during summer, whereas the corresponding κinv were systematically higher, averaging 0.25 ± 0.04 and 0.31 ± 0.08, respectively (Figs. S5 and S6). It should be noted that κinv was available for only six days (2–7 July 2021) during the summer campaign because of CPC instrument failure. Consequently, the following analyses focus primarily on the winter observations.
The wintertime κinv measured at Huainan was generally higher than that reported at the rural Heshan site in the Pearl River Delta (Kuang et al., 2021). This difference is consistent with the substantially higher inorganic-to-organic mass ratio observed at Huainan (1.27 compared with 0.72 at Heshan), highlighting the dominant contribution of hygroscopic inorganic salts to bulk aerosol water uptake. Nevertheless, the winter mean κinv (0.25 ± 0.04) remained lower than the continental aerosol value of 0.3 that is commonly adopted in atmospheric models (e.g., Andreae and Rosenfeld, 2008). Using κ = 0.3 instead of the measurement-constrained value resulted in an overestimation of CCN number concentration (NCCN) by as much as 10 % at a supersaturation of 0.1 %, although the bias decreased to approximately 3 % at 0.8 % supersaturation (Fig. S8). These results demonstrate that regionally constrained hygroscopicity parameters can substantially improve CCN predictions, particularly under low-supersaturation conditions where aerosol activation is highly sensitive to κ.
Interestingly, κinv exhibited a systematic decrease with increasing RH (Fig. S9a). The RH dependence became more pronounced for aerosol populations with larger κinvyvalues (Fig. S9b), indicating that aerosol hygroscopicity cannot always be represented by a constant κ under ambient conditions. Possible explanations include non-ideal solution effects, RH-dependent solute mass fractions and liquid–liquid phase separation at elevated RH (Liu et al., 2018; Li et al., 2021; Zhao et al., 2022), whereas uncertainties associated with surface tension assumptions (Figs. S10 and S11) and particle equilibration time (Liu et al., 2018) are unlikely to fully account for the observed trend. A similar decrease in κ with increasing RH was reported by Zhao et al. (2022) for both individual inorganic aerosols (e.g., AS) and ambient aerosols, which was attributed, at least in part, to variations in solute mass fraction within the aerosol–water system. A higher inorganic fraction generally leads to larger κ values and greater RH-induced variability in κ. Therefore, aerosol populations with higher κinv values, which are likely associated with larger inorganic fractions, may exhibit stronger RH dependence. Because elucidating the underlying mechanisms is beyond the scope of the present study, this RH dependence is not discussed further.
Distinct diurnal and pollution-dependent variations in κinv were closely associated with changes in aerosol chemical composition (Figs. S12–S14). Higher κinv values generally coincided with larger fractions of hygroscopic inorganic salts, whereas increased contributions from OA and BC were associated with lower bulk hygroscopicity. As pollution intensified, κinv first increased and then decreased, reflecting a compositional transition from inorganic-dominated aerosol growth at moderate pollution levels to increasingly OA-rich aerosol populations under heavily polluted conditions (Fig. S14).
These observations indicate that although inorganic salts dominate bulk aerosol hygroscopicity, the increasing contribution of OA during polluted periods may substantially modify aerosol water uptake. Quantifying the hygroscopicity of OA is therefore essential for understanding the observed variability in bulk aerosol hygroscopicity and is the focus of the following sections.
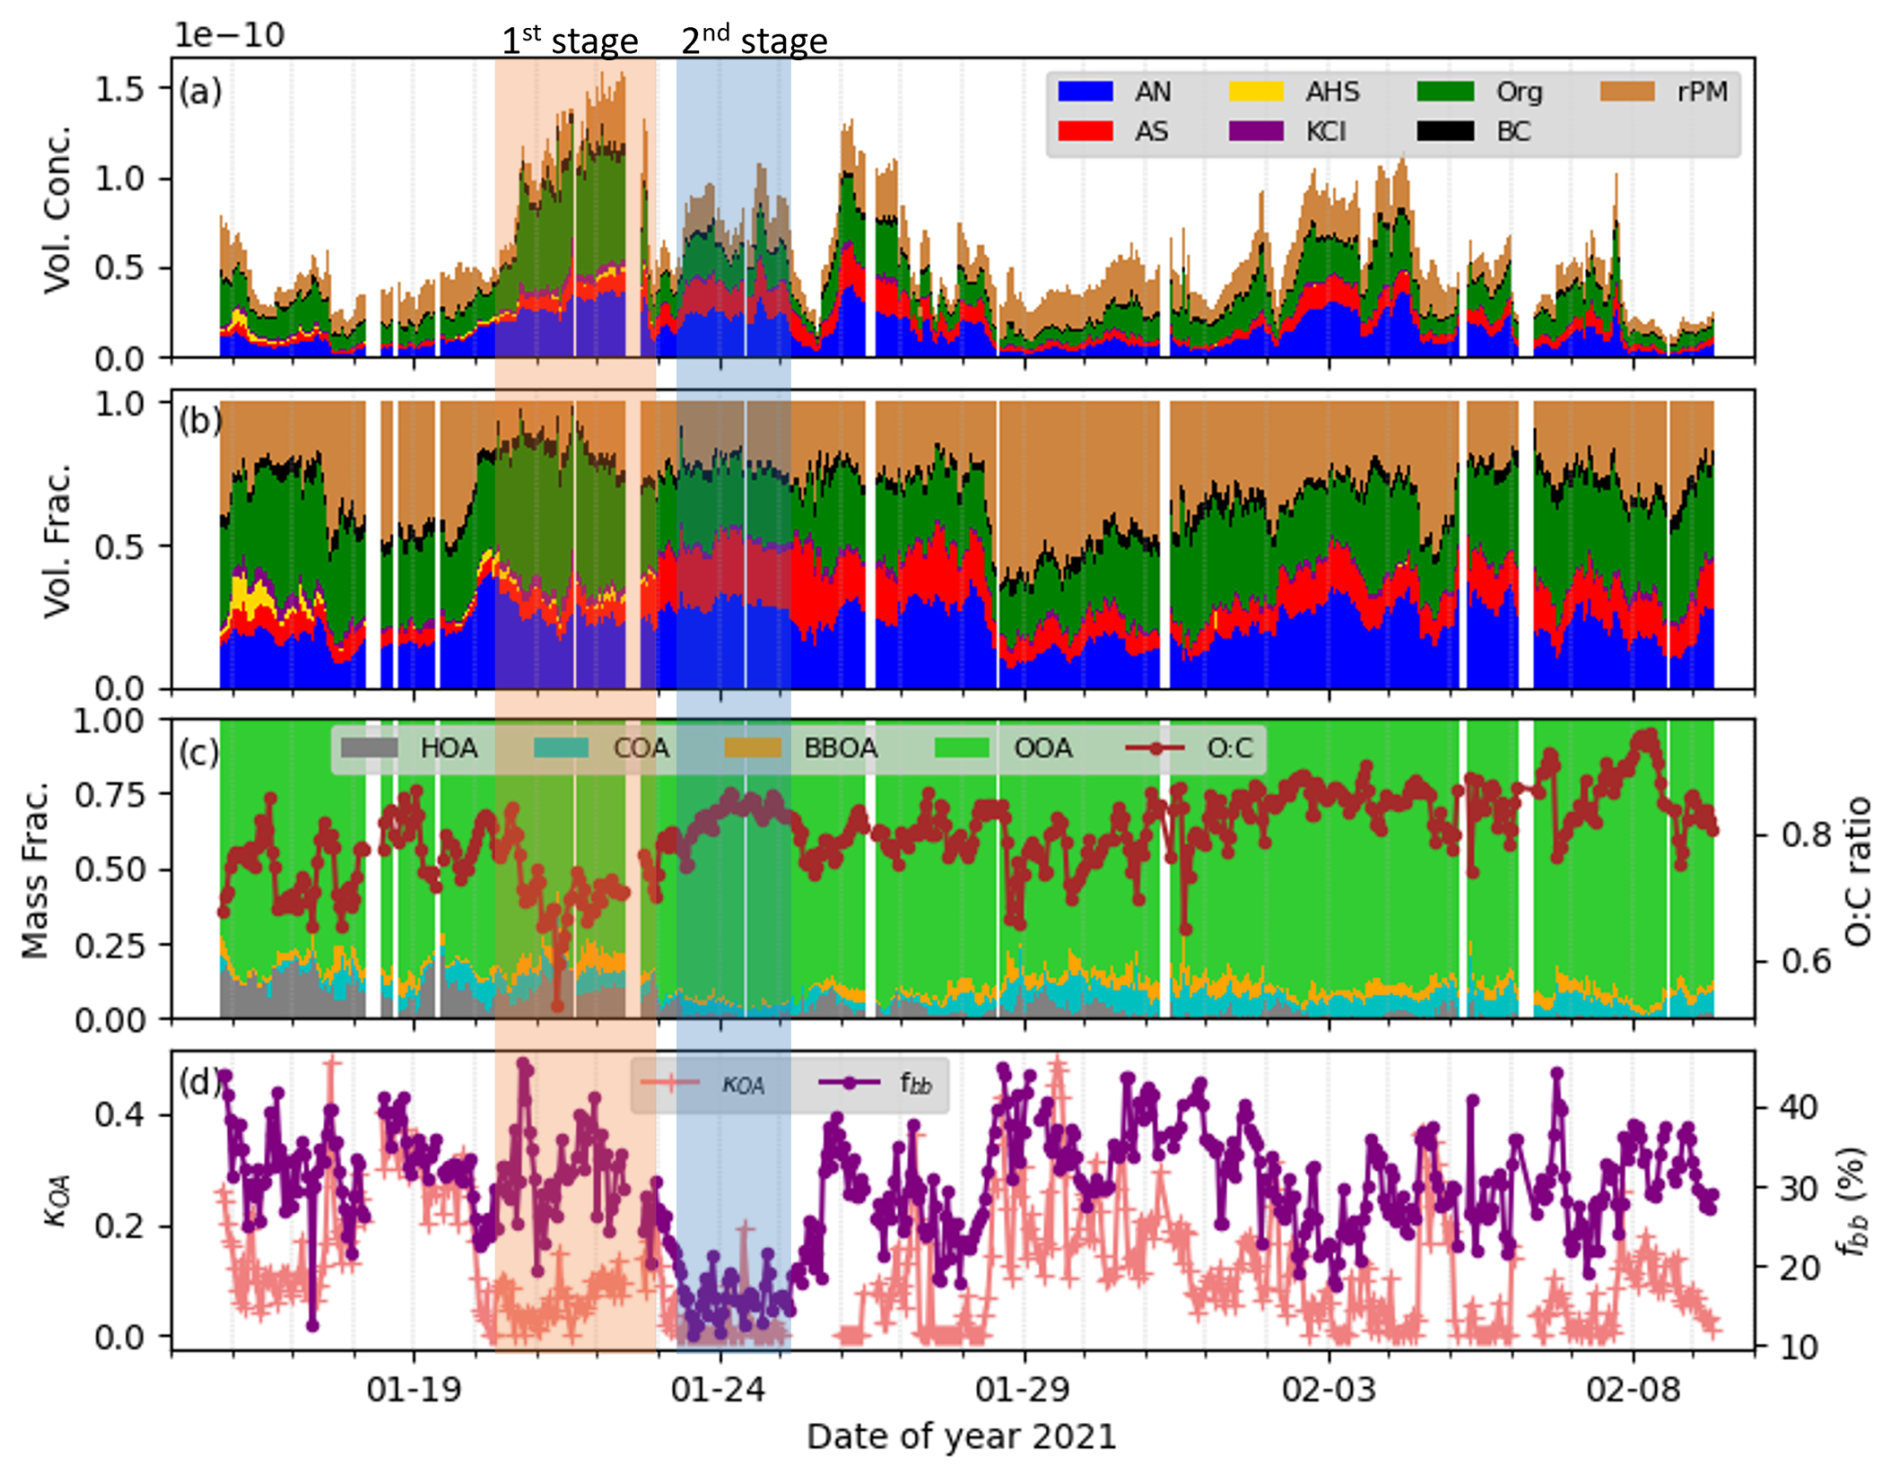
Figure 3Time series of (a) volume concentrations, (b) volume fractions of different chemical species in PM2.5, (c) mass fractions of different OA factors and O:C ratio, (d) κOA and relative contribution of biomass burning to BC (fbb) at the Huainan site during the winter campaign. The shaded area denotes a persistent pollution episode from 20 to 25 January 2021, with different colors indicating distinct stages of the episode.
3.3 Variability and Controls of OA Hygroscopicity
Wintertime κOA exhibited substantial temporal variability, ranging from nearly zero to 0.49 and averaging 0.11 ± 0.11 (mean ± standard deviation, Fig. 3d). This mean κOA was slightly higher than those reported at the Gucheng site in the North China Plain (0.08 ± 0.06; Kuang et al., 2020) and the Heshan site in the Pearl River Delta (0.085; Kuang et al., 2021), suggesting that OA at Huainan was, on average, relatively more hygroscopic. Such pronounced variability indicates that OA hygroscopicity cannot be represented by a single characteristic value and highlights the need to identify the controlling factors governing κOA. Monte Carlo uncertainty analysis showed that he standard deviations of the simulated κOA distributions at individual measurement points ranged from 0.01 to 0.18 (Fig. S15). Larger uncertainties generally occurred at higher κOA values and lower OA volume fractions, indicating greater sensitivity of the ZSR-based retrieval under these conditions (Fig. S16). Despite the substantial point-by-point uncertainties, the Monte Carlo mean values agreed well with the baseline estimates (Fig. S15a), yielding the same campaign-average κOA of 0.11 and a correlation coefficient of 0.99 between the two sets of estimates. Additional Monte Carlo sensitivity tests, in which each input parameter was perturbed individually while the others were held constant, showed that uncertainties in VPM and κrPM contributed most strongly to the uncertainty in the retrieved κOA (Fig. S15c).Previous studies have commonly related κOA to bulk oxidation metrics, particularly the O:C ratio and f44, leading to several widely adopted empirical parameterizations (Chang et al., 2010; Lambe et al., 2011; Wu et al., 2016). Consistent with this framework, the relatively high average oxidation level observed at Huainan (mean O:C = 0.80 ± 0.06) may partly explain why the mean κOA exceeded values reported at several other field sites. However, oxidation state alone explained little of the observed temporal variability. Throughout the campaign, κOA exhibited only a weak negative correlation with O:C (R = −0.13, p = 0.004), despite the relatively narrow range of O:C (0.6–0.9). This result indicates that although oxidation may contribute to the overall hygroscopicity level of ambient OA, it cannot account for the pronounced fluctuations observed on shorter temporal scales. Similar weak relationships between κOA and bulk oxidation metrics have also been reported in previous ambient studies (e.g., Kuang et al., 2021; Liu et al., 2021). These observations indicate that bulk oxidation state may determine the overall hygroscopicity level of ambient OA but provides limited explanatory power for its pronounced temporal variability.
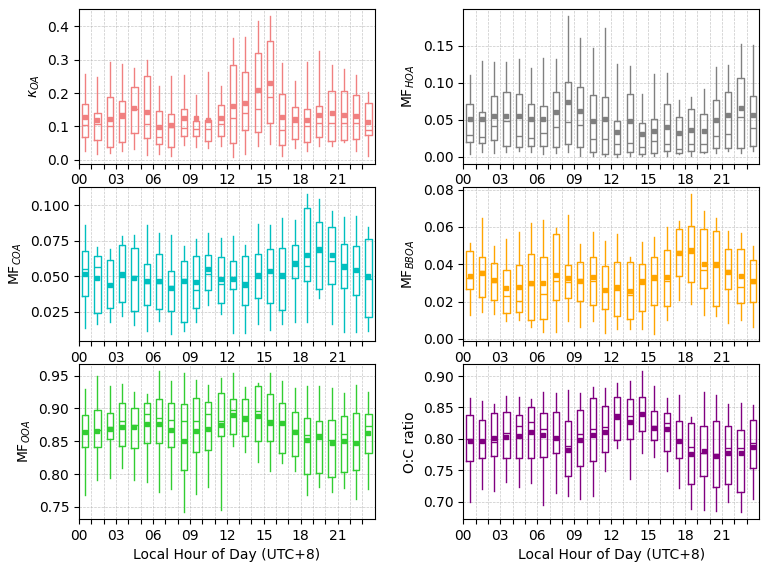
Figure 4Diurnal variations of κOA, mass fraction of four OA factors, and O:C ratio during the winter campaign. The upper and lower bounds of each box represent the 75th and 25th percentiles, and the upper and lower whiskers represent the 95th and 5th percentiles. The line in each box is the median value and the square represents the mean.
To further evaluate whether OA composition could explain the variability of κOA, relationships between κOA and PMF-derived OA factors were examined. Previous studies have generally reported higher hygroscopicity for oxygenated OA than for primary OA (Kuang et al., 2021), implying that source apportionment may provide additional information beyond bulk oxidation metrics. At Huainan, however, κOA remained only weakly correlated with all resolved OA factors, with correlation coefficients of 0.24, 0.03, 0.07, and −0.26 for the mass fraction of HOA, COA, BBOA, and OOA, respectively. One possible explanation is that OOA could not be further resolved into less-oxidized and more-oxidized components because of the relatively simple OA mass spectra during winter. Consequently, variations associated with atmospheric aging remained embedded within a single OOA factor, weakening the apparent relationship between κOA and OA source apportionment. These results suggest that the variability of κOA cannot be adequately explained by either bulk oxidation metrics or the resolved OA factors alone, implying that the processes governing OA hygroscopicity extend beyond conventional bulk descriptors of OA composition.
Further insight can be gained from the diurnal evolution of κOA (Fig. 4). κOA exhibited a pronounced daytime maximum and lower values during the morning and evening. This temporal variation closely resembled that of the OOA fraction while opposing the evolution of primary OA. The morning decrease in κOA coincided with enhanced HOA contributions associated with traffic emissions, as indicated by concurrent peaks in NO and CO concentrations (Fig. S13). During the evening, increased contributions from cooking and residential biomass-burning emissions enhanced the fractions of COA and BBOA, leading to another reduction in κOA. These observations indicate that freshly emitted primary OA generally suppresses OA hygroscopicity, whereas secondary processing tends to increase it. However, these diurnal patterns are not reflected in the weak point-by-point correlations between κOA and the individual OA factors. This discrepancy suggests that the influence of atmospheric aging depends strongly on the chemical nature of the emitted OA rather than simply on its bulk oxidation state.
Collectively, the analyses above demonstrate that bulk oxidation metrics explain the average hygroscopicity of OA only to a limited extent and fail to capture its large temporal variability. Likewise, conventional PMF source apportionment alone provides insufficient explanatory power in this study. These findings indicate that the hygroscopic response of OA is likely governed by source-dependent chemical composition and atmospheric processing acting together. We therefore next examine biomass-burning emissions, which exhibit the strongest association with κOA throughout the observation period, to further elucidate the source dependence of OA hygroscopicity.
3.4 Source-dependent Controls on OA Hygroscopicity
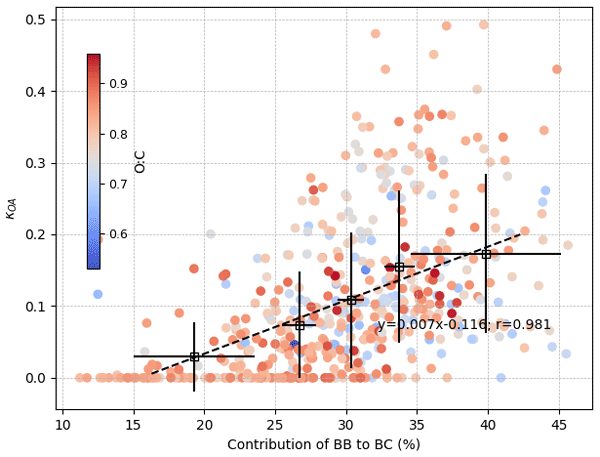
The analyses presented above suggest that bulk oxidation metrics alone cannot adequately explain the observed variability in κOA. We therefore further investigated whether source-dependent composition exerts a stronger control on κOA by examining the relationship between κOA and the relative contribution of biomass burning (fbb). As shown in Fig. 3d, temporal variations in κOA closely tracked those of fbb throughout the campaign, with periods of enhanced biomass-burning influence generally accompanied by elevated κOA values. This relationship is further supported by the point-by-point comparison (Fig. 5), which reveals a statistically significant positive correlation between κOA and fbb (R = 0.48, p < 0.001). Consistently, binned averages show a systematic increase in κOA with increasing biomass-burning contribution, with mean κOA rising from approximately 0.03 at fbb = 19 % to about 0.17 when fbb exceeded 40 % (Fig. 5). Compared with the weak relationship between κOA and bulk oxidation metrics, these observations indicate that biomass-burning influence explains substantially more of the temporal variability in OA hygroscopicity. The robustness of the κOA–fbb relationship was examined through sensitivity tests by varying AAEbb from 2.0 to 1.8 and 2.2 while keeping AAEff fixed at 1.0, and by varying AAEff from 1.0 to 0.9 and 1.1 while keeping AAEbb fixed at 2.0. Although the estimated fbb values varied with the assumed AAE parameters, the increasing trend of κOA with fbb remained qualitatively consistent (Fig. S17).
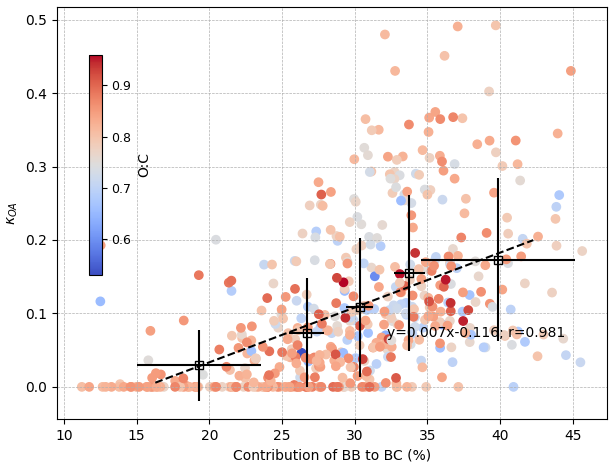
Figure 5Variation of κOA as a function of relative contribution of biomass burning to BC (fbb), with colors indicating the corresponding O:C ratios. Black open squares represent binned mean κOA values based on fbb bins defined by 20-percentile intervals, with error bars indicating one standard deviation. The dashed line shows a linear regression fitted to the binned means.
Although κOA exhibited a clear positive relationship with biomass-burning influence, this relationship could still arise indirectly because biomass-burning aerosol also experiences continuous atmospheric aging after emission. To disentangle the respective influence of emission source and atmospheric oxidation, κOA was further examined under contrasting biomass-burning conditions. When biomass-burning influence was weak (fbb < 24 %, corresponding to the 20th percentile), κOA remained consistently low despite relatively high bulk oxidation levels (mean O:C = 0.82), indicating that highly oxidized OA associated primarily with fossil-fuel-related emissions does not necessarily exhibit strong hygroscopicity (Fig. 5). In contrast, under strong biomass-burning influence (fbb > 36 %, corresponding to the 80th percentile), κOA became strongly dependent on oxidation state. Samples with O:C ratios above 0.8 exhibited substantially higher hygroscopicity (mean κOA = 0.21) than those with O:C ratios below 0.7 (mean κOA = 0.10). These contrasting behaviours indicate that atmospheric oxidation enhances OA hygroscopicity primarily when biomass-burning-derived OA constitutes a substantial fraction of ambient organic aerosol. In other words, the influence of oxidation on OA hygroscopicity is fundamentally source dependent rather than universal. This interpretation is also consistent with previous laboratory and field studies showing that freshly emitted biomass-burning OA generally exhibits low hygroscopicity, whereas atmospheric aging substantially enhances κOA through oxidative processing (Carrico et al., 2010; Martin et al., 2013; Mallet et al., 2017). Additional interaction analysis further supports this interpretation by demonstrating a statistically significant coupling between biomass-burning contribution and oxidation state (Sect. S2 in the Supplement), indicating that the sensitivity of κOA to oxidation increases progressively with increasing biomass-burning influence.
The statistical relationships described above are further evaluated using a persistent pollution episode from 20 to 25 January 2021 (Fig. 3), which provides an independent case study validating the statistical relationships described above. During the first stage of the episode (red shaded area in Fig. 3), PM2.5 increased progressively and was accompanied by continuous particle growth (Fig. S5), indicating sustained aerosol accumulation and aging. Biomass-burning influence remained relatively strong throughout this period, with fbb averaging approximately 30 %. Elevated levoglucosan concentrations independently confirmed the substantial contribution of biomass-burning emissions (Fig. S18). Although the bulk O:C ratio first decreased from approximately 0.8 to 0.5 before gradually recovering to around 0.8, κOA increased continuously from nearly zero to approximately 0.2. Considering that OOA remained the dominant OA component (∼ 80 %) throughout this stage, the increase in κOA is unlikely to be explained solely by changes in bulk oxidation level. Instead, it most likely reflects the progressive atmospheric aging of biomass-burning-derived OA under sustained biomass-burning influence, which gradually enhances its hygroscopicity. This interpretation is consistent with the field observations of Kuang et al. (2021), who reported substantially higher hygroscopicity for aged biomass-burning OA than for freshly emitted biomass-burning aerosol.
A striking contrast occurred during the second stage of the episode (blue shaded area in Fig. 3). Following a rapid transition in air masses, backward trajectory analysis indicates that transport shifted from eastern China to northern China (Fig. S19), accompanied by increased sulfate contribution and a marked reduction in biomass-burning influence. The average fbb decreased to approximately 15 %, whereas OOA accounted for nearly 94 % of total OA mass. Despite the predominance of highly oxidized OA and the continued increase in O:C ratio, κOA decreased abruptly from approximately 0.2 to nearly zero and remained extremely low throughout this stage. Such behaviour would not be expected if oxidation state were the primary control on OA hygroscopicity. Instead, the coexistence of high oxidation levels with negligible hygroscopicity indicates that these transported aerosols, likely associated with coal-combustion-related emissions from North China, as supported by the enhanced sulfate fraction and lower ratios during this stage, remained weakly hygroscopic despite extensive atmospheric aging. This contrasting evolution between the two stages provides compelling observational validation that the hygroscopic response to atmospheric oxidation depends strongly on emission source.
To examine whether the source-dependent behaviour identified above is representative beyond this individual episode, we further examined the relationship between κOA and the molar ratio of , which is commonly used as an indicator of the relative importance of mobile and coal-combustion-related emissions. κOA exhibited a moderate positive correlation with (R = 0.34, p < 0.001; Fig. S20), indicating systematically lower OA hygroscopicity under sulfate-rich conditions associated with stronger coal-combustion influence. This independent statistical relationship corroborates the conclusions drawn from the pollution episode and further demonstrates that emission source exerts a stronger influence on κOA than oxidation state alone.
The enhanced hygroscopicity associated with biomass-burning influence is most likely attributable to the distinct chemical composition of biomass-burning-derived OA and its evolution during atmospheric aging. Fresh biomass-burning emissions contain a complex mixture of organic compounds, including weakly hygroscopic primary organics together with abundant brown carbon (BrC). Consequently, freshly emitted biomass-burning OA generally exhibits relatively low hygroscopicity despite containing substantial amounts of BrC (Carrico et al., 2010). During atmospheric aging, oxidative processing and secondary organic aerosol formation progressively transform this complex organic mixture, increasing the relative abundance of water-soluble oxygenated compounds while simultaneously modifying the optical and chemical properties of BrC. Consequently, aged biomass-burning OA becomes substantially more hygroscopic than freshly emitted biomass-burning aerosol, consistent with previous laboratory and field observations (Martin et al., 2013; Mallet et al., 2017). Supporting this interpretation, κOA exhibited a significant positive correlation with the OA mass absorption efficiency at 370 nm (MAEOA,370 nm; R = 0.59, p < 0.001; Fig. S21), which serves as an indicator for the abundance of biomass-burning-derived chromophoric organic matter. Rather than suggesting that BrC itself directly controls OA hygroscopicity, this relationship indicates that BrC co-varies with a broader suite of biomass-burning-derived water-soluble organic compounds that collectively enhance the hygroscopicity of aged biomass-burning aerosol. This interpretation is fully consistent with the source-dependent framework proposed in this study, in which biomass-burning influence enhances OA hygroscopicity not because BrC alone is highly hygroscopic. Instead, BrC should be regarded as an indicator of a chemically evolving biomass-burning OA mixture enriched in water-soluble organic compounds, whose collective compositional evolution enhances OA hygroscopicity during atmospheric aging.
Overall, the statistical relationships, interaction analysis, pollution episode, and optical evidence consistently demonstrate that the influence of atmospheric oxidation on OA hygroscopicity is fundamentally source dependent rather than universal. Atmospheric aging substantially enhances κOA when biomass-burning-derived OA constitutes a significant fraction of ambient organic aerosol. Consequently, parameterizations representing κOA solely as a function of oxidation state are unlikely to capture the large temporal variability observed in polluted continental atmospheres. Incorporating source-dependent constraints into κOA parameterizations therefore provides a more physically realistic framework for predicting aerosol water uptake, aerosol–cloud interactions, and the climatic impacts of biomass-burning emissions.
By combining humidified light-scattering measurements with ZSR-based component separation, this study provides observational constraints on the variability and controlling mechanisms of OA hygroscopicity at a polluted rural site in eastern China. Although OA generally reduced bulk aerosol hygroscopicity, with a mean κOA of 0.11 during the winter campaign, κOA exhibited pronounced temporal variability, ranging from nearly zero to 0.49. Such large variability highlights the importance of accurately representing OA hygroscopicity for predicting bulk aerosol hygroscopicity under ambient conditions.
Our results demonstrate that this variability cannot be satisfactorily explained by bulk oxidation state alone. Although OA at the study site was generally highly oxidized, κOA exhibited only weak relationships with conventional oxidation metrics, including the O:C ratio and PMF-derived OA factors. In contrast, κOA showed a substantially stronger dependence on source-related composition, particularly the relative contribution of biomass-burning-derived OA. Multiple lines of evidence – including statistical relationships, interaction analysis, pollution episode evolution, air-mass transport, and BrC optical properties – consistently demonstrate that the hygroscopic response of OA to atmospheric oxidation is fundamentally source dependent rather than universal. Atmospheric aging substantially enhanced κOA when biomass-burning-derived OA constituted a significant fraction of ambient organic aerosol, whereas highly oxidized OA associated with coal-combustion-dominated air masses remained weakly hygroscopic. These observations indicate that emission source fundamentally modulates the influence of atmospheric aging on OA hygroscopicity.
The source-dependent behaviour identified in this study most likely originates from differences in the chemical evolution of OA from different emission sources during atmospheric aging. In particular, biomass-burning-derived OA undergoes progressive oxidative processing that enriches water-soluble oxygenated compounds and substantially enhances its hygroscopicity. The observed positive relationship between κOA and BrC-related optical properties further suggests that BrC serves primarily as an indicator of a chemically evolving biomass-burning OA mixture rather than acting as the direct cause of enhanced hygroscopicity. Together, these findings highlight the coupled roles of emission source, atmospheric aging, and chemical evolution in governing OA hygroscopic behaviour under complex ambient conditions.
Given the increasing relative importance of OA under ongoing emission-control policies in eastern China, these findings have important implications for improving OA hygroscopicity parameterizations in atmospheric models. Representing κOA solely as a function of oxidation state is unlikely to capture the pronounced temporal variability observed in polluted continental atmospheres. Instead, incorporating source-dependent information provides a more physically realistic framework for simulating aerosol water uptake, aerosol–cloud interactions, and regional climate effects under evolving emission scenarios. Future field observations spanning a wider range of atmospheric environments, together with laboratory investigations of the hygroscopic evolution of OA from representative emission sources, are needed to further evaluate and generalize the source-dependent framework proposed in this study. More broadly, our results suggest that the climatic impacts of biomass-burning emissions may arise not only from the direct radiative effects of BrC, but also from indirect effects associated with enhanced aerosol hygroscopicity and its influence on aerosol water uptake and aerosol–cloud interactions.
Data supporting this study were obtained through direct measurements by the authors. Processed datasets are publicly available at https://doi.org/10.57760/sciencedb.42983 (Wu, 2026).
The supplement related to this article is available online at https://doi.org/10.5194/acp-26-15333-2026-supplement.
YW and ZD conceptualized the study, designed the methodology, and developed the inversion procedure. The investigation was performed by YW, JL, YX, ZZ, and JT. YW and JL curated the data and conducted the formal analysis. YW performed the validation, prepared the visualizations, and wrote the original draft. The manuscript was reviewed and edited by ZD, JL, LR, and JT.
The contact author has declared that none of the authors has any competing interests.
Publisher's note: Copernicus Publications remains neutral with regard to jurisdictional claims made in the text, published maps, institutional affiliations, or any other geographical representation in this paper. The authors bear the ultimate responsibility for providing appropriate place names. Views expressed in the text are those of the authors and do not necessarily reflect the views of the publisher.
We gratefully acknowledge the staff of the Huainan Observation Station, Institute of Atmospheric Physics, Chinese Academy of Sciences, for their support and assistance during the observational experiments. We also extend our appreciation to all individuals who contributed to the experiments but are not listed as authors.
This research was funded by the Strategic Priority Research Program of the Chinese Academy of Sciences (grant no. XDB0760200), and also supported by the National Natural Science Foundation of China (grant no. 42275114), the Fundamental Research Funds of Institute of Atmospheric Physics, Chinese Academy of Sciences and State Key Laboratory of Atmospheric Environment and Extreme Meteorology (grant no. 2024ZD04).
This paper was edited by Manabu Shiraiwa and reviewed by two anonymous referees.
Andreae, M. O. and Rosenfeld, D.: Aerosol–cloud–precipitation interactions. Part 1. The nature and sources of cloud-active aerosols, Earth-Sci. Rev., 89, 13–41, https://doi.org/10.1016/j.earscirev.2008.03.001, 2008.
Canonaco, F., Crippa, M., Slowik, J. G., Baltensperger, U., and Prévôt, A. S. H.: SoFi, an IGOR-based interface for the efficient use of the generalized multilinear engine (ME-2) for the source apportionment: ME-2 application to aerosol mass spectrometer data, Atmos. Meas. Tech., 6, 3649–3661, https://doi.org/10.5194/amt-6-3649-2013, 2013.
Carrico, C. M., Petters, M. D., Kreidenweis, S. M., Sullivan, A. P., McMeeking, G. R., Levin, E. J. T., Engling, G., Malm, W. C., and Collett Jr., J. L.: Water uptake and chemical composition of fresh aerosols generated in open burning of biomass, Atmos. Chem. Phys., 10, 5165–5178, https://doi.org/10.5194/acp-10-5165-2010, 2010.
Cerully, K. M., Bougiatioti, A., Hite Jr., J. R., Guo, H., Xu, L., Ng, N. L., Weber, R., and Nenes, A.: On the link between hygroscopicity, volatility, and oxidation state of ambient and water-soluble aerosols in the southeastern United States, Atmos. Chem. Phys., 15, 8679–8694, https://doi.org/10.5194/acp-15-8679-2015, 2015.
Chang, R. Y.-W., Slowik, J. G., Shantz, N. C., Vlasenko, A., Liggio, J., Sjostedt, S. J., Leaitch, W. R., and Abbatt, J. P. D.: The hygroscopicity parameter (κ) of ambient organic aerosol at a field site subject to biogenic and anthropogenic influences: relationship to degree of aerosol oxidation, Atmos. Chem. Phys., 10, 5047–5064, https://doi.org/10.5194/acp-10-5047-2010, 2010.
Chen, L.-W. A., Chow, J. C., Wang, X. L., Robles, J. A., Sumlin, B. J., Lowenthal, D. H., Zimmermann, R., and Watson, J. G.: Multi-wavelength optical measurement to enhance thermal/optical analysis for carbonaceous aerosol, Atmos. Meas. Tech., 8, 451–461, https://doi.org/10.5194/amt-8-451-2015, 2015.
Chen, Q., Miao, R. Q., Geng, G. N., Shrivastava, M., Dao, X., Xu, B. Y., Sun, J. Q., Zhang, X., Liu, M. Y., Tang, G. G., Tang, Q., Hu, H. W., Huang, R.-J., Wang, H., Zheng, Y., Qin, Y., Guo, S., Hu, M., and Zhu, T.: Widespread 2013-2020 decreases and reduction challenges of organic aerosol in China, Nat. Commun., 15, 4465, https://doi.org/10.1038/s41467-024-48902-0, 2024.
Dawson, K. W., Ferrare, R. A., Moore, R. H., Clayton, M. B., Thorsen, T. J., and Eloranta, E. W.: Ambient aerosol hygroscopic growth from combined Raman lidar and HSRL, J. Geophys. Res.-Atmos., 125, e2019JD031708, https://doi.org/10.1029/2019JD031708, 2020.
Dusek, U., Frank, G. P., Hildebrandt, L., Curtius, J., Schneider, J., Walter, S., Chand, D., Drewnick, F., Hings, S., Jung, D., Borrmann, S., and Andreae, M. O.: Size matters more than chemistry for cloud-nucleating ability of aerosol particles, Science, 312, 1375–1378, https://doi.org/10.1126/science.1125261, 2006.
Ervens, B., Turpin, B. J., and Weber, R. J.: Secondary organic aerosol formation in cloud droplets and aqueous particles (aqSOA): a review of laboratory, field and model studies, Atmos. Chem. Phys., 11, 11069–11102, https://doi.org/10.5194/acp-11-11069-2011, 2011.
Fan, J. W., Wang, Y., Rosenfeld, D., and Liu, X. H.: Review of aerosol-cloud interactions: mechanisms, significance, and challenges, J. Atmos. Sci., 73, 4221–4252, https://doi.org/10.1175/JAS-D-16-0037.1, 2016.
Garnett, J. C. M.: XII. Colours in metal glasses and in metallic films, Philos. T. R. Soc. A, 203, 385–420, https://doi.org/10.1098/rsta.1904.0024, 1904.
Gunthe, S. S., King, S. M., Rose, D., Chen, Q., Roldin, P., Farmer, D. K., Jimenez, J. L., Artaxo, P., Andreae, M. O., Martin, S. T., and Pöschl, U.: Cloud condensation nuclei in pristine tropical rainforest air of Amazonia: size-resolved measurements and modeling of atmospheric aerosol composition and CCN activity, Atmos. Chem. Phys., 9, 7551–7575, https://doi.org/10.5194/acp-9-7551-2009, 2009.
Gunthe, S. S., Liu, P. F., Panda, U., Raj, S. S., Sharma, A., Darbyshire, E., Reyes-Villegas, E., Allam, J., Chen, Y., Wang, X., Song, S. J., Pöhlker, M. L., Shi, L. H., Wang, Y., Kommula, S. M., Liu, T. J., Ravikrishna, R., McFiggans, G., Mickley, L. J., Martin, S. T., Pöschl, U., Andreae, M. O., and Coe, H: Enhanced aerosol particle growth sustained by high continental chlorine emission in India, Nat. Geosci., 14, 77–84, https://doi.org/10.1038/s41561-020-00677-x, 2021.
Gysel, M., Crosier, J., Topping, D. O., Whitehead, J. D., Bower, K. N., Cubison, M. J., Williams, P. I., Flynn, M. J., McFiggans, G. B., and Coe, H.: Closure study between chemical composition and hygroscopic growth of aerosol particles during TORCH2, Atmos. Chem. Phys., 7, 6131–6144, https://doi.org/10.5194/acp-7-6131-2007, 2007.
Hagen, D. E. and Alofs, D. J.: Linear inversion method to obtain aerosol size distributions from measurements with a differential mobility analyzer, Aerosol Sci. Technol., 2, 465–475, https://doi.org/10.1080/02786828308958650, 1983.
Hu, W. W., Day, D. A., Campuzano-Jost, P., Nault, B. A., Park, T., Lee, T., Croteau, P., Canagaratna, M. R., Jayne, J. T., Worsnop, D. R., and Jimenez, J. L.: Evaluation of the New Capture Vaporizer for Aerosol Mass Spectrometers (AMS): Elemental Composition and Source Apportionment of Organic Aerosols (OA), ACS Earth Space Chem., 2, 410–421, https://doi.org/10.1021/acsearthspacechem.8b00002, 2018.
Jimenez, J. L., Canagaratna, M. R., Donahue, N. M., Prevot, A. S. H., Zhang, Q., Kroll, J. H., DeCarlo, P. F., Allan, J. D., Coe, H., Ng, N. L., Aiken, A. C., Docherty, K. S., Ulbrich, I. M., Grieshop, A. P., Robinson, A. L., Duplissy, J., Smith, J. D., Wilson, K. R., Lanz, V. A., Hueglin, C., Sun, Y. L., Tian, J., Laaksonen, A., Raatikainen, T., Rautiainen, J., Vaattovaara, P., Ehn, M., Kulmala, M., Tomlinson, J. M., Collins, D. R., Cubison, M. J., Dunlea, E. J., Huffman, J. A., Onasch, T. B., Alfarra, M. R., Williams, P. I., Bower, K., Kondo, Y., Schneider, J., Drewnick, F., Borrmann, S., Weimer, S., Demerjian, K., Salcedo, D., Cottrell, L., Griffin, R., Takami, A., Miyoshi, T., Hatakeyama, S., Shimono, A., Sun, J. Y., Zhang, Y. M., Dzepina, K., Kimmel, J. R., Sueper, D., Jayne, J. T., Herndon, S. C., Trimborn, A. M., Williams, L. R., Wood, E. C., Middlebrook, A. M., Kolb, C. E., Baltensperger, U., and Worsnop, D. R.: Evolution of organic aerosols in the atmosphere, Science, 326, 1525–1529, https://doi.org/10.1126/science.1180353, 2009.
Kuang, Y., He, Y., Xu, W., Zhao, P., Cheng, Y., Zhao, G., Tao, J., Ma, N., Su, H., Zhang, Y., Sun, J., Cheng, P., Yang, W., Zhang, S., Wu, C., Sun, Y., and Zhao, C.: Distinct diurnal variation in organic aerosol hygroscopicity and its relationship with oxygenated organic aerosol, Atmos. Chem. Phys., 20, 865–880, https://doi.org/10.5194/acp-20-865-2020, 2020.
Kuang, Y., Huang, S., Xue, B., Luo, B., Song, Q., Chen, W., Hu, W., Li, W., Zhao, P., Cai, M., Peng, Y., Qi, J., Li, T., Wang, S., Chen, D., Yue, D., Yuan, B., and Shao, M.: Contrasting effects of secondary organic aerosol formations on organic aerosol hygroscopicity, Atmos. Chem. Phys., 21, 10375–10391, https://doi.org/10.5194/acp-21-10375-2021, 2021.
Kuwata, M., Zorn, S. R., and Martin, S. T.: Using elemental ratios to predict the density of organic material composed of carbon, hydrogen, and oxygen, Environ. Sci. Technol., 46, 787–794, https://doi.org/10.1021/es202525q, 2012.
Lambe, A. T., Onasch, T. B., Massoli, P., Croasdale, D. R., Wright, J. P., Ahern, A. T., Williams, L. R., Worsnop, D. R., Brune, W. H., and Davidovits, P.: Laboratory studies of the chemical composition and cloud condensation nuclei (CCN) activity of secondary organic aerosol (SOA) and oxidized primary organic aerosol (OPOA), Atmos. Chem. Phys., 11, 8913–8928, https://doi.org/10.5194/acp-11-8913-2011, 2011.
Li, W., Teng, X., Chen, X., Liu, L., Xu, L., Zhang, J., Wang, Y., Zhang, Y., and Shi, Z.: Organic coating reduces hygroscopic growth of phase-separated aerosol particles, Environ. Sci. Technol., 55, 16339–16346, https://doi.org/10.1021/acs.est.1c05901, 2021.
Li, Y., Lei, L., Sun, J. X., Gao, Y. Q., Wang, P., Wang, S. Y., Zhang, Z. L., Du, A. D., Li, Z. J., Wang, Z. F., Kim, J. Y., Kim, H., Zhang, H. L., and Sun, Y. L.: Significant reductions in secondary aerosols after the three-year action plan in Beijing summer, Environ. Sci. Technol., 57, 15945–15955, https://doi.org/10.1021/acs.est.3c02417, 2023.
Liu, J. Y., Zhang, F., Xu, W. Q., Sun, Y. L., Chen, L., Li, S. Z., Ren, J. Y., Hu, B., Wu, H., and Zhang, R. Y.: Hygroscopicity of organic aerosols linked to formation mechanisms, Geophys. Res. Lett., 48, e2020GL091683, https://doi.org/10.1029/2020GL091683, 2021.
Liu, P. F., Song, M. J., Zhao, T. N., Gunthe, S. S., Ham, S. H., He, Y. P., Qin, Y. M., Gong, Z. H., Amorim, J. C., Bertram, A. K., and Martin, S. T.: Resolving the mechanisms of hygroscopic growth and cloud condensation nuclei activity for organic particulate matter, Nat. Commun., 9, 4076, https://doi.org/10.1038/s41467-018-06622-2, 2018.
Mallet, M. D., Cravigan, L. T., Milic, A., Alroe, J., Ristovski, Z. D., Ward, J., Keywood, M., Williams, L. R., Selleck, P., and Miljevic, B.: Composition, size and cloud condensation nuclei activity of biomass burning aerosol from northern Australian savannah fires, Atmos. Chem. Phys., 17, 3605–3617, https://doi.org/10.5194/acp-17-3605-2017, 2017.
Martin, M., Tritscher, T., Jurányi, Z., Heringa, M. F., Sierau, B., Weingartner, E., Chirico, R., Gysel, M., Prévôt, A. S. H., Baltensperger, U., and Lohmann, U.: Hygroscopic properties of fresh and aged wood burning particles, J. Aerosol Sci., 56, 15–29, https://doi.org/10.1016/j.jaerosci.2012.08.006, 2013.
Müller, T., Laborde, M., Kassell, G., and Wiedensohler, A.: Design and performance of a three-wavelength LED-based total scatter and backscatter integrating nephelometer, Atmos. Meas. Tech., 4, 1291–1303, https://doi.org/10.5194/amt-4-1291-2011, 2011.
Petters, M. D. and Kreidenweis, S. M.: A single parameter representation of hygroscopic growth and cloud condensation nucleus activity, Atmos. Chem. Phys., 7, 1961–1971, https://doi.org/10.5194/acp-7-1961-2007, 2007.
Pöhlker, M. L., Pöhlker, C., Quaas, J., Mülmenstaedt, J., Pozzer, A., Andreae, M. O., Artaxo, P., Block, K., Coe, H., Ervens, B., Gallimore, P., Gaston, C. J., Gunthe, S. S., Henning, S., Herrmann, H., Krueger, O. O., Mcfiggans, G., Poulain, L., Raj, S. S., Reyes-Villegas, E., Royer, H. M., Walter, D., Wang, Y., and Pöschl, U.: Global organic and inorganic aerosol hygroscopicity and its effect on radiative forcing, Nat. Commun., 14, 6139, https://doi.org/10.1038/s41467-023-41695-8, 2023.
Ran, L., Deng, Z. Z., Wang, P. C., and Xia, X. A.: Black carbon and wavelength-dependent aerosol absorption in the North China Plain based on two-year aethalometer measurements, Atmos. Environ., 142, 132–144, https://doi.org/10.1016/j.atmosenv.2016.07.014, 2016.
Rosenfeld, D., Zhu, Y. N., Wang, M. H., Zheng, Y. T., Goren, T., and Yu, S. C.: Aerosol-driven droplet concentrations dominate coverage and water of oceanic low-level clouds, Science, 363, 599, https://doi.org/10.1126/science.aav0566, 2019.
Sandradewi, J., Prévôt, A. S. H., Szidat, S., Perron, N., Alfarra, M. R., Lanz, V. A., Weingartner, E., and Baltensperger, U.: Using aerosol light absorption measurements for the quantitative determination of wood burning and traffic emission contributions to particulate matter, Environ. Sci. Technol., 42, 3316–3323, https://doi.org/10.1021/es702253m, 2008.
Shi, R. F., Zhang, F., Shen, Y. M., Shen, J. S., Xu, B. Y., Kuang, B. Y., Xu, Z. N., Jin, L. L., Tang, Q., Tian, X. D., and Wang, Z. B.: Aerosol liquid water in PM2.5 and its roles in secondary aerosol formation at a regional site of Yangtze River Delta, J. Environ. Sci., 138, 684–696, https://doi.org/10.1016/j.jes.2023.04.030, 2024.
Stokes, R. H. and Robinson, R. A.: Interactions in aqueous nonelectrolyte solutions. I. Solute-solvent equilibria, J. Phys. Chem., 70, 2126–2131, https://doi.org/10.1021/j100879a010, 1966.
Wang, Y. and Chen, Y.: Significant climate impact of highly hygroscopic atmospheric aerosols in Delhi, India, Geophys. Res. Lett., 46, 5535–5545, https://doi.org/10.1029/2019GL082339, 2019.
Wu, Y.: Aerosol hygroscopicity observed at Huainan Site in East China, V1, Science Data Bank [data set], https://doi.org/10.57760/sciencedb.42983, 2026.
Wu, Y., Xia, Y., Huang, R., Deng, Z., Tian, P., Xia, X., and Zhang, R.: A study of the morphology and effective density of externally mixed black carbon aerosols in ambient air using a size-resolved single-particle soot photometer (SP2), Atmos. Meas. Tech., 12, 4347–4359, https://doi.org/10.5194/amt-12-4347-2019, 2019.
Wu, Z. J., Zheng, J., Shang, D. J., Du, Z. F., Wu, Y. S., Zeng, L. M., Wiedensohler, A., and Hu, M.: Particle hygroscopicity and its link to chemical composition in the urban atmosphere of Beijing, China, during summertime, Atmos. Chem. Phys., 16, 1123–1138, https://doi.org/10.5194/acp-16-1123-2016, 2016.
Yang, Y., Ren, L. L., Wu, M. X., Wang, H. L., Song, F. F., Leung, L. R., Hao, X., Li, J. D., Chen, L., Li, H. M., Zeng, L. Y., Zhou, Y., Wang, P. Y., Liao, H., Wang, J., and Zhou, Z.-Q.: Abrupt emissions reductions during COVID-19 contributed to record summer rainfall in China, Nat. Commun., 13, 959, https://doi.org/10.1038/s41467-022-28537-9, 2022.
Zhang, Y., Tang, L., Croteau, P. L., Favez, O., Sun, Y., Canagaratna, M. R., Wang, Z., Couvidat, F., Albinet, A., Zhang, H., Sciare, J., Prévôt, A. S. H., Jayne, J. T., and Worsnop, D. R.: Field characterization of the PM2.5 Aerosol Chemical Speciation Monitor: insights into the composition, sources, and processes of fine particles in eastern China, Atmos. Chem. Phys., 17, 14501–14517, https://doi.org/10.5194/acp-17-14501-2017, 2017.
Zhao, D. F., Buchholz, A., Kortner, B., Schlag, P., Rubach, F., Fuchs, H., Kiendler-Scharr, A., Tillmann, R., Wahner, A., Watne, Å. K., Hallquist, M., Flores, J. M., Rudich, Y., Kristensen, K., Hansen, A. M. K., Glasius, M., Kourtchev, I., Kalberer, M., and Mentel, Th. F.: Cloud condensation nuclei activity, droplet growth kinetics, and hygroscopicity of biogenic and anthropogenic secondary organic aerosol (SOA), Atmos. Chem. Phys., 16, 1105–1121, https://doi.org/10.5194/acp-16-1105-2016, 2016.
Zhao, G., Zhao, C., Kuang, Y., Tao, J., Tan, W., Bian, Y., Li, J., and Li, C.: Impact of aerosol hygroscopic growth on retrieving aerosol extinction coefficient profiles from elastic-backscatter lidar signals, Atmos. Chem. Phys., 17, 12133–12143, https://doi.org/10.5194/acp-17-12133-2017, 2017.
Zhao, P. S., Ge, S. S., Su, J., Ding, J., and Kuang, Y.: Relative humidity dependence of hygroscopicity parameter of ambient aerosols, J. Geophys. Res.-Atmos., 127, e2021JD035647, https://doi.org/10.1029/2021JD035647, 2022.
Zheng, B., Tong, D., Li, M., Liu, F., Hong, C., Geng, G., Li, H., Li, X., Peng, L., Qi, J., Yan, L., Zhang, Y., Zhao, H., Zheng, Y., He, K., and Zhang, Q.: Trends in China's anthropogenic emissions since 2010 as the consequence of clean air actions, Atmos. Chem. Phys., 18, 14095–14111, https://doi.org/10.5194/acp-18-14095-2018, 2018.