
the Creative Commons Attribution 4.0 License.
the Creative Commons Attribution 4.0 License.
 | 20 Oct 2026
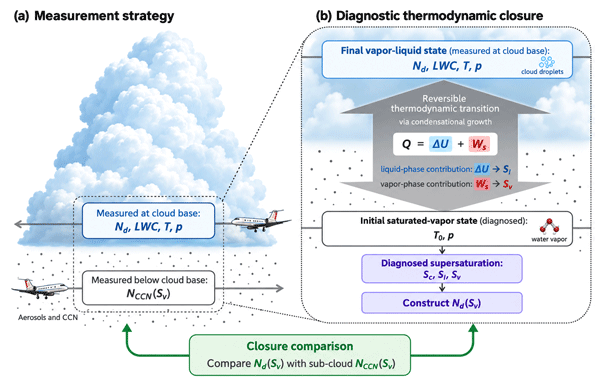
A new method to derive water vapor supersaturation at cumulus cloud base from in situ measurements

Manfred Wendisch
Rachel Albrecht
Daniel Harrison
Current in situ measurements of water vapor supersaturation (Sv) with respect to liquid water at cloud base are highly uncertain due to instrumental limitations. Consequently, Sv is commonly estimated using cloud microphysical models and parameterizations. Here, we derive Sv at warm cumulus cloud base from in situ measurements through calculations of the energy and water vapor budgets associated with cloud formation. The derived Sv provides a thermodynamic analogue to the supersaturation established in a cloud condensation nuclei (CCN) chamber, enabling direct comparison with independently measured CCN activation spectra below cloud base. To this end, we formulate the energy budget of a saturated rising air parcel at cloud base and treat the transition between saturated thermodynamic states locally as quasi-isobaric. Under these conditions, the latent heat (Q) released during condensational droplet growth is determined by the corresponding sensible enthalpy difference between the saturated-vapor and water vapor–liquid states. According to the first law of thermodynamics, Q is partitioned between the change in internal energy (ΔU) and water vapor expansion work (Ws). Within this diagnostic framework, part of the condensational energy is, therefore, spent on Ws, reducing the amount of liquid water formed relative to the limiting case in which the entire condensational energy contributes to droplet growth. Accordingly, the cloud supersaturation (Sc) is diagnostically partitioned into liquid-phase (Sl) and vapor-phase (Sv) components based on the fractions of Q associated with ΔU and Ws, respectively. This framework enables the derivation of Sv from airborne cloud-base measurements through thermodynamic constraints on condensational energy partitioning. Here we use airborne measurements collected in growing convective cumuli over the Amazon Basin during the ACRIDICON-CHUVA campaign. Our results demonstrate that the derived cloud droplet number concentration as a function of Sv agrees, within measurement uncertainties, with Sv activation spectra of CCN measured below cloud base.
- Article
(6062 KB) - Full-text XML
-
Supplement
(5936 KB) - BibTeX
- EndNote


A realistic representation of cloud formation processes and their impact on the atmospheric energy budget and water cycle is crucial for accurate numerical weather prediction and reliable climate projection models (IPCC, 2021). Liquid water cloud droplets form in a rising humid (i.e., water vapor containing) air parcel, which expands during ascent due to decreasing air pressure. The expansion causes a cooling of the air parcel until the relative humidity (RH) exceeds 100 %. In case of RH exceeds 100 %, the excess is expressed as water vapor supersaturation, Sv, with respect to liquid water instead of RH. Subsequently, the water vapor condenses onto surfaces provided by a subset of the preexisting aerosol particles that act as cloud condensation nuclei (CCN). The condensation of water vapor on CCN and the subsequent activation and growth of cloud droplets are described by the Köhler theory (Köhler, 1936). This theory quantifies the equilibrium Sv (or equilibrium RH) over an aqueous solution droplet as a function of droplet size, accounting for curvature (Kelvin) and solute (Raoult) effects. It defines the critical Sv at which CCN particles are activated to form cloud droplets. Due to the particle size dependence, the growth of solution droplets and Sv beyond diameters of about 1–2 µm are mostly determined by the thermodynamic state of the cloudy air parcel rather than by the physicochemical properties of the original CCN particles (Khain and Pinsky, 2018; Petters and Kreidenweis, 2007; Pinsky et al., 2012).
Despite extensive efforts during numerous field campaigns, airborne in situ measurements of Sv in clouds are highly uncertain due to inherent instrumental limitations. RH is commonly derived from measurements of air temperature and water vapor mass mixing ratio. The uncertainties of these parameters result in errors of about 5 %–10 % for the calculated RH (Kaufmann et al., 2018; Namdari et al., 2025), which is much larger than the actual values of Sv typically observed in cumulus clouds () and set in CCN counters under controlled conditions (Roberts and Nenes, 2005; Rose et al., 2008). Thus, Sv at bases of warm (i.e., only liquid water containing) clouds often needs to be estimated using numerical modeling and parameterizations based on Köhler theory.
Microphysical cloud models (e.g., Khain and Pinsky, 2018; Korolev and Mazin, 2003) explicitly calculate the water vapor budget for adiabatic changes of thermodynamic state of a saturated air parcel where the condensational growth of cloud droplets is controlled by Sv. Based on the thermodynamic equations governing air temperature, water vapor mixing ratio and the Clausius–Clapeyron relation, the prognostic water vapor budget during cloud formation can be calculated as a function of the change in Sv per unit time:
P (production term) represents the increase of Sv by cooling during the adiabatic ascent (), and Cd (condensation term) describes the decrease of Sv due to the condensation of water vapor on CCN particles and droplets () (see Appendix A). A1 and A2 are thermodynamic coefficients associated with the Clausius–Clapeyron equation describing the dependence of saturation water vapor pressure on temperature. w is the updraft velocity () of the rising air parcel (z represents altitude, and t time) and LWC represents the liquid water content.
For a warm cloud base, Sv is typically inferred through parameterizations that associate parcel dynamics (i.e., w) and CCN properties to droplet activation (Ghan et al., 2011; Reutter et al., 2009; Twomey, 1959). Twomey (1959) first formulated a parameterization relating the CCN spectrum to the Sv in a rising cloud parcel. The parameterization established a practical basis for predicting the number concentration of droplets (Nd) at cloud bases from CCN properties just below cloud bases and w in cloud. From this information, the Sv activation spectra of number concentration of CCN [NCCN(Sv)] are estimated for different atmospheric conditions. Several studies based on Twomey's parameterizations have been widely implemented in cloud microphysical schemes (Ervens et al., 2010; Feingold and Heymsfield, 1992; Ghan et al., 2011; Khain et al., 2015; Reutter et al., 2009; Varghese and Prabhakaran, 2025), either in their original form or through modifications that account for additional processes such as entrainment of dry air and CCN chemical composition. These parameterizations are typically validated through so-called Nd closure analysis, where simulated and measured Nd are adjusted. The agreement achieved from this closure ranges between 20 %–30 %. Furthermore, NCCN(Sv) spectra are estimated based on satellite retrievals (Rosenfeld et al., 2016), in which clouds are considered as CCN chambers and thermodynamic as well as microphysical properties estimated for cloud bases are implemented to calculate Nd(Sv) (Konwar et al., 2012; Pinsky et al., 2012; Rosenfeld et al., 2014; Zheng and Rosenfeld, 2015). The accuracy of satellite retrievals of Nd(Sv) is about 25 %–30 % when compared with ground-based NCCN(Sv) measurements.
Modeling and observational studies have been performed to improve our understanding of the relationship between aerosol particle properties and their ability to form cloud droplets as a function of Sv (Ervens et al., 2010; Kleinheins et al., 2025; Kulkarni et al., 2023; Pöhlker et al., 2016; Rissler et al., 2004; Wang et al., 2008). These studies compare the predicted CCN number concentrations derived from Köhler theory, as a function of particle size and chemical composition, with results from CCN counting instruments at different Sv. Nd at cloud bases is commonly calculated in adiabatic cloud models based on the hygroscopic growth of CCN particles within a rising humid air parcel with a prescribed hygroscopicity (k) of the CCN particles and w (Braga et al., 2021a; Pöhlker et al., 2021; Reutter et al., 2009; Varghese and Prabhakaran, 2025). These models simulate the expansion and the corresponding cooling of the air parcel, the resulting changes in RH, and the activation followed by condensational growth of cloud droplets. From closure analysis using adiabatic parcel model results, Braga et al. (2021a) observed that w and k are critical factors in determining Nd at cloud bases, particularly in the unique environments of the Amazon Basin during the dry (polluted) season and the clean conditions of the Atlantic Ocean. The results indicated that while larger accumulation mode CCN particles dominate cloud formation over land, smaller Aitken mode CCN particles play a significantly role in cleaner marine air masses. A dedicated analysis confirming these findings is described by Pöhlker et al. (2021). The authors conclude that while w and k are critical for CCN activation into cloud droplets, the contribution of Aitken mode particles is most significant in clean environments or deep convective clouds. Conversely, in polluted air masses, high concentrations of larger particles suppress the Sv required to activate smaller ones. Through this sensitivity analysis, the authors clarify the thresholds where aerosol properties and w interact to determine cloud microphysics responses.
In general, current estimates of Sv at cloud base are inferred from aerosol-activation parameterizations or cloud parcel models rather than being directly constrained by independent in situ measurements (Braga et al., 2017a; Pinsky et al., 2012; Rosenfeld et al., 2016; Twomey, 1959; Varghese and Prabhakaran, 2025). Although these approaches reproduce observed Nd at cloud base, direct observational validation of Sv remains challenging (Braga et al., 2017a, 2021a). For in situ cloud-base conditions, the quasi-steady supersaturation (SQSS; Squires, 1952) is also not applicable within the activation layer because it requires dynamical forcing and the droplet population to vary slowly relative to the supersaturation-adjustment timescale, a condition that is not satisfied during rapid aerosol activation at cloud base (Romps et al., 2023; Romps, 2025).
In this study, we propose a new method to derive Sv at cloud bases for saturated parcels considering the energy and water vapor budgets during the condensational growth process of liquid droplets. Sv is diagnosed from the thermodynamic states of the saturated parcel, and the transition from the saturated-vapor state to the vapor–liquid state is treated as quasi-isobaric over the short cloud-base transition (Δz≈10 m), for which the expected hydrostatic pressure change is of the order 1 hPa (Δp≈ρgΔz), corresponding to ∼0.1 % of the ambient pressure. At cloud base, in situ measurements typically show slightly lower air pressure in cloudy than cloud-free air, with higher LWC and water vapor mixing ratios at lower temperatures for quasi-isobaric conditions. The diagnostic thermodynamic state of the saturated parcel is determined primarily by the atmospheric air pressure (p), the initial air parcel temperature (T0) of the saturated-vapor state, and the final temperature (T) of the vapor–liquid state, which constrains the calculation of the saturation ratio. At cloud base level, the atmospheric pressure and the specific heat capacity of cloudy air (cp,cloud) vary only slightly over the short-saturated transition. Therefore, this formulation represents a quasi-isobaric thermodynamic transition rather than an extended moist-adiabatic ascent in which the temperature difference between the two thermodynamic states is directly related to vertical displacement through the saturated adiabatic lapse rate. Within this quasi-isobaric framework, the thermodynamic transition between saturated-vapor and vapor–liquid states is then constrained by the parcel energy budget.
Here, the transition of thermodynamic states is assumed to be adiabatic and reversible, such that it follows an idealized reversible thermodynamic process, and the initial saturated-vapor state can be recovered from the vapor–liquid state by reversing the energy transformation. The energy associated with the vapor-to-liquid transition is constrained by the sensible enthalpy difference (dH) between the two thermodynamic states and by the latent energy released during condensation (Q), such that δQ=dH. Q is interpreted as an internal energy redistribution within the parcel rather than as external diabatic heating. The partitioning of the condensational energy of the saturated parcel is formulated from the first law of thermodynamics, such that the latent energy associated with condensation, Q, is partitioned between changes in parcel internal energy (ΔU) and the work associated with water vapor expansion (Ws), according to . Within this diagnostic framework, part of the condensational energy is associated with Ws during liquid-water formation relative to the limiting case in which the entire condensational energy contributes to liquid formation (δQ=dH). Consequently, the LWC is reduced, resulting in a relative excess of water vapor. We define the cloud supersaturation (Sc) from the vapor pressures of the saturated parcel in the vapor and liquid states for the limiting case in which the entire condensational energy contributes to liquid formation. Since part of Q is associated with Ws during the vapor-to-liquid transition, we diagnostically define the liquid-phase supersaturation (Sl) and vapor-phase (Sv) as the respective fractions of Q associated with ΔU and Ws (i.e., ). The corresponding temperatures of the vapor and liquid states obtained from the energy-budget calculations define the vapor pressures of the saturated parcel during the vapor-to-liquid transition.
The derived Sv provides a thermodynamic analogue to the effective supersaturation established in a CCN counter (CCNc), where the instrument supersaturation is calibrated from the critical activation of particles with known physicochemical properties, e.g. ammonium sulfate, using Köhler theory (Roberts and Nenes, 2005; Rose et al., 2008). This correspondence allows the cloud-base Nd(Sv) relationship to be represented by the classical power-law CCN activation spectrum, (Twomey, 1959), in which increasing supersaturation activates progressively larger fractions of the available CCN population. Unlike conventional parcel-model or CCN-closure approaches, which estimate Sv from prescribed w and CCN properties to reproduce the observed Nd, the present method diagnoses cloud-base Sv from a thermodynamic energy-budget closure constrained primarily by condensational energy and LWC. The method is evaluated using in situ measurements of cloud-base properties and compared with NCCN(Sv) observations below cloud base. In this framework, Q is directly derived from measured LWC, air temperature (T) and pressure (p) at cloud base, while T0, ΔU, Ws, Sl, and Sv are diagnostically estimated. The airborne cloud base data were collected in growing convective cumuli over the Amazon Basin in September 2014 during the ACRIDICON-CHUVA campaign (Wendisch et al., 2016), encompassing polluted conditions over forested and deforested regions, and clean marine conditions over the adjacent Atlantic Ocean. ACRIDICON stands for “Aerosol, Cloud, Precipitation, and Radiation Interactions and Dynamics of Convective Cloud Systems”; CHUVA is the acronym for “Cloud Processes of the Main Precipitation Systems in Brazil: A Contribution to Cloud Resolving Modeling and to the GPM (Global Precipitation Measurement)”. The High Altitude and Long Range Research Aircraft (HALO) was used during the campaign (Stevens et al., 2019). The resulting cloud-base Nd(Sv) spectra was calculated for eight flight segments and, for the flights in the Central Amazon, were compared with the NCCN(Sv) spectra measured below cloud base. This comparison tests the robustness of the underlying physical assumptions, as the cloud-base Nd(Sv) spectrum is expected to represent the NCCN(Sv) population below cloud bases. Figure 1 summarizes the measurement strategy and the diagnostic thermodynamic framework used in this study. Cloud-base measurements provide Nd, LWC, T, and p while NCCN(Sv) is independently measured below cloud base (Fig. 1a). From the measured cloud-base state, the initial saturated-vapor state is diagnostically reconstructed under the assumptions of an adiabatic and reversible transition treated locally as quasi-isobaric (Fig. 1b). The condensational energy is partitioned according to , from which the liquid- and vapor-phase contributions to cloud supersaturation, Sl and Sv, are derived. The resulting cloud-base Nd(Sv) spectrum is then compared with the independently measured sub-cloud NCCN (Sv) spectrum as a closure test of the proposed framework. The following Sect. 3 presents the proposed method and its underlying physical laws, while the results and discussion are provided in the subsequent sections. Table A1 in the Appendix lists and defines the symbols used in this manuscript.
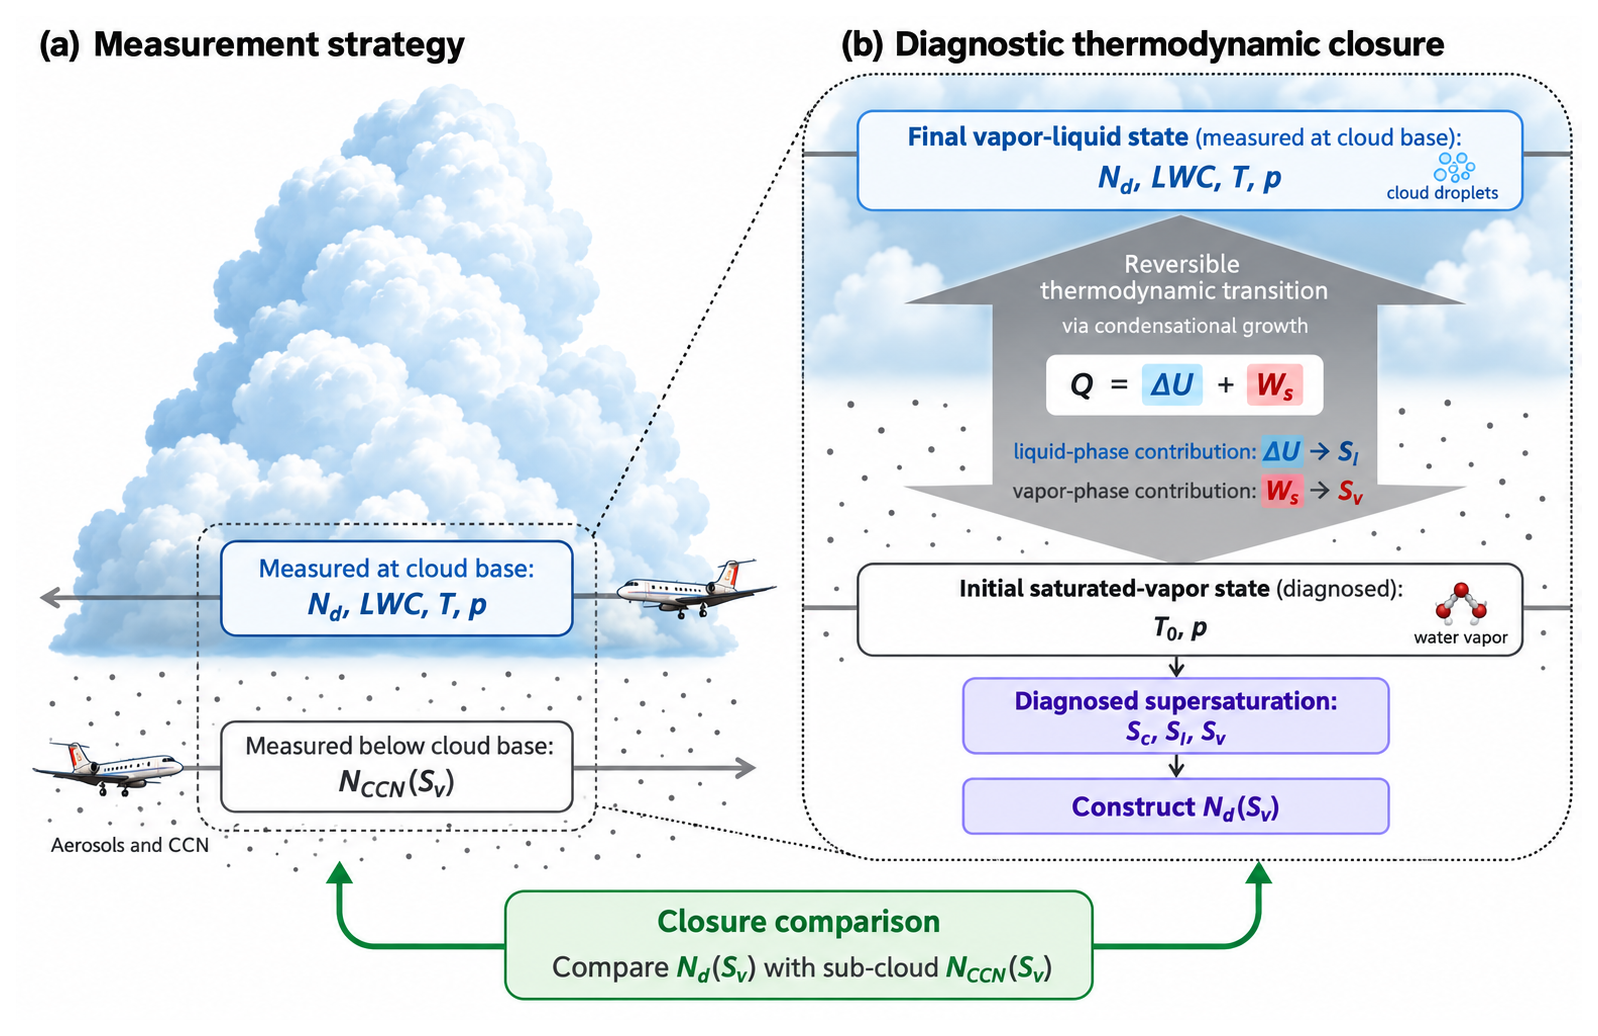
Figure 1Measurement strategy and diagnostic thermodynamic closure used to derive water vapor supersaturation at cloud base. (a) Schematic of the airborne measurement strategy. At cloud base, the HALO aircraft measures droplet number concentration (Nd), liquid water content (LWC), temperature (T), and pressure (p). Below cloud base, cloud condensation nuclei activation spectra, NCCN(Sv), and pressure are measured. The highlighted cloud-base region indicates the local layer to which the thermodynamic closure is applied. (b) Schematic of the diagnostic thermodynamic framework. The measured cloud-base state is treated as the final vapor–liquid state, characterized by Nd, LWC, T, and p, while the corresponding initial saturated-vapor state, characterized by T0 and p, is diagnosed. The transition between these states is represented as a reversible thermodynamic transformation during condensational growth. The latent heat (Q) released by condensation is partitioned according to , where the internal-energy contribution is associated with the liquid-phase supersaturation Sl and the water-vapor expansion work with the vapor-phase supersaturation Sv. The diagnosed supersaturations Sc, Sl, and Sv are then used to construct the cloud-base Nd(Sv) spectrum, which is compared with the independently measured sub-cloud NCCN(Sv) spectrum as the closure test.
We present a physically based diagnostic formulation to derive Sv at cloud bases in a saturated air parcel (with respect to water vapor over a plane liquid water surface). The formulation couples the parcel energy and water vapor budgets during the condensational growth. Across the analyzed cloud base transition, pressure variations are typically small of the order of 0.1 % of the atmospheric pressure; the process is therefore treated locally as quasi-isobaric. The transition is further assumed to be adiabatic and reversible, and the total moist enthalpy approximately conserved over the short cloud-base transition, while the sensible enthalpy changes between the saturated-vapor and vapor–liquid states. In the energy budget, the condensation energy (Q) is treated as a partition between the change in internal energy (ΔU) associated with the transition between the thermodynamic states, and the work associated with water vapor expansion (Ws). Under saturated quasi-isobaric conditions, the energy budget is governed by pressure and temperature, and the partitioning between ΔU and Ws remains process-dependent. The energy budget is diagnosed from the temperature change between the thermodynamic states, which determines the sensible enthalpy difference (dH), and equivalently, from the condensational energy (Q) for a given liquid water content. The cloud supersaturations (Sc, Sl and Sv) are then diagnostically calculated from the resulting energy and water vapor budgets during the condensational growth process. In this study, the variables are expressed as specific quantities per unit mass of dry air and are denoted by uppercase symbols. To recover the corresponding extensive quantities, these terms must be multiplied by the mass of dry air.
In situ measurements at the cloud bases of growing cumulus clouds are used to evaluate the theoretical assumptions. NCCN(Sv) spectra measured just below cloud base, prior to cloud measurements, are compared with the Nd(Sv) spectra derived at cloud base during flights in the Central Amazon. The Nd(Sv) spectrum is considered representative of the NCCN(Sv) population below cloud base that, after buoyant ascent, is activated into cloud droplets. The analysis is restricted to the cloud-base activation stage, where sub-cloud CCN can be related most directly to newly formed droplets. Farther above cloud base, the effects of entrainment of dry air, evaporation, secondary activation of CCN and coagulation processes weaken this correspondence. The following sections describe the steps of the proposed method, its underlying physical formulation, and the cloud, meteorological, and CCN measurements used in this study.
3.1 Calculation of the latent heat of condensation
The total energy of the saturated parcel is limited by the sensible enthalpy difference of the phase change from vapor to liquid, δQ=dH, and can be written in finite forms as follows (hereafter the signs in the energy balance equations describe the direction of energy transfer):
Where ql is the liquid water mixing ratio (kg kg−1), cp,cloud is the specific heat capacity of cloudy air (), and Lv is the latent heating of vaporization (J kg−1). The ql and cp,cloud are defined as the following:
and,
Where, ρair is the dry air density (kg m−3), LWC is the liquid water content (kg m−3), rs is the saturation water vapor mixing ratio (kg kg−1), cpd is the specific heat of dry air at constant pressure (1005 ), cpv is the specific heat of water vapor at constant pressure (1850 ), cpl is the specific heat of liquid water at constant pressure (4218 ). We assume the warmer temperature (T0) in the cp.cloud and Lv calculations, as it represents the initial condition of the saturated parcel. For small temperature differences at cloud base (), cp.cloud varies only weakly with rs and ql. Since T and T0 represent the temperatures of a saturated parcel under isobaric conditions, they are equivalent to the dew-point temperature at the corresponding pressure. Furthermore, rs is calculated as follows:
Where Rv is the gas constant for water vapor (461.5 ), Rd is the gas constant for dry air (287.05 ), and es(T) is the saturation water vapor pressure (Pa) (Bolton, 1980; Rogers and Yau, 1989). The values of es can be calculated for a wide range of temperatures in Celsius () with minor uncertainties (∼0.1 %) as follows:
During the phase change, the internal energy decreases (T0>T) as ql and Q increase. The phase change process leads to an increase in the air temperature, represented here by the latent-heat-equivalent temperature (TQ), which is approximately conserved during the vapor-to-liquid conversion, i.e.:
Where,
3.2 Cloud supersaturation
The formulation of RH describes the amount of water vapor in the air relative to the maximum amount of water vapor the air can hold for a given temperature, i.e., the saturation ratio, and is defined as follows:
Where e(T) is the ambient water vapor pressure (Pa). For a saturated parcel or cloud undergoing cooling (from T0 to T) the reference-state saturation ratio (RHc) is calculated as follows:
and the cloud supersaturation (Sc) is formulated as follows:
where RHs=100 % is the saturation ratio at the reference state (T0), and Sc expresses the thermodynamic excess of water vapor relative to equilibrium with respect to liquid water at the reference state. Since the cooling process is related to the increase of ql (shown in Eq. 2), the increase in Sc is associated with vapor-to-liquid conversion and Q.
3.3 Calculation of energy budget from the first law of thermodynamics
According to the first law of thermodynamics, the change in internal energy of a closed system is determined by the balance between heat exchange and pressure-volume work. For an isobaric process involving only pressure-volume work, the change in sensible enthalpy (dH) can be interpreted as the sum of the change in internal energy and the expansion work performed by the system. Under adiabatic conditions, the dH equals the heat exchanged at constant pressure by a saturated parcel. Thus, for a saturated parcel undergoing condensational growth from the reference state, the latent heat released (δQ=dH) is the source of heat in the thermodynamic system, and the energy budget can be calculated following the first law as follows:
where Q represents the latent heat released by condensation, ΔU is the change in internal energy of the parcel associated with vapor–liquid conversion, and Ws is the specific work done by water vapor during expansion. The terms of ΔU and Ws are calculated for a saturated parcel under isobaric cooling as follows:
and,
Where αv is the specific volume of water vapor for saturated conditions (m3 kg−1). The Ws term represents the effective thermodynamic work associated with changes in the specific volume of saturated water vapor during cloud-adiabatic cooling. Under quasi-isobaric conditions and small cloud base cooling intervals, the integration is referenced to the initial thermodynamic state of the saturated parcel (T0), and Ws depends primarily on T0 and T.
Analogous to Eq. (2), the energy budget from Eq. (12) can be calculated as follows:
or,
From this budget, Tws, the saturated temperature, is slightly warmer than T calculated in Eq. (2) due to the Ws term. Similarly, the resulting air temperature (Tair) will be slightly cooler than TQ due to the Ws term. Thus, Tair is calculated as follows:
The differences of the saturated temperatures (Tws−T) and air temperature (T0−Tair) are the same.
3.4 Reversibility of the saturated parcel energy budget
The reversibility of the energy budget for isobaric conditions relies on the fact that the magnitude of the total latent energy (δQ=dH) can be expressed equivalently in terms of either LWC or the temperature difference (ΔT) between two saturated states. In Sect. 3.1, we show that the relationship between LWC and ΔT is one-to-one since the parameters are calculated as a function of the initial thermodynamic properties of the saturated parcel. In this framework, this dependence is treated explicitly through an iterative solution, ensuring consistency between condensate and heat capacity.
When the total energy is partitioned as , the internal-energy component represents a reduced cooling of the saturated parcel compared to the case without accounting for the work term Ws. Despite this partitioning, the functional dependence between ql and ΔTws remains unchanged, so the relationship between thermodynamic variables remains one-to-one. Since the parameters at Ws, cp,cloud and Lv are calculated for the initial conditions of the parcel (T0), the reversibility of the heat budget is preserved, ensuring a consistent and reversible relationship between condensate and temperature within the proposed framework. The numerical differences while applying Eqs. (2) and (12) to calculate Q are negligible (). The differences between the thermodynamic and energetic components of the cloud parcel for simulations with a range of initial temperatures T0 (2–30 °C) and adiabatic cooling magnitudes (ΔT) are presented in Sect. S1 in the Supplement. The calculations are performed for the energy and vapor budgets at an atmospheric pressure of 950 hPa, similar as shown in the Sect. 4.1.
3.5 Calculation of liquid and water vapor supersaturation
The calculation of liquid supersaturation (Sl) and water vapor supersaturation (Sv) from the cloud supersaturation (Sc) is performed as a function of the energy budget formulation described in Sect. 3.3, where Sl and Sv are the energy contributions of ΔU and Ws in the total energy of the saturated parcel (Q), respectively.
The signs in the energy balance equations shown above describe the direction of energy transfer. However, Sl and Sv are not directional variables. They represent the partition of Sc considering the energy budget, which is defined from the absolute magnitudes of the energetic contributions, and thus, for a given latent heat released, due to condensation Sl and Sv are calculated as follows:
Where,
3.6 Closure analysis from airborne measurements at cloud bases
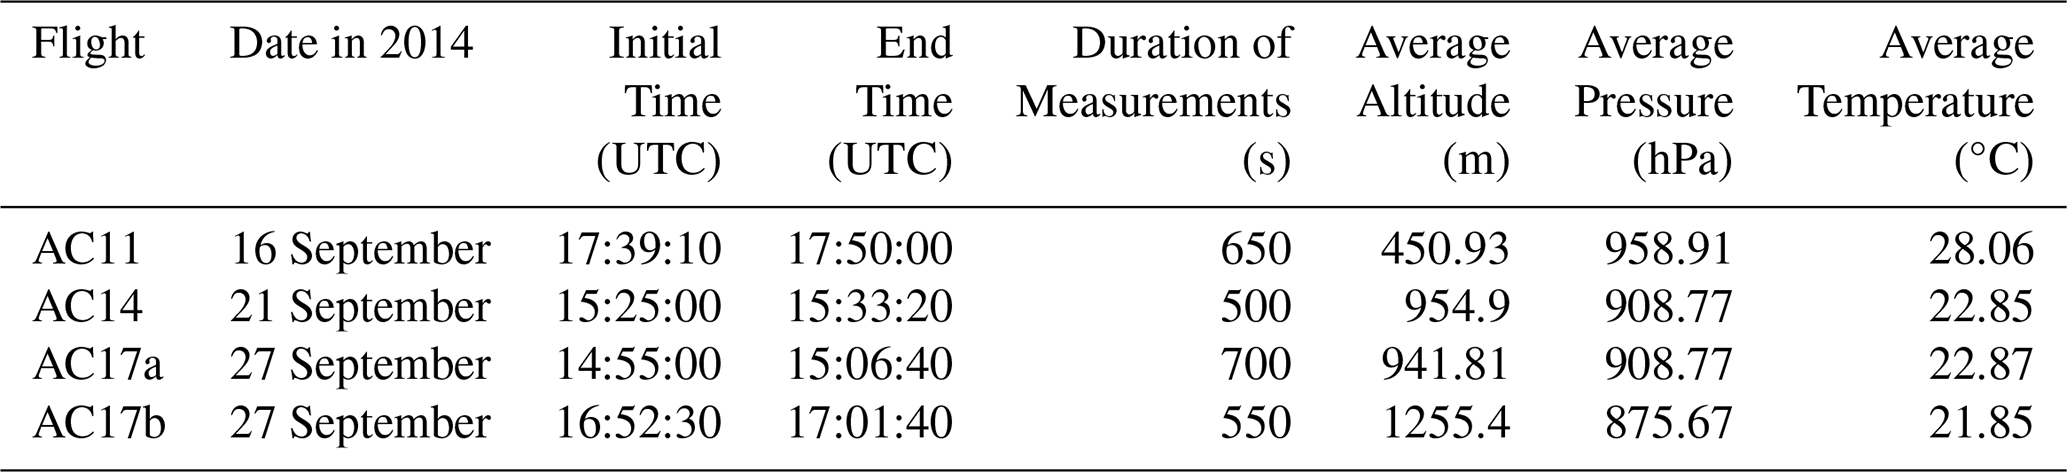
The calculations of RHc and cloud supersaturations (Sc, Sl, and Sv) at cloud bases are performed from measurements collected during the ACRIDICON-CHUVA campaign using HALO. Cloud probes and meteorological sensors on board HALO have been used to collect the necessary data. Table 1 summarizes the general thermodynamic conditions and time intervals of cloud properties measured at cloud bases. The cloud measurements were conducted with the Cloud Combination Probe-Cloud Droplet Probe (CCP-CDP) (Lance, 2012). In this study, we focus on the initial stage of cloud formation. Therefore, only 1 Hz cloud passes (individual in-cloud sampling intervals) with Nd greater than 20 cm−3, developing under updraft conditions, are considered. This threshold of is used to avoid haze and well-mixed cloud elements in the analysis. Furthermore, cloud passes with measured raindrops are removed from our analysis. In the supplementary material (Sect. S2), we present the sensitivity analysis assuming the proposed threshold for cloud identification and varying the values of Nd and LWC for the derived supersaturations and their relationships. These analysis shows that the derived supersaturations and their relationships assuming the proposed threshold () are robust with respect to variations in cloud identification criteria. The remaining variability is primarily driven by environmental heterogeneity and turbulence rather than by the threshold definition itself.
Table 1Summary of cloud base 1 Hz CCP-CDP measurements conditions, including sampling duration and mean thermodynamic conditions for each analysed flight segment.

The closure analysis relies on the reversibility of the cloud adiabatic parcel as described in Sect. 3.4. The calculations of RHc, Sc, Sl, and Sv require the information of p, LWC, T, and T0 near cloud bases. From the airborne data at cloud bases, p, T and LWC are measured. The distinction between the measured cloud-base quantities and the diagnostically reconstructed thermodynamic state is illustrated in Fig. 1b. Therefore, we estimate T0 and Tair for each cloud pass. Below are the sequential steps used in our analysis:
-
T0 (or TQ) is iteratively estimated for each cloud pass from Q (calculated from LWC, T and p) using Eq. (2). RHc and Sc are subsequently calculated from T and estimated T0.
-
The process is repeated by considering both Q, calculated in the first step, and Ws in the energy budget (see Eq. 16), which results in an estimated air temperature (Tair) lower than T0 obtained in step 1, such that . From this closure analysis, the values of ΔU and Ws are estimated, and Sl and Sv are subsequently calculated with Eqs. (18) and (19), respectively.
During flights AC11, AC14 and AC17, the NCCN(Sv) spectra from two CCN counters (CCNa and CCNb) were measured below cloud base prior to cloud base measurements with the CCP-CDP probe. This comparison provides an important evaluation of the derived water vapor component of cloud supersaturation (Sv), since CCN chamber measurements are independent of in-cloud condensational growth processes. The Nd(Sv) spectra were converted to standard temperature and pressure (STP) conditions before comparison. The comparison between Nd(Sv) and NCCN(Sv) aimed to evaluate the physical consistency of the proposed thermodynamical framework. In the CCN counters, Sv is determined from the Köhler theory using particles with a known physicochemical composition, typically ammonium sulfate, and is therefore independent of cloud processes.
3.7 Aircraft data
3.7.1 Meteorological measurements
HALO was equipped with a meteorological sensor system (BAsic HALO Measurement And Sensor System – BAHAMAS) located at the nose of the aircraft (Wendisch et al., 2016). The water vapor mixing ratio and derived humidity quantities were measured by the Sophisticated Hygrometer for Atmospheric Research (SHARC). The uncertainties for measurements at a frequency resolution of 1 Hz of air pressure, air temperature, relative humidity, water vapor mixing ratio, and wind speed are about 3 Pa, 0.5 K, 5 %, 4 % and 0.3 m s−1, respectively (Mallaun et al., 2015).
3.7.2 Cloud and CCN measurements
The measurements of cloud properties over the Amazon Basin were performed at a frequency resolution of 1 Hz by the CCP mounted below the wings of the aircraft (Lance, 2012). CCP combines two detectors, the CDP and the grayscale Cloud Imaging Probe (CIPgs), which allow the measurement of droplets with a size range of 3–960 µm. In this study, the integrated water content of CDP for bin diameters ranging from 3–50 µm was used to calculate the LWC at warm cloud bases. The measurements were validated by another cloud probe (Cloud and Aerosol Spectrometer with depolarization, CAS-DPOL) and a hot wire King probe (Braga et al., 2017a). The integrated water content of CIPgs for bin diameters greater than 50 µm was used to calculate the Rainwater Content (RWC). Only cloud passes without rain droplets (i.e., ) are used in our analysis.
During the ACRIDICON-CHUVA campaign, CCN number concentrations were measured at a frequency resolution of 1 Hz onboard HALO using a two-column CCNc [CCN-200; columns A (CCNa) and B (CCNb)], which is a continuous-flow longitudinal thermal-gradient instrument manufactured by Droplet Measurement Technologies (DMT) (Roberts and Nenes, 2005). In the instrument, the sampled aerosol particles are exposed to a set supersaturation and absorb water depending on their size and chemical composition. Particles that grow to droplets larger than 1 µm in diameter are counted as CCN at that Sv. CCNa measured CCN concentrations with cycled Sv between 0.2 % and 0.55 % at 100 s intervals, and CCNb measured CCN concentrations with a fixed Sv∼0.55 %. Table 2 summarizes the general thermodynamic conditions and the time intervals during which CCN measurements were conducted below cloud base. The NCCN(Sv) measurements of the chambers were compared to the measured Nd and calculated Sv for three flights where Nd(Sv) and NCCN(Sv) had the same range of Sv values.
Table 2Summary of below cloud base 1 Hz CCN measurement conditions, including sampling duration and mean thermodynamic conditions for each analysed flight segment.
For measurements on polluted conditions during flights AC11, AC14 and AC17, the estimated uncertainties in CCN concentrations are about 10 %. Furthermore, the estimated relative uncertainty in Sv values () is about 14 % on average, resulting from the uncertainties of 10 % from counting efficiencies and 10 % due to calibration accuracy. Sample air for the aerosol measurements was obtained from two different inlets: (i) the HALO aerosol submicron inlet (HASI) and (ii) the HALO counterflow virtual impactor (HALO-CVI). The CCN-200 provides the possibility to measure from both inlets in parallel or at two different values of Sv.
3.7.3 Airborne meteorological and cloud properties uncertainties
During the ACRIDICON–CHUVA campaign, the resulting uncertainty in the measured Nd and LWC by CCP–CDP with 1 Hz resolution was about 10 % (Braga et al., 2017a). The uncertainty of RWC measurements was about 30 % (Braga et al., 2017b, 2021b). RWC uncertainties are less relevant to this study since we are focused on shallow cumulus clouds in the initiation stage of development, which typically have no rain droplets.
The measurement uncertainties of the energy budget parameters were calculated using a Monte Carlo method (Joint Committee for Guides in Metrology, 2008) and are described in Sect. S2.2 in the Supplement. The uncertainties in the meteorological measurements from the BAHAMAS system translate into an estimated average uncertainty of about 0.24 percentage points (%) (typically<1 % for 1 Hz data) in the derived RHc. The relative uncertainties in the energy terms are about 10 % for Q and ΔU, and 13 % for Ws. Propagating these errors yields relative uncertainties of supersaturation () of approximately 10 % for Sc and Sl, and ∼12 % for Sv. The uncertainties of energy terms and supersaturations are primarily sensitive to the LWC uncertainties. Baumgardner et al. (2017) reports that expected range of uncertainties in LWC and Nd is between 10 % and 30 %. For LWC uncertainty of 30 %, the relative uncertainties of the energy terms are about 29 % for Q and ΔU, and 38 % for Ws. Propagating these errors yields overall uncertainties of ∼28 % for Sc and Sl, and ∼36 % for Sv.
The uncertainties reported in the main text correspond to the best-case measurement scenario, for which relative uncertainties of 10 % in LWC and Nd are adopted. This value represents the lower range of uncertainty expected under favorable sampling conditions, particularly during straight and stable cloud penetrations through non-precipitating clouds, for which the cloud liquid water is predominantly contained within the droplet-size range measured by the CCP-CDP. Although LWC is particularly sensitive to droplet-sizing uncertainties because it is derived from the third moment of the measured droplet size distribution, the uncertainty in integrated LWC cannot be obtained directly by applying a single sizing uncertainty uniformly to all droplets in a polydisperse distribution. Laboratory calibrations of CDP instruments using droplets of known size have demonstrated that sizing accuracy depends on calibration conditions, droplet size, and position within the probe sample area (Lance et al., 2010; Faber et al., 2018). To account for less favorable measurement conditions and larger uncertainties associated with CDP sizing and sampling effects, a conservative case assuming 30 % uncertainty in LWC is also evaluated in Sect. S2.2. The corresponding uncertainties in the energy terms and derived supersaturations provide an upper-bound assessment of the sensitivity of the method to uncertainties in the cloud microphysical measurements.
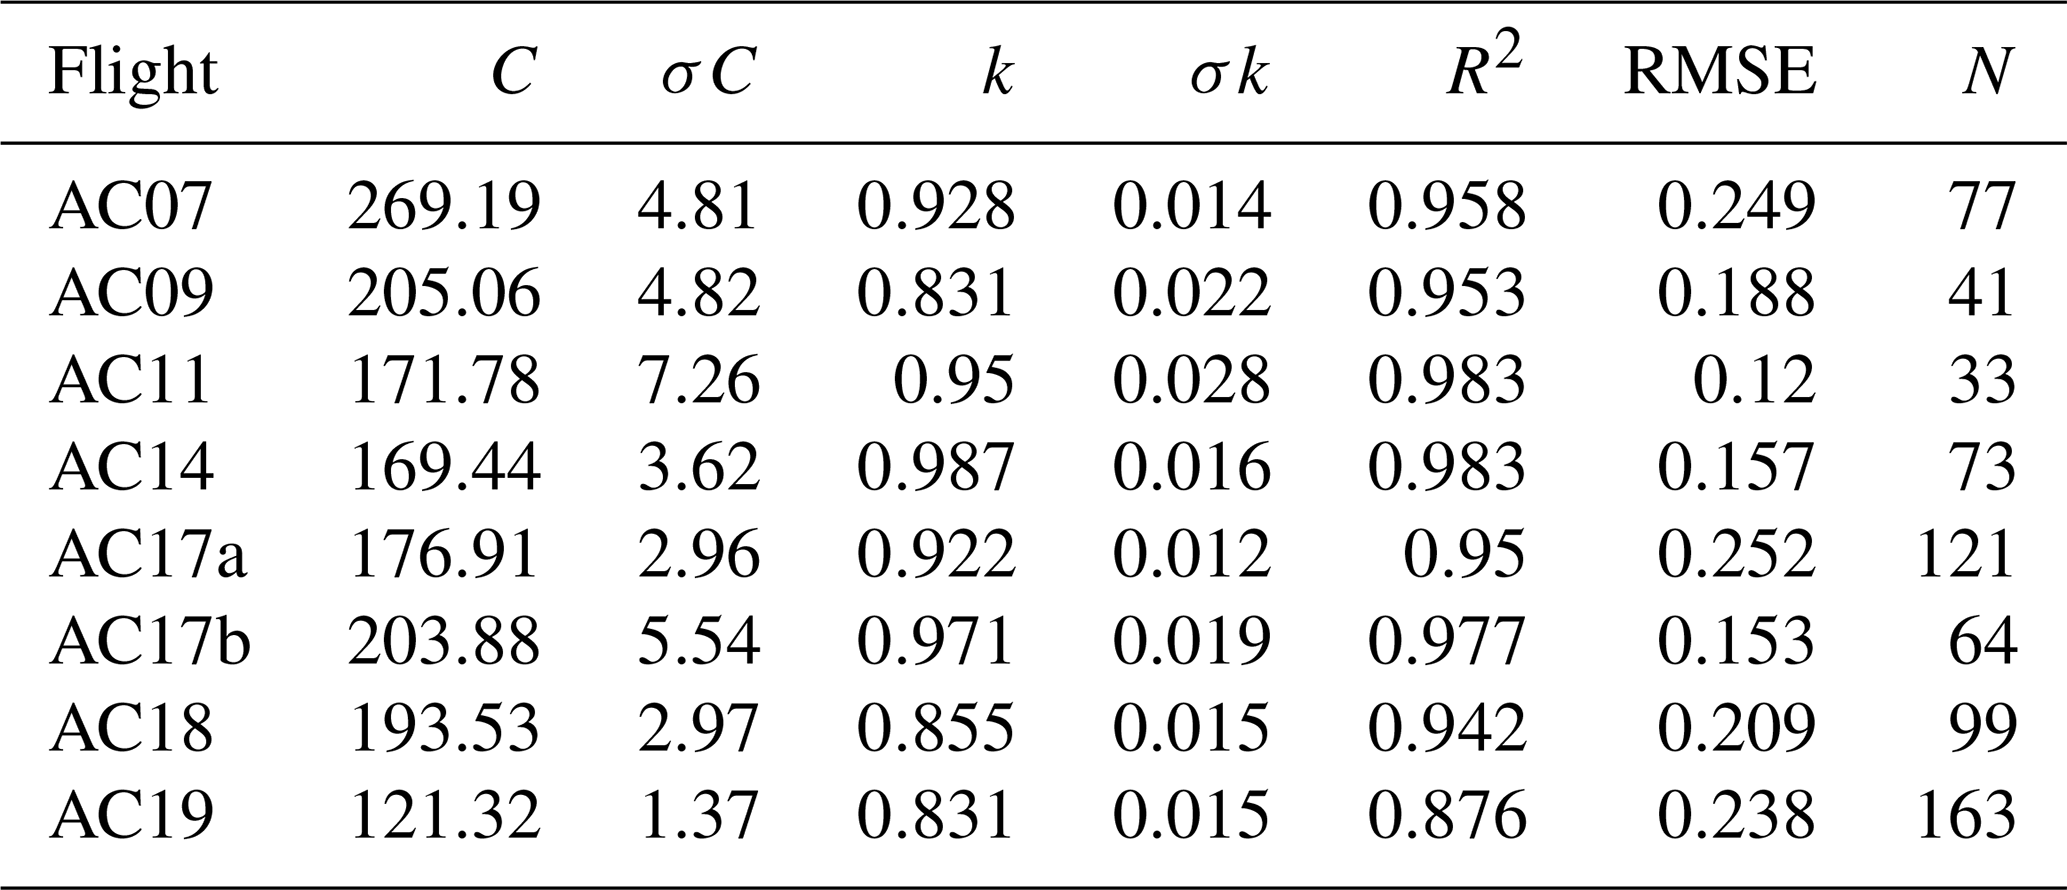
The uncertainties of the power-law relationship fitted for each flight segment shown in this manuscript were also calculated using Monte Carlo uncertainty propagation (using 10 % for Nd and 12.6 % for Sv). These calculations are presented in Sect. S2.3 in the Supplement. Across all flights, the exponent is well constrained with uncertainties of , while the C shows relative uncertainties of approximately 2 %–6 %. Higher measurement uncertainties increase the scatter in the power-law relationships Nd−S (shown in Tables S5–S7 in the Supplement). Our analysis show a systematic decrease in both C and k when uncertainties increase, indicating that uncertainty propagation affects not only the precision but also the magnitude of the fitted parameters. Despite these shifts, the power-law relationship remains consistent across thresholds and flights, and the variations in C and k are within the broader uncertainty range of the estimates. This indicates that while increased uncertainties reduce the strength of the statistical fit and slightly bias the parameter values, they do not alter the underlying physical dependence of Nd on Sc, Sl, and Sv.
4.1 Energetic budget and supersaturations at cloud base
To illustrate the thermodynamic basis of the energetic budget analysis at cloud base, we first describe the fundamental relationships between the initial temperature of the saturated parcel (T0) and adiabatic cooling ΔT for T0 ranging from 2–30 °C. Figure 2 shows the simulated values of LWC, Q, ΔU, and Ws resulting from the energy balance at a pressure level of 950 hPa. All quantities from the energy balance are expressed as positive values to represent the partition of the total energy (Q) during the condensational growth. In the case in which water vapor is completely condensed (Q=dH) the LWC (solid lines) increase almost linearly with cooling rate for different T0. For the same cooling rate, a slightly larger LWC is calculated for lower temperatures owing to the higher dry air density of the saturated parcel. When accounting for Ws in the energy budget, the resulting values of LWC (dotted lines) are relatively smaller. At 950 hPa, the fractional reduction in LWC due to Ws increases approximately linearly with temperature, ranging from about 4 %–6 % at low temperatures (∼2–6 °C) to 15 %–20 % at higher temperatures () (see Fig. S1 in the Supplement). The values of ΔU are slightly smaller than Q since the total energy is partitioned with Ws, which increases approximately linearly with temperature and logarithmically with the cooling rate.
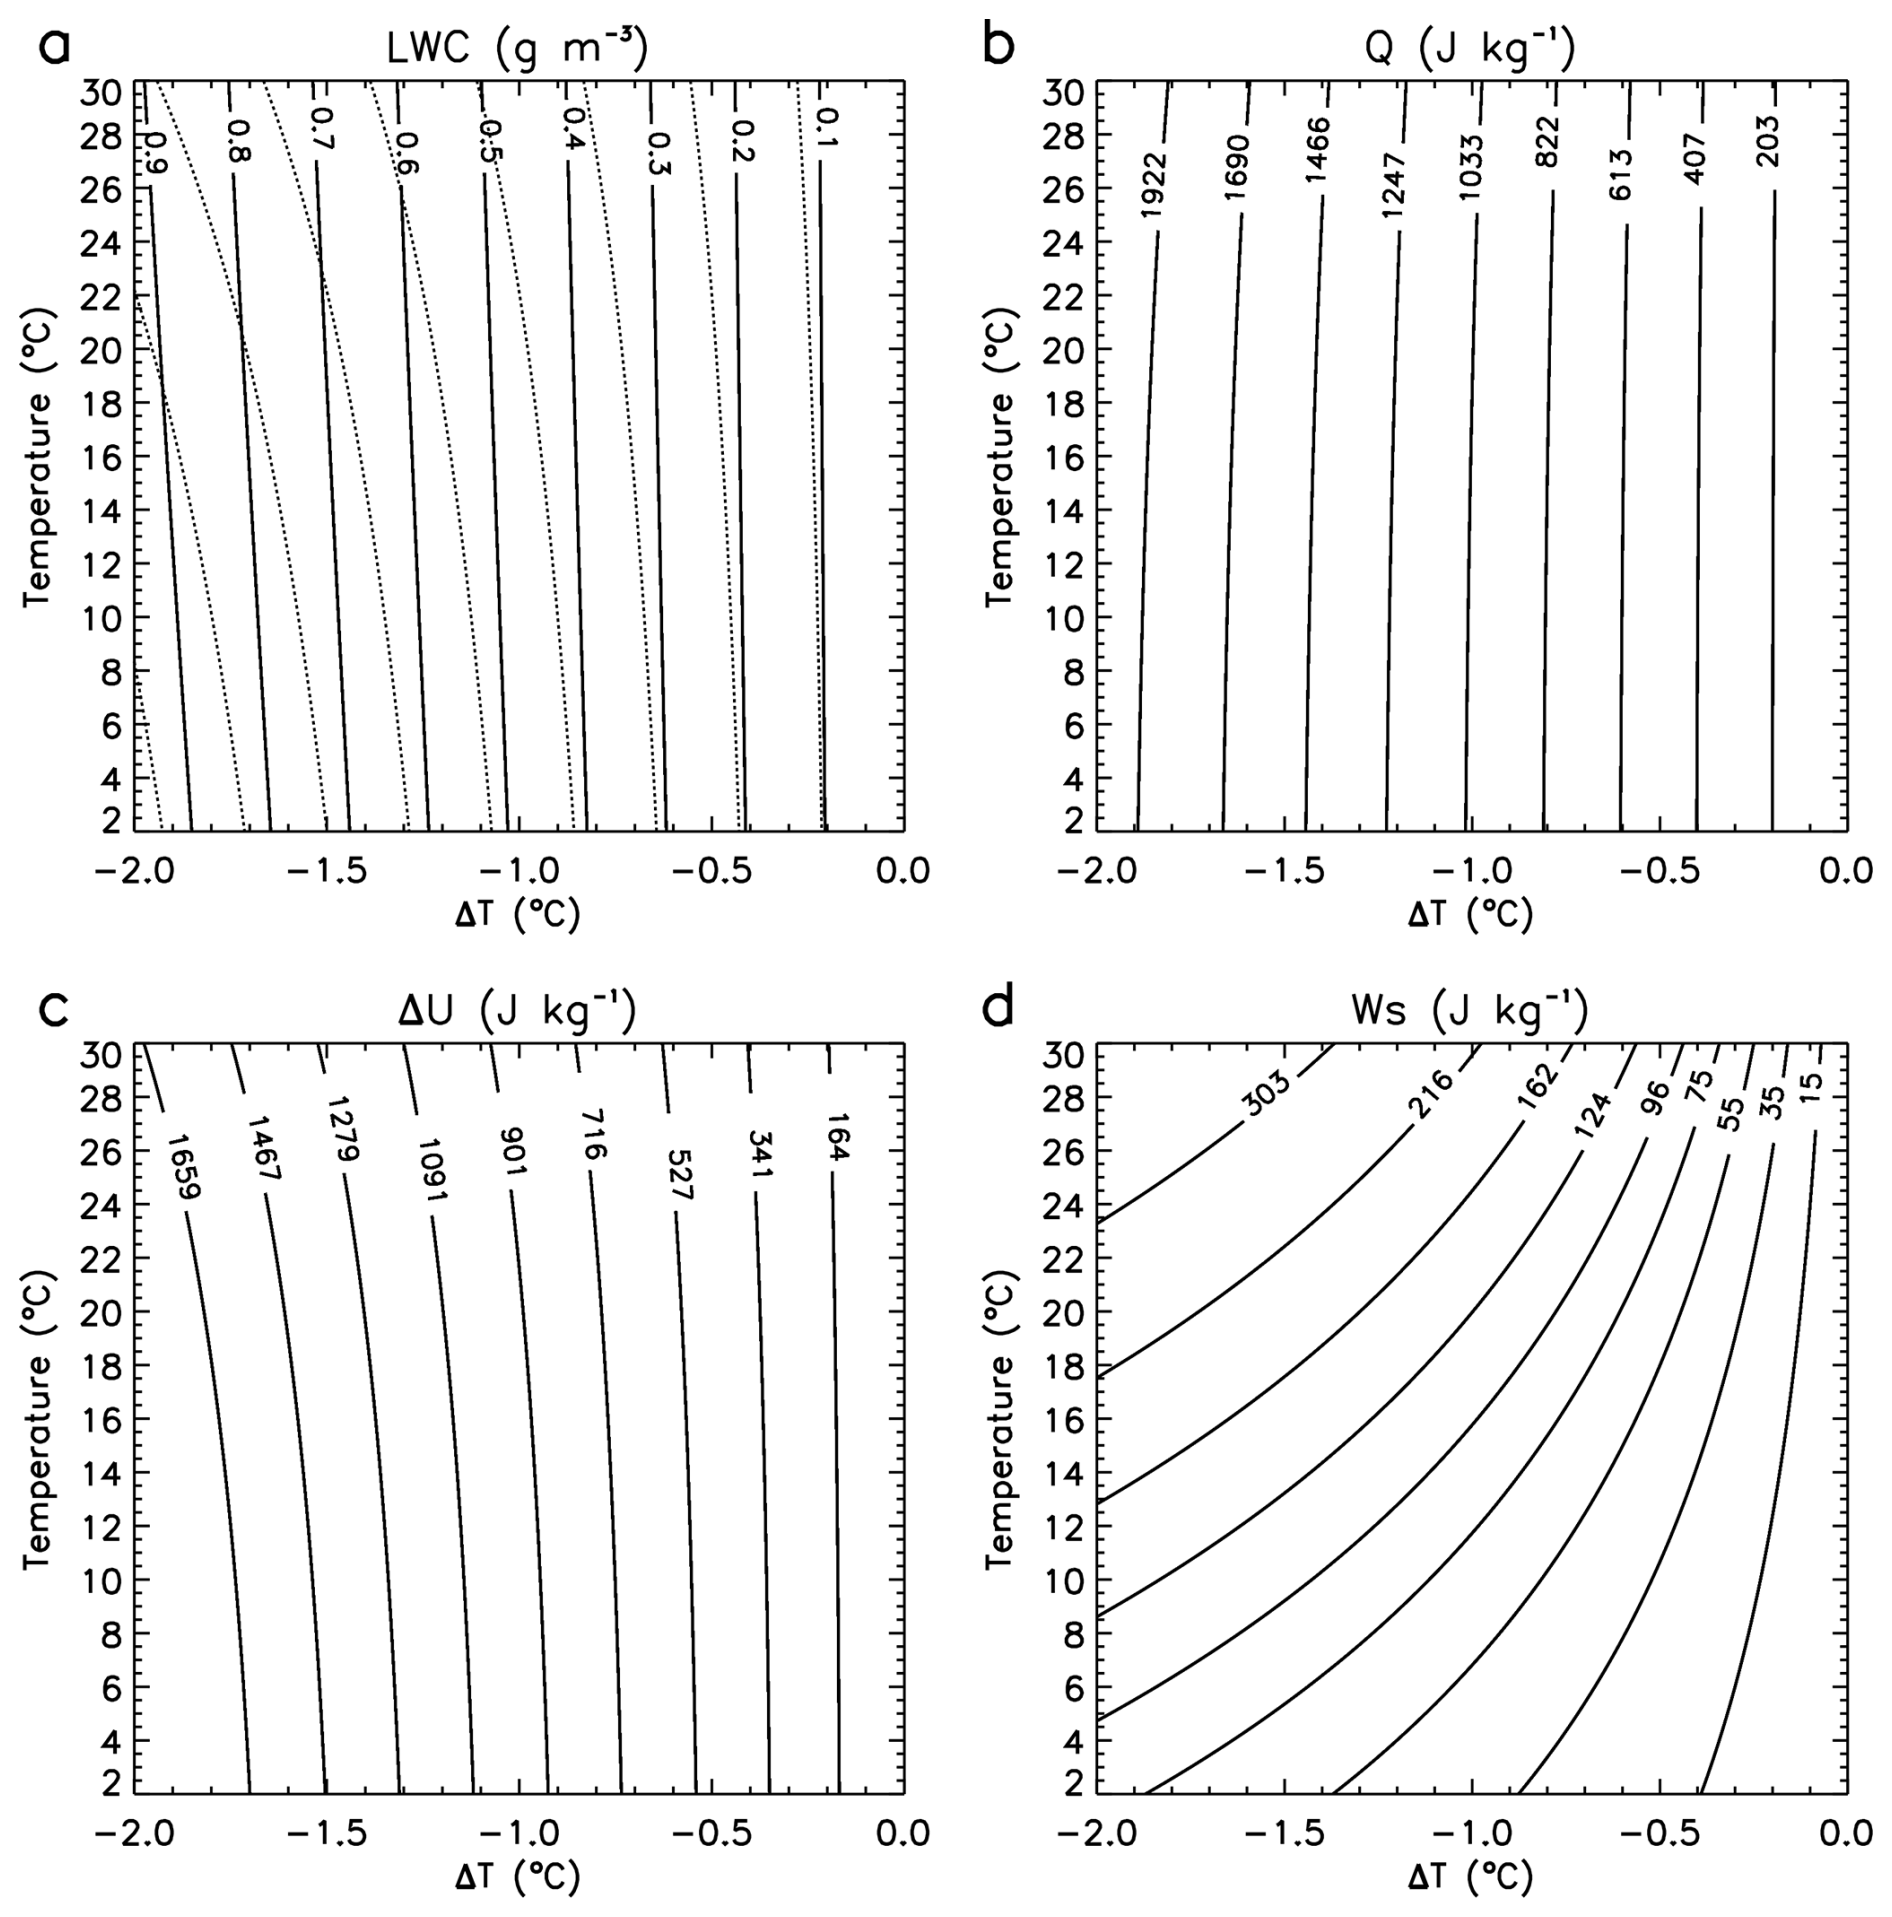
Figure 2(a) Contours of Liquid Water Content (LWC) values of cloud adiabatic parcels as a function of initial temperature T0 (y-axis) and adiabatic cooling rate (ΔT) (x-axis) at 950 hPa. Dotted lines indicate the LWC resulting from the energy budget (Ws term leads to LWC decrease for the same ΔT). Similar for (b) Latent heat of condensation (Q), (c) Magnitude of internal-energy change (), and (d) saturation work (Ws).
Figure 3 shows the corresponding values of RHc, Sc, Sl, and Sv derived from the energy budget framework. Figure 3a and b show RHc decreasing below 100 %, with a corresponding increase of Sc above 0 % as a function of the prescribed adiabatic cooling. For a given cooling magnitude, the increase in Sc becomes slightly smaller at warmer temperatures because the fractional reduction in for a fixed ΔT decreases slightly with increasing T0, consistent with the temperature dependence of the Clausius–Clapeyron relation. Figure 3c and d show the partitioning of Sc into Sl and Sv resulting from the energy budget analysis. The values of Sl are about one order of magnitude larger than Sv, indicating that most of the enthalpy change associated with adiabatic cooling and condensation contributes to vapor-to-liquid conversion and condensational growth, while Ws represents a smaller fraction of the total energy budget. Since Ws increases with T0, Sv becomes relatively larger under warmer cloud-base conditions for the same cooling magnitude, whereas the opposite behaviour is observed for Sl. This emphasizes the increasing contribution of saturation work to the total energy budget at warmer temperatures, which enhances Sv while reducing the condensational growth of cloud particles.
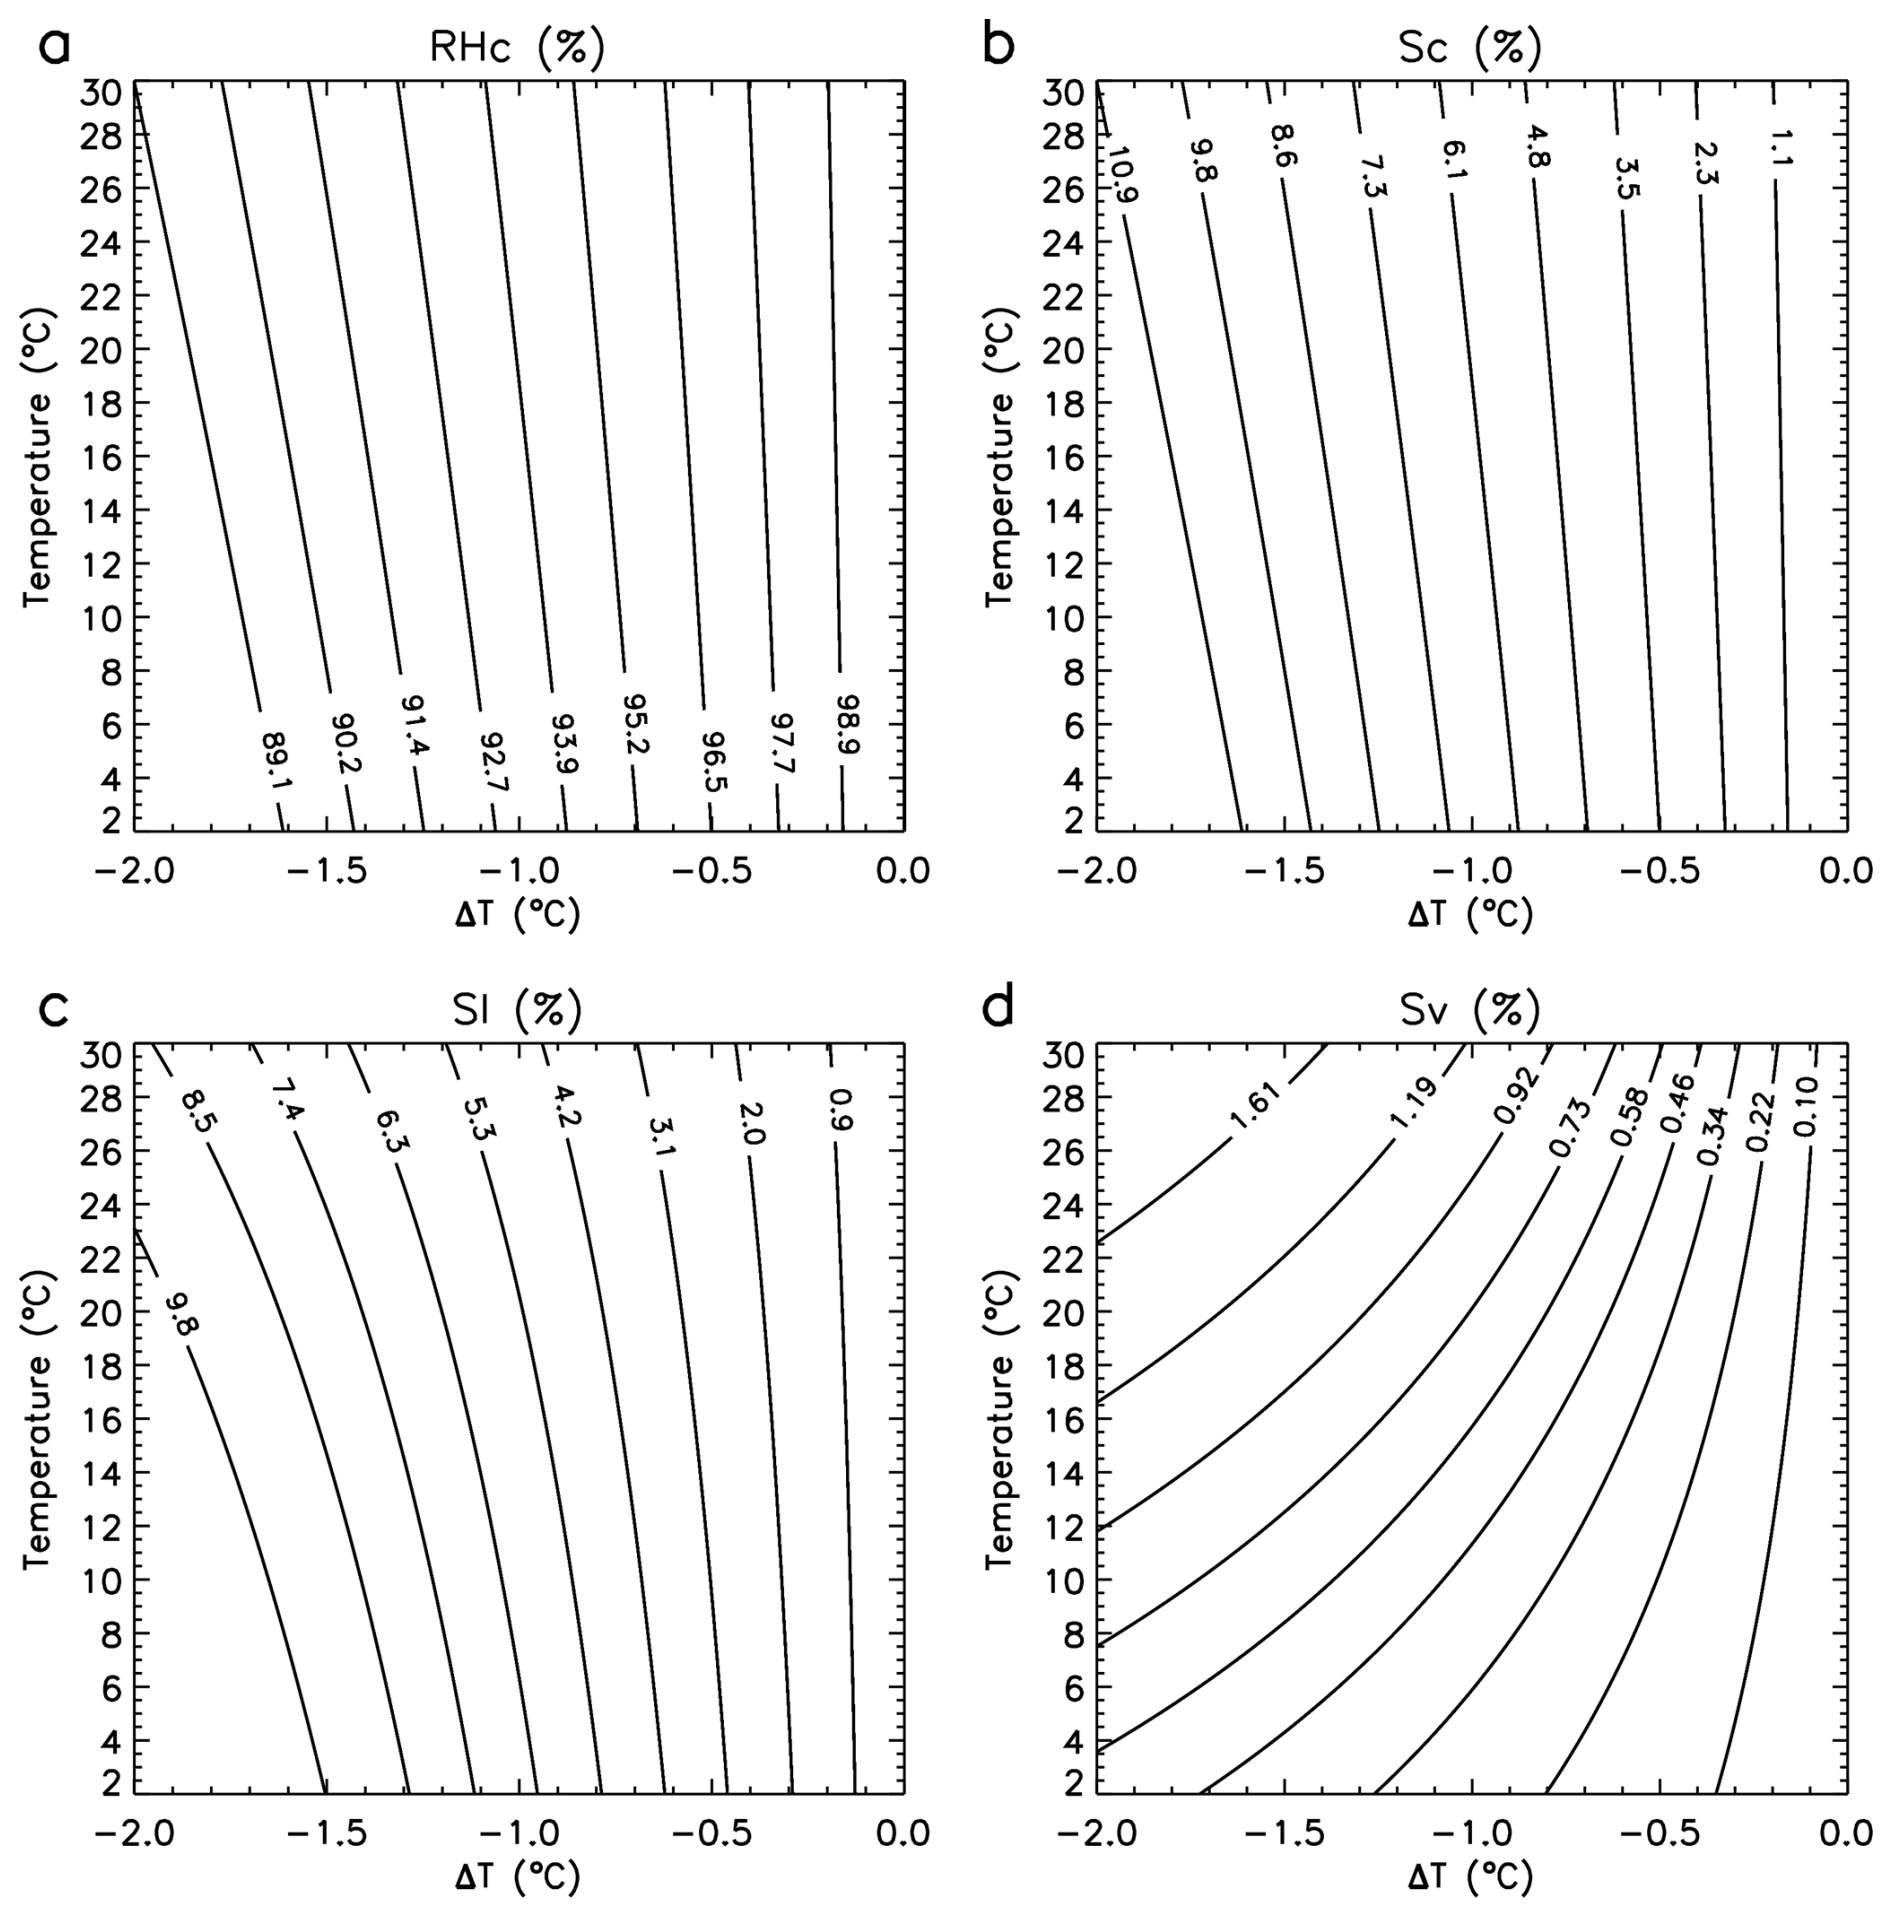
Figure 3(a) Contours of reference-state saturation ratio (RHc) as a function of initial temperature T0 (y-axis) and adiabatic cooling rate (ΔT) (x-axis) for saturated parcels at 950 hPa. (b–d) Similar to cloud supersaturation (Sc), liquid-phase supersaturation (Sl), and for water vapor supersaturation (Sv), respectively.
These relationships between energetic partitioning and the vapor budget remain qualitatively similar under lower-pressure conditions. However, as pressure decreases, the LWC is reduced because the density of dry air decreases. Furthermore, for a given T0 and ΔT, the magnitude of Ws is slightly enhanced at lower pressures due to the larger saturation mixing ratio (see Eq. 5), thereby increasing the contribution of water vapor expansion to the total energy budget. Consequently, a smaller fraction of the enthalpy change associated with cooling and condensation contributes to vapor-to-liquid conversion and condensational growth. At 850 hPa, for example, the reduction in LWC associated with Ws ranges from approximately 5 %–7 % at low temperatures () to about 18 %–22 % at higher temperatures () (Fig. S2 in the Supplement). The larger contribution of Ws to the energy budget leads to slightly larger Sv and smaller Sl relatively to those at 950 hPa.
4.2 Cloud supersaturations at cloud bases of growing cumuli
The data collected during the ACRIDICON-CHUVA campaign over the Amazon Basin provides a particularly useful testbed for the cloud base closure analysis because the same aircraft and instrumentation sampled a wide range of cloud base environments, from relatively clean marine and forested conditions to polluted air masses influenced by biomass burning and the Manaus urban plume (see the locations of the cloud base measurements at Fig. S3 in the Supplement).
Figure 4 illustrates a case study of the dependence of Nd at cloud base on RH, RHc, cloud supersaturations (Sc, Sl, Sv), and the associated energetic terms (Q, ΔU, Ws) derived from measurements collected during Flight AC14. During this flight leg, cloud bases of developing cumuli were sampled under RH conditions ranging from ∼60 % to ∼102 %, at an altitude of about 1600 m and temperatures near 17.6 °C. Figure 4a shows that RH generally increases as a function of Nd even though in most cloud passes RH is smaller than 100 %. This variability in RH measurements arises from the characteristics of in situ temperature measurements: liquid water impinging on the sensor can induce evaporative cooling, whereas the latent heat released during particle condensational growth and buoyant air volumes may locally warm the sensor. RHc decreases consistently with Nd associated with higher LWC. For cloud passes where RH<RHc the local vapor pressure e(T) is typically smaller than expected from the cooling trajectory of the initially saturated parcel, suggesting enhanced entrainment of unsaturated environmental air and reduced condensational growth (see Fig. S4 in the Supplement). Under such conditions, smaller droplets evaporate preferentially due to the inhomogeneous nature of mixing in convective clouds. This selective evaporation reduces the local LWC, and the remaining droplet population is biased toward droplets formed on CCN with higher hygroscopicity, which are more resistant to evaporation. Conversely, cases in which RH>RHc indicate that the parcel retains a larger vapor content relative to theoretical calculations, favouring continued condensational growth, enhanced Sv, yielding higher Nd for a given CCN population.
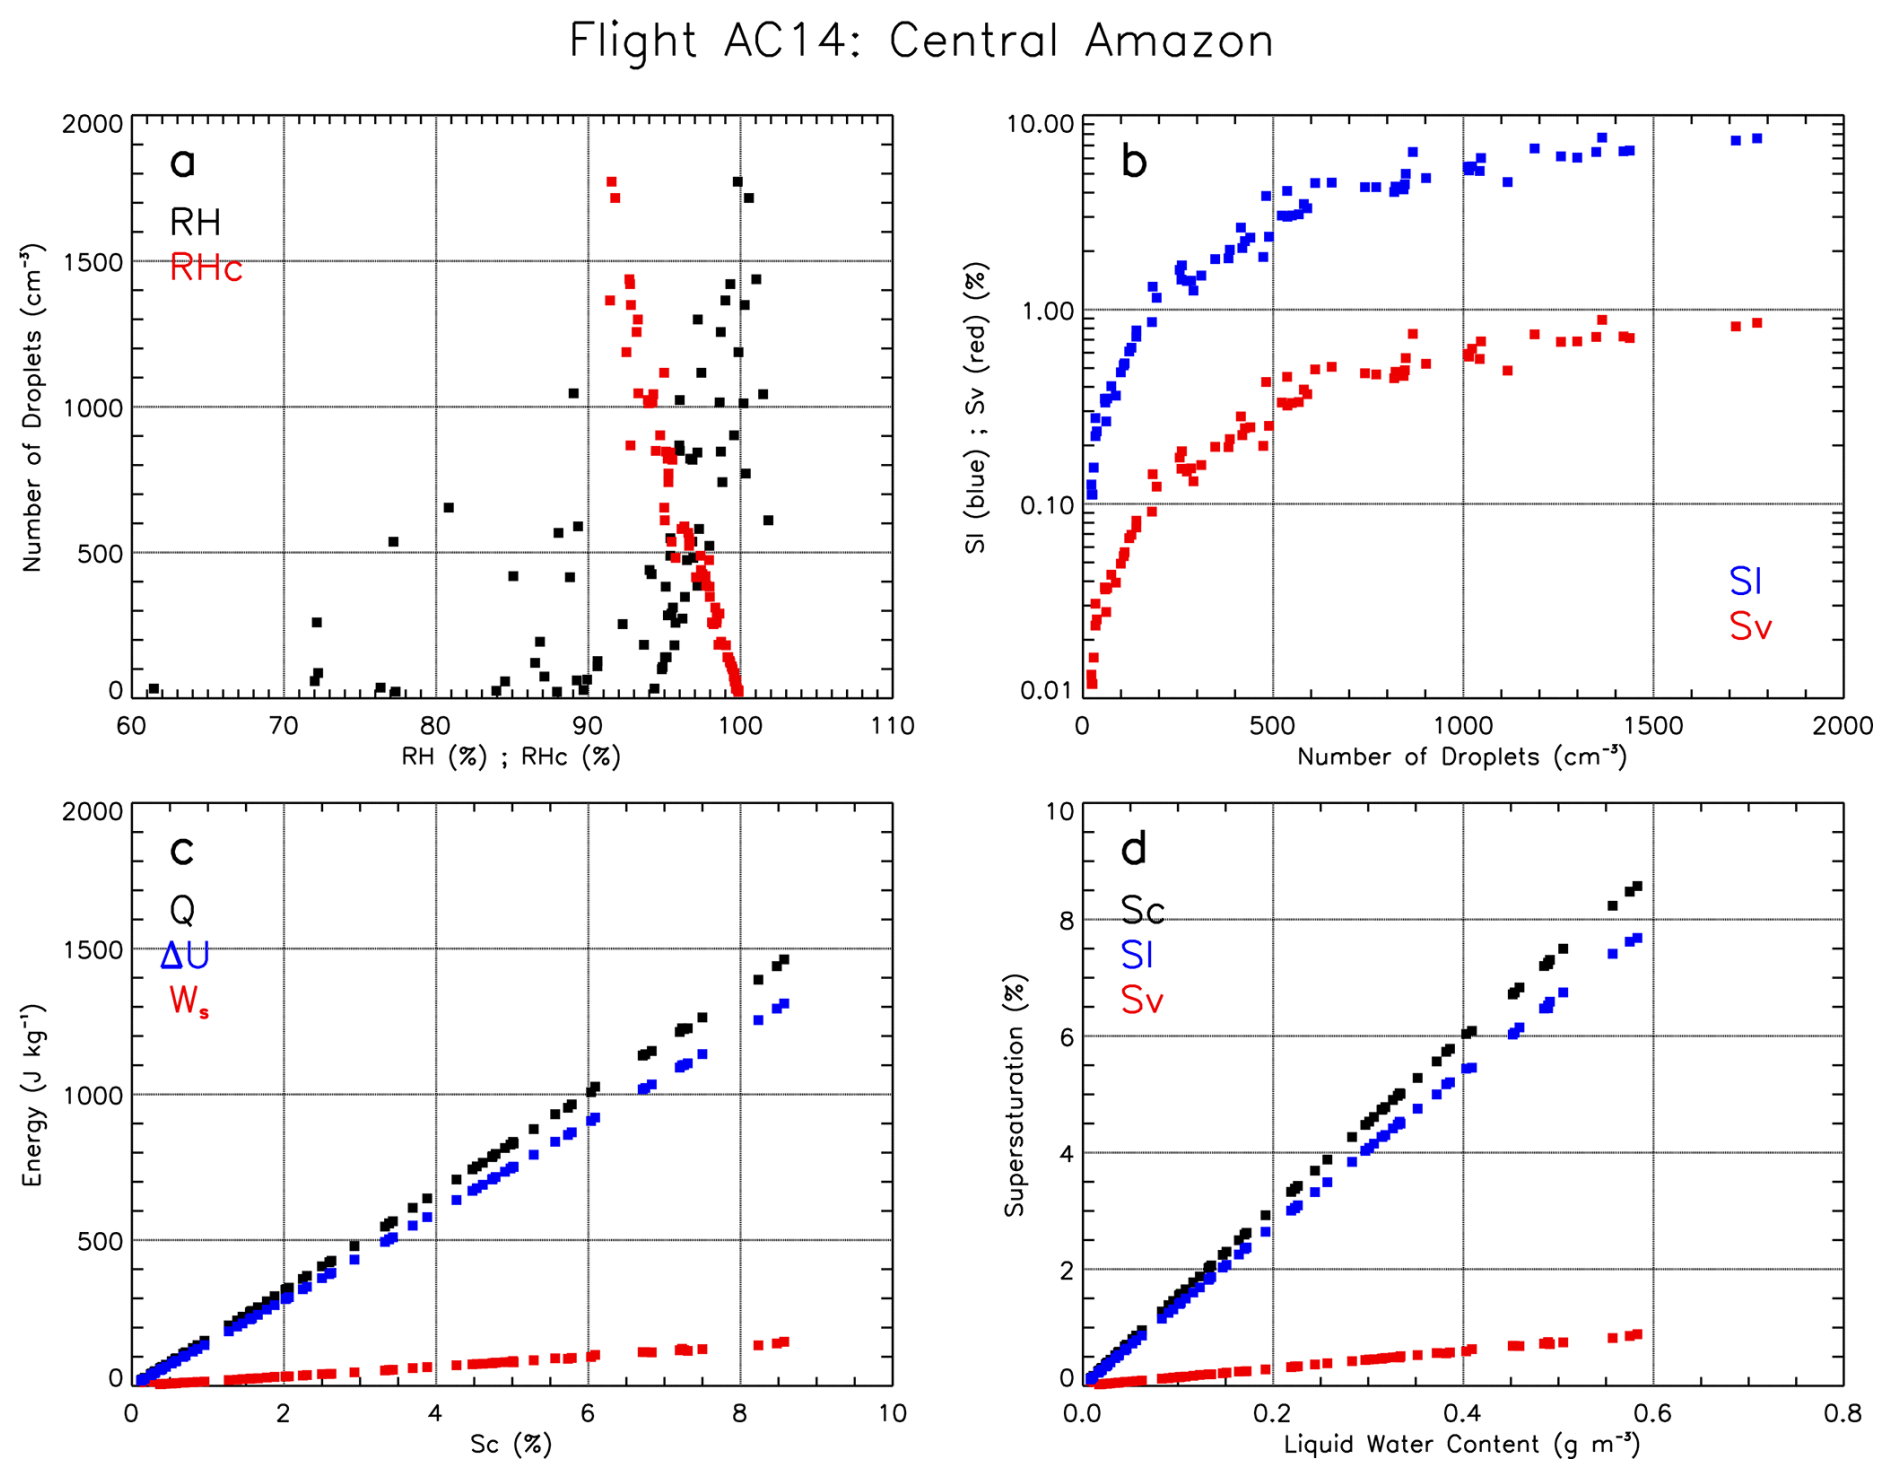
Figure 4Cloud microphysical and thermodynamic properties measured at cloud bases of growing convective cumuli during Flight AC14. (a) RH versus Nd (black) and RHc versus Nd (red). (b) Nd versus Sl (blue) and Nd versus Sv (red). (c) Sc versus Q, , and Ws. (d) LWC versus Sc, Sl, and Sv.
Figure 4b shows the dependence of Nd on Sv and Sl at cloud base. Both Sl and Sv increase with Nd, although Sv remains nearly one order of magnitude smaller than Sl. The calculated Sv values exhibit the expected positive relationship between supersaturation and droplet concentration commonly observed in CCN activation spectra. The Nd(Sv) relationship exhibits substantial variability at cloud base owing to the inhomogeneous and turbulent nature of the in situ measurements. The dispersion is particularly enhanced for cases in which relatively large Nd values are associated with small Sv, corresponding to conditions where the local vapor pressure remains below the theoretical simulations (RH<RHc). Nevertheless, most of the measured water vapor pressures remain within the estimated uncertainty range of the theoretical estimates (see Fig. S4), indicating that the overall Nd−Sv relationship remains representative of the cloud base thermodynamic conditions. Figure 4c presents the energy budget components as a function of Sc, while Fig. 4d depicts the cloud supersaturations derived from the measured LWC. These figures show that the total energy (Q) increases strongly with LWC and is dominated by changes in internal energy (; ∼90 % on average), while the contribution from saturation work (Ws) is comparatively minor.
Similar characteristics of the energy budget were observed for the different flight legs measured in the Amazon Basin and Atlantic Ocean (Figs. S5–S18 in the Supplement). In these flight segments, most of the measured water vapor pressures were within the estimated uncertainty range of the theoretical cloud-adiabatic estimates. The estimated fraction of accounted for in the energy budget, lower values were measured for warmer (marine) clouds during flight AC19. As shown in Sect. 4.1, Sv has a strong linear dependence on temperature, since this supersaturation component is associated with the Ws term. These results show that in warmer environments, a larger amount of energy relative to Q is expended for the air parcel's expansion, leading to a smaller decrease in the cloud parcel's internal energy and a lower cooling rate.
Figure 5 shows the droplet number spectra as a function of cloud supersaturations (Sc, Sl, Sv), Nd(S), derived from cloud base measurements for all flight segments (see Tables 3–5 for the statistics of the fit parameters). The Nd(S) were derived using power-law fits of the form , where C is a scaling factor and k is the spectral exponent. Across all three supersaturations derived larger values of C and k parameters are estimated for aerosol-rich conditions (e.g., AC07), whereas smaller C and k values (e.g., AC19) reflect more CCN-limited regimes. The values of C and k have closer values for the power-law fits of Nd−Sc and Nd−Sl due to the similar values of Q and ΔU in the energetic budget partition (). The high coefficients of determination (R2>0.87) and low root-mean-square errors (RMSE<0.3) indicate robust agreement between the fitted relationships and the observations under different atmospheric conditions. The tables show that the values of R2 are sensitive to sample size, and larger cloud base datasets typically result in lower R2 values due to the inclusion of a broader range of atmospheric variability. In our observations, larger samples encompass more heterogeneous conditions in updraft velocity, turbulence intensity, and CCN concentrations, which increase scatter in the Nd−S relationships. Nevertheless, the fitted parameters C and k remain relatively stable across the different environmental conditions owing to the underlying physical dependence between Nd and S. A more detailed description of this analysis accounting for different cloud detection thresholds and measurements uncertainties is provided in Sect. S2.3.
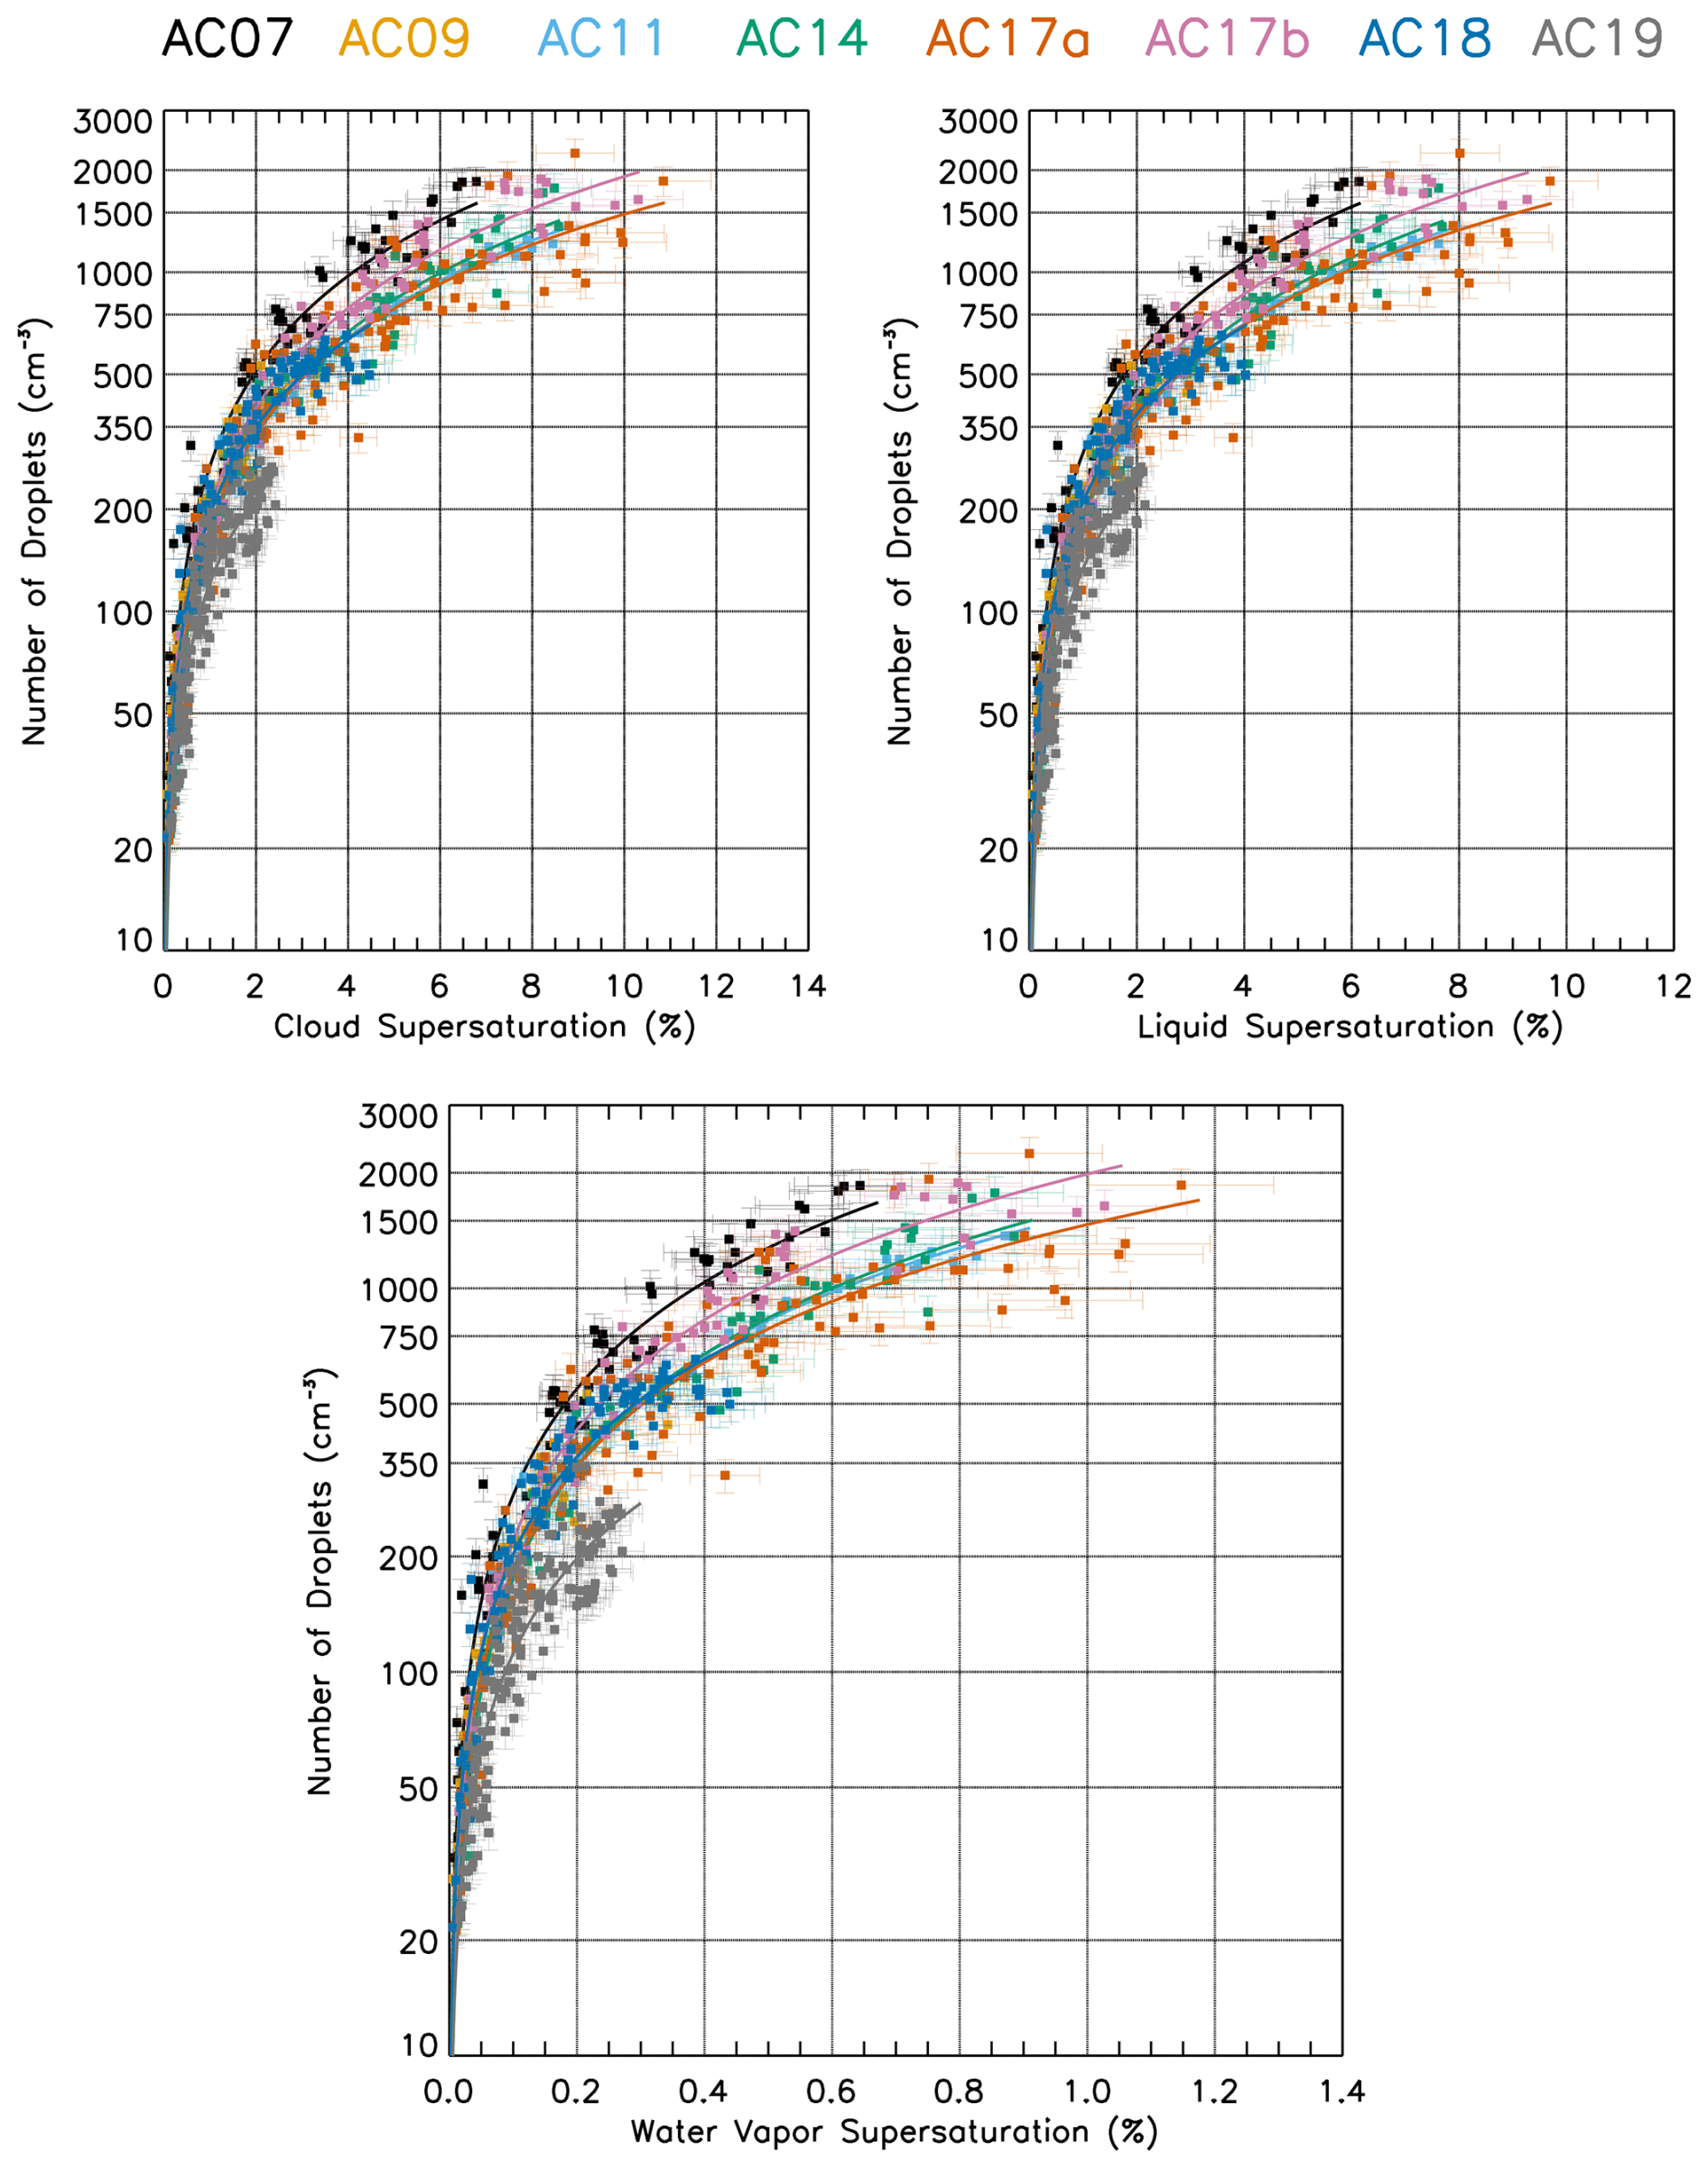
Figure 5(upper-left) Sc vs. Nd for multiple flight segments (AC07, AC09, AC11, AC14, AC17a, AC17b, AC18, and AC19). Colored markers represent in-situ measurements, while solid curves correspond to power-law fits of the form . The colored markers correspond to different aerosol backgrounds in the Amazon region (red: Central Amazon, green: Northwestern Amazon, blue: Atlantic Ocean). (upper-right) and (bottom) Similar for Sl vs. Nd and Sv vs. Nd, respectively. Error bars indicate the uncertainties of Nd (10 %), Sc (∼9.5 %), Sl (∼9.2 %) and Sv (∼12.6 %). The statistics of the power-law fits are presented in Tables 3–5.
Table 3Power-law fit parameters for the relationship derived from log–log regression for each flight leg. The coefficients C and k are reported as Monte Carlo means ±1σ (Nr=5000 realizations). The coefficient of determination (R2) and root-mean-square error (RMSE) are calculated from the nominal fit in logarithmic space. The uncertainties of Nd and Sv assumed in the calculations are 10 % and 12.6 %, respectively. Columns list: Flight leg, C, σC, k, σk, R2, RMSE, and sample size (N).
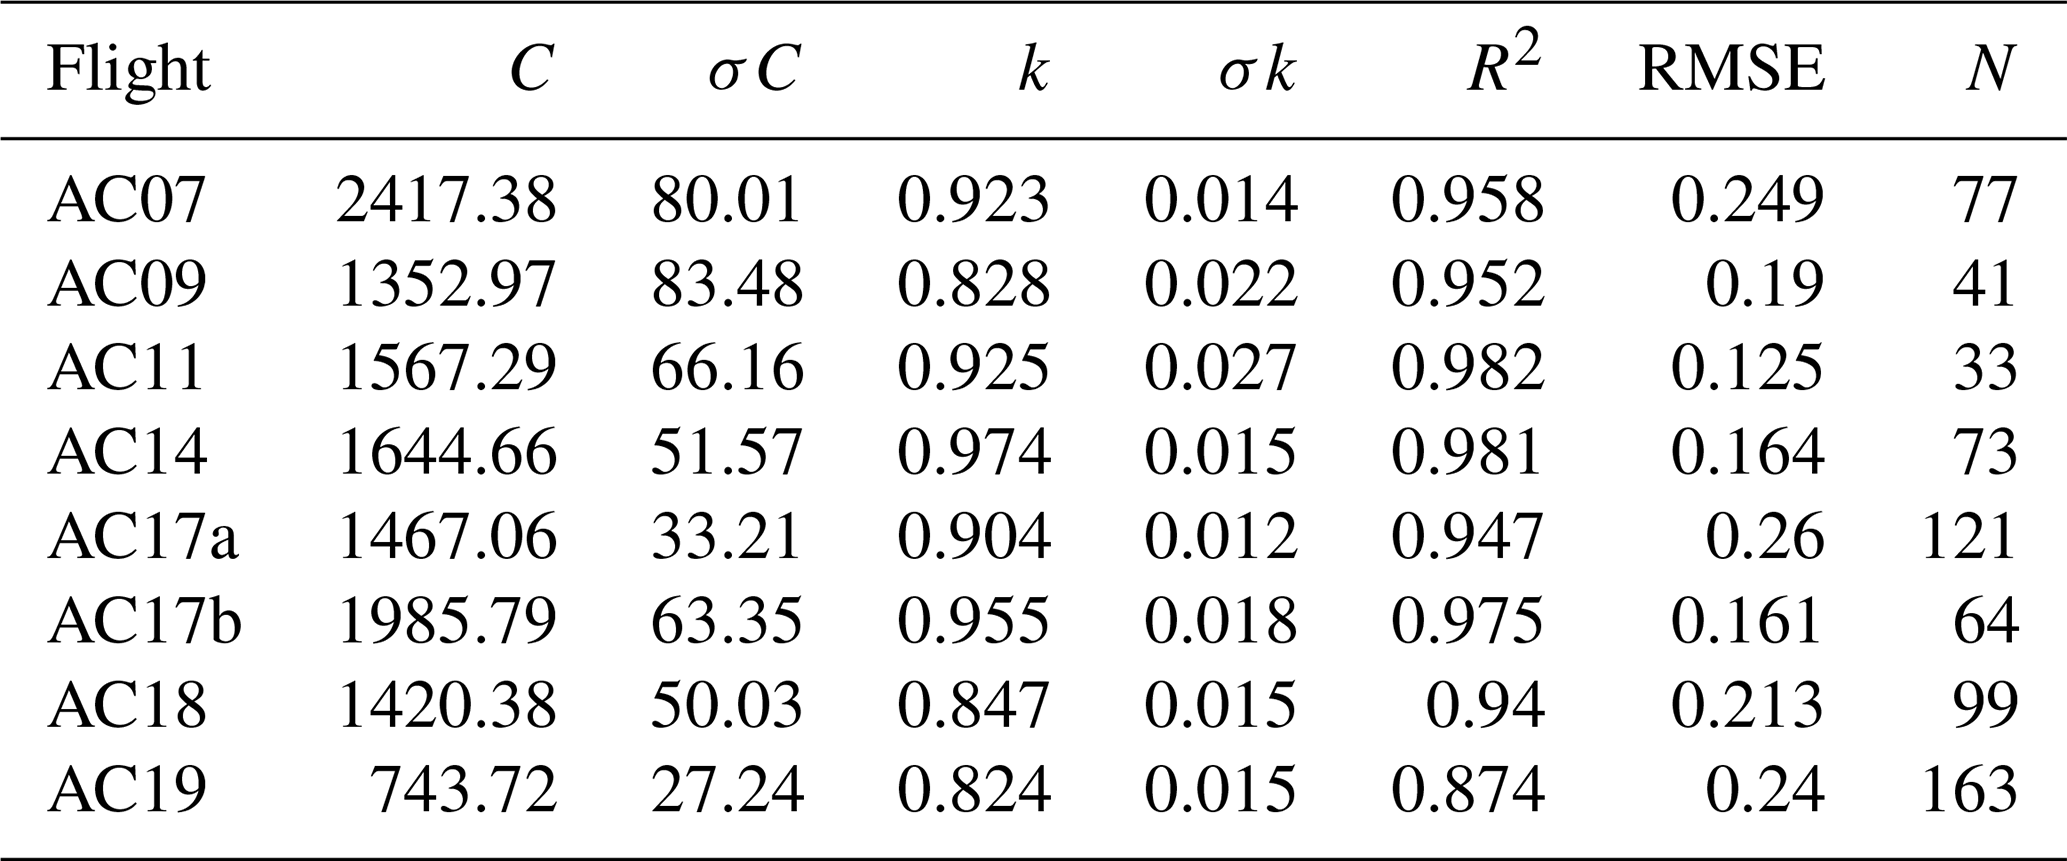
Table 4Similar to Table 3 for power-law fit parameters for the relationship derived from log–log regression. The uncertainties of Nd and Sl assumed in the calculations are 10 % and 9.2 %, respectively.

Table 5Similar to Table 3 for power-law fit parameters for the relationship derived from log–log regression. The uncertainties of Nd and Sc assumed in the calculations are 10 % and 9.5 %, respectively.
The Nd(Sv) spectra calculated from the energetic budget analysis at cloud base are comparable to the NCCN(Sv) spectra observed near the surface level over marine regions and the Amazon Basin during the dry season (Khain and Pinsky, 2018; Pöhlker et al., 2016). Under clean marine conditions (flight AC19), the estimated Nd expected to activate at cloud base is about 740 cm−3 at Sv=1 %. The maximum estimated Sv derived from the measurements is 0.27 %, corresponding to an adiabatic cooling (ΔTc) of ∼0.4 °C resulting from the closure analysis. In contrast, measurements obtained under more polluted conditions over forested regions during flights AC09 and AC18 show Nd values roughly twice as large for the same Sv. The maximum estimated Sv values derived from measurements were 0.34 % (ΔTc=0.53 °C) and 0.44 % (ΔTc=0.71 °C) for flights AC09 and AC18, respectively. Even larger Nd (Sv=1 %) values are estimated for the data over the Central Amazon and the deforestation arc, where the droplet concentrations were more strongly influenced by emissions from urban activities and biomass burning. The largest estimated Sv value derived from the measurements (1.15 %) was calculated for flight leg AC17a corresponding to a ΔTc of 1.81 °C.
The cloud properties observed under CCN-limited regimes were generally associated with regions of weaker buoyant forcing, resulting in lower LWC and weaker w, with maximum values (Fig. S19 in the Supplement). In contrast, aerosol-rich environments were associated with stronger buoyant forcing and enhanced adiabatic cooling at cloud base, leading to larger LWC, higher Sv, and stronger w (up to ). Enhanced buoyant forcing also increased the variability of cloud-base measurements by strengthening fluctuations in the thermodynamic state of the cloud parcel (LWC, T, and p), which are the primary variables used in the energy budget and supersaturation calculations. However, the uncertainties in Sv do not scale directly with buoyant forcing itself, but rather with the uncertainty in these thermodynamic and microphysical measurements (see Sect. S2.2). Consequently, the largest observed Sv and w values were generally associated with larger cloud base LWC values, consistent with stronger adiabatic cooling and enhanced condensational growth.
4.3 Comparison of Nd(Sv) spectra vs. NCCN(Sv) spectra
The comparison of Nd(Sv) spectra vs. NCCN(Sv) spectra is performed for four flight segments in Central Amazon, AC11, AC14, AC17a, and AC17b. The Nd(Sv) spectra are interpreted as representative of the sub-cloud NCCN(Sv) population that was activated into cloud droplets after buoyant ascent to cloud base. During flights AC14 and AC17, the NCCN(Sv) measurements were performed about 700 m below cloud base altitude, while during flight AC11, they were performed about 1400 m below cloud base (Tables 1 and 2). Therefore, the comparison should be interpreted as a closure between nearby sub-cloud CCN populations and cloud base droplet activation rather than as a strict Lagrangian comparison of identical air parcels. This observational configuration is illustrated schematically in Fig. 1a.
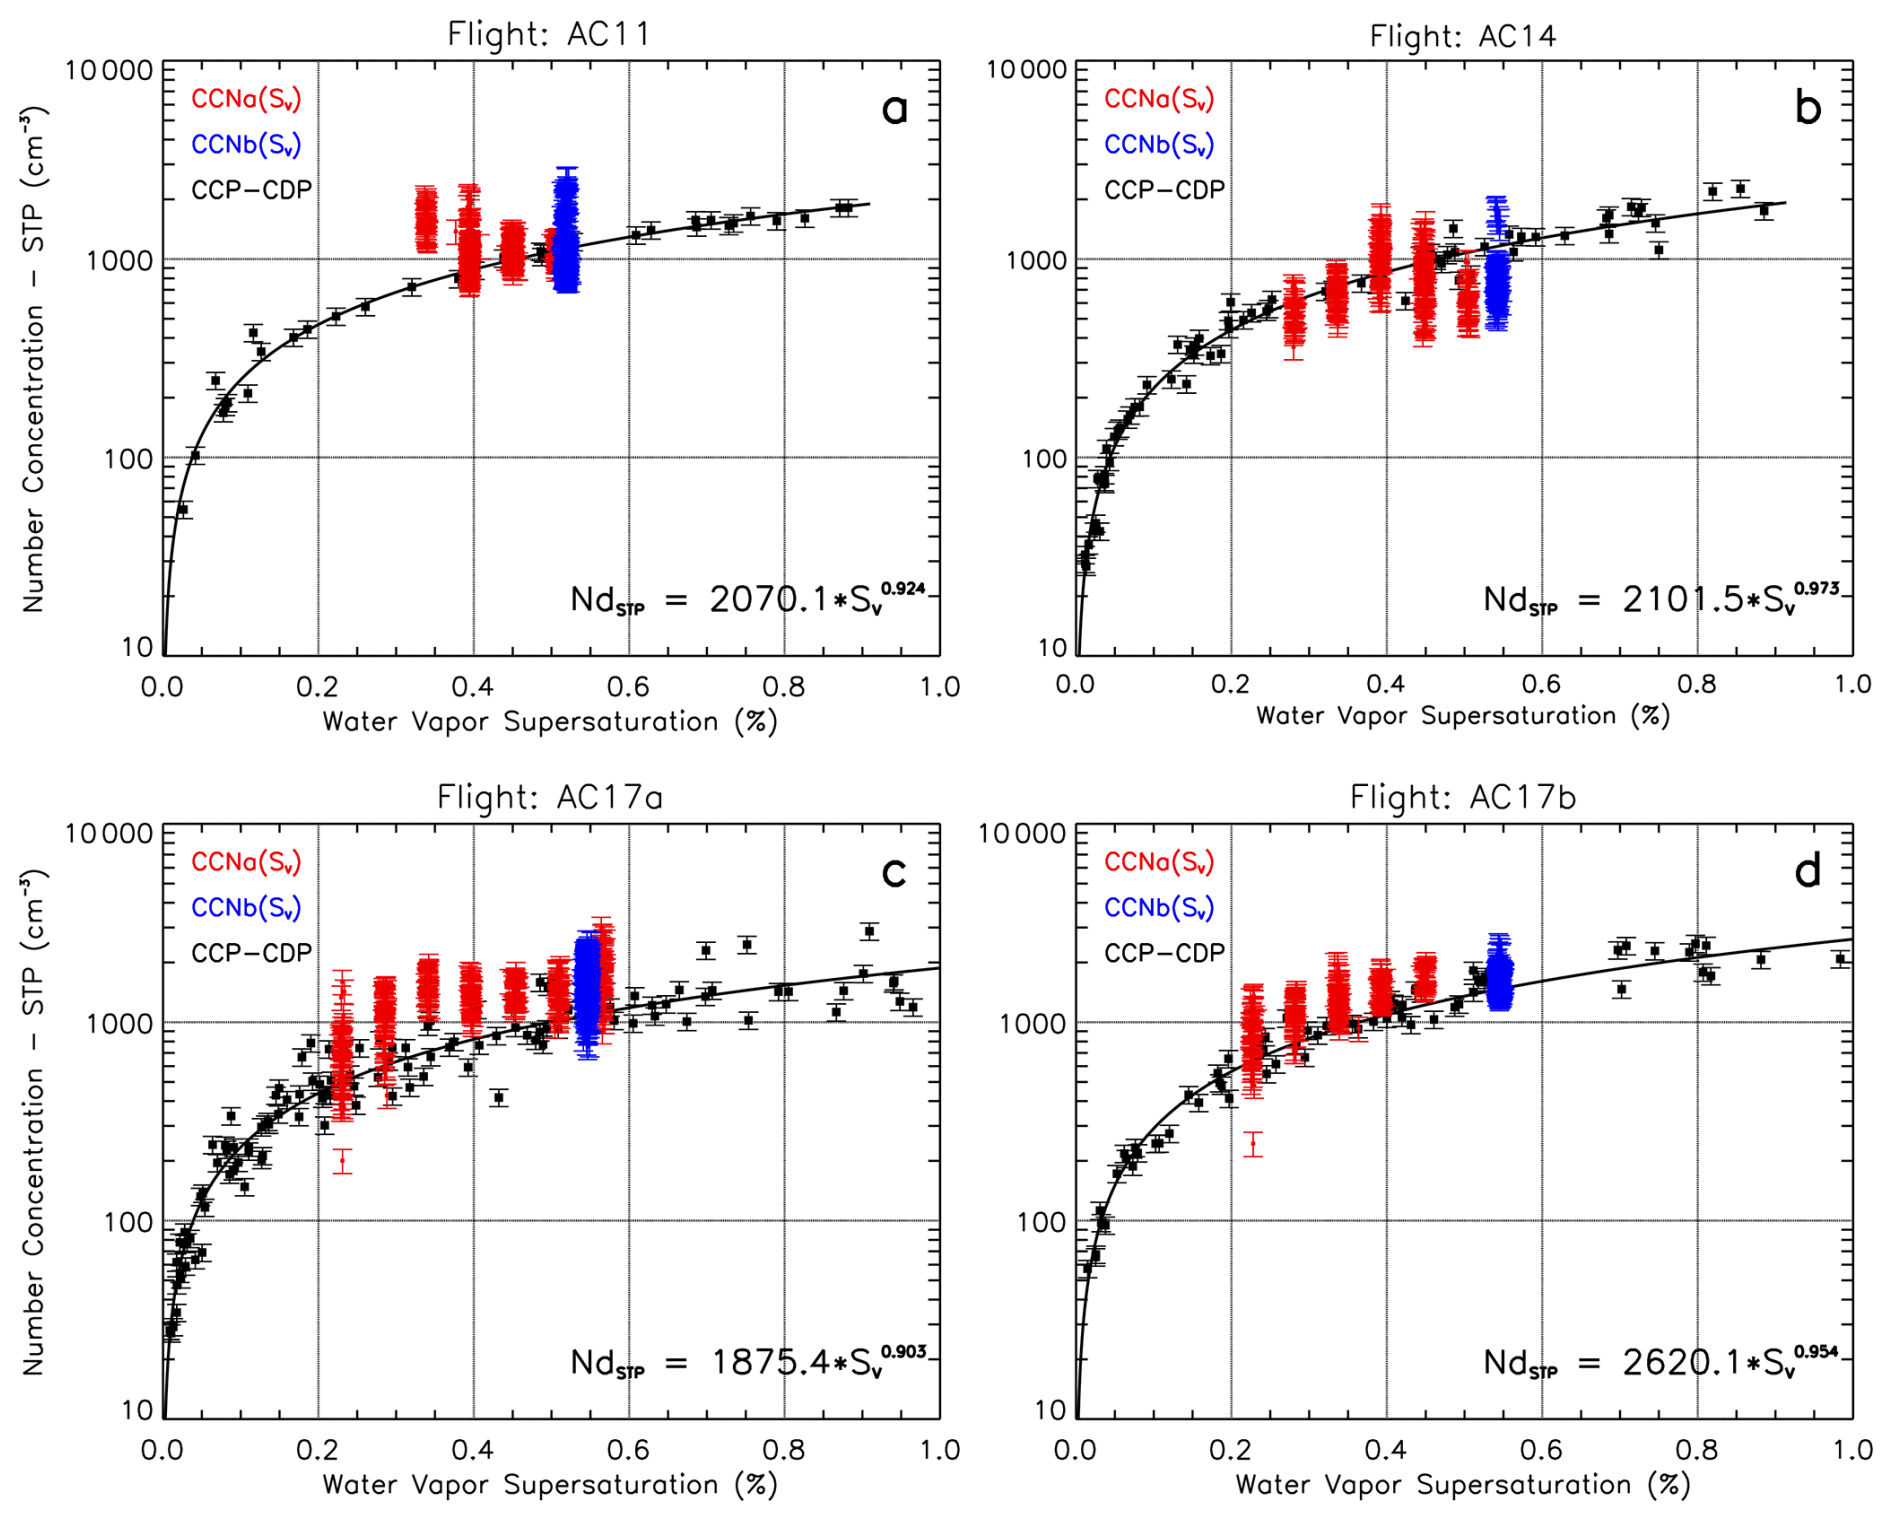
Figure 6(a) Sv vs. Nd measured at cloud bases (black dots), and Sv vs. CCN concentrations measured below cloud bases (CCNa(Sv) in red and CCNb(Sv) in blue) during Flight AC11. Nd and CCN concentrations are calculated at standard temperature (0 °C) and pressure (1013.25 hPa) (STP). Solid curves correspond to power-law fits of the form . (b–d) similar data from flight legs AC14, AC17a, and AC17b, respectively. Error bars indicate the estimated uncertainties of Nd and CCN concentrations (10 %). Uncertainties of Sv from CCN counters (14 %) and theoretically derived (∼12.6 %) are not shown for clarity.
Figure 6 shows NCCN(Sv) spectra measured with CCNa for Sv ranging from ∼0.2 % to ∼0.55 % (red marks), while NCCN(Sv) from CCNb was measured with a fixed Sv at ∼0.55 % (blue marks). The corresponding Nd(Sv) spectra and the power-law fit parameters for each flight segment are shown in black. The fixed-Sv measurements from CCNb illustrate the variability of sub-cloud CCN concentrations for each flight segment. For segments AC11, AC14 and AC17a, the differences between minimum and maximum NCCN(Sv) exceeded 1300 cm−3, whereas during AC17b this range remained below 700 cm−3. The large variability in NCCN(Sv) is associated with heterogeneous air masses influenced by pollution plumes from biomass-burning and urban emissions. Under these conditions, the typical monotonic increase of NCCN(Sv) with increasing Sv is not consistently observed in the CCNa measurements. This effect of pollution plumes in CCNa measurements is clearly shown in the figure where larger concentrations were measured for smaller Sv. In the flight segment AC17b, where a smaller variability of NCCN(Sv) is observed in the CCNb sampling, NCCN(Sv) measurements from CCNa are more consistent with those observed in homogenous air masses.
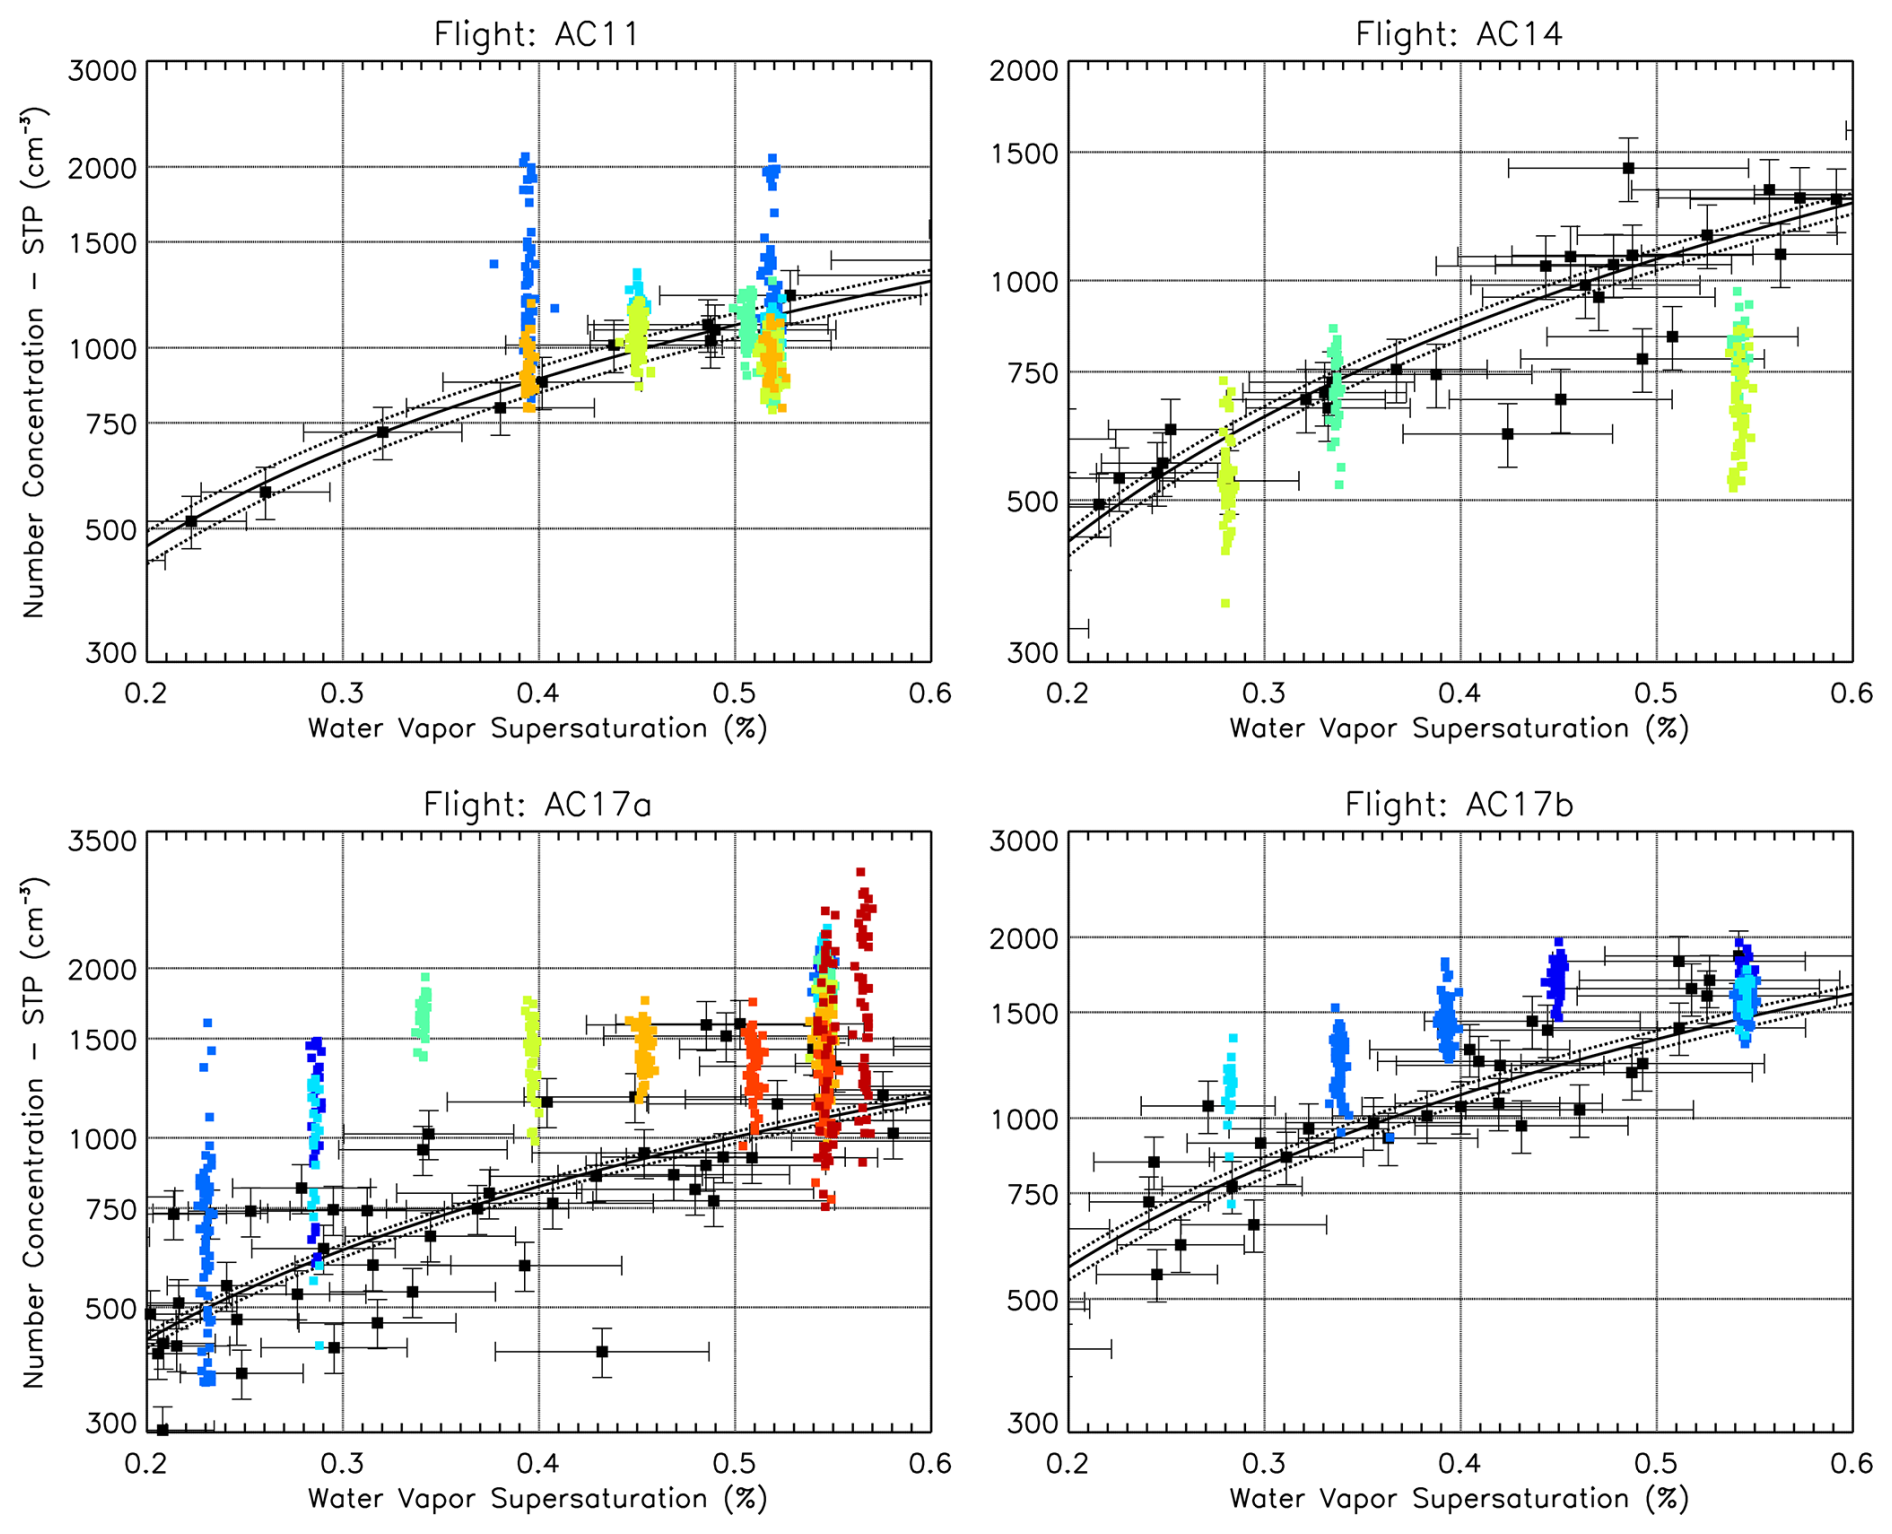
Figure 7Relationship between cloud-base Nd(Sv) spectra and sub-cloud NCCN(Sv) measurements at STP for flight segments AC11, AC14, AC17a, and AC17b over Central Amazon. Black symbols show the Nd(Sv) observations at cloud base with the corresponding power-law fits, while colored symbols represent NCCN(Sv) measurements from CCNa and CCNb. The colored measurements are grouped according to individual CCNa supersaturation cycles with fixed Sv. Only periods with simultaneous operation of both CCN counters and sampling durations longer than 20 s (∼1 km horizontal distance) are included. Error bars indicate the estimated uncertainties of Nd (10 %) and Sv (∼12.6 %). Uncertainties of Sv from CCN counters (14 %) and in CCN concentrations (10 %) are not shown for clarity.
Figure 7 shows the Nd(Sv) spectra and the NCCN(Sv) measurements for time intervals during which both CCNa and CCNb were operating and the sampling duration exceeded 20 s (∼1 km horizontal distance). The NCCN(Sv) measurements are displayed using the same color for each fixed-Sv cycle of the CCNa measurements. The measurements during Flight AC11 exhibit a clear influence of pollution plumes, with CCN concentrations reaching up to in both counters measuring in different Sv. Large concentration peaks are frequently observed in flight segment AC17a for a wide range of Sv measurements. Overall, most Nd(Sv) and NCCN(Sv) values remain within the combined uncertainty bounds, whereas the largest deviations are associated with variability in polluted air masses and with derived Nd(Sv) values from cloud passes more strongly affected by the entrainment and mixing of dry air. The spatial and temporal heterogeneity of the sampled air masses during AC11, AC14, and AC17a also contributes to deviations in the fitted relationships over specific supersaturation ranges (e.g., near Sv≈0.55 % during AC14). Additional discrepancies between Nd(Sv) and NCCN(Sv) concentrations may arise from differences in the particle diameter (d) detection ranges of the CCP-CDP probe (approximately 3–50 µm) and the CCN counters (activated droplets with d≳1 µm), since the CCN counters may detect activated particles that have not yet grown to the minimum detectable size of the CCP-CDP probe at cloud base.
The thermodynamic framework introduced in this study provides a diagnostic estimate of water vapor supersaturation (Sv) at the base of warm cumulus clouds by treating the transition between saturated-vapor to vapor–liquid states as adiabatic and reversible under a local quasi-isobaric approximation. Airborne observations over the Central Amazon reveal that Nd(Sv) spectra at cloud base agree within the uncertainty range of NCCN(Sv) spectra measured below cloud base, indicating that the water vapor pressure derived from the thermodynamic equations is physically consistent with that generated in CCN counters. In both cases, the water vapor pressure results from a thermal gradient under saturated conditions. In CCN counters, Sv is produced within a continuous-flow chamber by imposing controlled temperature gradients (warmer downstream) along wet walls. These gradients promote differential diffusion of water vapor and heat, leading to an enhanced water vapor pressure along the flow axis that exceeds saturation at the local air temperature. In the proposed diagnostic framework, Sv inferred from cloud base in-situ measurements represents the vapor-phase contribution to cloud supersaturation resulting from adiabatic cooling and is associated with the fraction of the latent energy partitioned into water-vapor expansion work (Ws) during the condensational growth.
The calculated Nd(Sv) spectra at cloud base in different thermodynamic and aerosol conditions over the Amazon Basin and Atlantic Ocean have shown a typical variability expected at ground-based NCCN(Sv) spectra measured in clean and polluted conditions (Khain and Pinsky, 2018; Pöhlker et al., 2016). However, the methodology relies on several idealized assumptions – thermodynamic reversibility, negligible entrainment (adiabaticity), and accurate in situ microphysical and thermodynamic measurements – that may not fully capture the complexity of heterogeneous and highly turbulent cloud bases. Despite these assumptions, the diagnostic methodology adds new insights for the modeling of cloud base supersaturation and energetics, offering a physically consistent constraint on droplet activation and condensational growth. Under the assumption of conserved isobaric enthalpy at cloud base, the energy budget and cloud supersaturation components of the saturated parcel can be estimated from the temperature change during adiabatic cooling or, equivalently, from in situ measurements of liquid water content, which constrain the sensible enthalpy change associated with the conversion of water vapor into liquid water. Within the proposed framework, neglecting the energetic cost of water vapor expansion assigns a larger fraction of the available energy to vapor-to-liquid conversion. This suggests a possible tendency to overestimate condensate production, latent heating, buoyancy and associated updraft velocities in simplified parcel calculations that do not explicitly account for this energetic partition.
Future studies applying energetic budget analyses to in situ measurements may extend this framework to estimate Sv at cloud base in other regions of the globe characterized by different aerosol and thermodynamic conditions. The method described in this manuscript is especially relevant when NCCN(Sv) measurements are unavailable. Furthermore, the thermodynamic evolution of cloudy parcels can be investigated within the context of the energetic budget to infer Sv from the vertical profiles of air temperature and dew-point temperature, with the parcel evolution physically interpreted in terms of dry- and cloud-adiabatic cooling. Such extensions would enable a more comprehensive quantification of the coupled microphysical and energetic responses of clouds under diverse atmospheric conditions, including aerosol-cloud interactions, condensational droplet growth and evaporation.
The derivation of Eq. (1) can be found in cloud physics textbooks such as Rogers and Yau (1989) and Khain and Pinsky (2018), which describe the supersaturation tendency equation over water for an adiabatically ascending air parcel under the assumption of small water vapor supersaturation ():
Where, A1 and A2 are given by:
The equations are derived from the thermodynamic equations governing temperature, water vapor mixing ratio, and the Clausius–Clapeyron relation. The coefficient A1 represents the production of supersaturation during adiabatic parcel ascent, resulting from the differential changes in vapor pressure and saturation vapor pressure during adiabatic expansion, whereas A2 represents the depletion of supersaturation during condensation; its first term accounts for the direct removal of water vapor, while its second term accounts for the increase in saturation vapor pressure caused by latent heat release. The derivation of A1 is resulting from differentiating Sv, in the form , assuming parcel ascent with no condensation. The derivation of A2 follows the same general framework but additionally accounts for the effects of condensation through vapor depletion and latent heat release (Rogers and Yau, 1989).
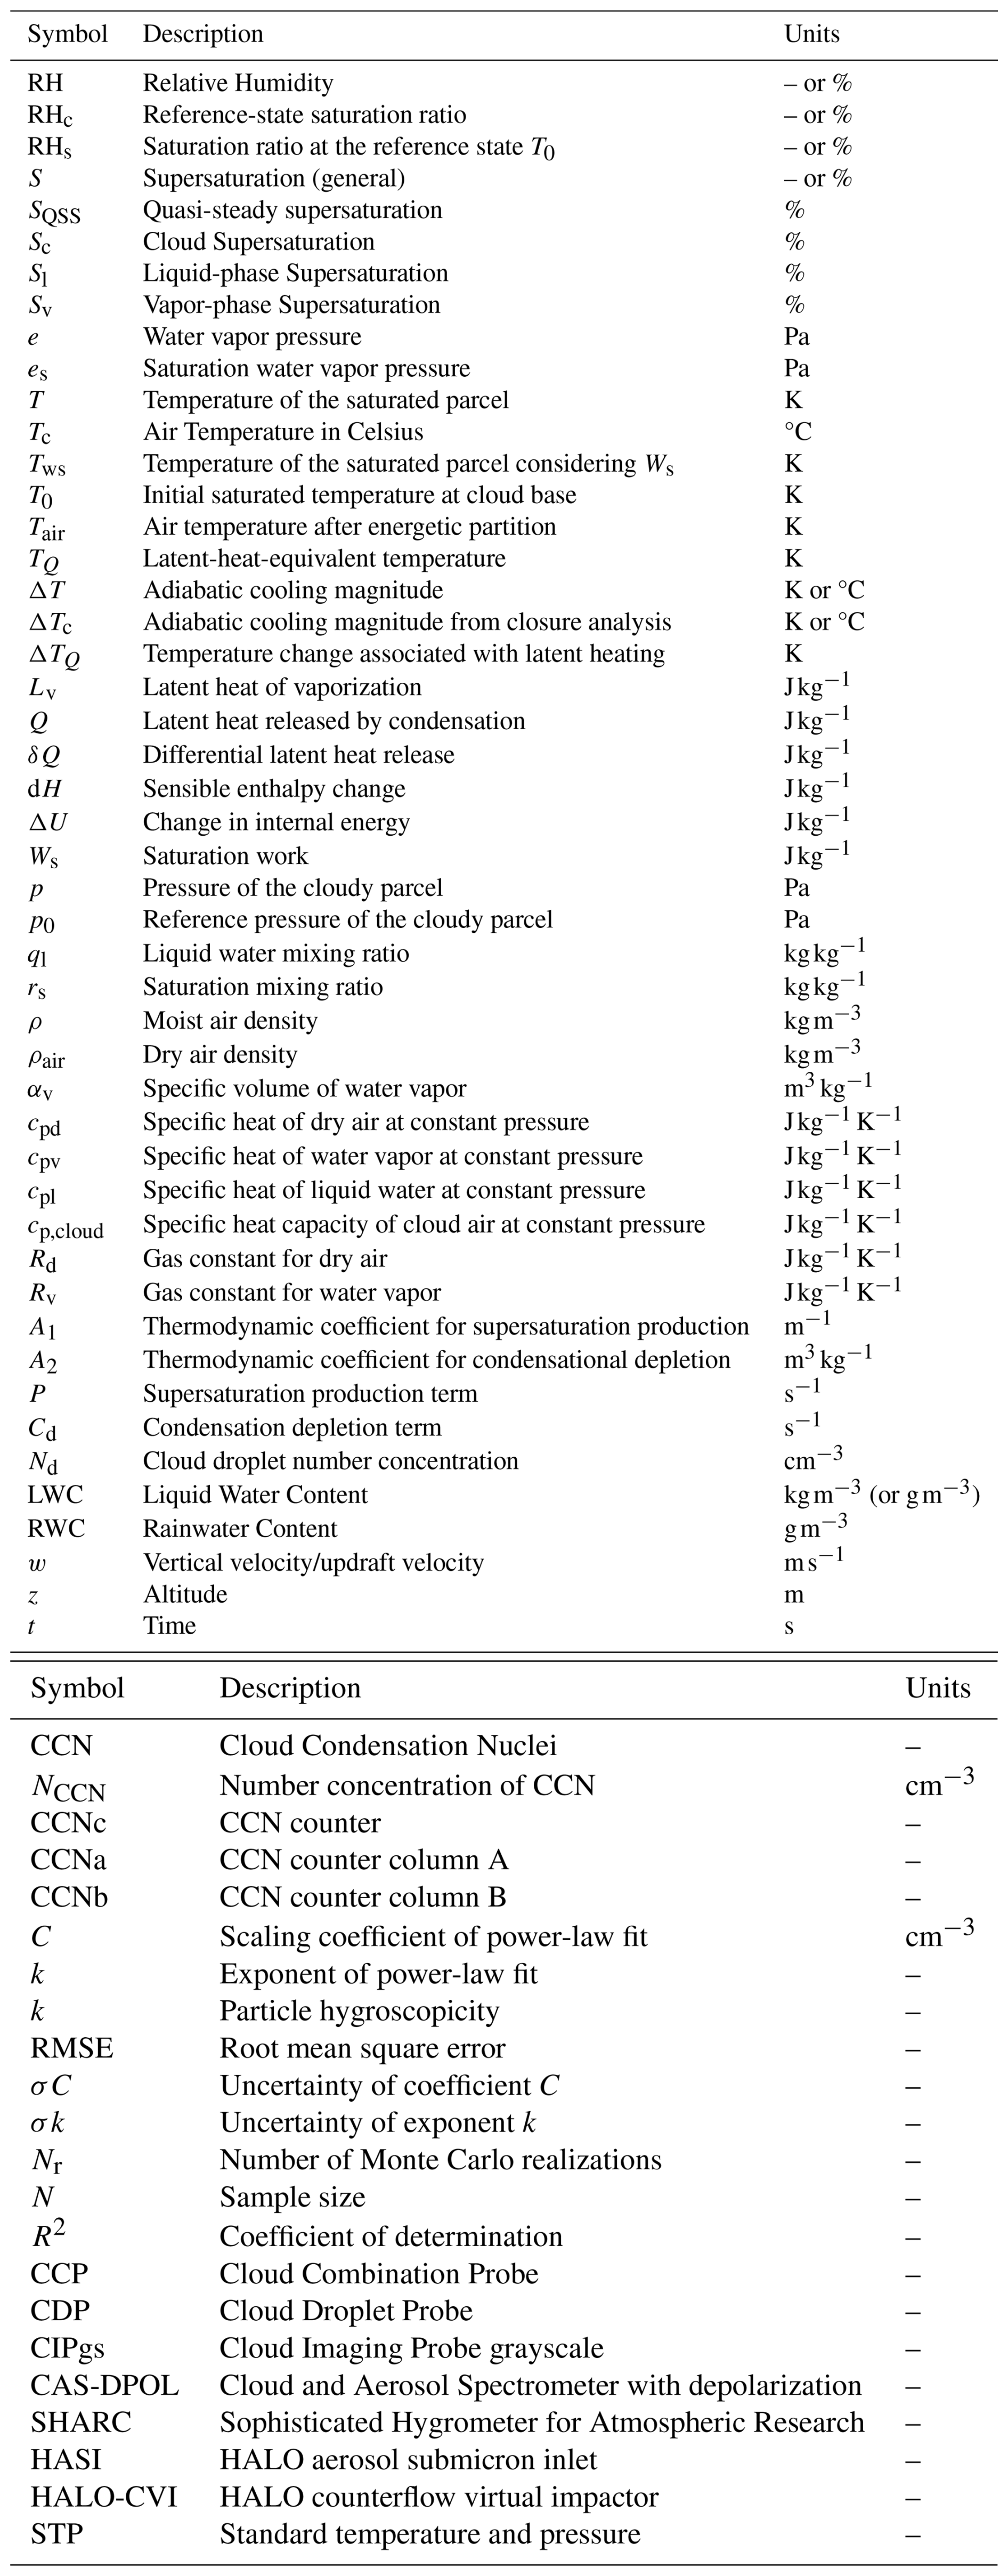
Table A1List of symbols, variables, and physical constants used in this study. Thermodynamic variables are expressed as specific quantities per unit mass of dry air. Uppercase notation is retained for consistency with the energetic framework. The corresponding extensive quantities are obtained by multiplying by the mass of dry air.
The ACRIDICON-CHUVA HALO aircraft data are available from the HALO database: https://halo-db.pa.op.dlr.de/mission/5 (last access: 16 October 2026). Derived quantities used in this analysis are available from the corresponding author upon reasonable request.
The supplement related to this article is available online at https://doi.org/10.5194/acp-26-14769-2026-supplement.
Conceptualization: RCB. Formal analysis: RCB. Methodology: RCB. Investigation: RCB. Visualization: RCB, RA. Supervision: DH. Writing – original draft: RCB, DH. Writing – review and editing: RCB, DH, MW and RA.
At least one of the (co-)authors is a member of the editorial board of Atmospheric Chemistry and Physics. The peer-review process was guided by an independent editor, and the authors also have no other competing interests to declare.
Publisher's note: Copernicus Publications remains neutral with regard to jurisdictional claims made in the text, published maps, institutional affiliations, or any other geographical representation in this paper. The authors bear the ultimate responsibility for providing appropriate place names. Views expressed in the text are those of the authors and do not necessarily reflect the views of the publisher.
We thank the Reef Restoration and Adaptation Program (RRAP) and Southern Cross University. We are further grateful for funding of project grant no. 316646266 by the Deutsche Forschungsgemeinschaft (DFG, German Research Foundation) within the framework of Priority Programme SPP 1294 to promote research with HALO. We acknowledge FAPESP (São Paulo Research Foundation) projects 2009/15235-8, 2014/08615-7, 2022/13257-9, 2023/04358-9 and 2025/10608-3.
This research was supported by the Great Barrier Reef Foundation through the Reef Restoration and Adaptation Program (RRAP), grant no. RRAP Cooling and Shading Sub-Program, and by the Advanced Research + Invention Agency (ARIA) under grant no. FPCW-PR01-P014.
This paper was edited by Greg McFarquhar and reviewed by four anonymous referees.
Baumgardner, D., Abel, S. J., Axisa, D., Cotton, R., Crosier, J., Field, P., Gurganus, C., Heymsfield, A., Korolev, A., Krämer, M., Lawson, P., McFarquhar, G., Ulanowski, Z., and Um, J.: Cloud Ice Properties: In Situ Measurement Challenges, Meteor. Mon., 58, https://doi.org/10.1175/amsmonographs-d-16-0011.1, 2017.
Bolton, D.: The computation of equivalent potential temperature, Mon. Weather Rev., 108, https://doi.org/10.1175/1520-0493(1980)108<1046:TCOEPT>2.0.CO;2, 1980.
Braga, R. C., Rosenfeld, D., Weigel, R., Jurkat, T., Andreae, M. O., Wendisch, M., Pöhlker, M. L., Klimach, T., Pöschl, U., Pöhlker, C., Voigt, C., Mahnke, C., Borrmann, S., Albrecht, R. I., Molleker, S., Vila, D. A., Machado, L. A. T., and Artaxo, P.: Comparing parameterized versus measured microphysical properties of tropical convective cloud bases during the ACRIDICON–CHUVA campaign, Atmos. Chem. Phys., 17, 7365–7386, https://doi.org/10.5194/acp-17-7365-2017, 2017a.
Braga, R. C., Rosenfeld, D., Weigel, R., Jurkat, T., Andreae, M. O., Wendisch, M., Pöschl, U., Voigt, C., Mahnke, C., Borrmann, S., Albrecht, R. I., Molleker, S., Vila, D. A., Machado, L. A. T., and Grulich, L.: Further evidence for CCN aerosol concentrations determining the height of warm rain and ice initiation in convective clouds over the Amazon basin, Atmos. Chem. Phys., 17, 14433–14456, https://doi.org/10.5194/acp-17-14433-2017, 2017b.
Braga, R. C., Ervens, B., Rosenfeld, D., Andreae, M. O., Förster, J.-D., Fütterer, D., Hernández Pardo, L., Holanda, B. A., Jurkat-Witschas, T., Krüger, O. O., Lauer, O., Machado, L. A. T., Pöhlker, C., Sauer, D., Voigt, C., Walser, A., Wendisch, M., Pöschl, U., and Pöhlker, M. L.: Cloud droplet formation at the base of tropical convective clouds: closure between modeling and measurement results of ACRIDICON–CHUVA, Atmos. Chem. Phys., 21, 17513–17528, https://doi.org/10.5194/acp-21-17513-2021, 2021a.
Braga, R. C., Rosenfeld, D., Krüger, O. O., Ervens, B., Holanda, B. A., Wendisch, M., Krisna, T., Pöschl, U., Andreae, M. O., Voigt, C., and Pöhlker, M. L.: Linear relationship between effective radius and precipitation water content near the top of convective clouds: measurement results from ACRIDICON–CHUVA campaign, Atmos. Chem. Phys., 21, 14079–14088, https://doi.org/10.5194/acp-21-14079-2021, 2021b.
Ervens, B., Cubison, M. J., Andrews, E., Feingold, G., Ogren, J. A., Jimenez, J. L., Quinn, P. K., Bates, T. S., Wang, J., Zhang, Q., Coe, H., Flynn, M., and Allan, J. D.: CCN predictions using simplified assumptions of organic aerosol composition and mixing state: a synthesis from six different locations, Atmos. Chem. Phys., 10, 4795–4807, https://doi.org/10.5194/acp-10-4795-2010, 2010.
Faber, S., French, J. R., and Jackson, R.: Laboratory and in-flight evaluation of measurement uncertainties from a commercial Cloud Droplet Probe (CDP), Atmos. Meas. Tech., 11, 3645–3659, https://doi.org/10.5194/amt-11-3645-2018, 2018.
Feingold, G. and Heymsfield, A. J.: Parameterizations of condensational growth of droplets for use in general circulation models, J. Atmos. Sci., 49, 2325–2342, https://doi.org/10.1175/1520-0469(1992)049<2325:POCGOD>2.0.CO;2, 1992.
Ghan, S. J., Abdul-Razzak, H., Nenes, A., Ming, Y., Liu, X., Ovchinnikov, M., Shipway, B., Meskhidze, N., Xu, J., and Shi, X.: Droplet nucleation: Physically-based parameterizations and comparative evaluation, J. Adv. Model. Earth Sy., 3, https://doi.org/10.1029/2011ms000074, 2011.
Joint Committee for Guides in Metrology: Evaluation of measurement data – Supplement 1 to the “Guide to the expression of uncertainty in measurement” – Propagation of distributions using a Monte Carlo method, Evaluation, JCGM, 101, https://doi.org/10.59161/JCGM101-2008, 2008.
Kaufmann, S., Voigt, C., Heller, R., Jurkat-Witschas, T., Krämer, M., Rolf, C., Zöger, M., Giez, A., Buchholz, B., Ebert, V., Thornberry, T., and Schumann, U.: Intercomparison of midlatitude tropospheric and lower-stratospheric water vapor measurements and comparison to ECMWF humidity data, Atmos. Chem. Phys., 18, 16729–16745, https://doi.org/10.5194/acp-18-16729-2018, 2018.
Khain, A. P. and Pinsky, M.: Warm microphysical processes, in: Physical Processes in Clouds and Cloud Modeling, Chap. 5, Cambridge University Press, Cambridge, UK, 151–343, https://doi.org/10.1017/9781139049481.006, 2018.
Khain, A. P., Beheng, K. D., Heymsfield, A., Korolev, A., Krichak, S. O., Levin, Z., Pinsky, M., Phillips, V., Prabhakaran, T., Teller, A., van den Heever, S. C., and Yano, J. I.: Representation of microphysical processes in cloud-resolving models: Spectral (bin) microphysics versus bulk parameterization, Rev. Geophys., 53, 247–322, https://doi.org/10.1002/2014RG000468, 2015.
Kleinheins, J., Shardt, N., Lohmann, U., and Marcolli, C.: The surface tension and cloud condensation nuclei (CCN) activation of sea spray aerosol particles, Atmos. Chem. Phys., 25, 881–903, https://doi.org/10.5194/acp-25-881-2025, 2025.
Köhler, H.: The nucleus in and the growth of hygroscopic droplets, T. Faraday Soc., 32, 1152–1161, 1936.
Konwar, M., Maheskumar, R. S., Kulkarni, J. R., Freud, E., Goswami, B. N., and Rosenfeld, D.: Aerosol control on depth of warm rain in convective clouds, J. Geophys. Res.-Atmos., 117, 1–10, https://doi.org/10.1029/2012JD017585, 2012.
Korolev, A. V. and Mazin, I. P.: Supersaturation of Water Vapor in Clouds, J. Atmos. Sci., 60, 2957–2974, https://doi.org/10.1175/1520-0469(2003)060<2957:SOWVIC>2.0.CO;2, 2003.
Kulkarni, G., Mei, F., Shilling, J. E., Wang, J., Reveggino, R. P., Flynn, C., Zelenyuk, A., and Fast, J.: Cloud Condensation Nuclei Closure Study Using Airborne Measurements Over the Southern Great Plains, J. Geophys. Res.-Atmos., 128, https://doi.org/10.1029/2022JD037964, 2023.
Lance, S., Brock, C. A., Rogers, D., and Gordon, J. A.: Water droplet calibration of the Cloud Droplet Probe (CDP) and in-flight performance in liquid, ice and mixed-phase clouds during ARCPAC, Atmos. Meas. Tech., 3, 1683–1706, https://doi.org/10.5194/amt-3-1683-2010, 2010.
Lance, S.: Coincidence errors in a cloud droplet probe (CDP) and a cloud and aerosol spectrometer (CAS), and the improved performance of a modified CDP, J. Atmos. Ocean. Tech., 29, 1532–1541, https://doi.org/10.1175/JTECH-D-11-00208.1, 2012.
Mallaun, C., Giez, A., and Baumann, R.: Calibration of 3-D wind measurements on a single-engine research aircraft, Atmos. Meas. Tech., 8, 3177–3196, https://doi.org/10.5194/amt-8-3177-2015, 2015.
Masson-Delmotte, V., Zhai, P., Pirani, A., Connors, S. L., Péan, C., Berger, S., Caud, N., Chen, Y., Goldfarb, L., Gomis, M. I., Huang, M., Leitzell, K., Lonnoy, E., Matthews, J. B. R., Maycock, T. K., Waterfield, T., Yelekçi, O., Yu, R., and Zhou, B. (Eds.): IPCC 2021: Climate Change 2021: The Physical Science Basis, Contribution of Working Group I to the Sixth Assessment Report of the Intergovernmental Panel on Climate Change, Cambridge University Press, Cambridge, UK, and New York, NY, USA, https://doi.org/10.1017/9781009157896, 2021.
Namdari, S., Dmitrovic, S., Chen, G., Choi, Y., Crosbie, E., DiGangi, J. P., Diskin, G. S., Ferrare, R. A., Hair, J. W., Kirschler, S., Nowak, J. B., Thornhill, K. L., Voigt, C., Vömel, H., Zeng, X., and Sorooshian, A.: Intercomparison of wind speed, temperature, and humidity data between dropsondes and aircraft in situ measurements, Atmos. Meas. Tech., 18, 4325–4345, https://doi.org/10.5194/amt-18-4325-2025, 2025.
Petters, M. D. and Kreidenweis, S. M.: A single parameter representation of hygroscopic growth and cloud condensation nucleus activity, Atmos. Chem. Phys., 7, 1961–1971, https://doi.org/10.5194/acp-7-1961-2007, 2007.
Pinsky, M., Khain, A., Mazin, I., and Korolev, A.: Analytical estimation of droplet concentration at cloud base, J. Geophys. Res.-Atmos., 117, 1–14, https://doi.org/10.1029/2012JD017753, 2012.
Pöhlker, M. L., Pöhlker, C., Ditas, F., Klimach, T., Hrabe de Angelis, I., Araújo, A., Brito, J., Carbone, S., Cheng, Y., Chi, X., Ditz, R., Gunthe, S. S., Kesselmeier, J., Könemann, T., Lavrič, J. V., Martin, S. T., Mikhailov, E., Moran-Zuloaga, D., Rose, D., Saturno, J., Su, H., Thalman, R., Walter, D., Wang, J., Wolff, S., Barbosa, H. M. J., Artaxo, P., Andreae, M. O., and Pöschl, U.: Long-term observations of cloud condensation nuclei in the Amazon rain forest – Part 1: Aerosol size distribution, hygroscopicity, and new model parametrizations for CCN prediction, Atmos. Chem. Phys., 16, 15709–15740, https://doi.org/10.5194/acp-16-15709-2016, 2016.
Pöhlker, M. L., Zhang, M., Campos Braga, R., Krüger, O. O., Pöschl, U., and Ervens, B.: Aitken mode particles as CCN in aerosol- and updraft-sensitive regimes of cloud droplet formation, Atmos. Chem. Phys., 21, 11723–11740, https://doi.org/10.5194/acp-21-11723-2021, 2021.
Reutter, P., Su, H., Trentmann, J., Simmel, M., Rose, D., Gunthe, S. S., Wernli, H., Andreae, M. O., and Pöschl, U.: Aerosol- and updraft-limited regimes of cloud droplet formation: influence of particle number, size and hygroscopicity on the activation of cloud condensation nuclei (CCN), Atmos. Chem. Phys., 9, 7067–7080, https://doi.org/10.5194/acp-9-7067-2009, 2009.
Rissler, J., Swietlicki, E., Zhou, J., Roberts, G., Andreae, M. O., Gatti, L. V., and Artaxo, P.: Physical properties of the sub-micrometer aerosol over the Amazon rain forest during the wet-to-dry season transition – comparison of modeled and measured CCN concentrations, Atmos. Chem. Phys., 4, 2119–2143, https://doi.org/10.5194/acp-4-2119-2004, 2004.
Roberts, G. C. and Nenes, a.: A Continuous-Flow Streamwise Thermal-Gradient CCN Chamber for Atmospheric Measurements, Aerosol Sci. Tech., 39, 206–221, https://doi.org/10.1080/027868290913988, 2005.
Rogers, R. R. and Yau, M. K.: A short course of cloud physics, 3rd Edn., Library of Congress, Oxford, UK, ISBN 978-0-7506-3215-7, 1989.
Romps, D. M., Latimer, K., Zhu, Q., Jurkat-Witschas, T., Mahnke, C., Prabhakaran, T., Weigel, R., and Wendisch, M.: Air pollution unable to intensify storms via warm-phase invigoration, Geophys. Res. Lett., 50, e2022GL100409, https://doi.org/10.1029/2022GL100409, 2023.
Romps, D. M.: A method for calculating reliable supersaturation reveals low values in tropical rainy-season clouds, J. Atmos. Sci., 82, 1517–1527, https://doi.org/10.1175/JAS-D-24-0265.1, 2025.
Rose, D., Gunthe, S. S., Mikhailov, E., Frank, G. P., Dusek, U., Andreae, M. O., and Pöschl, U.: Calibration and measurement uncertainties of a continuous-flow cloud condensation nuclei counter (DMT-CCNC): CCN activation of ammonium sulfate and sodium chloride aerosol particles in theory and experiment, Atmos. Chem. Phys., 8, 1153–1179, https://doi.org/10.5194/acp-8-1153-2008, 2008.
Rosenfeld, D., Liu, G., Yu, X., Zhu, Y., Dai, J., Xu, X., and Yue, Z.: High-resolution (375 m) cloud microstructure as seen from the NPP/VIIRS satellite imager, Atmos. Chem. Phys., 14, 2479–2496, https://doi.org/10.5194/acp-14-2479-2014, 2014.
Rosenfeld, D., Zheng, Y., Hashimshoni, E., Pöhlker, M. L., Jefferson, A., Pöhlker, C., Yu, X., Zhu, Y., Liu, G., Yue, Z., Fischman, B., Li, Z., Giguzin, D., Goren, T., Artaxo, P., Barbosa, H. M. J., Pöschl, U., and Andreae, M. O.: Satellite retrieval of cloud condensation nuclei concentrations by using clouds as CCN chambers, P. Natl. Acad. Sci. USA, 113, 5828–5834, https://doi.org/10.1073/pnas.1514044113, 2016.
Squires, P.: The growth of cloud drops by condensation. I. General characteristics, Aust. J. Chem., 5, https://doi.org/10.1071/CH9520059, 1952.
Stevens, B., Ament, F., Bony, S., Crewell, S., Ewald, F., Gross, S., Hansen, A., Hirsch, L., Jacob, M., Kölling, T., Konow, H., Mayer, B., Wendisch, M., Wirth, M., Wolf, K., Bakan, S., Bauer-Pfundstein, M., Brueck, M., Delanoë, J., Ehrlich, A., Farrell, D., Forde, M., Gödde, F., Grob, H., Hagen, M., Jäkel, E., Jansen, F., Klepp, C., Klingebiel, M., Mech, M., Peters, G., Rapp, M., Wing, A. A., and Zinner, T.: A high-altitude long-range aircraft configured as a cloud observatory: The NARVAL expeditions, B. Am. Meteorol. Soc., 100, 1061–1077, https://doi.org/10.1175/BAMS-D-18-0198.1, 2019.
Twomey, S.: The nuclei of natural cloud formation part II: The supersaturation in natural clouds and the variation of cloud droplet concentration, Geofisica Pura e Applicata, 43, 243–249, https://doi.org/10.1007/BF01993560, 1959.
Varghese, M. and Prabhakaran, T. V.: Reconciling observed and predicted droplet concentration at the Indian summer monsoon cloud base, Sci. Total Environ., 973, https://doi.org/10.1016/j.scitotenv.2025.179077, 2025.
Wang, J., Lee, Y.-N., Daum, P. H., Jayne, J., and Alexander, M. L.: Effects of aerosol organics on cloud condensation nucleus (CCN) concentration and first indirect aerosol effect, Atmos. Chem. Phys., 8, 6325–6339, https://doi.org/10.5194/acp-8-6325-2008, 2008.
Wendisch, M., Pöschl, U., Andreae, M. O., Machado, L. A. T., Albrecht, R., Schlager, H., Rosenfeld, D., Martin, S. T., Abdelmonem, A., Afchine, A., Araùjo, A., Artaxo, P., Aufmhoff, H., Barbosa, H. M. J., Borrmann, S., Braga, R., Buchholz, B., Cecchini, M. A., Costa, A., Curtius, J., Dollner, M., Dorf, M., Dreiling, V., Ebert, V., Ehrlich, A., Ewald, F., Fisch, G., Fix, A., Frank, F., Fütterer, D., Heckl, C., Heidelberg, F., Hüneke, T., Jäkel, E., Järvinen, E., Jurkat, T., Kanter, S., Kästner, U., Kenntner, M., Kesselmeier, J., Klimach, T., Knecht, M., Kohl, R., Kölling, T., Krämer, M., Krüger, M., Krisna, T. C., Lavric, J. V., Longo, K., Mahnke, C., Manzi, A. O., Mayer, B., Mertes, S., Minikin, A., Molleker, S., Münch, S., Nillius, B., Pfeilsticker, K., Pöhlker, C., Roiger, A., Rose, D., Rosenow, D., Sauer, D., Schnaiter, M., Schneider, J., Schulz, C., de Souza, R. A. F., Spanu, A., Stock, P., Vila, D., Voigt, C., Walser, A., Walter, D., Weigel, R., Weinzierl, B., Werner, F., Yamasoe, M. A., Ziereis, H., Zinner, T., and Zöger, M.: The ACRIDICON-CHUVA campaign: Studying tropical deep convective clouds and precipitation over Amazonia using the new German research aircraft HALO, B. Am. Meteorol. Soc., 160128144638003, https://doi.org/10.1175/BAMS-D-14-00255.1, 2016.
Zheng, Y. and Rosenfeld, D.: Linear relation between convective cloud base height and updrafts and application to satellite retrievals, Geophys. Res. Lett., 42, 6485–6491, https://doi.org/10.1002/2015GL064809, 2015.