
the Creative Commons Attribution 4.0 License.
the Creative Commons Attribution 4.0 License.
 | 05 Oct 2026
Synthesis of the tethered balloon system and other TRACER campaign measurements elucidates aerosol property profiles

Jian Wang
Israel Silber
Nurun Nahar Lata
Gregory W. Vandergrift
Sarah D. Brooks
Michael P. Jensen
Damao Zhang
Darielle Dexheimer
Beat Schmid
Zezhen Cheng
Swarup China
Coastal urban environments exhibit strong vertical and horizontal heterogeneity in aerosol properties, complicating process-level understanding of aerosol–cloud interactions. This study analyzes tethered balloon system (TBS) measurements from 149 flights during summer over the greater Houston, Texas, region as part of the Department of Energy (DOE) Atmospheric Radiation Measurement (ARM) Tracking Aerosol Convection interactions ExpeRiment (TRACER) campaign. We characterized the vertical structure of aerosol number concentrations, size distributions, and inferred cloud condensation nuclei (CCN) concentrations. Air mass history was classified using back-trajectory analysis and k-means clustering into three clusters: (1) marine-influenced, (2) mixed marine and urban emissions, and (3) urban/anthropogenic and long-range transported aerosols. CCN concentrations are estimated from observed size distributions using κ-Köhler theory. The resulting profiles show pronounced vertical variability across clusters, strongly modulated by boundary-layer depth and coastal circulations, leading to substantial variability in the aerosol population available for cloud activation. The marine cluster showed the lowest concentrations, with CCN at 0.8 % supersaturation below 1000 cm−3, while urban and mixed clusters displayed higher concentrations and more complex layering. Profiles influenced by the mixed marine–urban cluster frequently exhibit decoupling between near-surface aerosol and elevated layers, including enhanced accumulation-mode number aloft, consistent with prior TBS-based compositional studies. A 6–7 September 2022 case study demonstrates that mesoscale transport can simultaneously transform the thermodynamic environment and the aerosol population, highlighting the importance of constraining boundary-layer dynamics and airmass origins before attributing cloud changes to aerosol effects in complex coastal environments.
- Article
(4023 KB) - Full-text XML
-
Supplement
(4115 KB) - BibTeX
- EndNote


Atmospheric aerosols are tiny solid or liquid particles from both natural sources and human activities suspended in the atmosphere. These aerosols influence the Earth's system in multiple ways, and their direct radiative forcing can be positive (warming) or negative (cooling). For example, sulfate aerosols primarily scatter sunlight, leading to cooling, while black carbon aerosols absorb sunlight, causing warming (Huang et al., 2014; Ervens et al., 2011; Andreae et al., 2005). The net effect of aerosols on radiative forcing is complex and also depends on their properties and interactions with clouds (Fuzzi et al., 2015; Lohmann and Feichter, 1997; Lohmann and Hoose, 2009; Twomey, 1977). This dual role makes aerosols a significant factor in atmospheric process modeling and weather prediction, and has also stimulated an enormous number of research publications (Fuzzi et al., 2015). Acting as cloud condensation nuclei (CCN), atmospheric aerosols facilitate a critical process in cloud formation by catalyzing the condensation of water vapor into cloud droplets. The efficiency of this process depends on the size, composition, mixing state, and concentration of the aerosol particles (Rosenfeld et al., 2019, 2014; Schmale et al., 2017). Overall, aerosols play a crucial role in Earth's systems and significantly influence severe weather monitoring (Tsimpidi et al., 2025; Mushtaq et al., 2022).
Due to the complexity of aerosol properties and their roles in atmospheric processes, accurate vertical profiles of aerosols are essential for quantifying radiative forcing, assessing air quality and transport, and understanding aerosol–cloud interactions. Remote sensing techniques initially emerged as crucial solutions for measuring aerosol vertical distributions and have since become essential tools for applications across diverse geographic regions, facilitating advanced research and applications. Elastic-backscatter lidar inversions, pioneered by Klett and Fernald (Fernald, 1984; Klett, 1981), laid the foundation for aerosol profiling by retrieving range-dependent backscatter and extinction using an assumed lidar ratio. While computationally efficient and widely applied, these methods carry inherent uncertainties due to their dependence on external assumptions about the lidar ratio (Chen et al., 2025; Burton et al., 2012; Fernald, 1984; Klett, 1981). To address this limitation, Raman (inelastic) lidar significantly improved retrievals by utilizing Raman-shifted molecular returns to directly derive aerosol extinction and backscatter, eliminating the need for an assumed lidar ratio and enhancing profile accuracy (Ansmann et al., 2012; Ansmann and Müller, 2005). High-Spectral-Resolution Lidar (HSRL) further advanced profiling capabilities by separating molecular and aerosol scattering components, enabling precise direct retrievals of extinction, backscatter, and the lidar ratio. These advancements have established lidar approaches as critical tools in field campaigns and satellite validation efforts, underpinning a deeper understanding of aerosol vertical structure and its global impacts (Dmitrovic et al., 2024; Burton et al., 2012; Hair et al., 2008).
While remote sensing provides broader spatial coverage and long-term monitoring, airborne measurements can offer high-resolution in-situ data that comprehensively characterize vertical profiles of aerosol properties, including concentration, size, and chemical composition. Airborne platforms such as piloted aircraft, uncrewed aerial systems (UAS), and tethered balloon systems (TBS) play a critical role in accurately measuring aerosol vertical profiles, providing essential insights into their spatial distribution, composition, transport, and atmospheric processing (Mei et al., 2020; Chiliński et al., 2018; Geiß et al., 2017; Brady et al., 2016; Ferrero et al., 2016; Corrigan et al., 2008; Ramanathan et al., 2001; Anderson et al., 1996). Recently, studies like the Department of Energy (DOE) Atmosphere Radiation Measurement (ARM) TBS and UAS deployments (Mei et al., 2025a; Chen et al., 2025; Creamean et al., 2025, 2021) and the ACTIVATE (Aerosol Cloud meTeorology Interactions oVer the western ATlantic Experiment) aircraft campaigns (Ajayi et al., 2024) collectively advanced the state of atmospheric science by coupling airborne in situ measurements, remote sensing, and new platform innovations to more accurately profile aerosols with unprecedented vertical resolution, filling the gaps of ground-based data. Aircraft can access high altitudes and carry advanced sensors, making them ideal for extensive regional measurements and satellite validation, though they are costly and often limited to short-term campaigns. UAS are portable, cost-efficient, and well-suited for fine-scale aerosol profiling at low-to-mid altitudes, but their operational range, payload capacity, and sensitivity to weather conditions can restrict their applications. TBS can provide detailed profiles of lower atmospheric layers at specific altitudes and are affordable to deploy in challenging environments, but are spatially constrained to their tethered location and limited to low altitudes due to operational constraints. Together, these airborne platforms and remote sensing techniques provide a synergistic approach to understanding aerosol distribution, composition, transport processes, and climatic effects across varying spatial and temporal scales.
Given its scientific importance, integrating multi-platform observations collected at the same location and time – such as those from the Tracking Aerosol Convection interactions ExpeRiment (TRACER) – is highly desirable. TRACER was a U.S. DOE ARM field campaign in the Houston, Texas, coastal urban region during 2021–2022, with an intensive observing period in summer 2022 (Wang et al., 2025; Jensen et al., 2025; Chen et al., 2025; Rapp et al., 2024; Farley et al., 2024). It deployed the ARM Mobile Facility and the ARM TBS, both equipped with a comprehensive suite of in situ and remote sensors, to characterize aerosol properties, boundary-layer structure, and convective cloud evolution under the influence of the sea breeze and urban pollution. The campaign's main objective was to quantify how aerosol loading and composition modulate convective cloud initiation, microphysics, and precipitation, thereby providing process-level constraints for weather and Earth's system models; TRACER was also coordinated with partner efforts to enable source attribution and multi-scale evaluation of aerosol–cloud–precipitation interactions (Jensen et al., 2025; Rapp et al., 2024).
One of the primary objectives of this study is to derive high-resolution vertical aerosol profiles from TBS measurements, targeting the lower troposphere and the atmospheric layers up to the cloud base, where remote-sensing retrievals are most uncertain. Unlike aircraft, which can sample these altitudes but typically only intermittently and for limited durations, TBS platforms can provide sustained, high-frequency profiling at fixed locations, enabling more continuous characterization of aerosol structure in these critical regions. From these profiles, we will quantify vertical variability in aerosol number, size distribution, composition, CCN activity, and optical properties across altitudes and meteorological regimes. Using vertical profiles of aerosol properties, researchers can better constrain boundary-layer structure and entrainment by directly leveraging observed vertical variability. This study can potentially lead to further validation and refinement of ground-based and satellite remote sensing retrievals, improve data assimilation and model process parameterizations, and provide actionable constraints for both observations and models.
2.1 Field Campaigns Overview
Conducted from June through September 2022 in the Houston, Texas, region, the TRACER Intensive Observation Period (IOP) was timed to capture frequent warm-season convection generated by strong surface heating, abundant Gulf moisture, and sea-breeze circulations. Combined with Houston's urban and industrial emissions and the contrasting marine and rural air masses, these conditions provided an ideal setting for investigating aerosol–convective-cloud interactions across a wide range of aerosol loadings and meteorological conditions (Jensen et al., 2025). During the IOP months, the ARM TBS was deployed for the first 2 weeks of each month at an ancillary (ANC) site in Guy, Texas (29.33° N, 95.74° W), southwest of Houston. Concurrently with TBS flights, a co-located 3-channel RPG-G5 microwave radiometer provides time-series measurements of brightness temperature from three channels centered at 23.8, 30, and 89 GHz (Cadeddu et al., 2013), which are used to retrieve precipitable water vapor (PWV) and liquid water path (LWP) (Turner et al., 2007). This location was selected to represent a rural background with less influence from a mix of aerosol sources (such as fresh aerosol emissions from the metropolitan Houston area).
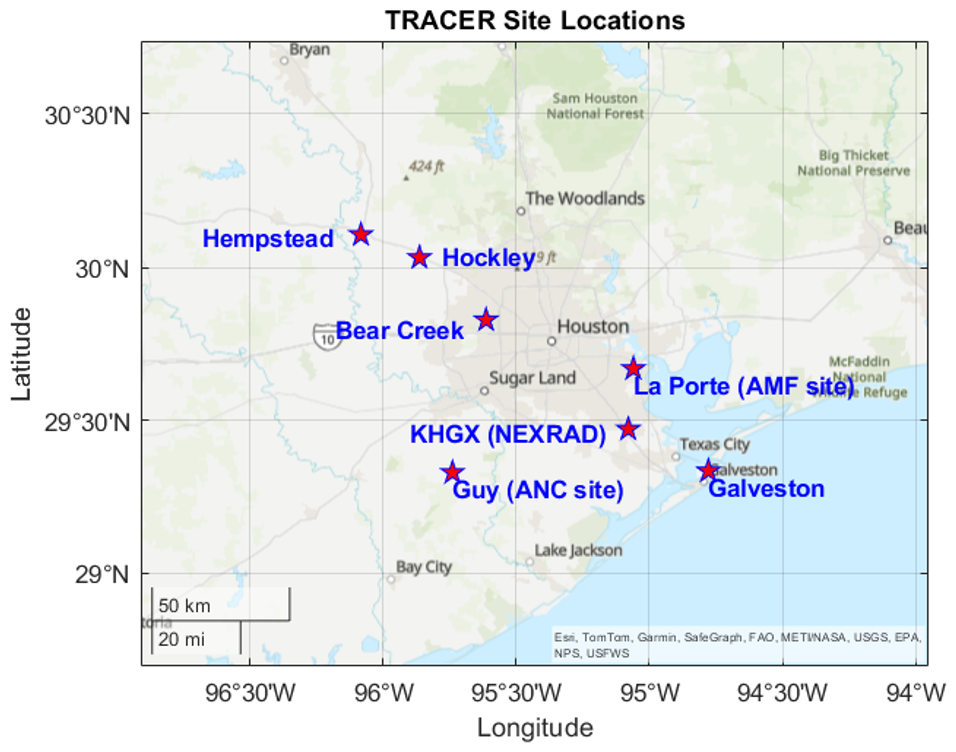
Figure 1Locations of Vertical Aerosol Observations during the TRACER IOP. Sources: Esri, TomTom, Garmin, SafeGraph, FAO, MET/NASA, USGS, EPA, NPS, USFWS | Powered by Esri.
Complementing the stationary measurements conducted by the ARM TBS team, the collaborating Texas A&M University (TAMU) team undertook mobile sampling of the sea breeze. Their sampling locations, illustrated in Fig. 1, typically originated on the coast in Galveston. From there, they followed the sea breeze inland, concluding at either the AMF site in La Porte or at one of several sites west and northwest of Houston (Bear Creek, Hockley, or Hempstead) (Thompson et al., 2025a). The specific transect routes are not shown because they varied among sampling days. Along this mapped corridor, TAMU mobile measurements frequently transitioned from marine boundary-layer air characterized by low particle concentration to continental air ahead of the sea-breeze front, which generally contained particles that were slightly more effective for cloud formation and exhibited substantial variability over tens of kilometers (Thompson et al., 2025a, b; Chen et al., 2025).
Additionally, the Next Generation Weather Radar (NEXRAD), designated KHGX and located at 29.47° N, 95.08° W, played a pivotal role in observational activities throughout the study period (Galfione et al., 2025). This advanced radar system conducted volume scans using Plan Position Indicator (PPI) techniques, systematically operating over elevation angles from 0.5 to 19.5°. By varying these elevation angles, the radar prioritized acquiring data essential for detecting and characterizing convective processes embedded within stratiform regions. This approach ensured comprehensive coverage and improved the accuracy of convective feature identification, which is critical for understanding aerosol–cloud interactions and precipitation patterns in the Houston area.
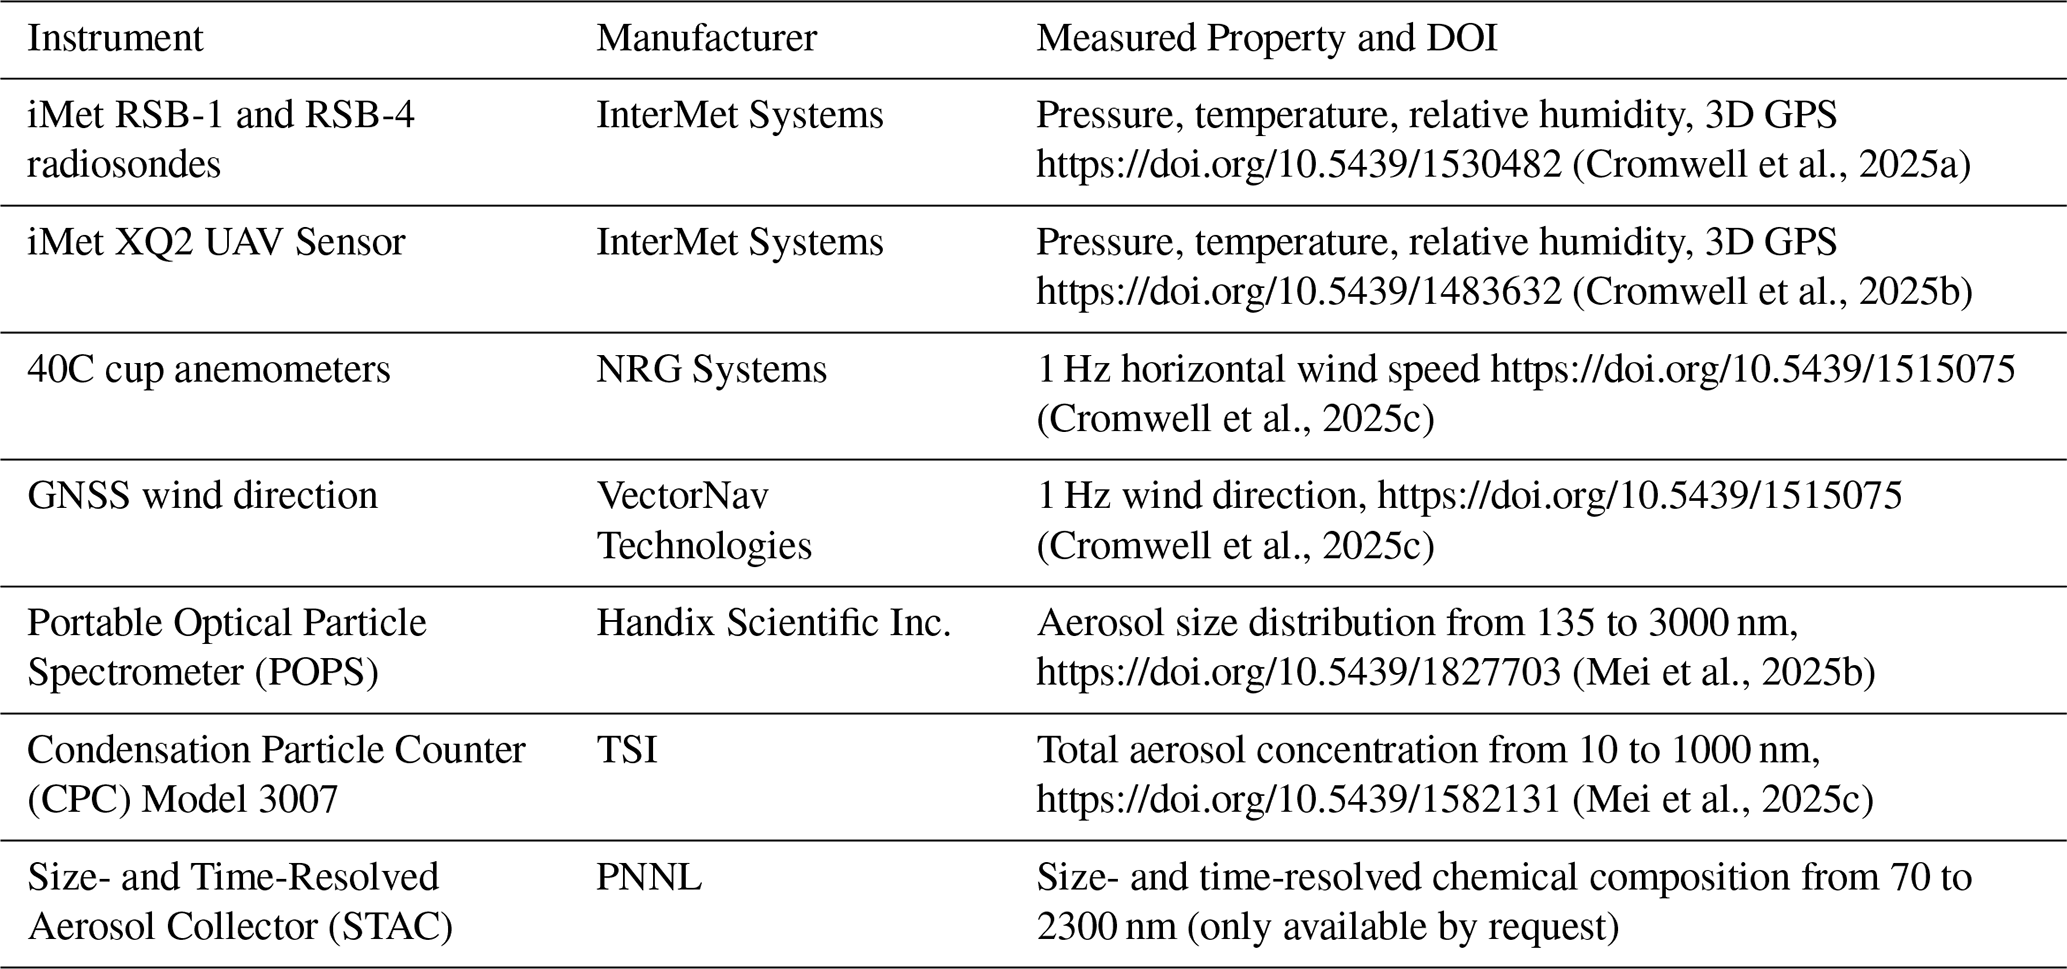
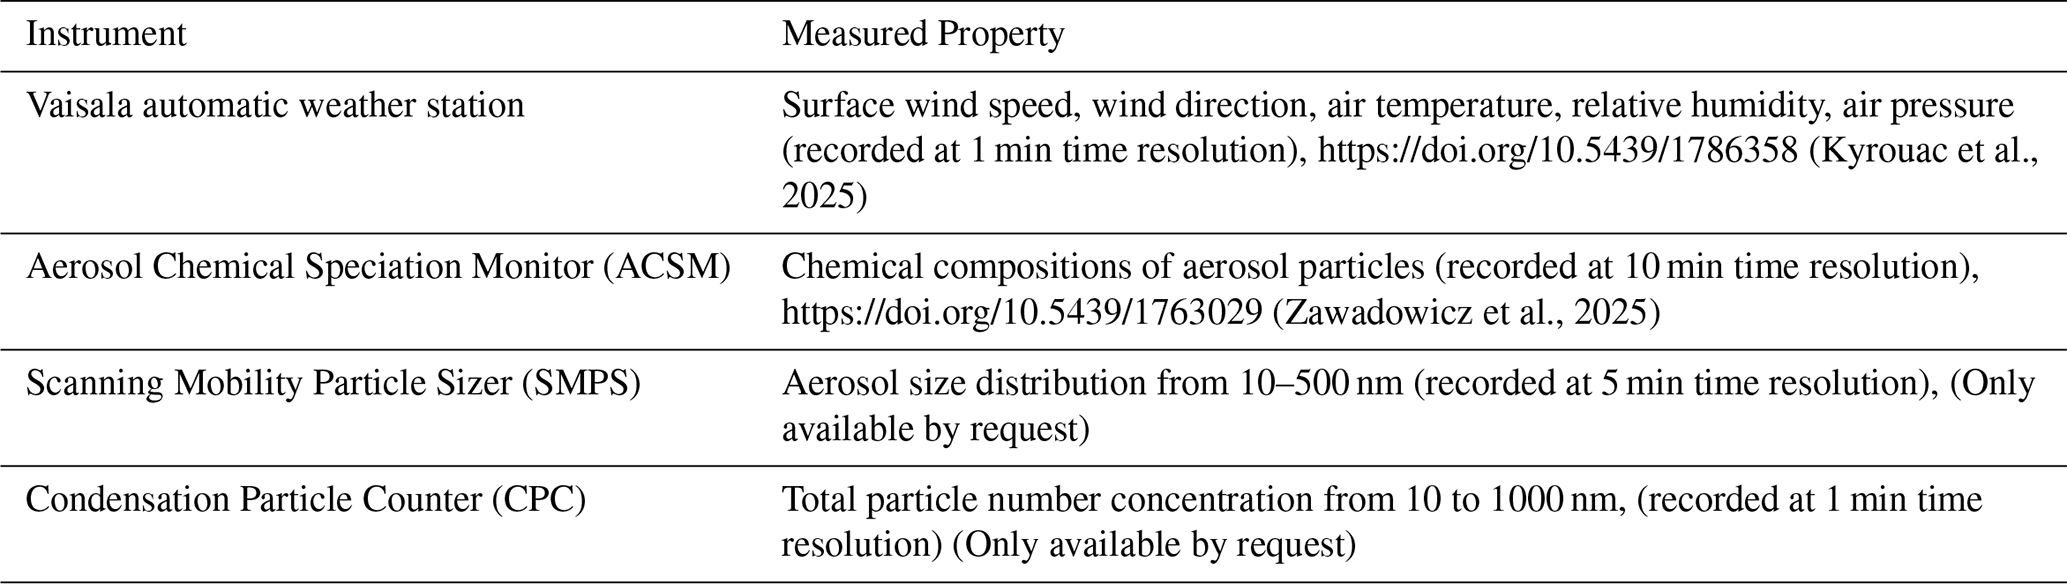
Table 2Additional measurements at the ANC site during TRACER IOP.
2.2 Vertical Observations
The TBS observations enable examination of vertical variations in aerosol properties, including changes in concentration and composition driven by sources such as urban pollution, industrial emissions, long-range transport, and marine influences. The ARM TBS (Dexheimer et al., 2026) uses winch-controlled, helium-filled aerostats to obtain in situ vertical profiles up to about 1.5 km above ground, operating below clouds. Typical payloads, as shown in Table 1 (a payload picture in Fig. S1 in the Supplement), include sensors for pressure, temperature, and humidity (e.g., iMet-XQ2), an anemometer for wind speed and direction, and a portable optical particle spectrometer (POPS) and a condensation particle counter for aerosol size distributions and concentrations; a Size- and Time-resolved Aerosol Collector (STAC) collected the aerosol particles at various altitudes for offline chemical analysis. Both the POPS and CPC were equipped with dryers in their sampling lines to reduce the relative humidity of the sampled aerosol flow to below 40 %. The POPS size bins were calibrated using DMA-classified ammonium sulfate particles rather than polystyrene latex spheres, so the reference refractive index of the sizing scale (n ≈ 1.54 at λ = 405 nm) falls within the range reported for ambient submicron aerosol, reducing the sizing bias associated with the assumed refractive index. A further consideration is the influence of long-range-transported mineral dust, whose refractive index differs from that of the ammonium sulfate used to assign the POPS size bins. We therefore assessed the sensitivity of the retrieved size distribution to the assumed refractive index. Adopting a dust-representative value (m = 1.52 + 0.002i) in place of the PSL calibration value and recomputing the Mie response curve shifts the bin boundaries by less than 4 % in diameter below 1.38 µm (Kezoudi et al., 2026), These shifts are smaller than the corresponding POPS bin widths across the size range; i.e., within the instrument's size resolution, the shape of the binned distribution is preserved to within counting uncertainty. This indicates that the change in CCN concentration is small.(Mei et al., 2024, 2022) During the TRACER IOP, a subset of meteorological and aerosol measurements was collected from 149 ARM TBS flights, which were conducted in the first 2 weeks of each month from June to September. The monthly distribution included 46 flights on 11 d between 3 and 14 June (46.45 h), 32 flights on 13 d between 2 and 14 July (41.12 h), 43 flights on 13 d between 2 and 14 August (46.92 h), and 28 flights on 12 d between 2 and 14 September (56.2 h). Detailed TBS daily operation reports can be found in Appendix A of the campaign report (Jensen et al., 2023). The taking-off and landing times for each flight were listed in Table S1 in the Supplement.
During the 2022 deployment, aerosol particles were collected using a 4-stage impactor (Sioutas) at ground level and a STAC (Cheng et al., 2022) on a TBS. The instrument collected size- and time-resolved samples directly onto substrates for two complementary analytical pathways at the Environmental Molecular Sciences Laboratory (EMSL, https://www.emsl.pnnl.gov/, last access: 22 November 2025). For single-particle characterization, particles collected at stage D (50 % cutoff size of 0.12 µm) of the STAC sampler were analyzed using Computer-Controlled Scanning Electron Microscopy with Energy-Dispersive X-ray spectroscopy (CCSEM-EDX). This technique yields individual particle size, morphology, mixing state, and elemental composition, helping identify particle types and sources (Lata et al., 2023). For molecular-level characterization, samples were collected on Teflon filters for about 12 h at ground level and analyzed by nanospray desorption electrospray ionization high-resolution mass spectrometry (nano-DESI-HRMS) (Gautam et al., 2024). The resulting mass spectra inform the constituent organic molecular formulas in the particle phase, from which we derive key parameters such as O:C ratios, carbon oxidation state, aromaticity indices, and organic aerosol volatility (Roach et al., 2010; Vandergrift et al., 2024; Vandergrift et al., 2022). The results discussed herein are from samples collected during the June and September 2022 flights.
At the ANC site, additional ground-based instruments were deployed to support the measurements conducted at the AMF site. The deployed instruments and the corresponding measurements are included in Table 2.
A range of ground-based measurements was obtained from the ARM Mobile Facility (AMF) site at La Porte, TX. The AMF was equipped with advanced radar and lidar systems, aerosol-observing instruments, and meteorological sensors. ARM has developed a set of Planetary Boundary Layer Height (PBLHT) value-added products to help scientists evaluate and compare estimates. In this study, the Planetary Boundary Layer Height Radiosonde Retrievals with yearly output (PBLHTSONDEYR1MCFARL) VAP was used to provide the PBLHT (Sivaraman et al., 2013; Li et al., 2021; Liu and Liang, 2010).
Additionally, this study used aerosol vertical profiles retrieved from a micropulse lidar (MPL) using a newly developed technique by the Brooks group at Texas A&M University (TAMU) that combines ground-based aerosol measurements with lidar and radiosonde data to obtain vertical profiles of aerosol, CCN, and INP (Chen et al., 2025). Chen's retrieval method assumes that surface measurements of aerosol size distribution, composition, and cloud-activating ability are representative of their vertical profiles, except in cases of elevated layers like smoke or dust. The approach involves determining the vertical profile of the cloud-free aerosol backscatter coefficient using lidar and radiosonde data. The aerosol backscatter coefficient is then corrected for hygroscopic growth using the lidar hygroscopic growth correction factor f(RH), which is which is calculated from hygroscopicity parameters derived from ground-based Scanning Mobility Particle Sizer (SMPS), POPS, and CCN counter measurements, along with relative humidity profiles from radiosondes. The resulting dry aerosol backscatter profiles were subsequently used to retrieve vertical CCN concentration profiles. We used these retrieved profiles to complement our CCN profiles estimated from the ANC location and to provide broader spatial and vertical context.
2.3 CCN concentration estimation
To estimate CCN concentration, our method combines the observed TBS aerosol size distribution with ground-based chemical composition measurements. Our approach includes two steps. The first step is to address the size-range limitation of the aerosol size-distribution data. We extrapolate the measured particle number size distribution from its original POPS range of 135–3000 to 10 nm. We employed a modal-fitting technique based on the algorithm detailed by Seinfeld and Pandis (2016), Hussein et al. (2005). The complete size distribution was represented as the sum of up to two lognormal modes, each defined by its total number concentration (Ni), geometric mean diameter (Dgi), and geometric standard deviation (σgi). The parameters of the fitted size distribution were determined through iterative optimization, minimizing the sum of squared errors between the fitted and measured size distributions over the 135–1000 nm range. The fit was further constrained such that the integral of the distribution from 10 to 135 nm reproduced the difference between the total number concentrations measured by the CPC and the POPS to within 10 %, consistent with the combined counting uncertainty of the two instruments. Consequently, the integral of the fitted distribution over the full 10–1000 nm range agrees, within the same tolerance, with the total number concentration measured independently by the CPC.
The second step is to determine the CCN concentration profile using the κ-Köhler theory. In this study, we assume that the aerosol chemical composition at the ground was representative of that at each TBS flight altitude when the same airmass influenced the TBS flight. Aerosol composition is not necessarily vertically uniform, even within a nominally well-mixed boundary layer. New particle formation has been observed to occur preferentially in the upper mixed layer, the entrainment zone, and the residual layer rather than at the surface, where condensation sinks are larger, and precursor photochemistry differs. Semi-volatile species repartition in response to the vertical temperature and relative humidity gradients: ammonium nitrate and semi-volatile organics shift toward the particle phase at the lower temperatures encountered aloft, so the organic-to-inorganic ratio measured at the surface may not apply at the top of the profile (Zhang et al., 2026; Lata et al., 2025, 2023; Creamean et al., 2021; Huffman et al., 2009). Our assumption is therefore most robust for the daytime and convectively well-mixed boundary layer, and more uncertain for decoupled profiles, such as cases on 6 September (discussed more in Sect. 3.5). Ground-level non-refractory PM1 was measured with a Time-of-Flight Aerosol Chemical Speciation Monitor (ToF-ACSM, Aerodyne Research) equipped with a standard vaporizer (Li et al., 2025; Fröhlich et al., 2013), using a PM2.5 cyclone upstream of the inlet. The instrument provided 10 min-resolution mass concentrations of organics (Org), sulfate (SO4), nitrate (NO3), ammonium (NH4), and chloride (Chl) to complement the TBS deployment. However, the ACSM only quantifies non-refractory submicron species and cannot detect refractory components such as black carbon, sea salt, and mineral dust. These missing species, together with the assumption of a vertically uniform chemical composition, can influence the bulk hygroscopicity and introduce additional uncertainty into CCN concentration estimates – a source of uncertainty that warrants further experimental study.(Schulze et al., 2020; Ren et al., 2026)
We averaged the volumetric fractions of aerosol chemical composition over the flight period. Aerosol particles were assumed as internal mixtures, and the particle hygroscopicity (κCCN) is therefore the volumetric average of the three participating species. More information can be found in our previous publication (Mei et al., 2024)
where xi is the volume fraction of species i. The values of κ are 0.15, 0.67 and 0.61 for organic, (NH4)2SO4 and NH4NO3, respectively. The densities of (NH4)2SO4 and NH4NO3 were assumed to be 1770 and 1730 kg m−3, respectively. Organics were assumed to have a density of 1350 kg m−3, which is within the typical range of previous measurements.(Engelhart et al., 2011)
For a given supersaturation (SS), the κ-Köhler theory is used to determine a corresponding critical activation diameter Dpc,
where , Mw the molecular weight of water, σw the surface tension of pure water, ρw the density of water, R the gas constant, and T the absolute temperature.
All particles in the measured size distribution larger than this critical diameter are assumed to activate into cloud droplets. The total CCN concentration is then found by integrating the particle size distribution from this critical diameter upwards.
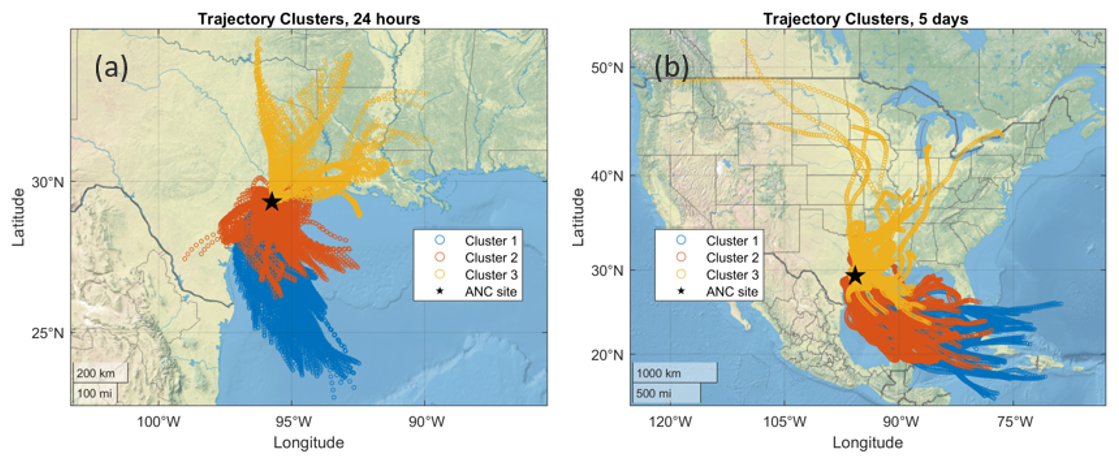
Figure 2ARMTRAJ-TBS back trajectory properties 2022 (a) for 24 h, and (b) for 5 d. The illustrated trajectory clusters are characterized by the geophysical range during measurement periods in June, July, August, and September. The star is the ancillary site in Guy, TX. All figures are generated using Natural Earth by MATLAB®.
2.4 ARM Air Mass Back-trajectory Analysis
The ARMTRAJ dataset (Silber et al., 2025b) is generated using the Hybrid Single-Particle Lagrangian Integrated Trajectory (HYSPLIT) model informed by the fifth-generation European Center for Medium-Range Weather Forecasts (ECMWF) atmospheric reanalysis dataset (ERA5) (Hersbach et al., 2020; Stein et al., 2015). The ERA5 dataset is utilized at its highest spatial resolution (0.25°; ∼ 31 km) and 1 h temporal resolution. The core value of ARMTRAJ is to bridge the gap between the fixed, or Eulerian, nature of ARM's ground-based measurements and the need to understand air-mass hysteresis as it passes over the site. To quantify uncertainty, the dataset incorporates results from ensemble runs for each trajectory initialization; the variability within these ensembles serves as a valuable metric for assessing the consistency and robustness of the reported air-mass coordinates and state variables (Silber et al., 2025b, a). For the ARMTRAJ-TBS, the trajectories were estimated at 11 equally spaced altitudes between the lowest and highest altitudes probed by the balloon, over 1 h intervals (Silber et al., 2025a).
To identify the dominant patterns of meteorological variability within clustered atmospheric regimes indicated by the trajectory dataset, we performed Principal Component Analysis (PCA) on it. Principal Component Analysis (PCA) was employed to reduce the dimensionality of the dataset while retaining as much of the variance as possible from the original variables. PCA is a multivariate statistical technique that transforms a set of possibly correlated variables into a smaller number of uncorrelated variables known as principal components (Jolliffe and Cadima, 2016). These components are linear combinations of the original variables and are ordered so that the first principal component accounts for the largest possible variance in the data, with each successive component capturing the maximum remaining variance subject to the constraint of being orthogonal to the preceding components. Prior to analysis, the data were standardized to ensure that contributions were not biased by scale, thereby allowing the PCA to reveal more meaningful underlying structures. In this study, the first two principal components (PC1 and PC2) accounted for more than 80 % of the total variance in each regime. The weights for these components reveal distinct physical processes.
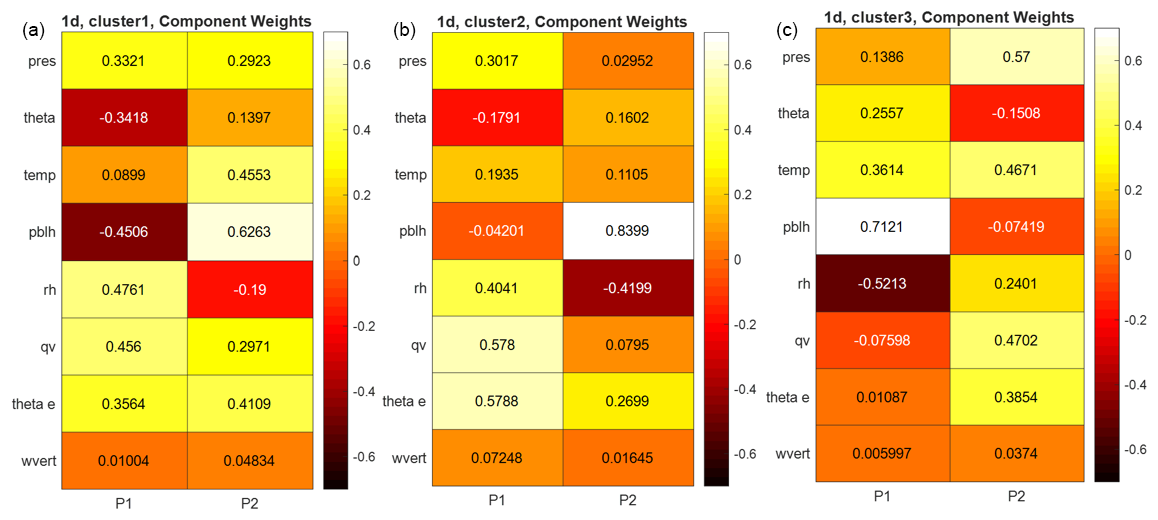
Figure 3Heatmaps of component weights from the Principal Component Analysis (PCA) for the three distinct atmospheric regimes: (a) Cluster 1 (Marine/Coastal Influence), (b) Cluster 2 (Regional/Marine Mixed Influence), and (c) Cluster 3 (Anthropogenic/transport Influence).
3.1 Air Mass Trajectory and Clusters Analysis
Using air-mass geospatial trajectory data derived from the TBS latitude and longitude coordinates via the ARMTRAJ dataset, Fig. 2 illustrates clustered atmospheric transport pathways over two time periods: 24 h (Fig. 2a) and 5 d (Fig. 2b). K-means clustering was applied to classify trajectories into three groups, highlighting contrasting transport pathways and source regions. For the 24 h back trajectories, Cluster 1 (blue) comprises air masses that travel almost exclusively over the Gulf of Mexico before reaching the ANC site, indicating a relatively direct marine inflow. In contrast, Cluster 2 (orange) follows more complex marine pathways: the trajectories initially traverse the Gulf, then curve inland and pass over land for part of their transport, indicating a mixed marine–continental influence and a greater potential for modification by boundary-layer processes over land. Cluster 3 (yellow) originates primarily from the north and west, reflecting stronger influence from continental sources, including anthropogenic emissions from the broader Houston metropolitan region and upwind areas. The 5 d analysis (Fig. 2b) provides crucial insight into the long-range history of these air masses. It confirms that Clusters 1 and 2 spent the vast majority of their transit time over the ocean, with pathways extending deep into the Gulf of Mexico and the western Atlantic. Conversely, the 5 d trajectories for Cluster 3 reveal a significant, long-range continental influence, with air masses originating from the central and upper Midwest of the United States and Canada. This demonstrates that while Clusters 1 and 2 are primarily influenced by oceanic processes, Cluster 3 is shaped by prolonged transport over land, bringing distinctly continental air to the site.
Further analysis using PCA provides additional insights into the meteorological conditions for each cluster. As shown in Fig. 3, the component weights illustrate the influence of eight meteorological variables on PC1 and PC2. The color indicates whether a variable's contribution is positive (yellow) or negative (red). The variables analyzed include airmass pressure (pres), potential temperature (theta), temperature (temp), planetary boundary layer height (pblh), relative humidity (rh), specific humidity (qv), equivalent potential temperature (theta_e), and the mean hourly airmass ascent rate (wvert).
In the marine-influenced regime (Cluster 1), the PCA cleanly separates the advective characteristics of the marine boundary layer from local diurnal forcing. The leading component (PC1) is strongly associated with planetary boundary layer height (pblh, −0.45), potential temperature (theta, −0.34), relative humidity (rh, 0.48), and specific humidity (qv, 0.46). We therefore interpret PC1 as an index of marine layer strength and intrusion. Positive PC1 scores correspond to a cool, moist, and shallow marine boundary layer characteristic of direct onshore flow, whereas negative scores indicate a deeper, warmer, and drier boundary layer associated with marine boundary layer erosion or increased continental influence. The second component (PC2) is dominated by positive weights for pblh (0.63), temperature (temp, 0.46), and equivalent potential temperature (theta_e, 0.41). Because PC2 is orthogonal to the marine-layer signal, it is interpreted as representing the diurnal cycle of surface heating and boundary-layer growth.
For the regime influenced by anthropogenic emissions and transport (Cluster 3), the PCA identifies atmospheric dispersion capacity as the primary mode of variability. The leading component (PC1) is dominated by pblh (0.71) and is strongly correlated with rh (−0.52). In this regime, PC1 functions as a ventilation index, quantifying the atmosphere's capacity to dilute surface emissions. High positive scores correspond to a deep, well-mixed boundary layer and reduced near-surface humidity, consistent with vigorous vertical mixing. Negative scores indicate a shallow, stable boundary layer that traps pollutants and moisture near the surface, favoring episodes of poor air quality. The second component (PC2) is characterized by positive weights for surface pressure (pres, 0.57), temperature (temp, 0.47), and specific humidity (qv, 0.47), and likely corresponds to conditions within a warm, moist high-pressure system.
Under mixed-influence conditions (Cluster 2), the leading mode of variability (PC1) is overwhelmingly characterized by strong, co-varying positive weights for specific humidity (qv, 0.58) and equivalent potential temperature (theta_e, 0.58). This component serves as a robust proxy for the large-scale advection of moisture and thermodynamic energy into the region. The second component is almost exclusively defined by a large weight for pblh (0.84) and a strong correlation with rh (−0.42). This signature suggests vertical mixing and entrainment, in which a growing boundary layer mixes with drier air from the free troposphere, thereby increasing pblh while reducing the layer-averaged rh.
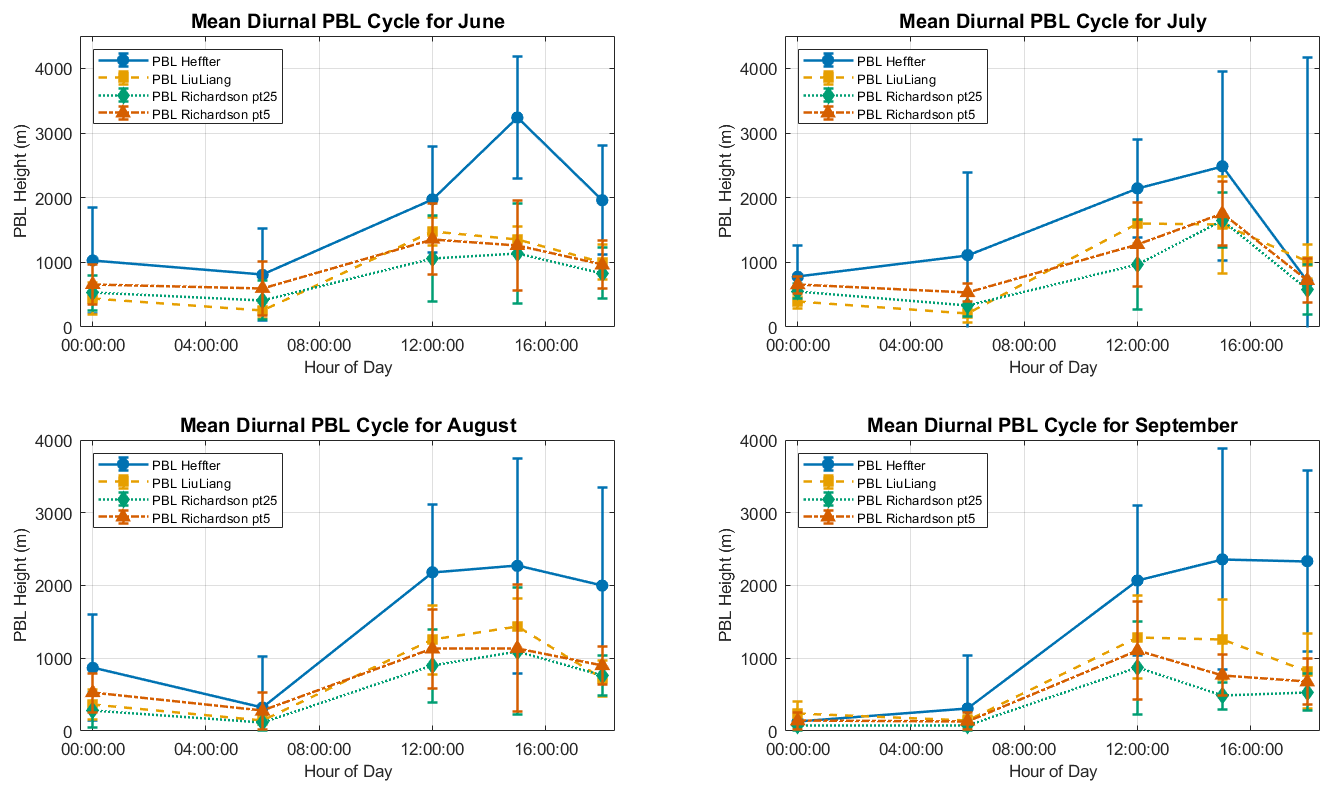
Figure 4Diurnal variation in UTC time of mean planetary boundary layer (PBL) height for June (1–14), July (2–14), August (2–14), and September (2–14) 2022. Dots indicate the mean PBL height at each sampling time; error bars show the standard deviation of PBL height during each sampling period.
In summary, the two-component PCA, stratified by regime, isolates the dominant atmospheric controls: marine-layer confinement versus diurnal heating (Cluster 1), moisture/energy advection versus entrainment-driven drying (Cluster 2), and boundary-layer ventilation capacity versus synoptic airmass forcing (Cluster 3).
3.2 Summertime Planetary Boundary Characterization
To contextualize the summertime boundary-layer behavior, we characterized its diurnal evolution using radiosonde profiles launched from the AMF site and two established algorithms implemented in the ARM PBLHT VAP product (Sivaraman et al., 2013). Estimating the Planetary Boundary Layer Height (PBLHT) from sounding data is a classic approach to understanding the PBL structure. However, no single perfect method exists, and the optimal approach varies with the definition; therefore, a given approach may be a better fit depending on the goal. Data from the ARM program enable comparison of several radiosonde-based approaches, including the Liu-Liang and bulk Richardson number methods (Li et al., 2021; Stull, 2012; Seidel et al., 2010; Liu and Liang, 2010), which are particularly effective for studying the diurnal cycle. The bulk Richardson number method, which identifies the PBL top as the point at which turbulence is dynamically suppressed, is physically robust and well-suited to determining the height of the nocturnal Stable Boundary Layer (SBL) and the transition periods. In contrast, the Liu-Liang method defines the PBLHT as the height at which the maximum vertical gradient in thermodynamic variables occurs, a feature characteristic of the entrainment zone atop a convective boundary layer.
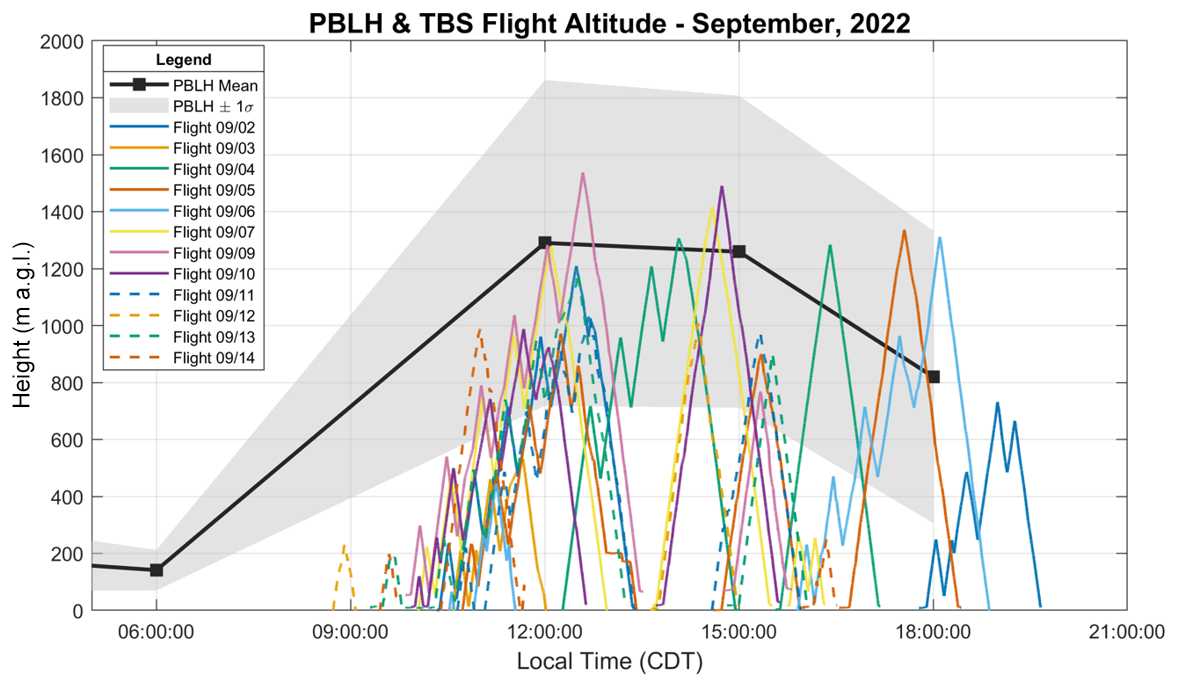
Figure 5Daily TBS flight altitudes during September 2022, overlaid with the mean planetary boundary layer height (solid blue line) and its variability (shaded region) derived from radiosonde profiles.
As shown in Fig. 4, the mean diurnal evolution of the PBLHT during the summer and early autumn months (June–September) aligns with theoretical expectations – increasing over the course of daylight hours coupled with the diurnal cycle of surface temperature. The PBLHT determined by the Heffter method is systematically higher than that obtained by other methods. Because it identifies the PBLHT by locating the base of the elevated temperature inversion and using empirical thresholds that require tuning across regions, it might not be robust in this case for moist/marine regimes. A comparison between the Liu-Liang and Richardson number methods (with a critical value of 0.25) reveals strong agreement during daytime hours (05:30 (00:30), 11:30 (06:30), 17:30 (12:30), and 23:30 (18:30) UTC (local time). The convergent estimates during this period indicate that both methods effectively capture the same fundamental process: the growth of a convective mixed layer driven by surface heating. The Richardson method illustrates a pronounced collapse of the PBLHT, while the Liu-Liang method shows a much more gradual decrease. This divergence is physically instructive. The Richardson method, being a direct measure of turbulence stability, captures the rapid decay of buoyancy-driven mixing as solar heating ceases, signaling the swift transition to a shallower, shear-driven stable layer. The Liu-Liang method, by seeking the maximum gradient, is prone to identifying the top of the now-inactive, neutrally stratified residual layer left over from the afternoon, thus overestimating the height of the active nocturnal boundary layer.
Although the sounding data from the middle of the night were limited to fully characterize the developed SBL, the 05:30 CDT data point is particularly instructive for inferring the preceding nocturnal conditions. The trend of a progressively shallower early-morning PBL from summer to autumn is evident. The mean PBLHT at 05:30 decreased from approximately 500–600 m in June and July to 300–400 m in August, and further to around 200–300 m in September. This implies that the nocturnal SBL becomes systematically shallower and more stable as the season progresses from summer to autumn, a trend consistent with longer nights and more extensive radiative cooling, which fosters the development of stronger, more vertically constrained surface inversions.
To assess how well the TBS profiled the summertime boundary layer, we overlaid flight altitudes with the mean PBLHT derived from the Liu–Liang algorithm. The overlay (Fig. S2 in the Supplement) shows that most daytime flights in June–August remained below the mean Liu–Liang PBLHT, whereas several September flights reached into and, at times, above the mean PBL top, as shown in Fig. 5. This is primarily explained by the systematic seasonal decrease in PBL depth from mid-summer to early autumn. Operational factors also contributed: earlier in the summer, the requirement to operate below the cloud base often constrained the TBS to lower altitudes, whereas in September, clearer conditions allowed the balloon to ascend to its maximum altitude. As established in the previous analysis, the mean afternoon PBLHT is significantly deeper in June and July (often exceeding 1.5–2.0 km) compared to September, when it typically peaks around 1.0–1.3 km. This is a direct consequence of reduced solar insolation and shorter day lengths, which lessen the surface heating that drives convective turbulence and PBL growth. With a fixed or operationally limited TBS ceiling, flights were therefore sampled primarily within the well-mixed layer in JJA. Within this regime, temperature, humidity, and aerosol properties are vertically homogeneous to first order, and profiles are representative of surface conditions and daytime dilution. The data collected in JJA are thus well suited to characterizing mixed-layer chemistry and aerosol processing and to relating CCN to surface emissions.
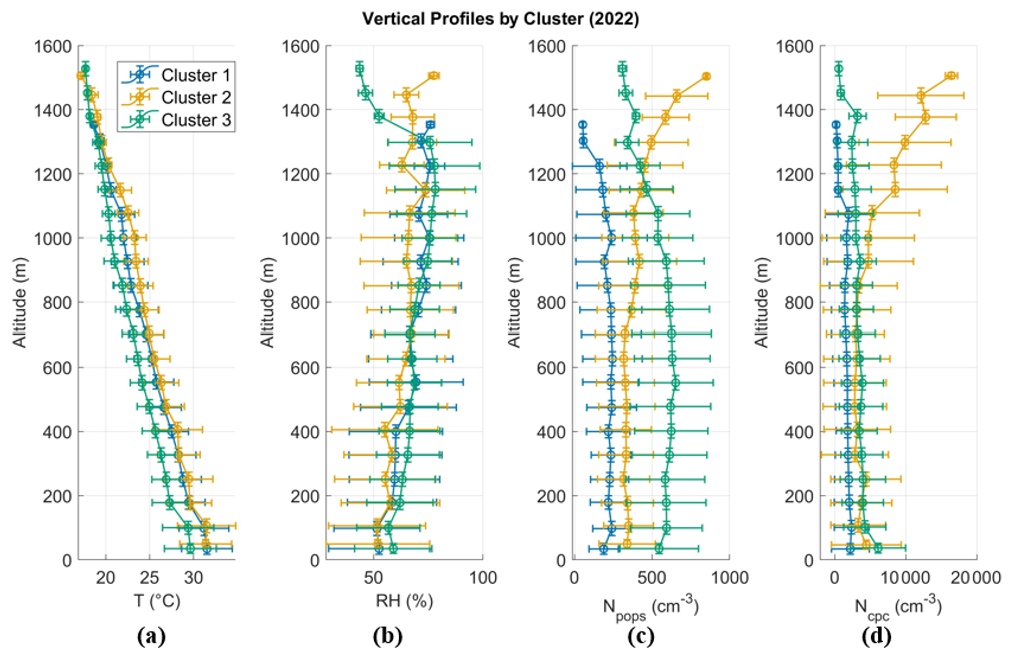
Figure 6Atmospheric conditions observed during various cluster-influenced flights in the 2022 TRACER campaign. The subplots include: (a) ambient temperature; (b) ambient relative humidity; (c) total particle concentration measured by the portable optical particle spectrometer (POPS, particles ranging from 135 to 3000 nm); and (d) total particle concentration measured by the condensation particle counter (CPC, particles greater than 10 nm). The square symbols represent the averaged mean values of the sampling periods, while the error bars denote the standard deviation of the measurements.
To link air-mass origin with boundary-layer dynamics, we combined back-trajectory cluster analysis with radiosonde-derived PBL heights (Liu–Liang and Ri=0.25) and TBS flight altitudes to diagnose how source regions are introduced into, and mixed within, the summertime boundary layer. As the convective boundary layer grows during the day (often exceeding 1–1.5 km in JJA), entrainment at the PBL top brings the Cluster-2 air downward, continuedly diluting the near-surface air residue. Because most TBS flights in JJA remained below the mean PBLHT, they primarily sampled the well-mixed local layer. In September, the air mass above 500 m becomes more heterogeneous, with both Cluster 2 and Cluster 3 appearing aloft, gradually mixed with the near-surface Cluster 1 layer. The decline in PBLHT (shallower afternoon maxima and lower morning depths) lowers the entrainment zone. September flights often reached and exceeded the mean PBLHT, enabling direct sampling of the entrainment zone and the lower free troposphere, where the influences of Clusters 2 and 3 are strongest. With a shallower morning SBL (∼ 200–300 m) and reduced daytime growth in September, the boundary layer is more vulnerable to changes in synoptic and mesoscale flow (e.g., shifting trajectories, sea-breeze passages, residual-layer interactions). Consequently, all three clusters can influence the air below 500 m, with the dominant cluster varying from day to day. This variability might be caused by intermittent entrainment of the overlying Cluster 2 layers into a shallow mixed layer and the occasional persistence of the previous day's residual layer aloft.
3.3 Vertical Profiles of Aerosol Properties
Air mass transport pathways, origins, and processes profoundly affect aerosol distribution, particularly vertical variability. To understand how different atmospheric regimes influence the vertical aerosol structure, we grouped the flight data into three distinct clusters, as discussed in Sect. 3.1. Cluster 1 affected 27 d, Cluster 2 influenced 12 d, and Cluster 3 impacted 9 d. Note that 6 September flights were influenced by both Cluster 1 and Cluster 2 and were excluded from the cluster-influenced figures. Figure 6 shows the mean vertical profiles of temperature (T), relative humidity (RH), and aerosol number concentrations (Npops > 135 nm and Ncpc > 10 nm) composited by three trajectory-based influence clusters: Cluster 1 (marine-influenced), Cluster 3 (anthropogenic/transport influenced), and Cluster 2 (mixed influence). The aerosol number concentrations were reported at the standard temperature and pressure (STP; 1013.15 hPa and 298.15 K). In Fig. 6, plots represent daytime TBS profiles during the intensive period in 2022, and error bars denote one standard deviation about the mean in each 75-m altitude bin for each cluster. The vertical profiles of mean diameters and geometric standard deviations of the modes of merged CPC-POPS size distributions are included in Fig. S4 in the Supplement.
Subtle differences in the vertical profiles of temperature and relative humidity were observed among the three air-mass clusters. However, these differences may also reflect local cloud cover, solar heating, wind, soil moisture, and boundary-layer mixing effects. Thus, the small, discernable difference does not establish that air-mass origin alone caused it. The temperature profiles are broadly similar across all three clusters, with comparable lapse rates from the surface to approximately 1.5 km. This suggests that the local-scale thermal structure and boundary-layer depth were not strongly dependent on air-mass origin during the sampled period, as confirmed with the normalized vertical profiles in Fig. S3a in the Supplement. However, there are slight differences near the surface: the anthropogenic cluster (Cluster 3) is slightly cooler (∼ 30°C) than the marine (Cluster 1, ∼ 32°C) and mixed (Cluster 2, ∼ 31°C) clusters. The relative humidity (RH) profiles show similar variation. Cluster 3 is slightly more humid throughout the lower atmosphere, with RH values sustained at ∼ 60 % below 1 km, consistent with a moist, coastal air mass. Notably, the RH in Cluster 2 shows a weak positive gradient: starting from around 60 %–65 % near the surface, RH gradually rises with height, reaching its highest values (≈ 70 %–75 %) near 1.3–1.4 km. In Cluster 3, RH aloft behaves differently. It is comparable to the other two cluster-influenced conditions within the lowest 1 km, then declines above ∼ 1.2 km. This implies that the anthropogenic cluster is characterized by a moist, well-mixed lower boundary layer capped by relatively drier air aloft, which is typical of a polluted, coastal boundary layer capped by subsiding or advected drier free-tropospheric air.
The vertical profiles of aerosol concentrations and size distributions reveal clear distinctions between the three air mass clusters. Cluster 1 (marine) exhibits low aerosol concentrations characteristic of clean background air. Both Ncpc (> 10 nm) and Npops (> 135 nm) profiles show a uniform concentration up to ∼ 1.1 km. This vertical structure is consistent with a well-mixed marine boundary layer, in which the dominant aerosol sources and precursors originate from the ocean surface (e.g., sea spray and volatile dimethyl sulfide). Furthermore, the gradual decrease with height at altitudes above 1000 m is likely due to vertical mixing and/or dilution from entrainment of even cleaner free-tropospheric air from above. Cluster 3 shows a similar uniform concentration in Ncpc (> 10 nm) and a gradual decrease in the aerosol concentration of Npops (> 135 nm) as altitude increases from 100 m to 1.5 km. This indicates that, in both the clean marine (Cluster 1) and polluted anthropogenic (Cluster 3) cases, the dominant aerosol sources are located within the lower boundary layer. However, Cluster 3 (anthropogenic), influenced by human activities such as industrial emissions, is also characterized by higher concentrations of larger particles (Npops (> 135 nm)), while the total aerosol number concentrations (Ncpc (> 10 nm)) are comparable to those in Cluster 1. This combination suggests an aged, processed aerosol source. As shown in Fig. S4, the contrast in Naccum between Cluster 1 and Cluster 3 is by a factor of 4–5 while Dg,accum differences of only ∼ 30 % indicate that the marine and continental air masses over the ANC site differ mainly in the number concentrations of accumulation-mode particles, but not in the mean diameters. This observation suggests that the aerosol particles influenced by Cluster 1 are coastal-modified marine aerosol, but not pristine.
Cluster 2 (mixed) presents a complex vertical structure. At lower altitudes, the aerosol concentration profiles are relatively constant below 800 m. However, above 1 km, the Ncpc (> 10 nm) and Npops (> 135 nm) profiles show a notable increase, making it the most concentrated cluster aloft. This elevated enhancement is usually consistent with an advected, or long-range transported aerosol layer residing near or just above the boundary-layer top. Such layers often arise from regional or continental pollution, biomass burning, or other distant sources and can be decoupled from the local surface emission regime. The fact that Cluster 2 is intermediate in concentration near the surface but enhanced aloft supports the interpretation of a mixed air mass influenced simultaneously by local fresh emissions, and an overlying transported pollution layer entrained into the boundary layer. In addition, the Cluster 2 result is the strongest corroboration of the trajectory analysis. Aqueous-phase sulfate production in non-precipitating cloud is the most efficient mechanism for shifting the accumulation mode to larger sizes, and Fig. S4 shows the largest Dg,accum while carrying only an intermediate number is precisely the signature of a processed rather than a freshly emitted population.
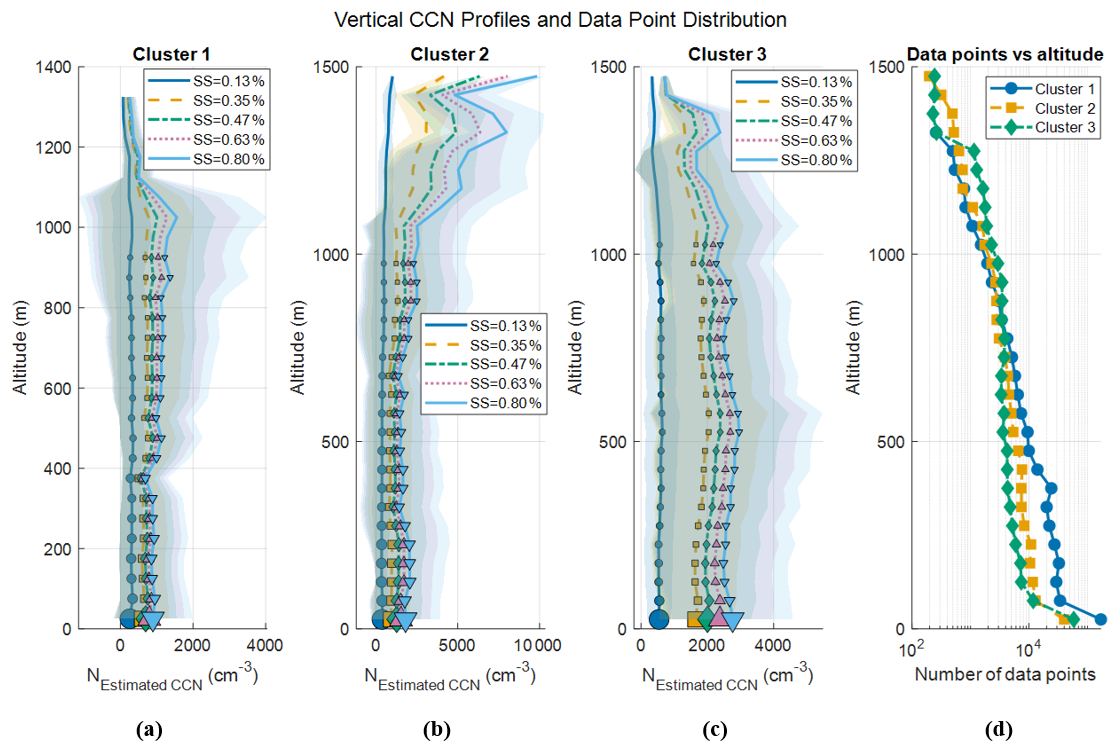
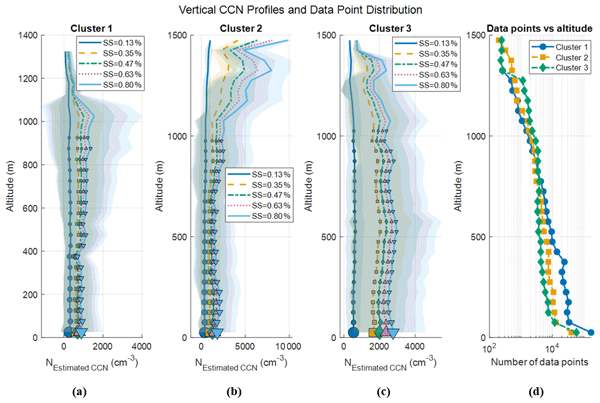
Figure 7Estimated CCN concentration vertical profiles as a function of TBS altitude for each cluster (a–c), with the number of data points collected at the corresponding altitude for three clusters (d).
3.4 Clusters-influenced CCN Profiles Estimation
Figure 7 presents vertical profiles of estimated CCN concentrations for three distinct air mass clusters, plotted as a function of altitude. These plots provide useful vertical context for the variation in CCN availability across airmass regimes. Another version of this figure was plotted against altitude normalized by the PBLHT (Altitude/PBLHT), as shown in Fig. S5 in the Supplement. This normalized version aims to reveal key differences in the vertical distribution of aerosols relative to the PBL structure across differing airmass influences. In Figs. 7a–c and S5, the size of the circle symbols at each altitude level is proportional to the number of data points collected within that altitude range, providing a visual indication of the statistical robustness of measurements. A threshold of 2000 data points is established as the confidence limit for data representativeness. Altitude bins containing fewer than 2000 data points (represented by smaller circles) should be interpreted with caution, as they may be less representative of the true vertical CCN distribution. Figures 7d and S3d appropriately document the sampling limitations inherent in TBS operations. They show a strong reduction in the number of samples collected aloft, and the data density decreases substantially above ∼ 800–1000 m altitude in Fig. 7d. In Fig. S5d, Cluster 2 shows notably fewer samples at the high normalized ratio ( > 0.8) compared to Clusters 1 and 3. Because statistical confidence in the upper-level observations is correspondingly reduced, the figures are most suitable for discussing within-PBL gradients and airmass differences but provide less definitive information about the free-tropospheric tail.
The vertical structure in all three cluster cases generally shows a well-mixed boundary layer (< 800 m), characterized by relatively uniform CCN concentrations. Cluster 1 (Marine-influenced) is characterized by the lowest overall CCN concentrations, consistent with a relatively clean marine air mass originating from the Gulf of Mexico. Within the lower PBL (Altitude/PBLHT ≲ 0.4), mean CCN concentrations at SS = 0.80 % are on the order of 1000 cm−3. The ratio of CCN at 0.80 % to 0.13 % supersaturation is around 3 in this region, indicating relatively homogeneous critical supersaturation among aerosol particles, likely dominated by sea salt and marine biogenic particles with similar hygroscopic properties. The low ratio also suggests fewer small Aitken-mode particles relative to the accumulation mode, which is typical of clean marine environments where new particle formation is suppressed or where coagulation/wet scavenging removes smaller particles.
Cluster 3 (Urban/Anthropogenic/Transport) exhibits the highest CCN concentrations and maintains elevated values through much of the sampled depth. Within the PBLHT, CCN concentrations at SS = 0.80 % reach ∼ 3000 cm−3. The ratio () is about 5, suggesting a broader, but still relatively processed, size distribution. This is consistent with aged urban/industrial pollution, where the transport time from Houston likely allows for photochemical aging and coagulation, and secondary aerosol formation (sulfate, nitrate, SOA) has grown particles into the accumulation mode, but a fraction of smaller, less hygroscopic particles remains (Li et al., 2025; Farley et al., 2024). This interpretation is further supported by the characteristics of aerosol chemical composition. The presence of an “aged” or “processed” aerosol population was observed by chemical analysis of a 3 June sample representative of Cluster 3's influence. This sample was exceptionally complex, with 1020 molecular formulas (MFs) assigned (Fig. S6 in the Supplement). A large fraction of these were nitrogen- and sulfur-containing organics, including 340 organonitrates (CHON) and 104 organosulfates (CHOS). The prevalence of these compounds resulted in a distinct chemical signature: high oxygenation and low aromaticity, both hallmarks of extensive atmospheric processing. A detailed manuscript (under review) presents chemical analyses of organic aerosols collected during TBS flights on 3, 5, 8, and 9 June 2022, and reports significant day-to-day variability attributable to distinct air-mass influences.
Cluster 2 (Mixed Influence from marine and regional) represents air masses influenced by both marine and regional continental sources and sits between Clusters 1 and 3 in absolute CCN concentration but shows the highest spread ratio ( ∼ 6). Cluster 2 exhibits a distinct vertical structure compared with Clusters 1 and 3. In addition to being well-mixed in the lower 70 % of PBL, CCN concentrations influenced by Cluster 2 increase significantly with altitude at the top of the PBLHT (above 1000 m), culminating in a distinct peak near the PBL top (Altitude/PBLHT > 0.8) with values exceeding 5000 cm−3 at SS = 0.80 %. This accumulation of aerosols aloft is strong evidence of active in situ particle growth occurring preferentially at the top of the boundary layer. These continental pollutants are trapped beneath a temperature inversion and interact with the high humidity and strong solar radiation characteristic of the coastal marine environment. These conditions are ideal for efficient aqueous-phase chemistry (cloud processing) and photochemical reactions, which rapidly convert precursor gases into particulate matter and add mass to existing small particles, thereby growing them into the CCN size range (Li et al., 2025; Farley et al., 2024). However, Fig. 7d shows that the number of samples decreases markedly with altitude, so the upper-level enhancement in Cluster 2 should be interpreted with caution, and additional observations would be needed to confirm this as a systematic feature.
We noticed elevated CCN layers in Fig. S3c (1.5 < Altitude/PBLHT < 2.2), which is due to the single-day event on 9 September, might not represent the general trend in this airmass regime.
3.5 Why Observational Aerosol-Cloud Interaction Studies Can be So Challenging – A Case Study
A central obstacle in observational aerosol–cloud interaction research is disentangling aerosol microphysical effects from the meteorological variability that simultaneously governs both aerosol distributions and cloud formation. The 6–7 September 2022, case study from the TRACER campaign near Houston provides a compelling, data-rich illustration of this challenge – demonstrating how mesoscale circulations, airmass advection, and differential transport can simultaneously transform the thermodynamic environment and the aerosol population, rendering causal attribution of cloud changes to aerosol effects deeply ambiguous from observations alone.
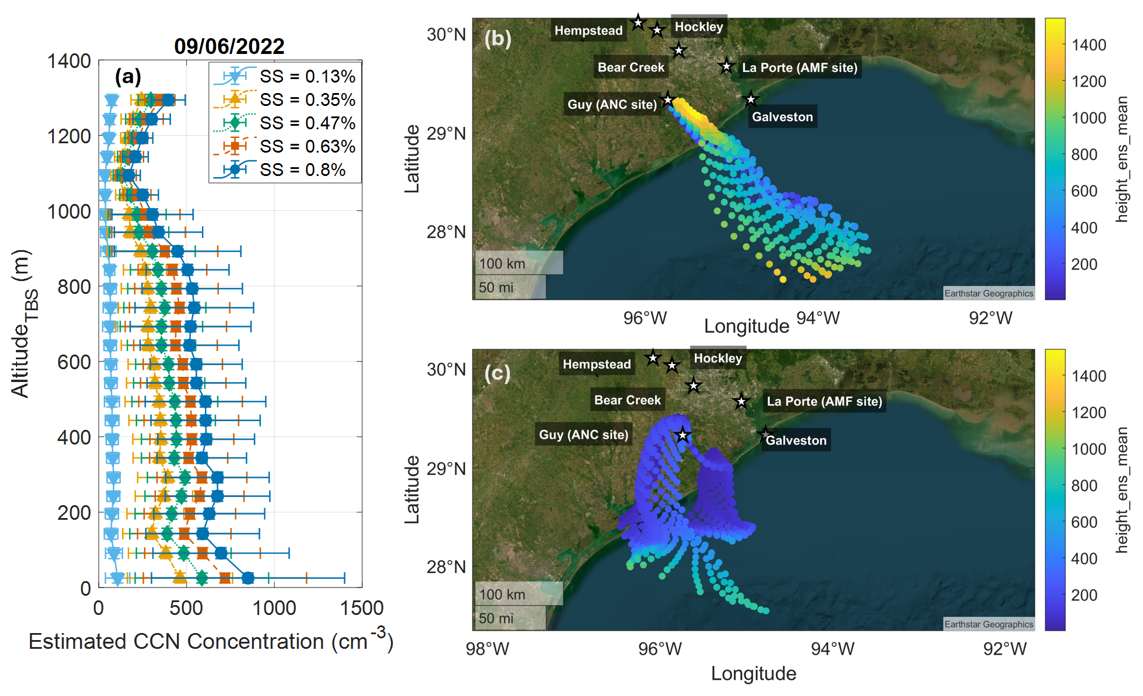
Figure 8Estimated CCN concentration vertical profiles (a) using TBS measurements for both flights on 6 September at the supersaturations of 0.13 %, 0.35 %, 0.47 %, 0.63 %, and 0.8 % with ARMTRAJ TBS 24 h back-trajectories for the TBS flight altitude higher than 1000 m (b) and near ground (c). © Earthstar Geographics.
3.5.1 Aerosol Vertical Structure and Airmass Complexity: 6 September
In most boundary-layer flights during the campaign, the TBS vertical profiles reflected a single, well-mixed air mass. However, several cases in September deviated significantly from this pattern. The case from 6 September 2022 (between 20:47 and 23:55 UTC), presented in Fig. 8, is a prominent example of such a deviation. The vertical profile of estimated CCN concentration (Fig. 8a) reveals a distinct vertical stratification: below approximately 1000 m, CCN concentrations are largely constant with altitude across all measured supersaturations, while above 1000 m, CCN concentrations increase with altitude. These trends strongly suggest the presence of two vertically decoupled air masses with different aerosol characteristics, likely separated at the top of the marine boundary layer. Because size-resolved chemical composition was not measured continuously along the vertical profiles, NCCN was computed using a single, height-invariant hygroscopicity parameter for each profile. This leads to greater uncertainty in the estimated NCCN, especially for SS values less than 0.3 %.
An analysis of the 24 h ARMTRAJ back-trajectory provides a compelling explanation for this observed stratification. Figure 8b shows the trajectories for air parcels arriving at altitudes higher than 1000 m. This airmass originated over the open Gulf of Mexico and partially underwent subsidence (as indicated by increasing pressure along the trajectory paths) as it advected towards the measurement site. This air mass history is characteristic of marine air (Cluster 1) from the free troposphere, consistent with the lower CCN concentrations (< 500 cm−3) observed in Fig. 8a. Conversely, the trajectories for air parcels arriving near the ground (Fig. 8c) reveal a drastically different history. These air masses exhibit a complex, low-level recirculation pattern confined near the coast (Cluster 2). This low-level recirculation pattern is consistent with NEXRAD imagery (Fig. S6a), which shows an airmass boundary propagating from the Gulf Coast, reaching the site at approximately 17:00 UTC. Therefore, the 6 September case demonstrates a scenario of different airmass types inside and above the boundary layer. The TBS profile sampled two vertically stacked but historically distinct air masses: a recirculated continental/coastal layer near the surface, and a cleaner, subsided marine layer entraining from the free troposphere above it.
Critically, the corresponding radiosonde from 6 September (launched at 23:30 UTC, clost to the end of the TBS flight, Figs. S8 and S10 in the Supplement) indicates a thermodynamic environment that is fundamentally hostile to cloud formation. The skew-T profile shows a deep layer of extremely dry mid-level air (∼ 800–400 hPa). The large temperature–dewpoint separation indicates that any nascent cloud penetrating the cap would be rapidly eroded by entrainment of this dry air. Above the moist boundary layer (which extends only to roughly 950–900 hPa), the dewpoint drops, with a corresponding dewpoint depression of 20–30°C or more through the 800–400 hPa layer. Although the dewpoint trace shows some oscillations in the 700–600 hPa range (suggesting thin, intermittent layers of slightly higher moisture, possibly associated with the marine airmass above 1000 m identified by the back-trajectories. No clouds were observed on this day. The combination of CCN profiles, back trajectories and the thermodynamic sounding collectively indicate an atmosphere in which cloud formation was suppressed by dynamical and thermodynamic barriers – regardless of aerosol loading.
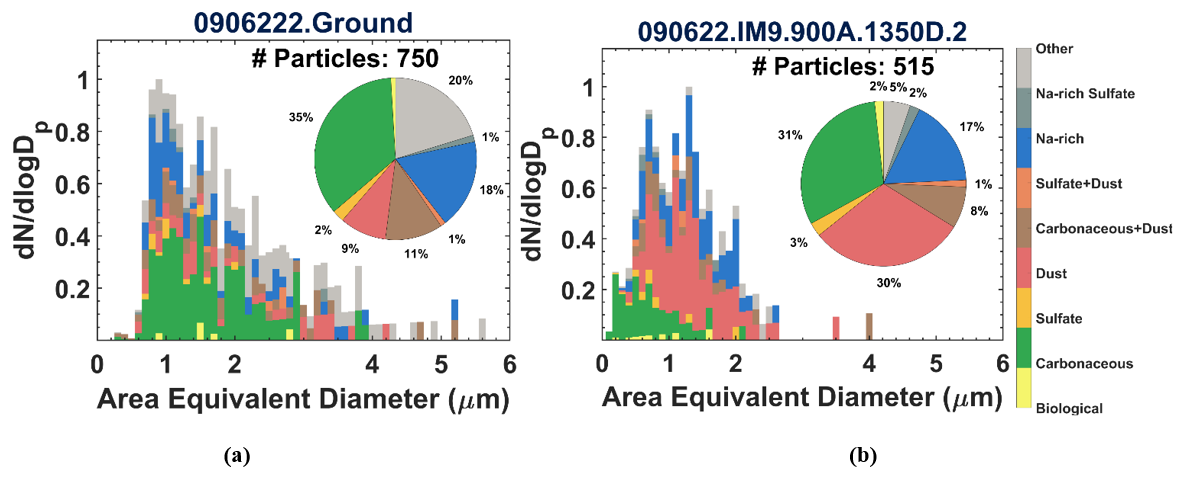
Figure 9Size-resolved particle classifications from CCSEM/EDX at (a) ground (750 particles analyzed) and (b) 1350 m altitude (515 particles analyzed) for flight on 6 September 2022. The inset shows the percentage of each CCSEM/EDX-derived particle class.
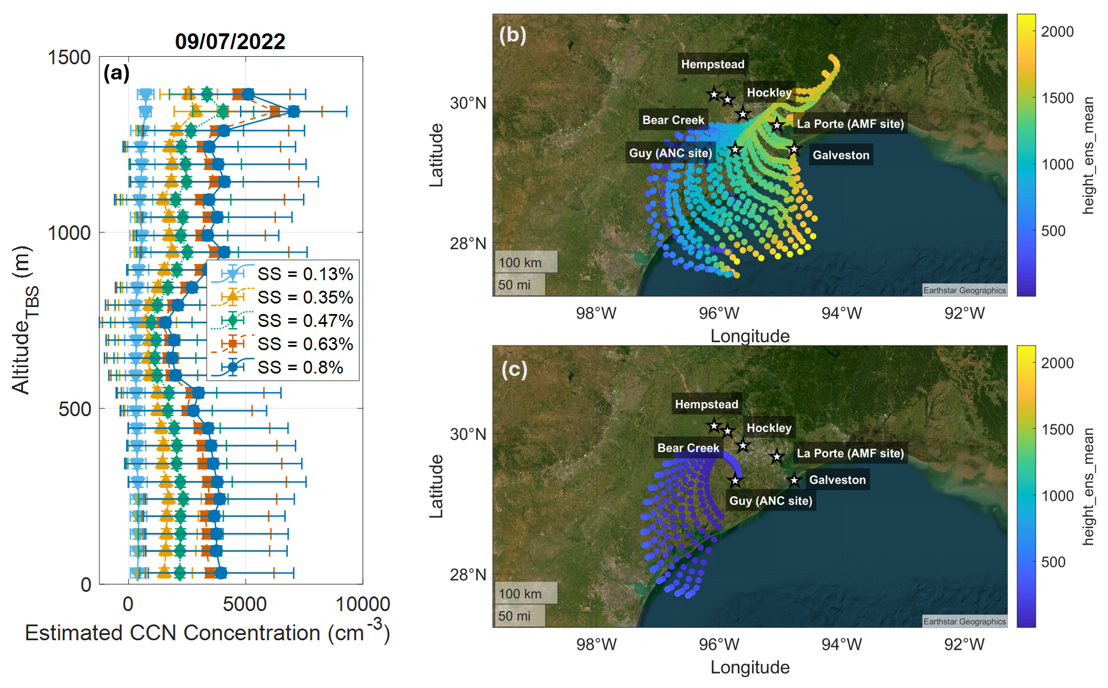
Figure 10Estimated CCN concentration vertical profiles (a) using TBS measurements for all flights on 7 September at the supersaturations of 0.13 %, 0.35 %, 0.47 %, 0.63 %, and 0.8 % with ARMTRAJ TBS 24 h back-trajectories for the TBS flight altitude higher than 1000 m (b) and near ground (c). © Earthstar Geographics.
Additionally, the size-resolved chemical compositions derived from CCSEM-EDX analysis show considerable differences between the ground and aloft samples, as shown in Fig. 9. The CCSEM-EDX results were consistent with the back-trajectory analysis: two distinct aerosol environments associated with different air masses at different heights. The ground-level sample is characterized by a high fraction of Carbonaceous (35 %) and Na-rich (18 % + 20 % Na-rich Sulfate) particles, indicating a strong influence of marine-influenced, boundary-layer air. The abundance of Na-rich sulfate suggests active chemical processing of sea salt in a polluted marine boundary layer. Meanwhile, the sample collected at 1350 m exhibits a markedly different chemical profile, indicative of a distinct airmass history. The most striking feature is the massive increase in the fraction of Dust (30 %) compared to the ground (9 %). This, combined with the still-significant Carbonaceous (31 %) fraction and Na-rich particles (17 %), suggests that the marine air masses also contained long-range-transported aerosol. The presence of internally mixed particles, such as Sulfate + Dust (3 %) and Carbonaceous + Dust (8 %), indicates atmospheric aging during transport. Overall, the ground-level composition reflects locally and marine-influenced boundary-layer air, whereas the aloft composition reflects a marine air mass with aged, long-range transported airmass rich in dust and processed carbonaceous material.
3.5.2 Dramatic Airmass Transformation: 7 September
By 7 September (takeoff at 14:58; landing at 21:19 UTC), both the aerosol environment and the thermodynamic structure had undergone a wholesale transformation. The vertical CCN profile showed exceptionally high concentrations, with values exceeding 3000 cm−3 at a supersaturation (SS) of 0.8 %, extending throughout the boundary layer, as shown in Fig. 10. This airmass, a processed mixture of continental pollution and humid marine air, was characterized by an abundance of small, hygroscopic particles (the ) ratio was about 10). The x axis scale of the CCN profile expanded from 0–1500 cm−3 on 6 September to 0–10 000 cm−3 on 7 September, reflecting a 5–10× increase in CCN across all supersaturations and altitudes.
The radiosonde from 7 September (launched at 20:30 UTC, Fig. S7 in the Supplement) reveals an equally dramatic thermodynamic transformation. The lower troposphere (surface through ∼ 700 hPa) was substantially moister on 7 September than on 6 September (Figs. S9 and S11 in the Supplement), thereby reducing the destructive entrainment of dry air during the critical early growth phase of convective clouds. However, above ∼ 600–700 hPa, significant drying persists. The mid-to-upper troposphere was not deeply moistened. Both days had large CAPE (Convective Available Potential Energy). On 6 September, no lifting mechanism existed to release this instability, so no clouds formed. On 7 September, a complicated combination of a bay-breeze boundary propagating from Galveston Bay to the west and multiple gust fronts, associated with a mesoscale convective system to the northeast of Houston, propagating toward the south and southwest (see Fig. S7b), provided the mesoscale convergence and lift necessary to push parcels through the cap. Once initiated, clouds benefited from the moister lower troposphere (which reduced entrainment-driven erosion during early growth). The dramatically higher CCN concentrations were a byproduct of the same airmass transformation that improved moisture and provided the outflow trigger.
In addition, we examined the CCN profiles derived from the TAMU MPL at Hockley (see Fig. 1) during the overlapping operational periods (as shown in Table S1). While the dataset in Fig. 8 highlighted the importance of vertical variance in CCN, the vertical profiles of CCN show a dramatic shift in air-mass properties between 6 and 7 September, 2022. As shown in Fig. S12 in the Supplement, the TBS and TAMU MPL-estimated CCN profiles clearly indicate a significant horizontal transport event. On 6 September, the region was characterized by relatively clean conditions. TBS and TAMU profiles at both 0.2 % and 0.8 % supersaturation are relatively similar in magnitude and vertical structure, suggesting that both platforms were largely sampling the same regional-continental background aerosol, with only modest spatial gradients. By 7 September, however, the TBS and TAMU profiles diverge sharply: CCN concentrations from the TBS increase by a factor of 2 (especially at 0.8 % SS) and exhibit a much more vertically diversity, with an elevated layer up to about 1–1.4 km, whereas TAMU values remain closer to the magnitude on 6 September. This contrast implies that mesoscale horizontal transport – likely associated with a change in wind direction or the passage of a plume – dominated CCN variability on 7 September, introducing strong spatial heterogeneity in aerosol properties over relatively short horizontal distances in the region.
3.5.3 The Covariability Trap
At first glance, the 6–7 September contrast might appear to present a natural experiment for aerosol-induced convective invigoration: a clean day with few clouds or precipitation, followed by a polluted day with more clouds and precipitation. Indeed, when ingested by the observed updrafts, the 7 September aerosol population may have led to the nucleation of a very high number of small cloud droplets, potentially suppressing warm rain formation and potentially invigorating convection through enhanced latent heat release (as shown in Figs. S10 and S11). However, the radar imagery from NEXRAD (Fig. S7) reveals that the ANC site was strongly influenced by mesoscale dynamical forcing: a density current boundary (most likely a sea breeze) on 6 September, whereas on 7 September, strong convection propagating from the north with multiple cold pools that interacted with a bay breeze frontal boundary.
The combined skew-T, CCN analysis and radar imagery reveals that this interpretation is untenable as a simple causal narrative for three reasons. First, the clean day (6 September) was meteorologically incapable of producing deep clouds due to a general lack of moisture and low-level instability. Second, the polluted day (7 September) was meteorologically primed for convection regardless of aerosol loading. With enormous CAPE, deep moisture, and a mesoscale lifting mechanism (convective cold pools and a bay breeze front), the 7 September environment would have produced deep convection even with 6 September's modest CCN of a few hundred cm−3. Cloud droplets would have been fewer and larger, and warm rain would have developed more efficiently, but convection would still have occurred. Third, the aerosol and meteorological transformations were not independent. The same mesoscale process – sea-/bay-breeze circulations, convective cold pools, and airmass advection – that delivered deep moisture, removed CIN (Convective Inhibition), and enhanced CAPE also imported an entirely different aerosol population with dramatically higher CCN concentrations. The aerosol and thermodynamic changes are confounded at their source.
This case study reinforces a fundamental hierarchy of controls on deep convection, in which thermodynamic environment and mesoscale dynamical forcing act as first-order controls while aerosol effects serve only as second-order modulators: on 7 September, the combination of enormous CAPE, deep moisture, and robust lifting from colliding cold pools and a bay-breeze front virtually guaranteed convection regardless of aerosol loading, meaning aerosols may have shaped droplet size, precipitation efficiency, or intensity but not whether storms occurred. This carries direct significance for forecasting – accurately representing boundary-layer circulations and cold-pool dynamics matters more than resolving aerosol fields – and offers a broader cautionary lesson that dramatic clean-versus-polluted day contrasts can also reflect variation in underlying meteorology. At the regional scale, the primary finding is that aerosol character and convective favorability are not independent but dynamically coupled through the same circulation systems: similar mesoscale processes that imported moisture, eroded inhibition, and enhanced instability also delivered a high-CCN aerosol population, such that clean marine air tends to arrive with stable, moisture-limited conditions while polluted continental inflow coincides with convectively primed environments. Because the region's aerosol and convective climatologies co-evolve with the prevailing flow, understanding – and ultimately projecting – convection in this coastal setting requires treating the circulation–thermodynamics–aerosol system as an integrated whole, particularly as variability at the decadal time scales alters land–sea thermal contrasts, boundary-layer moisture, and aerosol transport pathways in ways no single-variable analysis could anticipate.
This study used TBS observations in the greater Houston coastal urban region to investigate how vertical thermodynamic structure and transport modulate aerosol and inferred CCN distributions. TBS data were collected during the summer over the greater Houston, Texas, region as part of the DOE ARM User Facility's TRACER field campaign. To interpret these measurements and understand the influence of air mass source regions, the study utilizes the ARMTRAJ dataset. This dataset consists of Lagrangian air-mass back trajectories generated with the HYSPLIT model, driven by high-resolution ERA5 meteorological reanalysis data. Its purpose is to provide historical context for air masses arriving at fixed (Eulerian) measurement sites, with trajectory uncertainty quantified through an ensemble methodology. A k-means clustering analysis of 24 h and 5 d back trajectories demonstrates the dataset's utility in differentiating air mass histories. The analysis identified three distinct transport pathways: (1) direct marine inflow from the Gulf of Mexico, (2) mixed marine-continental transport, and (3) urban/anthropogenic flow originating from the central US and Canada. This approach effectively classifies air masses by their source regions, providing an essential framework for interpreting the observed variations in aerosol properties.
By grouping flight data into three trajectory-based clusters (marine, anthropogenic, and mixed), distinct vertical profiles were identified. While temperature profiles were broadly similar across clusters, RH profiles revealed structural differences: the mixed cluster showed increasing RH with altitude, whereas the anthropogenic cluster featured a moist layer capped by drier air. The most dramatic differences were observed in the aerosol profiles. The marine cluster (Cluster 1) exhibited low aerosol concentrations that decreased with altitude, characteristic of a clean, well-mixed marine boundary layer with surface-based sources. Urban/anthropogenic cluster (Cluster 3) showed much higher concentrations that also decreased with altitude, indicating strong surface-based pollution within a well-mixed layer. The mixed cluster (Cluster 2) displayed a complex vertical structure with moderate surface concentrations and a significant increase in aerosol levels above 1 km. This elevated layer is interpreted as advected, long-range-transported pollution residing above the local boundary layer, thereby confirming the cluster's mixed-influence nature.
To contextualize the measurements, this study characterized the summertime diurnal evolution of the PBL using radiosonde data. Then, an analysis comparing TBS flight altitudes to the derived PBL height (PBLHT) revealed that summer (June–August) flights primarily sampled within the deep, well-mixed boundary layer. In contrast, September flights often reached or exceeded the shallower PBL top, enabling direct measurement of the entrainment zone. By integrating this analysis with air-mass trajectory clusters, a dynamic picture emerges. Especially in September, the shallower PBL and more heterogeneous air masses aloft (Clusters 2 and 3) led to greater variability, with TBS flights capturing the direct influence of entrainment and distinct synoptic flows on the boundary-layer structure.
An analysis of estimated CCN vertical profiles reveals distinct aerosol characteristics across three air mass clusters. The marine-influenced cluster (Cluster 1) shows the lowest CCN concentrations within a well-mixed boundary layer, consistent with a clean marine air mass. The urban/anthropogenic cluster (Cluster 3) exhibits the highest CCN concentrations and is also confined to a well-mixed PBL, reflecting strong surface-based pollution from fresh urban and industrial emissions. The CCN profiles in this airmass regime have the highest spread ratio (), pointing to a broader size distribution with a large population of smaller particles. The mixed-influence cluster (Cluster 2) exhibits a unique vertical structure, with the highest CCN concentrations peaking near the top of the PBL. This elevated aerosol layer is attributed to in-situ particle growth, in which continental pollutants trapped at the PBL inversion react with high humidity and solar radiation.
Finally, we focused on two interesting flight days. Analysis of vertically resolved CCN profiles from 6 and 7 September 2022, revealed significant vertical and horizontal aerosol heterogeneity. On 6 September, TBS profiles captured two vertically decoupled air masses: a polluted, recirculating coastal boundary layer and an overlying, cleaner, subsiding marine free-tropospheric layer containing long-range-transported dust. This case demonstrates the critical role of differential advection in stratifying aerosol chemical and physical properties. On 7 September, a mesoscale advection event introduced an air mass with anomalously high CCN concentrations (> 3000 cm−3 at 0.8 % SS), creating conditions highly conducive to aerosol-induced convective invigoration. The key scientific advance highlighted by these events is the synergistic use of in-situ TBS profiling with ground-based remote sensing. The TBS provided detailed, process-level measurements of the pre-convective aerosol microphysical properties, while subsequent radar and lidar observations captured the macroscopic cloud dynamical response – namely, the initiation of deep convection.
While this study provides valuable insights into the vertical structure of CCN under different air-mass regimes, several limitations frame the conclusions and motivate a clear path for future research. First, the TBS sampling provides high-resolution vertical structure but limited horizontal representativeness, capturing a single-column view of a spatially heterogeneous aerosol field. The observational period was confined to the summer months, precluding assessment of seasonal variability in aerosol-cloud interactions that may arise from shifts in source contributions, photochemical processing rates, and boundary-layer dynamics. Secondly, CCN concentrations were inferred from size distributions rather than measured directly, introducing uncertainty associated with assumed hygroscopicity (κ) and the internal versus external mixing state. The activation ratios (N__0.13 %) presented here are bulk metrics that cannot fully disentangle the relative contributions of the size-distribution shape and composition-dependent hygroscopicity. This is particularly relevant for Cluster 2 (coastal recirculation), where the high activation ratio (∼ 6) could reflect either a broad size distribution with abundant Aitken-mode particles, compositional heterogeneity from mixed marine-continental sources, or both. Thirdly, back-trajectory clustering provides a robust statistical framework for air-mass classification, but not deterministic attribution of sources and transformations. Trajectories capture transport pathways but cannot resolve sub-grid emission sources, vertical mixing during transport, or chemical transformations that modify aerosol properties en route. Fourthly, reduced sampling aloft due to TBS operational limitations means conclusions about free-tropospheric CCN or fine-scale features near the highest altitudes should be framed as indicative rather than definitive. This is particularly relevant to understanding the effects of entrainment and the contributions of the residual layer to boundary-layer CCN budgets. Finally, cloud responses were constrained by the availability of coincident cloud observations, limiting the ability to establish direct linkages between specific aerosol populations and cloud microphysical responses.
These limitations highlight critical, actionable priorities for future work to achieve process-level closure on aerosol-cloud interactions. The next generation of field studies should move beyond characterization toward targeted, hypothesis-driven experiments. For example, using advanced chemical analyses to constrain source contributions and mixing state, especially for cluster 3-influenced aerosol particles. Extending observations beyond the summer period would capture seasonal shifts in: (a) marine biogenic emissions (DMS-derived sulfate), (b) photochemical processing rates affecting secondary aerosol formation, (c) boundary layer depth and mixing dynamics, and (d) synoptic transport patterns influencing the frequency of each air-mass regime. Winter observations could reveal how reduced photochemistry and shallower boundary layers alter the vertical structure of CCN and their activation characteristics. Finally, the cluster-stratified CCN profiles demonstrated here offer a valuable dataset for evaluating how well regional and global models reproduce: (a) the magnitude of CCN differences among marine, coastal recirculation, and urban-transported regimes, (b) the vertical structure of CCN within and above the boundary layer, and (c) the supersaturation dependence (spread ratio) as a proxy for size distribution and composition representation. Such comparisons could identify specific model deficiencies in aerosol emission inventories, microphysical process parameterizations, or transport/mixing schemes.
The datasets presented in this article are available upon registration at the ARM Data Discovery (https://adc.arm.gov/discovery/#/, last access: 27 January 2026). The cloud condensation nuclei concentrations estimated in this study are available from the corresponding author upon reasonable request by contacting Fan Mei (fan.mei@pnnl.gov). They are also undergoing data ingestion at the Atmospheric Radiation Measurement Data Center and will be publicly accessible upon completion. In the interim, these data are available from the corresponding author upon reasonable request by contacting Fan Mei (fan.mei@pnnl.gov). The NEXRAD data can be requested by contacting Michael Jensen (mjensen@bnl.gov). NEXRAD Level II radar data are publicly available through the Unidata Amazon Web Services (AWS) S3 archive (https://doi.org/10.7289/V5W9574V; NOAA National Weather Service (NWS) Radar Operations Center, 1991) with anonymous access. In this study, data were programmatically retrieved using a Python interface to the NEXRAD Level II archive by querying scans for a given radar site (e.g., KHGX, Houston, TX) over specified UTC time ranges, and the resulting file URLs were used for subsequent processing and analysis.
The supplement related to this article is available online at https://doi.org/10.5194/acp-26-13885-2026-supplement.
FM and JW conceptualized the TBS study. BS secured financial support for the project that led to this publication. FM, GWV, and NNL formally analyzed the data and provided the figures. FM, MPJ, BC, SDB, DZ and DD participated in the field campaign and data collection. FM, JW, IS, NNL, GWV, ZC, and SC interpreted the results. FM wrote the initial draft of the paper. FM, JW, IS, NNL, GWV, JL, BC, SDB, MJP, MD, ZC, SC, and DZ proofread and edited the paper.
The contact author has declared that none of the authors has any competing interests.
Publisher's note: Copernicus Publications remains neutral with regard to jurisdictional claims made in the text, published maps, institutional affiliations, or any other geographical representation in this paper. The authors bear the ultimate responsibility for providing appropriate place names. Views expressed in the text are those of the authors and do not necessarily reflect the views of the publisher.
This research was supported by the ARM user facility, a US DOE Office of Science user facility managed by the Biological and Environmental Research (BER) program. A portion of this research was performed under project awards (https://doi.org/10.46936/lser.proj.2020.51377/60000185 and https://doi.org/10.46936/expl.proj.2021.60186/60008210) as user projects at the Environmental Molecular Sciences Laboratory (EMSL). Battelle operates the Pacific Northwest National Laboratory (PNNL) for the DOE under contract DE-AC05-76RL01830 to support both EMSL and ARM user facilities. Sarah D. Brooks and Bo Chen were supported by the Department of Energy Atmospheric System Research (ASR) program grant DE-SC0021047 for data collection and analysis, and by the ARM field campaigns AFC07023 and AFC07065. Contributions from Michael P. Jensen were supported by the ASR program under the Process-level AdvancementS of Coupled Cloud and Aerosol LifecycleS (PASCCALS) Science Focus Area through DOE Contract No. DE-SC0012704. Jian Wang acknowledges support by the Atmospheric System Research (ASR) program of the U.S. Department of Energy (DOE) under Award No. DE-SC0021017. We acknowledge the use of AI Incubator (including ChatGPT 5.4, Claude-opus-4-6-v1, and gemini-2.5-pro) to assist in refining the language used in this document. Authors also want to express their sincere gratitude for Jerome Fast's contributions to help shape this work.
This research has been supported by the Biological and Environmental Research (grant nos. DE-AC05-76RL01830, DE-SC0021017, and DE-SC0021047).
This paper was edited by Birgit Wehner and reviewed by two anonymous referees.
Ajayi, T., Choi, Y., Crosbie, E. C., DiGangi, J. P., Diskin, G. S., Fenn, M. A., Ferrare, R. A., Hair, J. W., Hilario, M. R. A., Hostetler, C. A., Kirschler, S., Moore, R. H., Shingler, T. J., Shook, M. A., Soloff, C., Thornhill, K. L., Voigt, C., Winstead, E. L., Ziemba, L. D., and Sorooshian, A.: Vertical variability of aerosol properties and trace gases over a remote marine region: a case study over Bermuda, Atmos. Chem. Phys., 24, 9197–9218, https://doi.org/10.5194/acp-24-9197-2024, 2024.
Anderson, B. E., Grant, W. B., Gregory, G. L., Browell, E. V., Collins Jr., J. E., Sachse, G. W., Bagwell, D. R., Hudgins, C. H., Blake, D. R., and Blake, N. J.: Aerosols from biomass burning over the tropical South Atlantic region: Distributions and impacts, J. Geophys. Res.-Atmos., 101, 24117–24137, https://doi.org/10.1029/96JD00717, 1996.
Andreae, M. O., Jones, C. D., and Cox, P. M.: Strong present-day aerosol cooling implies a hot future, Nature, 435, 1187–1190, https://doi.org/10.1038/nature03671, 2005.
Ansmann, A. and Müller, D.: Lidar and Atmospheric Aerosol Particles, in: Lidar: Range-Resolved Optical Remote Sensing of the Atmosphere, edited by: Weitkamp, C., Springer New York, New York, NY, 105–141, ISBN 0-387-40075-3, 2005.
Ansmann, A., Seifert, P., Tesche, M., and Wandinger, U.: Profiling of fine and coarse particle mass: case studies of Saharan dust and Eyjafjallajökull/Grimsvötn volcanic plumes, Atmos. Chem. Phys., 12, 9399–9415, https://doi.org/10.5194/acp-12-9399-2012, 2012.
Brady, J. M., Stokes, M. D., Bonnardel, J., and Bertram, T. H.: Characterization of a Quadrotor Unmanned Aircraft System for Aerosol-Particle-Concentration Measurements, Environ. Sci. Technol., 50, 1376–1383, https://doi.org/10.1021/acs.est.5b05320, 2016.
Burton, S. P., Ferrare, R. A., Hostetler, C. A., Hair, J. W., Rogers, R. R., Obland, M. D., Butler, C. F., Cook, A. L., Harper, D. B., and Froyd, K. D.: Aerosol classification using airborne High Spectral Resolution Lidar measurements – methodology and examples, Atmos. Meas. Tech., 5, 73–98, https://doi.org/10.5194/amt-5-73-2012, 2012.
Cadeddu, M. P., Liljegren, J. C., and Turner, D. D.: The Atmospheric radiation measurement (ARM) program network of microwave radiometers: instrumentation, data, and retrievals, Atmos. Meas. Tech., 6, 2359–2372, https://doi.org/10.5194/amt-6-2359-2013, 2013.
Chen, B., Thompson, S. A., Matthews, B. H., Sharma, M., Li, R., Nowotarski, C. J., Rapp, A. D., and Brooks, S. D.: A new technique to retrieve aerosol vertical profiles using micropulse lidar and ground-based aerosol measurements, Atmos. Meas. Tech., 18, 5841–5859, https://doi.org/10.5194/amt-18-5841-2025, 2025.
Cheng, Z., Liyu, A., Dexheimer, D., Lata, N. N., Kulkarni, G., Longbottom, C. M., Mei, F., and China, S.: An automated size and time-resolved aerosol collector platform integrated with environmental sensors to study the vertical profile of aerosols, Environ. Sci.-Atmos., 2, 1263–1276, 2022.
Chiliński, M. T., Markowicz, K. M., and Kubicki, M.: UAS as a Support for Atmospheric Aerosols Research: Case Study, Pure Appl. Geophys., 175, 3325–3342, https://doi.org/10.1007/s00024-018-1767-3, 2018.
Corrigan, C. E., Roberts, G. C., Ramana, M. V., Kim, D., and Ramanathan, V.: Capturing vertical profiles of aerosols and black carbon over the Indian Ocean using autonomous unmanned aerial vehicles, Atmos. Chem. Phys., 8, 737–747, https://doi.org/10.5194/acp-8-737-2008, 2008.
Creamean, J. M., de Boer, G., Telg, H., Mei, F., Dexheimer, D., Shupe, M. D., Solomon, A., and McComiskey, A.: Assessing the vertical structure of Arctic aerosols using balloon-borne measurements, Atmos. Chem. Phys., 21, 1737–1757, https://doi.org/10.5194/acp-21-1737-2021, 2021.
Creamean, J. M., Dexheimer, D., Hume, C. C., Vazquez, M., Hess, B. T. M., Longbottom, C. M., Ruiz, C. A., and Theisen, A. K.: Reaching new heights: A vertically-resolved ice nucleating particle sampler operating on Atmospheric Radiation Measurement (ARM) tethered balloon systems, EGUsphere [preprint], https://doi.org/10.5194/egusphere-2025-5000, 2025.
Cromwell, E., Dexheimer, D., Shi, Y., and Whitson, G.: Meteorological Instrumentation Aboard TBS (TBSIMET), 2022-06-03 to 2022-09-14, ARM Mobile Facility (HOU), Houston, TX; Supplemental Facility 3 for ANC: Upwind Site for Summer Iop (S3), Atmospheric Radiation Measurement (ARM) User Facility [data set], https://doi.org/10.5439/1530482, last access: 22 November 2025a.
Cromwell, E., Dexheimer, D., Shi, Y., and Whitson, G.: Meteorological Instrumentation Aboard TBS (TBSIMETXQ2), 2022-06-03 to 2022-09-14, ARM Mobile Facility (HOU), Houston, TX; Supplemental Facility 3 for ANC: Upwind Site for Summer Iop (S3), Atmospheric Radiation Measurement (ARM) User Facility [data set], https://doi.org/10.5439/1483632, last access: 22 November 2025b.
Cromwell, E., Dexheimer, D., Shi, Y., and Whitson, G.: Anemometers Aboard Tethered Balloon System (TBSWIND), 2022-06-03 to 2022-09-14, ARM Mobile Facility (HOU), Houston, TX; Supplemental Facility 3 for ANC: Upwind Site for Summer Iop (S3), Atmospheric Radiation Measurement (ARM) User Facility [data set], https://doi.org/10.5439/1515075, last access: 22 November 2025c.
Dexheimer, D., Creamean, J., Gaustad, K., Longbottom, C., Cheng, Z., Sammon, J., and Mei, F.: Tethered Balloon System (TBS) Instrument Handbook, ARM Climate Research Facility, DOE Office of Science Atmospheric Radiation Measurement (ARM) Program (United States), United States, 2026.
Dmitrovic, S., Hair, J. W., Collister, B. L., Crosbie, E., Fenn, M. A., Ferrare, R. A., Harper, D. B., Hostetler, C. A., Hu, Y., Reagan, J. A., Robinson, C. E., Seaman, S. T., Shingler, T. J., Thornhill, K. L., Vömel, H., Zeng, X., and Sorooshian, A.: High Spectral Resolution Lidar – generation 2 (HSRL-2) retrievals of ocean surface wind speed: methodology and evaluation, Atmos. Meas. Tech., 17, 3515–3532, https://doi.org/10.5194/amt-17-3515-2024, 2024.
Engelhart, G. J., Moore, R. H., Nenes, A., and Pandis, S. N.: Cloud condensation nuclei activity of isoprene secondary organic aerosol, J. Geophys. Res.-Atmos., 116, https://doi.org/10.1029/2010JD014706, 2011.
Ervens, B., Turpin, B. J., and Weber, R. J.: Secondary organic aerosol formation in cloud droplets and aqueous particles (aqSOA): a review of laboratory, field and model studies, Atmos. Chem. Phys., 11, 11069–11102, https://doi.org/10.5194/acp-11-11069-2011, 2011.
Farley, R. N., Lee, J. E., Rivellini, L.-H., Lee, A. K. Y., Dal Porto, R., Cappa, C. D., Gorkowski, K., Shawon, A. S. M., Benedict, K. B., Aiken, A. C., Dubey, M. K., and Zhang, Q.: Chemical properties and single-particle mixing state of soot aerosol in Houston during the TRACER campaign, Atmos. Chem. Phys., 24, 3953–3971, https://doi.org/10.5194/acp-24-3953-2024, 2024.
Fernald, F. G.: Analysis of atmospheric lidar observations: some comments, Appl. Optics, 23, 652–653, https://doi.org/10.1364/AO.23.000652, 1984.
Ferrero, L., Cappelletti, D., Busetto, M., Mazzola, M., Lupi, A., Lanconelli, C., Becagli, S., Traversi, R., Caiazzo, L., Giardi, F., Moroni, B., Crocchianti, S., Fierz, M., Močnik, G., Sangiorgi, G., Perrone, M. G., Maturilli, M., Vitale, V., Udisti, R., and Bolzacchini, E.: Vertical profiles of aerosol and black carbon in the Arctic: a seasonal phenomenology along 2 years (2011–2012) of field campaigns, Atmos. Chem. Phys., 16, 12601–12629, https://doi.org/10.5194/acp-16-12601-2016, 2016.
Fröhlich, R., Cubison, M. J., Slowik, J. G., Bukowiecki, N., Prévôt, A. S. H., Baltensperger, U., Schneider, J., Kimmel, J. R., Gonin, M., Rohner, U., Worsnop, D. R., and Jayne, J. T.: The ToF-ACSM: a portable aerosol chemical speciation monitor with TOFMS detection, Atmos. Meas. Tech., 6, 3225–3241, https://doi.org/10.5194/amt-6-3225-2013, 2013.
Fuzzi, S., Baltensperger, U., Carslaw, K., Decesari, S., Denier van der Gon, H., Facchini, M. C., Fowler, D., Koren, I., Langford, B., Lohmann, U., Nemitz, E., Pandis, S., Riipinen, I., Rudich, Y., Schaap, M., Slowik, J. G., Spracklen, D. V., Vignati, E., Wild, M., Williams, M., and Gilardoni, S.: Particulate matter, air quality and climate: lessons learned and future needs, Atmos. Chem. Phys., 15, 8217–8299, https://doi.org/10.5194/acp-15-8217-2015, 2015.
Galfione, A., Battaglia, A., Oue, M., Cattani, E., and Kollias, P.: Comparison of GOES16 Data with the TRACER-ESCAPE Field Campaign Dataset for Convection Characterization: A Selection of Case Studies and Lessons Learnt, Remote Sens., 17, 2621, https://doi.org/10.3390/rs17152621, 2025.
Gautam, T., Vandergrift, G. W., Lata, N. N., Cheng, Z., Rahman, A., Minke, A., Lai, Z., Dexheimer, D. N., Zhang, D., Marcus, M. A., Zawadowicz, M. A., Kuang, C., Zhao, R., Steiner, A. L., and China, S.: Chemical Insights into the Molecular Composition of Organic Aerosols in the Urban Region of Houston, Texas, ACS ES&T Air, 1, 1304–1316, https://doi.org/10.1021/acsestair.4c00141, 2024.
Geiß, A., Wiegner, M., Bonn, B., Schäfer, K., Forkel, R., von Schneidemesser, E., Münkel, C., Chan, K. L., and Nothard, R.: Mixing layer height as an indicator for urban air quality?, Atmos. Meas. Tech., 10, 2969–2988, https://doi.org/10.5194/amt-10-2969-2017, 2017.
Hair, J. W., Hostetler, C. A., Cook, A. L., Harper, D. B., Ferrare, R. A., Mack, T. L., Welch, W., Izquierdo, L. R., and Hovis, F. E.: Airborne High Spectral Resolution Lidar for profiling aerosol optical properties, Appl. Optics, 47, 6734–6752, https://doi.org/10.1364/AO.47.006734, 2008.
Hersbach, H., Bell, B., Berrisford, P., Hirahara, S., Horányi, A., Muñoz-Sabater, J., Nicolas, J., Peubey, C., Radu, R., Schepers, D., Simmons, A., Soci, C., Abdalla, S., Abellan, X., Balsamo, G., Bechtold, P., Biavati, G., Bidlot, J., Bonavita, M., De Chiara, G., Dahlgren, P., Dee, D., Diamantakis, M., Dragani, R., Flemming, J., Forbes, R., Fuentes, M., Geer, A., Haimberger, L., Healy, S., Hogan, R. J., Hólm, E., Janisková, M., Keeley, S., Laloyaux, P., Lopez, P., Lupu, C., Radnoti, G., de Rosnay, P., Rozum, I., Vamborg, F., Villaume, S., and Thépaut, J.-N.: The ERA5 global reanalysis, Q. J. Roy. Meteor. Soc., 146, 1999–2049, https://doi.org/10.1002/qj.3803, 2020.
Huang, R.-J., Zhang, Y., Bozzetti, C., Ho, K.-F., Cao, J.-J., Han, Y., Daellenbach, K. R., Slowik, J. G., Platt, S. M., Canonaco, F., Zotter, P., Wolf, R., Pieber, S. M., Bruns, E. A., Crippa, M., Ciarelli, G., Piazzalunga, A., Schwikowski, M., Abbaszade, G., Schnelle-Kreis, J., Zimmermann, R., An, Z., Szidat, S., Baltensperger, U., Haddad, I. E., and Prévôt, A. S. H.: High secondary aerosol contribution to particulate pollution during haze events in China, Nature, 514, 218–222, https://doi.org/10.1038/nature13774, 2014.
Huffman, J. A., Docherty, K. S., Mohr, C., Cubison, M. J., Ulbrich, I. M., Ziemann, P. J., Onasch, T. B., and Jimenez, J. L.: Chemically-Resolved Volatility Measurements of Organic Aerosol from Different Sources, Environ. Sci. Technol., 43, 5351–5357, https://doi.org/10.1021/es803539d, 2009.
Hussein, T., Dal Maso, M., Petäjä, T., Koponen, I. K., Paatero, P., Aalto, P. P., Hämeri, K., and Kulmala, M.: Evaluation of an automatic algorithm for fitting the particle number size distributions, Boreal Environ. Res., 10, 337, https://doi.org/10.60910/gkzd-jt7v, 2005.
Jensen, M. P., Flynn, J. H., Kollias, P., Kuang, C., McFarquhar, G., Powers, H., Brooks, S., Bruning, E., Collins, D., Collis, S. M., Fan, J., Fridlind, A., Giangrande, S. E., Griffin, R., Hu, J., Jackson, R. C., Kumjian, M., Logan, T., Matsui, T., Nowotarski, C. J., Oue, M., Rapp, A. D., Rosenfeld, D., Ryzhkov, A., Sheesley, R., Snyder, J., Stier, P., Usenko, S., van den Heever, S. C., van Lier-Walqui, M., Varble, A., Wang, Y., Aiken, A., Deng, M., Dexheimer, D., Dubey, M., Feng, Y., Ghate, V. P., Johnson, K. L., Lamer, K., Saleeby, S. M., Wang, D., Zawadowicz, M. A., and Zhou, A.: Tracking Aerosol Convection Interactions Experiment (TRACER) Field Campaign Report, Oak Ridge National Laboratory (ORNL), Oak Ridge, TN (United States), Atmospheric Radiation Measurement (ARM) Data Center, United States, 2023.
Jensen, M. P., Flynn, J. H., Gonzalez-Cruz, J. E., Judd, L. M., Kollias, P., Kuang, C., McFarquhar, G. M., Powers, H., Ramamurthy, P., Sullivan, J., Aiken, A. C., Alvarez, S. L., Argay, P., Argrow, B., Bell, T. M., Boyer, D., Brooks, S. D., Bruning, E. C., Brunner, K., Butterworth, B., Calmer, R., Cappa, C. D., Chakrabarty, R. K., Chandrasekar, V., Chao, C.-Y., Chen, B., China, S., Collins, D. R., Collis, S. M., Crowell, S., Porto, R. D., Boer, G. d., Deng, M., Dexheimer, D., Drager, A. J., Du, X., Dubey, M. K., Dzambo, A. M., Etten-Bohm, M., Fan, J., Farley, R., Feng, Y.-C., Feng, Y., Fenn, M., Ferrare, R. E., Flusche, S., Fridlind, A. M., Galewsky, J., Gamarro, H., Gardner, S., Ghate, V. P., Giangrande, S. E., Griffin, R. J., Griggs, T., Gronoff, G. P., Grover, M., Gaugenti, M., Guo, F., Gupta, S., Hu, J., Huang, Y., Jackson, R. C., Hair, J. W., Johnson, K. L., Kasparoglu, S., Klein, P., Kotsakis, A. E., Kumar, J., Kumjian, M. R., Lamer, K., Lappin, F. M., Lei, Z., Li, J., Li, R., Li, Y., Logan, T., Lombardo, K., Luke, E. P., Mages, Z., Matthews, A. A., Matthews, B. H., Mayol-Bracero, O., Matsui, T., McKeown, K. E., Mehra, M., Mei, F., Meskidzhe, N., Nguyen, C., Nielsen, E. R., Nowotarski, C. J., Oaks, D., Oktem, R., Oue, M., Park, J. M., Partida, N., Patil, S., Pena, J. C., Petters, M. D., Phoenix, D. B., Puthserry, J. V., Rapp, A. D., Romps, D. M., Roots, M., Rosenfeld, D., Saleeby, S. M., Savala, P., Sedlacek, A. J., Sharma, M., Sheesley, R., Shingler, T. J., Shrestha, S., Singh, A., Smith, E. N., Smith, J. N., Smith, S., Snyder, J., Spicer, E., Spinei, E., Spychala, M., Steir, P., Storm, M. R., Subba, T., Treserras, B. P., Trojanowski, R., Theisen, A., Thompson, S. A., Twigg, L., Uin, J., Ulinski, A. R., van den Heever, S., van Lier-Walqui, M., Varble, A. C., Wagner, T. J., Wakeen, J., Wales, N. A., Walter, P. J., Wang, D., Wang, J., Wood, L., Wang, Y., Wolde, M., Yoon, S., Young, M. H., Zawadowicz, M. A., Zhang, Q., Zhou, A., Zhu, Z., and Zhu, Z.: Studying Aerosol, Clouds, and Air Quality in the Coastal Urban Environment of Southeastern Texas, B. Am. Meteorol. Soc., online, BAMS–D–23–0331.0331, https://doi.org/10.1175/BAMS-D-23-0331.1, 2025.
Jolliffe, I. T. and Cadima, J.: Principal component analysis: a review and recent developments, Philos. T. R. Soc. A, 374, https://doi.org/10.1098/rsta.2015.0202, 2016.
Kezoudi, M., Papetta, A., Kandler, K., Ryder, C. L., Leonidou, A., Keleshis, C., Stopford, C., Thornberry, T., Mamouri, R.-E., Sciare, J., and Marenco, F.: Microphysical and Compositional Differences Between Saharan and Middle Eastern Dust Revealed by UAS Observations, Atmos. Chem. Phys., 26, 7361–7385, https://doi.org/10.5194/acp-26-7361-2026, 2026.
Klett, J. D.: Stable analytical inversion solution for processing lidar returns, Appl. Optics, 20, 211–220, https://doi.org/10.1364/AO.20.000211, 1981.
Kyrouac, J., Shi, Y., and Tuftedal, M.: Surface Meteorological Instrumentation (MET), 2022-05-12 to 2022-10-01, ARM Mobile Facility (HOU), Houston, TX; Supplemental Facility 3 for ANC: Upwind Site for Summer Iop (S3), Atmospheric Radiation Measurement (ARM) User Facility [data set], https://doi.org/10.5439/1786358, last access: 22 November 2025.
Lata, N. N., Cheng, Z., Dexheimer, D., Zhang, D., Mei, F., and China, S.: Vertical Gradient of Size-Resolved Aerosol Compositions over the Arctic Reveals Cloud Processed Aerosol in-Cloud and above Cloud, Environ. Sci. Technol., 57, 5821–5830, https://doi.org/10.1021/acs.est.2c09498, 2023.
Lata, N. N., Cheng, Z., Dexheimer, D., Mathai, S., Marcus, M. A., Pratt, K. A., Thevuthasan, T., Mei, F., and China, S.: Vertical gradient in atmospheric particle phase state: a case study over the alaskan arctic oil fields, Environ. Sci.-Atmos., 5, 415–428, https://doi.org/10.1039/D4EA00150H, 2025.
Li, H., Liu, B., Ma, X., Jin, S., Ma, Y., Zhao, Y., and Gong, W.: Evaluation of retrieval methods for planetary boundary layer height based on radiosonde data, Atmos. Meas. Tech., 14, 5977–5986, https://doi.org/10.5194/amt-14-5977-2021, 2021.
Li, J., Zhang, J., Gong, X., Spielman, S., Kuang, C., Singh, A., Zawadowicz, M. A., Xu, L., and Wang, J.: The sources and diurnal variations of submicron aerosols in a coastal–rural environment near Houston, US, Atmos. Chem. Phys., 25, 13975–13993, https://doi.org/10.5194/acp-25-13975-2025, 2025.
Liu, S. and Liang, X.-Z.: Observed Diurnal Cycle Climatology of Planetary Boundary Layer Height, J. Climate, 23, 5790–5809, https://doi.org/10.1175/2010JCLI3552.1, 2010.
Lohmann, U. and Feichter, J.: Impact of sulfate aerosols on albedo and lifetime of clouds: A sensitivity study with the ECHAM4 GCM, J. Geophys. Res.-Atmos., 102, 13685–13700, https://doi.org/10.1029/97JD00631, 1997.
Lohmann, U. and Hoose, C.: Sensitivity studies of different aerosol indirect effects in mixed-phase clouds, Atmos. Chem. Phys., 9, 8917–8934, https://doi.org/10.5194/acp-9-8917-2009, 2009.
Mei, F., Wang, J., Comstock, J. M., Weigel, R., Krämer, M., Mahnke, C., Shilling, J. E., Schneider, J., Schulz, C., Long, C. N., Wendisch, M., Machado, L. A. T., Schmid, B., Krisna, T., Pekour, M., Hubbe, J., Giez, A., Weinzierl, B., Zoeger, M., Pöhlker, M. L., Schlager, H., Cecchini, M. A., Andreae, M. O., Martin, S. T., de Sá, S. S., Fan, J., Tomlinson, J., Springston, S., Pöschl, U., Artaxo, P., Pöhlker, C., Klimach, T., Minikin, A., Afchine, A., and Borrmann, S.: Comparison of aircraft measurements during GoAmazon2014/5 and ACRIDICON-CHUVA, Atmos. Meas. Tech., 13, 661–684, https://doi.org/10.5194/amt-13-661-2020, 2020.
Mei, F., Pekour, M. S., Dexheimer, D., de Boer, G., Cook, R., Tomlinson, J., Schmid, B., Goldberger, L. A., Newsom, R., and Fast, J. D.: Observational data from uncrewed systems over Southern Great Plains, Earth Syst. Sci. Data, 14, 3423–3438, https://doi.org/10.5194/essd-14-3423-2022, 2022.
Mei, F., Wang, H., Zhu, Z., Zhang, D., Zhang, Q., Fast, J. D., Gustafson, W. I., Li, X.-Y., Schmid, B., Niedek, C., Tomlinson, J., and Flynn, C.: Bridging New Observational Capabilities and Process-Level Simulation: Insights into Aerosol Roles in the Earth System, B. Am. Meteorol. Soc., 105, E709–E724, https://doi.org/10.1175/BAMS-D-23-0110.1, 2024.
Mei, F., Zhang, Q., Zhang, D., Fast, J. D., Kulkarni, G., Pekour, M. S., Niedek, C. R., Glienke, S., Silber, I., Schmid, B., Tomlinson, J. M., Mehta, H. S., Mansoura, X., Cheng, Z., Vandergrift, G. W., Lata, N. N., China, S., and Zhu, Z.: Measurement report: Vertically resolved atmospheric properties observed over the Southern Great Plains with the ArcticShark uncrewed aerial system, Atmos. Chem. Phys., 25, 3425–3444, https://doi.org/10.5194/acp-25-3425-2025, 2025a.
Mei, F., Stephenson, J., and Pekour, M.: Portable Optical Particle Spectrometer Aboard Tethered Balloon System (TBSPOPS), 2022-06-03 to 2022-09-14, ARM Mobile Facility (HOU), Houston, TX; Supplemental Facility 3 for ANC: Upwind Site for Summer Iop (S3), Atmospheric Radiation Measurement (ARM) User Facility [data set], https://doi.org/10.5439/1827703, last access: 22 November 2025b.
Mei, F., Stephenson, J., and Pekour, M.: Condensation Particle Counter Aboard Tethered Balloon System (TBSCPC), 2022-06-03 to 2022-09-14, ARM Mobile Facility (HOU), Houston, TX; Supplemental Facility 3 for ANC: Upwind Site for Summer Iop (S3), Atmospheric Radiation Measurement (ARM) User Facility [data set], https://doi.org/10.5439/1582131, last access: 22 November 2025c.
Mushtaq, Z., Sharma, M., Bangotra, P., Gautam, A. S., and Gautam, S.: Atmospheric Aerosols: Some Highlights and Highlighters, Past to Recent Years, Aerosol Sci. Eng., 6, 135–145, https://doi.org/10.1007/s41810-022-00133-w, 2022.
NOAA National Weather Service (NWS) Radar Operations Center: NOAA Next Generation Radar (NEXRAD) Level 2 Base Data, NOAA National Centers for Environmental Information, https://doi.org/10.7289/V5W9574V (last access: 22 April 2026), 1991.
Ramanathan, V., Crutzen, P. J., Lelieveld, J., Mitra, A. P., Althausen, D., Anderson, J., Andreae, M. O., Cantrell, W., Cass, G. R., Chung, C. E., Clarke, A. D., Coakley, J. A., Collins, W. D., Conant, W. C., Dulac, F., Heintzenberg, J., Heymsfield, A. J., Holben, B., Howell, S., Hudson, J., Jayaraman, A., Kiehl, J. T., Krishnamurti, T. N., Lubin, D., McFarquhar, G., Novakov, T., Ogren, J. A., Podgorny, I. A., Prather, K., Priestley, K., Prospero, J. M., Quinn, P. K., Rajeev, K., Rasch, P., Rupert, S., Sadourny, R., Satheesh, S. K., Shaw, G. E., Sheridan, P., and Valero, F. P. J.: Indian Ocean Experiment: An integrated analysis of the climate forcing and effects of the great Indo-Asian haze, J. Geophys. Res.-Atmos., 106, 28371–28398, https://doi.org/10.1029/2001JD900133, 2001.
Rapp, A. D., Brooks, S. D., Nowotarski, C. J., Sharma, M., Thompson, S. A., Chen, B., Matthews, B. H., Etten-Bohm, M., Nielsen, E. R., and Li, R.: TAMU TRACER: Targeted Mobile Measurements to Isolate the Impacts of Aerosols and Meteorology on Deep Convection, B. Am. Meteorol. Soc., 105, E1685–E1702, https://doi.org/10.1175/BAMS-D-23-0218.1, 2024.
Ren, J., Xu, W., Huang, R.-J., Zhang, F., Wang, Y., Chen, L., Ovadnevaite, J., Ceburnis, D., O'Dowd, C., and Sun, Y.: Contrasting aerosol mixing states at inland and coastal sites: an entropy-based metric for CCN activity, Atmos. Chem. Phys., 26, 2985–3000, https://doi.org/10.5194/acp-26-2985-2026, 2026.
Roach, P. J., Laskin, J., and Laskin, A.: Molecular Characterization of Organic Aerosols Using Nanospray-Desorption/Electrospray Ionization-Mass Spectrometry, Anal. Chem., 82, 7979–7986, https://doi.org/10.1021/ac101449p, 2010.
Rosenfeld, D., Andreae, M. O., Asmi, A., Chin, M., de Leeuw, G., Donovan, D. P., Kahn, R., Kinne, S., Kivekäs, N., Kulmala, M., Lau, W., Schmidt, K. S., Suni, T., Wagner, T., Wild, M., and Quaas, J.: Global observations of aerosol-cloud-precipitation-climate interactions, Rev. Geophys., 52, 750–808, https://doi.org/10.1002/2013RG000441, 2014.
Rosenfeld, D., Zhu, Y., Wang, M., Zheng, Y., Goren, T., and Yu, S.: Aerosol-driven droplet concentrations dominate coverage and water of oceanic low-level clouds, Science, 363, eaav0566, https://doi.org/10.1126/science.aav0566, 2019.
Schmale, J., Henning, S., Henzing, B., Keskinen, H., Sellegri, K., Ovadnevaite, J., Bougiatioti, A., Kalivitis, N., Stavroulas, I., Jefferson, A., Park, M., Schlag, P., Kristensson, A., Iwamoto, Y., Pringle, K., Reddington, C., Aalto, P., Äijälä, M., Baltensperger, U., Bialek, J., Birmili, W., Bukowiecki, N., Ehn, M., Fjæraa, A. M., Fiebig, M., Frank, G., Fröhlich, R., Frumau, A., Furuya, M., Hammer, E., Heikkinen, L., Herrmann, E., Holzinger, R., Hyono, H., Kanakidou, M., Kiendler-Scharr, A., Kinouchi, K., Kos, G., Kulmala, M., Mihalopoulos, N., Motos, G., Nenes, A., O'Dowd, C., Paramonov, M., Petäjä, T., Picard, D., Poulain, L., Prévôt, A. S. H., Slowik, J., Sonntag, A., Swietlicki, E., Svenningsson, B., Tsurumaru, H., Wiedensohler, A., Wittbom, C., Ogren, J. A., Matsuki, A., Yum, S. S., Myhre, C. L., Carslaw, K., Stratmann, F., and Gysel, M.: Collocated observations of cloud condensation nuclei, particle size distributions, and chemical composition, Sci. Data, 4, 170003, https://doi.org/10.1038/sdata.2017.3, 2017.
Schulze, B. C., Charan, S. M., Kenseth, C. M., Kong, W., Bates, K. H., Williams, W., Metcalf, A. R., Jonsson, H. H., Woods, R., Sorooshian, A., Flagan, R. C., and Seinfeld, J. H.: Characterization of Aerosol Hygroscopicity Over the Northeast Pacific Ocean: Impacts on Prediction of CCN and Stratocumulus Cloud Droplet Number Concentrations, Earth Space Sci., 7, e2020EA001098, https://doi.org/10.1029/2020EA001098, 2020.
Seidel, D. J., Ao, C. O., and Li, K.: Estimating climatological planetary boundary layer heights from radiosonde observations: Comparison of methods and uncertainty analysis, J. Geophys. Res.-Atmos., 115, https://doi.org/10.1029/2009JD013680, 2010.
Seinfeld, J. H. and Pandis, S. N.: Atmospheric chemistry and physics: from air pollution to climate change, John Wiley & Sons, ISBN 978-1-118-94740-1, 2016.
Silber, I., Comstock, J. M., Kieburtz, M. R., Gaustad, K. L., and Mei, F.: ARM Trajectories Data Set Value-Added Product Report, Oak Ridge National Laboratory (ORNL), Oak Ridge, TN (United States). Atmospheric Radiation Measurement (ARM) Data Center, United States, 2025a.
Silber, I., Comstock, J. M., Kieburtz, M. R., and Russell, L. M.: ARMTRAJ: a set of multipurpose trajectory datasets augmenting the Atmospheric Radiation Measurement (ARM) user facility measurements, Earth Syst. Sci. Data, 17, 29–42, https://doi.org/10.5194/essd-17-29-2025, 2025b.
Sivaraman, C., McFarlane, S., Dong, X., and Xi, B.: Planetary Boundary Layer (PBL) Height Value Added Product Technical Report, U.S. Department of Energy, Office of Science, Biological and Environmental Research, DOE/SC-ARM-TR-132, https://www.osti.gov/servlets/purl/1808688 (last access: 27 January 2026), 2013.
Stein, A. F., Draxler, R. R., Rolph, G. D., Stunder, B. J. B., Cohen, M. D., and Ngan, F.: NOAA's HYSPLIT Atmospheric Transport and Dispersion Modeling System, B. Am. Meteorol. Soc., 96, 2059–2077, https://doi.org/10.1175/BAMS-D-14-00110.1, 2015.
Stull, R. B.: An introduction to boundary layer meteorology, Springer Science & Business Media, https://doi.org/10.1007/978-94-009-3027-8, 2012.
Thompson, S. A., Chen, B., Matthews, B. H., Li, R., Nowotarski, C. J., Rapp, A. D., and Brooks, S. D.: Characterizing Greater Houston's Aerosol by Air Mass During TRACER, J. Geophys. Res.-Atmos., 130, e2025JD043353, https://doi.org/10.1029/2025JD043353, 2025a.
Thompson, S. A., Peña, T. A., Chen, B., Sharma, M., Matthews, B. H., Li, R., Nowotarski, C. J., Rapp, A. D., and Brooks, S. D.: Variability in Ice Nucleating Particles Across Greater Houston Texas, J. Geophys. Res.-Atmos., 130, e2025JD044164, https://doi.org/10.1029/2025JD044164, 2025b.
Tsimpidi, A. P., Scholz, S. M. C., Milousis, A., Mihalopoulos, N., and Karydis, V. A.: Aerosol composition trends during 2000–2020: in-depth insights from model predictions and multiple worldwide near-surface observation datasets, Atmos. Chem. Phys., 25, 10183–10213, https://doi.org/10.5194/acp-25-10183-2025, 2025.
Turner, D. D., Clough, S. A., Liljegren, J. C., Clothiaux, E. E., Cady-Pereira, K. E., and Gaustad, K. L.: Retrieving Liquid Wat0er Path and Precipitable Water Vapor From the Atmospheric Radiation Measurement (ARM) Microwave Radiometers, IEEE T. Geosci. Remote, 45, 3680–3690, https://doi.org/10.1109/TGRS.2007.903703, 2007.
Twomey, S.: The Influence of Pollution on the Shortwave Albedo of Clouds, J. Atmos. Sci., 34, 1149–1152, https://doi.org/10.1175/1520-0469(1977)034<1149:TIOPOT>2.0.CO;2, 1977.
Vandergrift, G. W., Shawon, A. S. M., Dexheimer, D. N., Zawadowicz, M. A., Mei, F., and China, S.: Molecular Characterization of Organosulfate-Dominated Aerosols over Agricultural Fields from the Southern Great Plains by High-Resolution Mass Spectrometry, ACS Earth Space Chem., 6, 1733–1741, https://doi.org/10.1021/acsearthspacechem.2c00043, 2022.
Vandergrift, G. W., Dexheimer, D. N., Zhang, D., Cheng, Z., Lata, N. N., Rogers, M. M., Shrivastava, M., Zhang, J., Gaudet, B. J., Mei, F., and China, S.: Tethered balloon system and High-Resolution Mass Spectrometry Reveal Increased Organonitrates Aloft Compared to the Ground Level, Environ. Sci. Technol., 58, 10060–10071, https://doi.org/10.1021/acs.est.4c02090, 2024.
Wang, D., Kobrosly, R., Zhang, T., Subba, T., van den Heever, S., Gupta, S., and Jensen, M.: Aerosol impacts on isolated deep convection: findings from TRACER, Atmos. Chem. Phys., 25, 9295–9314, https://doi.org/10.5194/acp-25-9295-2025, 2025.
Zawadowicz, M., Howie, J., Shilling, J., and Levin, M.: ACSM, Corrected for Composition-Dependent Collection Efficiency (ACSMCDCE), 2022-05-28 to 2022-09-29, ARM Mobile Facility (HOU), Houston, TX; Supplemental Facility 3 for ANC: Upwind Site for Summer Iop (S3), Atmospheric Radiation Measurement (ARM) User Facility [data set], https://doi.org/10.5439/1763029, last access: 22 November 2025.
Zhang, R., Zhang, D., Mei, F., Mehra, M., Cai, J., Yu, H., Satheesh, A. R., Carillo-Cardenas, G., Hallar, A. G., Meskhidze, N., and Wang, Y.: Investigating Ultrafine Aerosol Turbulent Fluxes during Atmospheric New Particle Formation Events, Environ. Sci. Technol., 60, 19984–19998, https://doi.org/10.1021/acs.est.6c06924, 2026.