
the Creative Commons Attribution 4.0 License.
the Creative Commons Attribution 4.0 License.
 | 02 Oct 2026
The impact of orography on the troposphere-to-stratosphere transport during a typhoon event in the tropics
Massimo Martina

Anahí Villalba-Pradas
Šimon Bartoň
Stratosphere-troposphere exchange (STE) plays a fundamental role in the global atmospheric budget of chemical constituents. The troposphere-to-stratosphere transport (TST), as a part of STE, can inject anthropogenic pollutants from the Earth’s surface into the stratosphere, changing its chemical composition and influencing radiative processes. On record, TST is a multi-scale process with various contributing mechanisms, often not fully qualified nor quantified. In the tropics, typhoons and the corresponding overshooting convection and updrafts have recently been highlighted as one of the TST mechanisms, contributing for instance to the moistening of the lower stratosphere.
Expanding on this, our study proposes a novel mechanism for TST connected with the interaction of typhoons with orography, including modulation of typhoon updrafts and convection, orographic lifting, and orographic gravity waves. Combining a Lagrangian modeling tool with a high-resolution simulation of the landfall of typhoon Molave (2020) in the Philippines, our results show that the presence of orography enhances the transport of air from the planetary boundary layer to the upper troposphere–lower stratosphere (UTLS) region. The presented findings advance our understanding of tropical cyclones impacts on STE and may have significant implications for the long-range atmospheric transport of pollutants originating from tropics.
- Article
(6447 KB) - Full-text XML
-
Supplement
(1836 KB) - BibTeX
- EndNote


Atmospheric composition and the chemical and physical processes that control it are central to two environmental issues of highest importance to society: climate change and air quality. Prominently, the stratosphere-troposphere exchange (STE; e.g., Holton et al., 1995) couples the troposphere and the stratosphere dynamically, and affects the global budget of chemical constituents and hence, the radiative processes in the atmosphere. For example, water vapor (Forster and Shine, 2002) and aerosols (Solomon et al., 2011) are transported to the stratosphere in the troposphere-to-stratosphere transport (TST) pathway, while the inverse way, the stratosphere-to-troposphere transport, injects ozone-rich stratospheric air into the troposphere harming human health and ecosystems (Archibald et al., 2020). In both pathways, the exchange of air can include also the boundary layer (Wernli and Bourqui, 2002), for which ample evidence exists from models and observations (Orbe et al., 2015).
The exact role of different co-occurring dynamical processes driving STE has not been fully disentangled yet. STE is by nature a multiscale phenomenon in both space and time dimensions. The spatial scales involved range from the planetary scale upwelling of the residual mean circulation in the deep tropics (Holton and Gettelman, 2001), regional synoptic scale phenomena like baroclinic wave breaking (Bourqui, 2006), tropopause folds and horizontal confinement within anticyclones (Legras and Bucci, 2020), to the gravity wave breaking (GWs; Kunkel et al., 2014), overshooting convection at the mesoscales (Dessler and Sherwood, 2004) and down to the turbulence (Söder et al., 2021). All the scales contribute significantly and often in concordance.
In the tropics, STE impacts for instance the H2O and ozone budgets (Venkat Ratnam et al., 2016) and hence the radiative balance of the atmosphere. Based on our current understanding, it is estimated that 10 %–15 % of the global lower stratosphere H2O budget can be associated with overshooting convection in the tropics (Dauhut and Hohenegger, 2022; Tinney and Homeyer, 2021; Ueyama et al., 2023) and from this, approximately 15 % of overshooting convection occurs in TCs (Jiang and Tao, 2014; Romps and Kuang, 2009). Particularly, pronounced moistening of the lower stratospheric air above the center of TCs have been reported (Jiang et al., 2020) together with a downward flux of ozone within the eye of the cyclone (Das et al., 2016). Gordon and Homeyer (2025) have recently investigated the STE processes in tropical cyclones (TCs) and highlighted the uncertainty connected with a still incomplete understanding of this complex process. Therefore, it is imperative to investigate this understudied STE mechanism as the accurate representation of the H2O budget is an important goal for earth system models.
Typhoons are the strongest manifestation of tropical cyclones, being one of the most intense storms on Earth. According to the definition reported in the review paper by Emanuel (2003), typhoons are tropical cyclones characterized by a maximum wind speed of at least 33 m s−1. They can directly affect an area with a radius of between 100 and 1000 km from their centres, where the wind speed is significantly above typical tropical background values. However, the typhoon influence extends further when considering its impact on the large-scale atmospheric circulation pattern. In the vertical, deep convection within typhoons extends across the entire troposphere and often overshoots to the lower stratosphere, making convection a clear candidate for a prime mechanism driving STE within typhoons (Gordon and Homeyer, 2025).
Here we suggest additional dynamical mechanism stemming from the interaction of typhoons with orography, which can jointly act with convection to enhance STE during typhoons. Orography and orographic GWs (OGWs) are already known to influence the distribution (Cohen and Boos, 2017) and initiation of precipitation and convection (Nicolas and Boos, 2022), particularly during the tropical cyclone events above regions with significant orography (Smith et al., 2009; Tang et al., 2012). However, the orography-induced influence on STE in connection with typhoons has not received much attention yet.
Tropical cyclones are locally characterized by stable stratification and strong winds (Houze Jr., 2010), hence enabling generation and upward propagation of OGWs. Indeed, OGWs have been detected in balloon observations in the equatorial lower stratosphere, although less frequently than convective GWs (Jewtoukoff et al., 2013). The role of GWs for STE in the extratropics is well documented from models and observations (Moustaoui et al., 1999; Kunkel et al., 2014, 2019), but in the tropics this potential mechanism is vastly underexplored.
Our manuscript provides model-based evidence for the joint influence of typhoon and orography on TST based on a detailed case study of the typhoon Molave, the 18th typhoon in 2020, during its overpass of the Philippines that is a well-documented regional pollutant hotspot. The typhoon Molave has already been highlighted to result in strong STE by Huang et al. (2024), but during its later life phases in the South China Sea, already after the crossing of the Philippines. By focusing on the exact time episode of a landfall over this domain, our study provides unique insights into how complex terrain-typhoon interactions can impact local and regional pollutant dispersion. Specifically, we address the following two research questions: (1) Can the interaction between a typhoon and orography enhance the transport of air from the boundary layer to the tropical tropopause or even the stratosphere? (2) What are the dynamical processes that contribute to this intermittent mechanism of TST in the tropics?
2.1 WRF configuration
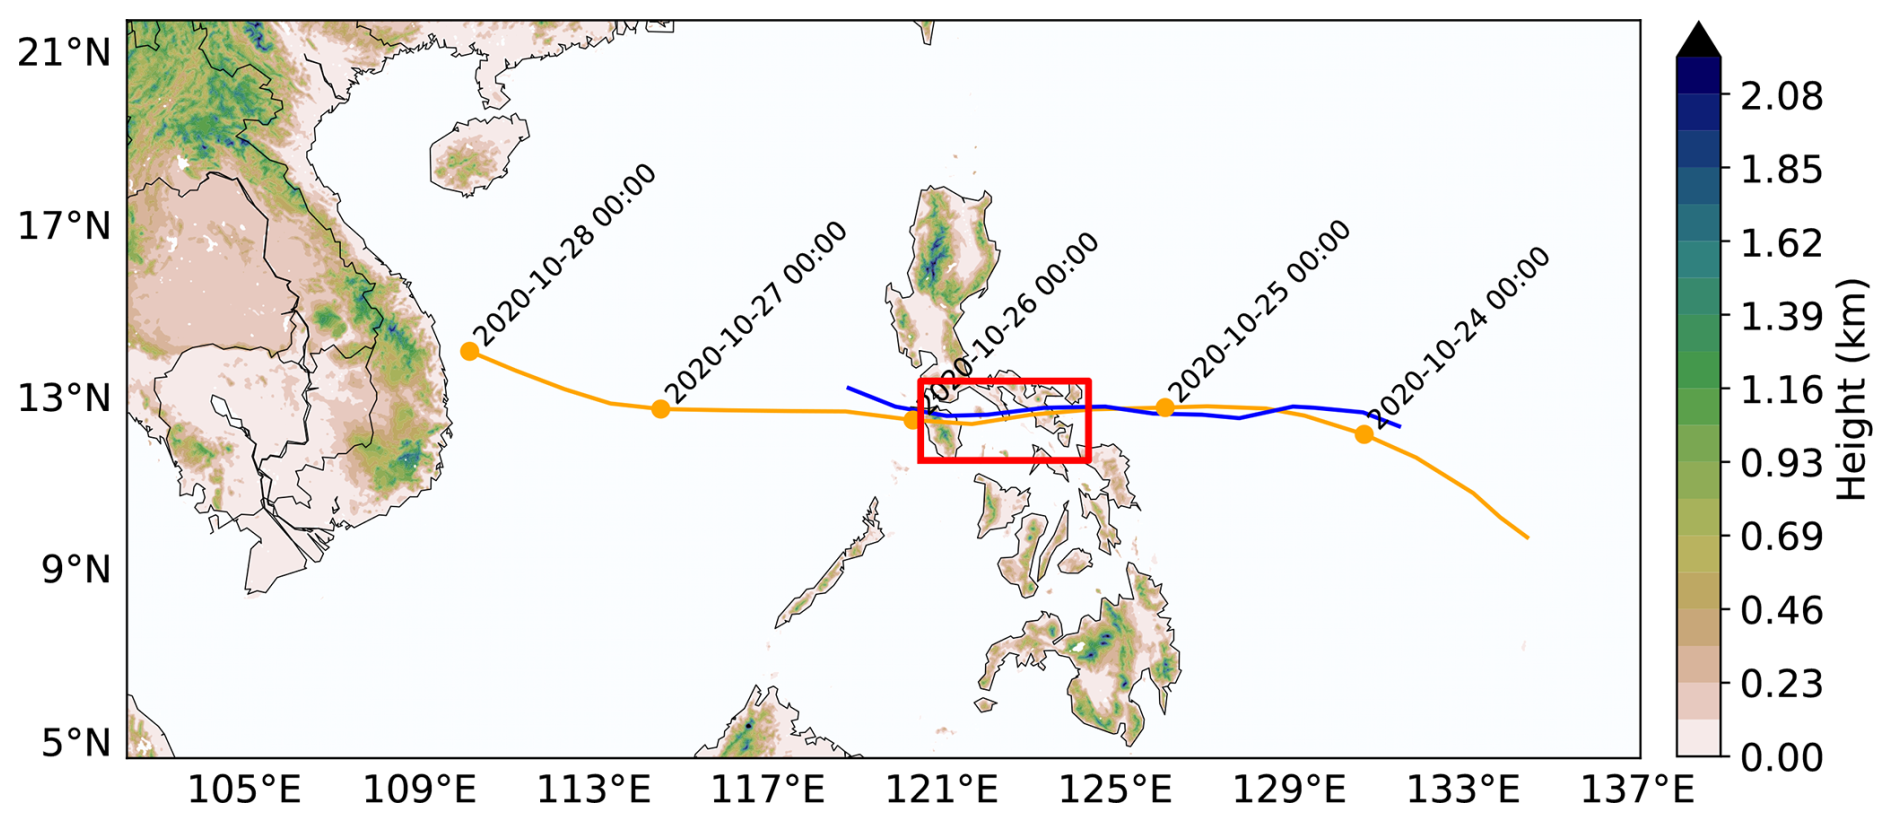
For simulating the typhoon Molave, the Weather Research and Forecasting model (WRF; Skamarock et al., 2005) version 4.1.0 was used. The model configuration follows the one described in Kruse et al. (2022), i.e., it includes 180 vertical levels extending up to 1 Pa with an upper sponge layer of 10 km. The USGS GMTED2010 30 arcsec data was used to derive the model terrain, and the ERA5 data (Hersbach et al., 2020) at 3 h provided the initial and boundary conditions of the model. The domain is centered over the Philippines, spanning a total of 1300×640 grid points with 3 km horizontal resolution (Fig. 1), without internal nudging, and a mean vertical grid spacing in the UTLS region of about 400 m. The simulated period is from 24 to 26 October 2020, using 23 October as spin-up.
Among the wide range of parameterizations that the model offers, the schemes chosen for this simulation are the one-moment Goddard scheme (Tao et al., 2016) for microphysics, the Rapid Radiative Transfer Model for general circulation models (RRTMG, Iacono et al., 2008) for the radiative transfer, the Mellor-Yamada-Janjić (Janjić, 1994) for the boundary layer processes, the Eta Model (Janić, 2001) to parameterize the surface layer, and the Noah land surface model (Chen and Dudhia, 2001) to represent land surface exchange processes. No convection scheme was used due to the horizontal resolution of the simulation sufficient for resolving it.
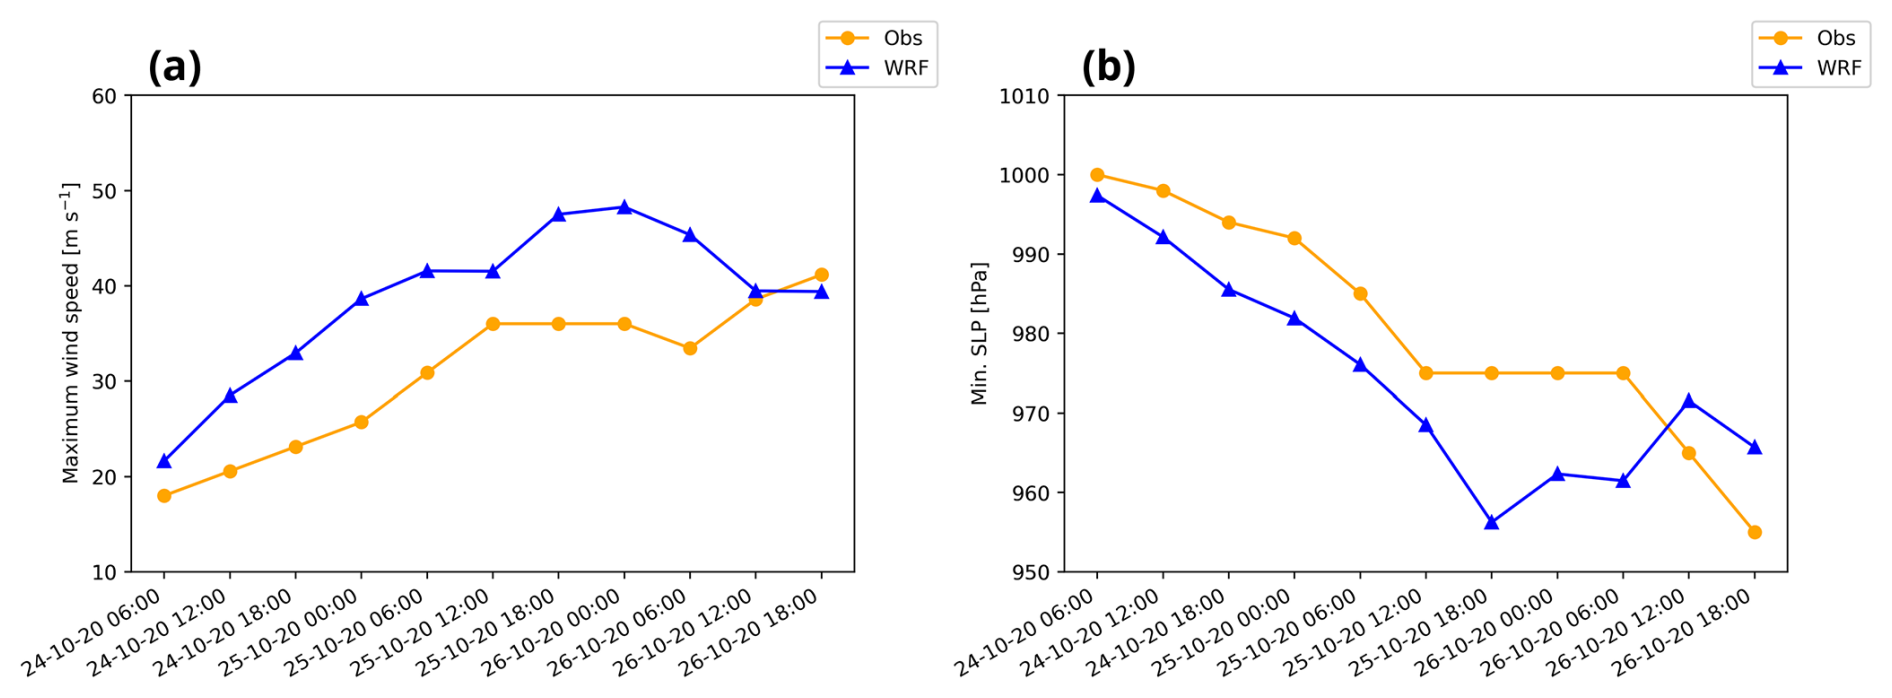
The WRF configuration used in this study successfully depicts the overall typhoon structure and evolution as can been seen from Figs. 1 and 2. As illustrated in Fig. 1, the WRF simulation accurately captures the observed typhoon track, which is a crucial requirement for correctly simulating the interaction with the Philippines orography. However, the model shows expected performance biases when considering intensity metrics, such as the maximum wind speed at 10 m above ground level (a.g.l.). and the minimum sea level pressure (SLP), consistently with previous studies about tropical cyclones using the WRF model (e.g., Srinivas et al., 2013; Lui et al., 2021). Specifically, the simulation overestimates the maximum wind speed at 10 m a.g.l. anticipating the transition from tropical storm to typhoon by approximately 12 h (occurring at 24 October 2020 at 18:00:00 UTC instead of at 25 October 2020 at 06:00:00 UTC). Conversely, the model underestimates the minimum SLP as displayed in Fig. 2b. Despite these biases in storm intensity, the model successfully captures the overall spatiotemporal behavior of the typhoon. Hence, the simulation is reliable for investigating the TST triggered by the complex interaction of the typhoon's flow field with the underlying Philippines orography.
2.2 FLEXPART-WRF configuration
The Lagrangian particle dispersion model FLEXPART-WRF (Brioude et al., 2013) is used for analyzing the typhoon-induced air parcels transport. FLEXPART-WRF is a natural evolution of the original FLEXPART model (Stohl et al., 2005; Pisso et al., 2019), enabling it to work with the WRF model data input instead of the meteorological data from the European Centre for Medium-Range Weather Forecasts (ECMWF) or the Global Forecast System (GFS). For running FLEXPART-WRF, the required meteorological variables include the 3-dimensional wind fields, temperature, specific humidity, geopotential height and pressure on WRF model levels, as well as surface fields used to parameterize the Planetary Boundary Layer (PBL) (see Table 1 in Brioude et al., 2013). To date, both FLEXPART and FLEXPART-WRF have been widely used in various atmospheric research areas, such as air pollution studies on a continental scale (Evangeliou et al., 2020; Zhu et al., 2018) to regional scale (Solomos et al., 2015; Madala et al., 2015) and also for analyses of STE (James et al., 2003; Chen et al., 2021).
The model allows computing the trajectories of a large number of “virtual” particles during the typhoon event simulated by WRF. They can represent passive tracers or each of them can carry a certain amount of the desired pollutant that can be removed from the atmosphere by three main processes: radioactive decay, wet and dry deposition (Seinfeld and Pandis, 2016). The contributions of turbulence and other subgrid scale processes to the transport are included by adding stochastic fluctuations based on the Langevin equation to the wind field.
The FLEXPART-WRF output domain is defined following the WRF projection with a resolution of 3 km. It covers approximately an area ranging from 103 to 131° E and from 5 to 20° N. Moreover, as our interest relies on the intrusions into the tropopause and the stratosphere, just 65 WRF vertical levels out of 180 were considered, with the top corresponding to a pressure level of about 25 hPa (around 25 km above the sea level).
We decided to consider an ideal source close to the Molave trajectory (Fig. 1), covering an area of approximately 4° longitude ×1.8° latitude with a vertical extension of 10 m a.g.l. A total number of 4 million passive tracers were released, starting on 24 October 2020 at 02:00:00 UTC and ending on 26 October 2020 at 22:00:00 UTC, and they were continuously emitted every internal time step (180 s).
Thanks to the high-resolution nature of the underlying WRF simulation, no convection parameterization is activated in FLEXPART-WRF, as well as no sub-grid scale orography parameterization (its use is not recommended for mesoscale WRF simulation with a horizontal grid spacing of less than 10 km; Brioude et al., 2013).
2.3 AirIntrusions algorithm
For detecting the intrusions into the tropopause and the stratosphere, the crucial issue is to localize the tropopause. In mid-latitudes, the tropopause can be considered as a narrow layer that separates the stratosphere from the troposphere (Homeyer et al., 2010) and its altitude can be approximated by a single value following various methodologies (i.e., lapse rate tropopause (LRT) method, potential vorticity method etc.) (Hoinka, 1997). However, in the tropics, much evidence has been collected over the years highlighting the “layer-nature” of the tropopause region (Sherwood and Dessler, 2000; Highwood and Hoskins, 1998; Fueglistaler et al., 2009), also known as tropical tropopause layer (TTL). Hence, to capture this layer-wise structure of the TTL, and to keep a simple computation in our study, we defined its bottom using the LRT method, computed in FLEXPART-WRF at each internal time step and particle location as the lower boundary of a layer in which the temperature lapse rate is less than 2 K km−1 for a depth of at least 2 km (Hoinka, 1997). Whereas, its top was defined considering the cold point tropopause (CPT) method where the temperature profile is used to search for the minimum temperature. This approach always determined a well-defined tropopause layer with a depth between 350 m and 4 km, which is in agreement with Fueglistaler et al. (2009). In their article, the authors provide a robust definition of the TTL based on assimilated meteorological fields, remote sensing data, and in situ measurements. The lower level of TTL is set to 150 hPa (about 13–14 km), the level where convection begins to lose its dominant influence; the TTL top is set to 70 hPa (about 17–18 km) since from that level on the troposphere is argued to have negligible influence on the horizontal circulation patterns in the stratosphere (see Fig. 14 in Fueglistaler et al., 2009). Our choice to consider the local instantaneous tropopause as in Stohl et al. (2003b) rather than a “background” value, as in Fueglistaler et al. (2009), is motivated by the need to take into account typhoon-induced vertical shifting of the tropopause, which can displace it by 200–500 m. This approach reduces the risk of overestimating or underestimating intrusions, which could mislead our analysis if we used a static background value. For instance, if the typhoon pushes the local troposphere upward, measuring parcel heights against a lower, undisturbed background tropopause would falsely register those parcels as entering the TTL or stratosphere.
The methodology for detecting and characterizing the intrusions, inspired by the work of James et al. (2003) and Bourqui (2006), is based on a novel algorithm implemented within the FLEXPART-WRF framework. The details of this algorithm are presented hereafter:
-
First of all, an intrusion is identified by tracking the position of an air parcel across two contiguous time steps: the old location (time t) and the new location (time t+1). For example, a parcel might start below the LRT at the old location and move between the LRT and CPT at the new location. To confirm this, the old location must be compared against the LRT and CPT boundaries from that initial time step, while the new location must be evaluated against the boundaries at the subsequent time and position. Consequently, LRT and CPT values must be computed for both contiguous time steps.
-
Secondly, each particle carried three different clocks to characterize the duration of the intrusion. The “PBL” clock records the time at which the particle crosses the planetary boundary layer (PBL), the height of which is computed internally by FLEXPART-WRF using a threshold of 0.25 for the Richardson number (Ri) (Brioude et al., 2013; Stohl et al., 2005). Whereas, the “TL” and the “ST” clocks record the time at which the particle enters the TTL and the stratosphere, respectively. In this way, the combination of the “PBL” clock and the “TL”/“ST” clock provide the “transition time”, namely the time required by the particle to enter the TTL or stratosphere. On the other hand, the “TL”/“ST” clock allows us to compute the residence time of the parcel in the TTL and the stratosphere.
-
For each intrusion, it is possible to activate the computation of some other background variables such as the Richardson number (Ri) and the Turbulent Kinetic Energy (TKE).
-
Finally, to reduce the information into a manageable dataset, the output is divided using the concept of “residence time classes”. Each parcel is classified into one of four classes according to its residence time in the tropopause/stratosphere. We selected four different categories to cover the short to long intrusion possibilities: class1 [0–3] h, class2 [3–6] h, class3 [6–9] h and class4 [>9] h.
The algorithm consists of different Fortran subroutines that can be incorporated in the FLEXPART-WRF model and it is freely available in this GitHub repository: https://github.com/MassiMart/FLEXPART-WRF_AirIntrusions.
3.1 Vertical transports triggered by Typhoon Molave
Typhoon Molave started to develop from a depression in the eastern Philippine sea on 24 October 2020. It was characterized by a minimum central pressure of 965 hPa and a mean wind speed at 10 m a.g.l. of approximately 38 m s−1 during its crossing of the Philippines, according to the data provided by the Japan Meteorological Agency (Kitamoto, 2021).
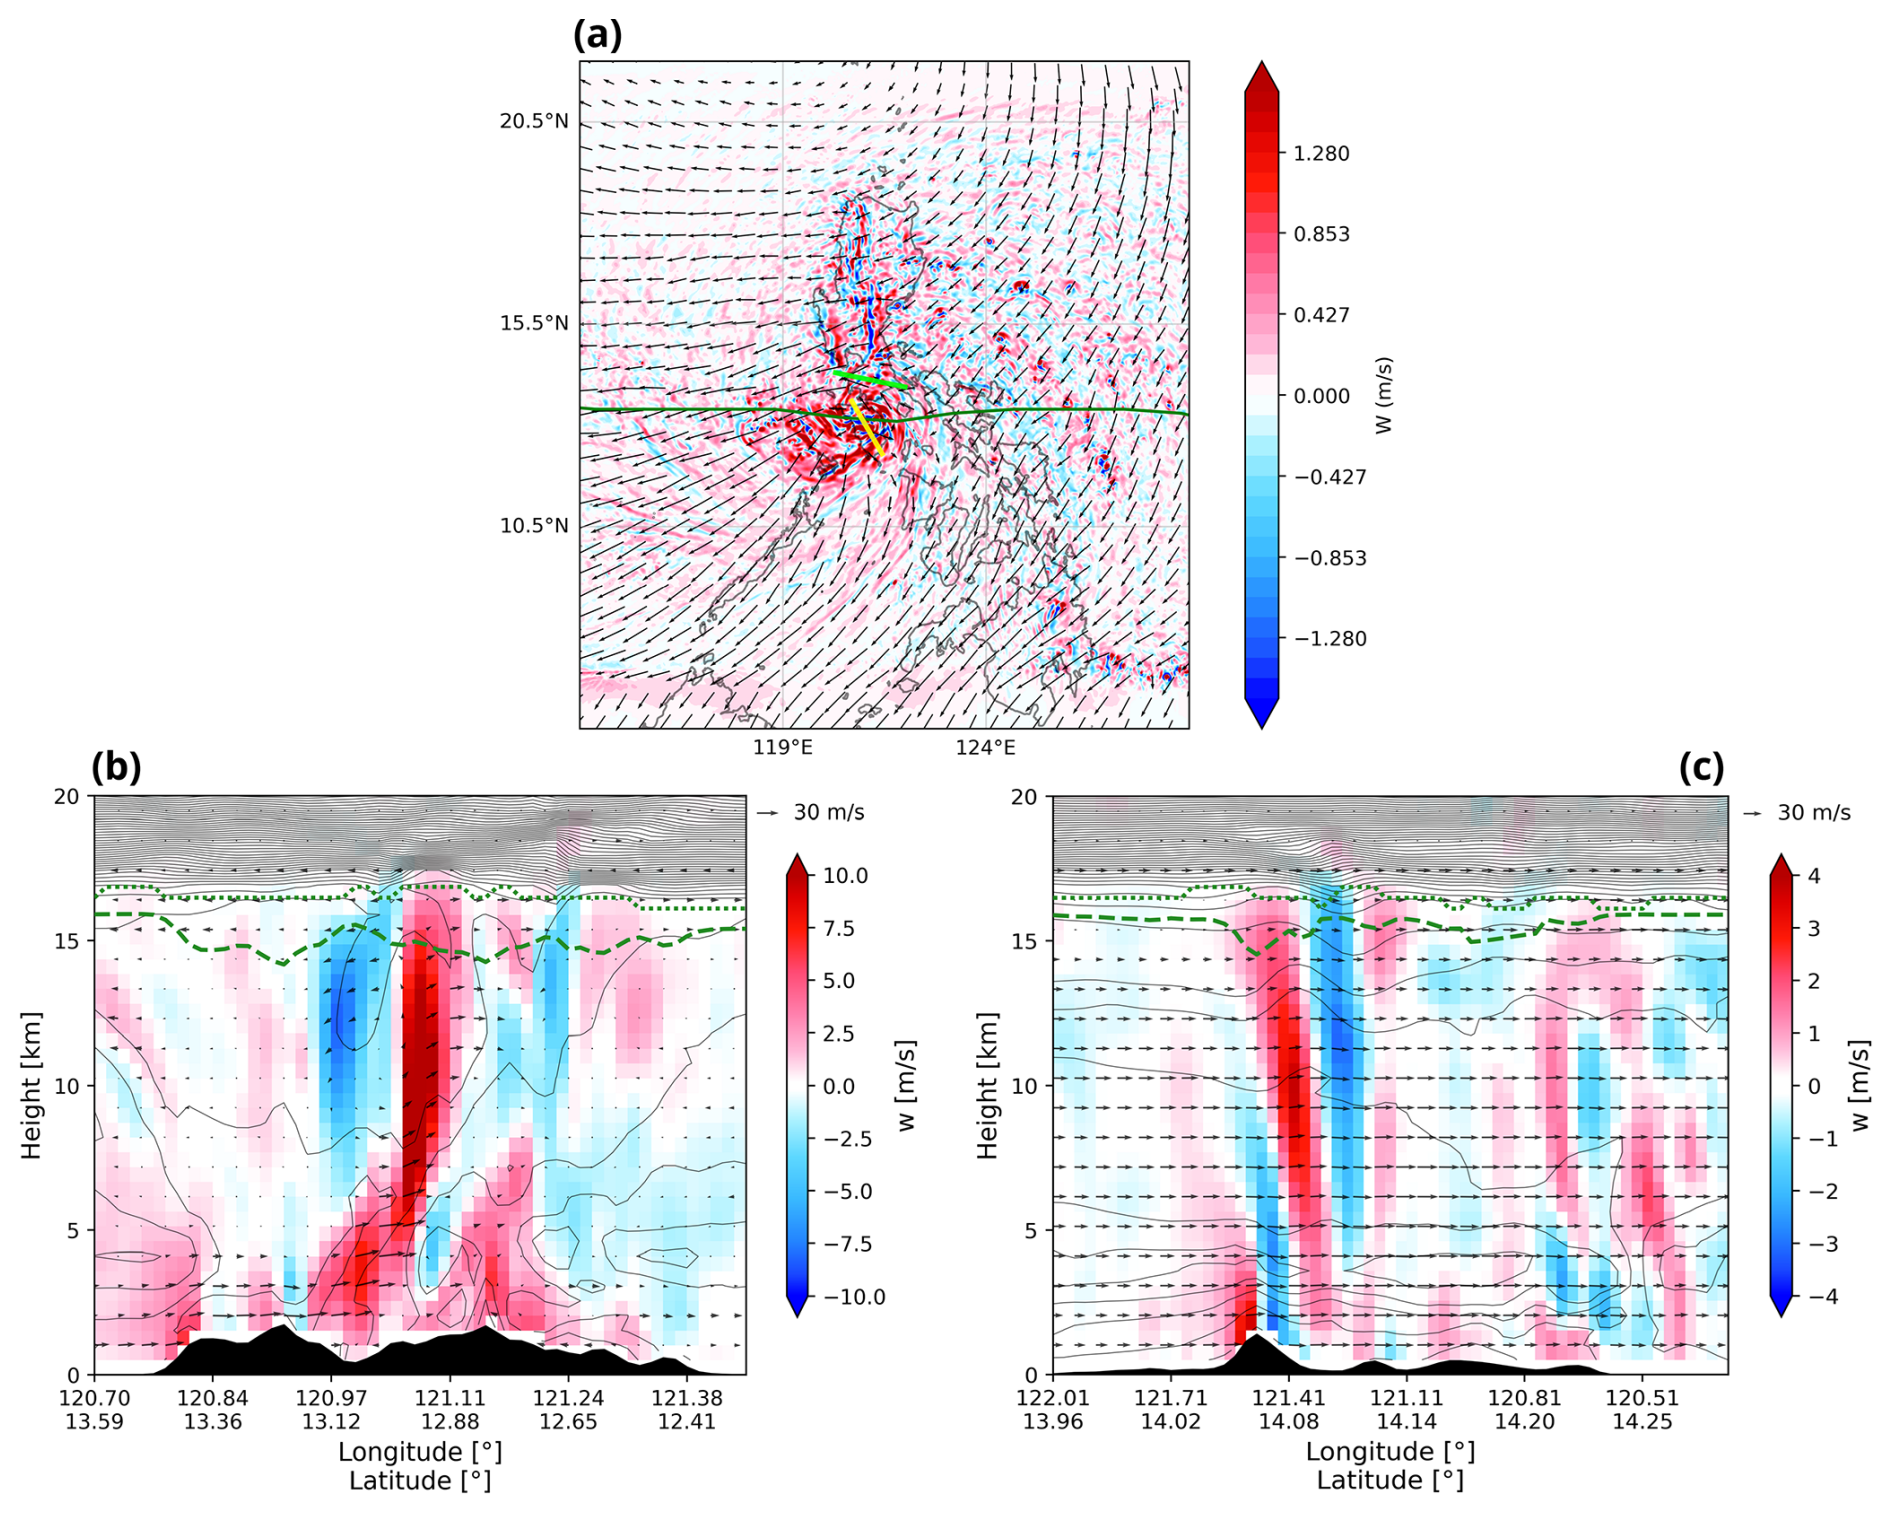
Figure 3(a) Vertical wind speed at 150 hPa on 26 October at 09:00:00 UTC (blue to red colors); the dark green line represents the typhoon's center track, the yellow (lime) line shows the location of the transect used in Fig. 3b (Fig. 3c) and the arrows illustrate the horizontal wind direction. Panels (b) and (c) present vertical wind speed cross-sections associated with two different transects; the arrows depict the wind direction along the cross-section, the contour lines represent equivalent potential temperature, the green dashed line lapse rate tropopause, and the green dotted line cold point tropopause.
Figure 3a shows the trajectory of the center of the typhoon, crossing mountains on its way with altitudes greater than ∼ 2000 m. The figure also shows the vertical velocity field at 150 hPa on 26 October at 09:00:00 UTC, when the typhoon was located approximately in the center of the Philippines. The vertical velocity plot features a clear signal of alternating positive and negative values displaying an arch-shaped pattern. This corresponds to the horizontal projection of concentric GWs, especially on the east side, as reported by Huang et al. (2024). Moreover, we can identify strong (saturated red color) updraft regions around the center, numerous isolated convective overshoots over the ocean, and the horizontal OGW signatures in the northern Philippines (see also Fig. 3c for a cross-section).
Illustrating the complex dynamical situation from a different angle, Fig. 3b and c show a vertical cross-section of the vertical wind speed. The former concerns a longitudinal transect crossing the path of the typhoon's center in the central part of the Philippines (yellow line in Fig. 3a), while the latter takes into account a slanted transect in the northern region of the Philippines (lime line in Fig. 3a). The convection associated with the typhoon is clearly visible by the very strong updraft extending from the surface up to the tropopause in Fig. 3b, where the overshooting of the convection is also distinguishable. Figure 3c illustrates the interaction between the circulation induced by the typhoon and the orography of the Philippines. The stably stratified unidirectional wind field supports an upward propagating OGW with amplitude about 3 m s−1 that modulates both tropopauses and penetrates to the stratosphere, possibly becoming convectively unstable near the surface and then again in the UTLS region due to the convective or dynamical instability or their interplay (Sutherland, 2010).
Hence, the typhoon landfall presents a complex dynamical set-up, where the boundary layer air can be efficiently transported to the free atmosphere by updrafts connected with the typhoon center, isolated convection or orography, and subsequently can overcome the tropopause if the updrafts are sufficiently strong to overshoot, or due to mixing induced by OGW breaking. This is further disentangled in the following sections.
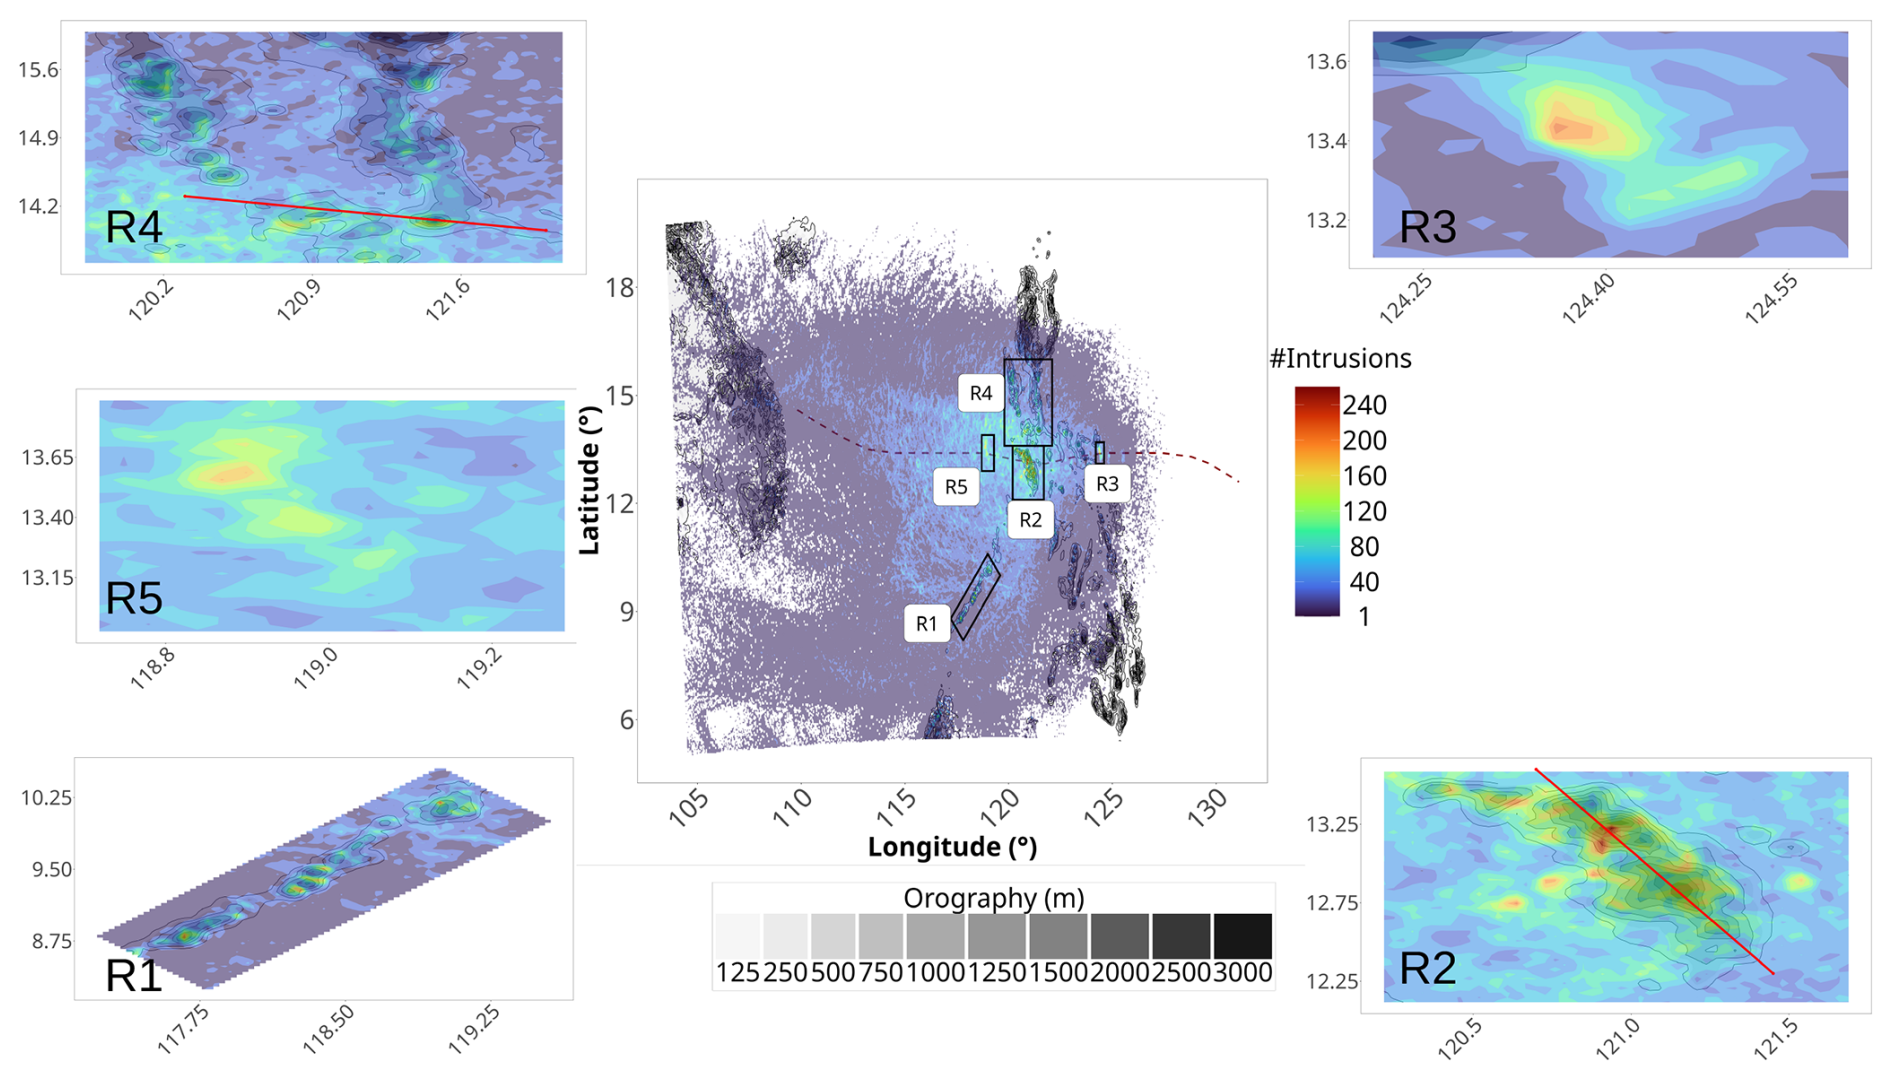
Figure 4Mean number of intrusions computed for each grid point and taking into account penetration into both the TTL and the stratosphere (colours ranging from violet to red). The dashed red line shows the typhoon track. The pannels R1 to R5 are a zoomed view to the regions highlighted by the rectangles in the central plot of geographical distribution of the intrusions. The red solid lines in the zoom panels in the upper left and bottom right corner show the location of the two transects used for the cross-sections.
3.2 Air parcels entering the Tropical Tropopause Layer and the Stratosphere
An ideal emission source located in the boundary layer of the Philippines was simulated using the FLEXPART-WRF model (see Fig. 1). The novel AirIntrusions algorithm was formulated and implemented to allow the model to identify TST events both in the temporal and spatial domain, also distinguishing between intrusions into the TTL and higher up across CPT to the stratosphere. Along the trajectories, the computation of the transition time and the residence time in the TTL/stratosphere, allow for a detailed spatiotemporal characterization of the intrusions. Figure 4 shows the mean number of intrusions into the TTL and stratosphere during the whole simulation binned according to the location of the LRT or CPT crossing. A broad region along the trajectory of the center stands out most pronounced in the figure, but after a closer look, several smaller scale regions appear as hotspots of the crossings. For a detailed analysis, five most pronounced TST hotspot regions were chosen, three of them located over orography (R1, R2, and R4), one hotspot (R3) centered over the sea (although it may still be influenced by the interaction between the flow and the orography in the vicinity) and the final region (R5) is situated over open water with minimal orographic influence compared to R3. From the zoomed plots on the sides of the figure, we see that in R1, R4 and also in R2, which is located directly in the region of the strongest updrafts in the typhoon center, the distribution of crossings reflects subtle nuances of the underlying orography, prompting a closer investigation of the mechanism later in the manuscript.
Table 1Total number and percentage of air parcels entering the TTL and stratosphere for the first time, categorized by residence time. Percentages are calculated with respect to the total number of air parcels entering each respective layer.
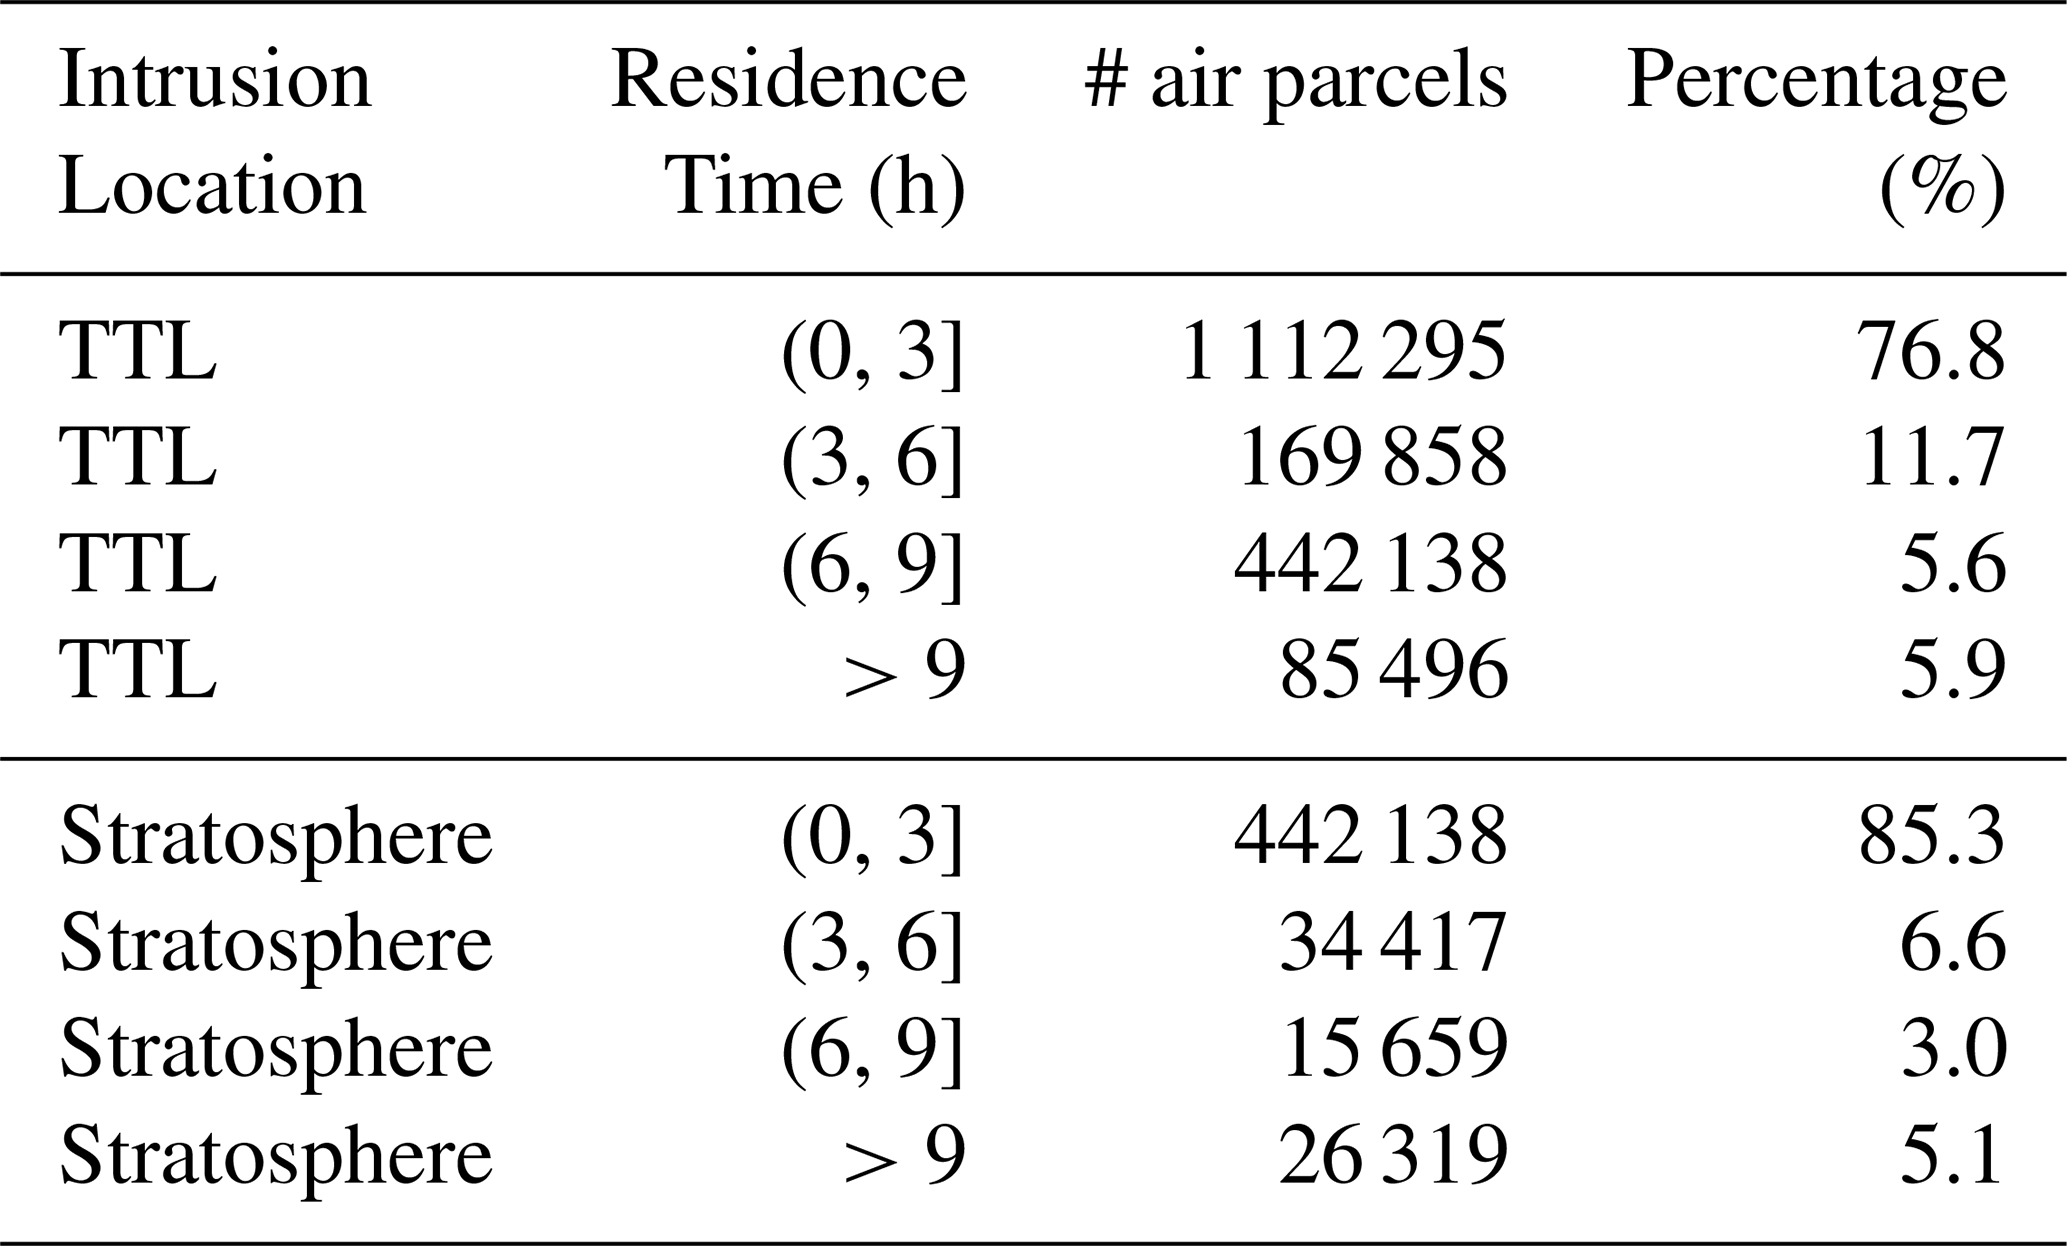
Table 2Percentage of air parcels reaching the TTL and stratosphere, categorized by transition time from the planetary boundary layer for the shortest and longest residence time classes.
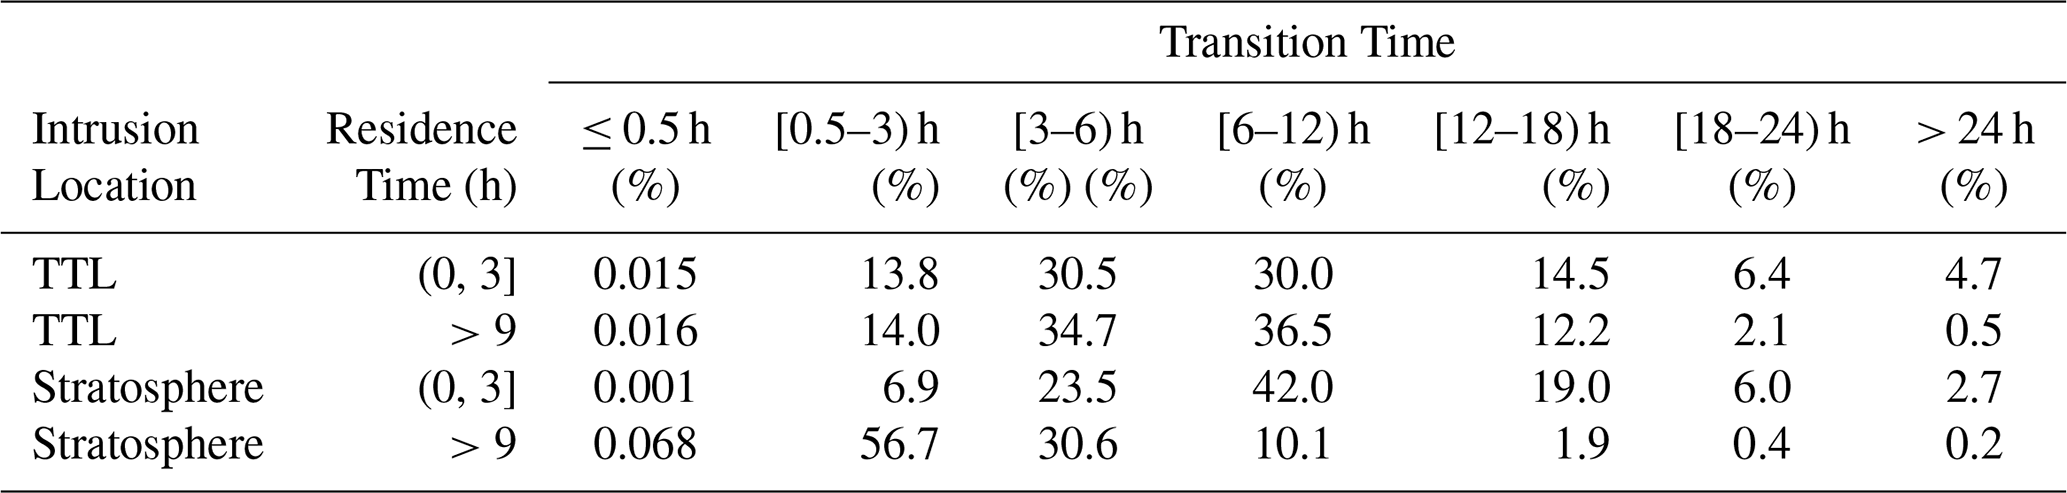
The results of the time and date dependence of the intrusions into TTL (stratosphere) are not surprising. The intrusions undergo an abrupt increase as the typhoon makes landfall in the Philippines on 25 October 2020 at 10:00:00 UTC (Table 3, upper part); In total around 36 % (13 %) of all the 4 millions air parcels considered in the simulation reach the TTL (stratosphere) region. The majority of the air parcels reside in the TTL (stratosphere) for up to 3 h (76.8 % and 85.3 % respectively); while, even though minor, a still significant number of air parcels stay in the TTL (stratosphere) for more than 9 h (5.9 % and 5.1 % respectively) (Table 1). Moreover, Table 2 illustrates the intensity of the transport processes activated by the Typhoon, which can carry air parcels emitted at the surface up to the TTL and stratosphere in just 3 to 6 h.
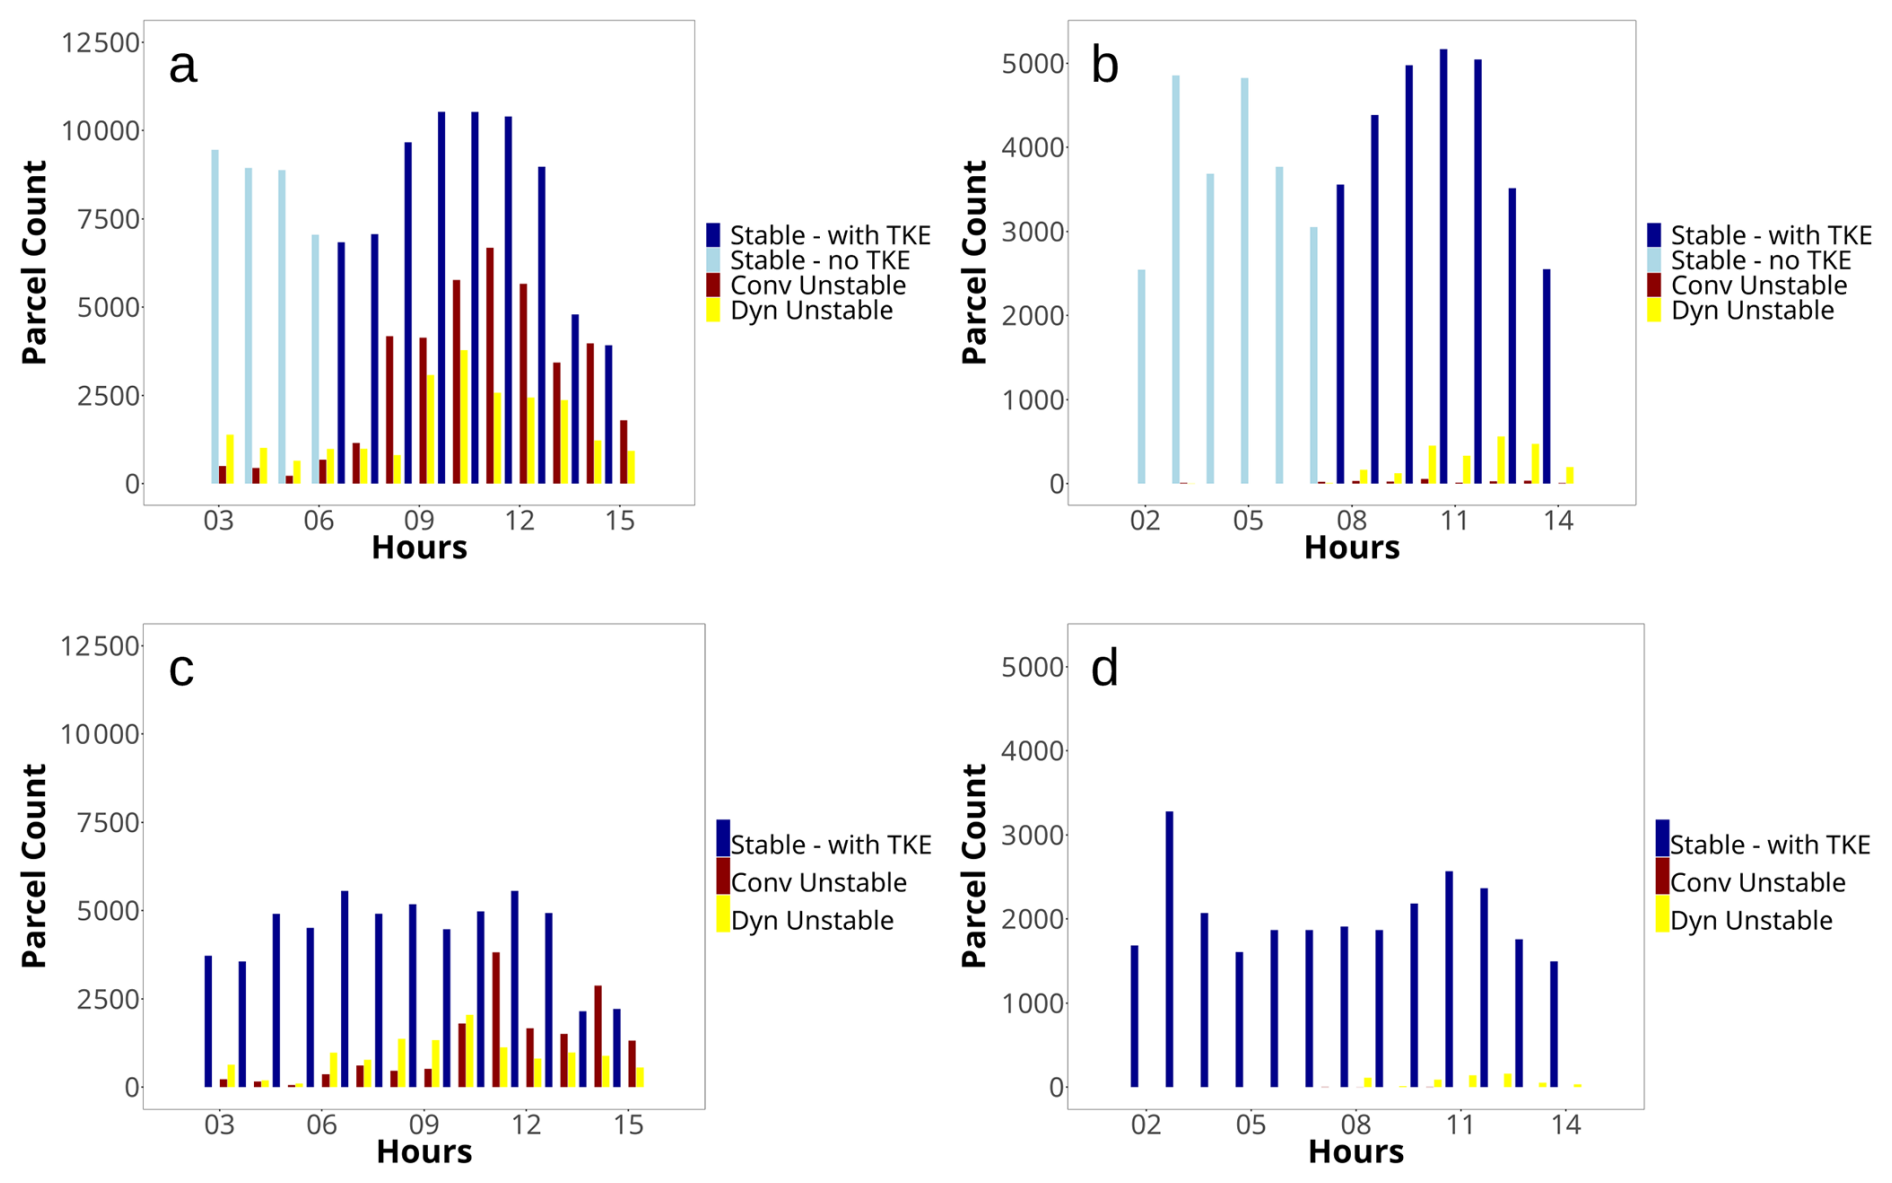
Figure 5Intrusions per hour entering the TTL (first column) and the stratosphere (second column) across the R2 target region (see Fig. 4) on 26 October 2020, categorized using the stability regimes described in Sect. 3.2. The panels refer to: (a) TTL intrusions over land, (b) stratospheric intrusions over land, (c) TTL intrusions over sea and, (d) stratospheric intrusions over sea. The bars indicate the absolute parcel counts categorized into four distinct environmental regimes based on their Richardson number (Ri) and Turbulent Kinetic Energy (TKE): convective instability (Ri<0, dark red), dynamical instability (, yellow), stable conditions with non-negligible turbulence (Ri>0.25 and TKE >0.1, dark blue), and stable conditions with negligible turbulence (Ri>0.25 and TKE ≤0.1, light blue).
Figures 5 and 6 display the intrusions per hour across the target regions R2 and R4. The x-axis represents a 13 h period centered on the mean entry time into the TTL/stratosphere for each region (see Table 4). For each hour, intrusions are classified considering the concept of stability regimes. These regimes are defined as follows:
-
Convective Instability: Ri<0;
-
Dynamical Instability: ;
-
Stable Conditions with Non-Negligible Turbulence: Ri>0.25 and TKE >0.1 m2 s−2;
-
Stable Conditions with Negligible Turbulence: Ri>0.25 and TKE ≤0.1 m2 s−2.
The later two criteria are introduced, because it is known from the literature that in coarsely sampled model data the criterion of Ri≤0.25 is overly sharp and may result in missing some of the dynamical instability events occurring in the model (Kaluza et al., 2022). The threshold value of 0.1 m2 s−2 for TKE is established based on the domain-averaged TKE within the 16–19 km layer during the first 10 h of the simulation, restricted to the calm region west of 129° E (see Fig. S4 in the Supplement). These spatio-temporal constraints isolate the ambient atmospheric state from the convective influence of the typhoon, establishing a representative background baseline for the study domain. Consequently, only TKE values exceeding 0.1 m2 s−2 are classified as non-negligible turbulence, ensuring that the identified regime signify robust, localized mixing that exceeds the unperturbed background state.
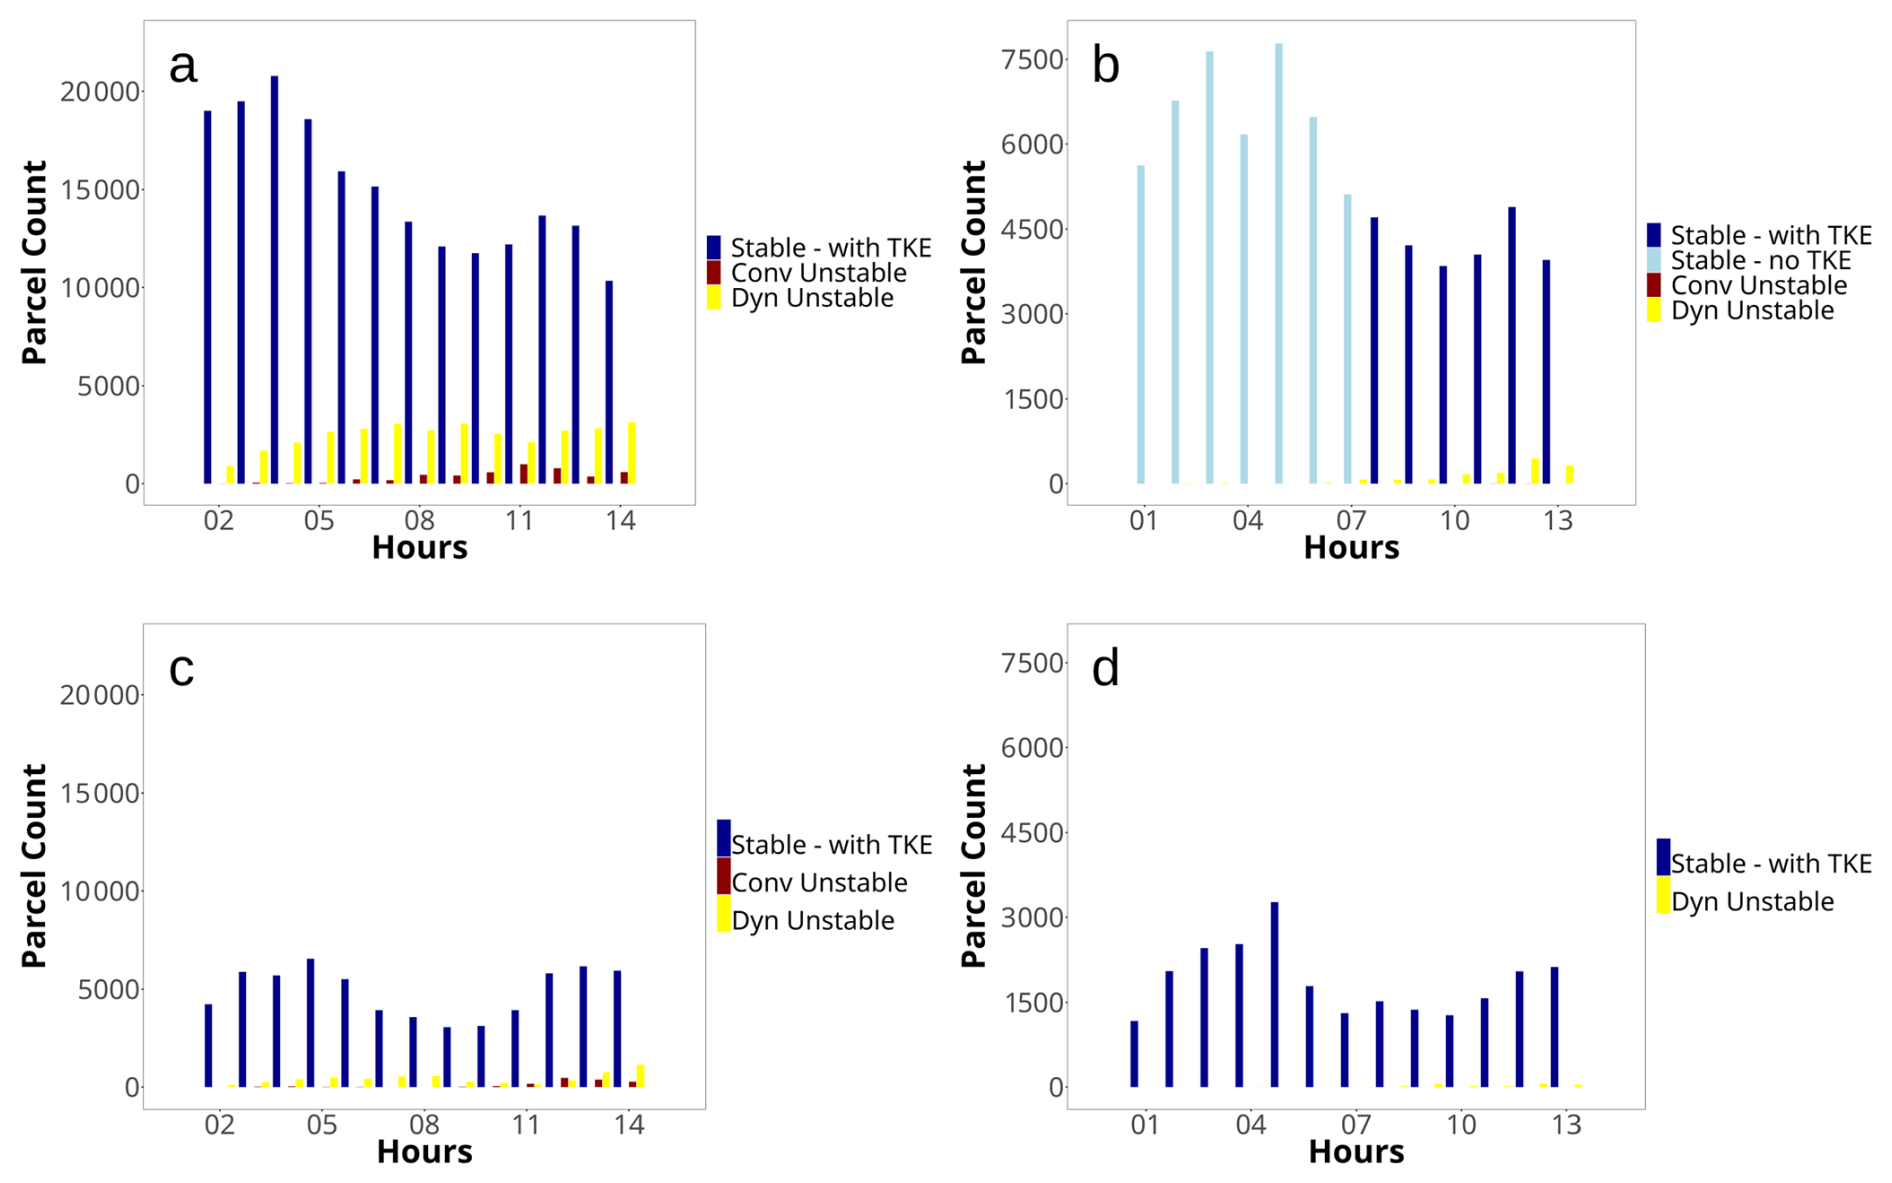
Figure 6Intrusions per hour entering the TTL (first column) and the stratosphere (second column) across the R4 target region (see Fig. 4) on 26 October 2020, categorized using the stability regimes described in Sect. 3.2. The panels refer to: (a) TTL intrusions over land, (b) stratospheric intrusions over land, (c) TTL intrusions over sea and, (d) stratospheric intrusions over sea. The first row refers to intrusions occurring over the orography and the second one above the sea. The bars indicate the absolute parcel counts categorized into four distinct environmental regimes based on their Richardson number (Ri) and Turbulent Kinetic Energy (TKE): convective instability (Ri<0, dark red), dynamical instability (, yellow), stable conditions with non-negligible turbulence (Ri>0.25 and TKE >0.1, dark blue), and stable conditions with negligible turbulence (Ri>0.25 and TKE ≤0.1, light blue).
Figure 5 presents the results for the target region R2 along the typhoon's center path, demonstrating that the majority of intrusions are coupled with orographic features. Similarly, Fig. 6, which focuses on the R4 region, illustrates how the combination of significant orography and proximity to the typhoon leads to a high number of intrusions into the TTL and stratosphere, with the highest number occurring again over land. Overall, target regions characterized by significant orography, like R2 and R4, exhibit a higher frequency of crossings over land than over the sea (see also Figs. S1, S2 and S3 for the target regions R1, R3 and R5, respectively). Note that in Figs. 5 and 6 different y-axis scales are utilized to distinguish between TTL and stratospheric intrusions and also different y-axis scales are used for different regions.
Furthermore, over the land we see higher portions of dynamical instability for the crossings to TTL and the stratosphere, and also over the land the crossings are more frequently marked by elevated TKE values, even when the Ri alone indicates stable flow regimes. This suggests that the Richardson number criterion likely underestimates the occurrence of dynamical instability in these regions. The signatures of the elevated ratio of dynamical instability and enhanced TKE within otherwise stable Ri regimes are a likely indicator of possible mixing induced by OGW breaking.
The stable, turbulence-free regime that characterizes part of the intrusions may be connected with oscillating trajectories due to the presence of waves near the tropopauses leading to advective, reversible intrusions. This mechanism could explain why for the target region R1, which is more distant from the typhoon center located over a mountain ridge and which is also characterized by the highest portion of secondary intrusions (see Table 4 and the following section), nearly all the intrusions over land are occurring under stable conditions (Fig. S1).
Table 3The upper part shows the total number of the first intrusions into the TTL and stratosphere, classified by the percentage occurring before and after the typhoon made landfall on the Philippines. The bottom part gives the total number of air parcels affected by secondary intrusions and the percentage relative to the total number of first intrusions. The further columns represent the distribution of the frequency of multiple entries (secondary intrusions) into the TTL/stratosphere categorized into three classes: between 2 and 4 intrusions (inclusive), between 5 and 10 intrusions (inclusive), and >10 intrusions.
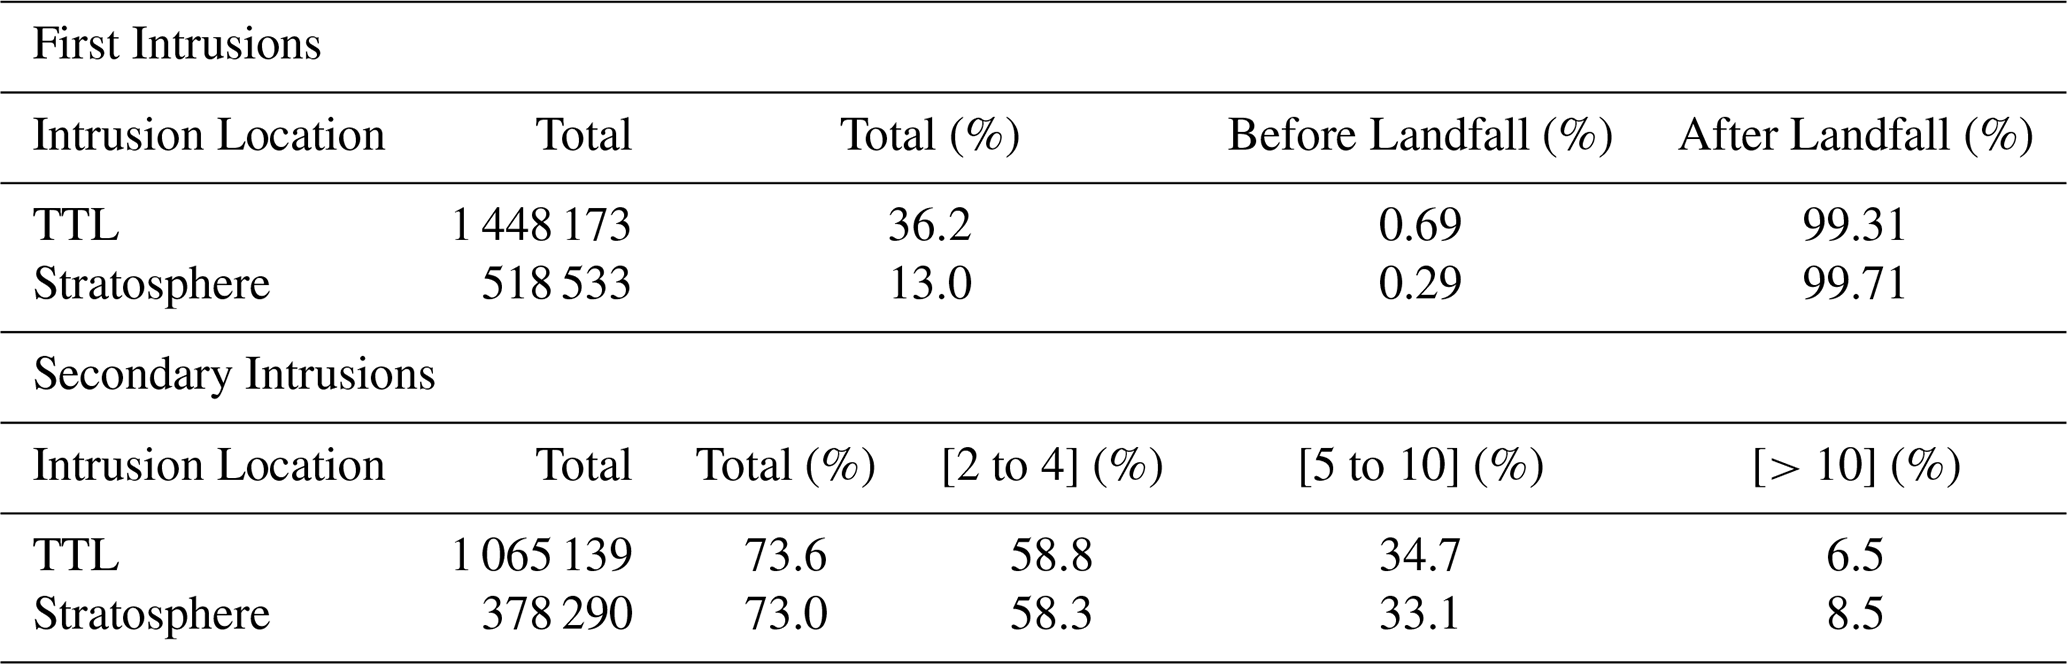
It should also be noted that the nature of TST during the typhoon is more complex than a single one-way crossing of LRT or CPT. Approximately 73 % of all air parcels entering the TTL and stratosphere fluctuate around the boundaries and undergo multiple intrusions along the trajectories. To capture this effect, the secondary intrusions concept is introduced, similar to the transit time concept developed by Wernli and Bourqui (2002), but without discarding shallow intrusions. Secondary intrusions occur when the air parcel enters the TTL (stratosphere) at least for a second time after the first penetration into the layer. Table 3 (lower part) shows that a significant amount of air parcels experience even more than ten successive penetrations.
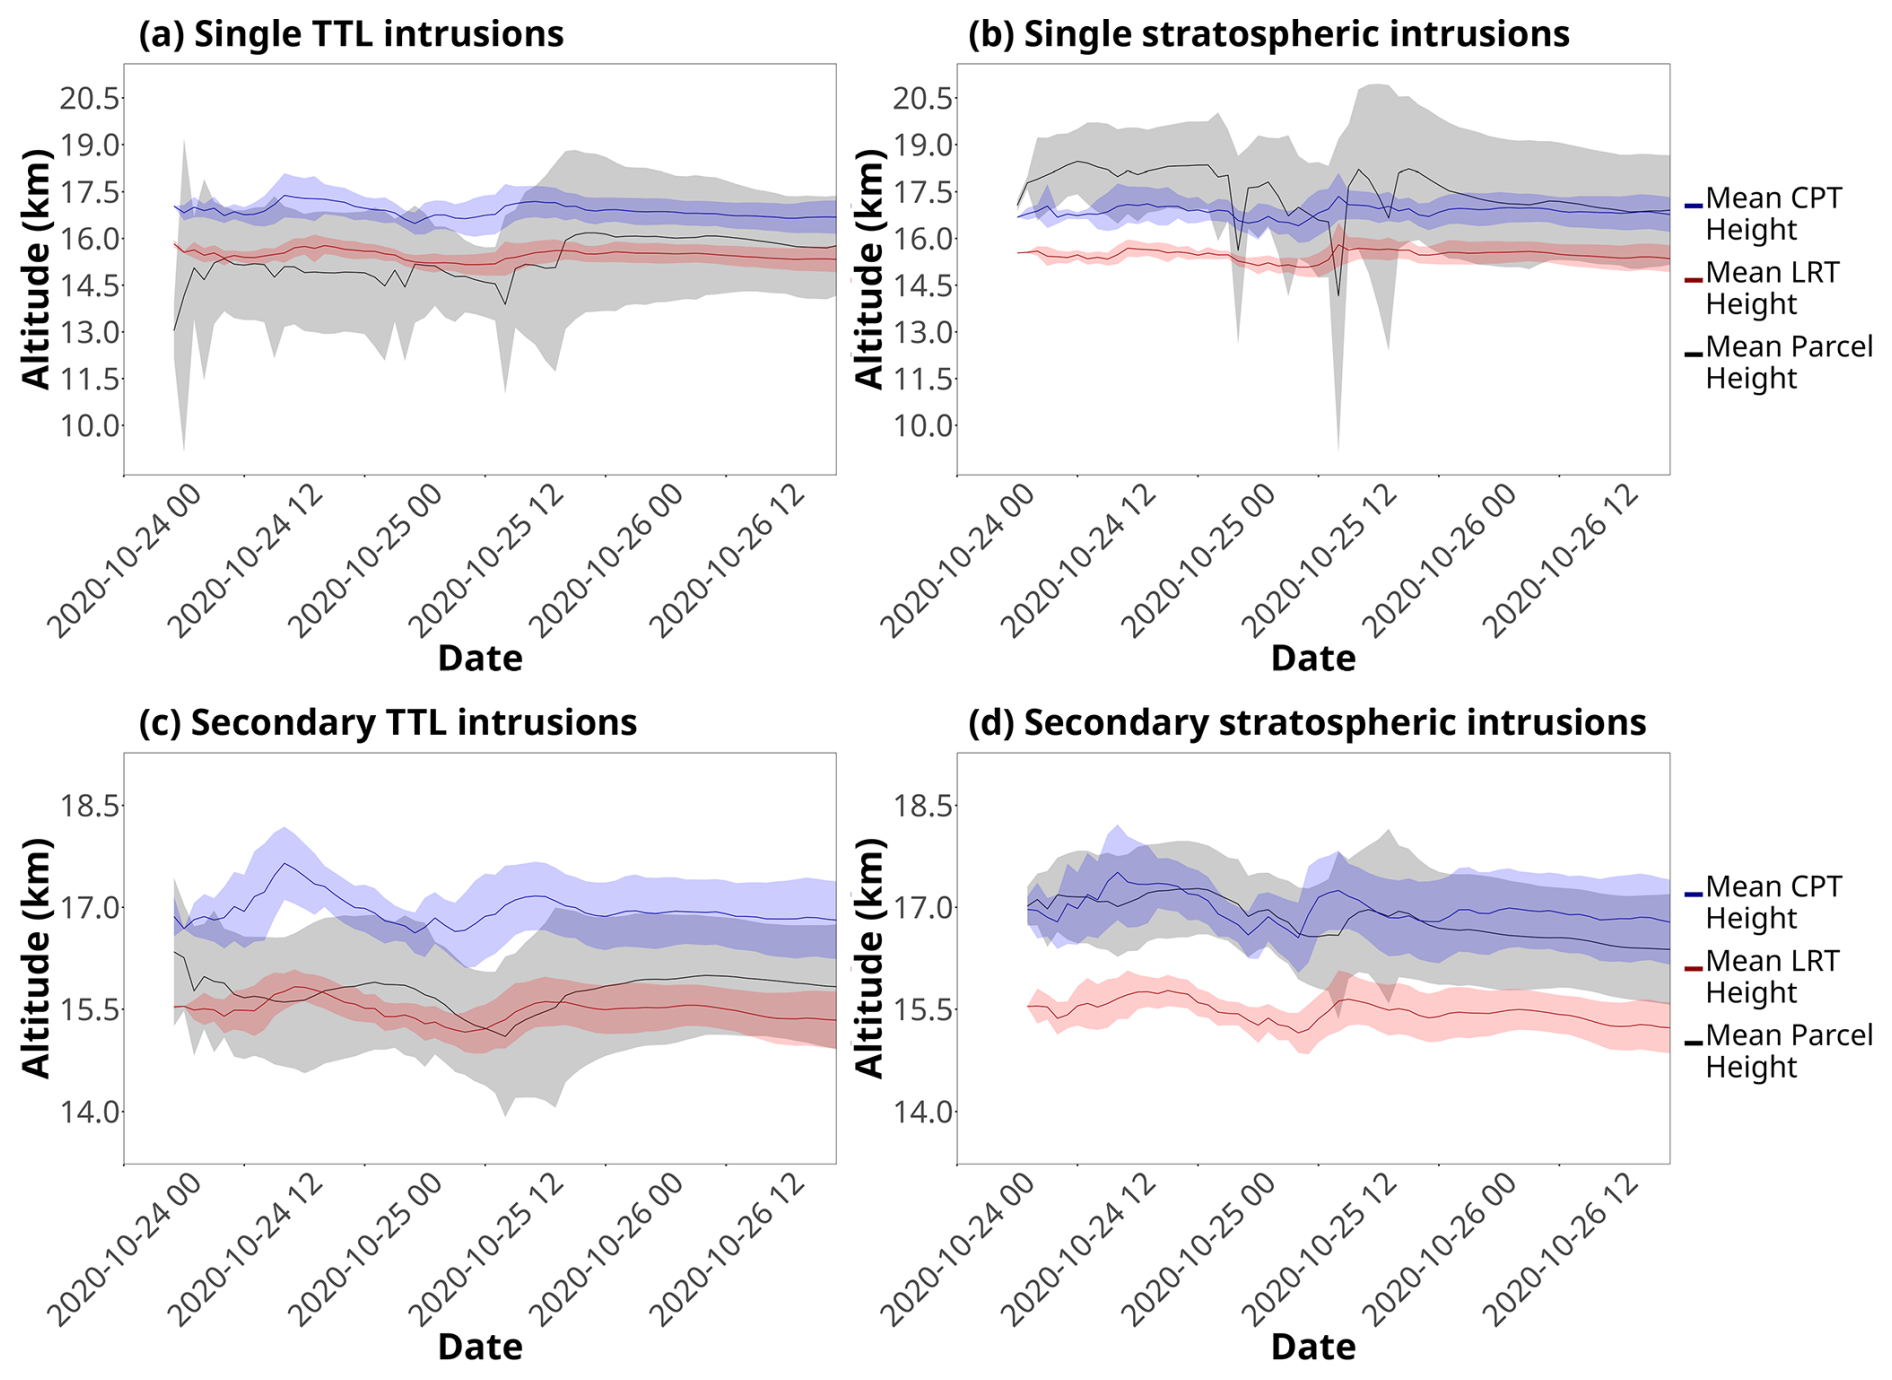
Figure 7Mean altitude of air parcel trajectories (black line) after entering the TTL (a, c) and stratosphere (b, d) associated with a single intrusion (a) and (b), and with secondary intrusions (c) and (d). The mean heights of LRT and CPT are represented by the red and blue lines, respectively. Shaded regions indicate ±σ (one standard deviation) values.
The distinction between parcels affected and unaffected by secondary intrusions is nicely illustrated by plotting the time evolution of the altitude along their trajectories versus the variations in the heights of LRT and CPT in Fig. 7. The term 'single intrusion' refers to air parcels that penetrate the TTL (stratosphere) once and then escape the layer towards the troposphere/stratosphere (TTL/troposphere), or continue their journey within that layer. In contrast, “secondary intrusion” refers to air parcels that enter the TTL/stratosphere multiple times and return to the troposphere multiple times. The intrusions of air parcels affected by secondary intrusions in the TTL (Fig. 7c) and stratosphere (Fig. 7d) are shallower than those affected by a single intrusion (Fig. 7a and b). As a consequence, the former travel close to the tropopause boundaries, being sensitive to small perturbations in the vertical wind field, which can result in escaping the TTL (or the stratosphere towards TTL).
Note that the parcels in TTL, regardless of being subjected to secondary intrusions (Fig. 7a, c) do not show a systematic tendency to escape the layer towards the troposphere or the stratosphere, suggesting their potential to reside in the layer for a longer time and contribute, for example, to the Asian Tropopause Aerosol Layer (Vernier et al., 2011). On the other hand, the parcels belonging to the single intrusions into the stratosphere (Fig. 7b) may affect its local atmospheric composition due to their fast transport from the PBL (see Table 2) and their long residence times (see Table 1). For the parcels oscillating between the stratosphere and TTL, there is a growing tendency to settle in TTL as time progresses (Fig. 7d).
A possible mechanism behind the multiple tropopause crossings is represented by OGWs, as their instabilities and breaking close to the tropopause location can induce the two-way mixing responsible for the transient and vertically shallow displacements or their pure presence can result in fluctuating trajectories and reversible advection. Consistent with this, Fig. 7c and d illustrate that air parcels exhibit some fluctuations along their trajectories. The standard deviation surrounding the mean altitude of all parcels undergoing secondary intrusions indicates that their trajectories deviate significantly from a linear path. Furthermore, the standard deviations of the lapse rate tropopause (LRT) and cold point tropopause (CPT) altitudes are smaller than the standard deviation associated with parcel positions. This suggests that it is rather the oscillation of air parcel trajectories, which is responsible for penetration into the TTL/stratosphere. However, the fluctuations in tropopause locations can also play a minor role. Sufficiently deep intrusions that are less connected with secondary intrusions, point rather towards strong overshooting updrafts and convection as a responsible mechanism. This can be further disentangled by studying the intrusions hotspot-wise.
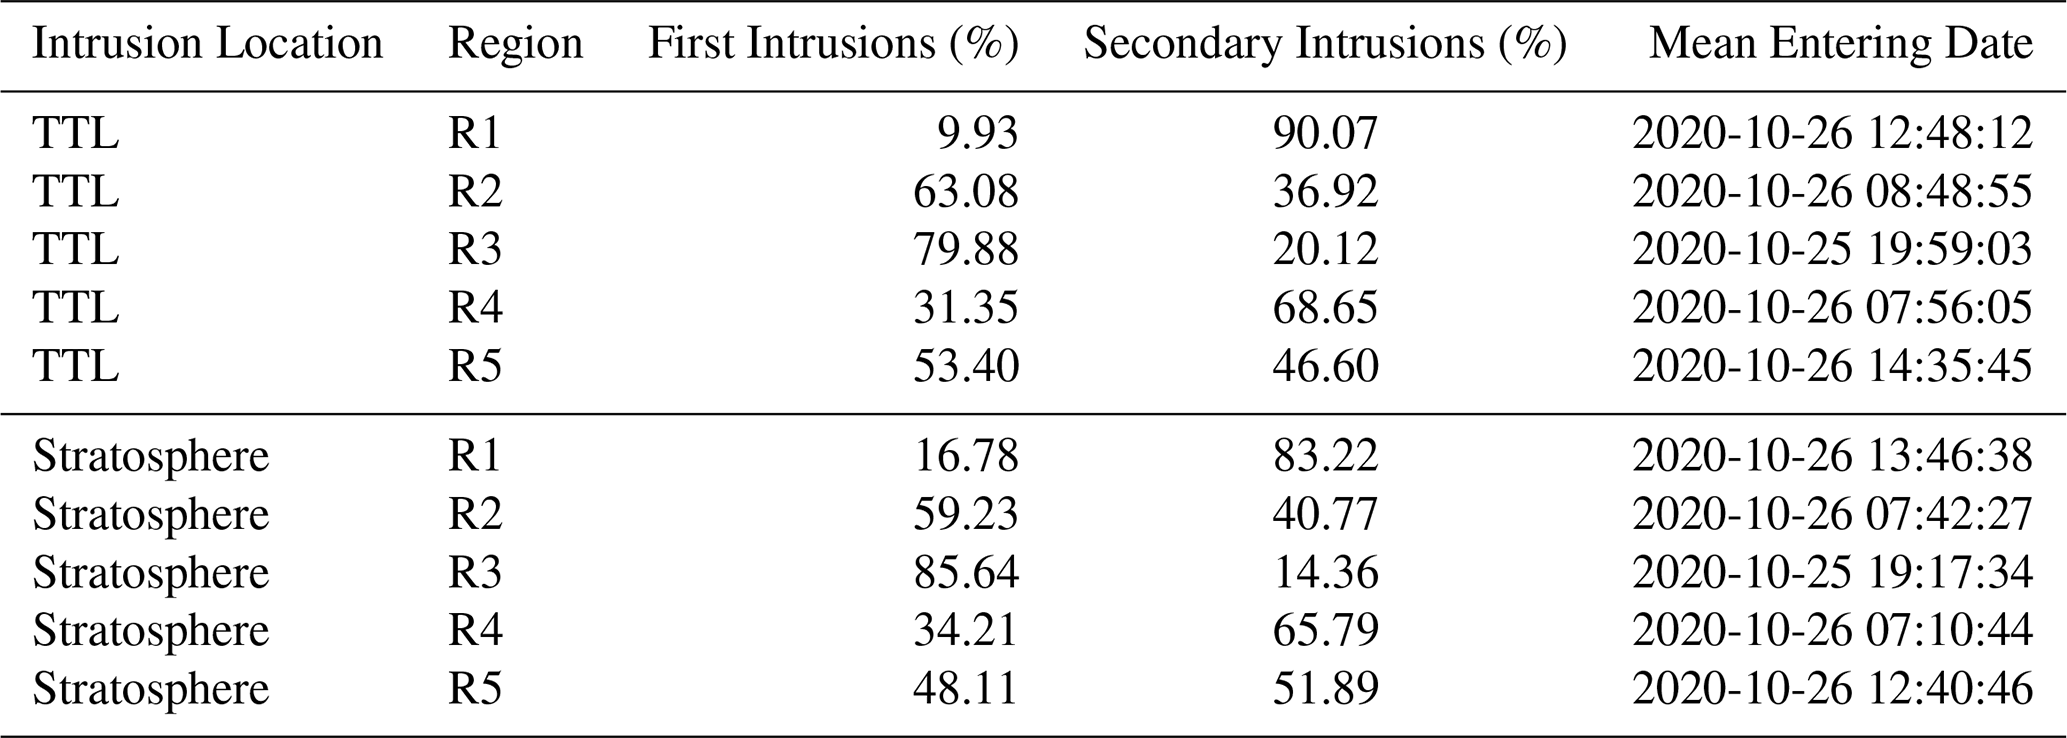
Table 4 provides the regional statistics of the type of intrusions. We see that regions R2 and R3 are mostly affected by the first intrusions (namely, these air parcels may be subjected to secondary intrusions in some other places of the domain), while R1 and R4 are characterized mainly by the secondary ones. R5 is characterized by a combination of first and secondary intrusions into the TTL and stratosphere. R2, R3 and R5 are located directly on the path affected by the center of the typhoon, providing evidence of the efficiency of typhoon updrafts in transporting air from the boundary layer aloft and sufficiently deep across the tropopauses. Regions R1 and R4 are located outside the center of the typhoon, but are connected with pronounced orography. For both, we see that secondary intrusions clearly dominate. Together with mean entering dates for both TTL and stratosphere, the plausible mechanism here is that the air parcels initially affected by the center of the typhoon, where they experienced the first intrusions and returned back to the free troposphere, are horizontally advected over R1 and R4, where they are mixed across the tropopause boundaries likely due to OGW breaking.
Table 4Percentage of first and secondary intrusions in the TTL/stratosphere along with their mean entering time.
3.3 Dynamics of the intrusions into the TTL and stratosphere
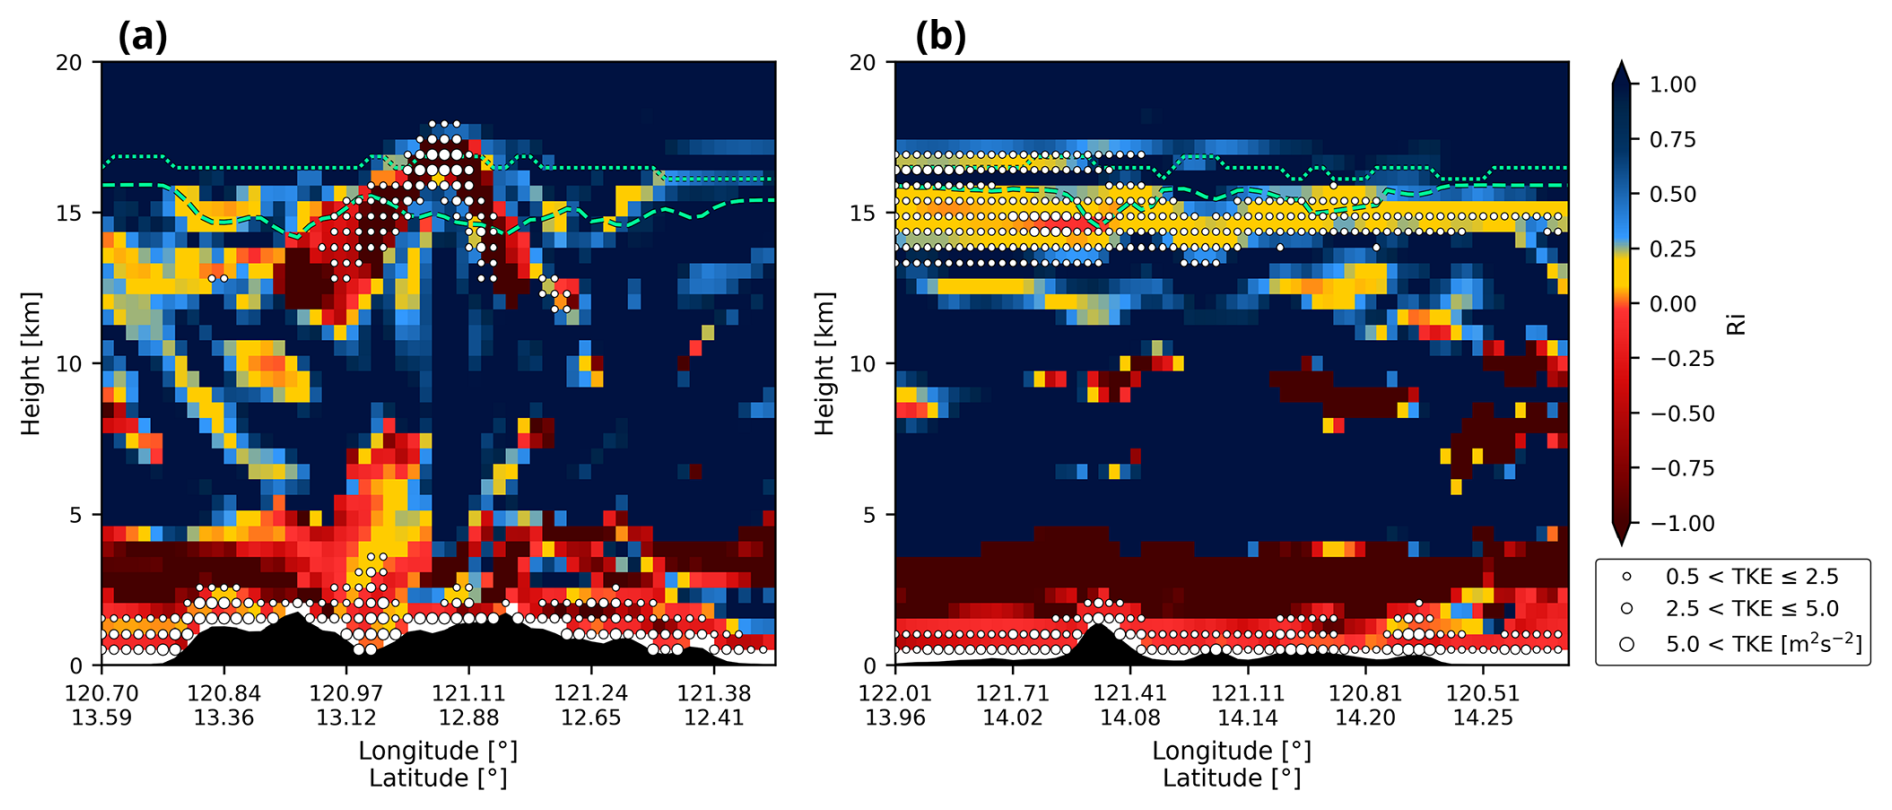
For unraveling the role of different transport mechanisms over different hotspots, we show vertical cross-sections of the Richardson number (Ri), which quantifies the stability and identifies the type of instability of the flow, and the Turbulent Kinetic Energy (TKE), which scales with the turbulent mixing in the model, across two hotspots representative for the typhoon center (R2) and off-center location (R4) (Fig. 8). The cross-sections are plotted for 26 October, 09:00:00 UTC, and correspond with the vertical wind cross-sections in Fig. 3b and c. Figure 8a clearly highlights the prime role of vertical advection by the overshooting updraft. At its top, we see an area of convective instability in UTLS across both tropopauses (green lines) depicted by the negative Richardson number (red color). In this region, the corresponding high turbulent kinetic energy values (white dots) indicate that this instability directly drives the intense mixing and first penetration of air parcels from the troposphere to the TTL/stratosphere. We can also notice the enhanced TKE values following the orography in the lower levels, pointing towards the role of orography in enhancing the mixing of air from the boundary layer.
In Fig. 8b for the R4 transect, we see a different mechanism in action. Here, a vertically propagating OGW is dominating the vertical wind field (Fig. 3c) and based on the Ri number we see that it gets unstable already at the mountain top (a primary breaking region) due to convective instability (red color). Furthermore, in UTLS we see a narrow region of along LRT and reaching downstream also across CPT, which points towards the presence of a dynamical instability and OGW breaking. This is also supported by enhanced TKE values marking this region and allowing vertical mixing and secondary intrusions of air parcels that are already traveling close to the tropopause (Fig. 7c and d).
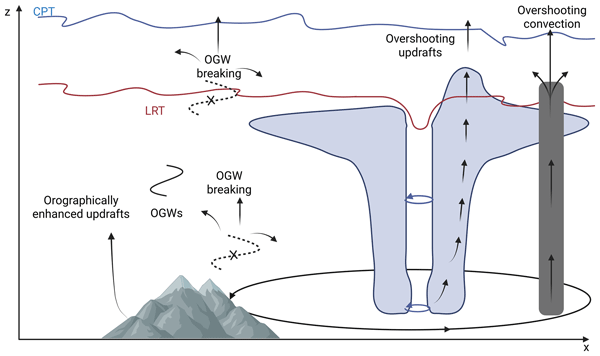
Tropical cyclones with their overshooting convection are an important mechanism for exchange of air between the troposphere and the stratosphere in the tropics (Gordon and Homeyer, 2025; Venkat Ratnam et al., 2016). In our study, we have provided a model evidence for the role of orography in enhancing TST and in opening previously unreported pathways for transport during the typhoon Molave. Our results demonstrate the ability of the typhoon to transport air parcels rapidly (in terms of hours) from the boundary layer to the TTL and to the stratosphere. Thanks to the novel algorithm for detecting the location and time of intrusions, we have identified several hotspots (often connected with orography), where the parcels preferentially cross the tropopause (either LRT or CPT), and studied how the mechanisms for crossings vary between hotspots in the center of typhoon and away from it. For the hotspots near the center, we have found a higher percentage of first intrusions, both to TTL and to the stratosphere, that are generally connected with deeper and stronger intrusions. For the hotspots off-center that are exclusively connected with orographic effects, secondary intrusions dominate, meaning that the parcels fluctuate around LRT or CPT and make several shallow intrusions. OGWs and their breaking in UTLS are suggested to play a role here by inducing vertical displacements and by mixing the parcels already present in UTLS across the tropopauses. But, the orography can also play a role lower down by enhancing the exchange between boundary layer and free atmosphere due to orographic lifting or near surface breaking of OGWs. Overall, our study provides the first evidence for the role of orography in modifying TST during a typhoon. Importantly, the shallow TST pathway resulting in air parcels being trapped in TTL during the course of the simulation, seems to be strongly dependent on orographic effects. We reflect this new understanding in Fig. 9 which is based on the work by Gordon and Homeyer (2025) and supplements their original sketch by illustrating the troposphere-to-stratosphere transport arising from the interaction of the typhoon with the orography.
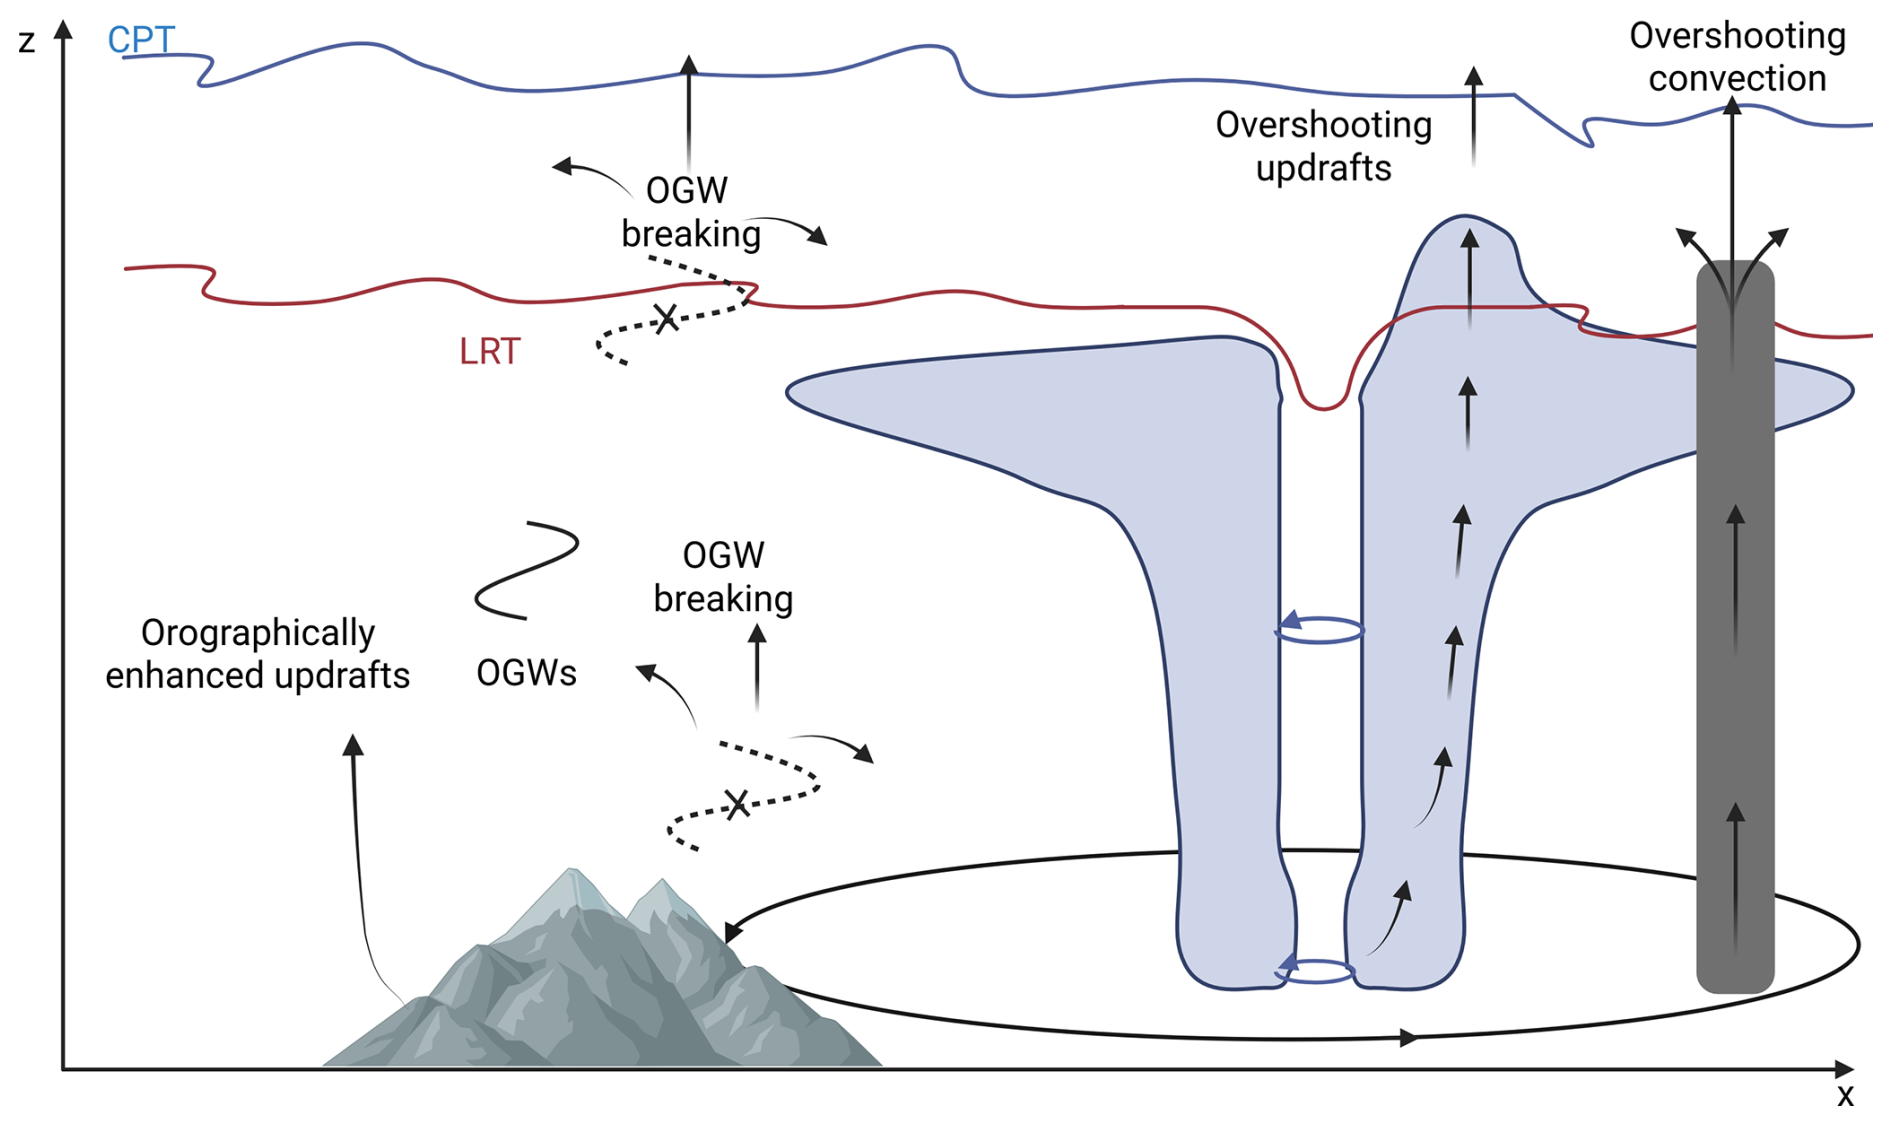
Figure 9Sketch of the troposphere-to-stratosphere transport arising from the interaction of a typhoon with orography based on the illustration by Gordon and Homeyer (2025) of a tropical cyclone cross section. It points out the significant contributions of orographic updraft enhancement and orographic gravity wave (OGW) breaking close to the tropopause and near the surface. The blue line represents the Cold Point Tropopause (CPT) and the red one the Lapse Rate Tropopause (LRT).
These processes could significantly alter the local chemical composition of the upper UTLS, including potential transport of short-lived tracers from lower tropospheric levels via the reported rapid transport pathways. Additionally, a non-negligible fraction of air parcels exhibits extended residence times (>9 h) in TTL and the stratosphere. This prolonged residence carries important implications for potential long-term modifications to the chemical budget of these layers. Our results show that air parcels that reach the TTL/stratosphere tend to settle in the TTL until the end of the simulation, highlighting their potential for long-range transport and impact in locations far from the source area in the Philippines.
Although we report novel findings on the process level, our study is also well aligned with the existing literature concerning the typhoon Molave dynamics and induced STE, which enhances confidence in our conclusions. First, the GW signals detected in our simulation compare well with a recent study focused on the typhoon Molave by Huang et al. (2024). Second, the finding that a majority of the intrusions into the TTL/stratosphere during the typhoon event are of a transient nature is consistent with the existing understanding of the climatological aspects of STE, e.g. Stohl et al. (2003a) reported that transient events often dominate the transport. Despite this, we note two possible sources of uncertainty in our results that are connected with the underlying WRF simulation and the simplified handling of transport in our FLEXPART set-up. Starting with the latter, all results presented were derived assuming passive tracers without considering the deposition processes. In this context, it is crucial to differentiate between gaseous pollutants and particulate matter. For gaseous species, when the deposition mechanisms are taken into account, the spatiotemporal distribution of the intrusions and all the conclusions drawn remain valid, since deposition processes affect only the mass transported by air parcels, not their physical trajectory. For particulate matter, it should be noted that, when calculating the settling velocity for dry deposition, gravitational settling velocity not only affects the depletion of mass, but also the trajectory of the tracer particles because it alters the vertical velocity (Stohl et al., 2005). Nevertheless, our findings remain preserved even in this scenario, as typical gravitational settling velocities are orders of magnitude smaller than the intense vertical velocities characterizing a tropical cyclone like Typhoon Molave. Although the conclusions regarding transport pathways are robust, it is important to note that including the mass depletion mechanisms is essential if the aim is to investigate the transport of particular chemical species and substances. Regarding the WRF simulation set-up, we must acknowledge that the salient features of transport in our study (transport from the boundary layer and TST) are governed by the turbulence parameterization scheme, as documented by the enhanced TKE values. Given that the Mellor-Yamada-Janjić turbulence scheme has not been primarily formulated for targeting mixing in UTLS (often with a strongly stable stratification), this may add a portion of uncertainty to our results. Although the recent study by Chau et al. (2025) argues that parameterized turbulent mixing in high-resolution simulations compares reasonably well to observations, it would be desirable to repeat a similar experiment at least in a smaller domain in the LES set-up in a future work.
A small error in the extent or location of the mixing can translate to different pathways of TST, which can have important implications, because the parcels confined to TTL can possibly accumulate and contribute, for example, to the formation of the Asian Tropopause Aerosol Layer (e.g., Bossolasco et al., 2021; Breuninger et al., 2025), while the parcels that cross CPT and enter the stratosphere can be transported globally by the Brewer-Dobson circulation. Finally, by unraveling the effects of orography and the fact that even fine variations of it are reflected in the distribution of intrusions, our study has important implications for climate model development in terms of parameterizing subgrid-scale orography (SSO) effects. Given the need of global chemistry-climate and earth system models for accurate transport, especially in the UTLS region important for the global radiation budget (Riese et al., 2012), properly capturing SSO effects on transport and STE can help alleviate model biases (Ploeger et al., 2024) in this region.
The WRF data used to run the FLEXPART-WRF model and the FLEXPART-WRF outputs are publicly available at https://doi.org/10.48700/v4e4p-cbc18 (Massimo, 2026). The AirIntrusions algorithm is freely available at: https://doi.org/10.5281/zenodo.22668508 (Massimo et al., 2026).
The supplement related to this article is available online at https://doi.org/10.5194/acp-26-13845-2026-supplement.
MM: Conceptualization of the study; FLEXPART-WRF simulations; Data analysis; Investigation; Writing original draft; Writing – review & editing. AVP: WRF simulations, Data post-processing, Consultation, Writing – review & editing. SB: Data post-processing, Writing – review & editing. PS: Conceptualization of the study; Investigation; Consultation; Supervision; Writing original draft; Writing – review & editing.
At least one of the (co-)authors is a member of the editorial board of Atmospheric Chemistry and Physics. The peer-review process was guided by an independent editor, and the authors also have no other competing interests to declare.
Publisher's note: Copernicus Publications remains neutral with regard to jurisdictional claims made in the text, published maps, institutional affiliations, or any other geographical representation in this paper. The authors bear the ultimate responsibility for providing appropriate place names. Views expressed in the text are those of the authors and do not necessarily reflect the views of the publisher.
The authors thank Dominika Hájková, Zuzana Procházková and Radek Zajíček for their valuable contributions to the discussion, and the referees and editor for their constructive reviews.
All authors were partly supported by the Czech Science Foundation project “Unravelling Subgrid-Scale Orography Effects on Composition in the Free Atmosphere (SCOPE)”, 25-17683S in the final year of the study. Massimo Martina, Petr Šácha were supported by the Czech Science Foundation JUNIOR STAR project no. 23-04921M “Unravelling climate impacts of atmospheric internal gravity waves” throughout the project as well as Anahí Villalba Pradas in initial years of the study. Further, Massimo Martina acknowledges partial support from the Charles university under GAUK no. 442325 and Petr Šácha from the Charles University Research Centre program no. UNCE/24/SCI/005.
This paper was edited by Laura Wilcox and reviewed by two anonymous referees.
Archibald, A., Neu, J., Elshorbany, Y., Cooper, O., Young, P., Akiyoshi, H., Cox, R., Coyle, M., Derwent, R., Deushi, M., Finco, A., Frost, G., Galbally, I., Gerosa, G., Granier, C., Griffiths, P., Hossaini, R., Hu, L., Jöckel, P., Josse, B., Lin, M., Mertens, M., Morgenstern, O., Naja, M., Naik, V., Oltmans, S., Plummer, D., Revell, L., Saiz-Lopez, A., Saxena, P., Shin, Y., Shahid, I., Shallcross, D., Tilmes, S., Trickl, T., Wallington, T., Wang, T., Worden, H., and Zeng, G.: Tropospheric Ozone Assessment Report: A critical review of changes in the tropospheric ozone burden and budget from 1850 to 2100, Elem. Sci. Anth., 8, 034, https://doi.org/10.1525/elementa.2020.034, 2020. a
Bossolasco, A., Jegou, F., Sellitto, P., Berthet, G., Kloss, C., and Legras, B.: Global modeling studies of composition and decadal trends of the Asian Tropopause Aerosol Layer, Atmos. Chem. Phys., 21, 2745–2764, https://doi.org/10.5194/acp-21-2745-2021, 2021. a
Bourqui, M. S.: Stratosphere-troposphere exchange from the Lagrangian perspective: a case study and method sensitivities, Atmos. Chem. Phys., 6, 2651–2670, https://doi.org/10.5194/acp-6-2651-2006, 2006. a, b
Breuninger, A., Joppe, P., Wilsch, J., Schwenk, C., Bozem, H., Emig, N., Merkel, L., Rossberg, R., Keber, T., Kutschka, A., Waleska, P., Hofmann, S., Richter, S., Ungeheuer, F., Dörholt, K., Hoffmann, T., Miltenberger, A., Schneider, J., Hoor, P., and Vogel, A. L.: Organic aerosols mixing across the tropopause and its implication for anthropogenic pollution of the UTLS, Atmos. Chem. Phys., 25, 16533–16551, https://doi.org/10.5194/acp-25-16533-2025, 2025. a
Brioude, J., Arnold, D., Stohl, A., Cassiani, M., Morton, D., Seibert, P., Angevine, W., Evan, S., Dingwell, A., Fast, J. D., Easter, R. C., Pisso, I., Burkhart, J., and Wotawa, G.: The Lagrangian particle dispersion model FLEXPART-WRF version 3.1, Geosci. Model Dev., 6, 1889–1904, https://doi.org/10.5194/gmd-6-1889-2013, 2013. a, b, c, d
Chau, C. H., Hoor, P., and Tost, H.: Simulated mixing in the UTLS by small-scale turbulence using multi-scale chemistry-climate model MECO(n), Atmos. Chem. Phys., 25, 13123–13140, https://doi.org/10.5194/acp-25-13123-2025, 2025. a
Chen, D., Zhou, T., Guo, D., and Ge, S.: Simulation of the multi-timescale stratospheric intrusion processes in a typical cut-off low over northeast Asia, Atmosphere, 13, 68, https://doi.org/10.3390/atmos13010068, 2021. a
Chen, F. and Dudhia, J.: Coupling an advanced land surface–hydrology model with the Penn State–NCAR MM5 modeling system. Part I: Model implementation and sensitivity, Mon. Weather Rev., 129, 569–585, 2001. a
Cohen, N. Y. and Boos, W. R.: The influence of orographic Rossby and gravity waves on rainfall, Q. J. Roy. Meteor. Soc., 143, 845–851, 2017. a
Das, S. S., Ratnam, M. V., Uma, K. N., Subrahmanyam, K. V., Girach, I. A., Patra, A. K., Aneesh, S., Suneeth, K. V., Kumar, K. K., Kesarkar, A. P., Sijikumar, S., and Ramkumar, G.: Influence of tropical cyclones on tropospheric ozone: possible implications, Atmos. Chem. Phys., 16, 4837–4847, https://doi.org/10.5194/acp-16-4837-2016, 2016. a
Dauhut, T. and Hohenegger, C.: The Contribution of Convection to the Stratospheric Water Vapor: The First Budget Using a Global Storm-Resolving Model, J. Geophys. Res.-Atmos., 127, e2021JD036295, https://doi.org/10.1029/2021JD036295, 2022. a
Dessler, A. and Sherwood, S.: Effect of convection on the summertime extratropical lower stratosphere, J. Geophys. Res.-Atmos., 109, https://doi.org/10.1029/2004JD005209, 2004. a
Emanuel, K.: Tropical cyclones, Annu. Rev. Earth Pl. Sc., 31, 75–104, 2003. a
Evangeliou, N., Grythe, H., Klimont, Z., Heyes, C., Eckhardt, S., Lopez-Aparicio, S., and Stohl, A.: Atmospheric transport is a major pathway of microplastics to remote regions, Nat. Commun., 11, 3381, https://doi.org/10.1038/s41467-020-17201-9, 2020. a
Forster, P. M. D. F. and Shine, K.: Assessing the climate impact of trends in stratospheric water vapor, Geophys. Res. Lett., 29, 10–1, https://doi.org/10.1029/2001GL013909, 2002. a
Fueglistaler, S., Dessler, A., Dunkerton, T., Folkins, I., Fu, Q., and Mote, P. W.: Tropical tropopause layer, Rev. Geophys., 47, https://doi.org/10.1029/2008RG000267, 2009. a, b, c, d
Gordon, A. E. and Homeyer, C. R.: Examining stratosphere-troposphere exchange in an idealized simulation of a tropical cyclone, J. Geophys. Res.-Atmos., 130, e2025JD044044, https://doi.org/10.1029/2025JD044044, 2025. a, b, c, d, e
Hersbach, H., Bell, B., Berrisford, P., Hirahara, S., Horányi, A., Muñoz-Sabater, J., Nicolas, J., Peubey, C., Radu, R., Schepers, D., Simmons, A., Soci, C., Abdalla, S., Abellan, X., Balsamo, G., Bechtold, P., Biavati, G., Bidlot, J., Bonavita, M., De Chiara, G., Dahlgren, P., Dee, D., Diamantakis, M., Dragani, R., Flemming, J., Forbes, R., Fuentes, M., Geer, A., Haimberger, L., Healy, S., Hogan, R., Hólm, E., Janisková, M., Keeley, S., Laloyaux, P., Lopez, P., Lupu, C., Radnoti, G., de Rosnay, P., Rozum, I., Vamborg, F., Villaume, S., and Thépaut, J.: The ERA5 global reanalysis, Q. J. Roy. Meteor. Soc., 146, 1999–2049, 2020. a
Highwood, E. and Hoskins, B.: The tropical tropopause, Q. J. Roy. Meteor. Soc., 124, 1579–1604, 1998. a
Hoinka, K. P.: The tropopause: Discovery, definition and demarcation, Meteorol. Z., 6, 281–303, 1997. a, b
Holton, J. R. and Gettelman, A.: Horizontal transport and the dehydration of the stratosphere, Geophys. Res. Lett., 28, 2799–2802, 2001. a
Holton, J. R., Haynes, P. H., McIntyre, M. E., Douglass, A. R., Rood, R. B., and Pfister, L.: Stratosphere-troposphere exchange, Rev. Geophys., 33, 403–439, 1995. a
Homeyer, C. R., Bowman, K. P., and Pan, L. L.: Extratropical tropopause transition layer characteristics from high-resolution sounding data, J. Geophys. Res.-Atmos., 115, https://doi.org/10.1029/2009JD013664, 2010. a
Houze Jr., R. A.: Clouds in tropical cyclones, Mon. Weather Rev., 138, 293–344, 2010. a
Huang, D., Wan, L.-F., Wan, Y.-S., Chang, S.-J., Ma, X., and Zhao, K.-J.: Gravity Wave Activity and Stratosphere-Troposphere Exchange During Typhoon Molave (2020), J. Trop. Meteorol., 30, 306–326, 2024. a, b, c
Iacono, M. J., Delamere, J. S., Mlawer, E. J., Shephard, M. W., Clough, S. A., and Collins, W. D.: Radiative forcing by long-lived greenhouse gases: Calculations with the AER radiative transfer models, J. Geophys. Res.-Atmos., 113, https://doi.org/10.1029/2008JD009944, 2008. a
James, P., Stohl, A., Forster, C., Eckhardt, S., Seibert, P., and Frank, A.: A 15-year climatology of stratosphere-troposphere exchange with a Lagrangian particle dispersion model: 1. Methodology and validation, J. Geophys. Res.-Atmos., 108, https://doi.org/10.1029/2002JD002637, 2003. a, b
Janić, Z. I.: Nonsingular implementation of the Mellor-Yamada level 2.5 scheme in the NCEP Meso model, Office note (National Centers for Environmental Prediction (U.S.)), 437, https://repository.library.noaa.gov/view/noaa/11409 (last acess: 29 September 2026), 2001. a
Janjić, Z. I.: The step-mountain eta coordinate model: Further developments of the convection, viscous sublayer, and turbulence closure schemes, Mon. Weather Rev., 122, 927–945, 1994. a
Jewtoukoff, V., Plougonven, R., and Hertzog, A.: Gravity waves generated by deep tropical convection: Estimates from balloon observations and mesoscale simulations, J. Geophys. Res.-Atmos., 118, 9690–9707, 2013. a
Jiang, B., Lin, W., Hu, C., and Wu, Y.: Tropical cyclones impact on tropopause and the lower stratosphere vapour based on satellite data, Atmos. Sci. Lett., 21, e1006, https://doi.org/10.1002/asl.1006, 2020. a
Jiang, H. and Tao, C.: Contribution of tropical cyclones to global very deep convection, J. Climate, 27, 4313–4336, 2014. a
Kaluza, T., Kunkel, D., and Hoor, P.: Analysis of Turbulence Reports and ERA5 Turbulence Diagnostics in a Tropopause-Based Vertical Framework, Geophys. Res. Lett., 49, e2022GL100036, https://doi.org/10.1029/2022GL100036, 2022. a
Kitamoto, A.: Digital Typhoon: Typhoon 202018 (MOLAVE) – Detailed Wind Information, National Institute of Informatics (NII), https://agora.ex.nii.ac.jp/digital-typhoon/summary/wnp/l/202018.html.en (last access: 16 December 2025), 2021. a, b, c
Kruse, C. G., Alexander, M. J., Hoffmann, L., van Niekerk, A., Polichtchouk, I., Bacmeister, J. T., Holt, L., Plougonven, R., Šácha, P., Wright, C., Sato, K., Shibuya, R., Gisinger, S., Ern, M., Meyer, C., and Stein, O.: Observed and modeled mountain waves from the surface to the mesosphere near the Drake Passage, J. Atmos. Sci., 79, 909–932, 2022. a
Kunkel, D., Hoor, P., and Wirth, V.: Can inertia-gravity waves persistently alter the tropopause inversion layer?, Geophys. Res. Lett., 41, 7822–7829, 2014. a, b
Kunkel, D., Hoor, P., Kaluza, T., Ungermann, J., Kluschat, B., Giez, A., Lachnitt, H.-C., Kaufmann, M., and Riese, M.: Evidence of small-scale quasi-isentropic mixing in ridges of extratropical baroclinic waves, Atmos. Chem. Phys., 19, 12607–12630, https://doi.org/10.5194/acp-19-12607-2019, 2019. a
Legras, B. and Bucci, S.: Confinement of air in the Asian monsoon anticyclone and pathways of convective air to the stratosphere during the summer season, Atmos. Chem. Phys., 20, 11045–11064, https://doi.org/10.5194/acp-20-11045-2020, 2020. a
Lui, Y. S., Tse, L. K. S., Tam, C.-Y., Lau, K. H., and Chen, J.: Performance of MPAS-A and WRF in predicting and simulating western North Pacific tropical cyclone tracks and intensities, Theor. Appl. Climatol., 143, https://doi.org/10.1007/s00704-020-03444-5, 2021. a
Madala, S., Satyanarayana, A., Srinivas, C., and Kumar, M.: Mesoscale atmospheric flow-field simulations for air quality modeling over complex terrain region of Ranchi in eastern India using WRF, Atmos. Environ., 107, 315–328, 2015. a
Massimo, M.: Data – The impact of orography on the troposphere-to-stratosphere transport during a typhoon event in the tropics, Data Catch-all Repository [data set], doi:10.48700/v4e4p-cbc18, 2026. a
Martina, M., Villalba-Pradas, A., Bartoň, Š., and Šácha, P.: MassiMart/FLEXPART-WRF_AirIntrusions: FLEXPART-WRF AirIntrusions v1.0 (Version FLEXPART-WRF), Zenodo [software], https://doi.org/10.5281/zenodo.22668508, 2026. a
Moustaoui, M., Teitelbaum, H., Van Velthoven, P., and Kelder, H.: Analysis of gravity waves during the polinat experiment and some consequences for stratosphere–troposphere exchange, J. Atmos. Sci., 56, 1019–1030, 1999. a
Nicolas, Q. and Boos, W. R.: A theory for the response of tropical moist convection to mechanical orographic forcing, J. Atmo. Sci., 79, 1761–1779, 2022. a
Orbe, C., Waugh, D. W., and Newman, P. A.: Air-mass origin in the tropical lower stratosphere: The influence of Asian boundary layer air, Geophys. Res. Lett., 42, 4240–4248, 2015. a
Pisso, I., Sollum, E., Grythe, H., Kristiansen, N. I., Cassiani, M., Eckhardt, S., Arnold, D., Morton, D., Thompson, R. L., Groot Zwaaftink, C. D., Evangeliou, N., Sodemann, H., Haimberger, L., Henne, S., Brunner, D., Burkhart, J. F., Fouilloux, A., Brioude, J., Philipp, A., Seibert, P., and Stohl, A.: The Lagrangian particle dispersion model FLEXPART version 10.4, Geosci. Model Dev., 12, 4955–4997, https://doi.org/10.5194/gmd-12-4955-2019, 2019. a
Ploeger, F., Birner, T., Charlesworth, E., Konopka, P., and Müller, R.: Moist bias in the Pacific upper troposphere and lower stratosphere (UTLS) in climate models affects regional circulation patterns, Atmos. Chem. Phys., 24, 2033–2043, https://doi.org/10.5194/acp-24-2033-2024, 2024. a
Riese, M., Ploeger, F., Rap, A., Vogel, B., Konopka, P., Dameris, M., and Forster, P.: Impact of uncertainties in atmospheric mixing on simulated UTLS composition and related radiative effects, J. Geophys. Res.-Atmos., 117, https://doi.org/10.1029/2012JD017751, 2012. a
Romps, D. M. and Kuang, Z.: Overshooting convection in tropical cyclones, Geophys. Res. Lett., 36, https://doi.org/10.1029/2009GL037396, 2009. a
Seinfeld, J. H. and Pandis, S. N.: Atmospheric chemistry and physics: from air pollution to climate change, John Wiley & Sons, ISBN 978-1-118-94740-1, 2016. a
Sherwood, S. C. and Dessler, A. E.: On the control of stratospheric humidity, Geophys. Res. Lett., 27, 2513–2516, 2000. a
Skamarock, W. C., Klemp, J. B., Dudhia, J., Gill, D. O., Barker, D. M., Wang, W., and Powers, J. G.: A description of the advanced research WRF version 2, Tech. rep., https://doi.org/10.5065/D6DZ069T, 2005. a
Smith, R. B., Schafer, P., Kirshbaum, D., and Regina, E.: Orographic enhancement of precipitation inside Hurricane Dean, J. Hydrometeorol., 10, 820–831, 2009. a
Söder, J., Zülicke, C., Gerding, M., and Lübken, F.-J.: High-resolution observations of turbulence distributions across tropopause folds, J. Geophys. Res.-Atmos., 126, e2020JD033857, https://doi.org/10.1029/2020JD033857, 2021. a
Solomon, S., Daniel, J. S., Neely III, R. R., Vernier, J.-P., Dutton, E. G., and Thomason, L. W.: The persistently variable “background” stratospheric aerosol layer and global climate change, Science, 333, 866–870, 2011. a
Solomos, S., Amiridis, V., Zanis, P., Gerasopoulos, E., Sofiou, F., Herekakis, T., Brioude, J., Stohl, A., Kahn, R., and Kontoes, C.: Smoke dispersion modeling over complex terrain using high resolution meteorological data and satellite observations – The FireHub platform, Atmos. Environ., 119, 348–361, 2015. a
Srinivas, C., Bhaskar Rao, D., Yesubabu, V., Baskaran, R., and Venkatraman, B.: Tropical cyclone predictions over the Bay of Bengal using the high-resolution Advanced Research Weather Research and Forecasting (ARW) model, Q. J. Roy. Meteor. Soc., 139, 1810–1825, 2013. a
Stohl, A., Bonasoni, P., Cristofanelli, P., Collins, W., Feichter, J., Frank, A., Forster, C., Gerasopoulos, E., Gäggeler, H., James, P., Kentarchos, T., Kromp-Kolb, H., Krüger, B., Land, C., Meloen, J., Papayannis, A., Priller, A., Seibert, P., Sprenger, M., Roelofs, G., Scheel, H., Schnabel, C., Siegmund, P., Tobler, L., Trickl, T., Wernli, H., Wirth, V., Zanis, P., and Zerefos, C.: Stratosphere-troposphere exchange: A review, and what we have learned from STACCATO, J. Geophys. Res.-Atmos., 108, https://doi.org/10.1029/2002JD002490, 2003a. a
Stohl, A., Wernli, H., James, P., Bourqui, M., Forster, C., Liniger, M. A., Seibert, P., and Sprenger, M.: A new perspective of stratosphere–troposphere exchange, B. Am. Meteor. Soc., 84, 1565–1574, 2003b. a
Stohl, A., Forster, C., Frank, A., Seibert, P., and Wotawa, G.: Technical note: The Lagrangian particle dispersion model FLEXPART version 6.2, Atmos. Chem. Phys., 5, 2461–2474, https://doi.org/10.5194/acp-5-2461-2005, 2005. a, b, c
Sutherland, B. R.: Internal gravity waves, Cambridge University Press, https://doi.org/10.1017/CBO9780511780318, 2010. a
Tang, X.-D., Yang, M.-J., and Tan, Z.-M.: A modeling study of orographic convection and mountain waves in the landfalling typhoon Nari (2001), Q. J. Roy. Meteor. Soc., 138, 419–438, 2012. a
Tao, W.-K., Wu, D., Lang, S., Chern, J.-D., Peters-Lidard, C., Fridlind, A., and Matsui, T.: High-resolution NU-WRF simulations of a deep convective-precipitation system during MC3E: Further improvements and comparisons between Goddard microphysics schemes and observations, J. Geophysi. Res.-Atmos., 121, 1278–1305, 2016. a
Tinney, E. N. and Homeyer, C. R.: A 13-year trajectory-based analysis of convection-driven changes in upper troposphere lower stratosphere composition over the United States, J. Geophys. Res.-Atmos., 126, e2020JD033657, https://doi.org/10.1029/2020JD033657, 2021. a
Ueyama, R., Schoeberl, M., Jensen, E., Pfister, L., Park, M., and Ryoo, J.-M.: Convective impact on the global lower stratospheric water vapor budget, J. Geophys. Res.-Atmos., 128, e2022JD037135, https://doi.org/10.1029/2022JD037135, 2023. a
Venkat Ratnam, M., Ravindra Babu, S., Das, S. S., Basha, G., Krishnamurthy, B. V., and Venkateswararao, B.: Effect of tropical cyclones on the stratosphere–troposphere exchange observed using satellite observations over the north Indian Ocean, Atmos. Chem. Phys., 16, 8581–8591, https://doi.org/10.5194/acp-16-8581-2016, 2016. a, b
Vernier, J.-P., Thomason, L., and Kar, J.: CALIPSO detection of an Asian tropopause aerosol layer, Geophys. Res. Lette., 38, https://doi.org/10.1029/2010GL046614, 2011. a
Wernli, H. and Bourqui, M.: A Lagrangian “1-year climatology” of (deep) cross-tropopause exchange in the extratropical Northern Hemisphere, J. Geophys. Res.-Atmos., 107, ACL-13, https://doi.org/10.1029/2001JD000812, 2002. a, b
Zhu, Q., Liu, Y., Jia, R., Hua, S., Shao, T., and Wang, B.: A numerical simulation study on the impact of smoke aerosols from Russian forest fires on the air pollution over Asia, Atmos. Environ., 182, 263–274, 2018. a