
the Creative Commons Attribution 4.0 License.
the Creative Commons Attribution 4.0 License.
 | 30 Sep 2026
Isotopic fractionation during ice growth by riming and its effect on the d-excess of precipitation

Courtney Schumacher
Frederick J. Longstaffe
Aaron Funk
Matthew D. Shupe
We have investigated the impact of riming on the deuterium excess (d-excess = δ2H − 8 ⋅ δ18O) of precipitation. In mixed-phase clouds, precipitation forms by vapor deposition, where supercooled liquid droplets do not come in contact with ice particles, and by riming, where droplets freeze directly on particle surfaces. While vapor deposited ice generally has higher d-excess than liquid, riming is assumed to occur without isotopic fractionation. We correlated radar-observed mean Doppler velocity (MDV), an independent indicator of riming, with precipitation d-excess (−23 ‰ to +45 ‰) at polar (Summit, Greenland; Ny-Ålesund and Andenes, Norway, Dumont d'Urville, Antarctica), mid-latitude (Cazadero, California) and tropical (Rio Claro, Brazil) sites. The d-excess decreases with increasing MDV (or riming intensity) at all locations, except for winter precipitation at Summit. The low d-excess of rimed ice is consistent with the evaporation of accreted liquid on particle surface before freezing is complete. For Summit winter, cold temperatures and low δ18O of vapor suppress d-excess independently of riming. Calculations show that mixtures of ice growing by riming and vapor deposition (including diamond dust) can produce the observed range of precipitation d-excess in this study. We conclude that riming-driven lowering of d-excess can explain, at least in part, the spatial gradients in surface snow d-excess across Greenland and Antarctica previously attributed to changes in source moisture origin, and the very low d-excess of rainfall attributed solely to sub-cloud evaporation. Precipitation d-excess can be used to estimate the rimed mass fraction, providing observational constraints for improving microphysics schemes in climate models.
- Article
(5795 KB) - Full-text XML
-
Supplement
(4628 KB) - BibTeX
- EndNote


Polar ice cores have long been known to record temperature changes in past climates based on their oxygen (δ18O) and hydrogen (δ2H) isotope compositions (e.g., Dansgaard et al., 1969; Jouzel et al., 2013). The relative composition of these isotopes, namely d-excess (defined as δ2H − 8 ⋅ δ18O), is believed to provide insights into the climatic conditions (temperature, relative humidity, windspeed) of source moisture origin (Dansgaard, 1964; Masson-Delmotte et al., 2005; Jouzel et al., 2013). Lower d-excess of Greenland and Antarctic ice cores from the Last Glacial Maximum (LGM) compared to the Holocene, or in the warming phase compared to the cooling phase of abrupt climate change events in Greenland (Jouzel et al., 2007), has been suggested to indicate substantial and rapid reorganization of the high-latitude hydrological cycles that changed the geographical region of source moisture origin (Johnsen et al., 1989; Jouzel et al., 2007). In addition to temporal differences, the northward increase in d-excess of surface snow across Greenland is attributed to differences in source moisture origin (Johnsen et al., 1989; Masson-Delmotte et al., 2005).
The interpretation of the d-excess of precipitation and ice cores is guided by two primary constraints (Fig. S1 in the Supplement). The first constraint is that d-excess is inherited from the oceanic evaporation source moisture. The global average precipitation d-excess of ∼ +10 ‰ (Dansgaard, 1964) reflects the differential kinetic fractionation of 2H relative to 18O under mean oceanic evaporation conditions (Merlivat and Jouzel, 1979). During evaporation, the lighter isotopologue () diffuses faster than the heavier ones ( and H2H16O) across the vapor–liquid interface, so the vapor is depleted in 18O and 2H relative to the liquid. However, because H2H16O diffuses faster than (Merlivat, 1978), the resulting d-excess of the vapor is higher than that of the liquid. The kinetic increase in vapor d-excess is greater when evaporation occurs at lower relative humidity or warmer sea surface temperatures (Dansgaard, 1964; Merlivat and Jouzel, 1979). In the current climate, oceanic vapor is estimated to have a d-excess range of ∼ +8 ‰ to +13 ‰ (Northern Hemisphere) and ∼ +9 ‰ to +12 ‰ (Southern Hemisphere), suggesting a seasonal d-excess variability of ∼ 3 ‰ to 5 ‰ (Pfahl and Sodemann, 2014). Ocean evaporation in dry conditions (∼ 30 % relative humidity) may result in vapor with d-excess of about +25 ‰ (Pfahl and Sodemann, 2014). However, precipitation d-excess in the adjacent land areas generally does not correspond to such higher d-excess values because precipitation results from a mixture of moisture sources with different evaporation histories (Pfahl and Sodemann, 2014).
The second constraint is related to ice growth in mixed phase clouds, where a supercooled liquid phase co-exists with ice and vapor at temperatures above approximately −38 °C (Pruppacher and Klett, 2010; Houze, 2014). When ice crystals grow by vapor deposition (i.e. the Wegener–Bergeron–Findeisen (WBF) process), the d-excess of ice is higher than the co-existing liquid or vapor. In the WBF process, liquid droplets do not come in direct contact with the ice particles, but instead evaporate owing to a higher saturation vapor pressure over liquid than ice. The vapor then diffuses and is deposited on ice particles (Houze, 2014; Pruppacher and Klett, 2010). As H2H16O diffuses faster than , the d-excess of ice may be ∼ 30 ‰ higher than that of the liquid, depending upon the level of supersaturation in the vapor with respect to ice (Jouzel and Merlivat, 1984; Uemura et al., 2005; Casado et al., 2016).
Because of this large fractionation during ice growth by vapor deposition, source moisture d-excess may be more directly reflected in “warm rain” that does not involve an ice phase. However, precipitation over land and oceans forms dominantly by ice-phase processes (Mülmenstädt et al., 2015). Even in the tropics where warm rain is most prevalent, clouds producing only warm rain are largely confined to shallow isolated oceanic convective cells and onshore tropical flow over land (Schumacher and Houze, 2003; Mülmenstädt et al., 2015). This implies that the lower d-excess commonly observed in precipitation cannot be explained by source moisture conditions alone and must reflect an additional in-cloud process that reduces d-excess.
In addition to the WBF process, ice growth in mixed phase clouds can occur by riming. Unlike the WBF process, riming involves the collision of ice particles and liquid droplets, leading to the direct freezing of droplets on particle surfaces (Pruppacher and Klett, 2010; Houze, 2014). Collisions between ice particles form aggregates or snow-flakes, while the colliding ice particles themselves may have formed by the WBF or riming process.
A fundamental assumption in existing interpretations of precipitation d-excess is that riming occurs without an isotopic fractionation (Federer et al., 1982; Jouzel and Merlivat, 1984; Ciais and Jouzel, 1994; Bailey et al., 2025). That is, the rimed ice has the same isotopic composition and d-excess as the liquid. To the best of our knowledge, this assumption has not been thoroughly explored in the literature.
Evidence from several field, laboratory and modeling studies suggests that isotopic fractionation may indeed be involved in riming. For example, Warburton and deFelice (1986) and Demoz et al. (1991) analyzed freshly fallen snow in the Sierra Nevada mountains and observed that the δ18O of snow was lower when ice crystal habits were typical of vapor deposition (dendrites, columns and plates) compared to graupel and other rimed particles. Lowenthal et al. (2011) used sulfate concentrations in cloud water and Rocky Mountain snow to estimate the fraction of ice that formed by riming and observed that the δ18O of snow increased as the rimed fraction increased.
Bailey et al. (1969) conducted laboratory experiments in an icing tunnel (air temperature = −20 °C) to study isotopic fractionation during the freezing of supercooled droplets on a cold surface (riming). The experiments were conducted at liquid water concentrations (LWC) of 1 or 5 g m−3. In both experiments, the δ18O and δ2H values of the frozen material were slightly higher than those of the supercooled liquid. A modeling study by Jouzel et al. (1985) corroborated the laboratory results of Bailey et al. (1969). At lower LWC, the droplets froze completely and rapidly (“dry growth” regime), while at higher LWC, the supercooled liquid was considered to have partially evaporated before freezing was complete (“wet growth” regime). These studies were conducted in the context of hailstone growth. Hailstones are an extreme case of riming distinguished by their larger size (> 5 mm) compared to rimed particles (Pruppacher and Klett, 2010). A continuum of ice particles from unrimed to graupel and hail has been shown based on their mass-size relationships (Lin and Colle, 2011) and the physics of isotopic fractionation in hailstones is equally applicable to the riming of smaller particles in mixed phase clouds.
More significantly than the slightly higher δ values, the d-excess of rimed ice in the laboratory and modeling studies was lower than that of the supercooled liquid. Natural hailstones analyzed by Jouzel et al. (1985) had low (< +10 ‰) d-excess values. Increased riming of snow from the Rocky Mountains (Lowenthal et al., 2011) also appears to correspond to lower d-excess values reported in Lowenthal et al. (2016).
Studies of the mechanism of riming (e.g., Macklin and Payne, 1967; Pruppacher and Klett, 2010; Korolev et al., 2017, and references therein) suggest that when a liquid droplet collides with an ice particle, it may lose some water by splashing, depending on the impact velocity. The drop initially freezes with a thin frozen shell as the latent heat of fusion released in the process warms the inner part of the droplet. If latent heat is dissipated fast enough to keep the particle surface temperature (Ts) a few degrees below 0 °C, the accreted water freezes in the dry growth regime, with or without the loss of some accreted water by shedding. Conversely, if heat dissipation is slower – for example, due to high droplet concentration or increased frequency of droplet-particle collisions – Ts rises and the accreted water spreads to form a thin film on the particle surface. In that case, the accreted water freezes in the wet growth regime where the liquid film may be partially evaporated before freezing is complete. This evaporation is driven by the vapor pressure difference between the warmer particle surface and the ambient air.
The liquid film during wet growth may be persistent (Ts = 0 °C) or transient, depending on the particle size, LWC, and ambient air temperature (Ta). The minimum LWC required to sustain a persistent liquid film is the Schumann-Ludlam limit (Pruppacher and Klett, 2010). Calculations using a heat balance equation (Pruppacher and Klett, 2010) show that for small particles of ∼ 2 mm, this limit may be reached in stratiform clouds at Ta > −10 to −5 °C, particularly when LWC increases due to embedded convection or enhanced turbulence. Even below this limit, Mossop (1976) showed that a transient liquid film is sufficient for wet growth (with evaporation of the liquid) on small particles (0.5 to 2 mm) at Ta = −5 °C when Ts rises above the ambient by more than 0.6 °C. Wet growth – whether from a persistent or transient liquid film – is therefore expected in stratiform clouds at air temperatures warmer than approximately −10 °C, consistent with the Hallett-Mossop riming zone (∼ −8 to −3 °C) within which supercooled liquid water is most abundant (Mossop, 1976). Below about −10 °C, riming would occur predominantly by dry growth process.
Ice growth by riming frequently occurs in precipitation at all latitudes and across various meteorological conditions (Korolev et al., 2017). It is estimated that in mixed phase regions, the riming process is active in about half of the stratiform clouds and almost all of the convective clouds (Korolev et al., 2017). For example, riming is estimated to contribute about 30 % to 50 % of the surface snowfall mass in the Sierra Nevada Mountains (Mitchell et al., 1990; Lowenthal et al., 2011) and near Sapporo, Japan (Harimaya and Sato, 1992). Arctic precipitation at Ny-Ålesund, Svalbard and Hyytiälä, Finland includes up to 40 % of the snow mass from riming (Moisseev et al., 2017; Chellini and Kneifel, 2024). At Oliktok Point, Alaska, about two thirds of Arctic precipitation forms by riming (Fitch and Garrett, 2022). Riming has also been observed in snowfall at the South Pole (Ohtake, 1978). In eastern Antarctic coastal precipitation at Dumont d'Urville, a mean riming growth of about 30 % was estimated with ∼ 11 % of the rimed particles being fully developed graupel (Grazioli et al., 2017).
Riming increases the particle mass and density and the particle becomes more rounded in shape (Pruppacher and Klett, 2010; Houze, 2014). These changes result in a generally higher terminal fall velocity of rimed particles compared to unrimed particles, which grow by vapor deposition (Locatelli and Hobbs, 1974; Weiss et al., 1977; Heymsfield and Kajikawa, 1987; Pruppacher and Klett, 2010; Heymsfield et al., 2013; Garrett and Yuter, 2014; Houze, 2014; Kneifel and Moisseev, 2020; Matrosov, 2023). A lightly rimed snowflake might fall at 0.5–1 m s−1 while a dense graupel particle falls at > 1.5 m s−1 (Locatelli and Hobbs, 1974). So, terminal velocity is essentially a proxy for the degree of riming.
While the fall velocity of rimed or unrimed particles is dependent on physical characteristics (size, shape, mass and density), the d-excess would respond to the microphysical process (WBF or riming) responsible for the phase change from vapor or liquid to ice. Consequently, it may be possible to distinguish d-excess change resulting from ice growth purely by the WBF process (unrimed) from that resulting from riming based on the higher fall velocities (> ∼ 1 m s−1) of rimed particles.
In this study, we use the terminal fall velocity as an independent parameter to explore the impact of riming on d-excess in polar to tropical precipitation (observed d-excess range ∼ −23 ‰ to +45 ‰). We also use photographic images of precipitating snowflakes to document riming and vertical profiles of temperature and humidity derived from radiosondes to characterize cloud processes at the polar locations in our study. Our findings reveal that precipitation d-excess values decrease with an increasing fraction of particle mass attributed to riming. We conclude that d-excess is a powerful indicator of riming or vapor deposition growth during precipitation formation and may be used to characterize changes in cloud microphysical processes at a variety of spatial or temporal scales, with implications for the interpretation of d-excess records in ice cores and other high-resolution paleoclimate archives.
2.1 Study locations
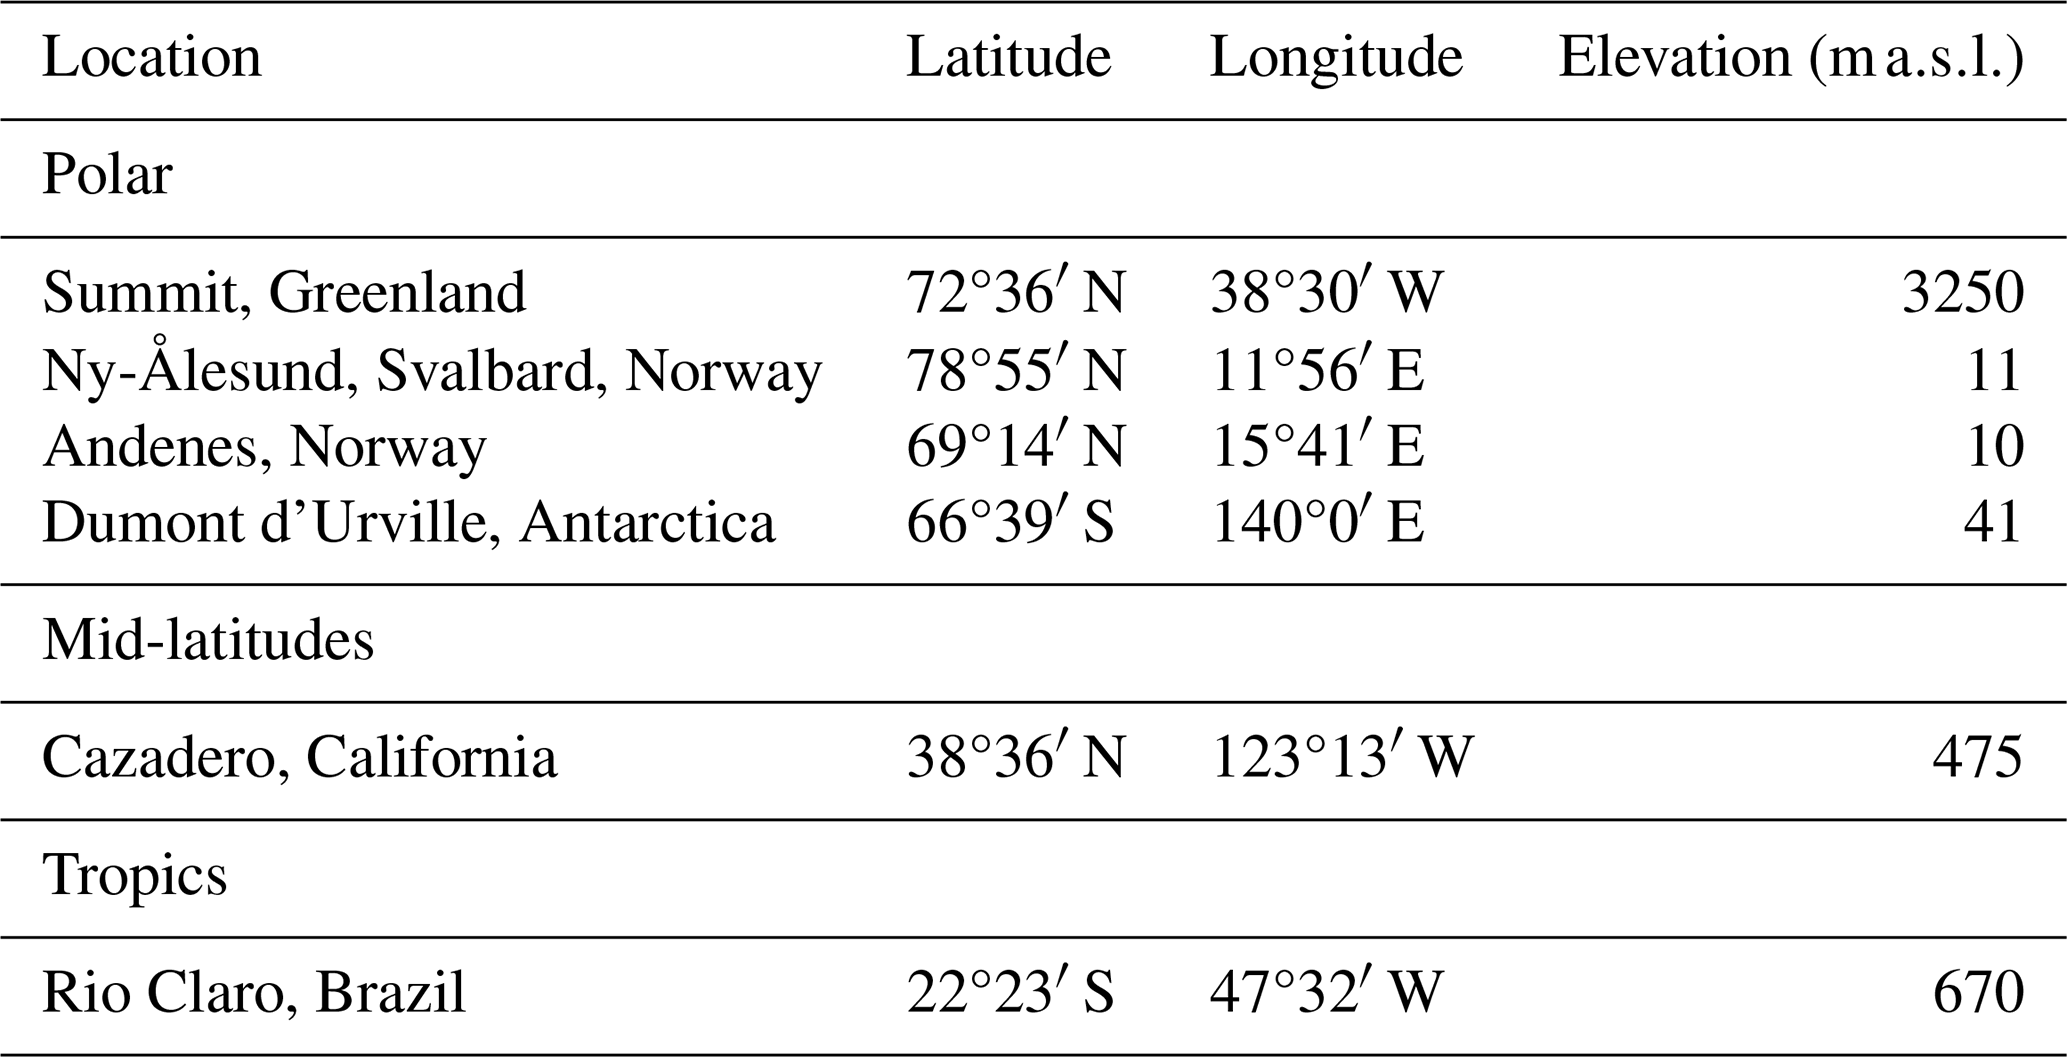
To test our hypothesis that d-excess values in precipitation reflect microphysical processes associated with riming, it is important to consider concurrent data for isotope compositions and terminal fall velocities on a daily or shorter time scale. This approach minimizes data averaging much beyond the precipitation events where isotope compositions are acquired. Likewise, because the nature of cloud processes is essentially the same on the global scale (Pruppacher and Klett, 2010; Houze, 2014), data from the polar to the tropical regions would be important. Table 1 lists the coordinates and elevation and Fig. 1 shows the locations where we have successfully compiled concurrent isotope and terminal fall velocity data. In addition, vertical profiles of temperature and relative humidity were obtained for the polar locations to better characterize the cloud microphysical processes.
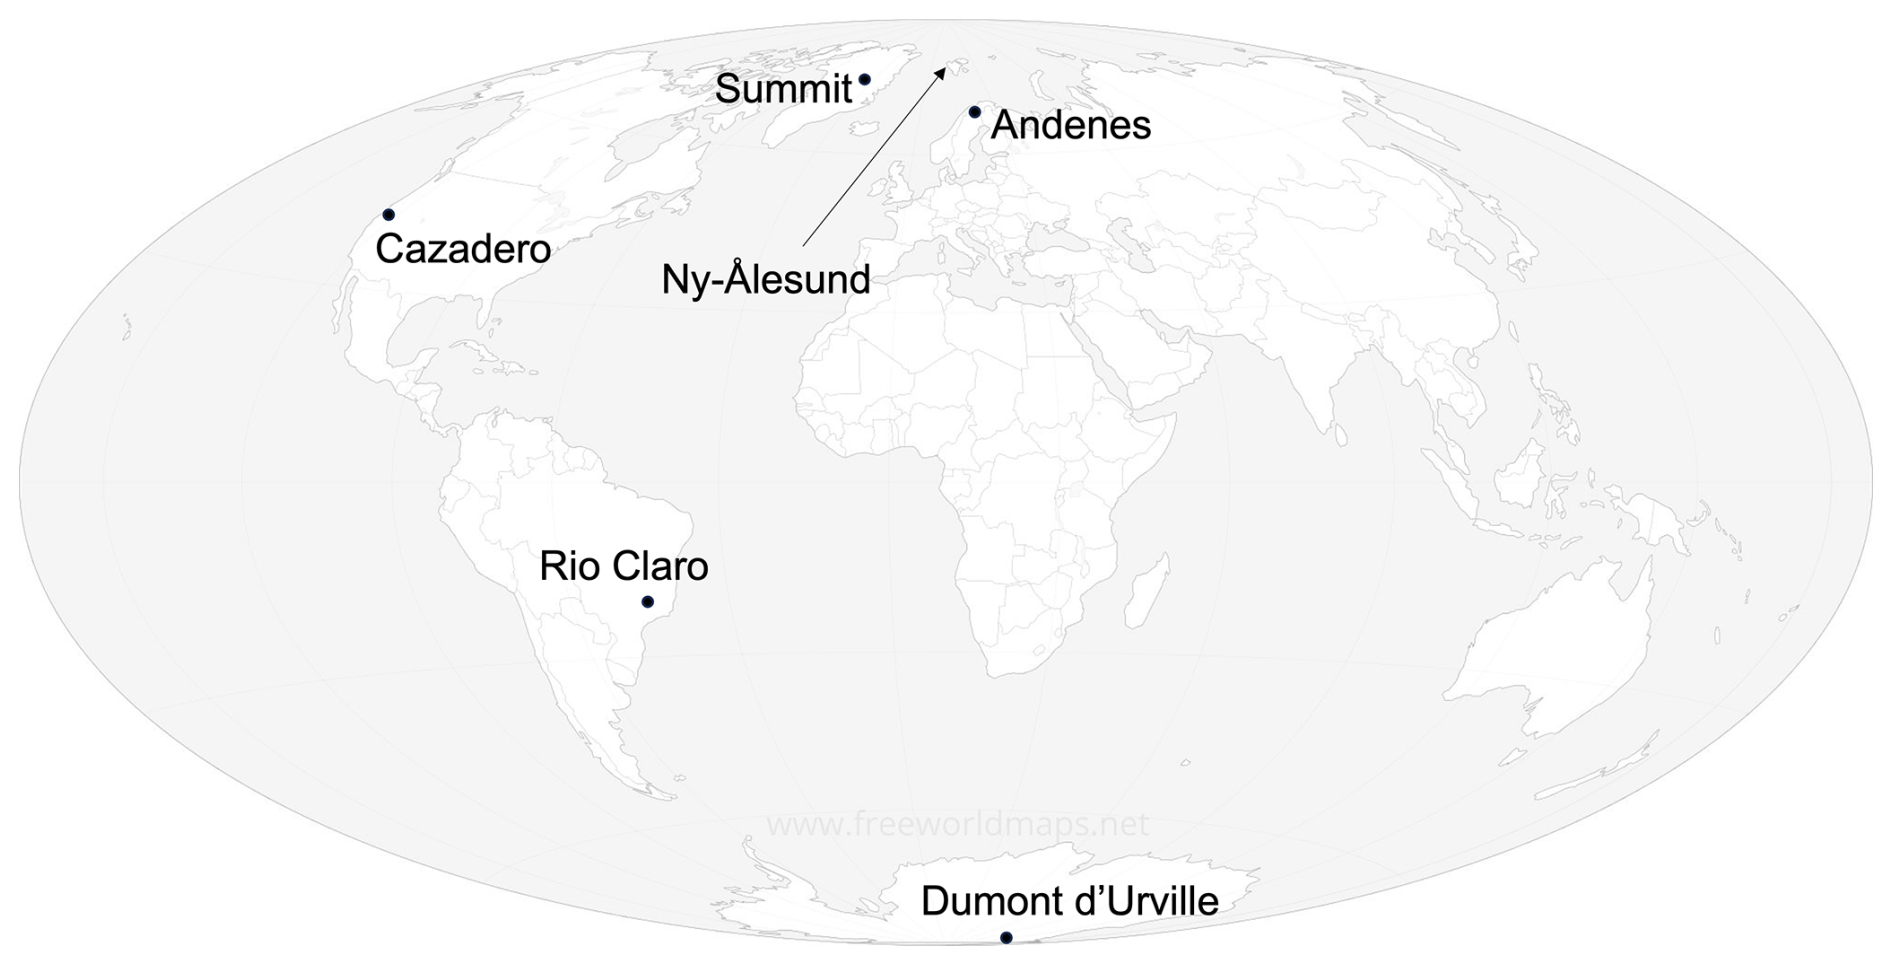
Figure 1Map showing the study locations (base map from https://www.freeworldmaps.net/printable/hammer-worldmap-hd.jpg, last access: 25 November 2025).
2.2 Terminal fall velocity
The terminal fall velocity of ice particles is commonly determined using vertically-pointing ground-based Doppler radars (Houze, 2014) or particle imaging devices (Garrett and Yuter, 2014; Praz et al., 2017). Doppler velocities from profiling radars have been reported at each of the study locations for all or part of the same time period as the isotope samples. In addition, a limited amount of concurrent terminal fall velocity data acquired with a snowflake camera were retrieved for Summit, Greenland.
Table 1Coordinates and surface elevations (meters above sea level) of study locations.
2.3 Doppler velocity and terminal fall speed in stratiform clouds
The use of Doppler radars for measuring the terminal fall velocities of hydrometeors has been extensively described in the literature (e.g., Weiss and Hobbs, 1975; Orr and Kropfli, 1999; Protat and Williams, 2011; Houze, 2014). Briefly, Doppler radars used for cloud and precipitation studies emit microwave radiation that is reflected by various hydrometeors (snow, ice or rain drops) and the travel time, strength, and phase of the returned signal are used to determine the altitude (or range), reflectivity, and Doppler velocity of the reflecting objects (Houze, 2014). The reflectivity values are reported as the “effective reflectivity” (Ze) in units of mm6 m−3 (or in decibels, dBZ = 10 log10Ze). The Doppler velocity is denoted as the mean Doppler velocity (MDV) with units of m s−1 and is the reflectivity-weighted mean of the measured Doppler spectrum. An altitude correction is applied to Doppler velocities owing to the lower air density (pressure) at higher elevations (Heymsfield et al., 2013): MDVo = MDV. Here, ρ is air density, P is atmospheric pressure in hPa, and the subscripts o and h, respectively, are mean sea level and the height where the measurement is made. Note that we are using the convention that positive MDV is towards the radar such that lower MDV values indicate weaker downward motion.
MDV is determined by the terminal fall velocity of the hydrometeor (Vt) and the vertical air motion (Va): MDV = Vt+Va (Orr and Kropfli, 1999; Houze, 2014). In stratiform clouds, small-scale vertical air motions are both upwards and downwards (Orr and Kropfli, 1999; Houze, 2014). It has been shown that these small-scale air motions cancel out when MDV is averaged over a period of at least 20–30 min in stratiform or anvil cloud regions (Mosimann, 1995; Orr and Kropfli, 1999; Protat and Williams, 2011). Then, MDV ≈ Vt. The assumption of cancelling vertical air motions is not valid for convective clouds where downdrafts and updrafts are significantly higher and persistent, such that the use of MDV for characterizing the rimed nature of snow particles is only feasible for stratiform precipitation (Mosimann, 1995; Orr and Kropfli, 1999).
Terminal velocities and particle size distributions from field campaigns conducted over a wide temperature range (−86 to 0 °C) were evaluated by Heymsfield et al. (2013). All else being equal (e.g., particle shape, degree of riming), the MDV (and reflectivity) is lower when precipitation consists of smaller particles, which in general are produced in colder clouds. As a result, seasonal differences in particle size may potentially mask the increase in MDV due to riming (Heymsfield et al., 2013; Chellini and Kneifel, 2024).
2.4 Doppler velocity and precipitation phase
While d-excess is measured in precipitation samples collected on the ground, the altitude at which the MDV values can be used to characterize riming depends on the phase (snow or rain) of precipitation. For snowfall, MDV close to the ground at a height free of ground interference can be used (Weiss and Hobbs, 1975; Orr and Kropfli, 1999). In the case of rainfall, however, the MDV aloft in the snow region above the melting level is used (Fig. S2).
Stratiform rain results from the melting of snow particles in a 200 to 500 m thick layer called the melting layer (Fig. S2; Pruppacher and Klett, 2010; Houze, 2014). The height of the melting layer above ground is typically less than 3 km in mid- to high-latitudes and between 4 and 5 km in the tropics. Within the melting layer, the snowflakes generally melt without further growth or breaking into smaller drops (Ohtake, 1969; Karrer et al., 2022). Weiss et al. (1977) investigated the use of MDV during rainfall to determine the rimed nature of snow particles above the melting layer. They used the fall velocity of rimed and unrimed snow particles of known mass measured in situ by Locatelli and Hobbs (1974) as the fall velocity of snow (Vs) above the melting layer. The relationship between raindrop mass and fall velocity (Atlas et al., 1973) was used to obtain the fall velocity of raindrops just below the melting layer (Vr). Based on a correlation of Vs versus Vr, graupel and heavily rimed particles could be differentiated from unrimed or lightly rimed aggregates, as validated against field measurements (Weiss et al., 1977). Mosimann (1995) and Zawadzki et al. (2005) have also suggested that riming during rainfall can be characterized using particle fall velocities in the snow region.
The melting layer is identified by a distinct peak in the profile of radar reflectivity or “bright band” (Fig. S2; Pruppacher and Klett, 2010; Houze, 2014), which occurs when ice particles become coated in water and appear brighter to the radar because of the dielectric difference between water and ice. Following White et al. (2002), the top of the melting layer is identified at the inflection point in the MDV vertical gradient just above the bright band, where the profile transitions from a nearly constant MDV in the snow region above to a rapidly increasing MDV within the melting layer (Fig. S2). The bottom of the melting layer is similarly identified at the inflection point just below the bright band, when all the ice particles have fully melted into smaller rain drops and the MDV transitions from its maximum within the melting layer to the more gradual increase toward the surface characteristic of the rain region below. We used this approach to retrieve the MDV above the melting layer at Cazadero, California and Rio Claro, Brazil where all surface precipitation was in the form of rainfall. The same approach was used for Ny-Ålesund and Andenes, Norway when rainfall at the surface was indicated by a bright band aloft in the reflectivity profiles.
2.4.1 MASC fall velocity and snowflake photographs at Summit
Particle fall velocities for some of the days of isotope sampling at Summit were available from a Multi-Angle Snowflake Camera (MASC), which captures photographs of snow particles in free fall from multiple angles while simultaneously measuring their fall velocity (Garrett and Yuter, 2014). The cameras are automatically triggered by near-infrared detectors that are vertically offset by 3.2 cm. The minimum particle size detected by the MASC is 0.1 mm. The fall velocity is calculated by the time difference when the upper and lower detectors are triggered successively within 1 s, equivalent to a minimum fall speed of 0.03 m s−1.
In addition to the photographs captured by the MASC, an ice particle imaging camera (IcePIC), which consisted of a manually operated camera attached to a microscope, is a part of the instrument cluster of the ICECAPS observatory at Summit (Shupe et al., 2013). The device is housed in a wooden shed that prevents contamination from blowing snow during the collection of images. Falling snow was collected on glass slides that were cleaned with isopropyl/glycol mixture, dried, and placed on a wooden table. This table, however, was in an open area where blowing snow contamination on the slide was possible. To minimize this effect, the slides were placed on either side of a vertical barrier to be differentiated as upwind or downwind locations. Sample accumulation times ranged from a few minutes to several hours depending upon precipitation rate. The slides were then observed with the IcePIC system. The microscope stage and air around the device were at or near ambient temperature. The IcePIC photographs and accompanying notes from the microscopic examination were retrieved from the ICECAPS database (https://psl.noaa.gov/arctic/observatories/summit/, last access: 31 July 2023). The photographs may be used to qualitatively characterize riming on ice crystals during precipitation events, but may not be representative of particle habits in daily precipitation.
2.5 Doppler velocity and isotope data at the study locations
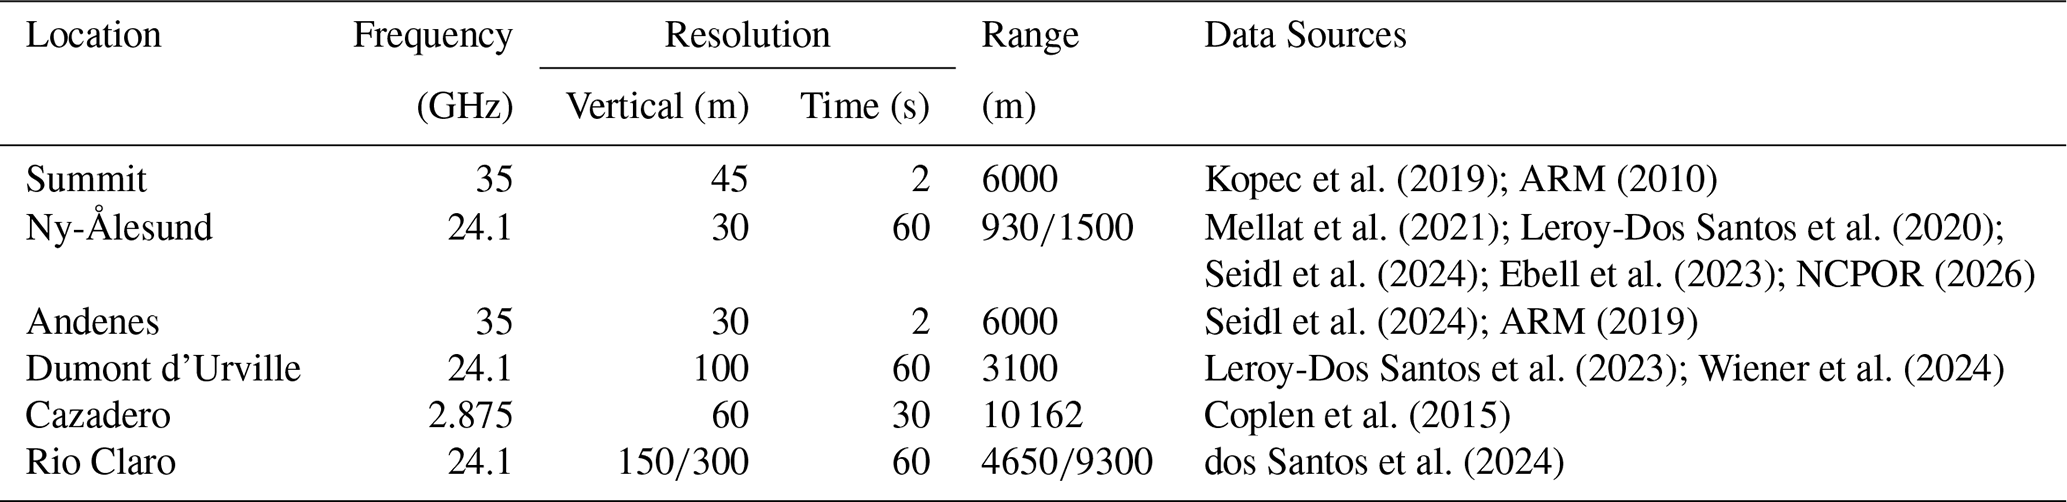
Table 2 shows the details of the vertically-pointing Doppler radars deployed at the locations in this study along with the sources of isotope and radar data. Isotopic compositions of precipitation were obtained from published studies. The oxygen and hydrogen isotope analyses were conducted by standard methods using mass-spectrometers or laser analyzers and the analytical details are available in the original publications. As noted previously, d-excess is defined as: d(‰) = δ2H − 8 ⋅ δ18O, where δ = (, and R is the isotope ratio (18O/16O) or (2H/H) in a sample or the VSMOW (Vienna Standard Mean Ocean Water) isotope standard.
Table 2Characteristics of Doppler radar and sources of isotope or radar data at the study locations
The dates and times of data averaging for reflectivity and MDV are provided in Table S1 in the Supplement. At the polar locations, precipitation samples were collected on a daily (∼ 24 h) time scale while those at the mid-latitude and tropical locations were collected at a higher frequency (∼ 30 min or less). We note that daily isotope sampling at the polar locations includes parts of two calendar days. To be precise, we would average the MDV over the same 24 h period. However, radar data were not always available for two consecutive days and in some cases, there was no or little precipitation on the first day. Sensitivity testing with available data for 24 h average MDV over consecutive days of precipitation indicated a negligible difference from the daily average for one calendar day.
2.5.1 Summit
Kopec et al. (2019) reported the isotopic compositions of daily precipitation between July 2011–September 2014. The d-excess values range from +6.4 ‰ to +34.9 ‰ in the summer (June, July, August or JJA) and from −10.6 ‰ to +15.9 ‰ in the winter (December, January, February or DJF). During the other seasons, d-excess values range from −9.3 ‰ to +25.4 ‰.
Snowfall at Summit is generally weak (Shupe et al., 2013) and average daily values of reflectivity and MDV were calculated for the days concurrent with isotope sampling. The reflectivity and terminal fall velocity at Summit increase as snow particles fall toward the ground surface, indicating continuous particle growth (Castellani et al., 2015; Pettersen et al., 2018). Therefore, the lowest radar level (∼ 200 m) was used that is free of ground clutter (Shupe et al., 2013; Castellani et al., 2015). An air density correction was applied to MDV values as the ground elevation at Summit station is 3250 m.
2.5.2 Ny-Ålesund and Andenes
Leroy-Dos Santos et al. (2020) reported the isotopic compositions of daily precipitation during 2014–2018 from Ny-Ålesund, located on the west coast of Svalbard, Norway. The samples consisted of snow, rain and “melt”, likely referring to a mixture of rain and snow. Smaller datasets of rain and snow samples were reported for July–August 2018 (Mellat et al., 2021) and February–March 2020 (Seidl et al., 2024). Isotopic composition of Andenes precipitation (rain and snow) for February–March 2020 also was reported by Seidl et al. (2024). The 2020 dataset from Ny-Ålesund and Andenes included a limited number of sub-daily samples. The d-excess values for the entire Ny-Ålesund dataset ranged from −55.8 ‰ to +37.6 ‰. The lowest values were measured for snow samples collected on 12 December 2016 (−55.8 ‰) and 14 April 2018 (−51.7 ‰) at Ny-Ålesund. Samples selected for this study (based on radar data availability) have a d-excess range from −8.2 ‰ to +45.2 ‰ at Ny-Ålesund and from −1.0 ‰ to +30.2 ‰ at Andenes.
Doppler radar data at Ny-Ålesund were obtained from two co-located MRR-2 instruments deployed by research groups from Germany (2017–2020) and India (2014–2017). The results from the two instruments were compared on overlapping measurement days; the inter-instrument mean MDV difference (0.023 m s−1) was negligible and no offset correction was applied. Daily or sub-daily averages of reflectivity and MDV were obtained for the days concurrent with isotope sampling. The precipitation phase was identified from the presence or absence of a bright band in vertical profiles of reflectivity. When present, the top of the bright band generally was at about 600–900 m above ground. As both snow and rain at Ny-Ålesund and Andenes may occur within a single day, we also evaluated sub-daily vertical profiles of reflectivity and Doppler velocity in the 0–12 h and 12–24 h time intervals. In many cases, the bright band occurred only in one interval and the radar reflectivity and MDV profiles generally were not usable for correlation with the daily values of d-excess, except for some of the 2020 samples that were collected at sub-daily intervals (Table S1). These constraints on radar data did not allow for the use of the lowest d-excess samples (< −10 ‰) in this study. For snow precipitation, the 150-m level above ground was used to avoid ground interference with the radar measurements at lower levels.
2.5.3 Dumont d'Urville
The isotopic compositions of daily precipitation from January–July 2019 and January–December 2020 were reported by Leroy-Dos Santos et al. (2023). Wiener et al. (2024) reported the corresponding radar reflectivity and Doppler velocity. As precipitation at Dumont d'Urville is stratiform (Wiener et al., 2024), daily averages of reflectivity and MDV were calculated. These values increase with decreasing altitude, consistent with snow particles growing as they fall towards the ground surface. However, sub-cloud sublimation of snow may be significant in the lower most ∼ 1 km due to strong katabatic winds blowing off of the Antarctic continent (Grazioli et al., 2017; Wiener et al., 2024).
Sublimation decreases the reflectivity of snow at lower altitudes (Durán-Alarcón et al., 2019). Katabatic winds may consistently increase the Doppler velocity (Wiener et al., 2024) and MDV may no longer be equated with the terminal fall velocity. We used the vertical profiles of reflectivity below 2.5 km to identify and exclude sublimation-affected data (Durán-Alarcón et al., 2019). The profiles were classified into two groups. One group – which is excluded from the analysis – shows a substantial decrease in Ze below ∼ 1 km that indicates sublimation (Fig. S3). In the second group, reflectivity below ∼ 1 km did not change significantly and the MDV values were retrieved for the 300-m level, which is the lowest level at this location free of ground interference with radar measurements (Wiener et al., 2024), and avoids the katabatic layer that affects the lowest ∼ 200–500 m at this location (Vignon et al., 2019). The d-excess of the selected samples of daily precipitation ranges from −5.1 ‰ to +14.0 ‰.
2.5.4 Cazadero
Coplen et al. (2015) provided the isotopic compositions of precipitation from multiple events between January to March 2005–2010 and radar reflectivity and Doppler velocity data for several of these events were available. The precipitation samples were collected with an automated sampling device at ∼ 30 min intervals. We selected the time intervals where a bright band in radar reflectivity was clearly present and estimated the top of the melting layer using the vertical gradients of MDV and reflectivity (White et al., 2002). Average MDV values just above this height were calculated for 30 min intervals concurrent with isotope samples. The top of the melting layer for periods of interest in this study was ∼ 2 to 3 km above ground and the MDV values were adjusted for air density at that altitude. The d-excess of samples selected for this study ranged from −22.9 ‰ to +20.5 ‰.
2.5.5 Rio Claro
The isotopic composition of tropical rainfall at Rio Claro, Brazil was reported by dos Santos et al. (2024). Rainfall was sampled at 5–10 min intervals during precipitation events lasting for about an hour to several hours. Three events (8 October 2019, 10 December 2019 and 5 January 2020) had a sufficiently long stratiform period to allow averaging over 25 to 30 min intervals (dos Santos et al. 2024). The top of the melting layer, determined using the same approach outlined above for Cazadero, ranged from ∼ 4 to 4.5 km and an altitude correction was applied to average MDV values. The d-excess values of samples from the selected events ranged from +4.5 ‰ to +21.9 ‰.
2.5.6 Radiosonde profiles of temperature and relative humidity
Vertical profiles of temperature (T) and relative humidity (RH) from radiosonde soundings were retrieved for Summit (Shupe et al., 2013), Ny-Ålesund (Maturilli and Kayser, 2016, 2017; Maturilli and Dünschede, 2023) and Dumont d'Urville (Météo-France: https://donneespubliques.meteofrance.fr/, last access: 12 June 2026). Height-resolved ice supersaturation index (SI) profiles were computed from daily radiosonde soundings interpolated to a uniform 100 m vertical grid and matched to precipitation isotope sample dates. SI was defined as (, where is the vapor pressure of water vapor in the air computed from the radiosonde-measured RH and T, eice(T) and ew(T) are, respectively, the saturation vapor pressure over ice and over liquid water at the given temperature, both computed following Murphy and Koop (2005).
Ice supersaturation is expressed in two equivalent forms in this paper: as a percentage (SI) for radiosonde profile analysis, and as a dimensionless ratio Si = in the isotope fractionation equations (Jouzel and Merlivat, 1984). We also define SIw as the value of SI at liquid water saturation: SIw = . Because , it follows that SI = SIw when RH = 100 % – that is, SI reaches a value of 1 at water saturation. As approaches 1, supercooled liquid droplets can coexist with ice crystals and riming growth would be enabled (Korolev and Mazin, 2003). When SI > 0 but , the air is supersaturated with ice but well below saturation with liquid water and ice growth occurs predominantly by vapor deposition.
We first examine the correlation of d-excess with riming intensity at Summit, Greenland using photographs, fall velocity from the Multi-Angle Snowflake Camera (MASC), and MDV from vertically pointing radar, followed by an examination of cloud microphysical conditions using radiosonde soundings. We then present d-excess–MDV correlations at the remaining sites and radiosonde-derived cloud profiles at Ny-Ålesund and Dumont d'Urville. Finally, we examine the effects of sub-cloud rain evaporation and in-cloud processes on d-excess variability, including a process-weighted calculation of d-excess based on the vapor deposition and riming growth frameworks of Jouzel and Merlivat (1984) and Jouzel et al. (1985).
3.1 Riming and d-excess at Summit
3.2 Snow particle photographs
We reviewed hundreds of IcePIC photographs for the 2011–2014 period that were concurrent with the isotope samples. Selected images corresponding to a range of d-excess values in daily precipitation are shown in Table 3. High d-excess (∼ +22 ‰) occurs in the summer (JJA) when snowfall contains unrimed single crystals or aggregates of various shapes, including columns, bullets, stellar plates or dendrites. Lower summer d-excess (∼ +14 ‰) is associated with snow particles showing heavier riming. The original crystal shapes of stellar plates and dendrites are preserved but riming growth covers almost the entire particle surface.
Table 3Photographs of snowflakes during precipitation events at Summit, Greenland captured with the IcePIC system. The scale bar in each photograph is ∼ 500 µm (black) or ∼ 100 µm (red). Snowflakes shown may not be representative of daily precipitation for which the d-excess values are listed here.
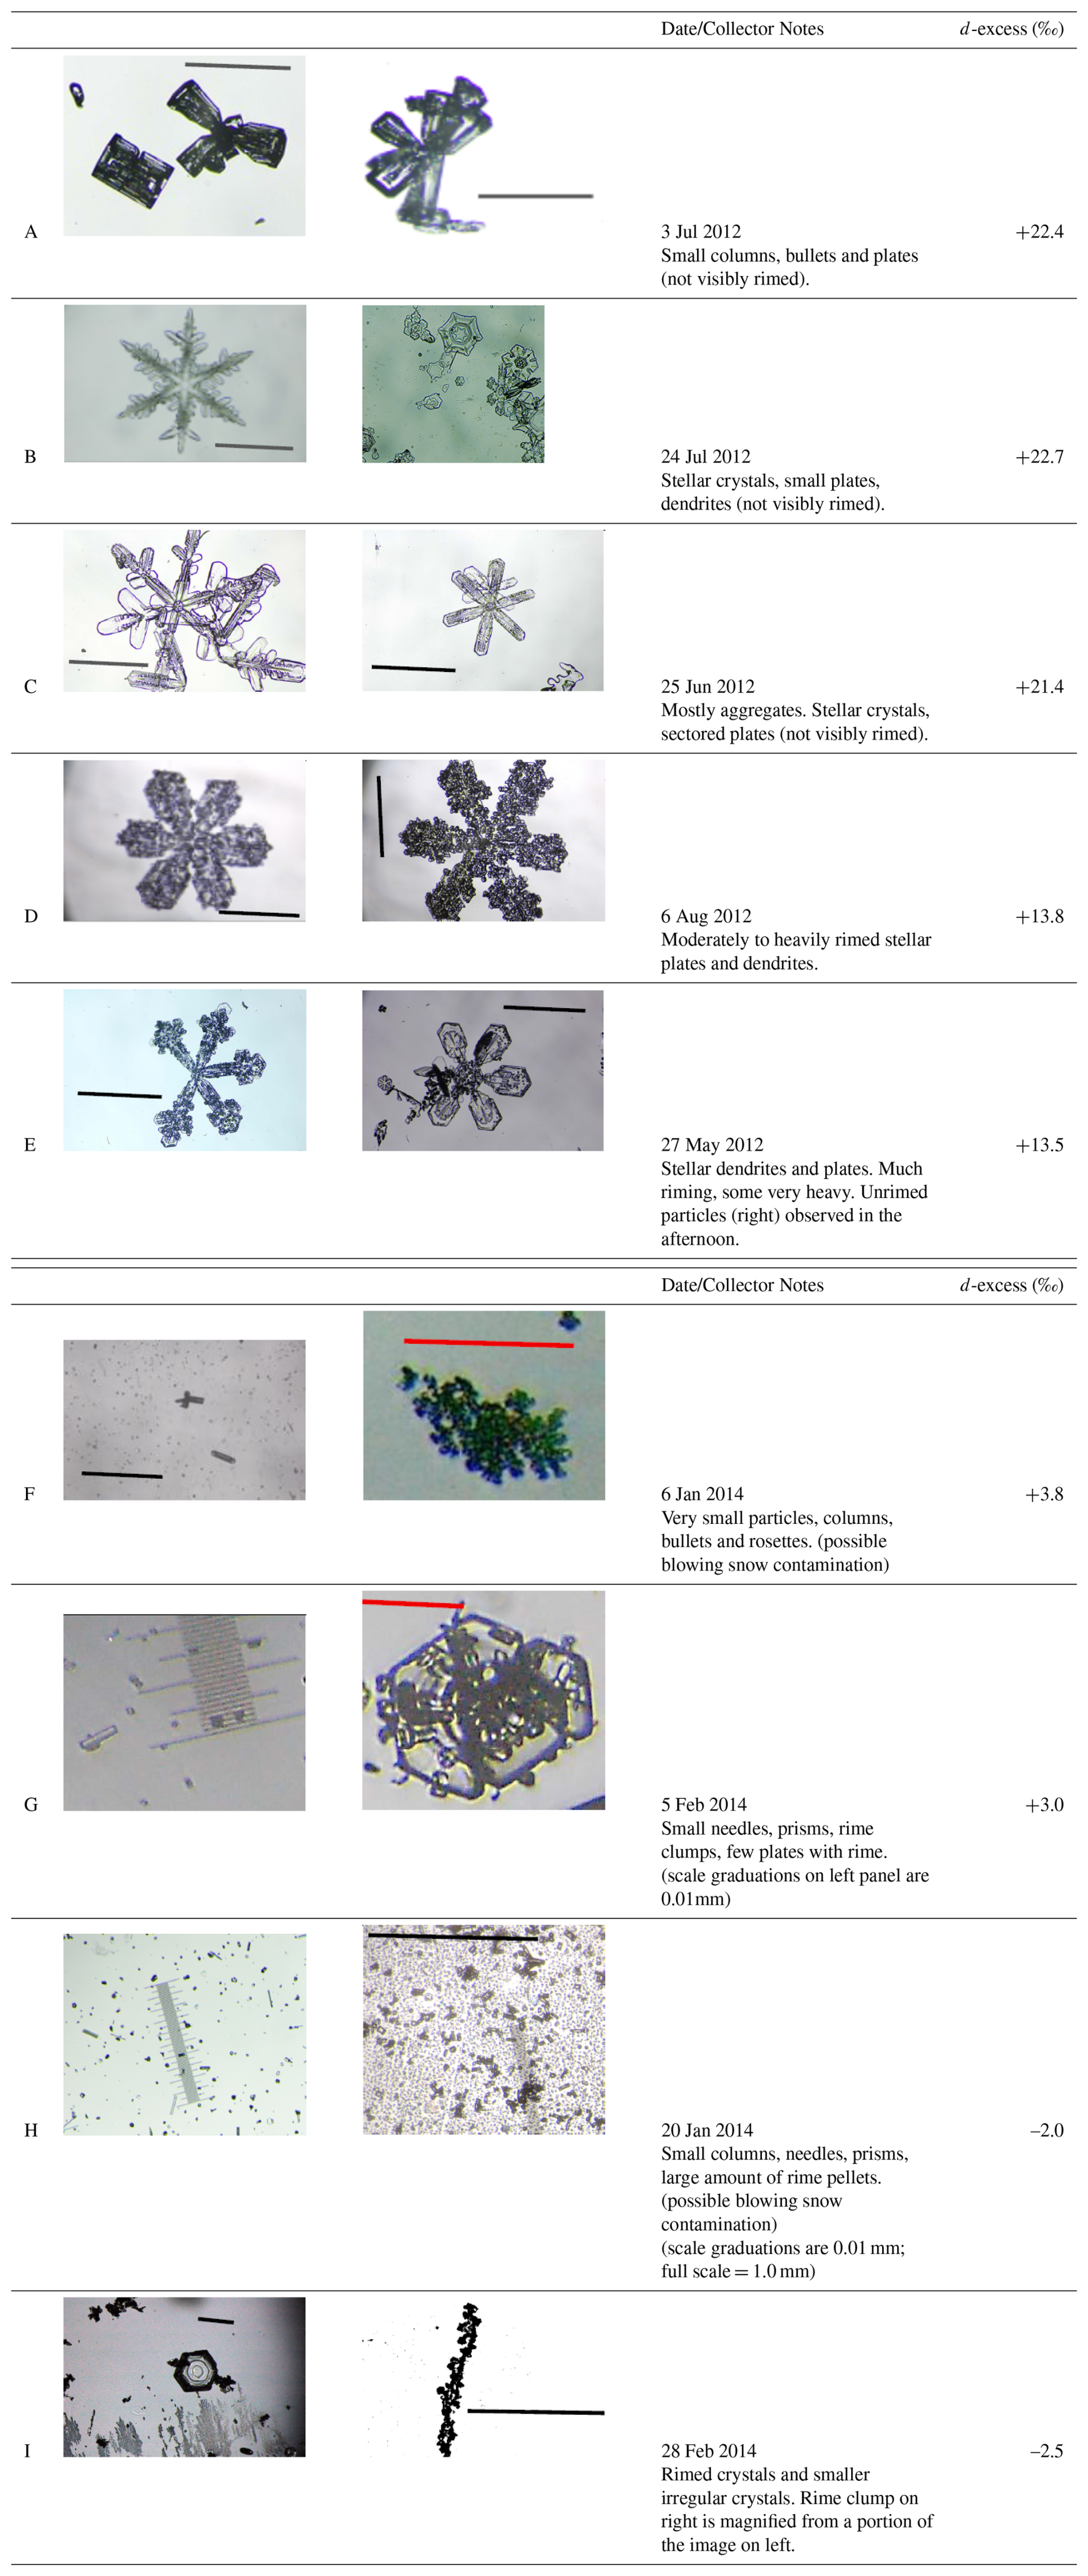
Lowest d-excess of −2.5 ‰ to +3.8 ‰ corresponds to winter snowfall (DJF) with relatively small particles of ∼ 20 to ∼ 700 µm. As noted previously, the IcePic photographs show snow particles collected on a slide kept in open air, blowing snow may have been captured and all of the small particles may not have fallen directly as precipitation.
3.2.1 MASC fall velocity
The MASC at Summit operated periodically during 2014 and measurements of fall velocity for several days in June, July and August were concurrent with isotope samples. Average fall velocity of snow particles and the d-excess of corresponding daily samples of precipitation are shown in Fig. 2. The average fall velocity was calculated from measurements on 3 to 93 individual particles (Table S2), except for one day that had a single measurement. Note that precipitation samples for d-excess were collected over a ∼ 24 h period while the fall velocities were measured for shorter durations so that the MASC measurements may not be representative of daily precipitation. Representative photographs of snow particles, on which the fall velocity was measured, are also shown in Fig. 2.
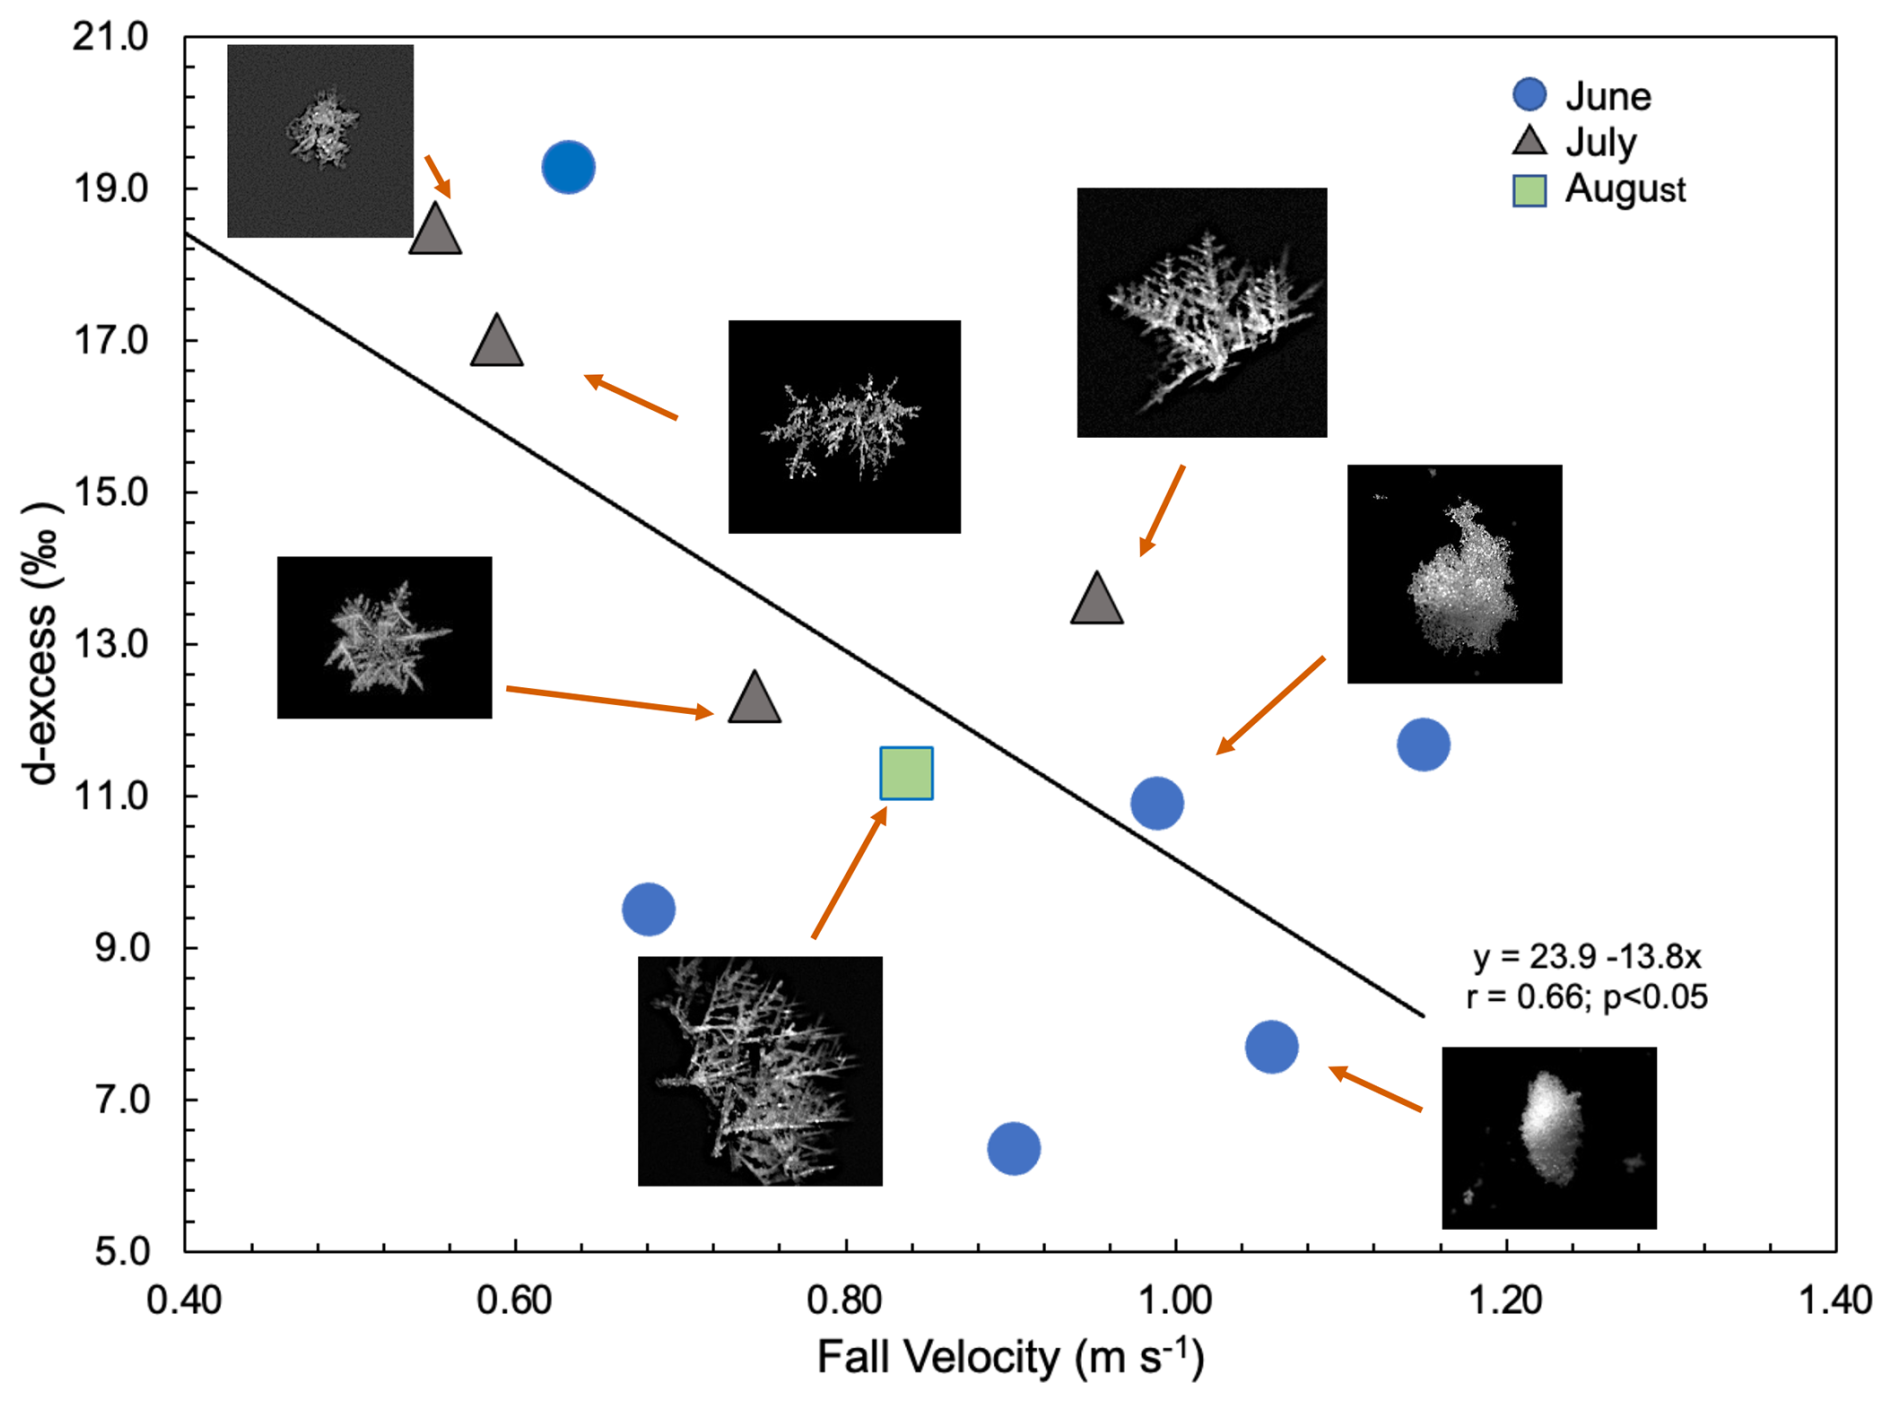
Figure 2d-excess versus MASC-measured average fall velocity at Summit. Photographs are those of selected particles corresponding to measured fall velocity. The grey line is the best fit line of linear regression.
Although the MASC data are for the summer months, they correspond with a significant range of d-excess from +6.4 ‰ to +19.3 ‰. A strong, inverse correlation is present between the d-excess of daily precipitation and the average fall velocity of snow particles (r = 0.65; p < 0.05). The particle shapes and riming in MASC photographs are consistent with those from the IcePIC photographs (Table 3). MASC photographs from two events in July (grey triangles with d-excess of ∼ +17 ‰ to 19 ‰; Fig. 2) show snow particles that are lightly rimed and the ice crystal shape is clearly evident. Following Locatelli and Hobbs (1974), these particles would be classified as lightly rimed assemblages of dendrites. The higher fall velocities (∼ 1 m s−1) and lower d-excess (∼ +7 ‰ to +10 ‰) correspond to June events (blue circles) where heavily rimed particles have a more rounded shape with the underlying ice crystal outline no longer apparent. These particles would be classified as lump graupel or graupel-like snow (Locatelli and Hobbs, 1974). For intermediate d-excess and fall velocities in July and August events, the particles are similar to lightly rimed aggregates of dendrites (Locatelli and Hobbs, 1974).
3.2.2 Mean Doppler velocity
Figure 3 shows a scatter plot of d-excess versus MDV in daily precipitation at Summit. The data are categorized as summer (JJA) and winter (DJF). For clarity, Summit data for the other seasons are not shown as they lie within the bounds of the summer and winter categories (see Fig. S4 for all data).
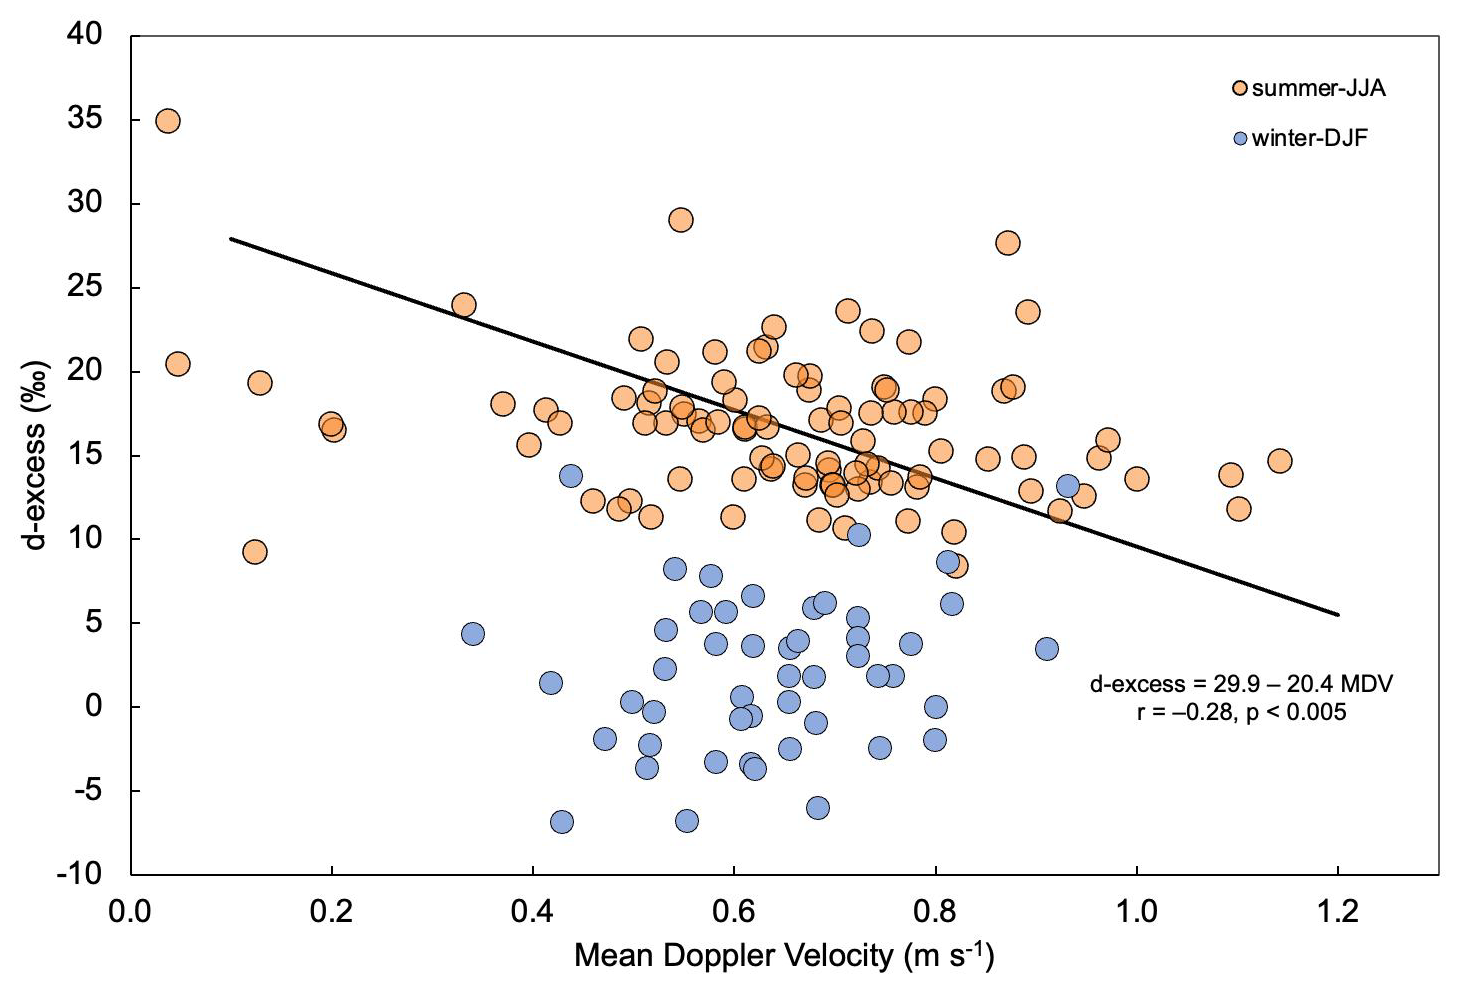
Figure 3d-excess and MDV in daily precipitation at Summit. The best fit line for standardized total least squares regression of summer data is shown.
The variation of d-excess with MDV for the summer precipitation (brown circles in Fig. 3) shows essentially the same inverse relationship as that indicated by the MASC fall velocities (Fig. 2) also obtained in the summer. Samples with higher d-excess (> +20 ‰) have a range of MDV values that are less than ∼ 1.0 m s−1, indicating unrimed to moderately rimed particles (Locatelli and Hobbs, 1974). Lower d-excess of ∼ +12 ‰ to +14 ‰ is associated with higher MDV (> 1 m s−1) that is indicative of heavier riming (Kneifel and Moisseev, 2020; Matrosov, 2023). Table 3 shows a moderate to heavily rimed particle collected on 6 August 2012, consistent with a relatively lower d-excess of daily precipitation (+13.8 ‰) on that day.
Winter precipitation at Summit (blue circles in Fig. 3) mostly has lower d-excess than the summer but with comparable MDVs, albeit with a slightly narrower MDV range than in the summer. Notably, the maximum MDV value in the winter is < 1 m s−1 and an inverse correlation with d-excess is absent. The winter MDV values likely reflect a smaller particle size at colder temperatures (Takahashi and Fukuta, 1988; Heymsfield et al., 2013) while the lower d-excess may result from an alternative mechanism than riming as discussed below.
Summit precipitation is attributed to deep (∼ 4–6 km above ground level, ) or shallow (< ∼ 3 ) clouds with varying proportions in different months (Shupe et al., 2013; Miller et al., 2015; Pettersen et al., 2018). Pettersen et al. (2018) used differences in the microwave absorption and scattering properties of cloud liquid water and ice to separate the majority of the precipitation events (both by accumulation and occurrence frequency) into three categories: snow originating from fully glaciated ice clouds (IC), snow where cloud liquid water was measurable in the column (CLW), and snow where the IC or CLW cloud types could not be differentiated based on their microwave signals (indeterminate). The CLW type clouds were single- or multi-layer, Arctic mixed-phase clouds while the IC type were similar to deep, nimbostratus-like clouds. Snowfall mass accumulating at Summit from IC and CLW events was seasonally variable with CLW events more prevalent in the summer and the IC events in winter (Pettersen et al., 2018). Back-trajectory analysis indicated that CLW clouds frequently originated from the west-southwest of Greenland and IC clouds primarily from the southeast, but with no seasonal differences in air mass trajectory for each cloud type, suggesting that moisture source origin alone cannot explain the seasonal d-excess variability. A further study (Kopec et al., 2019) suggested that summer precipitation originated from vapor sublimated from surface snow, resulting in higher d-excess; however, this is inconsistent with the back-trajectory analysis of Pettersen et al. (2018). The lower d-excess in winter at Summit compared to summer is therefore unlikely to reflect seasonal differences in the origin of source moisture. Alternatively, riming may be important only in the summer while ice growth in the colder and drier winter conditions may occur mostly by vapor deposition, but with lower d-excess.
3.2.3 Radiosonde profiles at Summit
The nature of cloud processes at Summit can be evaluated further by using the vertical profiles of temperature (T), relative humidity (RH), and ice supersaturation (SI) derived from radiosonde soundings. Figure 4 shows the mean vertical profiles for the winter (blue curves) and the summer (brown curves). Mean T at the surface was 18 °C colder in winter (−30.9 °C) than in summer (−12.5 °C). With increasing height, the seasonal difference in mean T remained nearly the same throughout the column. The RH at the surface was lower in the winter (∼ 73 %) than in the summer (∼ 85 %) and decreased with height such that the RH was nearly the same (∼ 50 %) at ∼ 3500 in both seasons (Fig. 4b). At higher altitudes, the RH was slightly higher in the winter than in the summer. Most of the precipitating column in the winter was beyond the mixed-phase regime (T < −38 °C above ∼ 2400 ) where ice growth would occur by vapor deposition as diamond dust. In the summer, T < −38 °C was above ∼ 4600 , indicating riming can occur at lower levels if RH approached liquid saturation.
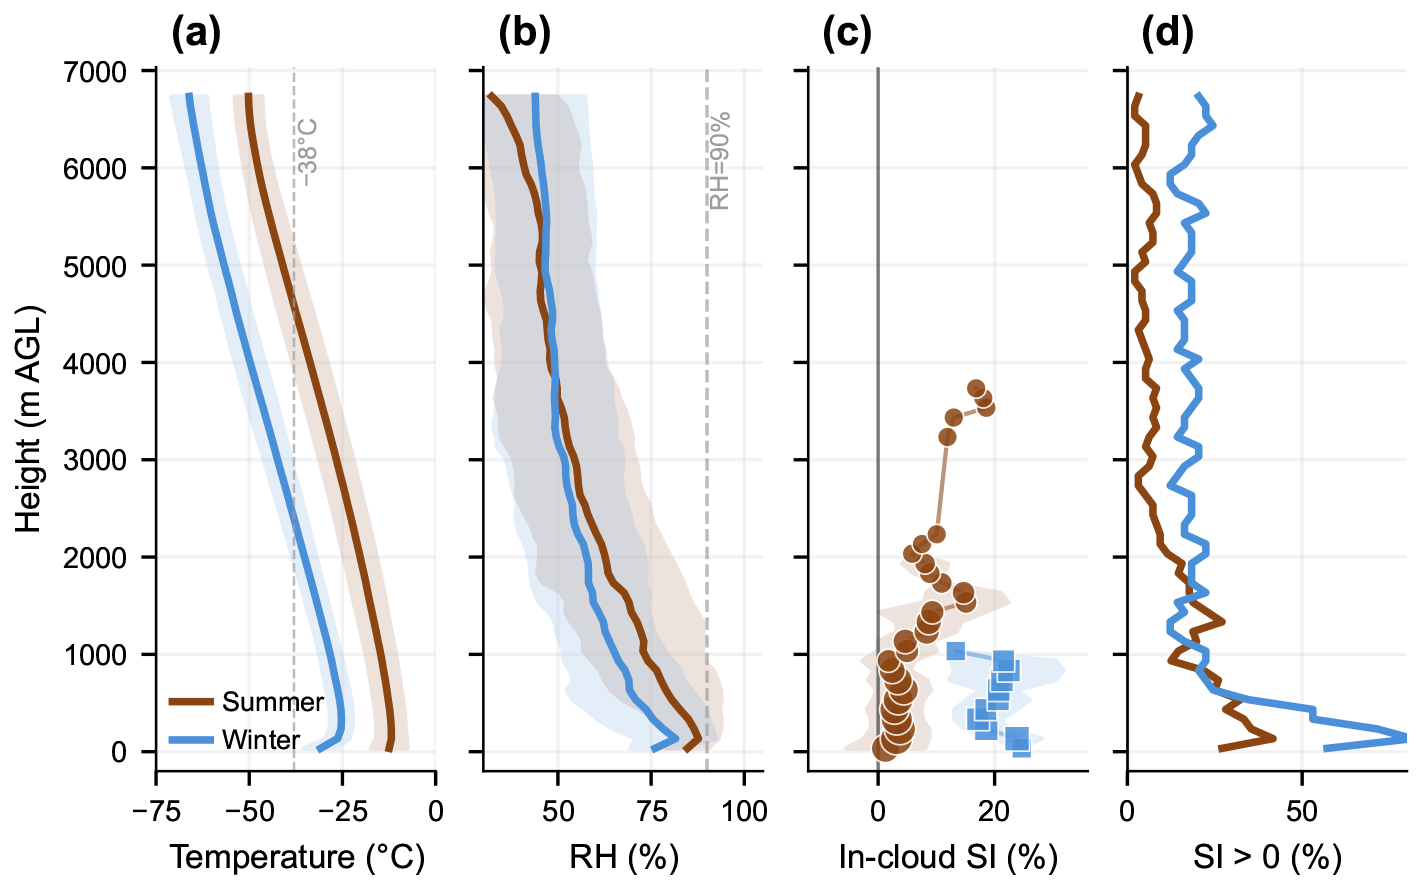
Figure 4Mean vertical profiles of (a) temperature, (b) RH, and (c) in-cloud SI from radiosonde soundings at Summit during summer (brown) and winter (blue). Shaded bands are ± 1 standard deviation around the mean (the overlapped areas show as grey). Panel (d) shows the percentage of soundings with SI > 0 for at least one radiosonde level.
In the winter, RH never approached liquid water saturation at any level throughout the precipitating column (Fig. 4b). At the low temperatures characteristic of the Summit winter column (−30 to −65 °C), liquid water cannot be sustained even when ice supersaturation is high (Korolev and Mazin, 2003; Murphy and Koop, 2005). Ice-supersaturated conditions (SI > 0) occur in nearly two-thirds of the winter soundings near the surface, declining to ∼ 25 % at 4000–6000 (Fig. 4d), confirming that vapor deposition prevails throughout on most winter isotope sampling days. When SI is > 0, the mean SI is ∼ 10 % throughout the column in both seasons (not shown). Despite the ice-supersaturated conditions, the lower d-excess of winter precipitation (−6.8 ‰ to +13.8 ‰) is counterintuitive because vapor deposition at higher SI is generally thought to produce higher d-excess at a given temperature (Jouzel and Merlivat, 1984). However, vapor deposition at very low temperatures from low δ18O vapor can produce condensate with low or even negative d-excess (Dütsch et al., 2019; their Fig. 1). The roles of SI, temperature and vapor δ18O in reconciling the low winter d-excess at Summit are explored further in Sect. 3.5.
RH in the summer approached liquid water saturation at some levels near the column base at temperatures between −4 and −15 °C (Fig. 4a and b), where near-zero SI (Fig. 4c) suggestes conditions favorable for riming growth. Higher in the column, SI was positive and RH was below liquid saturation, favoring ice growth by vapor deposition. About 20 % of summer soundings show near-liquid-saturation conditions at the column base, consistent with the mixed-phase CLW cloud type identified by Pettersen et al. (2018) being more prevalent in summer. Higher MDV values in daily precipitation (∼ 1 to 1.2 m s−1; Fig. 3) are consistent with riming contributing to lower d-excess for some of the summer events.
To illustrate the influence of vapor deposition and riming growth on d-excess variability in summer precipitation, we examine radiosonde profiles from two contrasting events on 2 July 2012 (d-excess = +23.6 ‰; MDV = 0.89 m s−1) and 26 July 2013 (d-excess = +14.7 ‰; MDV = 1.14 m s−1). We use the ratio (Sect. 2.4) as a diagnostic of proximity to liquid water saturation where wet or dry growth riming would be favored depending upon the ambient temperature.
The precipitation column on 2 July 2012 (blue curves in Fig. 5) was cold and deep, with temperatures ranging from −16 °C near the surface to −30 °C at ∼ 3000 (Fig. 5a). Relative humidity exceeded 80 % through a deep cloud layer from near the surface to ∼ 2500 , within which SI rose from near zero at cloud base to ∼ 18 % (Fig. 5b and c). Throughout this layer, remained well below 1.0 (Fig. 5d), indicating that the air was substantially undersaturated with respect to liquid water despite the high ice supersaturation. Under these conditions, which are characteristic of cold ice clouds well below the mixed-phase temperature range, ice growth would occur by vapor deposition at variable ice supersaturation, consistent with the high d-excess of +23.6 ‰.
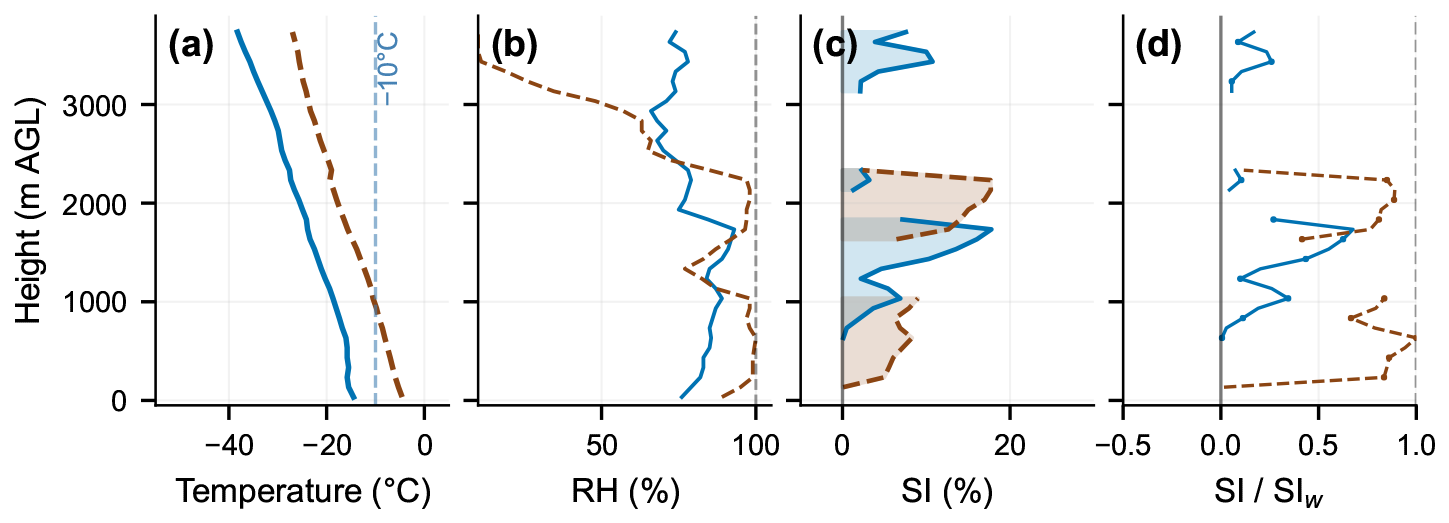
Figure 5Height-resolved profiles of temperature, RH, SI and ratio during Summit precipitation events on 2 July 2012 (blue; d-excess/MDV = +23.6 ‰/0.89 m s−1) and 26 July 2013 (brown; +14.7 ‰/1.14 m s−1).
A contrasting two-layer cloud structure existed on 26 July 2013 (brown curves in Fig. 5). In the lower layer (surface to ∼ 1000 , T = −5 to −11 °C), RH approached liquid water saturation and SI was near zero or slightly positive (Fig. 5a–c), with approaching 1.0 (Fig. 5d). These conditions are favorable for riming growth, with wet growth more likely given the warmer temperatures and near-liquid-saturation environment. An upper cloud layer was present from ∼ 1600 to 2300 (T = −15 to −19 °C) where SI was positive and was lower, indicating ice supersaturation but less proximity to liquid saturation. At these lower temperatures, any riming would occur by the dry growth process, where accreted liquid freezes on contact rather than sustaining a liquid film, and producing only a modest d-excess reduction (∼ 3 ‰; Sect. 3.5). The combination of near-liquid-saturation conditions in the lower layer, vapor deposition in the upper layer, and the transition between the two growth regimes is consistent with the intermediate d-excess of +14.7 ‰, which is lower than that during the depositional 2 July event.
3.2.4 Riming and d-excess at other study locations
We now discuss the correlation of d-excess and MDV at the remaining polar and non-polar locations in this study, as well as cloud profiles derived from radiosonde soundings at Ny-Ålesund and Dumont d'Urville in order to characterize the effect of cloud processes on d-excess.
3.3 MDV and d-excess correlation
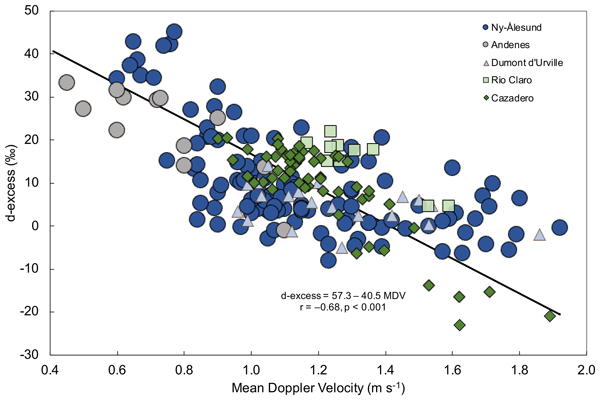
Figure 6 shows the d-excess and MDV relationships at Ny-Ålesund (dark blue circles), Andenes (light grey circles), Dumont d'Urville (light blue triangles), Cazadero (dark green diamonds) and Rio Claro (light green squares). The d-excess and MDV are strongly correlated with the correlation coefficient (r) = −0.68 (p < 0.001). A standardized total least squares regression across all locations (n=211), which accounts for uncertainties in the two variables with different measurement units, yielded a slope of −40.5 and intercept of 57.3. The slope is negative at each individual site with a strong correlation (r = 0.68–0.84, p < 0.001), except for a statistically weaker correlation at Dumont d'Urville (r = −0.40, p = 0.06). The two best-sampled sites (Cazadero, n=57; Ny-Ålesund, n=112) show tightly constrained, statistically robust slopes (−52.4 and −40.0, respectively, both p < 0.001). This consistency across sites, spanning mid-latitude, polar, and tropical climates, supports a common physical mechanism – riming-driven lowering of d-excess – rather than a coincidental cross-site correlation.
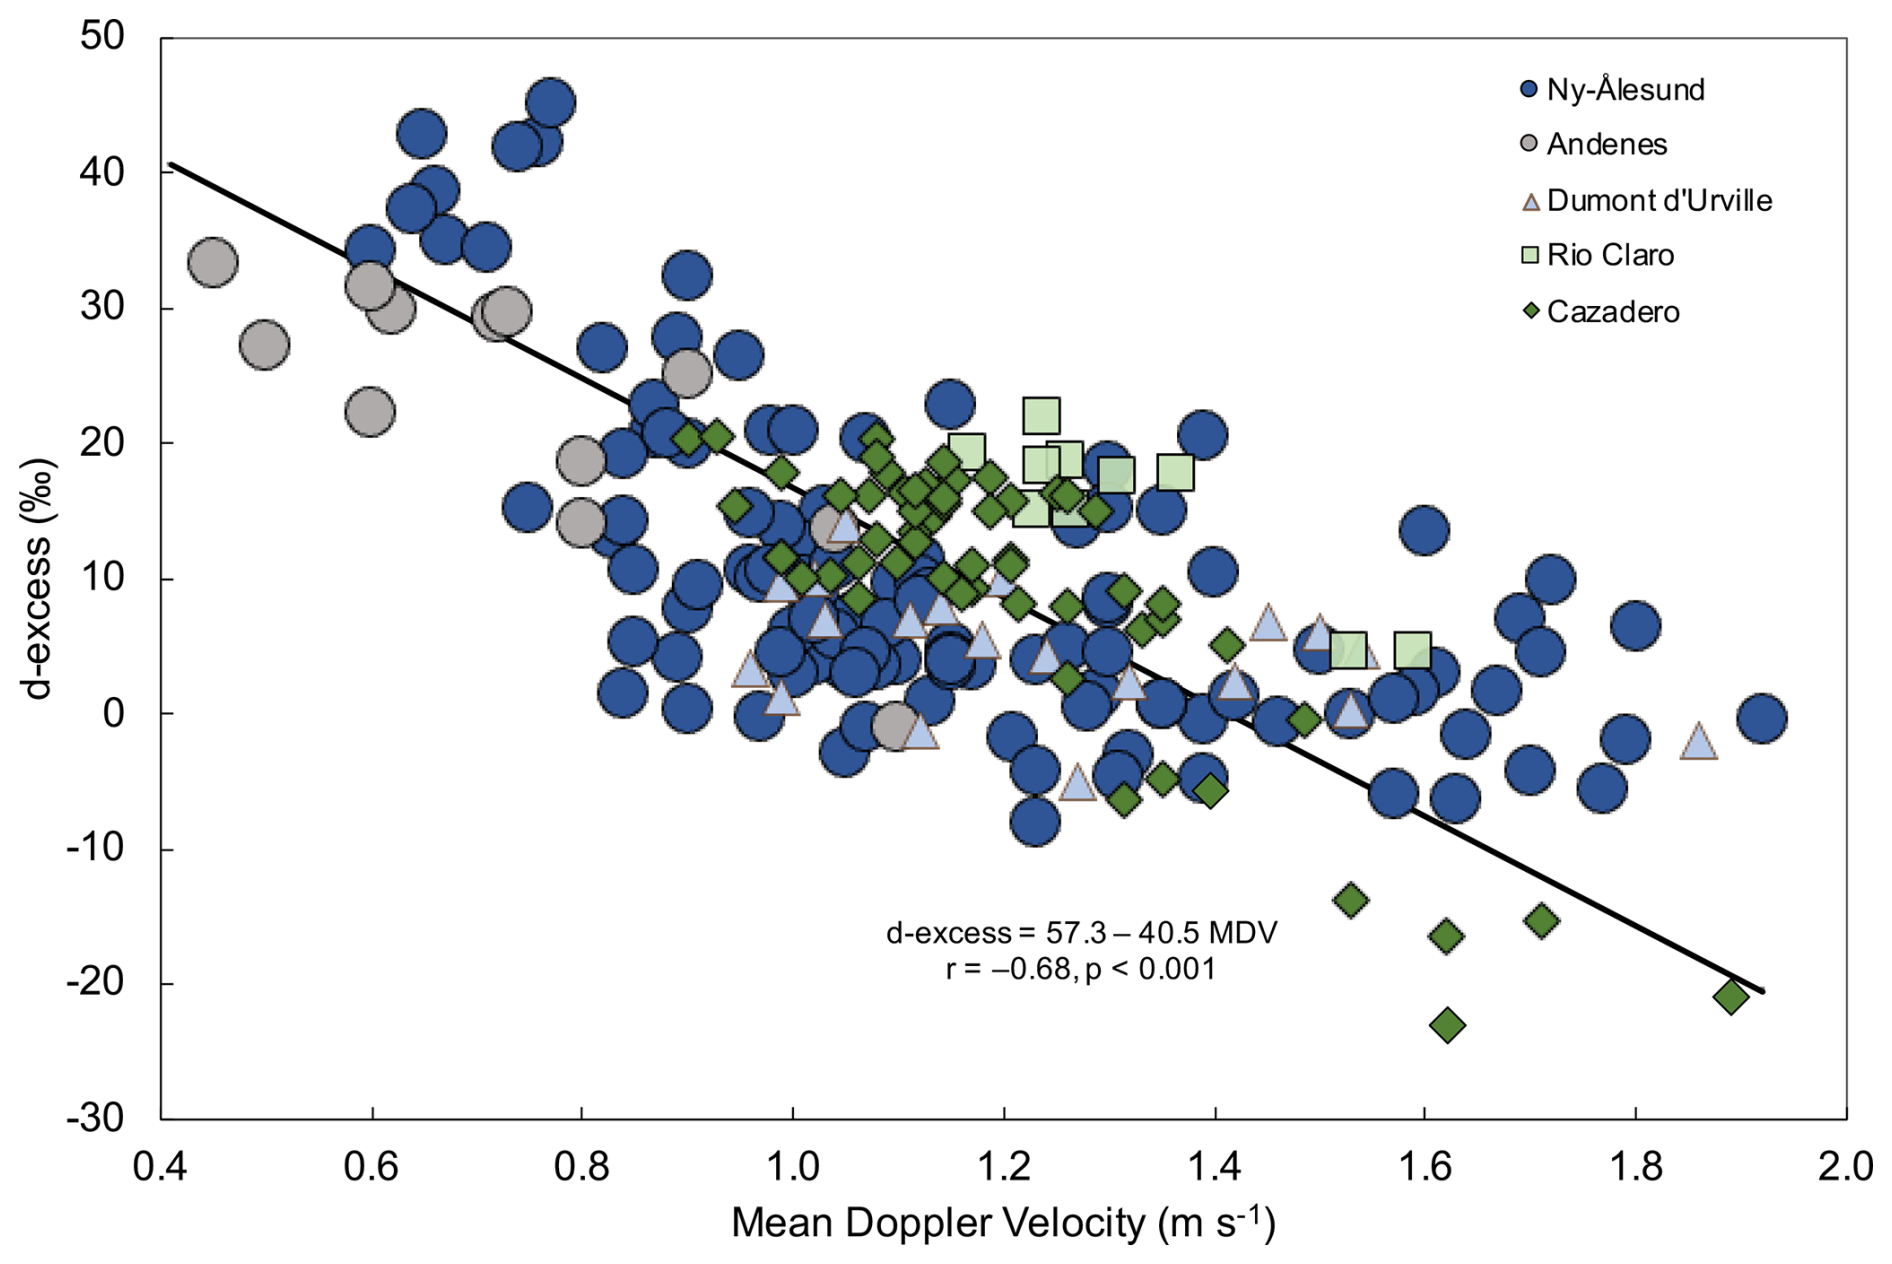
Figure 6d-excess versus MDV in polar and non-polar precipitation at all study locations except Summit. The best-fit line for standardized total least squares regression is shown.
Ny-Ålesund precipitation has a wide range of d-excess from −8.2 ‰ to +45.2 ‰ (dark blue circles in Fig. 6). The d-excess values are generally lower on rain days (−8.2 ‰ to +14.9 ‰; median = +3.1 ‰) compared to snow days (+3.9 ‰ to +45.2 ‰; median = +19.2 ‰). The corresponding MDV is higher on rain days (0.8 to 1.9 m s−1; median = 1.2 m s−1) compared to snow days (0.6 to 1.7 m s−1; median = 1.0 m s−1). Andenes precipitation (light grey circles in Fig. 6), consisting mostly of snow, has a d-excess range of −1.0 ‰ to +33.4 ‰ (median = +28.2 ‰) with the MDV ranging from 0.4 to 1.1 m s−1 (median = 0.7 m s−1).
Precipitation at Ny-Ålesund and Andenes is produced in low-level, mixed-phase clouds within cyclonic, atmospheric river and frontal systems (Lauer et al., 2023; Chellini and Kneifel, 2024; Ebell et al., 2025). Heavily rimed particles with higher MDVs are commonly observed at Ny-Ålesund (Chellini and Kneifel, 2024; Maherndl et al., 2024). Riming is attributed to increased turbulence, indicated by a higher eddy dissipation rate, which also is higher at cloud top temperatures warmer than about −10 °C (Chellini and Kneifel, 2024), consistent with the generally higher MDV and lower d-excess of rain compared to snow in our study.
Daily average MDV at Dumont d'Urville ranges from ∼ 1 to 1.9 m s−1, indicating significant riming growth, with the corresponding d-excess of −5.0 ‰ to +14.0 ‰ (light blue triangles in Fig. 6). Antarctic precipitation at this coastal location is produced mostly in warm fronts of extratropical cyclones (Jullien et al., 2020) with frequent riming and graupel formation (Grazioli et al., 2017). A strong katabatic layer at ∼ 200 to 500 results in extremely dry conditions near the surface such that over one-third of the time when it is precipitating, snowfall is fully sublimated (virga) before reaching the ground (Jullien et al., 2020). For several samples in our limited dataset of 20 samples, MDV values of 1.5 to 1.9 m s−1 are higher than the maximum monthly average (∼ 1.5 m s−1) in a much larger, 7-year dataset of MDVs with 5500 measurements per month (Wiener et al., 2024). The higher MDV of our samples may be an artefact of stronger turbulence in low-level katabatic winds so that the upward and downward air motions did not completely cancel out for all samples (Sect. 2.3.3).
Cazadero and Rio Claro precipitation was sampled only as rainfall and average MDVs in the snow region above the melting layer were obtained over ∼ 30 min intervals during stratiform events characterized by the presence of a reflectivity bright band (Sects. 2.3.4–2.3.5). The top of the melting layer was at a height of ∼ 2 km at Cazadero and ∼ 4 km at Rio Claro. The average MDV and d-excess values, respectively, ranged from 0.9 to 1.9 m s−1 and −22.9 ‰ to +20.6 ‰ at Cazadero (dark green diamonds in Fig. 6). At Rio Claro (light green squares in Fig. 6), the MDV ranged from 1.2 to 1.6 m s−1 and d-excess from +4.5 ‰ to +21.9 ‰.
Stratiform precipitation at Cazadero is produced mostly in landfalling, extra tropical cyclones and atmospheric rivers (White et al., 2003). Precipitation d-excess is nearly the same in both regimes (Coplen et al., 2015). Orographically forced, relatively deeper clouds at Cazadero seed the ice particles that fall through the lower, feeder clouds where supercooled water droplets are accreted and ice grows by riming (White et al., 2003). At Rio Claro, precipitation is associated with mesoscale convective systems (dos Santos et al., 2024) where the seeder–feeder process is commonly observed during stratiform events (Houze, 2014).
3.3.1 Vertical profiles of T and RH at Ny-Ålesund
Figure 7 shows the radiosonde-observed profiles of T, RH and in-cloud SI (RH > 90 %) on rain days (brown curves) and snow days (blue curves). Mean temperature (Fig. 7a) decreases from ∼ 5 °C near the surface to about −15 °C at 4000 m on rain days, and from −5 °C near the surface to about −25 °C at 4000 m on snow days. Mean RH profiles are nearly the same on rain and snow days (Fig. 7b), increasing from near-surface values of ∼ 80 % to near or above 90 % between ∼ 800 and 1500 m, and then decreasing to ∼ 65 %–70 % at 4000 m.
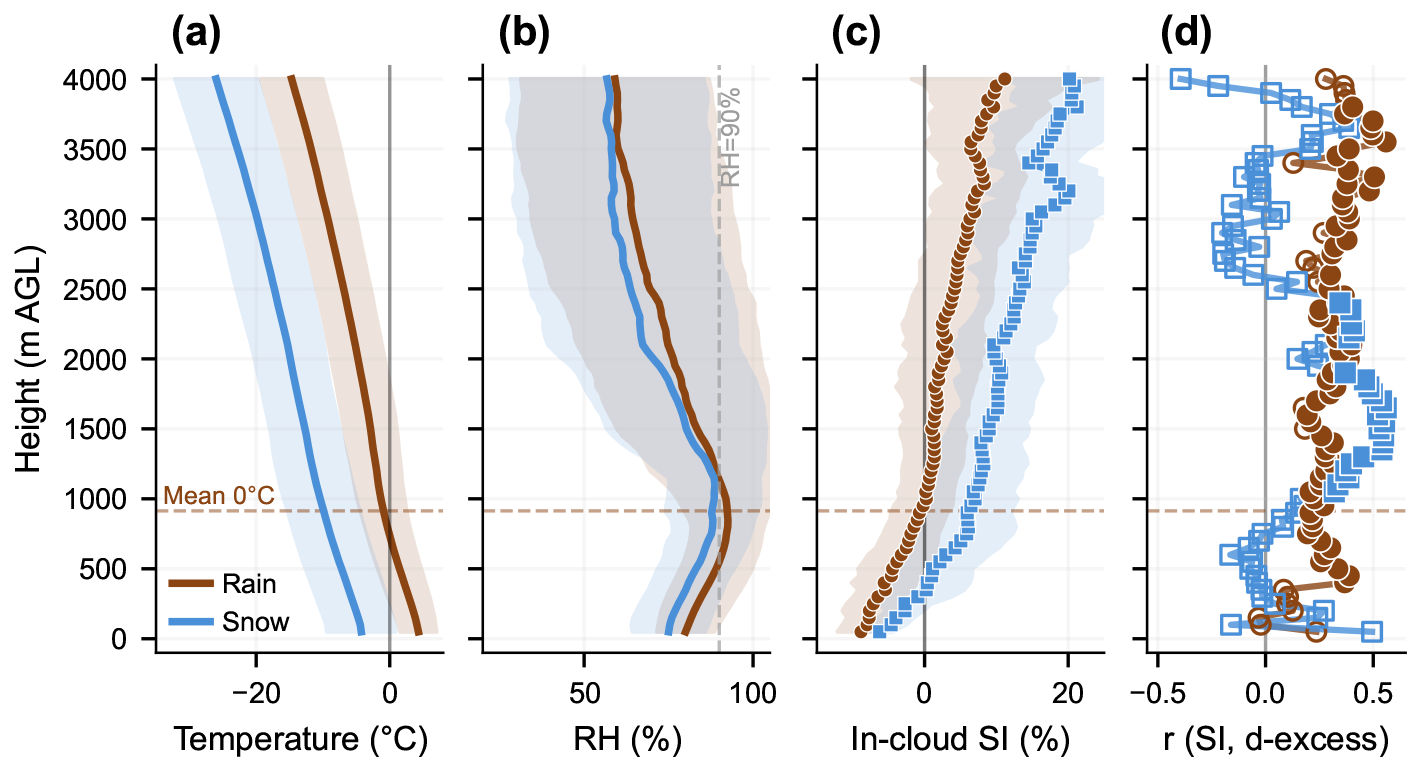
Figure 7Mean vertical profiles of (a) temperature, (b) RH, (c) in-cloud SI, and (d) correlation coefficient (r) for the linear regression of d-excess and height-resolved mean in-cloud SI from radiosonde measurements at Ny-Ålesund during rain (brown) or snow (blue) precipitation days. Shaded bands in (a)–(c) are ± 1 standard deviation around the mean (the overlapped areas show as grey). The dashed brown line shows the summer mean height of the 0 °C isotherm. Open symbols in (d) indicate p > 0.05 (statistically insignificant) and solid symbols indicate p < 0.05 (statistically significant).
The 0 °C isotherm on rain days ranged widely in height from near the surface to ∼ 3150 , with a mean of 914 ± 688 m and median of 700 m, reflecting the large variability in synoptic conditions across the 2014–2018 sampling period. The majority of rain events (59 %) had 0 °C levels between 500 and 1500 m, with 25 % below 500 m and the rest above 2000 m. This variability in 0 °C level height directly determines the depth of the ice-phase column available for riming and vapor deposition growth, contributing to the wide range of d-excess values observed in surface rainfall.
The fraction of radiosonde levels within clouds (RH > 90 %) increased from ∼ 10 % near the surface to a maximum of 74 % at 800–1050 (Fig. 7b). Within the cloud layer, RH approached liquid water saturation (mean RH = 91 %–97 %), indicating mixed-phase conditions where riming would be the dominant growth process at warmer temperatures near the base of the ice column.
Mean in-cloud SI on rain days is negative (−8 %) near the surface and becomes positive above ∼ 1000 m (near the mean 0 °C level), increasing to ∼ 10 % at 4000 (Fig. 7c). The vertical transitions in T and RH define a two-layer growth structure above the 0 °C level on rain days: a lower mixed-phase riming layer from ∼ 1000–2750 where SI is weakly positive (0 % to 5 %) but the cloud is near water saturation, and an upper depositional layer (∼ 2750–4000 m) where SI increases from 5 % to 10 % as temperatures decrease from −8 to −13 °C. Ice crystals would nucleate and grow by deposition in the upper layer before falling into the riming zone below; hence, the isotopic composition of surface precipitation integrates contributions from both growth regimes. This is consistent with the mixed-phase cloud structure described by Korolev et al. (2017).
Snow days show positive SI throughout the column, increasing from near zero at ∼ 300 m to ∼ 20 % at 4000 m (Fig. 7c), reflecting consistently colder temperatures at all levels and the absence of liquid saturation conditions. Under these conditions vapor deposition is the dominant growth process, with riming occurring episodically where turbulent vertical motions activate supercooled liquid water (Korolev et al., 2017; Chellini and Kneifel, 2024).
A significant positive correlation exists between d-excess and height-resolved in-cloud SI across most of the ice-phase column on rain days (brown curve in Fig. 7d), with r values ranging from 0.18 to 0.50 (p < 0.05) between 400 and ∼ 3500 m and showing considerable variability with height. The correlation extending below the mean 0 °C isotherm to ∼ 400 m likely reflects variability in freezing level height across rain events, such that on days with lower freezing levels the ice-phase column extends to those lower altitudes and the SI–d-excess relationship is maintained. Precipitation events with higher SI in the upper depositional layer are associated with relatively higher d-excess in surface rainfall, consistent with the seeder-feeder growth model in which stronger vapor deposition aloft would partially offset the d-excess reduction from riming below.
On snow days, the SI – d-excess correlation (blue curve in Fig. 7d) is significant from 1050 to ∼ 2500 m (r=0.32 to 0.56, p < 0.05), consistent with vapor deposition being the dominant growth process in that layer and indicating that it represents the primary zone of crystal growth on snow days. The radiosonde profiles therefore characterize the vapor deposition component of snow day growth, while the MDV independently captures the riming component – the two measurements being complementary rather than redundant. In contrast to rain days, where the melting layer thermodynamically anchors the riming zone as a persistent day-scale feature, transient mixed-phase conditions on snow days may not be captured in a once-daily radiosonde profile but are evident in higher MDV values (up to 1.7 m s−1) that directly reflect riming intensity regardless of when and where in the column it occurred.
Three radiosonde profiles for 12 February 2016 (d-excess = +34.5 ‰; MDV = 0.71 m s−1), 31 August 2014 (d-excess = +13.9 ‰; MDV = 0.99 m s−1) and 19 July 2014 (d-excess = −4.6 ‰; MDV = 1.31 m s−1) illustrate the effect of ice growth regimes on d-excess variability at Ny-Ålesund.
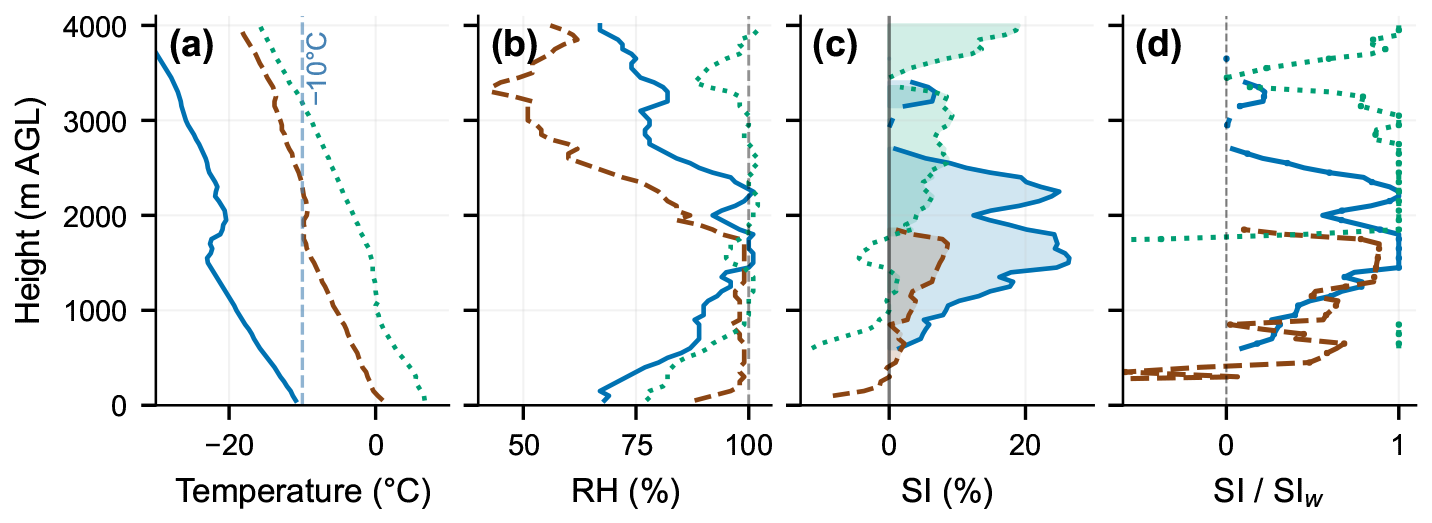
Figure 8Height-resolved profiles of (a) temperature, (b) RH, (c) SI, and (d) during Ny-Ålesund precipitation events on 12 February 2016 (blue; d-excess/MDV = +34.5 ‰/0.71 m s−1), 31 August 2014 (brown; +13.9 ‰/0.99 m s−1) and 19 July 2014 (green; −4.6 ‰/1.31 m s−1).
On 12 February 2016 (blue, solid curves in Fig. 8), surface temperature was −10.5 °C, decreasing to −20 °C at 1000 and to still lower values at higher levels (Fig. 8a). A deep cloud layer (RH > 90 %, SI > 0) extended from ∼ 600 to 3400 (Fig. 8b), within which three distinct zones of ice crystal growth are apparent. Vapor deposition would be favored near the cloud top (∼ 3000 to 3200 ; T = ∼ −24 to −26 °C) and at cloud base (600 to 1250 ), where the cloud was mildly supersaturated with ice (SI = ∼ 0 % to 8 %; Fig. 8c) but substantially undersaturated with respect to liquid water ( < 0.5; Fig. 8d). A middle cloud layer between ∼ 1250 and 2400 had higher SI values of 17 %–26 % with exceeding 0.6 and briefly approaching 1.0 at several levels, where riming would be favored. However, at the colder temperatures in this layer (−20 to −23 °C), riming would occur by the dry growth process with only a modest lowering of d-excess (Sect. 3.5). As a result, precipitation d-excess would be determined predominantly by the vapor-deposition signal, consistent with the observed high d-excess of +34.5 ‰.
On 19 July 2014 (green, dotted curves in Fig. 8), surface temperature was +6.7 °C, with the freezing level at ∼ 1000 (Fig. 8a). An unusually deep isothermal melting layer extended from ∼ 1000 to ∼ 1400 where temperatures remained at or within a fraction of a degree of 0 °C. Immediately above, from ∼ 1400 to 1800 , SI was slightly negative despite high RH of 95 %–99 % (Fig. 8b), reflecting the near-zero temperatures in this transitional layer where air approaches but does not reach ice saturation. The primary ice-forming cloud extended from ∼ 1800 to 3300 , where RH was ∼ 100 % and SI ranged from near zero to ∼ 9 % (Fig. 8c). At the relatively warm temperatures in this layer (T = −2 to −11 °C), reached water saturation intermittently (Fig. 8d), indicating conditions favorable for wet growth riming as the dominant growth process. A brief drier intrusion at 3300–3500 , where RH dropped to 88 %–91 % and SI briefly became negative, separated the riming zone from an upper cloud layer at 3500–4000 (T = −12 to −16 °C). In this upper layer, SI increased from ∼ 2 to ∼ 19 % with RH ∼ 100 % near the top, and of ∼ 0.74 on average indicates predominantly depositional growth with near-saturated conditions developing at the uppermost levels. The strongly rimed character of this event, with wet growth conditions dominating most of the ice-phase column at relatively warm temperatures, is consistent with the low d-excess of −4.6 ‰ observed at the surface.
Surface temperature on 31 August 2014 (brown, dashed curve in Fig. 8), was +1.0 °C, with the 0 °C isotherm at ∼ 200 (Fig. 8a). RH was 88 % near the surface and rose sharply to ∼ 98 % by ∼ 200 m, and then remained consistently high (97 %–99 %) through ∼ 1700 (Fig. 8b). Ice supersaturation was intermittently positive from ∼ 300 m upward and became consistently positive from ∼ 900 to ∼ 1800 (Fig. 8c), with temperatures ranging from −0.6 °C near the lower cloud margin to −9.8 °C near the cloud top. The ratio increased steadily with height through the cloud, approaching but not reaching water saturation (0.84 to 0.88) between ∼ 1300 and 1700 (Fig. 8d), before declining sharply toward the cloud top. Vapor deposition would be favored near cloud top, while the near-water-saturation state in the 1300–1700 m layer at temperatures of −7.3 to −9.5 °C indicates wet growth riming. The intermediate d-excess of +13.9 ‰ – lower than the vapor deposition event on 12 February 2016 but higher than the more strongly rimed 19 July 2014 rainfall – is consistent with a combination of vapor deposition near cloud top and wet growth riming in the lower cloud layer, where riming remained intermittent rather than fully established at water saturation.
3.3.2 Vertical profiles of T and RH at Dumont d'Urville
Height-resolved profiles of T, RH and in-cloud SI (RH > 90 %) at Dumont d'Urville on isotope sampling days in the summer (DJF; brown curves) and the winter (JJA; blue curves) are shown in Fig. 9. Although acceptable MDV values were available only for 20 of the 85 isotope sampling days, the radiosonde data are available for all days and this analysis is based on the full dataset. Mean temperatures decrease from ∼ −2 °C near the surface to −20 °C at 4000 in the summer and from −13 to −26 °C in the winter (Fig. 9a). Unlike Summit, temperatures throughout the 0–4000 m column remain above −38 °C in both seasons, indicating that the entire precipitation-forming layer is within the mixed-phase regime where ice growth can occur both by riming and vapor deposition.
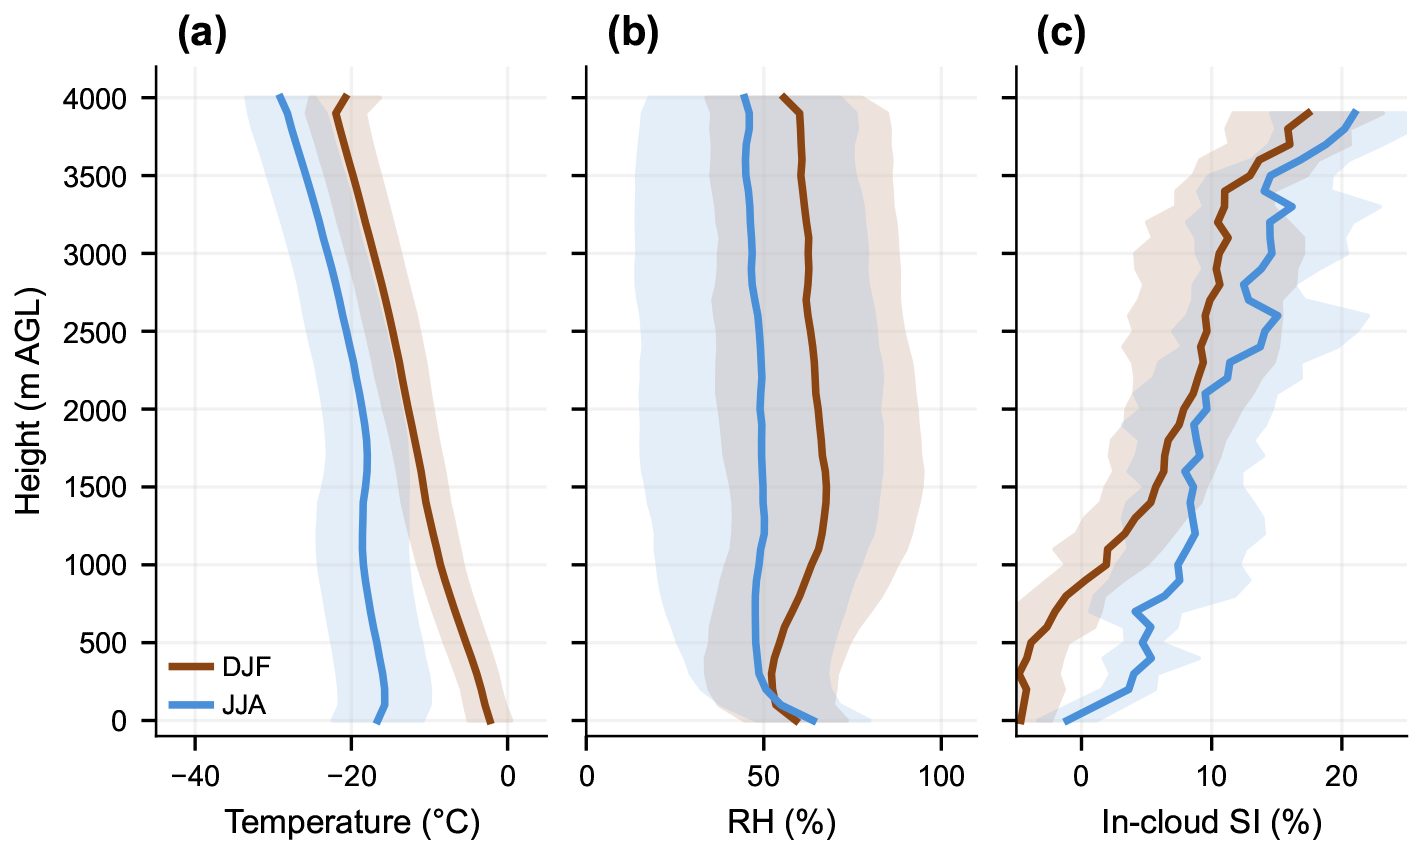
Figure 9Mean vertical profiles of (a) temperature, (b) RH, and (c) in-cloud SI at Dumont d'Urville during summer (DJF, brown) or winter (JJA, blue) precipitation days. Shaded bands in (a–c) are ± 1 standard deviation around the mean (the overlapped areas show as grey).
Mean RH near the surface was 60 %–65 % in both seasons, decreasing to about 50 % between ∼ 200 to 500 In the winter, RH remained nearly the same above 500 m, but in the summer, there was a slight increase up to about 2500 m, before decreasing to reach ∼ 55 % at 4000 m (Fig. 9b). In-cloud conditions (RH > 90 %) occur on 35 %–40 % of isotope sampling days in summer and winter, respectively (not shown), confirming that the RH > 90 % criterion is appropriate for identifying cloud layers at this coastal Antarctic site. Mean in-cloud SI is∼ 8 % in summer and ∼ 6 % in winter, with winter clouds shallower on average (∼ 2400 vs ∼ 3400 cloud top in summer) and fewer in-cloud levels per day (4.5 in winter vs 8.6 in summer). Individual precipitation events frequently show a two-layer vertical structure – a lower cloud layer near water saturation where riming would be favored and an upper layer with SI > 0 but below water saturation where vapor deposition would dominate – as illustrated by the case studies below.
The influence of vapor deposition and riming on d-excess can be described with the radiosonde profiles for two events on 29 May 2019 (d-excess = +14.0 ‰; MDV = 1.05 m s−1) and 23 July 2019 (d-excess = +4.8 ‰; MDV = 1.54 m s−1).
On 29 May 2019 (blue curves in Fig. 10), near surface temperature was approximately −16.4 °C and decreased to about −33 °C at 3300 (Fig. 10a). RH remained below 90 % through most of the column, except for a narrow sub-layer (900–1300 , T = −21 to −22 °C) with RH ≥ 90 %. Ice-supersaturated conditions (SI > 0) extended from ∼ 100 to 3300 , reaching up to ∼ 15 % at 3100 despite RH < 90 % through most of this depth (Fig. 10b and c). The ratio peaked at 0.64 within the higher-humidity sub-layer and was 0.4–0.5 through the deeper ice supersaturated layer above (Fig. 10d), placing the profile within the vapor deposition regime. This is consistent with the higher d-excess of +14.0 ‰ in surface precipitation.
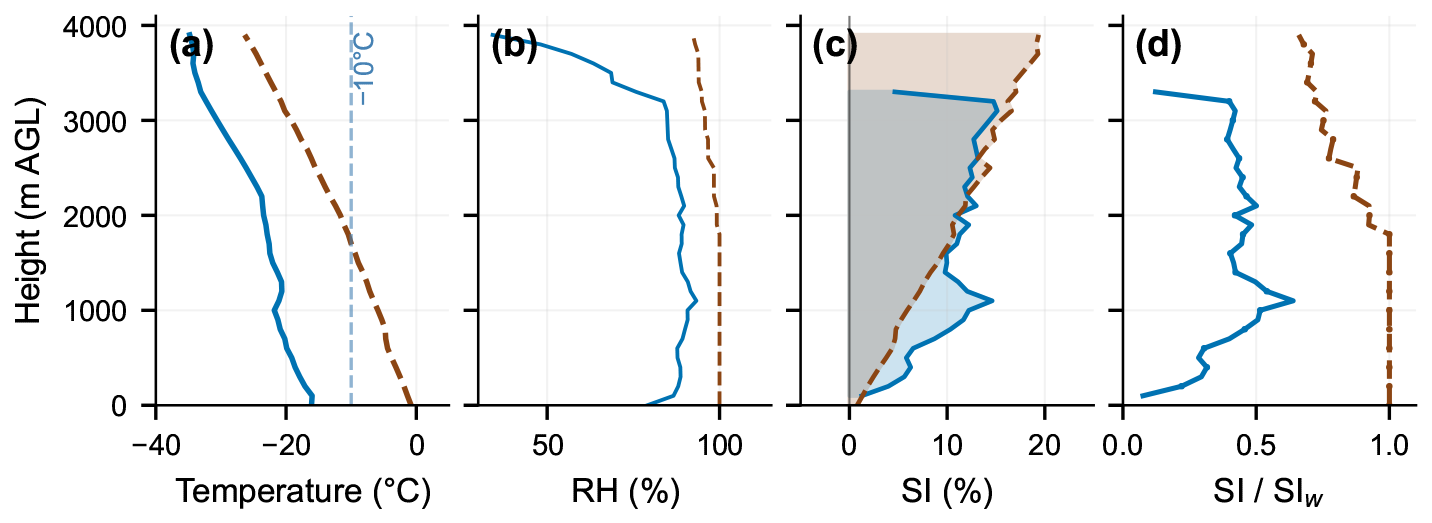
Figure 10Height-resolved profiles of (a) temperature, (b) RH (c) SI, and (d) for Dumont d'Urville precipitation events on 29 May 2019 (blue; d-excess/MDV = +14.0 ‰/1.05 m s−1) and 23 July 2019 (brown; +4.8 ‰/1.54 m s−1).
The 23 July 2019 event (brown curves in Fig. 10) corresponds to an intense synoptic scale intrusion of warm and moist air identified by Leroy-Dos Santos et al. (2023) as representative of the synoptic events that dominate precipitation variability at Dumont d'Urville. Surface temperature was −1.4 °C (Fig. 10a) and a deep saturated column extended from the surface to ∼ 3900 (Fig. 10b and c) with cloud top temperature of approximately −26 °C (Fig. 10a). From the surface to ∼ 1800 , RH was 100 % and SI was near zero to 10 % (Fig. 10c), with at or very close to 1.0 (Fig. 10d), indicating conditions at or near liquid water saturation. As the temperature was above −10 °C in this layer, ice growth would occur predominantly by wet growth riming. Above 1800 , SI increased gradually to ∼ 20 % at 3900 (Fig. 10c) while the ratio decreased to ∼ 0.7, indicating a transition to ice-supersaturated but water-undersaturated conditions where vapor deposition would be the dominant growth process. The combination of wet growth riming in the lower column and vapor deposition aloft is consistent with the lower d-excess of +4.8 ‰ compared to the deposition-dominated event on 29 May 2019.
3.3.3 Sub-cloud evaporation and d-excess
Sub-cloud evaporation of rain results in lower d-excess (Dansgaard, 1964) and could be responsible for the low d-excess observed at Cazadero, Rio Claro and Ny-Ålesund (Fig. 6). Evaporation decreases the drop size across the particle size spectrum although smaller raindrops evaporate faster (Kumjian and Ryzhkov, 2010; Xie et al., 2016). The decreased particle size would result in a decreasing reflectivity profile in the sub-cloud region and could be used as an indicator of rainfall evaporation. For most of the precipitation events at Cazadero, the vertical profiles of reflectivity in the sub-cloud region (below ∼ 1 km) either did not decrease or decreased only for a brief interval at the beginning or the end of precipitation when rain rates generally were minimal. In those cases, we discarded the d-excess and MDV data for ∼ 30 min at the start or the end of each event to avoid the potential effect of sub-cloud evaporation on our analysis. This approach of partially discarding the early or late portions of an event was also used for Rio Claro where the sub-cloud region extended to a height of ∼ 3 A decreasing reflectivity profile was not observed for rain events at Ny-Ålesund where the sub-cloud layer generally was less than about 500 m deep.
However, decreasing reflectivity profiles in the sub-cloud region were present for several hours during one Cazadero precipitation event on 1 March 2009 (Fig. S5). The time-height profiles of reflectivity and MDV for this event are shown in Fig. S6. Precipitation began at about 03:00 UTC and continued through 24:00 UTC with several breaks in between. Lowest d-excess values at Cazadero, ranging from −22.9 ‰ to −13.9 ‰ (Fig. 6), were measured in the first three hours (05:45 to 08:45 UTC) of this event when the rain rate mostly was < 1 mm h−1 (Coplen et al., 2015). Surface air temperature and RH averaged 11 °C and 63 %, respectively, between 05:00 and 09:00 UTC. Later in the day, the average temperature was slightly lower (9 °C) with high RH (91 %), consistent with a lack of sub-cloud evaporation in reflectivity profiles. We examined the effect of sub-cloud evaporation of rain on d-excess in our study by using calculations based on Stewart (1975) and by comparing the fall velocities above and below the melting layer based on Weiss et al. (1977).
3.3.4 Calculation of d-excess change
We estimated the magnitude of d-excess by sub-cloud evaporation using the Stewart (1975) model, which calculates isotopic fractionation during raindrop evaporation as a function of drop size, fall distance, ambient temperature and RH. During the 1 March 2009 Cazadero event, the sub-cloud region was about 1 km and drop size on the surface was mostly greater than 0.5 mm as recorded with a disdrometer (Fig. S7). For the observed surface conditions (T = 11 °C, RH = 63 %), our calculations show that sub-cloud evaporation could have lowered the d-excess by ∼ 2 ‰.
Graf et al. (2019) applied a similar approach for characterizing sub-cloud changes in isotopic composition resulting from below cloud evaporation and rain—vapor equilibration. They assumed a sub-cloud region of 1 km and a surface RH and temperature of 75 % and 12 °C, respectively. In this scenario, a small raindrop (0.5 mm) may lose ∼ 28 % of its mass by evaporation, which would lower its d-excess by ∼ 10 ‰. For a larger drop (1 mm), ∼ 7 % of the mass may be lost with a 5 ‰ decrease in d-excess.
We can consider a maximum of 5 ‰ lowering of d-excess by sub-cloud evaporation at Cazadero on 1 March 2009 when the surface drop size was > 0.5 mm. Sub-cloud evaporation in this Cazadero rain event, therefore, would not be the primary factor responsible for the low d-excess (about −22 ‰ to −13 ‰) and its inverse correlation with MDV (Fig. 6). That is because the MDV values for rainfall were obtained in the snow region above the melting layer within the cloud layer. The corresponding d-excess in the snow region, adjusted for sub-cloud evaporation effect, would then increase to about −17 ‰ to −8 ‰. These higher values would only strengthen the inverse correlation of d-excess with MDV (not shown).
Surface RH at Rio Claro exceeded 90 % during the portions of the stratiform precipitation events used in this study (dos Santos et al., 2024), indicating near-saturation conditions and consistent with the absence of decreasing reflectivity profiles in the relatively deep (∼ 3 km) sub-cloud region. Calculations with the Stewart model confirm that raindrop evaporation with surface RH > 90 % would result in a d-excess change of less than 1 ‰ regardless of the drop size.
At Ny-Ålesund, the sub-cloud layer was typically less than ∼ 500 m deep where rain drop evaporation potentially could occur. However, the relatively colder temperatures and higher RH documented in the radiosonde profiles (mean near-surface values of 5 °C and 80 %, respectively) further limit any evaporative loss in the shallow sub-cloud region.
3.3.5 Fall velocity above and below the melting layer
Independent confirmation that sub-cloud evaporation at Cazadero, Rio Claro and Ny-Ålesund was not responsible for the low d-excess values of rainfall comes from the relationship between fall velocities in the snow region above the melting layer (Vs) and in the rain region immediately below (Vr). This rain region is still within the cloud layer, before rain has fallen far enough to be subjected to sub-cloud evaporation. Therefore, the Vs–Vr relationship reflects in-cloud microphysics rather than sub-cloud processes. Consequently, if the low d-excess of a rain sample was caused by sub-cloud evaporation, rather than riming, we would expect that sample to correspond to the Vs and Vr relationships characteristic of unrimed or lightly rimed snow instead of graupel or other rimed particles.
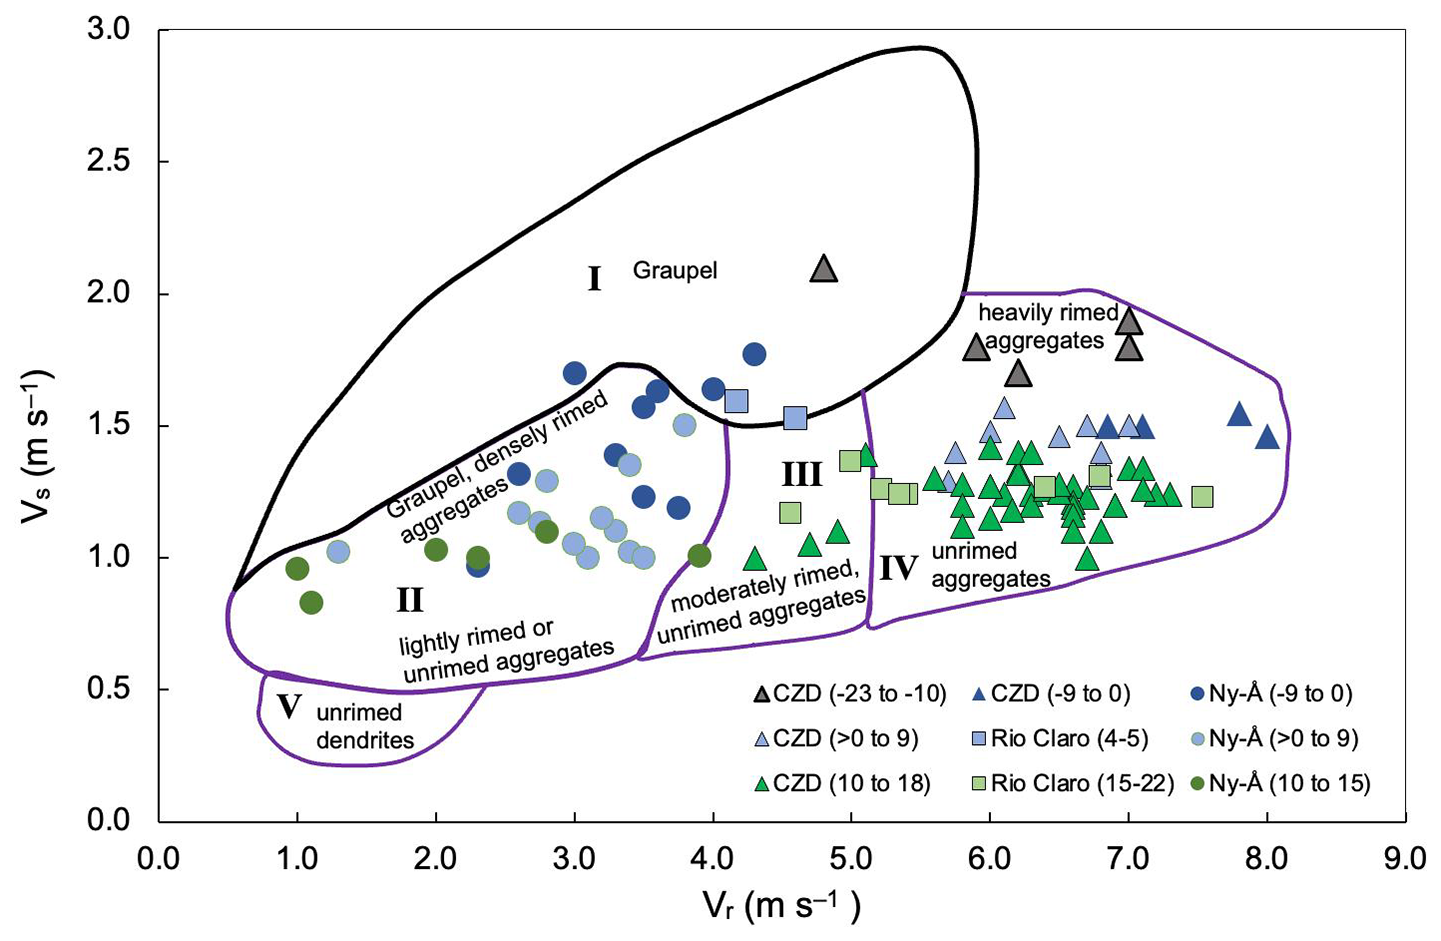
Figure 11Fall velocities above (Vs) and below (Vr) the melting layer in rainfall samples from Cazadero (CZD; triangles), Rio Claro (squares) and Ny-Ålesund (circles). Symbol colors correspond to the range of d-excess values (grey < −10 ‰; dark blue = −9 ‰ to 0 ‰; light blue = > 0 ‰ to +9 ‰; light and dark green > +10 ‰), as shown in the legend. Classification of rimed and unrimed particles in five categories (I–V) proposed by Weiss et al. (1977) is also shown: I. Graupel (lump and conical, hexagonal) and graupel-like snow; II. Graupel, graupel-like snow, moderately to densely rimed dendrites, assemblages of dendrites, and columns, aggregates of unrimed side planes, bullets and columns; III. Moderately rimed to unrimed aggregates of dendrites; unrimed aggregates of bullets, side planes and columns; IV. Moderately rimed to unrimed aggregates and radiating assemblages of dendrites; V. Unrimed dendrites. Graupel with varying density plots in multiple fields (highest density in category I). For categories II, III and IV, unrimed particles plot towards the bottom and densely rimed towards the top.
As noted previously (Sect. 2.2.2), Weiss et al. (1977) found that graupel and heavily rimed snow particles can be differentiated from unrimed particles based on their Vs–Vr relationships. They proposed five categories in the Vs–Vr space (Fig. 11) corresponding to graupel, heavily rimed dendrites and aggregates of dendrites, as well as lightly rimed or unrimed particles. The variability of fall velocities within each category is quite large because of a range of particle size and density of the rimed and unrimed particles.
The Vs–Vr values for rainfall samples from Cazadero, Rio Claro and Ny-Ålesund are plotted on Fig. 11. Lowest d-excess Cazadero samples from the 1 March 2009 event, for which the reflectivity profiles indicate potential sub-cloud evaporation, lie in the graupel or “heavily rimed” aggregates fields (grey triangles in Fig. 11), consistent with their low d-excess (−22.9 ‰ to −13.9 ‰) resulting from riming. The effect of sub-cloud evaporation, if any, would not have been significant as also indicated by the calculated effect of evaporation on d-excess (Sect. 3.3.1). The progressively higher d-excess of the rest of the Cazadero samples (light blue, dark blue and green triangles in Fig. 11) is consistent with their location in the heavily- or moderately-rimed aggregates fields of Weiss et al. (1977).
Two of the Rio Claro samples with low d-excess of +4.5 ‰ and +5.6 ‰ plot in the graupel field (light blue squares in Fig. 11). Other Rio Claro samples have much higher d-excess (light green squares), consistent with their location in the light to moderately rimed aggregates fields. This again indicates that d-excess was not significantly affected by sub-cloud evaporation, consistent with near-saturated conditions during precipitation (Sect. 3.3.1).
The d-excess of Ny-Ålesund samples is similarly consistent with their Vs–Vr classification (circles in Fig. 11). Lower d-excess samples (dark blue circles) lie in the graupel and heavily-rimed fields, indicating a riming-driven lowering of d-excess. As noted previously (Sect. 3.3.1), sub-cloud evaporation would not be expected at Ny-Ålesund because the melting layer occurs within a few hundred meters above ground.
3.3.6 Rimed mass fraction
The MDV has been directly related to the rimed mass fraction (RMF), the ratio of particle mass acquired by riming to the total mass (Mosimann, 1995; Kneifel and Moisseev, 2020). This relationship was parameterized by using a large dataset of particle size and MDV in Hyytiälä, Finland precipitation (Kneifel and Moisseev, 2020): RMF = .
We used the Kneifel and Moisseev coefficients to calculate the RMF from MDV. Because RMF is derived from MDV via a non-linear equation, a separate total least squares regression with d-excess (excluding Summit) was conducted, yielding the following relationship: d-excess = (r = −0.68; p < 0.001). The regression equation indicates a low d-excess of about −48 ‰ for fully rimed particles (graupel at RMF = 1) and a high d-excess of +34.1 ‰ for unrimed particles growing by vapor deposition (RMF = 0).
Calculated RMF for Summit was excluded from the regression because riming at Summit may occur infrequently and only in the summer (Sect. 3.1.3). Two Andenes samples result in negative RMF values. This arises because the generalized fall velocity–size relationship for unrimed particles in Kneifel and Moisseev (2020), derived from Hyytiälä precipitation, is not fully applicable to the unrimed particle population at Andenes, likely reflecting regional differences in particle size distributions. These two samples were also excluded from the regression.
The inverse correlation of d-excess with RMF was essentially the same as that for MDV (Fig. S8), but RMF is used here because it has a physical interpretation as the fraction of particle mass attributable to riming, allowing process-weighted d-excess calculations to be directly linked to observable microphysical quantities (Sect. 3.5).
3.3.7 In-cloud processes and precipitation d-excess
The site-independent correlation of d-excess with MDV (Fig. 6) and the influence of vapor deposition versus riming growth on d-excess of daily precipitation at Summit, Ny-Ålesund and Dumont d'Urville (Sect. 3.2) all indicate that variable in-cloud processes modulate the d-excess of surface precipitation. The dynamic forcing controlling these processes changes rapidly and frequently during a precipitation event (Korolev et al., 2017), such that precipitation collected for even a short interval of 10–20 min would contain hydrometeors that grew by vapor deposition at variable SI or by both vapor deposition and riming. In addition, the lower d-excess of winter Summit precipitation without riming contributions indicates that vapor deposition itself may result in variable d-excess. Isotopic analysis of precipitation therefore provides a process-weighted d-excess value reflecting the integrated history of all growth modes experienced by the hydrometeor population. We now explore the role of in-cloud processes in precipitation d-excess variability by calculating the d-excess of end-members forming by vapor deposition (including diamond dust) and riming (wet and dry growth) to evaluate a process-weighted interpretation of observed d-excess at our study locations. A sensitivity analysis was conducted to evaluate the influence of various input parameters on calculated d-excess. Finally, the end-member compositions were combined in different fractions to show that the observed d-excess variations can be produced by in-cloud processes.
3.3.8 Calculation of end-member d-excess
The d-excess of vapor deposition and riming end-members in mixed-phase clouds were calculated following established isotope fractionation frameworks (Jouzel and Merlivat, 1984; Jouzel et al., 1985). Calculations for diamond dust, which is pure ice-phase precipitation forming at temperatures below −38 °C, use the same kinetic fractionation as vapor deposition.
The isotope ratio during vapor deposition of ice, including diamond dust, is given as (Jouzel and Merlivat, 1984):
where Rice and Rv are the isotope ratios ( or ), respectively, of vapor-deposited ice and ambient vapor, αsv is the equilibrium solid–vapor fractionation factor (Majoube, 1971 for 18O; Merlivat and Nief, 1967 for 2H), and αk is the kinetic fractionation factor (Jouzel and Merlivat, 1984):
where Si is the ice supersaturation ratio, is the ratio of diffusivities of the light to heavy isotopologue (1.0285 for ; 1.0251 for H2H16O; Merlivat, 1978) reflecting the faster diffusion of the lighter molecule, and f is the ventilation factor. Jouzel and Merlivat (1984) defined Si as the effective ice supersaturation that accounts for the thermodynamic effects of latent heat at the particle surface. The effective Si is equivalent to the ambient supersaturation ratio at temperatures below −35 °C, and is lower at higher temperatures. The difference becomes most significant at temperatures near zero. Within the temperature range −35 to −20 °C that we have used for calculations here, the effective Si is only 1 %–5 % lower than the ambient ratio. Therefore, we have simplified the calculation of vapor deposition and diamond dust d-excess (Table 4) by defining Si as the ambient supersaturation ratio. As noted previously (Sect. 2.4), and is parameterized as with a=1 and b generally in the range of −0.002 to −0.006 (Dütsch et al., 2019).
Table 4Calculated isotope compositions of end-members from different growth processes∗
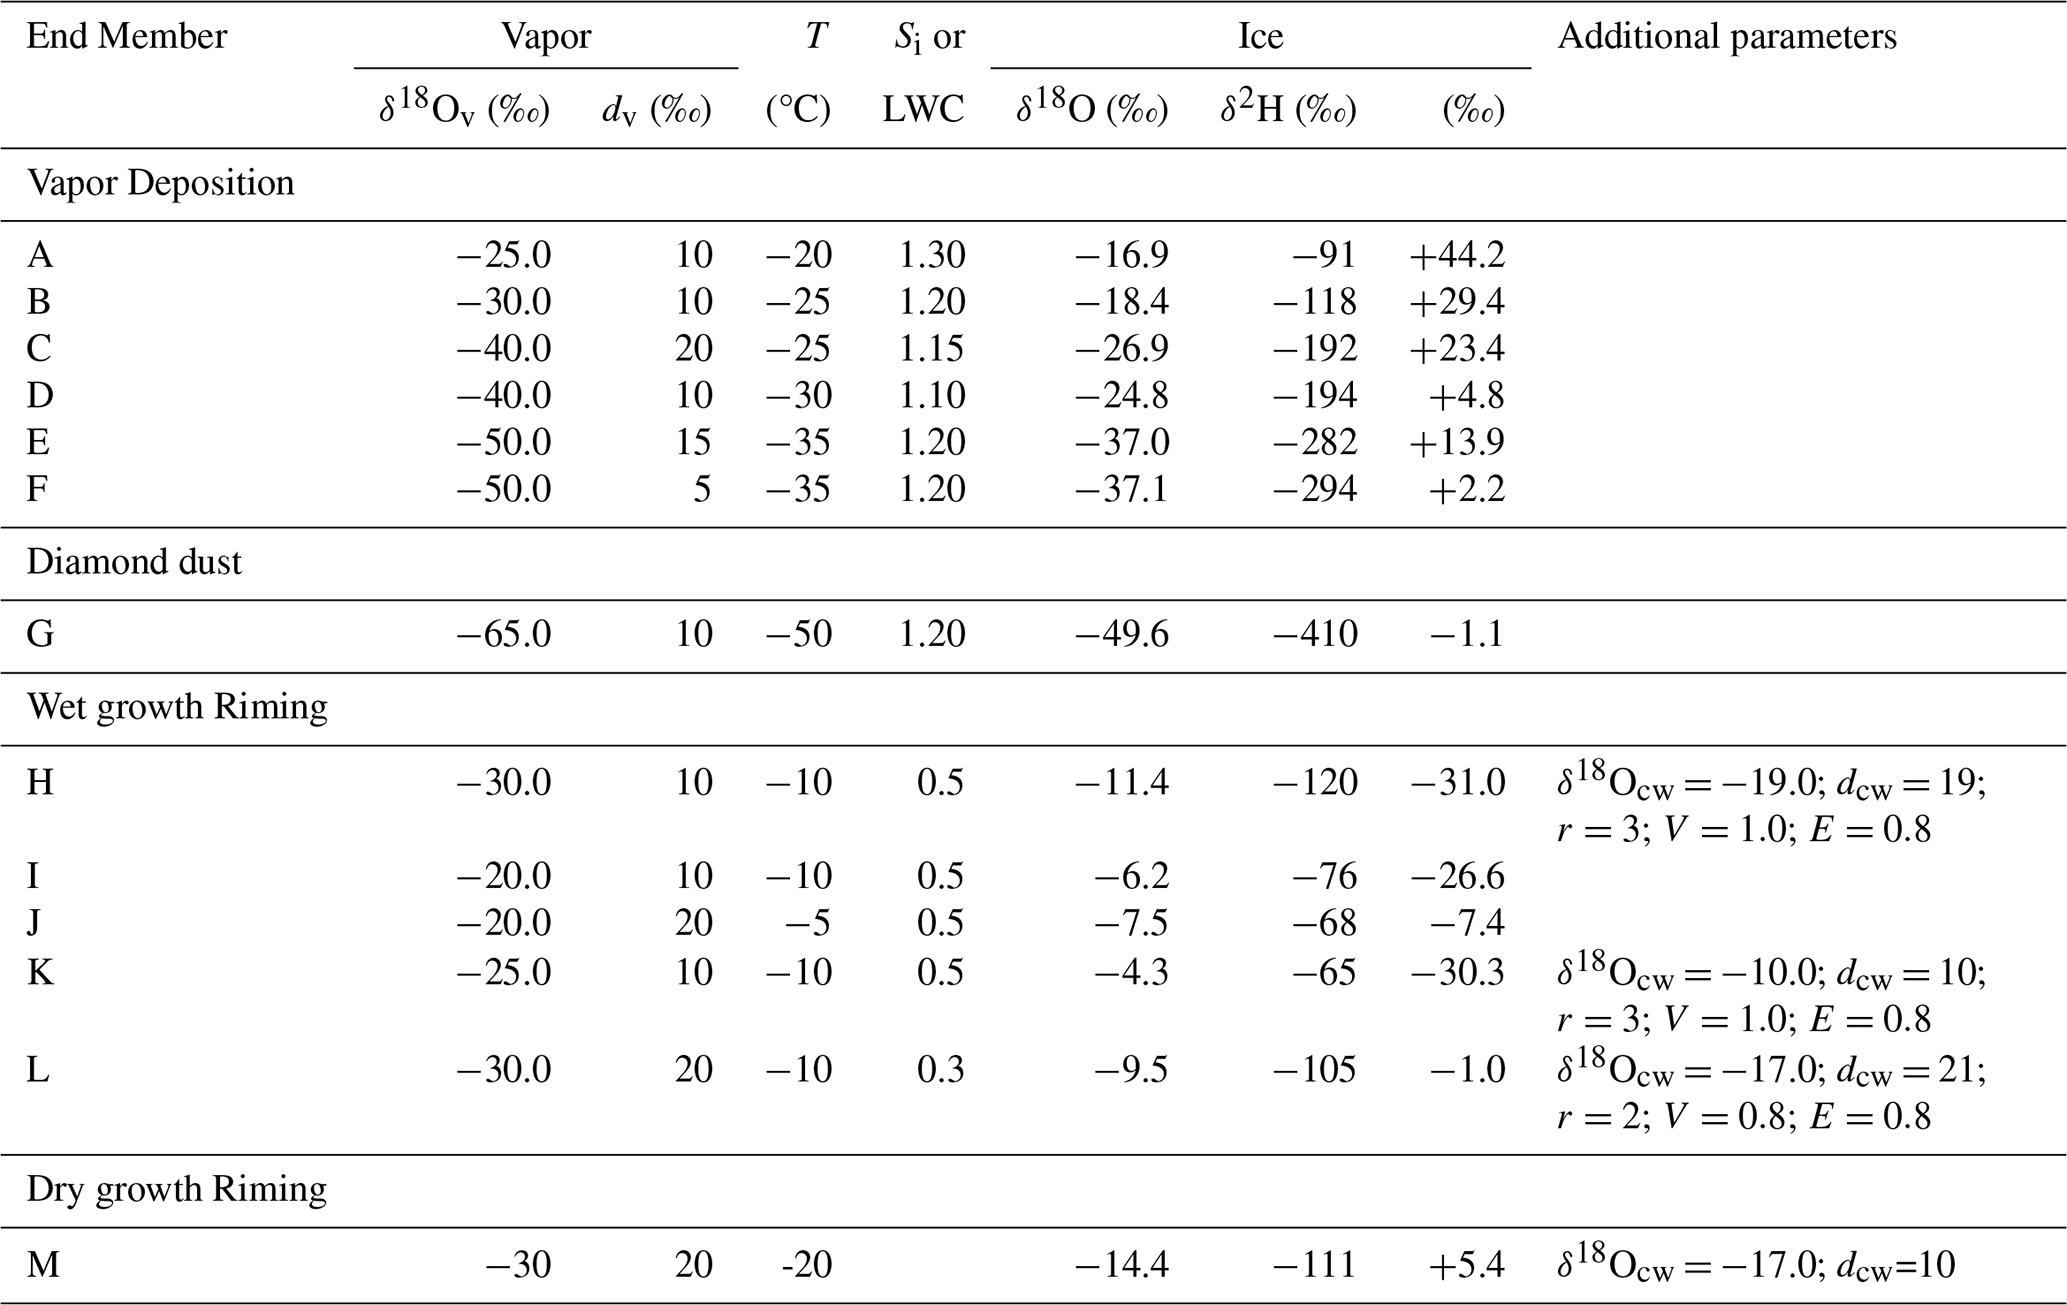
∗ Input isotope compositions: the subscripts v and cw refer to ambient vapor and cloud water; T = growth temperature; Si = ice supersaturation ratio; LWC = liquid water content (g m−3); r = particle radius (mm); V = relative fall speed (m s−1); E = collection efficiency.
Riming by wet growth occurs when the latent heat of fusion released by the freezing of the supercooled droplets raises the particle surface temperature and the droplets spread to form a liquid film. This liquid film may partially evaporate before the supercooled liquid freezes completely.
The isotopic composition of a persistent liquid film on the growing particle evolves as follows (Jouzel et al., 1985):
where RL is the isotope ratio of the liquid film, Rc is the cloud water isotope ratio, dμc is the total collection rate of supercooled liquid, dμf is the freezing rate, dμE is the evaporation rate from the film surface, αls is the equilibrium liquid-solid fractionation factor, F is the isotope flux to the vapor phase, and μL is the film thickness (assumed constant). Note that dμf is determined by mass balance (dμf = dμc−dμE) rather than the heat budget directly, because both constraints are simultaneously satisfied in wet growth; the heat budget determines the minimum LWC required, and once that threshold is exceeded, Ts is maintained at 0 °C and the mass balance governs the freeze rate.
The collection rate of the liquid is
where r is the particle radius, V is the relative fall speed of the particle with respect to air motion, LWC is the liquid water content, and E is the collection efficiency. The evaporation rate from the liquid film is governed by diffusive vapor transport away from the particle surface:
where is the molecular diffusivity of water vapor (= 2.4 × 10⁻⁵ m2 s−1; Pruppacher and Klett, 2010), Sh is the Sherwood number (Sh = , computed from the same particle radius and fall speed as the collection rate in Eq. 4), Sc is the Schmidt number, Re is the Reynolds number, ρs is the saturation vapor density at the particle surface temperature, and ρe is the ambient vapor density.
We note that evaporation of the liquid film on the particle surface is driven by the temperature (or vapor pressure) difference between the particle surface and ambient air. On the particle surface, the temperature (Ts) is 0 °C regardless of the ambient air temperature (Ta). Because Ta is less than Ts in any mixed-phase cloud, the saturation vapor pressure at the particle surface always exceeds the ambient vapor pressure, driving continuous evaporation of the liquid film even when the surrounding air is at liquid water saturation.
The isotope flux F in Eq. (3) is the species-specific form of Eq. (5):
where Di is the absolute isotopologue-specific diffusivity (), and αlv is the liquid–vapor equilibrium fractionation factor at the particle surface temperature (0 °C for wet growth).
The isotope ratio of rimed ice from wet growth at each time step is αls⋅RL. Integration of Eq. (3) proceeds until the film composition reaches an asymptotic value at a prescribed film thickness (Jouzel et al., 1985).
Dry growth occurs when the latent heat of fusion is dissipated without the particle surface warming to 0 °C. In that case, a persistent liquid film does not form. The accreted droplets freeze rapidly, with heat conducted primarily into the ice particle rather than to the ambient air. A small fraction of each droplet may evaporate before complete freezing, but that would produce an isotopic correction of the order of 0.1 ‰ (following Jouzel et al. 1985, Appendix B). Therefore, the isotope ratio of the rimed ice is assumed to reflect only the equilibrium liquid-solid fractionation:
This fractionation results in the d-excess of dry growth rimed ice being ∼ 2 ‰–3 ‰ lower than the cloud water depending on the ambient temperature.
3.3.9 Sensitivity calculations
Equations (1) through (7) employ multiple parameters to determine the d-excess resulting from vapor deposition or riming processes. Table S3 summarizes the various input parameters and their significance in the process-based isotope calculations. To assess the relative impact of these parameters on calculated d-excess, we conducted sensitivity calculations across a range of parameter values. Figure 12 illustrates the calculated sensitivity, focusing solely on one dominant parameter for each process. Detailed results for other parameters are provided in Figs. S9–S11.
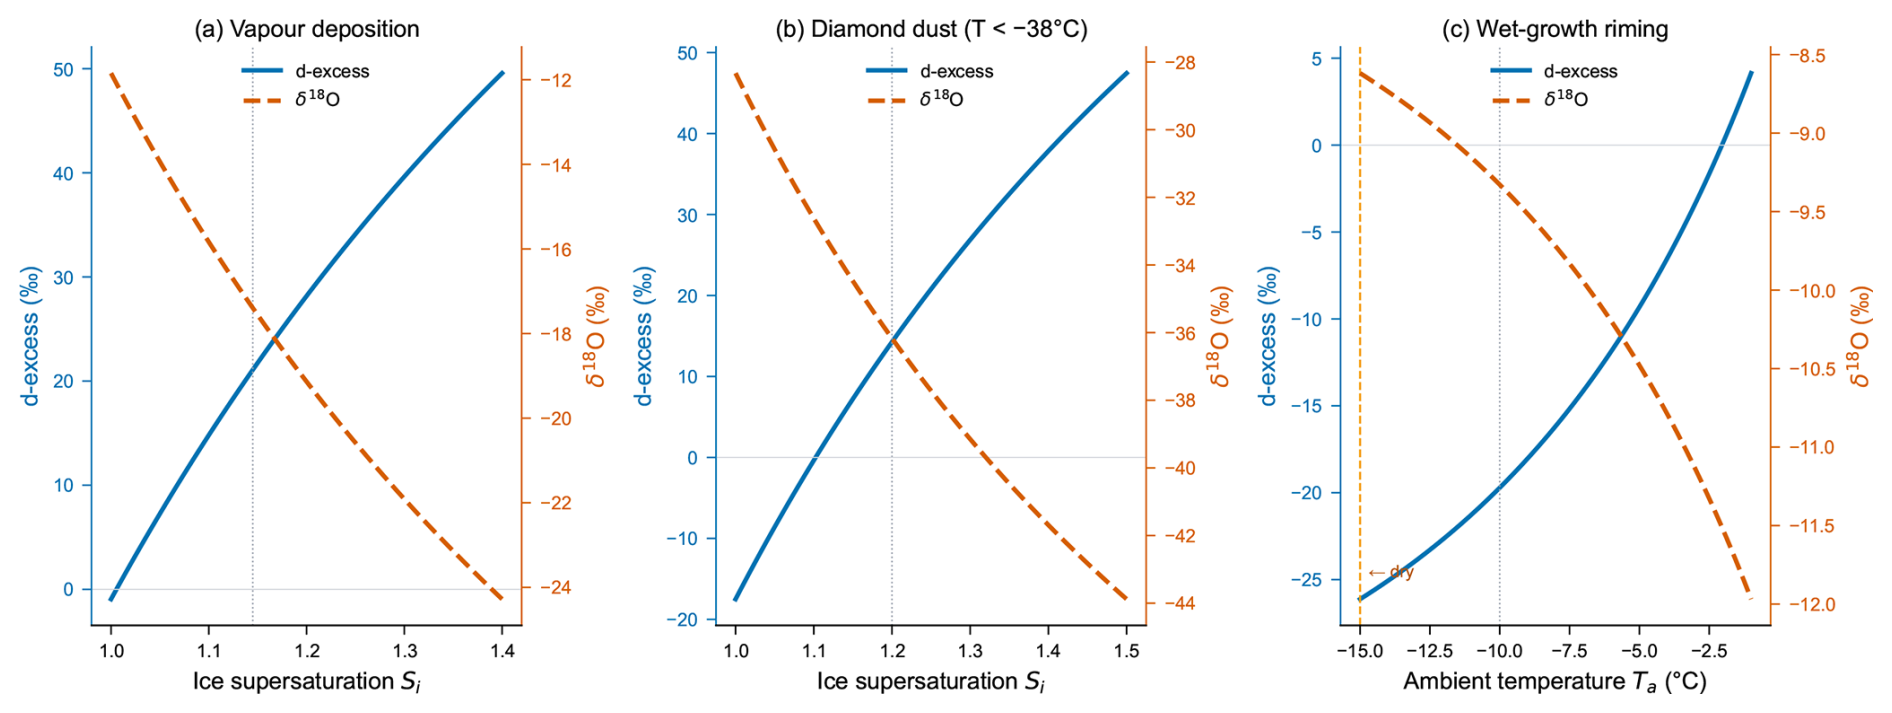
Figure 12Sensitiy of calculated end-member d-excess and δ18O to input parameters. The vertical brown line in (c) shows the temperature below which riming by dry growth becomes dominant. Other input parameters: for (a): δ18Ov = −30 ‰, dv = +10 ‰, Tc = −20 °C, f = 0.997; for (b) δ18Ov = −50 ‰, dv = 15 ‰, Tc = −40 °C; for (c): δ18Ov = −20 ‰, dv = +10 ‰, LWC = 0.5 g m−3, E = 0.8, r = 3 mm, V = 1 .
For vapor deposition and diamond dust (Fig. 12a and b), the sensitivity analysis identifies ice supersaturation as the dominant control on the d-excess of ice. The d-excess increases approximately linearly from near 0 ‰ at Si = 1.00 ‰ to +50 ‰ at Si = 1.40 – driven by the faster diffusion of H2H16O relative to . At lower temperatures, the low δ18O of ambient vapor is an equally important secondary control: d-excess of deposited ice increases by about 47 ‰ as δ18Ovapor varies from −60 ‰ to −20 ‰ (Fig. S9), because αsv(18O) has a stronger temperature dependence than αsv(2H) at T < −20 °C, depressing the d-excess of ice and potentially driving it negative. The ambient vapor d-excess has a comparatively minor impact as a given change in vapor d-excess produces an almost equally sized change in ice d-excess, rather than being amplified or damped by the fractionation in the deposition process (Fig. S9).
Winter precipitation at Summit forms by vapor deposition throughout a cold column (∼ −60 to −30 °C) with positive SI (up to ∼ 23 %), and atmospheric vapor with very low δ18O (average winter precipitation δ18O of approximately −38 ‰). The combination of cold temperatures and atmospheric vapor with very low δ18O resulted in low d-excess of deposited ice in our calculations. This is consistent with results of Dütsch et al. (2019) who used iCAM5, an isotope-enabled general circulation model (GCM), to show that the ice supersaturation parameterization strongly controls simulated polar precipitation d-excess. As noted previously (Sect. 3.5.1), the dimensionless ice supersaturation ratio Si () is parameterized as a linear function of temperature (Si = ) with a=1 and b = −0.002 to −0.006 (Jouzel and Merlivat, 1984; Dütsch et al., 2019). A parameter value of b = −0.002 is commonly used to reproduce d-excess values of ∼ +20 ‰ observed in ice cores (Dütsch et al., 2019). However, with b = −0.006, the condensate has a d-excess of −10 ‰ (Fig. 1 of Dütsch et al.) when δ2Hvapor ≈ −460 ‰ and d-excessv ≈ −5 (equivalent δ18Ov ≈ −57 ‰). For b = −0.006 and T = −50 °C, Si = 1.3 (SI = 30 %), and at T = −30 °C, Si = 1.18 (SI = 18 %). For these conditions, our calculations give an average d-excess of −12 ‰ (compared to −10 ‰ by Dütsch et al.) and provide an explanation for the low d-excess (and low MDV) of Summit winter precipitation (Fig. 3) without any riming contribution. The variability in winter d-excess at Summit would reflect variations in both vapor δ18O and SI, consistent with the absence of mixed-phase conditions at the low winter temperatures. Conversely, higher summer SI values at warmer growth temperatures – and relatively higher δ18O of ambient vapor – would result in higher d-excess. The variability in summer d-excess at Summit would be modulated by variability in SI and riming under favorable conditions.
In the case of riming by wet growth (Figs. 12c and S11), the sensitivity analysis identifies ambient temperature as the dominant control on rimed ice d-excess (∼ 18 ‰ range across −15 to −5 °C), followed by liquid water content (∼ 25 ‰ range across 0.05 to 3.0 g m−3) and particle size (∼ 16 ‰ range across 0.5 to 5 mm), while cloud water d-excess contributes a moderate effect (∼ 6 ‰ range). At T = −5 °C, typical of the riming zone below ∼ 700 m at Ny-Ålesund and of ice-phase growth above the melting layer at tropical and mid-latitude sites, we estimate d-excess values of 0 ‰ to +5 ‰ for cloud water d-excess of +7 ‰ to +10 ‰ – substantially lower than the +15 ‰ to +20 ‰ produced by vapor deposition under the same source vapor conditions. The boundary for wet or dry growth riming – defined by whether the supercooled water collection rate exceeds the freez rate – is temperature and LWC dependent, with wet growth becoming increasingly restricted to temperatures warmer than −10 to −5 °C at low LWC values typical of stratiform clouds. In turbulent cloud conditions, both the droplet collection rate (through enhanced relative fall velocity) and the available LWC (through adiabatic updraft condensation) increase, lowering the minimum LWC threshold for wet growth by ∼ 10 %–15 %. This potentially shifts riming from the dry to wet growth regime even in predominantly stratiform environments, consistent with the findings of Chellini and Kneifel (2024) that riming intensity at Ny-Ålesund correlates with turbulence.
In dry growth riming, which operates at temperatures below approximately −15 °C and low LWC where collected droplets freeze immediately without forming a liquid film, only the equilibrium liquid-ice fractionation is applicable. Our calculations show that dry growth rimed ice has d-excess approximately 2 ‰–3 ‰ lower than the collected cloud water at −15 °C, declining toward zero difference at −30 °C as the equilibrium fractionation factors for deuterium and 18O converge at lower temperatures.
3.3.10 Process-weighted d-excess
We used a range of vapor and cloud water isotope compositions and riming growth parameters that were reasonable for the study locations to calculate end-member isotopic compositions (Table 4). Process-weighted d-excess of surface precipitation (dsurface) was calculated as the mass-weighted sum of the four end-member contributions (Table 5):
where fdep, fdust, frim-wet and frim-dry are the fractional contributions of each growth process summing to unity.
Table 5Precipitation isotope compositions based on process-weighted mixtures. End-member compositions A to M are provided in Table 4.
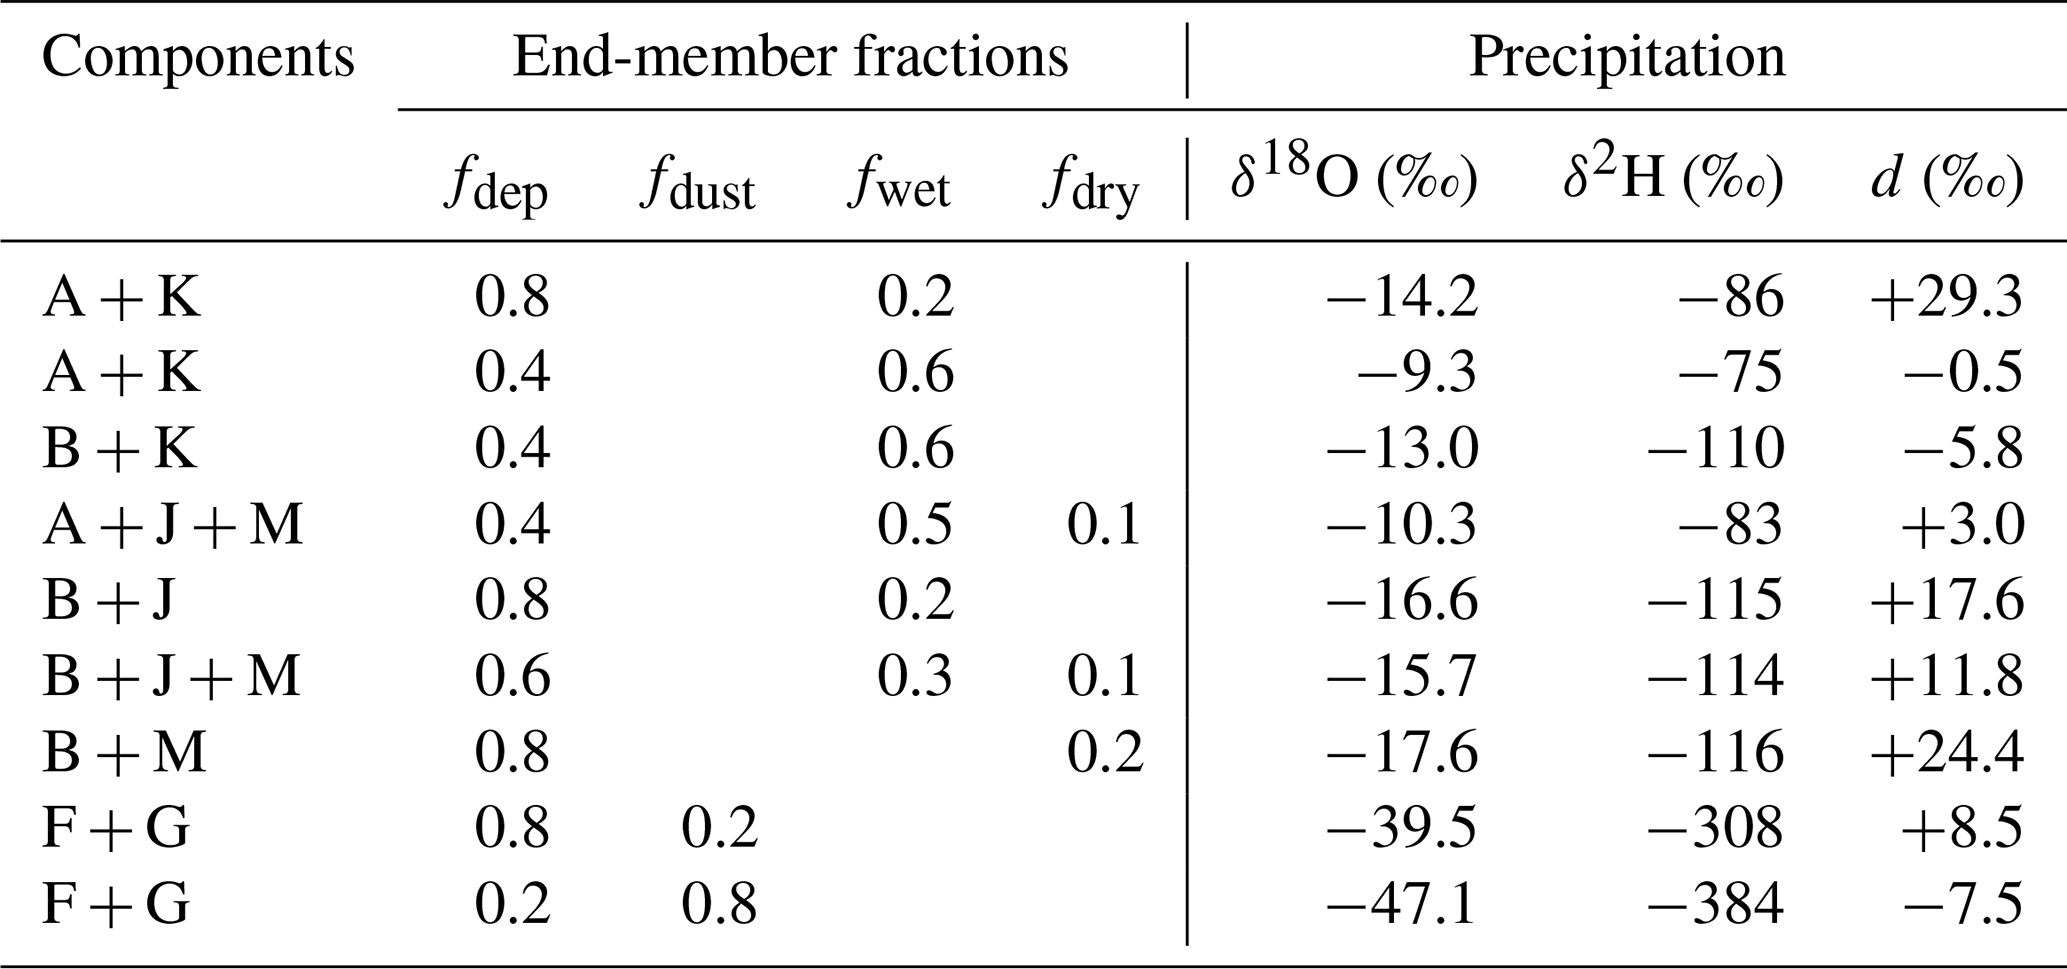
For the maritime polar, mid-latitude and tropical sites (Ny-Ålesund, Dumont d'Urville, Cazadero and Rio Claro), rimed ice fractions ranged from 0.2 to 0.6, consistent with estimated RMF (Fig. S8), with the rest being vapor deposition. Diamond-dust was not included for these polar sites as the temperature and SI profiles during the isotope sampling days indicated mixed-phase conditions at all heights (Sect. 3.2). Process-weighted mixtures spanning 40 %–80 % vapor deposition with the remainder as wet and/or dry riming produced d-excess values of −5.8 ‰ to +29.3 ‰, consistent with the observed precipitation d-excess range at these sites. The mixture with 40 % vapor deposition and 60 % wet growth riming produces d-excess ≈ 0 ‰, consistent with heavily rimed events approaching the graupel end-member. Vapor deposition events (fdep = 100 %) reach d-excess = +44.2 ‰ (Table 4), consistent with the highest observed values at Ny-Ålesund.
For Summit summer, vapor deposition at Tc = −25 °C and Si = 1.20 (SI = 20 %) yields d-excess = +29.4 ‰ (Table 4). Mixtures of 80 % vapor deposition with 20 % dry growth riming or 20 % wet growth riming produce d-excess of +24.4 ‰ and +17.6 ‰, respectively, and 30 % wet growth riming with 10 % dry growth results in a d-excess of +9.3 ‰, consistent with the observed summer d-excess range of approximately +10 ‰ to +30 ‰.
For Summit winter, the vapor deposition end-member at Tc = −35 °C and Si = 1.20 produces d-excess = +13.9 ‰ while the diamond dust end-member at Tc = −50 °C and Si = 1.20 yields d-excess = −1.1 ‰. Mixtures of vapor deposition and diamond dust (20 %–80 % diamond dust fraction) produce d-excess of −7.5 ‰ to +8.5 ‰, consistent with the observed winter d-excess range of approximately 0 ‰ to +15 ‰ at Summit. The strongly negative d-excess of the diamond dust end-member – forming at very cold temperatures from strongly 18O- and 2H-depleted source vapor – drives the mixture d-excess well below the vapor deposition end-member even at modest diamond dust fractions.
3.4 Discussion
The inverse correlation of d-excess with MDV (or rimed mass fraction) and the process-weighted framework developed here have broader implications for the interpretation of d-excess in ice core records and modern precipitation.
3.4.1 d-excess–RMF parameterization
The total least squares regression of d-excess and RMF across all sites (except Summit) yields a slope of approximately −82 ‰ per unit RMF (Fig. S8), providing a simple, observationally constrained parameterization: each 0.1 unit (10 %) increase in RMF corresponds to a d-excess decrease of ∼ 8 ‰. The convergence of this slope across sites ranging from tropical Rio Claro to polar Ny-Ålesund and Dumont d'Urville, with a wide range of cloud temperatures, LWC, and atmospheric conditions, suggests that it reflects a robust microphysical relationship rather than a site-specific artifact. This parameterization offers a practical diagnostic for isotope-enabled climate models such as iCAM5 (Nusbaumer et al., 2017), which currently treat riming as isotopically neutral. Where Doppler radar observations are available alongside modeled precipitation fields, the predicted lowering of d-excess from simulated riming intensity could be compared against observed precipitation d-excess to evaluate whether model microphysics schemes produce physically realistic riming rates. Conversely, where isotope observations exist but radar data do not, the parameterization allows rimed mass fraction to be estimated directly from measured d-excess, providing a microphysical constraint that is otherwise difficult to obtain from surface observations alone.
3.4.2 Paleoclimate implications
The lower d-excess of ice cores from the LGM compared to the Holocene, and the d-excess changes associated with abrupt stadial-interstadial transitions in Greenland (Jouzel et al., 2007; Johnsen et al., 1989), have been interpreted as evidence for major reorganization of moisture source regions. The results of this study suggest an alternative or complementary interpretation that does not require source region changes. The Summit winter case demonstrates that vapor deposition at very low temperatures (−30 to −65 °C), from vapor strongly depleted in 18O under high ice supersaturation, suppresses precipitation d-excess to low or negative values entirely through in-cloud fractionation physics, without any riming contribution. Glacial conditions at high-latitude ice core sites were characterized by temperatures substantially colder than present, more 2H- and 18O-depleted atmospheric vapor, and likely higher ice supersaturation during precipitation events (Jouzel and Merlivat, 1984; Dütsch et al., 2019). These are precisely the conditions that we identify in our process-weighted framework as producing low d-excess through vapor deposition, independent of evaporative conditions at the moisture source. The glacial-to-Holocene increase in d-excess at Greenland or Antarctic ice core sites may therefore reflect, at least in part, the warming of the precipitating column and the associated increase in vapor δ18O and reduction in ice supersaturation, rather than, or in addition to, a shift in moisture source origin. This interpretation is consistent with the back-trajectory analysis of Pettersen et al. (2018), which found no systematic seasonal difference in moisture source between Summit precipitation types despite large differences in d-excess, and with GCM sensitivity experiments showing that the choice of ice supersaturation parameterization strongly controls simulated polar d-excess (Dütsch et al., 2019). Distinguishing the in-cloud fractionation signal from the source moisture signal in ice core records will require isotope-enabled models that explicitly represent both the temperature and SI dependence of vapor deposition fractionation and the riming contribution documented here.
3.4.3 Spatial variations in d-excess of polar surface snow
In Greenland (Fig. S12a), surface snow d-excess decreases from north to south – from approximately +14 ‰ in the northwest (near Camp Century; Osterberg et al., 2015), through +9.5 ‰ at GRIP (Summit), to +8 ‰ at Dye 3 (Johnsen et al., 1989) – a gradient traditionally attributed to different moisture source origins (Johnsen et al., 1989; Masson-Delmotte et al., 2005). However, the same gradient would be consistent with a systematic change in d-excess resulting from vapor deposition at different ice supersaturation and temperature conditions along the north-south transect. Compared to GRIP (Summit), Camp Century has a lower surface elevation and is located closer to the coast (∼ 200 km inland). These differences likely would result in ice growth at Camp Century to occur by vapor deposition at relatively higher temperatures and different ice supersaturation conditions than at GRIP. This would likely exclude the very low d-excess in winter precipitation and result in a higher d-excess at Camp Century compared to GRIP. Similarly, lower d-excess from riming contribution would be important at Dye 3 in southcentral Greenland, where proximity to the coast (∼ 120 km inland) and warmer cloud temperatures favor frequent mixed-phase conditions and riming (Borys et al., 1993). Distinguishing between these controls requires simultaneous Doppler radar observations and isotope sampling of daily precipitation at multiple Greenland sites.
In Antarctica (Fig. S12b), coastal precipitation has consistently lower d-excess than interior plateau precipitation (Wang et al., 2022) – a contrast attributed to the closer proximity of coastal sites to marine moisture sources with higher relative humidity (Masson-Delmotte et al., 2008). However, the coastal Antarctic environment is characterized by frequent frontal precipitation with vigorous dynamics, high LWC in mixed-phase clouds, and extensive riming as documented for Dumont d'Urville in this (Sect. 3.2) and previous studies (Grazioli et al., 2017). Moderate to heavy riming has been noted at McMurdo (Tridon et al., 2022) and the Mario Zucchelli station (Scarchilli et al., 2020). At both of these locations, snow particle fall velocities are frequently greater than ∼ 1 m s−1 near the surface, consistent with the low d-excess values resulting from more frequent and heavier riming. Warburton (1978) noted that rimed ice crystals were dominant in falling snow near the McMurdo station and that their proportion decreased with distance from the coast as growth by vapor deposition became dominant in inland precipitation. Different in-cloud processes may therefore sufficiently explain the spatial d-excess variations across Antarctica rather than, or in addition to, source moisture differences. Distinguishing between these two controls may be possible with more detailed analysis using simultaneous Doppler radar observations and isotope sampling of daily precipitation.
3.4.4 Tropical precipitation and the amount effect
The inverse d-excess–MDV correlation at Rio Claro extends the riming interpretation into the tropics, where stratiform precipitation in mesoscale convective systems is responsible for a large fraction of total rainfall (Schumacher and Funk, 2023). Low d-excess values in tropical rainfall are commonly attributed to the “amount effect” – the observed depletion of heavy isotopes in high-intensity rainfall – or to sub-cloud evaporation (Dansgaard, 1964; Moerman et al., 2013). However, the results here show that stratiform tropical rainfall with a well-defined melting layer and rimed particles above it carries a low d-excess signal that originates in the ice-phase region, entirely above the sub-cloud layer. In mesoscale convective systems, the seeder-feeder process is well documented during stratiform episodes (Houze, 2014): ice particles grown by vapor deposition in the upper anvil fall into a lower feeder region where supercooled liquid water content is higher and riming occurs. The temporal progression from convective to stratiform precipitation within a single mesoscale event would therefore produce a systematic evolution from very low d-excess – driven by vigorous wet growth riming in the convective stage – toward higher d-excess as the stratiform stage becomes vapor-deposition dominated. Riming may therefore contribute to the amount effect signal in tropical precipitation, and its role warrants further investigation alongside sub-cloud evaporation and convective intensity.
3.4.5 Mid-latitude frontal precipitation
The systematic temporal evolution of d-excess during mid-latitude frontal precipitation events may also be better understood through the process-based interpretation developed here. At Cazadero, the lowest d-excess values (−22.9 ‰ to −13.9 ‰) occurred in the early hours of the 1 March 2009 event (Fig. 6 and Sect. 3.3) followed by progressively higher d-excess and lower δ18O (Fig. S13). Low d-excess values in rainfall have commonly been attributed to sub-cloud evaporation, which we have shown may have had only a minor influence on the Cazadero d-excess values (Sect. 3.3). The presence of a melting layer throughout the event (Fig. S6) confirms that precipitation was stratiform during both the early low d-excess and later higher d-excess periods. The temporal evolution of d-excess is physically consistent with the known evolution of riming intensity within frontal precipitation systems: in the early stage, embedded convective cells and turbulent motions within the stratiform region generate higher LWC and more vigorous riming – conditions identified in the sensitivity analysis as producing the lowest d-excess – while the mature stratiform stage has weaker vertical motions, lower LWC, and vapor-deposition-dominated growth producing higher d-excess (Matejka et al., 1980; Houze, 2014). The temporal MDV–d-excess correlation within the Cazadero event is therefore consistent with the expected evolution of riming intensity within a single frontal precipitation event, and mirrors the tropical case in reflecting the convective-to-stratiform transition.
We investigated the effect of riming on the d-excess of precipitation at six locations from the tropics to the polar regions: Rio Claro, Brazil; Cazadero, California; Summit, Greenland; Ny-Ålesund and Andenes, Norway; and Dumont d'Urville, Antarctica. The mean Doppler velocity (MDV) of precipitating hydrometeors was used as an independent, physically based indicator of riming intensity. Riming increases both particle density – replacing low-density dendritic ice with dense accreted ice – and effective diameter, both of which raise terminal fall speed substantially. MDV is therefore a direct proxy for the degree of riming that is entirely independent of the isotopic measurements.
Daily or sub-daily precipitation d-excess was correlated with concurrent MDV measured near the surface (150–300 ) during snowfall and above the melting layer (∼ 2–4.5 ) during rainfall. An inverse correlation between d-excess and MDV was found at all locations except Summit winter, spanning a wide range of temperatures, moisture sources and atmospheric conditions. Because the MDV values used for rainfall were extracted from the ice-phase region above the melting layer, they are unaffected by sub-cloud evaporation. Sub-cloud evaporation may slightly lower the d-excess of individual rain samples at the surface, but it cannot produce the systematic, multi-site inverse correlation of d-excess and MDV shown here.
Vertical profiles of temperature, relative humidity and ice supersaturation index (SI) derived from radiosonde soundings at Summit, Ny-Ålesund and Dumont d'Urville, provide independent atmospheric context that corroborates the microphysical interpretation. At Summit, these profiles show that the low winter temperatures (< −38 °C) in the entire precipitating column preclude mixed-phase conditions and riming while summer profiles reveal the occurrence of near-liquid-saturation conditions at temperatures between −10 and −4 °C, consistent with wet growth riming. The low d-excess of winter Summit precipitation can be explained to result from ice growth by vapor deposition at very low temperatures (−30 to −65 °C) and ice supersaturated conditions from vapor depleted in 18O, consistent with published isotope-enabled GCM simulations (Dütsch et al., 2019). At Ny-Ålesund and Dumont d'Urville, the temperature and SI profiles reveal a two-layer growth structure in which vapor deposition dominates in the upper, ice-supersaturated column while riming occurs in the lower, near-liquid-saturated layer, consistent with the seeder-feeder cloud structure documented at those sites.
The physical mechanism responsible for the lower d-excess of rimed ice operates through evaporation of the accreted liquid film during wet growth riming. When the rate of supercooled droplet collection exceeds the rate at which latent heat of fusion can be conducted away, the particle surface temperature rises to 0 °C while ambient air remains at temperatures below freezing. This temperature (and corresponding vapor pressure) differential drives evaporation of water from the liquid film into the subsaturated ambient air. Liquid film evaporation on small particles may also occur even when the particle surface remains below 0 °C, due to low water contents, as long as the latent heat release warms the particle surface to temperatures > 0.6 °C compared to the ambient. Because H2H16O diffuses more slowly than in air, evaporation preferentially removes 18O relative to 2H from the accreted liquid, lowering the d-excess of the liquid that ultimately freezes. Sensitivity calculations show that this mechanism produces rimed ice with substantially lower d-excess than the liquid (by as much as 20 ‰–30 ‰) while dry growth riming at temperatures below approximately −10 °C produces only a modest d-excess reduction of 2 ‰–3 ‰ through equilibrium liquid-ice fractionation.
A process-weighted framework was developed to quantify the d-excess of precipitation as a mass-weighted mixture of four end-member growth modes: vapor deposition, diamond dust, wet growth riming, and dry growth riming. Process mixtures with 20 %–80 % vapor deposition (or 100 % for Summit winter), and the remainder as riming, reproduce the observed d-excess range across all study sites. These calculations demonstrate that in-cloud microphysical processes alone can account for the observed spatial and temporal d-excess variability from tropical to polar precipitation regimes.
Our findings suggest that low d-excess in precipitation and ice cores, traditionally attributed to changes in source moisture origin or sub-cloud evaporation, warrants reexamination. This does not imply that vapor composition is irrelevant: the δ18O and d-excess of ambient vapor are explicit inputs to the fractionation calculations, and their seasonal and spatial variability contributes meaningfully to d-excess variability. Rather, we argue that the in-cloud fractionation component – controlled by growth temperature, ice supersaturation and riming intensity – is of comparable or greater magnitude than the vapor signal across many precipitation regimes. Separating these two contributions requires independent constraints on in-cloud conditions, such as those provided by the radar-based riming proxy introduced here. The conventional attribution of d-excess variability solely to oceanic evaporation conditions (sea surface temperature and relative humidity) requires additional caution: the source evaporation signal is substantially modified by Rayleigh distillation and vapor mixing during atmospheric transport and during ice growth by vapor deposition and riming.
Data used in this study were obtained from publicly available sources (Table 2) and are listed here: Radar data (https://doi.org/10.5439/1025228, ARM, 2010; https://doi.org/10.5439/1228768, ARM, 2019; https://doi.org/10.1594/PANGAEA.958967, Ebell et al., 2023; Coplen et al., 2015; , Wiener et al., 2024; https://npdc.ncpor.res.in/, last access: 8 May 2026); Radiosonde data (https://psl.noaa.gov/arctic/observatories/summit/; https://doi.org/10.1594/PANGAEA.845338, Maturilli and Kayser, 2016; https://doi.org/10.1594/PANGAEA.875196, Maturilli and Kayser, 2017; https://doi.org/10.1594/PANGAEA.961203, Maturilli and Dünschede, 2023; Météo-France: https://donneespubliques.meteofrance.fr/, last access: 12 June 2026); Isotope data (Coplen et al., 2015; Kopec et al., 2019; https://doi.org/10.5281/zenodo.7708489, Leroy-Dos Santos, 2023; https://doi.org/10.5281/zenodo.3689566, Leroy-Dos Santos, 2020; Mellat et al., 2021; dos Santos et al., 2024; Seitel et al., 2026).
The supplement related to this article is available online at https://doi.org/10.5194/acp-26-13661-2026-supplement.
PKA conceived the project and designed the methodology, compiled isotope and radar data, and conducted the analyses; CS, FJL and MDS contributed to refining the methodology; AF assisted in processing radar data; PKA wrote the original draft; CS, FJL and MDS critically reviewed and edited the original and revised drafts; PKA prepared the final manuscript.
The contact author has declared that none of the authors has any competing interests.
Publisher's note: Copernicus Publications remains neutral with regard to jurisdictional claims made in the text, published maps, institutional affiliations, or any other geographical representation in this paper. The authors bear the ultimate responsibility for providing appropriate place names. Views expressed in the text are those of the authors and do not necessarily reflect the views of the publisher.
The senior author expresses his sincere gratitude to the researchers who diligently collected and made publicly accessible the isotope and radar data utilized in this study, and to Jean Jouzel for his review of an earlier version of the manuscript. Allen White of NOAA and Vinicius dos Santos and Didier Gastmann of UNESP, Rio Claro, kindly shared the radar data from Cazadero and Rio Claro electronically. Athulya Radhakrishnan and Nuncio Murukesh of the National Centre for Polar and Ocean Research (NCPOR), India, kindly facilitated access to raw MRR data for 2014–2017 from Ny-Ålesund that were collected as part of the Indian Arctic Programme and accessed through the NCPOR data repository (https://data.ncpor.res.in/newhtml/3, last access: 8 May 2026). A generative AI tool, Claude (Anthropic), was used to generate or refine some of the figures in this manuscript. All code, figure content, and scientific interpretations were reviewed and verified by the authors who take full responsibility for the final content. MDS was supported by the National Science Foundation (OPP-2137091) and NOAA Cooperative Agreement (NA22OAR4320151). Frederick J. Longstaffe was supported by the Natural Sciences and Engineering Research Council of Canada (NSERC Discovery Grant RGPIN 2019-05904) and the Canada Research Chairs Program (X1277C01). We thank two anonymous reviewers and H. Sodemann for their constructive criticisms and helpful suggestions to strengthen the manuscript.
This research has been supported by the National Science Foundation (grant no. OPP-2137091 to MDS), NOAA Cooperative Agreement (grant no. NA22OAR4320151 to MDS), the Natural Sciences and Engineering Research Council of Canada (NSERC Discovery Grant RGPIN 2019-05904 to FJL), and the Canada Research Chairs Program (grant no. X1277C01 to FJL).
This paper was edited by Anna Gannet Hallar and reviewed by two anonymous referees.
Atlas, D., Srivastava, R. C., and Sekhon, R. S.: Doppler radar characteristics of precipitation at vertical incidence, Rev. Geophys., 11, https://doi.org/10.1029/rg011i001p00001, 1973.
Atmospheric Radiation Measurement (ARM) user facility: Millimeter Wavelength Cloud Radar (MMCRMOM). 2010-06-01 to 2017-09-01, Summit Station, Greenland (SMT) External Data (satellites and others) (X1), compiled by: Bharadwaj, N., ARM Data Center [data set], https://doi.org/10.5439/1025228, 2010.
Atmospheric Radiation Measurement (ARM) user facility: Active Remote Sensing of CLouds (ARSCL) product using Ka-band ARM Zenith Radars (ARSCLKAZR1KOLLIAS), 2020-02-22 to 2020-03-24, ARM Mobile Facility (ANX) Andenes, Norway; AMF1 (main site for COMBLE) (M1), compiled by: Johnson, K., Jensen, M., and Giangrande, S., ARM Data Center [data set], https://doi.org/10.5439/1228768, 2019.
Bailey, A., Noone, D., Dee, S. G., Nusbaumer, J., Conroy, J. L., Stevenson, S., and Atwood, A.: Toward a process-oriented understanding of water in the climate system: recent insights from stable isotopes, Environ. Res.: Climate, 4, 012002, https://doi.org/10.1088/2752-5295/ada17b, 2025.
Bailey, I. H., Hulston, J. R., Macklin W. C., and Stewart, J. R.: On the isotopic composition of hailstones, J. Atmos. Sci., 26, 689–694, https://doi.org/10.1175/1520-0469(1969)26<689:OTICOH>2.0.CO;2, 1969.
Borys, R. D., Del Vecchio, D., Jaffrezo, J.-L., Davidson, C. I., and Mitchell, D. L.: Assessment of ice particle growth processes at Dye-3, Greenland, Atmos. Environ., 27, 2815–2822, https://doi.org/10.1016/0960-1686(93)90313-N, 1993.
Casado, M., Cauquoin, A., Landais, A., Israel, D., Orsi, A., Pangui, E., Landsberg, J., Kerstel, E., Prie, F., and Doussin, J.-F.: Experimental determination and theoretical framework of kinetic fractionation at the water vapor–ice interface at low temperature, Geochim. Cosmochim. Ac., 174, 54–69, https://doi.org/10.1016/j.gca.2015.11.009, 2016.
Castellani, B. B., Shupe, M. D., Hudak, D. R., and Sheppard, B. E.: The annual cycle of snowfall at Summit, Greenland. J. Geophys. Res.-Atmos., 120, 6654–6668, https://doi.org/10.1002/2015JD023072, 2015.
Chellini, G. and Kneifel, S.: Turbulence as a key driver of ice aggregation and riming in Arctic low-level mixed-phase clouds, revealed by long-term cloud radar observations, Geophys. Res. Lett., 51, e2023GL106599, https://doi.org/10.1029/2023GL106599, 2024.
Ciais, P. and Jouzel J.: Deuterium and oxygen 18 in precipitation: Isotopic model, including mixed cloud processes, J. Geophys. Res.-Atmos., 99, 16793–16803, https://doi.org/10.1029/94JD00412, 1994.
Coplen, T. B., Neiman, P. J., White, A. B., and Ralph, F. M.: Categorization of northern California rainfall for periods with and without a radar bright band using stable isotopes and a novel automated precipitation collector, Tellus B, 67, 28552–28574, https://doi.org/10.3402/tellusb.v67.28574, 2015.
Dansgaard, W.: Stable isotopes in precipitation, Tellus, 16, 436–468, https://doi.org/10.3402/tellusa.v16i4.8993, 1964.
Dansgaard, W., Johnsen, S. J., Møller, J., and Langway Jr., C. C.: One thousand centuries of climatic record from Camp Century on the Greenland ice sheet, Science, 166, 377–381, https://doi.org/10.1126/science.166.3903.377, 1969.
Demoz, B. B., Warburton, J. A., and Stone, R. H.: The influence of riming on the oxygen isotopic composition of ice-phase precipitation, Atmos. Res., 26, 463–488, https://doi.org/10.1016/0169-8095(91)90039-Y, 1991.
dos Santos, V. , Durán-Quesada, A. M. Sánchez-Murillo, R., and Gastmans, D.: High-frequency isotope compositions reveal different cloud-top and vertical stratiform rainfall structures in the inland tropics of Brazil, Geophys. Res. Lett., 51, e2024GL109886, https://doi.org/10.1029/2024GL109886, 2024.
Durán-Alarcón, C., Boudevillain, B., Genthon, C., Grazioli, J., Souverijns, N., van Lipzig, N. P. M., Gorodetskaya, I. V., and Berne, A.: The vertical structure of precipitation at two stations in East Antarctica derived from micro rain radars, The Cryosphere, 13, 247–264, https://doi.org/10.5194/tc-13-247-2019, 2019.
Dütsch, M., Blossey, P. N., Steig, E. J., and Nusbaumer, J. M.: Nonequilibrium fractionation during ice cloud formation in iCAM5: Evaluating the common parameterization of supersaturation as a linear function of temperature, J. Adv. Model. Earth Sy., 11, 3777–3793, https://doi.org/10.1029/2019MS001764, 2019.
Ebell, K., Walbröl, A., and Krobot, K.: Measurements of micro rain radar at AWIPEV, Ny-Ålesund (2017–2021), PANGAEA [data set], https://doi.org/10.1594/PANGAEA.958967, 2023.
Ebell, K., Buhren, C., Gierens, R., Chellini, G., Lauer, M., Walbröl, A., Dahlke, S., Krobot, P., and Mech, M.: Impact of weather systems on observed precipitation at Ny-Ålesund (Svalbard), Atmos. Chem. Phys., 25, 7315–7342, https://doi.org/10.5194/acp-25-7315-2025, 2025.
Federer, B., Brichet, N., and Jouzel, J.: Stable isotopes in hailstones. Part I: The isotopic cloud model, J. Atmos. Sci., 39, 1323–1335, https://doi.org/10.1175/1520-0469(1982)039<1323:SIIHPI>2.0.CO;2, 1982.
Fitch, K. E. and Garrett, T. J.: Graupel precipitating from thin Arctic clouds with liquid water paths less than 50 g m−2, Geophys. Res. Lett., 49, e2021GL094075, https://doi.org/10.1029/2021GL094075, 2022.
Garrett, T. J. and Yuter, S. E.: Observed influence of riming, temperature, and turbulence on the fallspeed of solid precipitation, Geophys. Res. Lett., 41, 6515–6522, https://doi.org/10.1002/2014GL061016, 2014.
Graf, P., Wernli, H., Pfahl, S., and Sodemann, H.: A new interpretative framework for below-cloud effects on stable water isotopes in vapour and rain, Atmos. Chem. Phys., 19, 747–765, https://doi.org/10.5194/acp-19-747-2019, 2019.
Grazioli, J., Genthon, C., Boudevillain, B., Duran-Alarcon, C., Del Guasta, M., Madeleine, J.-B., and Berne, A.: Measurements of precipitation in Dumont d'Urville, Adélie Land, East Antarctica, The Cryosphere, 11, 1797–1811, https://doi.org/10.5194/tc-11-1797-2017, 2017.
Harimaya, T. and Sato, M.: The riming proportion in snow particles falling on coastal areas, J. Meteorol. Soc. Jpn. Ser. II, 70, 57–65, 1992.
Heymsfield, A. J. and Kajikawa, M.: An improved approach to calculating terminal velocities of plate-like crystals and graupel, J. Atmos. Sci., 44, 1088–1099, https://doi.org/10.1175/1520-0469(1987)044<1088:AIATCT>2.0.CO;2, 1987.
Heymsfield, A. J., Schmitt, C., and Bansemer, A.: Ice cloud particle size distributions and pressure-dependent terminal velocities from in situ observations at temperatures from 0 to −86 °C, J. Atmos. Sci., 70, 4123–4154, https://doi.org/10.1175/JAS-D-12-0124.1, 2013.
Houze Jr, R. A.: Cloud dynamics, Vol. 104, Academic Press, ISBN 978-0-12-374266-7, 2014.
Johnsen, S. J., Dansgaard, W., and White, J. W. C.: The origin of Arctic precipitation under present and glacial conditions, Tellus B, 41, 452–468, https://doi.org/10.3402/tellusb.v41i4.15100, 1989.
Jouzel, J. and Merlivat, L.: Deuterium and oxygen 18 in precipitation: Modeling of the isotopic effects during snow formation, J. Geophys. Res.-Atmos., 89, 11749–11757, https://doi.org/10.1029/JD089iD07p11749, 1984.
Jouzel, J., Merlivat, L., and Federer, B.: Isotopic study of hail: The δD-δ18O relationship and the growth history of large hailstones, Q. J. Roy. Meteor. Soc., 111, 495–516, https://doi.org/10.1002/qj.49711146812, 1985.
Jouzel, J., Stiévenard, M., Johnsen, S. J., Landais, A., Masson-Delmotte, V., Sveinbjornsdottir, A., Vimeux, F., Von Grafenstein, U., and White J. W. C.: The GRIP deuterium-excess record, Quataternary Sci. Rev. 26, 1–17, https://doi.org/10.1016/j.quascirev.2006.07.015, 2007.
Jouzel, J., Delaygue, G., Landais, A., Masson-Delmotte, V., Risi, C., and Vimeux, F.: Water isotopes as tools to document oceanic sources of precipitation, Water Resources Res., 49, 7469–7486, https://doi.org/10.1002/2013WR013508, 2013.
Jullien, N., Vignon, É., Sprenger, M., Aemisegger, F., and Berne, A.: Synoptic conditions and atmospheric moisture pathways associated with virga and precipitation over coastal Adélie Land in Antarctica, The Cryosphere, 14, 1685–1702, https://doi.org/10.5194/tc-14-1685-2020, 2020.
Karrer, M., Dias Neto, J. von Terzi, L., and Kneifel S.: Melting behavior of rimed and unrimed snowflakes investigated with statistics of triple-frequency Doppler radar observations, J. Geophys. Res.-Atmos., 127, e2021JD035907, https://doi.org/10.1029/2021JD035907, 2022.
Kneifel, S. and Moisseev., D.: Long-term statistics of riming in nonconvective clouds derived from ground-based Doppler cloud radar observations, J. Atmos. Sci., 77, 3495–3508, https://doi.org/10.1175/JAS-D-20-0007.1, 2020.
Kopec, B. G., Feng, X., Posmentier, E. S., and Sonder, L. J.: Seasonal deuterium excess variations of precipitation at Summit, Greenland, and their climatological significance, J. Geophys. Res.-Atmos., 124, 72–91, https://doi.org/10.1029/2018JD028750, 2019.
Korolev, A. V. and Mazin, I. P.: Supersaturation of water vapor in clouds, J. Atmos. Sci., 60, 2957–2974, https://doi.org/10.1175/1520-0469(2003)060<2957:SOWVIC>2.0.CO;2, 2003.
Korolev, A., Mcfarquhar, G., Field, P.R., Franklin, C., Lawson, P., Wang, Z., Williams, E., Abel, S. J., Axisa, D., Borrmann, S., Crosier, J., Fugal, J., Krämer, M., Lohmann, U., Schlenczek, O., Schnaiter, M., and Wendisch, M.: Ice formation and evolution in clouds and precipitation: measurement and modeling challenges, Chapter 5: Mixed-Phase Clouds: Progress and Challenges, Meteo. Mon., 58, 5–1, https://doi.org/10.1175/AMSMONOGRAPHS-D-17-0001.1, 2017.
Kumjian, M. R. and Ryzhkov, A. V.: The impact of evaporation on polarimetric characteristics of rain: Theoretical model and practical implications, J. Appl. Meteorol. Clim., 49, 1247–1267, https://doi.org/10.1175/2010JAMC2243.1, 2010.
Lauer, M., Rinke, A., Gorodetskaya, I., Sprenger, M., Mech, M., and Crewell, S.: Influence of atmospheric rivers and associated weather systems on precipitation in the Arctic, Atmos. Chem. Phys., 23, 8705–8726, https://doi.org/10.5194/acp-23-8705-2023, 2023.
Leroy-Dos Santos, C.: A 4.5 year-long record of Svalbard water vapor isotopic composition documents winter air mass origin V1, Zenodo, https://doi.org/10.5281/zenodo.3689566, 2020.
Leroy-Dos Santos, C.: From atmospheric water isotopes measurement to firn core interpretation in Adelie Land: A case study for isotope-enabled atmospheric models in Antarctica, Zenodo [data set], https://doi.org/10.5281/zenodo.7708489, 2023.
Lin, Y. and Colle, B. A.: A new bulk microphysical scheme that includes riming intensity and temperature-dependent ice characteristics, Mon. Weather Rev., 139, 1013–1035, https://doi.org/10.1175/2010MWR3293.1, 2011.
Locatelli, J. D. and Hobbs, P. V.: Fall speeds and masses of solid precipitation particles, J. Geophys. Res., 79, 2185–2197, https://doi.org/10.1029/JC079i015p02185, 1974.
Lowenthal, D. H., Borys, R. D., Cotton, W., Saleeby, S., Cohn, S. A., and Brown, W. O. J.: The altitude of snow growth by riming and vapor deposition in mixed-phase orographic clouds, Atmos. Environ., 45, 519–522, https://doi.org/10.1016/j.atmosenv.2010.09.061, 2011.
Lowenthal, D., Gannet Hallar, A., McCubbin, I., David, R., Borys, R., Blossey, P., Muhlbauer, A., Kuang, Z., and Moore, M.: Isotopic fractionation in wintertime orographic clouds, J. Atmos. Ocean. Tech., 33, 2663–2678, https://doi.org/10.1175/JTECH-D-15-0233.1, 2016.
Macklin, W. C. and Payne, G. S.: A theoretical study of the ice accretion process, Q. J. Roy. Meteor. Soc., 93, 195–213, https://doi.org/10.1002/qj.49709339606, 1967.
Maherndl, N., Moser, M., Lucke, J., Mech, M., Risse, N., Schirmacher, I., and Maahn, M.: Quantifying riming from airborne data during the HALO-(AC)3 campaign, Atmos. Meas. Tech., 17, 1475–1495, https://doi.org/10.5194/amt-17-1475-2024, 2024.
Majoube, M.: Fractionnement en oxygène-18 et en deutérium entre l'eau et sa vapeur, J. Chim. Phys., 68, 1423–1436, https://doi.org/10.1051/jcp/1971681423, 1971.
Masson-Delmotte, V., Landais, A., Stievenard, M., Cattani, O., Falourd, S., Jouzel, J., Johnsen S. J., White, J. W. C., Werner, M., Sveinbjörnsdottir, A., and Fuhrer, K.: Holocene climatic changes in Greenland: Different deuterium excess signals at Greenland Ice Core Project (GRIP) and North GRIP, J. Geophys. Res.-Atmos., 110, https://doi.org/10.1029/2004JD005575, 2005.
Masson-Delmotte, V., Hou, S., Ekaykin, A., Jouzel, J., Aristarain, A., Bernardo, R.T., Bromwich, D., Cattani, O., Delmotte, M., Falourd, S., Frezzoq, M., Gallée, H., Genoni, L., Isaksson, E., Landais, A., Helsen, M. M., Hoffmann, G., Lopez, J., Morgan, V., Motoyama, H., Noone, D., Oerter, H., Petit, J. R., Royer, A., Uemura, R., Schmidt, G. A., Schlosser, E., Simões, J. C., Steig, E. J., Stenni, B., Stievenard, M., Van Den Broeke, M. R., Van De Wal, R. S. W., Van De Berg, W. J. Vimeux, F., and White, J. W. C.: A review of Antarctic surface snow isotopic composition: Observations, atmospheric circulation, and isotopic modeling, J. Climate, 21, 3359–3387, https://doi.org/10.1175/2007JCLI2139.1, 2008.
Matejka, T. J., Houze Jr, R. A., and Hobbs, P. V.: Microphysics and dynamics of clouds associated with mesoscale rainbands in extratropical cyclones, Q. J. Roy. Meteor. Soc., 106, 29–56, https://doi.org/10.1002/qj.49710644704, 1980.
Matrosov, S. Y.: Frozen hydrometeor terminal fall velocity dependence on particle habit and riming as observed by vertically pointing radars, J. Appl. Meteorol. Clim., 62, 1023–1038, https://doi.org/10.1175/JAMC-D-23-0002.1, 2023.
Maturilli, M. and Kayser, M.: Homogenized radiosonde record at station Ny-Ålesund, Spitsbergen in 2014, PANGAEA [data set], https://doi.org/10.1594/PANGAEA.845338, 2016.
Maturilli, M. and Kayser, M.: Homogenized radiosonde record at station Ny-Ålesund, Spitsbergen, 2015–2016, PANGAEA [data set publication series], https://doi.org/10.1594/PANGAEA.875196, 2017.
Maturilli, M. and Dünschede, E.: Homogenized radiosonde record at station Ny-Ålesund, Spitsbergen, 2017–2022, PANGAEA [data set publication series], https://doi.org/10.1594/PANGAEA.961203, 2023.
Mellat, M., Bailey, H., Mustonen, K. R., Marqla, H., Klein, E. S., Gribanov, K., Bret-Harte, M. S., Chupakov, A. V., Divine, D. V., Else, B., and Filippov, I.: Hydroclimatic controls on the isotopic (δ18O, δ2H, d-excess) traits of pan-Arctic summer rainfall events, Front. Earth Sci., 9, 651731, https://doi.org/10.3389/feart.2021.651731, 2021.
Merlivat, L.: Molecular diffusivities of , HD16O and in gases, J. Chem. Phys., 69, 2864–2871, https://doi.org/10.1063/1.436884, 1978.
Merlivat, L. and Jouzel, J.: Global climatic interpretation of the deuterium-oxygen 18 relationship for precipitation, J. Geophys. Res.-Oceans, 84, 5029–5033, https://doi.org/10.1029/JC084iC08p05029, 1979.
Merlivat, L. and Nief, G.: Fractionnement isotopique lors des changements d'états solide–vapeur et liquide–vapeur de l'eau, Tellus, 19, 122–127, https://doi.org/10.1111/j.2153-3490.1967.tb01465.x, 1967.
Miller, N. B., Shupe, M. D., Cox, C. J., Walden, V. P., Turner, D. D., and Steffen, K.: Cloud radiative forcing at Summit, Greenland, J. Climate, 28, 6267–6280, https://doi.org/10.1175/JCLI-D-15-0076.1, 2015.
Mitchell, D. L., Zhang, R., and Pitter, R. L.: Mass-dimensional relationships for ice particles and the influence of riming on snowfall rates, J. Appl. Meteol. Clim., 29, 153–163, https://doi.org/10.1175/1520-0450(1990)029<0153:MDRFIP>2.0.CO;2, 1990.
Moerman, J. W., Cobb, K. M., Adkins, J. F., Sodemann, H., Clark, B., and Tuen, A. A.: Diurnal to interannual rainfall δ18O variations in northern Borneo driven by regional hydrology, Earth Planet. Sc. Lett., 369, 108–119, https://doi.org/10.1016/j.epsl.2013.03.014, 2013.
Moisseev, D., von Lerber, A., and Tiira, J.: Quantifying the effect of riming on snowfall using ground-based observations, J. Geophys. Res.-Atmos., 122, 4019–4037, https://doi.org/10.1002/2016JD026272, 2017.
Mosimann, L.: An improved method for determining the degree of snow crystal riming by vertical Doppler radar, Atmos. Res., 37, 305–323, https://doi.org/10.1016/0169-8095(94)00050-N, 1995.
Mossop, S. C.: Production of secondary ice particles during the growth of graupel by riming, Q. J. Roy. Meteor. Soc, 102, 45–57, https://doi.org/10.1002/qj.49710243104, 1976.
Mülmenstädt, J., Sourdeval, O., Delanoë, J., and Quaas, J.: Frequency of occurrence of rain from liquid-, mixed-, and ice-phase clouds derived from A-Train satellite retrievals, Geophys. Res. Lett., 42, 6502–6509, https://doi.org/10.1002/2015GL064604, 2015.
Murphy, D. M. and Koop, T.: Review of the vapour pressures of ice and supercooled water for atmospheric applica3ons, Q. J. R. Meteorol. Soc., 131, 1539–1565, https://doi.org/10.1256/qj.04.94, 2005.
NCPOR: MRR data from Himadri Station, National Center for Polar and Ocean Research, India, https://npdc.ncpor.res.in/ (last access: 8 May 2026).
Nusbaumer, J., Wong, T. E., Bardeen, C., and Noone, D.: Evaluating hydrological processes in the Community Atmosphere Model Version 5 (CAM5) using stable isotope ratios of water, J. Adv. Model. Earth Sy., 9, 949–977, https://doi.org/10.1002/2016MS000839, 2017.
Ohtake, T.: Observations of size distributions of hydrometeors through the melting layer, J. Atmos. Sci., 26, 545–557, https://doi.org/10.1175/1520-0469(1969)026<0545:OOSDOH>2.0.CO;2, 1969.
Ohtake, T.: Atmospheric ice crystals at the South Pole in summer, Antarct. JUS, 13, 174–175, 1978.
Orr, B. W. and Kropfli, R. A.: A method for estimating particle fall velocities from vertically pointing Doppler radar, J. Atmos. Ocean Tech., 16, 29–37, https://doi.org/10.1175/1520-0426(1999)016<0029:AMFEPF>2.0.CO;2, 1999.
Osterberg, E. C., Hawley, R. L., Wong, G., Kopec, B., Ferris, D., and Howley, J.: Coastal ice-core record of recent northwest Greenland temperature and sea-ice concentration, J. Glaciol., 61, 1137–1146, https://doi.org/10.3189/2015JoG15J054, 2015.
Pettersen, C., Bennartz, R., Merrelli, A. J., Shupe, M. D., Turner, D. D., and Walden, V. P.: Precipitation regimes over central Greenland inferred from 5 years of ICECAPS observations, Atmos. Chem. Phys., 18, 4715–4735, https://doi.org/10.5194/acp-18-4715-2018, 2018.
Pfahl, S. and Sodemann, H.: What controls deuterium excess in global precipitation?, Clim. Past, 10, 771–781, https://doi.org/10.5194/cp-10-771-2014, 2014.
Praz, C., Roulet, Y.-A., and Berne, A.: Solid hydrometeor classification and riming degree estimation from pictures collected with a Multi-Angle Snowflake Camera, Atmos. Meas. Tech., 10, 1335–1357, https://doi.org/10.5194/amt-10-1335-2017, 2017.
Protat, A. and Williams, C. R.: The accuracy of radar estimates of ice terminal fall speed from vertically pointing Doppler radar measurements, J. Appl. Meteorol. Clim., 50, 2120–2138, https://doi.org/10.1175/JAMC-D-10-05031.1, 2011.
Pruppacher, H. R. and Klett, J. D.: Microphysics of clouds and precipitation, Springer New York, https://doi.org/10.1007/978-0-306-48100-0, 2010.
Scarchilli, C., Ciardini, V., Grigioni, P., Iaccarino, A., De Silvestri, L., Proposito, M., Dolci, S., Camporeale, G., Schioppo, R., Antonelli, A. and Baldini, L., Roberto, N., Argen3ni, S., Bracci, A., and Frezzoq, M.: Characterization of snowfall estimated by in situ and ground-based remote-sensing observations at Terra Nova Bay, Victoria Land, Antarctica, J. Glaciology, 66, 1006–1023, https://doi.org/10.1017/jog.2020.70, 2020.
Schumacher, C. and Funk, A.: Assessing convective-stratiform precipitation regimes in the tropics and extratropics with the GPM satellite radar, Geophys. Res. Lett., 50, e2023GL102786, https://doi.org/10.1029/2023GL102786, 2023.
Schumacher, C. and Houze Jr., R. A.: The TRMM precipitation radar's view of shallow, isolated rain, J. Appl. Meteorol Clim., 42, 1519–1524, https://doi.org/10.1175/1520-0450(2003)042<1519:TTPRVO>2.0.CO;2, 2003.
Seidl, A. W., Johannessen, A., Dekhtyareva, A., Huss, J. M., Jonassen, M. O., Schulz, A., Hermansen, O., Thomas, C. K., and Sodemann, H.: The ISLAS2020 field campaign: studying the near-surface exchange process of stable water isotopes during the arctic wintertime, Earth Syst. Sci. Data, 18, 1969–1993, https://doi.org/10.5194/essd-18-1969-2026, 2026.
Shupe, M. D., Turner, D. D., Walden, von P., Bennartz, R., Cadeddu, M. P., Cox, C. J., Hudak, D. R., Kulie, M. S., Miller, N. B., Neely III, R. R., Neff, W. D., and Rowe, P. M.: High and dry: New observations of tropospheric and cloud properties above the Greenland Ice Sheet, B. Am. Meteorol. Soc., 94, 169–186, 2013.
Stewart, M. K.: Stable isotope fractionation due to evaporation and isotopic exchange of falling waterdrops: Applications to atmospheric processes and evaporation of lakes, J. Geophys. Res., 80, 1133–1146, https://doi.org/10.1029/JC080i009p01133, 1975.
Takahashi, T. and Fukuta, N.: Supercooled cloud tunnel studies on the growth of snow crystals between −4 and −20 °C, J. Meteorol. Soc. Jpn., 66, 841–855, 1988.
Tridon, F., Silber, I., Battaglia, A., Kneifel, S., Fridlind, A., Kalogeras, P., and Dhillon, R.: Highly supercooled riming and unusual triple-frequency radar signatures over McMurdo Station, Antarctica, Atmos. Chem. Phys., 22, 12467–12491, https://doi.org/10.5194/acp-22-12467-2022, 2022.
Uemura, R., Matsui, Y., Yoshida, N., Abe, O., and Mochizuki, S.: Isotopic fractionation of water during snow formation: Experimental evidence of kinetic effect, Polar Meteorol. Glaciology, 19, 1–14, https://doi.org/10.15094/00002984, 2005.
Vignon, É., Traullé, O., and Berne, A.: On the fine vertical structure of the low troposphere over the coastal margins of East Antarctica, Atmos. Chem. Phys., 19, 4659–4683, https://doi.org/10.5194/acp-19-4659-2019, 2019.
Wang, J., Pang, H., Wu, S., Schoenemann, S. W., Uemura, R., Ekaykin, A., Werner, M., Cauquoin, A., Goursaud Oger, S., Rupper, S., and Hou, S.: The Ant-Iso dataset: a compilation of Antarctic surface snow isotopic observations, Earth Syst. Sci. Data Discuss. [preprint], https://doi.org/10.5194/essd-2022-384, 2022.
Warburton, J. A.: Atmospheric processes and the chemistry of snow on the Ross Ice Shelf, Antarctica, J. Glaciol., 20, 149–162, https://doi.org/10.3189/S0022143000198053, 1978.
Warburton, J. A. and deFelice, T. P.: Oxygen isotopic composition of central Sierra Nevada precipitation, I. Identification of ice-phase water capture regions in winter storms, Atmos. Res., 20, 11–22, https://doi.org/10.1016/0169-8095(86)90004-9, 1986.
Weiss, R. R. and Hobbs, P. V.: The use of a vertically pointing pulsed Doppler radar in cloud physics and weather modification studies, J. Appl. Meteol. Clim., 14, 222–231, https://doi.org/10.1175/1520-0450(1975)014<0222:TUOAVP>2.0.CO;2, 1975.
Weiss, R. R., Locatelli, J. D., and Hobbs, P. V.: Deduction of ice particle types in the vicinity of the melting layer from Doppler radar measurements, J. Appl. Meteol. Clim.,16, 314–316, https://doi.org/10.1175/1520-0450(1977)016<0314:DOIPTI>2.0.CO;2, 1977.
White, A. B., Gottas, D. J., Strem, E. T., Ralph, F. M., and Neiman, P. J.: An automated bright band height detection algorithm for use with Doppler radar spectral moments, J. Atmos. Ocean. Tech., 19, 687–697, https://doi.org/10.1175/1520-0426(2002)019<0687:AABHDA>2.0.CO;2, 2002.
White, A. B., Neiman, P. J., Ralph, F. M., Kingsmill, D. E., and Persson, P. O. G.: Coastal orographic rainfall processes observed by radar during the California Land-Falling Jets Experiment, J. Hydrometeol., 4, 264–282, https://doi.org/10.1175/1525-7541(2003)4<264:CORPOB>2.0.CO;2, 2003.
Wiener, V., Roussel, M.-L., Genthon, C., Vignon, É., Grazioli, J., and Berne, A.: A 7-year record of vertical profiles of radar measurements and precipitation estimates at Dumont d'Urville, Adélie Land, East Antarctica, Earth Syst. Sci. Data, 16, 821–836, https://doi.org/10.5194/essd-16-821-2024, 2024.
Xie, X., Evaristo, R., Troemel, S., Saavedra, P., Simmer, C., and Ryzhkov A.: Radar observation of evaporation and implications for quantitative precipitation and cooling rate estimation, J. Atmos. Ocean. Tech., 33, 1779–1792, https://doi.org/10.1175/JTECH-D-15-0244.1, 2016.
Zawadzki, I., Szyrmer, W., Bell, C., and Fabry, F.: Modeling of the melting layer. Part III: The density effect, J. Atmos. Sci., 62, 3705–3723, https://doi.org/10.1175/JAS3563.1, 2005.