
the Creative Commons Attribution 4.0 License.
the Creative Commons Attribution 4.0 License.
 | 06 Aug 2026
Confirming the minimal role of in-atmosphere production on the global HFC-23 budget using a 3D chemical and transport model
Rayne Holland
Daniel Van Hoomissen
James B. Burkholder
M. Anwar H. Khan
Paul Griffiths
Jens Mühle
Dudley Shallcross
Matt Rigby
A large discrepancy of at least 10 Gg yr−1 exists between reported emissions of the potent greenhouse gas HFC-23 (CHF3, trifluoromethane) and emissions derived from atmospheric measurements. In-atmosphere production of HFC-23 from the breakdown of fluorinated source gases such as hydrofluorocarbons (HFCs) and hydrofluoroolefins (HFOs) contributes to this gap, but only a conservative upper limit has been estimated for the magnitude of this source. This uncertainty is due, in part, to limited experimental measurements of the photolysis quantum yield of trifluoroacetaldehyde (CF3CHO), a key degradation product that forms HFC-23 via photolysis. The parameters governing CF3CHO deposition are also poorly understood. Here, we use a 3D chemistry and transport model, STOCHEM-CRI, to further constrain the magnitude of in-atmosphere HFC-23 production, using recent estimates of source gas emissions and explicitly parametrised photolysis and deposition. Furthermore, we perform an ensemble of simulations to account for the uncertainties in these values. We find that in-atmosphere production of HFC-23 is in the range 0.013–0.035 Gg yr−1, substantially lower than previous estimates. This accounts for < 0.5 % of the discrepancy between reported and measurement-derived emissions, suggesting that this source makes a negligible contribution to the overall HFC-23 budget and that unreported direct emissions are likely responsible for the vast majority of the discrepancy. As part of this work, we also calculate indirect global warming potentials for the HFC-23 source gases HFO-1234ze(E), HFO-1336mzz(Z) and HCFO-1233zd(E) and find that their impact on climate is up to ten times higher than previously reported.
- Article
(1181 KB) - Full-text XML
-
Supplement
(723 KB) - BibTeX
- EndNote


HFC-23 (CHF3, trifluoromethane) is a potent greenhouse gas, with an atmospheric lifetime of 228 years and a global warming potential (GWP) of 14 700 over the 100-year time horizon (Liang et al., 2022). Emissions of this gas are controlled under the Kigali Amendment to the Montreal Protocol on Substances that Deplete the Ozone Layer (United Nations Environment Programme, 2016), which seeks to limit its release to the atmosphere in order to reduce its impact on global radiative forcing (Velders et al., 2009). The Kigali Amendment requires Parties to destroy emissions of HFC-23 “to the extent practicable” when it is generated during production of other hydrofluorocarbons (HFCs) and hydrochlorofluorocarbons (HCFCs). The dominant source of HFC-23 in the atmosphere is believed to be its emission as a by-product during HCFC-22 (CHClF2, chlorodifluoromethane) production from chloroform (CHCl3). Global HFC-23 emissions from HCFC-22 production have been reported as ∼ 2–3 Gg yr−1 since 2018 (United Nations Environment Programme, 2025a).
The use of HFC-23 is limited to applications in semiconductor etching, fire suppression, low-temperature refrigeration, and as a feedstock in the production of halon-1301 (bromotrifluoromethane, CBrF3) (United Nations Environment Programme, 2025b). Emissions of HFC-23 from these sources is estimated at < 0.4 Gg yr−1 globally (United Nations Environment Programme, 2023), a figure orders of magnitude lower than emissions of the other major HFCs with dispersive uses (Liang et al., 2022). Recently, the Technology and Economic Assessment Panel (TEAP) (United Nations Environment Programme, 2025b) estimated total emissions of HFC-23 by combining reported emissions from HCFC-22 production and emissive end-uses with information about other potential sources of HFC-23, such as fluoropolymer manufacture, HCFC-22 plant waste streams and other fluorochemical manufacturing, that are not reported under the Kigali Amendment. They found that the emissions from all known sources was expected to be in the range 1.6–3.7 Gg yr−1 in 2024.
In the last decade, global “top-down” emission estimates, derived using atmospheric measurements, have consistently exceeded reported emissions by over 10 Gg yr−1. For example, “top-down” emission estimates averaged over 15 Gg yr−1 in the period 2018–2023, while in that same period reported emissions, which assumed that national abatement policies were effectively implemented, were only in the range 2–3 Gg yr−1 (Adam et al., 2024). Even when comparing the top-down emissions (14.1 ± 0.7 Gg yr−1 in 2023) to the upper limit of the TEAP's estimates of emissions from all known sources, the discrepancy is still greater than 10 Gg yr−1(United Nations Environment Programme, 2025a).
In addition to the industrial sources mentioned above, it has been suggested that another source of HFC-23 may be its in-situ production in the atmosphere from the breakdown of other fluorinated source gases (United Nations Environment Programme, 2024a; Van Hoomissen et al., 2025). The potential source gases include a number of atmospherically abundant HFCs along with various hydrofluoroolefins (HFOs) and hydrochlorofluoroolefins (HCFOs). HFOs are fourth-generation refrigerants and foam-blowing agents, slated to replace HFCs (which in turn replaced chlorofluorocarbons, CFCs) due to their reduced impact on stratospheric ozone and climate (Vollmer et al., 2015; Liang et al., 2022; Vollmer et al., 2026). The carbon-carbon double bond in HFOs increases their reactivity towards oxidants such as the hydroxyl radical (OH), significantly reducing their atmospheric lifetimes relative to their saturated HFC predecessors. Consequently, GWPs of HFOs are generally small (often < 5) and far lower than HFCs and HCFCs. This fact coupled with their low atmospheric abundance implies that HFOs make a negligible contribution to global radiative forcing.
Two pathways for the in-atmosphere production of HFC-23 from HFC and HFO source gases have been studied. Firstly, HFC-23 is produced as a minor product in the UV photolysis of trifluoroacetaldehyde, CF3CHO (Sulbaek Andersen et al., 2023; Thomson et al., 2024; Van Hoomissen et al., 2025). CF3CHO is the major product of the reaction of a number of fluorinated trace gases with OH (United Nations Environment Programme, 2024b; Burkholder et al., 2019). Studies have shown that the yield of HFC-23 from CF3CHO UV photolysis at tropospherically relevant wavelengths is small but potentially significant. Secondly, direct formation of HFC-23 has been detected and quantified during the reactions of HFO-1234ze(E) (Garavagno et al., 2025), HFO-1336mzz(Z) (McGillen et al., 2023) and HCFO-1233zd(E) (Nielsen et al., 2025b) with ozone (O3). A recent study (Van Hoomissen et al., 2025) estimated the maximum contribution of in-atmosphere production to HFC-23 emissions, using: measurements of the CF3CHO photolysis quantum yield; estimated partial atmospheric loss lifetimes from the literature; globally averaged values for the concentrations of OH and O3; global mean abundances for the relevant long-lived species; and HFO abundances from a monitoring station in Europe. They estimated an upper-limit for the global in-atmosphere HFC-23 production of ∼ 0.215 Gg yr−1, considering eight abundant fluorinated species that lead to CF3CHO production. This value was intended to be a conservative upper-limit with the intention of informing policy, and assumed that UV photolysis accounted for 75 % of the atmospheric loss of CF3CHO. That study did not explicitly parameterise other CF3CHO loss processes such as reaction with OH and both wet and dry deposition. Nonetheless, it provides the most recent upper-limit estimate of the contribution of in-atmosphere production to global HFC-23 emissions to date. This would suggest that in-atmosphere production of HFC-23 does not drive the difference between reported and inferred HFC-23 emissions globally, as it leaves over 95 % of the discrepancy unaccounted for. However, further constraining this source is crucial in understanding the overall HFC-23 budget and establishing a solid evidence base for environmental policy.
Since the publication of Van Hoomissen et al. (2025), there has been further discussion of the physical properties of CF3CHO and its fate in the troposphere, particularly in relation to the balance of heterogeneous loss processes against photolysis (Nielsen et al., 2025a; Pérez-Peña et al., 2025). In addition, one recent modelling study explored the atmospheric fate and environmental impacts of one specific source gas, HFO-1234ze(E), and estimated very small in-atmosphere HFC-23 production using an alternative atmospheric chemistry and transport model (Killen et al., 2026). However, that study considered only one source gas for HFC-23, and so could only report a partial estimate for in-atmosphere production. In addition, given that no experimental data has been published to better constrain the physical properties of CF3CHO in the atmosphere, a range of modelling approaches are required to explore the uncertainties in these parameters.
In this work, we use the 3D global chemical and transport model STOCHEM-CRI to investigate the in-atmosphere production of HFC-23 from seven fluorinated source gases. We explore the reaction with OH of four HFCs (HFC-143a, HFC-236fa, HFC-245fa and HFC-365mfc) and three HFOs/HCFOs (HFO-1234ze(E), HFO-1336mzz(Z) and HCFO-1233zd(E)) to produce CF3CHO, and the subsequent photolysis of CF3CHO to yield HFC-23. We also consider the direct production of HFC-23 via the reaction of those three HFOs with O3. We aim to comprehensively constrain the extent to which atmospheric breakdown of other fluorinated gases contributes to the global burden of HFC-23, and how much of the discrepancy between the reported and top-down emissions these processes can explain. Due to the absence of experimental data regarding the physical properties of CF3CHO, the limited wavelength-dependent UV photolysis measurements and the limited information on HFO emissions globally, we conduct a sensitivity analysis exploring these physical and photochemical parameter uncertainties, as well as the relationship between the poorly constrained source gas emissions and HFC-23 production. This allows us to identify critical uncertainties in the in-atmosphere production of HFC-23, and place bounds on its contribution to the global budget. Finally, using results from the full 3D STOCHEM-CRI model simulation, we use a simple box model to provide updated estimates of the indirect global warming potentials of the HFC-23 source gases to reflect the additional impact on climate of their breakdown products.
2.1 STOCHEM-CRI
The 3D global chemical and transport model, STOchastic CHEMistry – Common Representative Intermediates (STOCHEM-CRI), was used to simulate the emissions, transport and chemical reactions of the various species under investigation. STOCHEM-CRI, and its preceding versions, has been used previously to model atmospheric trace gas species (Khan et al., 2018; Derwent et al., 2025; Khan et al., 2026), including the fluorinated species HFO-1234yf (Holland et al., 2021) and perfluorooctanoic acid (Holland et al., 2020). The model transport is driven by archived meteorological data from the UK Meteorological Office, and adopts a Langrangian approach to advect air parcels in the troposphere. Further details of the transport and meteorology can be found in Collins et al. (1997) and Derwent et al. (2008). In this study, we simulated a full year (2023) of HFC-23 in-atmosphere production following an initial spin-up simulation, which was used to initialise the atmospheric conditions and then discarded.
The model chemistry uses a reduced chemical Common Representative Intermediates (CRI) mechanism (Jenkin et al., 2008; Watson et al., 2008; Utembe et al., 2009, 2010; Khan et al., 2017) to which the chemical reactions, physical loss processes and emissions of the fluorinated source gases are added (see Sect. 2.2). OH and O3 concentrations are calculated for each grid cell in the model based on emissions, kinetics and photolysis. Abundances of all species are calculated at three-hourly time steps. For non-fluorinated species (e.g., other selected VOCs, CO and NOx), emissions were taken from the Precursor of Ozone and their Effects in the Troposphere (POET) inventory and physical removal processes such as wet and dry deposition were parametrized as in Holland et al. (2021).
2.2 Source gases and emissions
Several saturated fluorinated gases contain the CF3CH2- moeity required to produce CF3CHO upon reaction with the OH radical (United Nations Environment Programme, 2024b; Burkholder et al., 2019). Of these, HFC-143a (CF3CH3, tropospheric lifetime τtrop = 57.2 years), HFC-236fa (CF3CH2CF3, τtrop = 253 years), HFC-245fa (CF3CH2CHF2, τtrop = 8.1 years) and HFC-365mfc (CF3CH2CF2CH3, τtrop = 9.3 years) have been measured in the global atmosphere (Prinn et al., 2023, 2018; Burkholder et al., 2022; Liang et al., 2022). HCFC-133a (CF3CH2Cl) is another species containing the relevant CF3CH2- moeity (Laube et al., 2014; McGillen et al., 2015), but there is limited evidence to support the formation of CF3CHO in a quantifiable yield from the reaction of this species (United Nations Environment Programme, 2024b) and so it is excluded from the present study. The rate coefficients and yields of the reactions of these HFCs with OH are taken from the NASA/JPL recommended values (Burkholder et al., 2019). In addition, three unsaturated fluorinated gases with measured atmospheric abundances have also been shown to react with OH to produce CF3CHO (Burkholder et al., 2019). These species are HFO-1234ze(E) (trans-CF3CH=CHF, τtrop = 19 d), HFO-1336mzz(Z) (cis-CF3CH=CHCF3, τtrop = 27 d) and HCFO-1233zd(E) (trans-CF3CH=CHCl, τtrop = 41.9 d). These three species also react with O3 to produce HFC-23 directly. All rate coefficients and yields for included reactions are shown in Table 1.
Table 1Chemical reactions added into STOCHEM-CRI, with their rate constants and product yields.
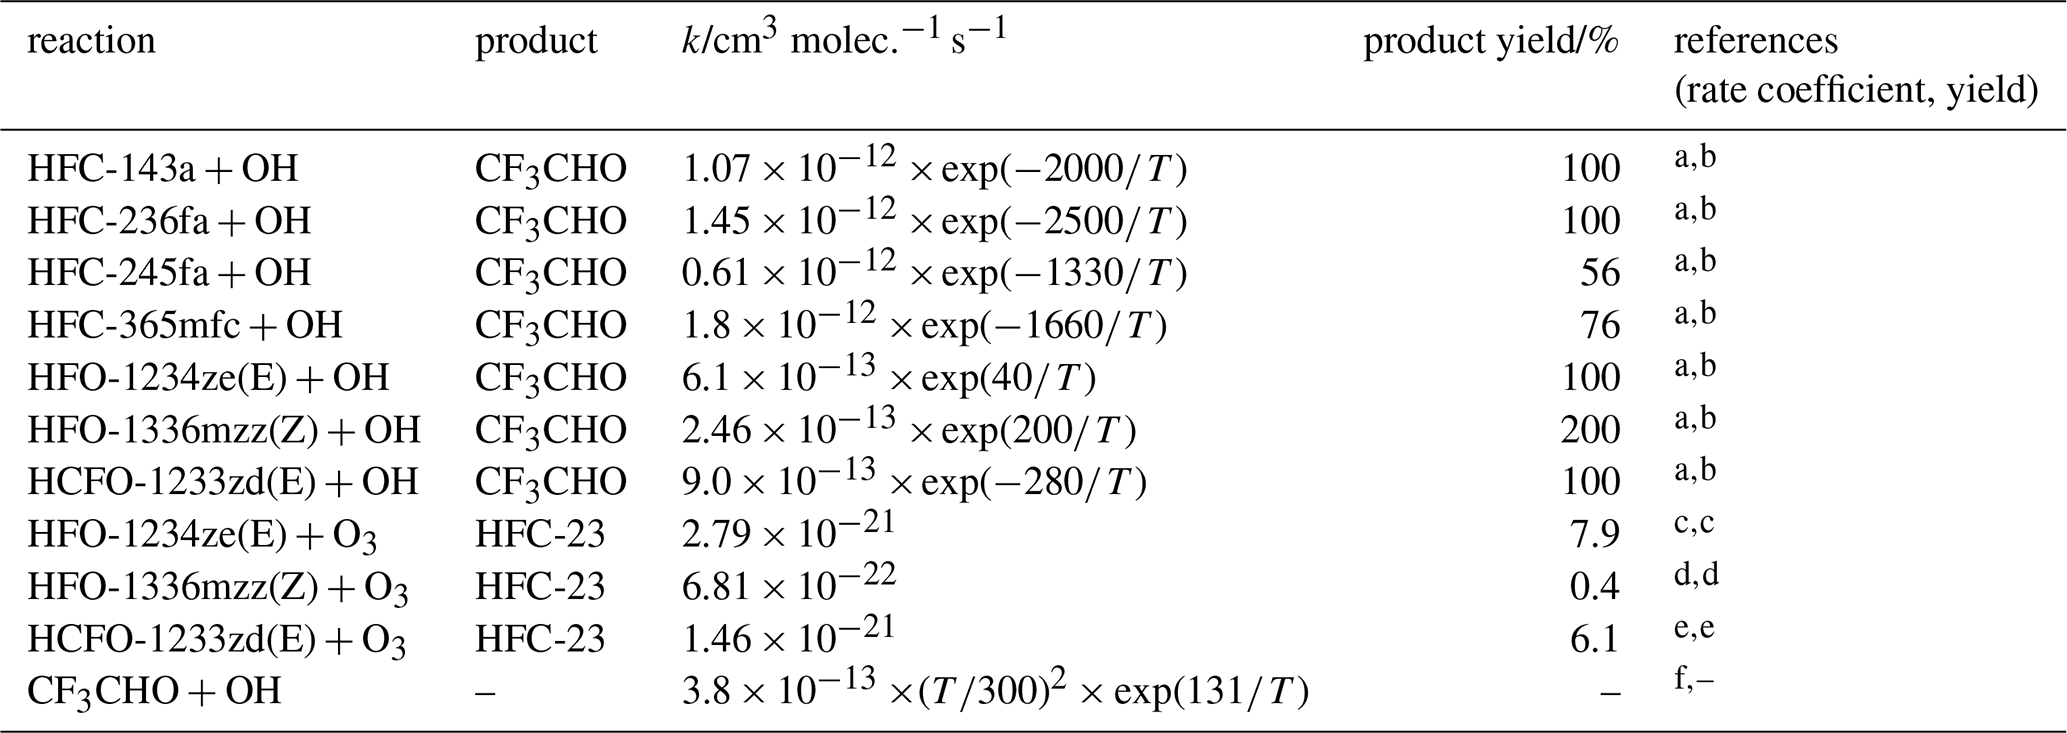
a Burkholder et al. (2019). b Van Hoomissen et al. (2025). c Garavagno et al. (2025). d McGillen et al. (2023). e Nielsen et al. (2025b) f Baumann et al. (2025).
For the four long-lived source gases (HFC-143a, HFC-236fa, HFC-245fa and HFC-365mfc), baseline mole fractions are taken from the Advanced Global Atmospheric Gases Experiment (AGAGE) network (Prinn et al., 2018, 2023). In the model runs, we initialise hemispheric average mole fractions for 2023 and prescribe global emissions for that same year from Western et al. (2025), as shown in Table 2. The emissions for each of the HFCs are spatially distributed over the 5° × 5° surface grid used in STOCHEM according to the EDGAR v8.0 inventory (Crippa et al., 2023). While these emissions estimates have uncertainties of up to 30 % (1σ), the reaction to form CF3CHO (and subsequently HFC-23) is predominantly driven not by emissions but by the background mole fraction, which is better-constrained (typically on the order of a few percent; see Western et al., 2025). We therefore do not consider the uncertainties in HFC emissions in this analysis.
Table 2Source gases used in the STOCHEM-CRI model, their tropospheric lifetimes taken from Burkholder et al. (2022), and the emissions and northern (NH) and southern (SH) hemispheric background mole fractions used as model inputs. Suffices are used to distinguish structural isomers (see https://www.ashrae.org/technical-resources/standards-and-guidelines/ashrae-refrigerant-designations, last access: 30 July 2026).
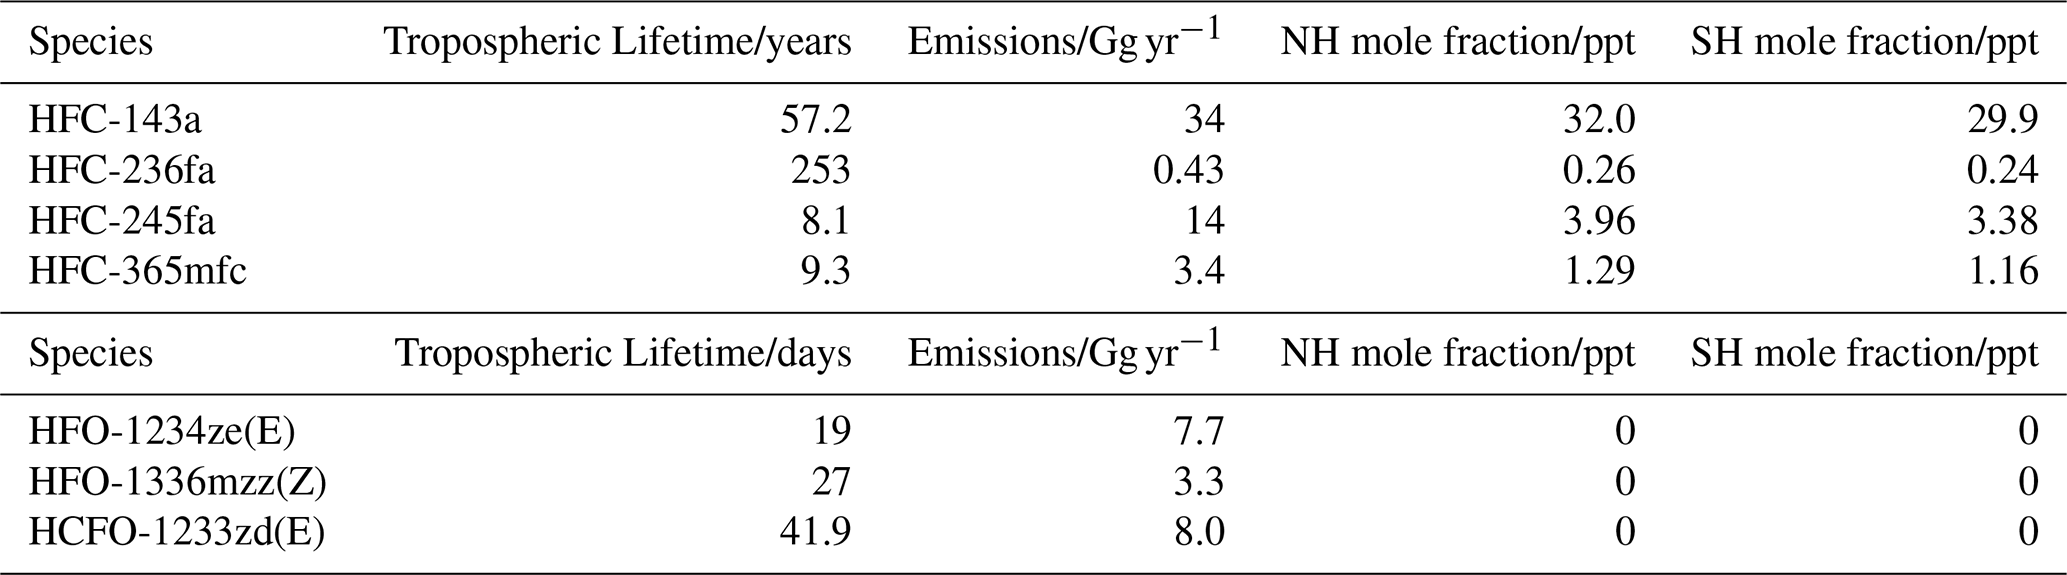
The shorter lifetimes of the HFOs make them unsuitable for top-down emissions estimation with a global box model (e.g. Western et al., 2025), and no global 3D top-down inversion or bottom-up inventory of emissions is available, either. Therefore, we make several approximations in estimating the magnitude and spatial distribution of HFO emissions and carry out a wide range of tests (detailed in Sect. 2.4) to explore the sensitivity of our results to these assumptions. Firstly, we assume that the adoption and emission of HFOs is correlated with national Gross Domestic Product (GDP) globally. Although it ignores the differing rates of transition from HFCs to HFOs in different regions, we use GDP as a proxy for emissions as it has been used previously to estimate demand for HFCs globally (Velders et al., 2009). Previous work (Vollmer et al., 2026) suggests this correlation is unlikely to hold globally, since phase-out of HFCs in favour of HFOs seems to be slower in areas such as East Asia than in Europe, where regulation of fluorinated species has accelerated this transition. However, in the absence of other suitable proxies, we take published HFO emissions for Europe (Vollmer et al., 2026) and scale them up using national GDP totals to give global estimates. Emissions of HFO-1234ze(E) and HCFO-1233zd(E) were 0.96 and 1.0 Gg yr−1, respectively, in 2023 for Northwest Europe, a region defined as Ireland, the United Kingdom, France, Germany, Luxembourg, the Netherlands and Belgium. These countries accounted for approximately 12.5 % of the global GDP for that year (World Bank Group, 2025). Therefore, we scale these emissions up by a factor of 8 and use global emissions of 7.7 and 8.0 Gg yr−1 for these two species, respectively, in the STOCHEM-CRI model. Despite concerns about overestimating emissions via this method, our estimates are approximately 50 % lower than those made by Killen et al. (2026), who estimated global HFO-1234ze(E) emissions at 15 Gg yr−1.
For HFO-1336mzz(Z), no recent emissions estimates are available. However, Rust et al. (2023) estimated Swiss emissions of HFO-1336mzz(Z) at 5 Mg yr−1 in 2019–2020. Swiss emissions of the other two HFOs considered in this model were also estimated for 2019–2020 at 34 Mg yr−1 (HFO-1234ze(E)) and 7.3 Mg yr−1 (HCFO-1233zd(E)) (Rust et al., 2022). Using a tracer ratio method and scaling up to global emissions, this suggests that HFO-1336mzz(Z) emissions are between 1.2 and 5.4 Gg yr−1, depending on which HFO is used as a tracer. Here, we take a mean of these values and estimate global HFO-1336mzz(Z) emissions at 3.3 Gg yr−1. We note that the use of the other HFOs as tracers for HFO-1336mzz(Z) emissions may not be reasonable, as evidenced by the large disparity in emissions when selecting alternative tracers. Nonetheless, in the absence of complete emission inventories derived from atmospheric measurements, we believe the wide range of sensitivity tests conducted here (see Sect. 2.4) produce a sound order-of-magnitude estimate for global HFO emissions, sufficient to estimate the in-atmosphere production of HFC-23. We also note that the amount of HFC-23 produced by the in-atmosphere breakdown of HFOs is likely to be linearly dependent on the global emissions of each species, so if improved emission estimates were to become available, our totals could be scaled. We explore the extent to which this is true, as well as the effect of varying emissions totals, in the sensitivity analysis.
The spatial distribution of the HFO emissions is also poorly constrained. In the absence of gridded emissions estimates, the emissions are distributed according to the method used by Holland et al. (2021) and McGillen et al. (2023). This takes the spatial distribution for HFC-134a emissions in the EDGAR database and replaces the emissions inventory from China using gridded estimates from Su et al. (2015). The impact of changing these spatial distributions and therefore releasing the HFOs into regions of varying O3 and OH concentrations, is investigated through a set of sensitivity tests outlined in Sect. 2.4. These tests also probe the validity of scaling up emissions by GDP.
2.3 Fate of CF3CHO
2.3.1 UV Photolysis
The loss of CF3CHO leading to HFC-23 formation occurs via UV photolysis, for which multiple pathways are possible:
CF3CHO + hν→ CF3 + HCO (367 kJ mol−1,
λ = 326 nm) (a)
CF3H + CO (325 kJ mol−1, λ = 368 nm) (b)
CF3CO + H (377 kJ mol−1, λ = 318 nm) (c)
CF3 + CO + H (403 kJ mol−1, λ = 304 nm) (d)
CF2 + CO + HF (320 kJ mol−1, λ = 374 nm) (e)
where the quoted photolysis energy thresholds are taken from Van Hoomissen et al. (2025). Pathway (a) yields CF3 and HCO radicals and dominates in the troposphere. Pathway (b) yields HFC-23 and carbon monoxide (CO), making it of particular interest in this work. Pathways (c), (d) and (e) are thought to be minor tropospheric photolysis pathways and are not considered here.
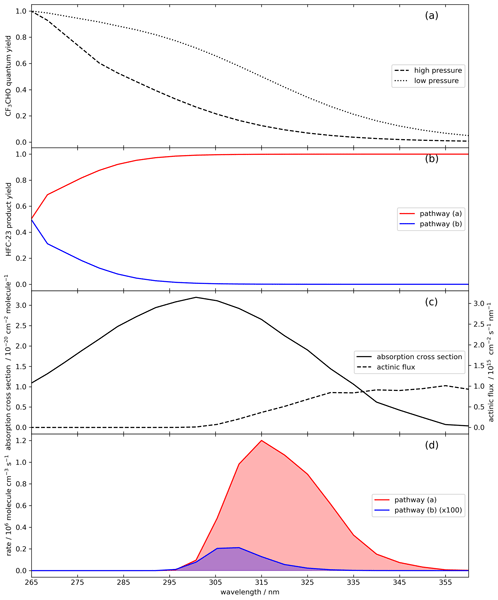
CF3CHO quantum yields and HFC-23 product yields have been reported at discrete wavelengths in recent studes: Sulbaek Andersen et al. (2023) (λ = 254 nm), Thomson et al. (2024) (λ = 308 nm) and Van Hoomissen et al. (2025) (λ = 248, 266, 281 and 308 nm). Sulbaek Andersen and Nielsen (2022) also carried out broadband photolysis measurements, in the wavelength range 290–400 nm. In this study, an empirical method was used to estimate the photolysis quantum yield for CF3CHO and the product yield for HFC-23 formation for wavelengths between 266 and 360 nm based on the experimental data from Van Hoomissen et al. (2025). Wavelength and pressure-dependent quantum yields for CF3CHO photolysis () and product yields for HFC-23 (PYHFC-23) were calculated using the empirical relationships given in Eqs. (1) and (2), where λ denotes the wavelength in nm and ND denotes the number density of the air in :
The CF3CHO photolysis quantum yield and the HFC-23 product yield are plotted as functions of wavelength in Fig. 1.
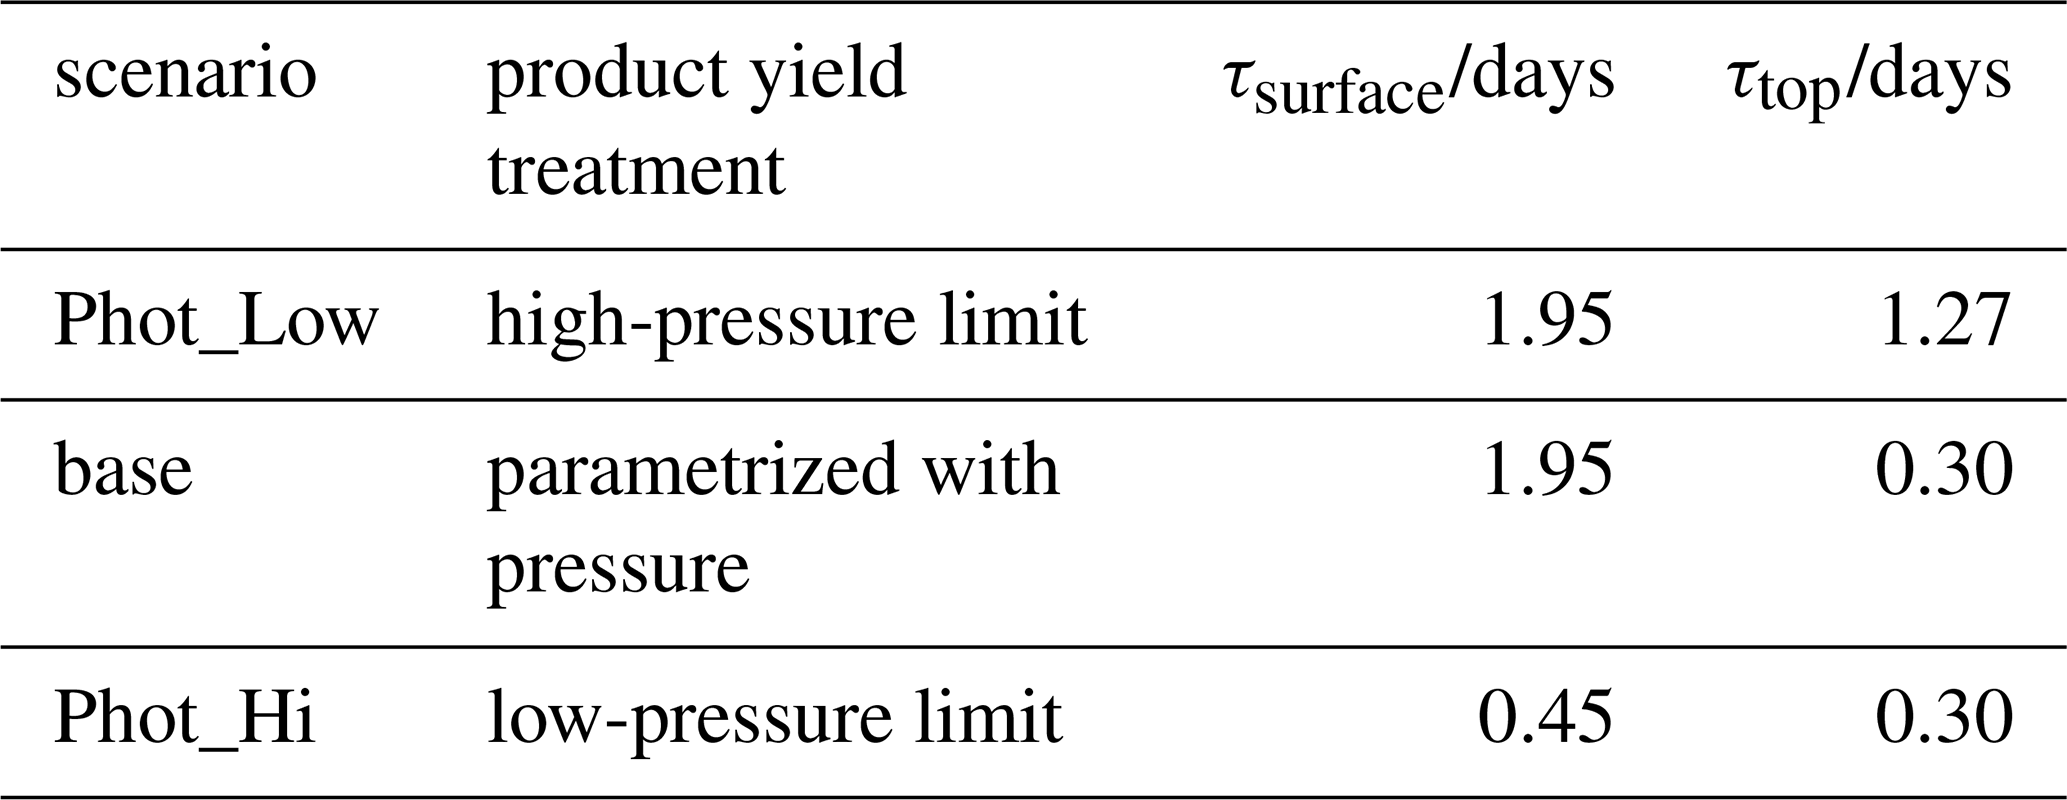
To investigate the sensitivity of the modelled HFC-23 production to uncertainties in the photolysis parametrisations, we carried out two further model runs, “Phot_Hi” and “Phot_Low”, in addition to the base case (see Sect. 2.4). In the “Phot_Hi” run, the CF3CHO quantum yield for pathway (b) is fixed to its low-pressure limit, giving an upper-limit to the HFC-23 production from the photolysis. This low-pressure limit is defined as the pressure at the highest vertical level of the model. Similarly, in the “Phot_Low” run, the CF3CHO quantum yield for pathway (b) is set to a high-pressure limit, defined as the pressure at the lowest vertical level of the model. The product yield is still allowed to vary with pressure, although Van Hoomissen et al. (2025) showed only a small pressure dependence at λ = 308 nm and our parametrisation reflects this.
At every timestep, STOCHEM-CRI calculates the photolysis rates Ja and Jb for pathways (a) and (b), respectively from the quantum and product yields, CF3CHO absorption spectrum and actinic flux according to the relationship:
where is the CF3CHO quantum yield at wavelength λ, PYHFC-23(λ) is the product yield for HFC-23 at wavelength λ, σ(λ) is the absorption cross-section at wavelength λ (taken from Burkholder et al., 2019), and F(λ) is the actinic flux at the relevant altitude. Details on the photolysis scheme of the model, including the calculation of actinic flux, can be found in Winiberg et al. (2018). The number density, ND, at every model height is also output at every timestep and used in the quantum and product yield calculations. In practice, this integral is computed by summing over 106 wavelength intervals between 200 and 660 nm, although the quantum yield is set to zero for values of λ greater than 360 nm. The absorption cross-section is assumed to be temperature-independent. As a result, a sensitivity study is carried out to determine the impact on HFC-23 production of increasing and decreasing the values of the absorption cross-section by ±10 % (runs “AXS_Hi” and “AXS_Low”), approximately the uncertainty in the published values of the cross-section reported by Burkholder et al. (2019). The discrete absorption cross-section values are linearly interpolated to the midpoint of the wavelength intervals, which are approximately linearly spaced at 5 nm intervals in the wavelength range. The quantum and product yields are calculated directly from these midpoints using Eqs. (1) and (2). The absorption cross-section used in the model is plotted in Fig. 1, along with a typical actinic flux at the surface. Figure 1 also shows a typical profile of the integrands in Eqs. (3) and (4) with wavelength, and suggests that photolysis pathway (a) peaks at approximately 315 nm, with roughly 87 % of photolysis via this pathway occurring between 305 and 335 nm. Pathway (b) operates at lower wavelengths, with a peak at approximately 310 nm at the surface. Roughly 85 % of photolysis via this pathway occurs at wavelengths between 300 and 320 nm.
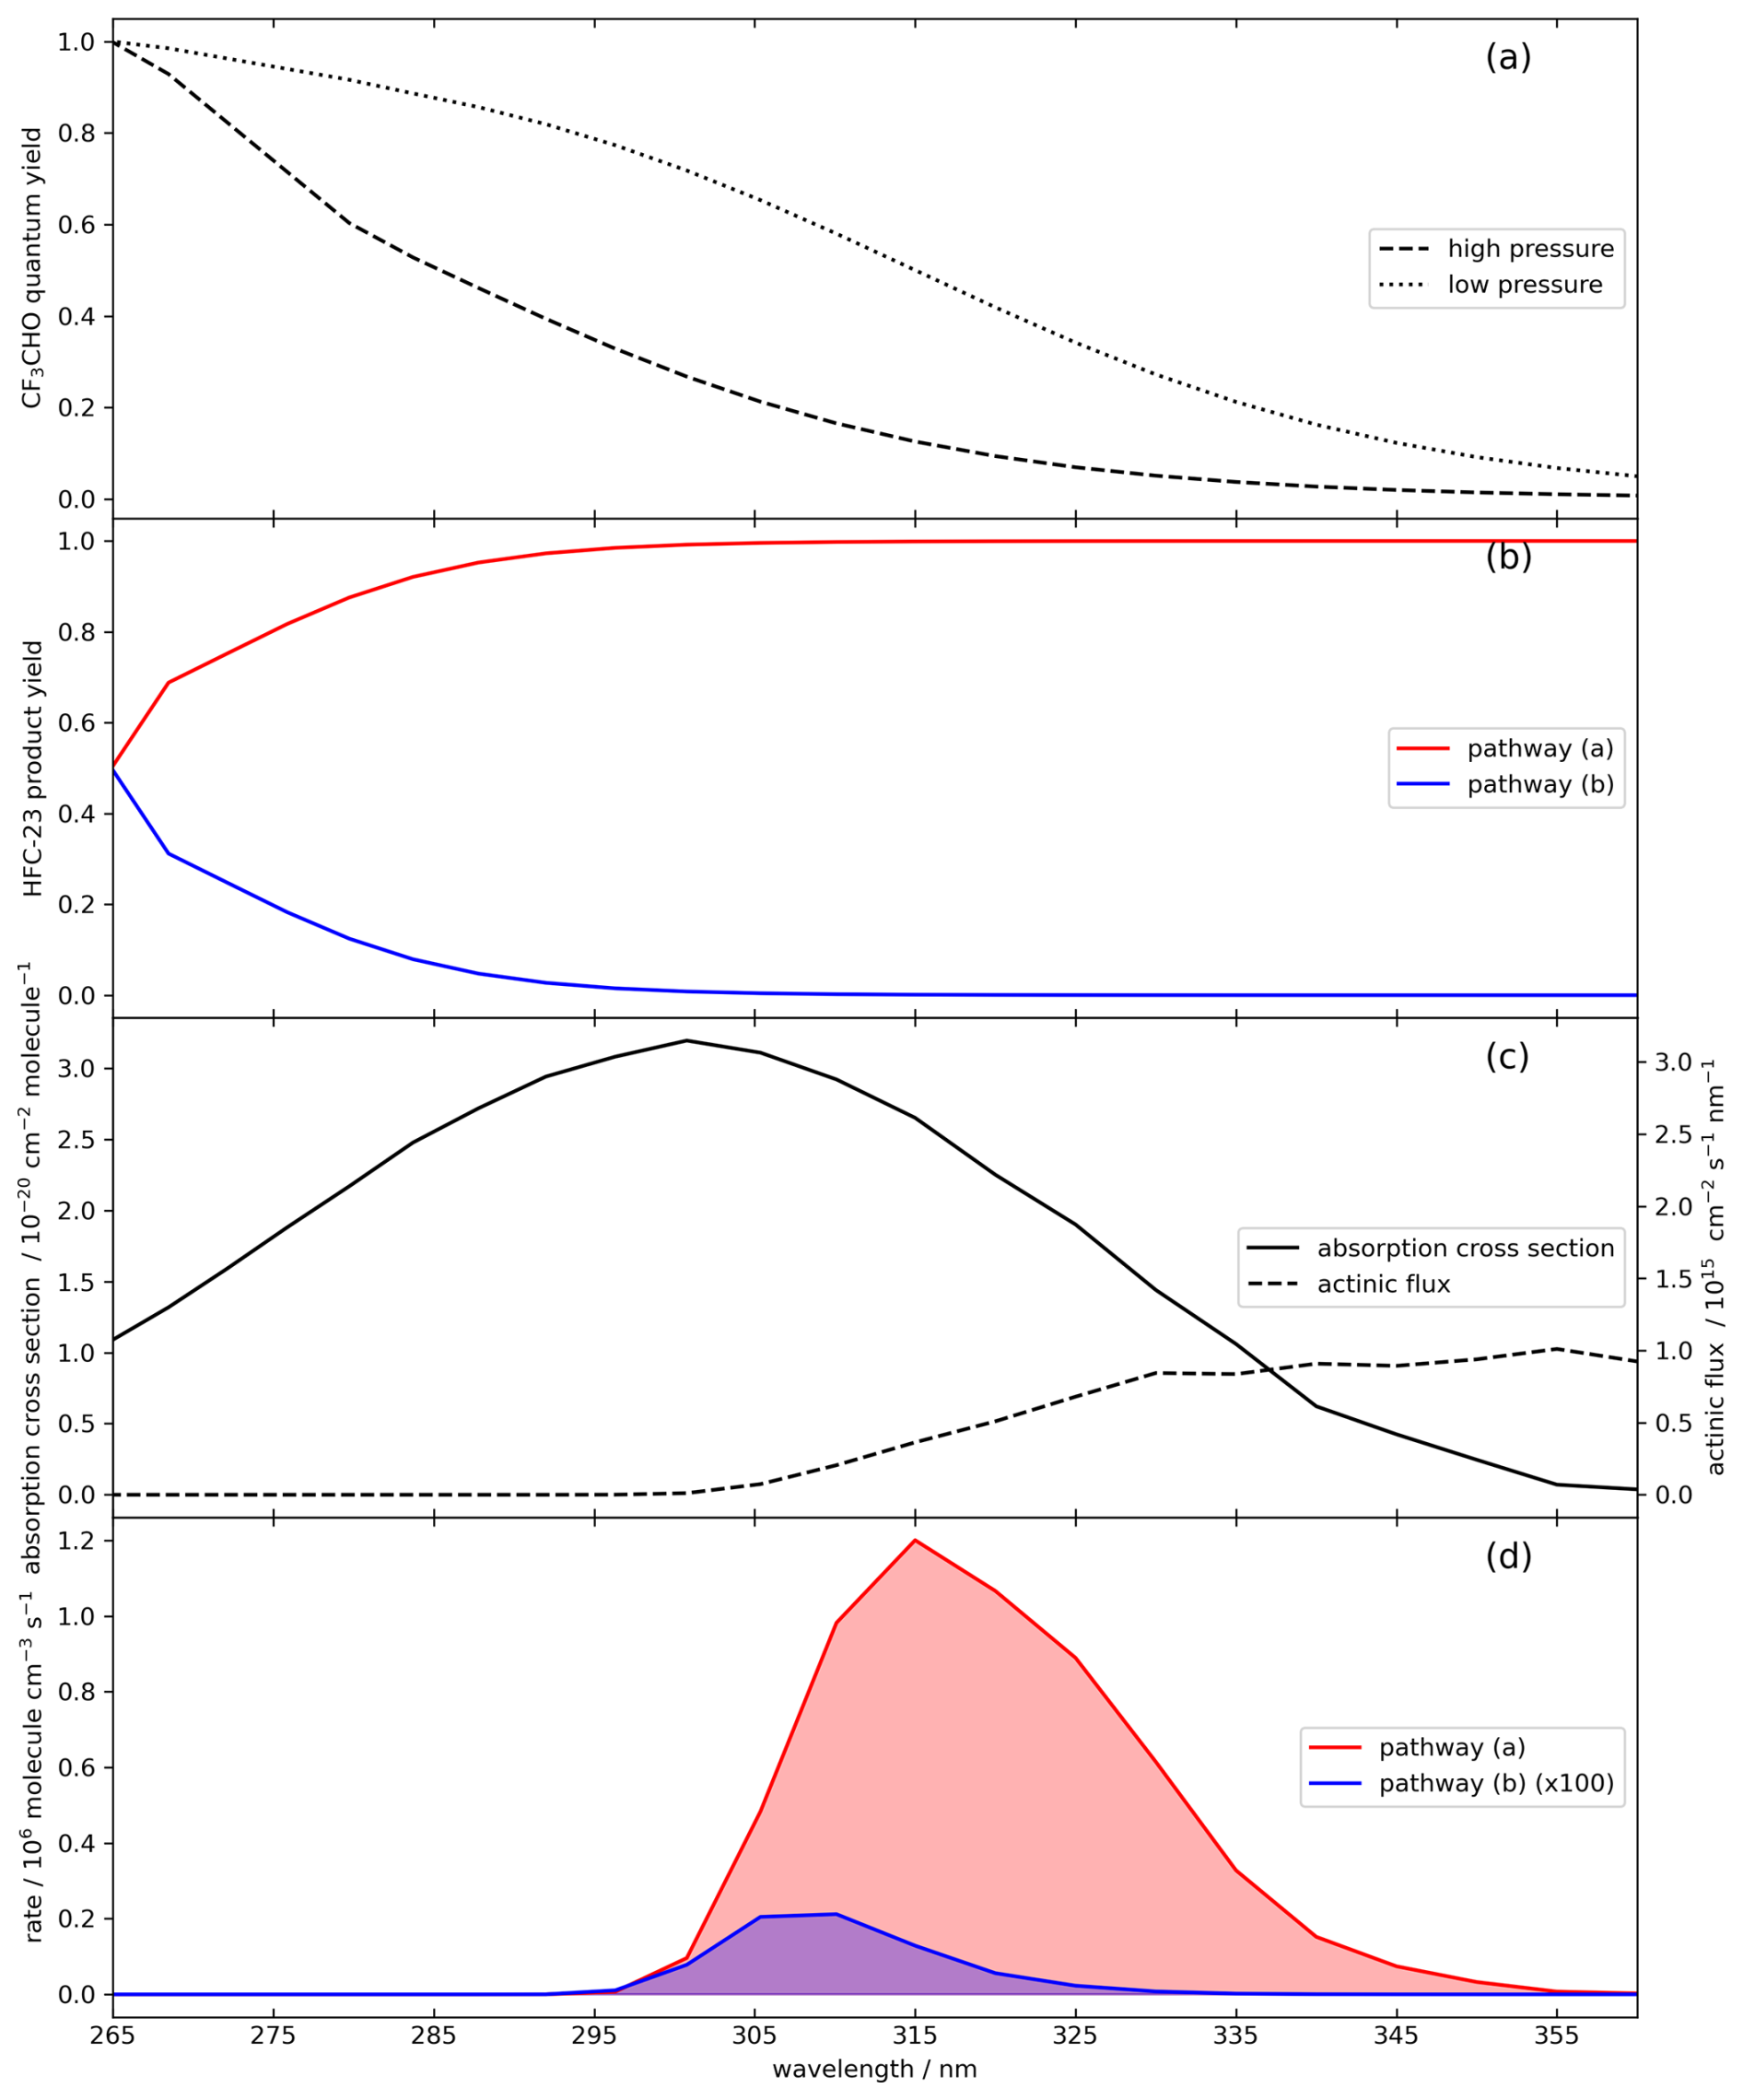
Figure 1(a) Variation with wavelength of the CF3CHO photolysis quantum yield in the model, according to Eq. (1). The dashed line shows the quantum yield calculated at the highest pressure in the model, while the dotted line shows the quantum yield at the lowest pressure in the model. These are also the pressures used in the “Phot_Hi” and “Phot_Low” scenarios. The quantum yield is set to 1.0 for wavelengths below 266 nm and 0 for wavelengths longer than 36 nm. (b) Variation with wavelength of the photolysis product yield for HFC-23. Pathway (a), producing radicals, is shown in red and is calculated as one minus the HFC-23 product yield, while the HFC-23 product yield (pathway (b)) is shown in blue. While this quantity varies slightly with pressure, this is insignificant and not shown here. (c) Variation with wavelength of the absorption cross-section of CF3CHO (solid line) and typical surface actinic flux (dashed line) used in the model. (d) Contribution of each wavelength to the overall photolysis rate at the surface for pathways (a) and (b), shown in red and blue, respectively. The contribution of pathway (b) is shown at 100× enlargement. This is calculated as the product of the quantum and product yields, the absorption cross-section and actinic flux. The area under each of the lines corresponds to the overall photolysis rate, as per Eqs. (3) and (4).
The three photolysis scenarios are summarised in Table 3, alongside typical CF3CHO photolysis lifetimes calculated at the highest (912–1013 hPa) and lowest (100–201 hPa) pressure levels in STOCHEM-CRI.
Table 3CF3CHO photolysis scenarios explored in this study, with the typical photolysis lifetimes for CF3CHO calculated by the model at the surface (τsurface) and at the highest vertical level (τtop). Although the quantum yield treatment is the same at all pressure levels in both the “Phot_Hi” and “Phot_Low” scenarios, differences between the surface and top of the model arise due to differing actinic fluxes.
2.3.2 Chemical and physical loss processes
Several reactions and loss pathways of CF3CHO that compete with UV photolysis were included in the model. Firstly, CF3CHO reacts with the OH radical to produce CF3CO, which does not go on to form HFC-23 (Sulbaek Andersen et al., 2004; Scollard et al., 1993; Sellevåg et al., 2004). The temperature-dependent rate constant for this process is taken from Baumann et al. (2025) and is shown in Table 1. In addition to the reaction with OH, our model also considers loss of CF3CHO through dry and wet deposition. Dry deposition is parametrized in STOCHEM using a deposition velocity, for which values over land and sea can be specified. A previous study estimated the global average dry deposition velocity to be between 0.007 and 0.07 cm s−1 using the GEOS-Chem model with acetaldehyde as a proxy for CF3CHO (Pérez-Peña et al., 2023). However, Nielsen et al. (2025a) note that for compounds with similar Henry's Law solubility coefficients to CF3CHO, mean dry deposition values can be higher than this. In the absence of any further estimates, we take the dry deposition velocity to be 0.01 cm s−1 over both land and sea. The effect on HFC-23 production of deposition velocities between 0.001 and 10 cm s−1 is explored in the sensitivity analysis.
Wet deposition is parametrized using dynamic and convective scavenging coefficients (DSC and CSC) for each species. These cannot be measured directly and have not been published for CF3CHO. We estimate these parameters based on previously published values of scavenging coefficients for soluble species, which lie between 0.0 and 5.0 cm−1 (Prinn and Rosenkranz, 1994), and in the absence of further information set both the DSC and CSC for CF3CHO to 3.0 cm−1 in the model. Another measure of the uptake of a gaseous compound into water, the Henry's Law solubility coefficient, has been heavily debated for CF3CHO, and estimates range from 0.96 M atm−1 (the lower value used in Pérez-Peña et al., 2023) to 3.3 × 10⁴ M atm−1 (the suggested value of the effective Henry's Law coefficient in Nielsen et al., 2025a). Given the spread of these estimates, any value chosen for the DSC and CSC is subject to large uncertainty, and so we explore the impact of varying this parameter between 1.0 and 10.0 cm−1 in the sensitivity analysis (see Sect. 2.4).
Extension of the range of deposition parameters to “extreme” upper limits intends to test the entire theoretical range of deposition behaviour. In doing so, our ensembles capture the full range of influence that uncertainty in these parameters can have on the atmospheric fate of CF3CHO and, therefore, improves the constraint on these highly uncertain processes.
It has been suggested that the in-cloud hydrolysis of CF3CHO may represent a further loss process (Nielsen et al., 2025a). However, there is insufficient published experimental data to represent this in STOCHEM-CRI, and so this process has not been included in this study. In addition, the impact of including another loss process would likely be to reduce the atmospheric burden of CF3CHO, making the estimates of HFC-23 production presented in this work a likely upper bound.
2.4 Sensitivity analysis
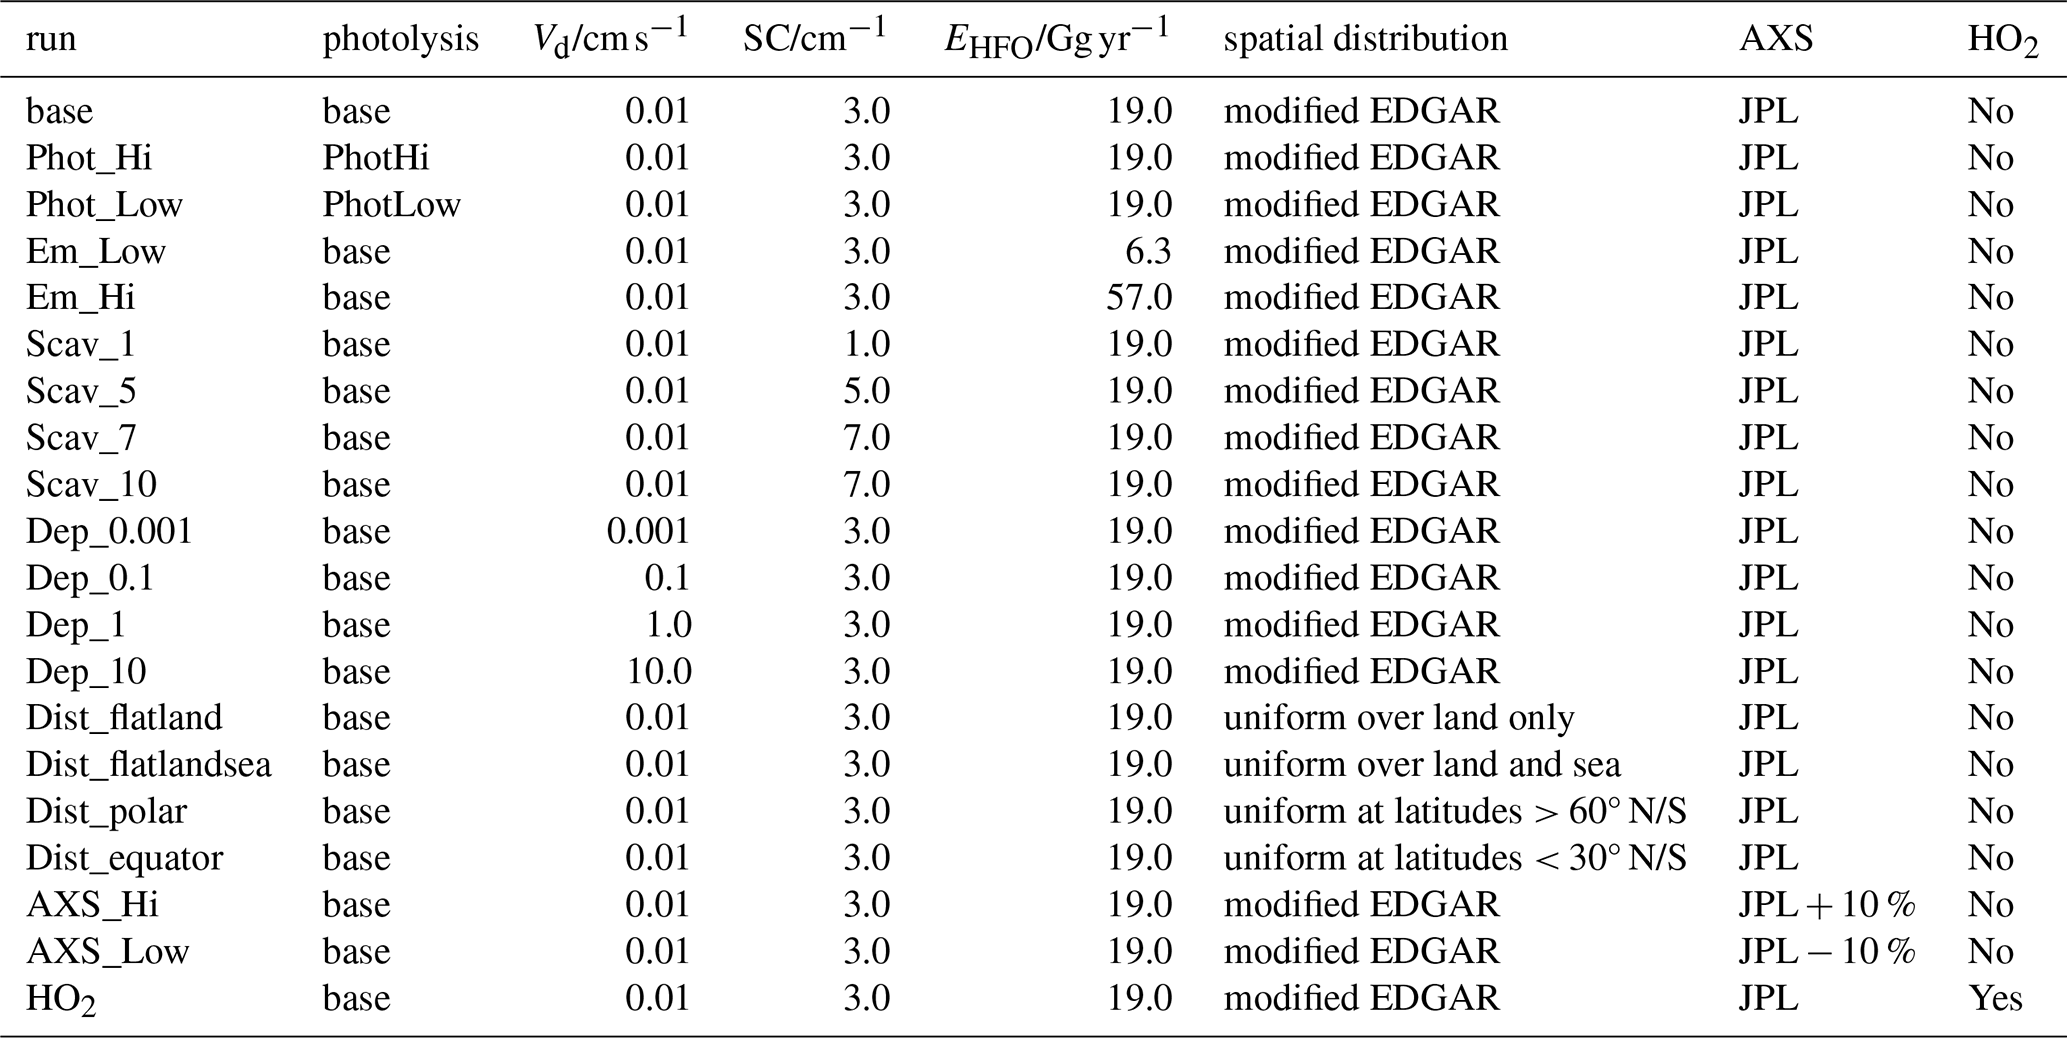
A “base” run was established for the sensitivity analysis, with the photolysis scheme set out as above (see Sect. 2.3.1) and total HFO emissions of 19.0 Gg yr−1 (7.7 Gg yr−1 HFO-1234ze(E), 8.0 Gg yr−1 HCFO-1233zd(E) and 3.3 Gg yr−1 HFO-1336mzz(Z) as derived in Sect. 2.2). Dry deposition velocities over both land and sea were set to 0.01 cm s−1, and dynamic and convective scavenging coefficients to 3.0 cm−1.
Starting from this “base” scenario, nineteen further runs were performed, to explore the loss processes that are poorly constrained by experimental data. Firstly, the effect of changing photolysis setup between the three scenarios “base”, “Phot_Low” and “Phot_Hi” was assessed, as well as a pair of runs (“AXS_Hi” and “AXS_Low”) assessing the impact of increasing or decreasing the absorption cross-section of CF3CHO. Secondly, we varied the emissions of the three HFOs considered in this model, increasing and decreasing emissions by a factor of three relative to the values outlined above to give “Em_Low” and “Em_Hi” runs. We also performed runs in which we varied the spatial distribution of HFO emissions, while keeping the magnitude constant. These explored the impact of distributing global emissions uniformly across the land and sea (“Dist_flatlandsea”), uniformly across the land only (“Dist_flatland”), in a zonal band at the equator (between 30° N and 30° S, run “Dist_equator”), and in two bands at the poles (latitudes greater than 60° N/S, run “Dist_polar”). This was done to explore how releasing the fluorinated source gases into regions of high and low OH or O3 concentrations would impact their breakdown, and these are not presented as plausible emissions distributions. Thirdly, a set of runs was carried out to assess the impact of changing the dry deposition velocity of CF3CHO. In addition to the base run with a dry deposition velocity of 0.01 cm s−1, further runs were performed with dry deposition velocities of 0.001 cm s−1 (“Dep_0.001”), 0.1 cm s−1 (“Dep_0.1”), 1.0 cm s−1 (“Dep_1”) and 10.0 cm s−1 (“Dep_10”). The higher dry deposition scenarios enable the exploration of deposition rates in the range of values proposed by Nielsen et al. (2025a) The impact of changing the convective and dynamic scavenging coefficients, which parametrise wet deposition in the model, was also investigated. While the base runs set this parameter at 3.0 cm−1, we also ran further simulations with the coefficients set to 1.0 cm−1 (“Scav_1”), 5.0 cm−1 (“Scav_5”), 7.0 cm−1 (“Scav_7”) and 10.0 cm−1 (“Scav_10”). These values span the full range of scavenging coefficients tabulated for common species in Prinn and Rosenkranz (1994) (1.0 to 5.0 cm−1) and extend to higher scavenging coefficients to fully explore the impacts of even higher rates of wet deposition. Finally, a single run (“HO2”) was performed to explore the impact of including the reversible reaction between CF3CHO and the HO2 radical, which has been suggested as a potential additional sink for CF3CHO in the atmosphere. This model run incorporates the forward (2.48 × 10⁻¹³ ) and reverse (1.73 × 10³ s−1) rate constants derived from theoretical calculations taken from Long et al. (2022). This run was compared to the “base” scenario, to assess the impact of this reaction of HFC-23 production.
Full details of all sensitivity analysis runs can be found in Table 4.
Table 4List of all model runs in the sensitivity study and the parameters used. The columns show the quantum yield parametrization (photolysis), the dry deposition velocity (Vd), the convective and dynamic scavenging coefficients (SC), total HFO emissions (EHFO) and their spatial distribution (spatial distribution), the CF3CHO absorption cross section (AXS) and whether or not the reversible reaction between CF3CHO and HO2 was included (HO2). The JPL cross-section can be found in Burkholder et al. (2019).
2.5 Global Warming Potentials
Global Warming Potentials (GWPs) quantify the climate impact of a greenhouse gas species, by comparing the time-integrated radiative forcing of a single pulse of emissions to that of carbon dioxide, over a given time horizon (typically 20, 100 and 500 years). The lifetime of the species relative to the time horizon is an important factor in determining the GWP. For example, short-lived species such as HFOs typically have very small GWPs, since their breakdown on timescales far shorter than the time horizon means that their time-integrated radiative impact is much smaller than species with longer lifetimes (Burkholder et al., 2022).
Generally, only the radiative impact of the single species is considered in such calculations, and not the impact of any breakdown products. However, for gases that breakdown to form long-lived, radiatively active species such as HFC-23, the indirect GWP may need to be considered, incorporating both the source gas's radiative impact and that of its breakdown products. This has been done previously for various HFOs (McGillen et al., 2023; Garavagno et al., 2025), considering only their ozonolysis, and for some of the HFOs that break down to CF3CHO (Thomson et al., 2024). A similar approach has been taken for chlorofluorocarbons (CFCs) as well, due to the negative radiative forcing resulting from their ability to deplete stratospheric ozone (Collins et al., 2026).
We calculated indirect GWPs for each of the eight source gases considered here. These were derived by assimilating the rates and yields of reactions contributing to the in-atmosphere HFC-23 production into a simple one-box model of the atmosphere. This model tracks the abundances of the relevant gas species over time according to a simple kinetic scheme, but is otherwise static with respect to atmospheric conditions. The reactions of each source gas with OH were simulated, using the same rate constants as in the STOCHEM-CRI model (see Table 1). A uniform temperature in the box model of 265 K was chosen to most accurately simulate the tropospheric lifetimes of the source gases. The concentration of OH radicals in the box model was set at 0.04 ppt. For the HFOs, the loss via reaction with O3 was also simulated, with the same (temperature-independent) rate constants as in the 3D model and a uniform O3 concentration of 50 ppb. From each member of the STOCHEM-CRI ensemble of runs, the CF3CHO lifetime and the fraction of the loss that yielded HFC-23 was extracted. Although the loss of HFC-23 in the STOCHEM-CRI model is negligible due to its long lifetime relative to the one-year simulations, the reaction with OH was also incorporated into the kinetic scheme here, tuned such that HFC-23 had a tropospheric lifetime of 243 years (ignoring stratospheric loss) (Burkholder et al., 2022).
To determine the indirect GWPs, a 1 kg pulse of emissions was emitted at t = 0 for each source gas species independently. The evolution of HFC-23 over time was tracked over time periods of 20, 100 or 500 years. This was integrated with respect to time and multiplied by the radiative forcing. To give an indirect global warming potential for each source gas due to the production of HFC-23, this was divided by the equivalent time-integrated radiative forcing for an equivalent pulse of CO2, taken from Burkholder et al. (2022).
Here, we report global in-atmosphere HFC-23 production from each of the model runs, assess how varying the parameters in STOCHEM-CRI impacts these values, and finally, calculate indirect global warming potentials for each of the source gas species due to their breakdown to HFC-23.
3.1 HFC-23 production
Across the twenty model scenarios, total HFC-23 production ranged from 0.013 to 0.035 Gg yr−1, with all but two of the runs yielding HFC-23 production rates between 0.016 and 0.022 Gg yr−1. The factors influencing HFC-23 production are discussed below. Figure 2a illustrates that the main source of HFC-23 in these model runs comes from the photolysis of CF3CHO, with the remaining production (< 17 % in all cases) coming from ozonolysis reactions. The absolute contribution from ozonolysis is similar for most runs, since most of the parameters investigated do not significantly impact that reaction pathway. However, differences in HFC-23 produced from ozonolysis are seen when the spatial distribution of HFO emissions is changed, and this is discussed below. Previous work by Van Hoomissen et al. (2025) put the contribution of ozonolysis reactions at 4 % of the total production, with photolysis of CF3CHO yielding the remaining 96 %. Our results suggest a slightly larger relative contribution, with ozonolysis contributing between 5 % and 17 % of the total HFC-23 production and a mean contribution of 11 % across the twenty runs.
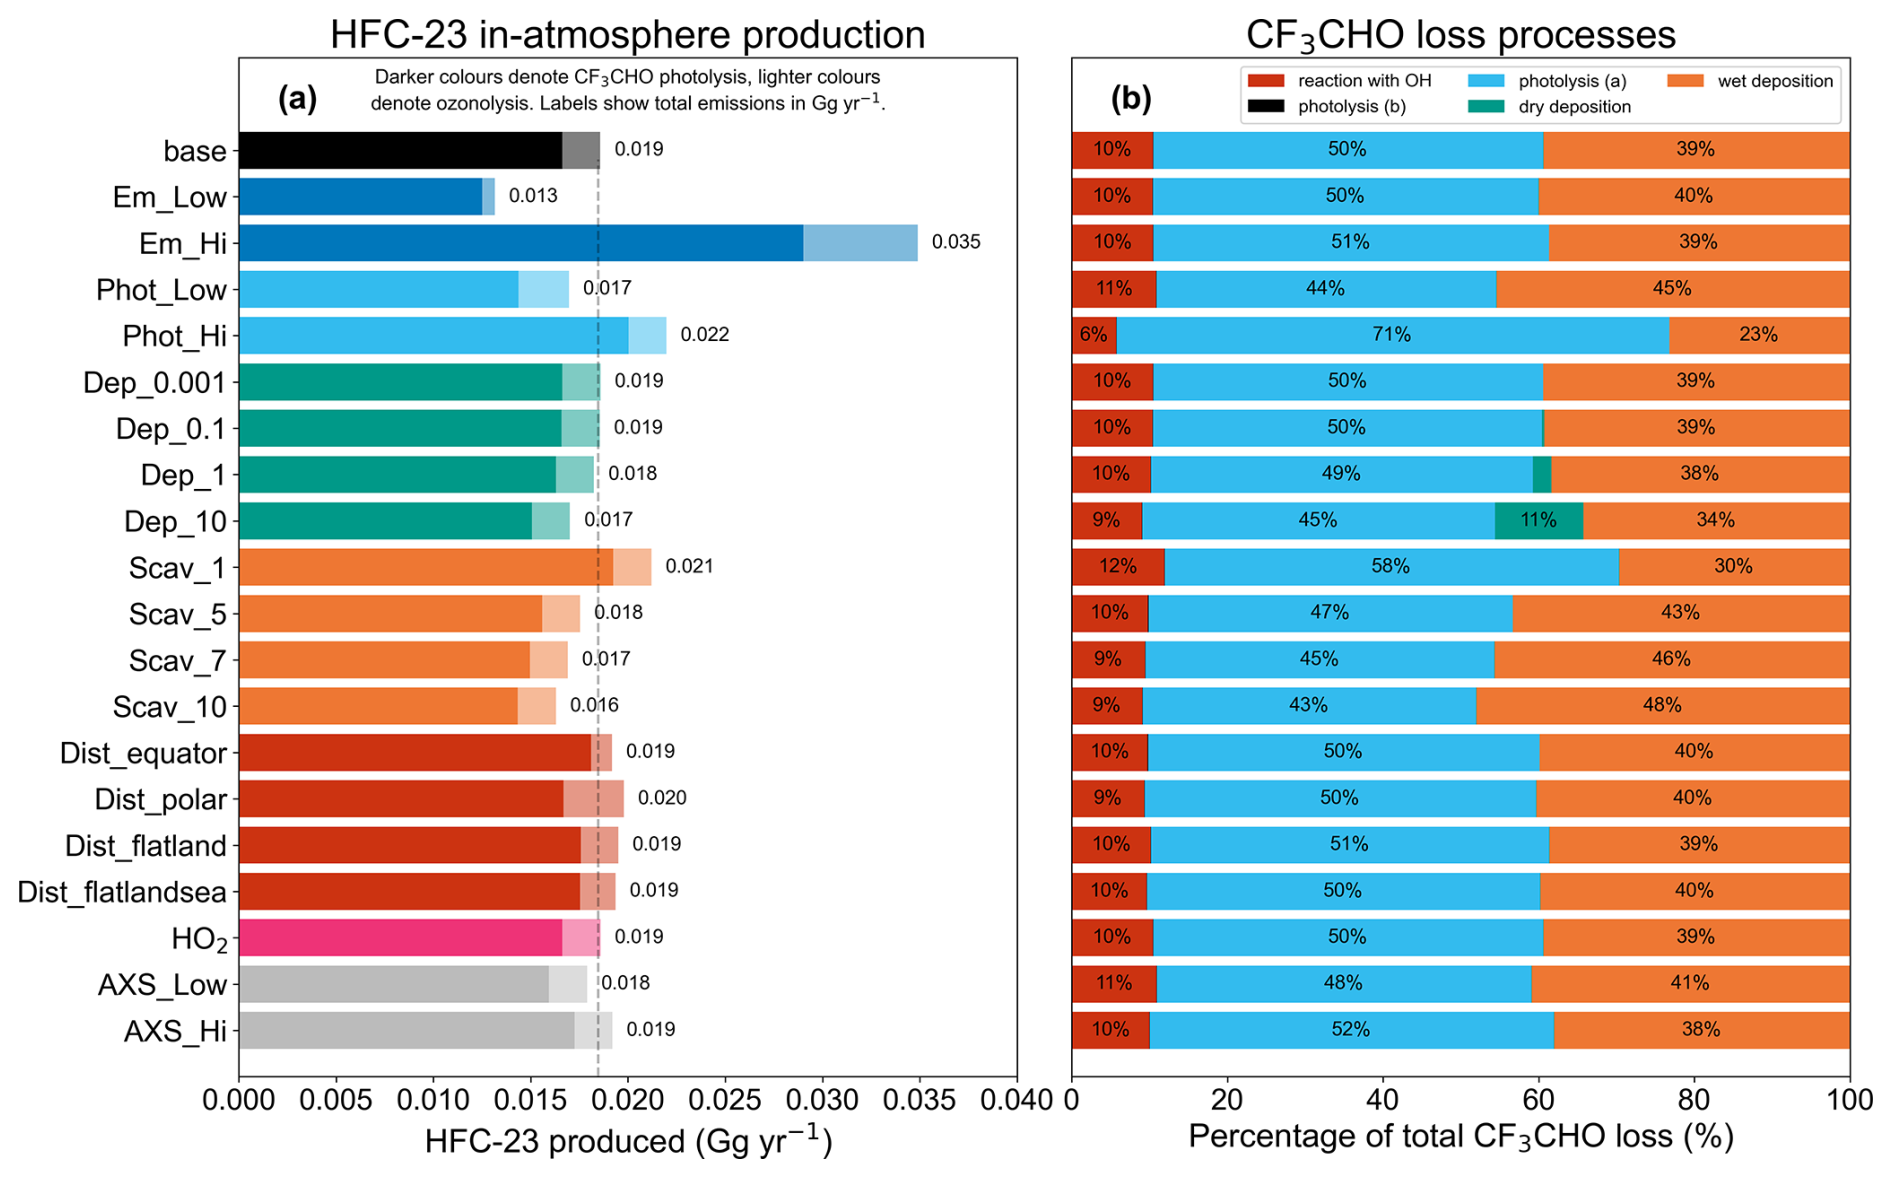
Figure 2(a) Annually averaged in-atmosphere production of HFC-23 under all scenarios in the sensitivity analysis (Sect. 2.4). The darker bars show the contribution of CF3CHO photolysis to HFC-23 production, while the lighter bars show the ozonolysis contribution. The dashed vertical grey line indicates the HFC-23 production in the “base” scenario and acts as a guide to the eye for comparison of other runs. (b) Percentage contribution of the five processes in the model (photolysis pathways (a) and (b), reaction with OH, wet and dry deposition) to CF3CHO loss in each STOCHEM run.
These results are an order of magnitude lower than than the previous estimate of in-atmosphere HFC-23 production by Van Hoomissen et al. (2025), who estimated global emissions of 0.215 Gg yr−1 from photochemical sources for 2022. That value, however, was calculated as an conservative upper bound and so is consistent with the results presented here. These results confirm that in-atmosphere HFC-23 production is likely negligible compared to the global emissions derived from atmospheric measurements. Modelled in-atmosphere production in this study was between 0.1 % and 0.25 % of the global emissions of 14.0 Gg yr−1 published for 2023 (Adam et al., 2024). While some parameters influencing HFC-23 production (such as deposition and in-cloud hydrolysis of CF3CHO) are poorly constrained by experimental data, these model runs were designed to capture a wide range of plausible values for the production of HFC-23. As a result, it is likely that the true contribution of in-atmosphere production to the global HFC-23 burden lies within this range.
These emissions lead to an increase in the global mean mole fraction of HFC-23 of roughly 0.001 ppt yr−1 in the model, in reasonable agreement with the value estimated by Killen et al. (2026). Not only is this value three orders of magnitude lower than the measured increase in global mean mole fraction (on the order 1 ppt yr−1), it is substantially lower than the precision of current measurement techniques (Prinn et al., 2018). This means that even in the absence of industrial emissions, the production of HFC-23 in the atmosphere would be undetectable at present.
3.2 Factors affecting HFC-23 production
3.2.1 Emissions
Comparison of the “Em_Hi” and “Em_Low” runs to the “base” scenario illustrates how HFC-23 production is influenced by HFO emissions (see Fig. 2a). HFOs are not the only source gases considered in this model, but we believe that the emissions (and, crucially, the background mole fractions, which drive HFC-23 production) of the long-lived HFC species are much better constrained, and so we do not vary their emissions in this ensemble. The contribution of the long-lived HFC source gases to HFC-23 production is constant at approximately 0.010 Gg yr−1 in all three emission scenarios, and the contribution of HFOs scales linearly with increasing emissions as expected. In our low emission scenario, HFOs contribute approximately 0.0027 Gg yr−1 of HFC-23 (21 % of the total), whereas with our estimated upper bound for HFOs emissions they contribute 0.023 Gg yr−1 (71 % of the total). As HFOs replace HFCs in the future in emissive applications due to HFC phase-down regulations, we would expect them to begin to dominate as source gases for HFC-23 production in the atmosphere. The contribution of each source gas and reaction to the total HFC-23 produced in the “base” scenario is shown in Fig. 3, in which HFOs contribute 44 % of HFC-23 production and HFCs contribute 56 %. HFO-1234ze(E) and HCFO-1233zd(E) make the largest contributions of the HFOs investigated, while HFC-143a is the largest contributor of the long-lived species, followed by HFC-245fa and HFC-365mfc. The relative ordering of the contributions within the HFC species is consistent with results in Van Hoomissen et al. (2025), which used globally averaged abundances of source gases and oxidants, as well as fixed estimates of the CF3CHO partial lifetime with respect to its loss processes, to estimate a conservative upper limit on HFC-23 production. In that study, the contribution from HFOs made up 80 % of the total HFC-23 production. This is a similar contribution to our “Em_Hi” scenario, in which HFOs contribute 71 % of HFC-23 production. Generation of HFC-23 from HFO-1234ze(E) can also be compared to Killen et al. (2026), who reported 0.011 Gg yr−1. While this is approximately three times larger than the amount of HFC-23 generated from HFO-1234ze(E) in this study, this can largely be explained by the higher emissions used in that study (see Sect. 2.2). The remaining discrepancy is likely due to different treatments of the loss of CF3CHO.
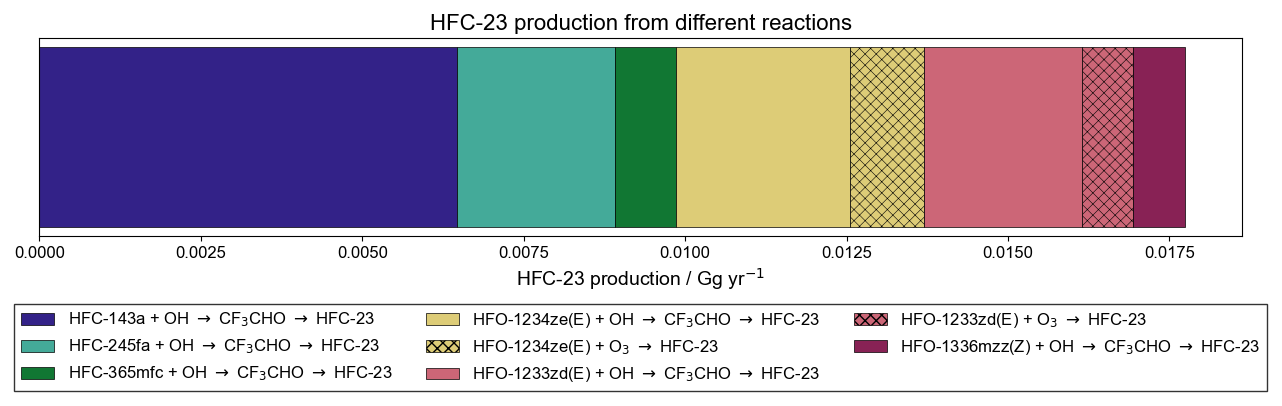
Figure 3Plot of the contribution of each HFO reaction to in-atmosphere HFC-23 production in “base” scenario. The CF3CHO photolysis pathway reactions are shown as solid bars, while the contribution from ozonolysis is shown as hatched bars. The reaction of HFC-236fa with OH and that of HFO-1336mzz(Z) with ozone are not shown, as their contributions to total HFC-23 emissions are < 0.1 % of the total.
Table 5 shows the total HFC-23 generated (in kg) from each of the three HFOs considered in the model, per Gg of HFO emitted. The median and standard deviation for each species are obtained from the full ensemble of simulations. The median is used here to avoid introducing biases from the simulations testing extreme parametrisations.
Table 5Median yield of HFC-23 per mass of emissions of each of the three HFOs considered in this model, reported in kg of HFC-23 per Gg of source gas species with the standard deviation (1σ) of this value across the twenty model runs.
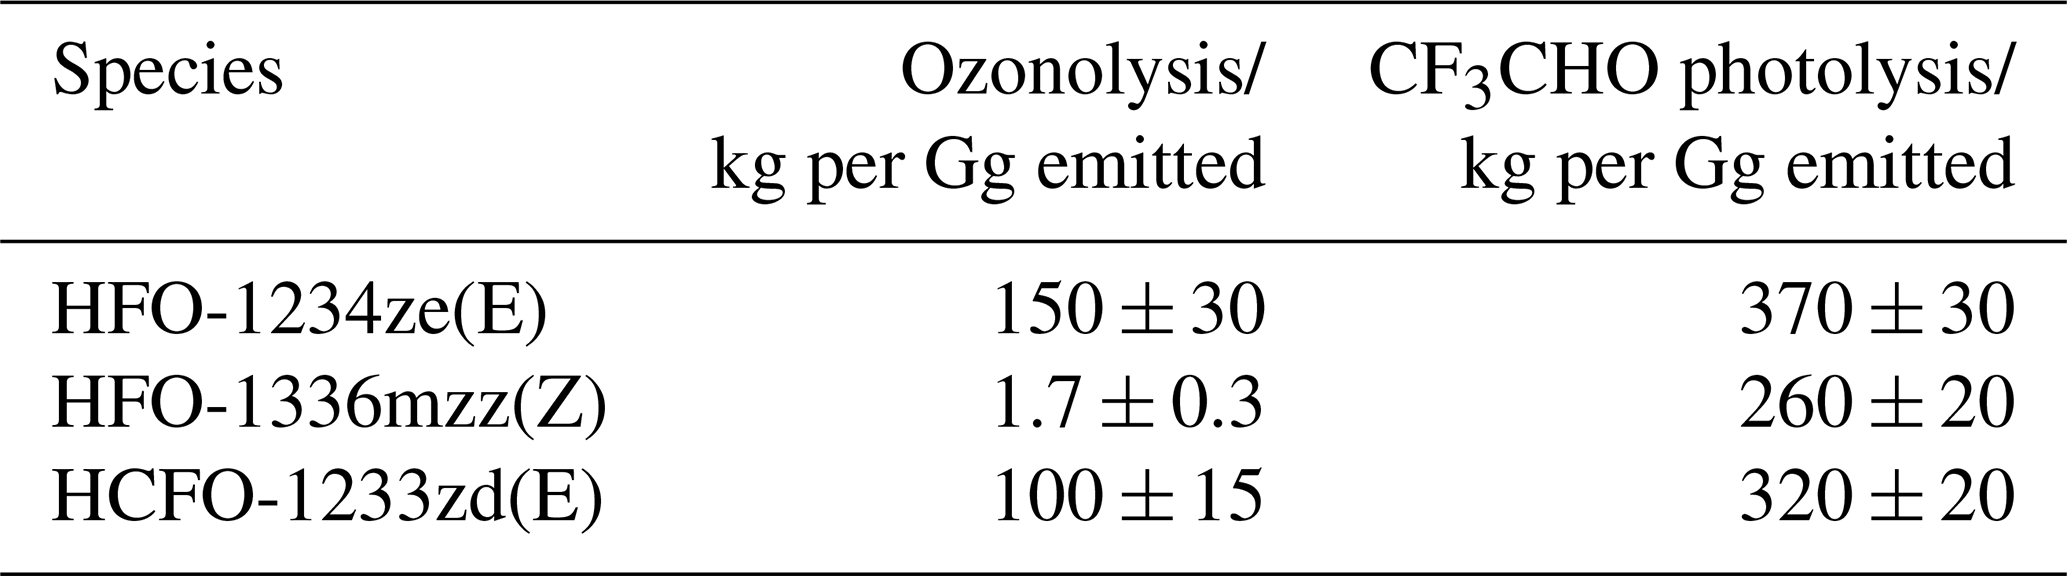
These yields can be compared to those published by Van Hoomissen et al. (2025), who report production of 790, 1100 and 700 kg HFC-23 from photolysis per Gg source gas emission for HFO-1234ze(E), HFO-1336mzz(Z) and HCFO-1233zd(E), respectively. The corresponding reported values for ozonolysis of HFO-1234ze(E) and HFO-1336mzz(Z) are 78 and 2.5 kg HFC-23 per Gg source gas emission (HCFO-1233zd(E) is not reported in their study). For photolysis, our range of yields is significantly lower than the previously published values for all three species, and for ozonolysis, the published values also differ from those presented here. Our ozonolysis yield is 48 % greater than the published value for HFO-1234ze(E) and 39 % lower for HFO-1336mzz(Z). These discrepancies may be attributed to the more thorough treatment of the photochemical and physical behaviour of CF3CHO in our model, as well as the more detailed three-dimensional transport scheme, compared to the calculation in the previous study. Our model also uses an updated value for the HFC-23 yield from HFO-1234ze(E) ozonolysis (Garavagno et al., 2025), which explains the increased yield for that species.
The linearity of HFC-23 production with respect to HFO emissions allows our estimates of in-atmosphere HFC-23 production to be updated, should better estimates of HFO emissions become available. Yield calculations are not performed for the HFC source gases considered in this study, since their longer lifetimes mean that their contribution to the CF3CHO burden varies over time and is dependent on both the background mole fraction and the emission rate. However, the HFC-23 produced by a single “pulse” emission of these gases is estimated when calculating the indirect GDP of these species (see Sect. 2.5) and is discussed below.
We find that the spatial distribution of emissions has a minimal impact on the total HFC-23 production. Relative to the “base” runs, where HFO emissions were distributed according to a modified version of the EDGAR HFC-134a inventory, running with emissions evenly distributed over the earth's surface, or over the land only, increased the HFC-23 production by roughly 5 %. Similarly, placing all the emissions at the equator or at the poles increased HFC-23 production by 3 % and 6 %, respectively. In the “Dist_equator” scenario, we would expect less ozonolysis due to the lower ozone concentrations at lower latitudes, and vice versa for the “Dist_polar” scenario. This is borne out by the results as seen in Fig. 2, although it appears that changes in the photolysis and ozonolysis pathways largely cancelled each other out between the different spatial distributions of emissions. Overall, this suggests that the assumptions we make in spatially distributing HFO emissions in Sect. 2.2 do not have a significant impact on the overall HFC-23 production in the model. The impact of these different emissions scenarios on the spatial distribution of HFC-23 production is shown in Fig. S1.
3.2.2 UV Photolysis
The sensitivity analysis explores the impact of changing the quantum yield of CF3CHO to its high- and low-pressure limits. We find that these limits have a modest impact on the overall HFC-23 production in the model, with the “Phot_Hi” scenario increasing HFC-23 production by 18 % and the “Phot_Low” scenario decreasing HFC-23 production by 9 %. Increasing or decreasing the absorption cross-section of CF3CHO in the model had a smaller impact, changing the HFC-23 production by < 4 %. Figure 2 suggests that uncertainties in photolysis parameters make a similar contribution to uncertainties in the deposition parameters in terms of their overall contribution to the uncertainty in HFC-23 production in the atmosphere. While more measurements of these parameters (namely quantum and product yields at different wavelengths and pressures, and absorption cross-sections at different temperatures) would help to constrain in-atmosphere HFC-23 production even further, existing uncertainties appear to be sufficiently small for meaningful conclusions about the role of in-atmosphere production in the HFC-23 budget to be drawn.
3.2.3 Wet and dry deposition
The impact of varying the wet and dry deposition parameters for CF3CHO in STOCHEM-CRI was explored in a set of model runs that independently varied the scavenging coefficients (which govern wet deposition) and the deposition velocity (which governs dry deposition). Increasing the rate at which CF3CHO is removed from the atmosphere via these processes would be expected to give a lower atmospheric burden, leading to less loss via photolysis and less HFC-23 production. It was found that varying these parameters did indeed have an impact on HFC-23 production. Increasing the dry deposition velocity across four orders of magnitude (from 0.001 to 10.0 cm s−1) decreased HFC-23 production by approximately 10 %, although dry deposition only became a significant loss process for CF3CHO at dry deposition velocities of 1.0 cm s−1 and higher, as shown in Fig. 2b. Similarly, increasing the dynamic and convective scavenging coefficients by an order of magnitude (from 1.0 to 10.0 cm−1) decreased the quantity of HFC-23 produced by approximately 23 %. Investigation of the intermediate values of the scavenging coefficients suggests a non-linear relationship between scavenging coefficient and HFC-23 production. However, further increasing the value of the scavenging coefficients appears unlikely to substantially decrease the HFC-23 yield, as the deposition process becomes limited by other factors such as diffusion and/or precipitation rate.
By imposing dry deposition velocities ranging across four orders of magnitude in the model, we explore the full range of possibilities for a parameter poorly constrained by experimental data. The velocities explored are beyond what has been suggested as an upper limit for the deposition of CF3CHO over a continental surface (Pérez-Peña et al., 2023), and above the range modelled by Zhang et al. (2023) for a range of different atmospheric trace species. Similarly, by varying the scavenging coefficient over the range 1.0–10.0 cm−3, we believe we are exploring a wide range of possible Henry's Law solubility coefficients (HLCs) for CF3CHO. For example, a highly soluble species such as HNO3 has a HLC on the order 105 M atm−1 (Sander, 2023), an order of magnitude higher than that suggested for CF3CHO by Nielsen et al. (2025a). Prinn and Rosenkranz (1994) report the dynamic and convective scavenging coefficients for HNO3 as 2.4 and 4.7 cm−1, respectively. Similar, methanesulfonic acid (another highly soluble trace gas with HLCs reported in the range 105 to 108 M atm−1) is reported to have dynamic and convective scavenging coefficients of 5.0 and 1.5 cm−1, respectively. Thus, even if the HLC of CF3CHO is as high as suggested in previous literature (Nielsen et al., 2025a), it appears unlikely that it will have a scavenging coefficient outside the range explored in this study, although further experimental work would be required to confirm this hypothesis. Our results show that in this model, the value of the scavenging coefficient (and by extension the Henry's Law coefficient) for CF3CHO likely has a similar impact on the uncertainty in the in-atmosphere production of HFC-23 to uncertainties in the photolysis parametrisation, but less of an impact than HFO emissions magnitudes. Further modelling of the chemistry of CF3CHO and its deposition with different models, as well as experimental measurements of the various deposition parameters, would help to enhance our understanding of these processes.
3.3 CF3CHO sinks
Given the importance of atmospheric CF3CHO to the in-atmosphere production of HFC-23, the fate of this compound was investigated. The sinks considered in the model were photolysis via two different pathways, reaction with the OH radical, and wet and dry deposition. As illustrated in Fig. 2b, photolysis pathway (a), generating non-HFC-23 products was the dominant loss process in every model run, except for “Scav_7” and “Scav_10” in which it was surpassed by wet deposition. Photolysis removed between 43 % and 71 % of the atmospheric CF3CHO across the twenty runs, while wet deposition (23 %–48 %) and reaction with OH (6 %–12 %) made up most of the remaining CF3CHO loss. Dry deposition contributed 11 % of CF3CHO loss in the “Dep_10” run and 2.4 % in the “Dep_1” run, but < 0.3 % in all other runs. Pathway (b) photolysis, which produces HFC-23, contributed < 0.1 % in all runs. In the “HO2” run, in which loss of CF3CHO via the reversible reaction with HO2 was included in the chemistry scheme, the relative contribution of the major loss processes was unchanged from the “base” run.
Again, the relative contribution of CF3CHO sinks can be compared with previous estimates in the literature. Pérez-Peña et al. (2023) modelled the photolysis pathway (a) as contributing between 46 % and 74 % of the total CF3CHO loss, which agrees well with the range of values from this study. The contribution of deposition processes (wet and dry) in this study was also similar to that in Pérez-Peña et al. (2023) (23 %–48 % compared to 7 %–41 % in that work). However, the contribution of the photolysis pathway (b) (i.e., that which produces HFC-23) in this study is far lower, because Pérez-Peña et al. (2023) assumed a HFC-23 quantum yield much greater than measured experimentally in Van Hoomissen et al. (2025) and Thomson et al. (2024).
Killen et al. (2026) also modelled the various sinks of CF3CHO, using the GEOS-Chem atmospheric chemistry and transport model. They found a broadly similar distribution of loss processes, although with deposition much more evenly split between wet and dry compared to this study, in which wet deposition dominated in all runs.
3.4 HFO lifetime validation
The globally averaged lifetimes of the HFOs considered here can be calculated and compared to the literature, to assess the model's simulation of their breakdown. For all three HFOs, the lifetime was the same through all the model runs except for those that varied the spatial distribution of emissions. In these, a large variation in lifetimes was seen, which can be attributed to the latitudinal distribution of the OH radicals that represent the main sink of HFOs. While some of these spatial distributions are unrealistic, they demonstrate that changing the spatial emission profile would make a minimal difference to HFC-23 production. The lifetimes quoted here are from the “base” scenario.
For HFO-1234ze(E), the modelled lifetime was 19.0 d, in excellent agreement with the literature value of 19 d reported in the WMO Ozone Assessment 2022 (Burkholder et al., 2022). The other species also showed good agreement with the literature values (24.5/27 and 36.0/41.9 d for the modelled/literature lifetimes for the HFO-1336mzz(Z) and HCFO-1233zd(E), respectively (Burkholder et al., 2022)). While the model tended to slightly underestimate the lifetimes, all three species agree to within 12 % of the literature value. This suggests a reasonable simulation of the sinks of these species, especially given the large variation in their lifetimes with latitude.
3.5 Global Warming potentials
For the eight source gases investigated here, their indirect global warming potential due to their breakdown to HFC-23 is calculated over 20-, 100- and 500-year time horizons using the box model described in Sect. 2.5. The 100-year indirect GWPs are presented in Table 6, while the 20- and 500-year values can be found in the supplement. The GWP values are dependent on the fractional yield of HFC-23 from CF3CHO loss, which varied across the twenty model runs from 0.05 % to 0.07 %. Here, we present the mean and standard deviation in the GWP100 values obtained from the STOCHEM-CRI simulations, alongside their published direct GWPs (Burkholder et al., 2022).
Table 6Direct and indirect 100-year global warming potentials (GWP100) for each of the eight source gases considered in the model. Indirect GWPs are described in Sect. 2.5. Direct GWP100 are taken from Burkholder et al. (2022), while the mean and standard deviation (1σ) of the indirect GWP100 values calculated across the twenty model runs are presented here.
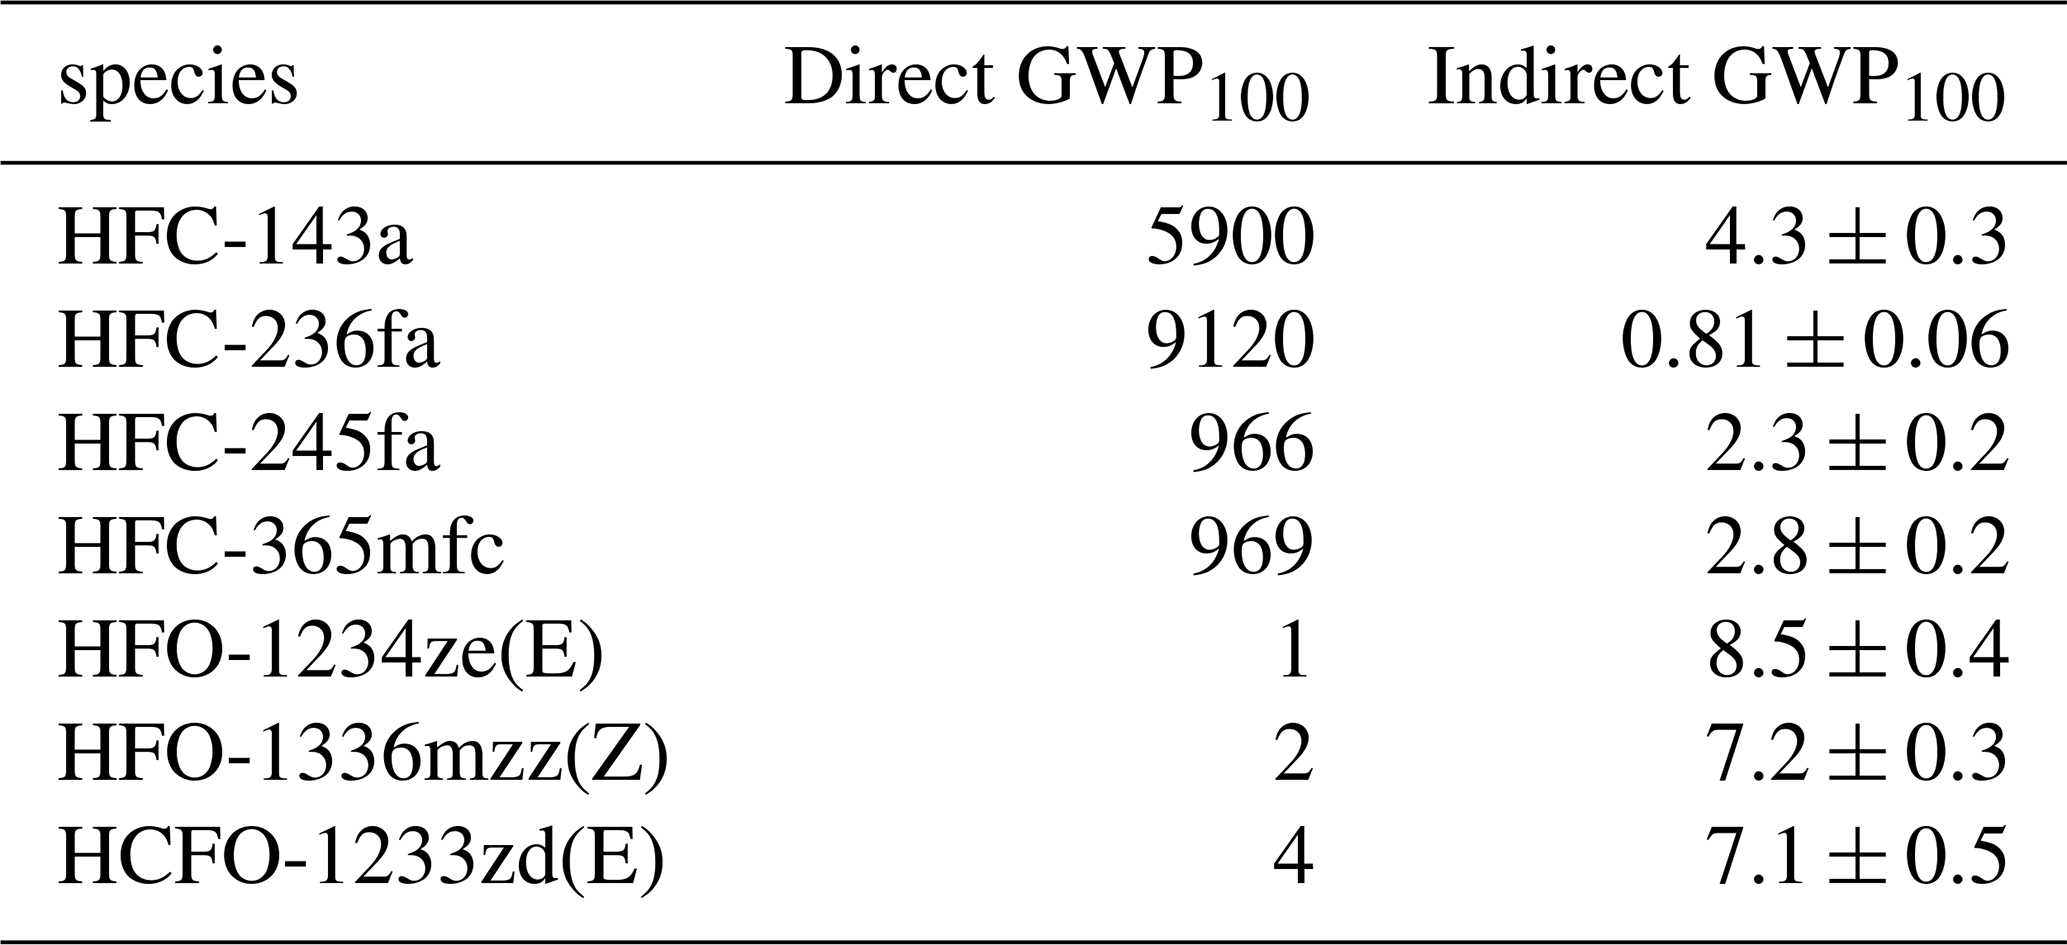
From Table 6, we see that the indirect GWPs for the long-lived source gases are negligible compared to their direct GWPs. The indirect GWPs of the HFOs, however, are larger than their very low direct GWPs. The value for HFO-1234ze(E) falls within the range of uncertainty published by Killen et al. (2026), who estimated an indirect GWP between 8.2 and 11.6. It is also in reasonable agreement with the OH-only and O3-only indirect GWPs from Thomson et al. (2024) and Garavagno et al. (2025), respectively, which summed to give a total of ∼ 9.3.
In this work, we present new estimates of HFC-23 production from the breakdown of fluorinated source gases in the atmosphere, using the STOCHEM-CRI global chemistry and transport model. We carry out a set of sensitivity tests, in order to explore the impact of uncertain parameters (namely source gas emissions, CF3CHO photolysis quantum yields and CF3CHO deposition parameters) on in-atmosphere HFC-23 production. We find that the contribution of these breakdown processes to the global HFC-23 budget is likely in the range of 0.013–0.035 Gg yr−1, which is far lower than previous “upper bound” calculations. Further work to better characterize the key parameters described above would lead to more accurate estimates of HFC-23 production.
These findings suggest that global emissions of HFC-23 are dominated by direct emissions into the atmosphere, and that the contribution of in-atmosphere production to the global discrepancy between inferred and reported emissions is negligible. As discussed above, the bulk of the emissions are likely to be associated with HCFC-22 production, although other industrial processes may also contribute. Therefore, investigations into the source of the “missing” HFC-23 should focus on verifying reported abatement rates at HCFC-22 production facilities (e.g. Rust et al., 2024) and identifying other potential sources. Even at the top end of our range of estimates, in-atmosphere production cannot account for more than a small fraction of the emission gap.
Strategies based on abatement of emissions from industrial sources are likely to be more effective in reducing HFC-23 emissions than minimising the in-atmosphere production pathway. Even as HFO usage increases in response to HFC phase-down under the Kigali Amendment, it would require a dramatic increase in HFO emissions (of at least two orders of magnitude) to lead to HFC-23 production comparable with reported direct emissions, assuming that emissions of other HFCs stay constant. Indeed, the HFCs contribute between 29 % and 79 % of in-atmosphere HFC-23 production in our modelled scenarios, and future abundances of these compounds may have a larger impact on in-atmosphere HFC-23 production than future HFO emissions. On the other hand, all the long-lived species considered in this model are controlled under the Kigali Amendment to the Montreal Protocol, and their abundances are expected to decrease as production and consumption are phased out globally, reducing the additional impact of their breakdown products (Liang et al., 2022).
Whilst our results show that in-atmosphere production has a small impact on the present day HFC-23 budget, they also show that some HFOs have a larger impact on climate than previously thought. When the indirect effects of their breakdown products are considered, the overall GWPs of HFO-1234ze(E), HFO-1336mzz(Z) and HCFO-1233zd(E) increase by at least a factor of two, and, at the top of our range of plausible values, by almost an order of magnitude. These indirect GWPs are still orders of magnitude lower than the direct GWPs of other HFCs in widespread use (such as HFC-134a, GWP100 = 1470, HFC-32, GWP100 = 749 and HFC-125, GWP100 = 3820), and would still be a significant improvement on those HFCs in terms of climate impact. For example, European fluorinated gas (F-gas) regulations are phasing out the use of F-gases with direct GWP100 greater than 150 from 2025 onwards (European Union, 2024), and even at the top end of the estimated range of indirect GWP100s, the HFOs considered here would not meet the criterion for phase-out. Nonetheless, the adoption of HFOs without sufficient consideration of their possible long-term impacts on both the climate and the environment echoes previous changes in policy concerning fluorinated species that had unintended consequences. As a result, the importance of understanding the atmospheric fate of these species cannot be understated.
Due to licensing restrictions, the STOCHEM model code is not publicly available. However, code is available on request from the corresponding author.
STOCHEM model outputs are available at https://doi.org/10.5281/zenodo.21718364 (Adam et al., 2026).
The supplement related to this article is available online at https://doi.org/10.5194/acp-26-10979-2026-supplement.
BA, MR and DS conceptualised and planned the work. BA, RH and AK developed and adapted the STOCHEM model. DVH and JB performed the photolysis parametrisations. BA carried out the runs and analysed the model outputs. PG and BA developed the box model for the Global Warming Potential analysis. BA, RH, JB and DVH wrote the manuscript, with input from all co-authors.
The contact author has declared that none of the authors has any competing interests.
Any views expressed here are the author's and do not represent official views of NOAA or the U.S. government.
Publisher's note: Copernicus Publications remains neutral with regard to jurisdictional claims made in the text, published maps, institutional affiliations, or any other geographical representation in this paper. The authors bear the ultimate responsibility for providing appropriate place names. Views expressed in the text are those of the authors and do not necessarily reflect the views of the publisher.
The authors are thankful to the AGAGE community and PIs (particularly Ray Weiss, Ron Prinn, Paul Krummel, Simon O'Doherty, Dickon Young, Stefan Reimann and Chris Lunder) for their continued work on providing high-quality measurement data to support global monitoring of atmospheric trace species (https://www-air.larc.nasa.gov/missions/agage/, last access: 30 July 2026). AGAGE is supported principally by the National Aeronautics and Space Administration (USA) grants to the Massachusetts Institute of Technology (NNX07AE89G, NNX16AC98G and 80NSSC21K1369) and the Scripps Institution of Oceanography (NNX07AF09G, NNX07AE87G, NNX16AC96G, NNX16AC97G, 80NSSC21K1210 and 80NSSC21K1201). AGAGE measurements are further supported in the United Kingdom by the Department for Energy Security and Net Zero (DESNZ, contracts 1028/06/2015, 1537/06/2018 and 5488/11/2021), in the United States the National Oceanic and Atmospheric Administration (NOAA, contract 1305M319CNRMJ0028), and in Australia by the Commonwealth Scientific and Industrial Research Organization (CSIRO), the Bureau of Meteorology (Australia), the Department of Climate Change, Energy, the Environment and Water (Australia), Refrigerant Reclaim Australia and the Australian Refrigeration Council. Measurements in Norway are supported by the Norwegian Environment Agency, and those from Switzerland by the Swiss National Programs HALCLIM and CLIMGAS-CH (Swiss Federal Office for the Environment, FOEN), by the International Foundation High Altitude Research Stations Jungfraujoch and Gornergrat (HFSJG), and by the European infrastructure projects ICOS and ACTRIS.
BA is supported by the Natural Environment Research Council (NERC) GW4+ Doctoral Landscape Training Partnership (grant no. NE/S007504/1). MR and RH and supported by the NERC InHALE Highlight Topic (Investigating HALocarbon impacts on the global Environment, grant no. NE/X00452X/1).
This paper was edited by Farahnaz Khosrawi and reviewed by two anonymous referees.
Adam, B., Western, L. M., Mühle, J., Choi, H., Krummel, P. B., O'Doherty, S., Young, D., Stanley, K. M., Fraser, P. J., Harth, C. M., Salameh, P. K., Weiss, R. F., Prinn, R. G., Kim, J., Park, H., Park, S., and Rigby, M.: Emissions of HFC-23 do not reflect commitments made under the Kigali Amendment, Commun. Earth Environ., 5, 1–8, https://doi.org/10.1038/s43247-024-01946-y, 2024. a, b
Adam, B., Holland, R., Van Hoomissen, D., Burkholder, J., Khan, M. A. H., Griffiths, P., Mühle, J., Shallcross, D., and Rigby, M.: STOCHEM-CRI model output to support 'Confirming the minimal role of in-atmosphere production on the global HFC-23 budget using a 3D chemical and transport model' (Version 20260731), Zenodo [data set], https://doi.org/10.5281/zenodo.21718364, 2026. a
Baumann, F., Fernholz, C., Lelieveld, J., and Crowley, J. N.: Kinetics of the reaction of CF3CHO with OH between 204 K and 361 K, Phys. Chem. Chem. Phys., https://doi.org/10.1039/D5CP02871J, 2025. a, b
Burkholder, J., Abbatt, J., Cappa, C., Dibble, T., Kolb, C., Orkin, V., Wilmouth, D., Sander, S., Barker, J., Crounse, J., Huie, Kurylo, M., Percival, C., and Wine, P.: JPL Publication 19-5. Chemical Kinetics and Photochemical Data for Use in Atmospheric Studies, Tech. rep., Jet Propulsion Laboratory, Pasadena, CA, https://doi.org/10.48577/jpl.KFQ0TZ, 2019. a, b, c, d, e, f, g, h
Burkholder, J., Hodnebrog, Ø., McDonald, B., Orkin, V., Papadimitriou, V., and Van Hoomissen, T.: Annex : Summary of Abundances, lifetimes, ODPs, REs, GWPs, and GTPs, in: Scientific Assessment of Ozone Depletion 2022, no. 278 in Global Ozone Research and Monitoring Project, World Meteorological Organization, Geneva, Switzerland, 435–492, https://ozone.unep.org/system/files/documents/Scientific-Assessment-of-Ozone-Depletion-2022.pdf (last access: 30 July 2026), 2022. a, b, c, d, e, f, g, h, i
Collins, W. J., Stevenson, D. S., Johnson, C. E., and Derwent, R. G.: Tropospheric Ozone in a Global-Scale Three-Dimensional Lagrangian Model and Its Response to NOX Emission Controls, J. Atmos. Chem., 26, 223–274, https://doi.org/10.1023/A:1005836531979, 1997. a
Collins, W. J., Daniel, J. S., Chipperfield, M. P., Cussac, M., Deushi, M., Faluvegi, G., Griffiths, P., Hodnebrog, Ø., Horowitz, L. W., Keeble, J., Kinnison, D., Naik, V., O'Connor, F. M., Shindell, D., Tilmes, S., Tsigaridis, K., Wang, Z., and Weber, J.: Indirect climate forcing from ozone depleting substances, EGUsphere [preprint], https://doi.org/10.5194/egusphere-2025-6033, 2026. a
Crippa, M., Guizzardi, D., Pagani, F., Banja, M., Muntean, M., Schaaf, E., Becker, W., Monforti-Ferrario, F., Quadrelli, R., Risquez Martin, A., Taghavi-Moharamli, P., Grassi, G., Rossi, S., Brandao De Melo, J., Oom, D., Branco, A., San-Miguel, J., and Vignati, E.: EDGAR v8.0 Greenhouse Gas Emissions, Publications Office of the European Commissions, https://doi.org/10.2760/953322, 2023. a
Derwent, R., Stevenson, D., Doherty, R., Collins, W., and Sanderson, M.: How is surface ozone in Europe linked to Asian and North American NOx emissions?, Atmos. Environ., 42, 7412–7422, https://doi.org/10.1016/j.atmosenv.2008.06.037, 2008. a
Derwent, R. G., Jenkin, M. E., Stevenson, D. S., Utembe, S. R., Khan, A. H., and Shallcross, D. E.: Influence of the oxidation of non-methane volatile organic compounds on tropospheric hydrogen: A STOCHEM-CRI global Lagrangian model study, Atmos. Environ., 352, 121214, https://doi.org/10.1016/j.atmosenv.2025.121214, 2025. a
European Union: Regulation (EU) 2024/573 of the European Parliament and of the Council of 7 February 2024 on fluorinated greenhouse gases, amending Directive (EU) 2019/1937 and repealing Regulation (EU) No 517/2014, Official Journal of the European Union, https://eur-lex.europa.eu/eli/reg/2024/573/oj (last access: 30 July 2026), 2024. a
Garavagno, M. D. L. A., Wenger, A., Holland, R. E. T., Fena, B. R., Goldstein, S. D., Hicks, D. E., Liu, F., Madell, J. B., Solomon, S. J., Kuwata, K. T., McGillen, M. R., Khan, M. A. H., Shallcross, D. E., Stanley, K. M., and Orr-Ewing, A. J.: Atmospheric Oxidation of Hydrofluoroolefins and Hydrochlorofluoroolefins by Ozone Produces HFC-23, PFC-14, and CFC-13, Environ. Sci. Technol., 59, 26031–26040, https://doi.org/10.1021/acs.est.5c11383, 2025. a, b, c, d, e
Holland, R., Khan, M. A. H., Chhantyal-Pun, R., Orr-Ewing, A. J., Percival, C. J., Taatjes, C. A., and Shallcross, D. E.: Investigating the Atmospheric Sources and Sinks of Perfluorooctanoic Acid Using a Global Chemistry Transport Model, Atmosphere, 11, 407, https://doi.org/10.3390/atmos11040407, 2020. a
Holland, R., Khan, M. A. H., Driscoll, I., Chhantyal-Pun, R., Derwent, R. G., Taatjes, C. A., Orr-Ewing, A. J., Percival, C. J., and Shallcross, D. E.: Investigation of the Production of Trifluoroacetic Acid from Two Halocarbons, HFC-134a and HFO-1234yf and Its Fates Using a Global Three-Dimensional Chemical Transport Model, ACS Earth Space Chem., 5, 849–857, https://doi.org/10.1021/acsearthspacechem.0c00355, 2021. a, b, c
Jenkin, M. E., Watson, L. A., Utembe, S. R., and Shallcross, D. E.: A Common Representative Intermediates (CRI) mechanism for VOC degradation. Part 1: Gas phase mechanism development, Atmos. Environ., 42, 7185–7195, https://doi.org/10.1016/j.atmosenv.2008.07.028, 2008. a
Khan, M. A. H., Jenkin, M. E., Foulds, A., Derwent, R. G., Percival, C. J., and Shallcross, D. E.: A modeling study of secondary organic aerosol formation from sesquiterpenes using the STOCHEM global chemistry and transport model, J. Geophys. Res.-Atmos., 122, 4426–4439, https://doi.org/10.1002/2016JD026415, 2017. a
Khan, M. A. H., Lyons, K., Chhantyal-Pun, R., McGillen, M. R., Caravan, R. L., Taatjes, C. A., Orr-Ewing, A. J., Percival, C. J., and Shallcross, D. E.: Investigating the Tropospheric Chemistry of Acetic Acid Using the Global 3-D Chemistry Transport Model, STOCHEM-CRI, J. Geophys. Res.-Atmos., 123, 6267–6281, https://doi.org/10.1029/2018JD028529, 2018. a
Khan, M. A. H., Mendes, D. C., Holland, R. E. T., de los Angeles Garavagno, M., Orr-Ewing, A. J., Stanley, K. M., O'Doherty, S. J., Young, D., Vollmer, M. K., Antony, A. J., Karamshahi, F., Wallington, T. J., Percival, C. J., Bacak, A., Derwent, R. G., and Shallcross, D. E.: Global modeling of trifluoroacetic acid surface concentration and deposition from the gas-phase oxidation of a wide range of precursor hydrofluoroolefins, Environ. Sci.: Atmos., 6, 195–212, https://doi.org/10.1039/D5EA00108K, 2026. a
Killen, B., Fisher, J. A., Hansen, C. S., Krummel, P., Vollmer, M. K., and Kable, S.: Atmospheric fates and global warming potential of HFO-1234ze (E) and its degradation product trifluoroacetaldehyde (CF3CHO), Environ. Sci.-Atmos., 6, 913–932, https://doi.org/10.1039/D6EA00034G, 2026. a, b, c, d, e, f
Laube, J. C., Newland, M. J., Hogan, C., Brenninkmeijer, C. A. M., Fraser, P. J., Martinerie, P., Oram, D. E., Reeves, C. E., Röckmann, T., Schwander, J., Witrant, E., and Sturges, W. T.: Newly detected ozone-depleting substances in the atmosphere, Nat. Geosci., 7, 266–269, https://doi.org/10.1038/ngeo2109, 2014. a
Liang, Q., Rigby, M., Fang, X., Godwin, D. S., Muhle, J., Saito, T., Stanley, K. M., and Velders, G. J. M.: Hydrofluorocarbons (HFCs), in: Scientific Assessment of Ozone Depletion 2022, edited by: Montzka, S. and Vollmer, M. K., no. 278 in Global Ozone Research and Monitoring Project, World Meteorological Organization, Geneva, Switzerland, 115–152, https://ozone.unep.org/system/files/documents/Scientific-Assessment-of-Ozone-Depletion-2022.pdf (last access: 30 July 2026), 2022. a, b, c, d, e
Long, B., Xia, Y., and Truhlar, D. G.: Quantitative Kinetics of HO2 Reactions with Aldehydes in the Atmosphere: High-Order Dynamic Correlation, Anharmonicity, and Falloff Effects Are All Important, J. Am. Chem. Soc., 144, 19910–19920, https://doi.org/10.1021/jacs.2c07994, 2022. a
McGillen, M. R., Bernard, F., Fleming, E. L., and Burkholder, J. B.: HCFC-133a (CF3CH2Cl): OH rate coefficient, UV and infrared absorption spectra, and atmospheric implications, Geophys. Res. Lett., 42, 6098–6105, https://doi.org/10.1002/2015GL064939, 2015. a
McGillen, M. R., Fried, Z. T. P., Khan, M. A. H., Kuwata, K. T., Martin, C. M., O'Doherty, S., Pecere, F., Shallcross, D. E., Stanley, K. M., and Zhang, K.: Ozonolysis can produce long-lived greenhouse gases from commercial refrigerants, P. Natl. Acad. Sci. USA, 120, e2312714120, https://doi.org/10.1073/pnas.2312714120, 2023. a, b, c, d
Nielsen, O. J., Andersen, M. P. S., and Franklin, J.: Comment on “Assessing the atmospheric fate of trifluoroacetaldehyde (CF3CHO) and its potential as a new source of fluoroform (HFC-23) using the AtChem2 box model” by Pérez-Peña et al., Environ. Sci.: Atmos., 2023, 3, 1767–1777, https://doi.org/10.1039/D3EA00120B, Environ. Sci.-Atmos., 5, 530–534, https://doi.org/10.1039/D4EA00123K, 2025a. a, b, c, d, e, f, g
Nielsen, O. J., Sulbaek Andersen, M. P., and Wallington, T. J.: CF3H production from the ozonolysis of HCFOs: E- and Z-CF3CH=CHCl, Atmos. Environ., 343, 120953, https://doi.org/10.1016/j.atmosenv.2024.120953, 2025b. a, b
Pérez-Peña, M. P., Fisher, J. A., Hansen, C., and Kable, S. H.: Assessing the atmospheric fate of trifluoroacetaldehyde (CF3CHO) and its potential as a new source of fluoroform (HFC-23) using the AtChem2 box model, Environ. Sci.: Atmos., 3, 1767–1777, https://doi.org/10.1039/D3EA00120B, publisher: RSC, 2023. a, b, c, d, e, f
Pérez-Peña, M. P., Fisher, J. A., Hansen, C. S., and Kable, S. H.: Reply to the 'Comment on “Assessing the atmospheric fate of trifluoroacetaldehyde (CF3CHO) and its potential as a new source of fluoroform (HFC-23) using the AtChem2 box model”' by O. J. Nielsen, M. P. Sulbaek Andersen and J. Franklin, Environ. Sci.: Atmos., 2025, 5, https://doi.org/10.1039/D4EA00123K, Environ. Sci.-Atmos., 5, 535–538, https://doi.org/10.1039/D4EA00154K, 2025. a
Prinn, R., Weiss, R., Arduini, J., Arnold, T., Fraser, P., Ganesan, A., Gasore, J., Harth, C., Hermansen, O., Kim, J., Krummel, P., Loh, Z., Lunder, C., Maione, M., Manning, A., Miller, B., Mitrevski, B., Mühle, J., O'Doherty, S., Park, S., Reimann, S., Rigby, M., Saito, T., Salameh, P., Schmidt, R., Simmonds, P., Stanley, K., Steel, P., Vollmer, M., Wang, H. R., Yao, B., Young, D., and Zhou, L.: The dataset of in-situ measurements of chemically and radiatively important atmospheric gases from the Advanced Global Atmospheric Gas Experiment (AGAGE) and affiliated stations (2023R2), ESS-DIVE, https://doi.org/10.15485/2216951, 2023. a, b
Prinn, R. G. and Rosenkranz, H. S. (Eds.): Global Atmospheric-Biospheric Chemistry, 223247, Plenum Publishing, New York, ISBN 978-1-4613-6075-9, 1994. a, b, c
Prinn, R. G., Weiss, R. F., Arduini, J., Arnold, T., DeWitt, H. L., Fraser, P. J., Ganesan, A. L., Gasore, J., Harth, C. M., Hermansen, O., Kim, J., Krummel, P. B., Li, S., Loh, Z. M., Lunder, C. R., Maione, M., Manning, A. J., Miller, B. R., Mitrevski, B., Mühle, J., O'Doherty, S., Park, S., Reimann, S., Rigby, M., Saito, T., Salameh, P. K., Schmidt, R., Simmonds, P. G., Steele, L. P., Vollmer, M. K., Wang, R. H., Yao, B., Yokouchi, Y., Young, D., and Zhou, L.: History of chemically and radiatively important atmospheric gases from the Advanced Global Atmospheric Gases Experiment (AGAGE), Earth Syst. Sci. Data, 10, 985–1018, https://doi.org/10.5194/essd-10-985-2018, 2018. a, b, c
Rust, D., Katharopoulos, I., Vollmer, M. K., Henne, S., O'Doherty, S., Say, D., Emmenegger, L., Zenobi, R., and Reimann, S.: Swiss halocarbon emissions for 2019 to 2020 assessed from regional atmospheric observations, Atmos. Chem. Phys., 22, 2447–2466, https://doi.org/10.5194/acp-22-2447-2022, 2022. a
Rust, D., Vollmer, M. K., Henne, S., Bühlmann, T., Frumau, A., van den Bulk, P., Emmenegger, L., Zenobi, R., and Reimann, S.: First Atmospheric Measurements and Emission Estimates of HFO-1336mzz(Z), Environ. Sci. Technol., 57, 11903–11912, https://doi.org/10.1021/acs.est.3c01826, 2023. a
Rust, D., Vollmer, M. K., Henne, S., Frumau, A., van den Bulk, P., Hensen, A., Stanley, K. M., Zenobi, R., Emmenegger, L., and Reimann, S.: Effective realization of abatement measures can reduce HFC-23 emissions, Nature, 633, 96–100, https://doi.org/10.1038/s41586-024-07833-y, 2024. a
Sander, R.: Compilation of Henry's law constants (version 5.0.0) for water as solvent, Atmos. Chem. Phys., 23, 10901–12440, https://doi.org/10.5194/acp-23-10901-2023, 2023. a
Scollard, D. J., Treacy, J. J., Sidebottom, H. W., Balestra-Garcia, C., Laverdet, G., LeBras, G., MacLeod, H., and Teton, S.: Rate constants for the reactions of hydroxyl radicals and chlorine atoms with halogenated aldehydes, J. Phys. Chem., 97, 4683–4688, https://doi.org/10.1021/j100120a021, 1993. a
Sellevåg, S. R., Kelly, T., Sidebottom, H., and Nielsen, C. J.: A study of the IR and UV-Vis absorption cross-sections, photolysis and OH-initiated oxidation of CF3CHO and CF3CH2CHO, Phys. Chem. Chem. Phys., 6, 1243–1252, https://doi.org/10.1039/B315941H, 2004. a
Su, S., Fang, X., Li, L., Wu, J., Zhang, J., Xu, W., and Hu, J.: HFC-134a emissions from mobile air conditioning in China from 1995 to 2030, Atmos. Environ., 102, 122–129, https://doi.org/10.1016/j.atmosenv.2014.11.057, 2015. a
Sulbaek Andersen, M. P. and Nielsen, O. J.: Tropospheric photolysis of CF3CHO, Atmos. Environ., 272, 118935, https://doi.org/10.1016/j.atmosenv.2021.118935, 2022. a
Sulbaek Andersen, M. P., Nielsen, O. J., Hurley, M. D., Ball, J. C., Wallington, T. J., Stevens, J. E., Martin, J. W., Ellis, D. A., and Mabury, S. A.: Atmospheric Chemistry of n-CxF2x+1CHO (): Reaction with Cl Atoms, OH Radicals and IR Spectra of CxF2x+1C(O)O2NO2, J. Phys. Chem. A, 108, 5189–5196, https://doi.org/10.1021/jp0496598, 2004. a
Sulbaek Andersen, M. P., Madronich, S., Ohide, J. M., Frausig, M., and Nielsen, O. J.: Photolysis of CF3CHO at 254 nm and potential contribution to the atmospheric abundance of HFC-23, Atmos. Environ., 314, 120087, https://doi.org/10.1016/j.atmosenv.2023.120087, 2023. a, b
Thomson, J. D., Campbell, J. S., Edwards, E. B., Medcraft, C., Nauta, K., Pérez-Peña, M. P., Fisher, J. A., Osborn, D. L., Kable, S. H., and Hansen, C. S.: Fluoroform (CHF3) Production from CF3CHO Photolysis and Implications for the Decomposition of Hydrofluoroolefins and Hydrochlorofluoroolefins in the Atmosphere, J. Am. Chem. Soc., 147, 33–38, https://doi.org/10.1021/jacs.4c11776, 2024. a, b, c, d, e
United Nations Environment Programme: Amendment to the Montreal Protocol on Substances That Deplete the Ozone Layer, type: treaty Place: Kigali, Rwanda, https://ozone.unep.org/treaties/montreal-protocol/amendments/kigali-amendment-2016-amendment-montreal-protocol-agreed (last access: 30 July 2026), 2016. a
United Nations Environment Programme: Report of the Technology and Economic Assessment Panel, September 2023. Volume 6: Response to Decision XXXIV/7: Strengthening Institutional Processes with respect to Information on HFC-23 By-Product Emissions, Tech. Rep. Volume 6, United Nations Environment Programme, https://ozone.unep.org/system/files/documents/TEAP-MCTOC-response-to-decision%20XXXIV7-report-september2023.pdf (last access: 30 July 2026), 2023. a
United Nations Environment Programme: Report of the Technology and Economic Assessment Panel, September 2024. Volume 5: Response to Decision XXXV/7: Emissions of HFC-23, Tech. Rep. Volume 5, United Nations Environment Programme, https://ozone.unep.org/system/files/documents/TEAP-reponse-to-decision-XXXV-7-report-september-2024.pdf (last access: 30 July 2026), 2024a. a
United Nations Environment Programme: Report of the Scientific Assessment Panel, September 2024. Response to Decision XXXV/7: Emissions of HFC-23, Tech. rep., United Nations Environment Programme, https://ozone.unep.org/system/files/documents/SAP_Report_on_HFC23_September2024.pdf (last access: 30 July 2026), 2024b. a, b, c
United Nations Environment Programme: HFC-23 emissions | Ozone Secretariat, United Nations Environment Programme, https://ozone.unep.org/hfc-23-emissions (last access: 30 July 2026), 2025a. a, b
United Nations Environment Programme: Report of the Technology and Economic Assessment Panel, September 2025. Volume 2: Response to Decision XXXVI/3: Emissions of HFC-23, Tech. Rep. Volume 2, United Nations Environment Programme, https://ozone.unep.org/system/files/documents/TEAP-reponse-to-decision-XXXVI-3-report-september-2025.pdf (last access: 30 July 2026), 2025b. a, b
Utembe, S. R., Watson, L. A., Shallcross, D. E., and Jenkin, M. E.: A Common Representative Intermediates (CRI) mechanism for VOC degradation. Part 3: Development of a secondary organic aerosol module, Atmos. Environ., 43, 1982–1990, https://doi.org/10.1016/j.atmosenv.2009.01.008, 2009. a
Utembe, S. R., Cooke, M. C., Archibald, A. T., Jenkin, M. E., Derwent, R. G., and Shallcross, D. E.: Using a reduced Common Representative Intermediates (CRIv2-R5) mechanism to simulate tropospheric ozone in a 3-D Lagrangian chemistry transport model, Atmos. Environ., 44, 1609–1622, https://doi.org/10.1016/j.atmosenv.2010.01.044, 2010. a
Van Hoomissen, D., Chattopadhyay, A., Montzka, S. A., and Burkholder, J. B.: CHF3 (HFC-23) and CF3CHO Quantum Yields in the Pulsed Laser Photolysis of CF3CHO at 248, 266, 281, and 308 nm, ACS Earth Space Chem., 9, 589–602, https://doi.org/10.1021/acsearthspacechem.4c00316, 2025. a, b, c, d, e, f, g, h, i, j, k, l, m, n
Velders, G. J. M., Fahey, D. W., Daniel, J. S., McFarland, M., and Andersen, S. O.: The large contribution of projected HFC emissions to future climate forcing, P. Natl. Acad. Sci. USA, 106, 10949–10954, https://doi.org/10.1073/pnas.0902817106, 2009. a, b
Vollmer, M. K., Reimann, S., Hill, M., and Brunner, D.: First Observations of the Fourth Generation Synthetic Halocarbons HFC-1234yf, HFC-1234ze(E), and HCFC-1233zd(E) in the Atmosphere, Environ. Sci. Technol., 49, 2703–2708, https://doi.org/10.1021/es505123x, 2015. a
Vollmer, M. K., Pitt, J. R., Young, D., Henne, S., Mitrevski, B., Mühle, J., Ganesan, A., Arduini, J., Manning, A. J., Wagenhäuser, T., Redington, A. L., Melo, D. B., Murphy, B., Gluckmann, R., Stanley, K. M., Krummel, P. B., Lunder, C. R., Yun, J., Rust, D., Wenger, A., Guillevic, M., Kim, J., Wang, R. H. J., Rhee, T. S., Constantin, L., Frumau, A., Harth, C. M., Salameh, P. K., Hermansen, O., Rigby, M., Western, L. M., Engel, A., O'Doherty, S., Park, S., Maione, M., Fraser, P. J., Prinn, R. G., Weiss, R. F., and Reimann, S.: Global Observations and European emissions of the halogenated olefins HFO-1234yf, HFO-1234ze(E), and HCFO-1233zd(E) from the AGAGE (Advanced Global Atmospheric Gases Experiment) network, Atmos. Chem. Phys., 26, 6993–7012, https://doi.org/10.5194/acp-26-6993-2026, 2026. a, b, c
Watson, L. A., Shallcross, D. E., Utembe, S. R., and Jenkin, M. E.: A Common Representative Intermediates (CRI) mechanism for VOC degradation. Part 2: Gas phase mechanism reduction, Atmos. Environ., 42, 7196–7204, https://doi.org/10.1016/j.atmosenv.2008.07.034, 2008. a
Western, L. M., Rigby, M., Mühle, J., Krummel, P. B., Lunder, C. R., O'Doherty, S., Reimann, S., Vollmer, M. K., Young, D., Adam, B., Fraser, P. J., Ganesan, A. L., Harth, C. M., Hermansen, O., Kim, J., Langenfelds, R. L., Loh, Z. M., Mitrevski, B., Pitt, J. R., Salameh, P. K., Schmidt, R., Stanley, K., Stavert, A. R., Wang, H.-J., Weiss, R. F., and Prinn, R. G.: Global emissions and abundances of chemically and radiatively important trace gases from the AGAGE network, Earth Syst. Sci. Data, 17, 6557–6582, https://doi.org/10.5194/essd-17-6557-2025, 2025. a, b, c
Winiberg, F. A., Percival, C. J., Shannon, R., Khan, M. A. H., Shallcross, D. E., Liu, Y., and Sander, S. P.: Reaction kinetics of OH+ HNO 3 under conditions relevant to the upper troposphere/lower stratosphere, Phys. Chem. Chem. Phys., 20, 24652–24664, 2018. a
World Bank Group: World Bank Open Data, blackboxPlease add the name of the publisher/publishing institution., https://data.worldbank.org/indicator/NY.GDP.MKTP.CD (last access: 30 July 2026), 2025. a
Zhang, L., He, Z., Wu, Z., Macdonald, A. M., Brook, J. R., and Kharol, S.: A database of modeled gridded dry deposition velocities for 45 gaseous species and three particle size ranges across North America, J. Environ. Sci., 127, 264–272, https://doi.org/10.1016/j.jes.2022.05.030, 2023. a