
the Creative Commons Attribution 4.0 License.
the Creative Commons Attribution 4.0 License.
 | 30 Jul 2026
Compensating biases in CCN predictions from composition averaging and neglected surfactant effects
Xiaotian Xu
Jeffrey H. Curtis
Matthew West
Accurate predictions of cloud condensation nuclei (CCN) activation are essential for reducing uncertainties in aerosol-cloud interactions and climate projections. Most large-scale aerosol models represent particles as compositionally averaged internal mixtures and assume constant surface tension of water, neglecting particle-level compositional variability and surfactant-driven reductions in surface tension. Here we use the particle-resolved model WRF-PartMC to quantify how these simplifications affect CCN predictions by comparing particle-resolved (PR) and composition-averaged (Comp) aerosol populations under constant surface tension (CST) and effective surface tension (EST) treatments. Within this framework, PR-EST case provides the most physically detailed reference, and Comp-CST case represents a modal-like aerosol representation in large-scale models. We find this modal-like representation underpredicts CCN by ∼ 19 % on average relative to PR-EST reference. This bias reflects two opposing effects: neglecting surfactants suppresses activation, whereas composition averaging shifts activation in both directions depending on particle size and composition. A particle-level decomposition shows that Comp-EST modifies activation through coupled changes in hygroscopicity and surface tension that oppose each other, producing compensating shifts in particle critical supersaturation. These responses produce opposing biases across particle size ranges, with enhanced activation in Aitken mode and suppressed activation in accumulation mode. When EST is included, the remaining bias from composition averaging is substantially reduced, with Comp-EST case differing from the PR-EST reference by ∼ 6 % in domain-mean. These results demonstrate simplified aerosol schemes can produce apparently reasonable CCN predictions through compensating errors, even when underlying activation physics is misrepresented. Incorporating effective surface tension therefore offers a practical pathway to reduce structural biases in large-scale models.
- Article
(5684 KB) - Full-text XML
- BibTeX
- EndNote


Cloud condensation nuclei (CCN) exert a strong influence on cloud microphysical properties, radiative forcing, and the hydrological cycle (IPCC, 2021), making accurate CCN prediction a long-standing objective of aerosol-climate modeling. Despite decades of development, aerosol-cloud interactions remain one of the largest sources of uncertainty in climate projections (Riipinen et al., 2011; Rosenfeld et al., 2014; He et al., 2015; Seinfeld et al., 2016). A central challenge is the representation of aerosol particle size, composition, and mixing state in large-scale models, which must rely on highly simplified descriptions of an inherently heterogeneous particle population.
Most global and regional aerosol-climate models diagnose CCN concentrations using κ-Köhler theory (Petters and Kreidenweis, 2007) applied to composition-averaged aerosol modes or bins, assuming constant surface tension of water and neglecting particle-scale variability (Neale et al., 2010; Liu et al., 2012). This approach collapses a wide distribution of particle sizes and compositions into a small number of internally mixed modes, trading physical realism for computational tractability. Surprisingly, despite these simplifications, modeled CCN concentrations often agree with observations to within a factor of order unity at fixed supersaturation, particularly in aged or regionally averaged aerosol populations (Moore et al., 2008; Hallquist et al., 2009; Petters et al., 2016; Lowe et al., 2016). This apparent success suggests that simplified aerosol schemes may reproduce CCN concentrations through compensating errors. However, the physical origin of such compensation, particularly the interaction between hygroscopicity, surface tension, and composition averaging, has not been systematically examined.
Previous work has shown that composition averaging alone can introduce compensating errors in CCN predictions (Ching et al., 2017). When particle composition is homogenized within a size mode, some particles experience reduced critical supersaturation and become CCN active, while others experience increased critical supersaturation and fail to activate. The net CCN error is therefore the aggregate result of particle-level gains and losses across the activation threshold. In some cases, these opposing contributions partially cancel, yielding modest bulk CCN errors even when individual particle activation behavior is substantially altered. This mechanism highlights that CCN agreement at the population level may mask significant misclassification at the particle level.
At the same time, laboratory and field studies have demonstrated that surface-active organic compounds can modify CCN activation by reducing droplet surface tension (Gill et al., 1983; Cruz and Pandis, 1998; Sareen et al., 2013; Nozière et al., 2014; Bzdek et al., 2020), an effect not captured by standard κ-Köhler theory. Effective surface tension (EST) approaches have been proposed to represent this pathway within Köhler theory by accounting for organic surface coverage and liquid-liquid phase separation (Ovadnevaite et al., 2017; Xu et al., 2026a). These studies consistently show that surfactants can enhance CCN activation, particularly for particles near the activation threshold. However, surfactant effects are almost universally neglected in global aerosol-climate models, which continue to rely on constant surface tension (CST) assumptions.
From a laboratory and process-level perspective, inclusion of surfactant effects in CCN parameterizations is well motivated. However, large-scale aerosol-climate models do not resolve individual particles but instead represent aerosol populations using internally mixed modes with averaged composition. In such a framework, composition averaging may already introduce compensating biases in CCN activation. Incorporating surfactant effects without simultaneously restoring particle-level compositional variability can therefore alter this balance, potentially degrading apparent agreement with observations despite improving the underlying physical representation.
Crucially, composition averaging and surfactant effects influence CCN activation through distinct and, in some regimes, opposing physical mechanisms. Composition averaging homogenizes chemical composition within a size mode, redistributing hygroscopic and less hygroscopic components among particles. This tends to increase κ for initially organic-rich particles while decreasing κ for initially inorganic-rich particles, thereby shifting critical supersaturation in opposing directions (Ching et al., 2012; Yao et al., 2022). In contrast, neglecting surfactant effects implicitly assumes higher surface tension, raising critical supersaturation and suppressing activation (Nozière et al., 2014; Ruehl et al., 2016; Ovadnevaite et al., 2017). The interaction between these two simplifications has not been systematically examined, particularly in realistic aerosol populations with a mixing state between the external and internal limits.
In this study, we use output from a regional-scale, particle-resolved aerosol simulation (WRF-PartMC) over California (Curtis, 2019) to examine how CCN biases arise when large-scale model simplifications are applied to a heterogeneous aerosol population. Within our framework, the particle-resolved EST case represents the most physically detailed reference, whereas the composition-averaged CST case serves as an analogue for the modal-like aerosol representations commonly used in large-scale models. Although the EST treatment remains semi-empirical and therefore idealized (Ovadnevaite et al., 2017), it provides the most physically explicit representation of surfactant effects available within the present modeling framework. We therefore treat the particle-resolved EST case as a best-effort reference within the present framework, while noting that the EST treatment is itself idealized and should not be interpreted as a complete description of interfacial thermodynamics. Its core value lies in allowing us to isolate how including versus omitting those effects changes CCN bias in simplified aerosol representations. The comparison between these two end members therefore provides the most directly relevant measure of model bias.
To interpret the origin of this bias, we further decompose the problem using intermediate comparisons that separately isolate the effects of neglected surfactant physics and composition averaging. This framework allows us to determine not only whether composition-averaged representations differ from the particle-resolved EST reference, but also which missing processes contribute most strongly to the discrepancy. By linking particle-level shifts in critical supersaturation to bulk CCN errors across aerosol size ranges and mixing states, we show that small aggregate CCN errors can coexist with substantial structural biases in the underlying activation physics, and that surfactant effects can substantially alter the balance of errors in simplified aerosol representations.
In this section, we define the aerosol representations used to isolate the effects of surfactant physics and composition averaging on CCN activation (Fig. 1). The starting point is a particle-resolved aerosol population obtained from a WRF-PartMC simulation, in which each particle has an explicitly simulated dry diameter and chemical composition reflecting emissions, mixing, and aging processes. Within this framework, CCN activation is diagnosed using either a constant surface tension (CST) assumption or an effective surface tension (EST) treatment that accounts for surfactant-induced reductions in droplet surface tension.
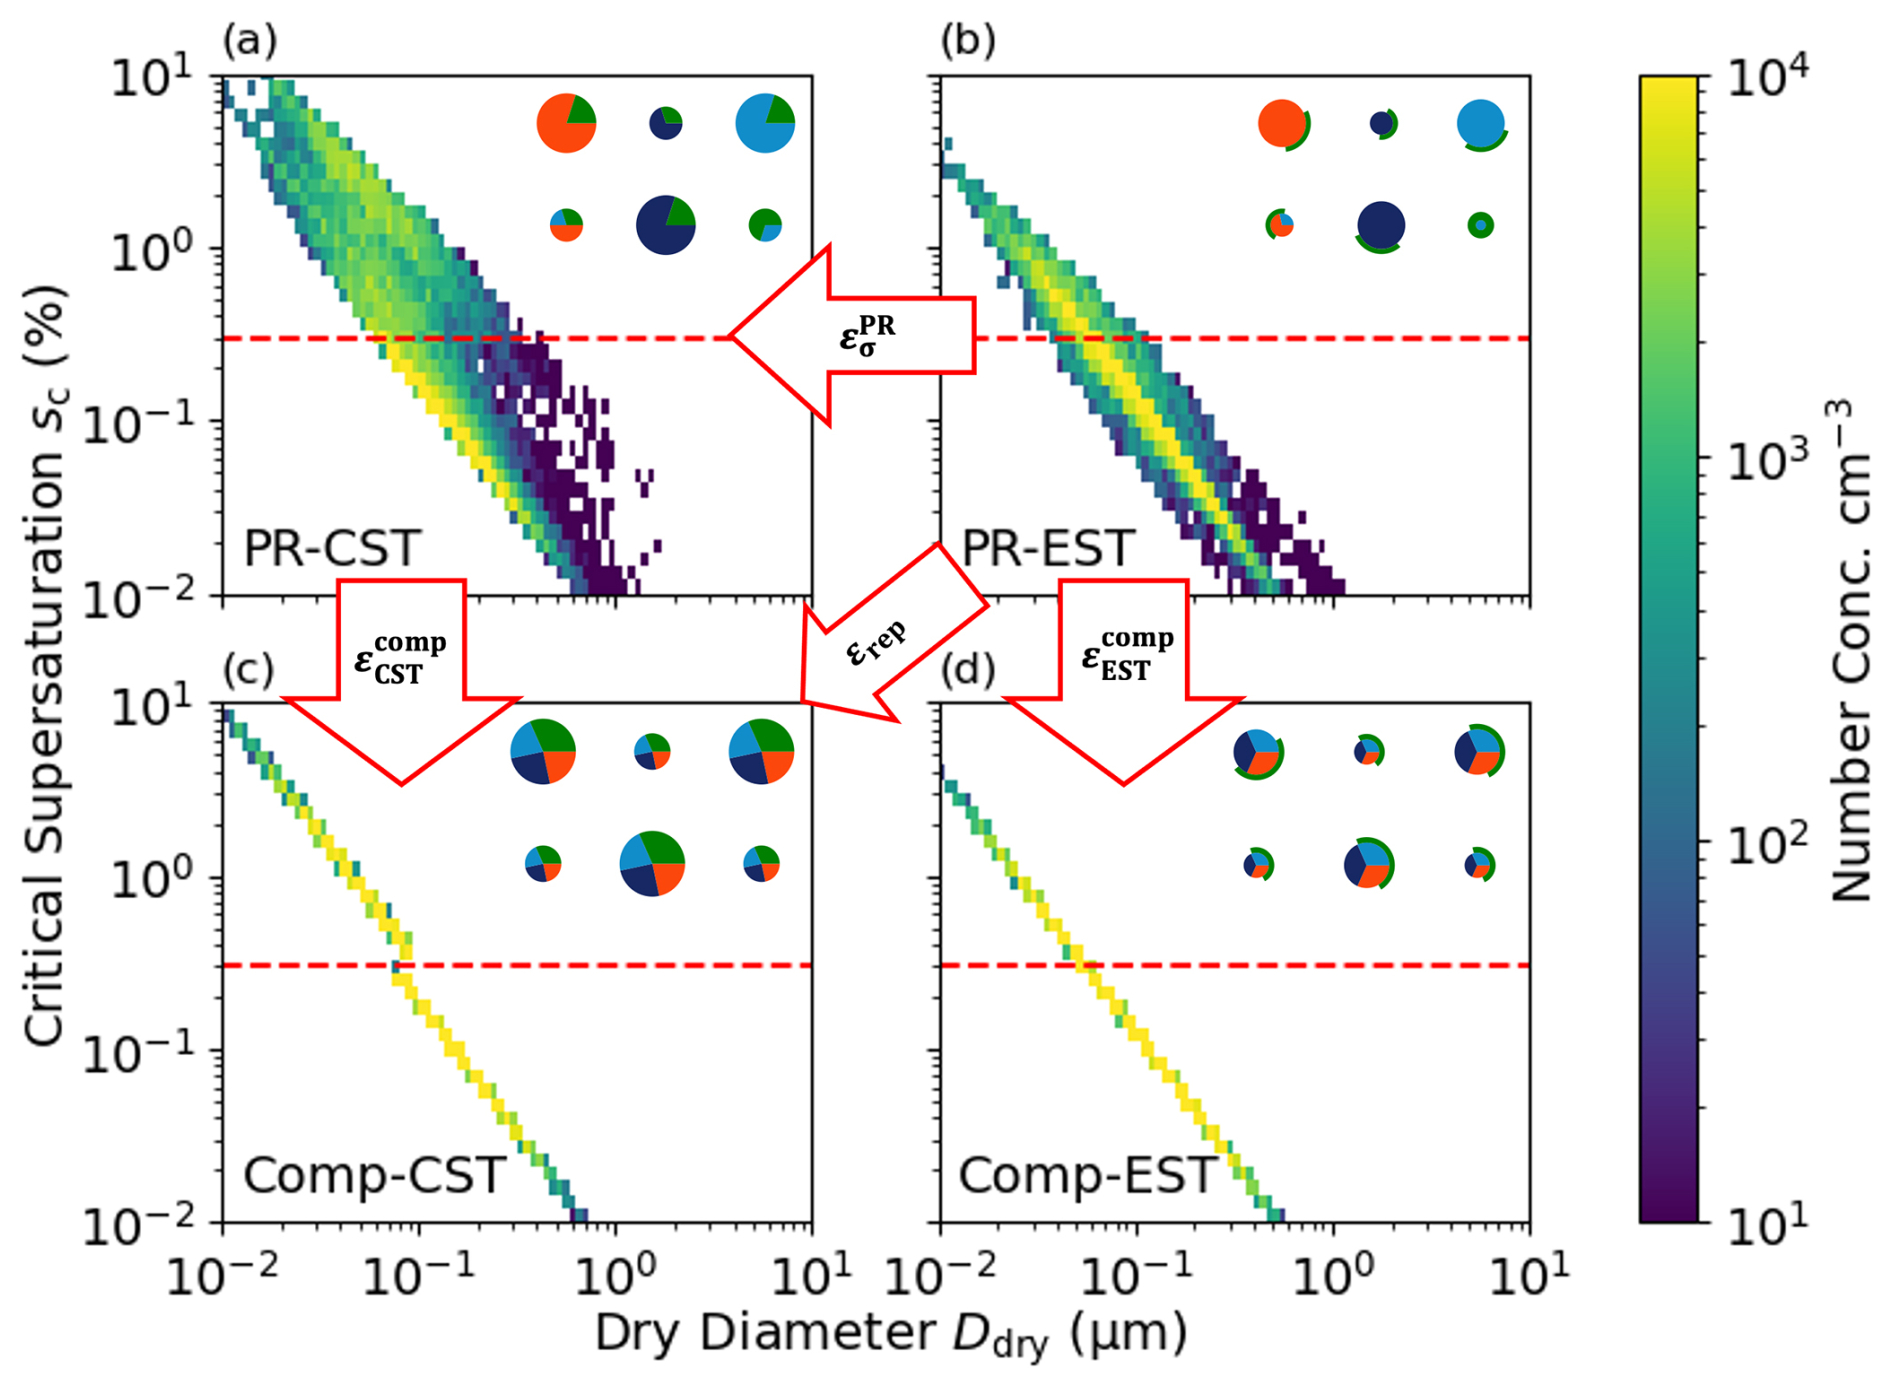
Figure 1Schematic of the four aerosol representations considered in this study. The top row shows particle-resolved (PR) cases under constant surface tension (PR-CST, a) and effective surface tension (PR-EST, b). The bottom row shows composition-averaged (Comp) cases under constant surface tension (Comp-CST, c) and effective surface tension (Comp-EST, d). The red dashed line indicates the prescribed environmental supersaturation (0.3 %) used to diagnose CCN activation; particles with critical supersaturation below this threshold are classified as CCN-active. The schematic particles in the upper-right corner of each panel illustrate how individual aerosols are represented under each scenario: green denotes organic material and the other colors denote the inorganic species. Horizontal comparisons isolate surfactant effects, vertical comparisons isolate the impact of composition averaging, and the diagonal comparison between PR-EST and Comp-CST represents the bias of a modal-like representation relative to the particle-resolved reference.
The top row of Fig. 1 represents particle-resolved cases: PR-CST (panel a) and PR-EST (panel b). We treat PR-EST as the best-effort physical reference available within our framework and therefore use it as the reference for evaluating simplified cases. We note that the EST treatment is itself idealized and may overestimate surface tension reduction in cases where organic material does not fully partition to the droplet interface (Sorjamaa et al., 2004; Prisle et al., 2008; Bzdek et al., 2020). The PR-CST case isolates the impact of neglecting surfactant effects while retaining full particle-level compositional variability. The bottom row represents composition-averaged cases in which particle compositions are homogenized within size ranges. Applying composition averaging under the CST assumption (Comp-CST, panel c) serves as an analogue to modal or sectional aerosol representations used in large-scale models. Composition averaging combined with EST (Comp-EST, panel d) represents a scenario in which surfactant effects are incorporated within a composition-averaged framework. The red dashed line indicates the prescribed environmental supersaturation (0.3 %) used to diagnose CCN activation; particles with critical supersaturation below this threshold are classified as CCN-active. We choose 0.3 % as a representative supersaturation for polluted continental conditions and because it provides a useful threshold for illustrating particle-level gains and losses in CCN activation (Pruppacher et al., 1998; Andreae and Rosenfeld, 2008). Together, these four representations form a two-dimensional design in which horizontal comparisons isolate surface tension effects and vertical comparisons isolate the impact of composition averaging. The resulting differences are quantified as relative CCN biases in Sect. 3. In particular, the diagonal comparison between PR-EST and Comp-CST quantifies the bias introduced by a modal-like representation relative to the particle-resolved reference.
2.1 Effective Surface Tension (EST) Framework
To account for surfactant effects, we adopt a semi-empirical effective surface tension (EST) approach described by Ovadnevaite et al. (2017) and implemented in PartMC-MOSAIC by Xu et al. (2026a). This method assumes liquid-liquid phase separation (LLPS) where an inorganic core (α) is partially or fully covered by an organic-rich shell (β). The effective surface tension σ(D) is calculated as a blend of the inorganic and organic phase tensions based on the fractional surface coverage Cβ:
where σα and σβ are the surface tensions of the inorganic and organic phases, respectively. The fractional surface coverage Cβ is computed individually for each particle from its simulated composition. Assuming that the entire organic volume of a particle partitions to the shell phase β under LLPS, and that a complete film requires a minimum shell thickness δmin, the surface coverage of a droplet with wet diameter D is
where Vβ is the organic-phase volume of the particle, and Vδ(D) is the volume of a spherical shell of thickness δmin. Particles containing enough organic material to sustain a complete film are fully covered (Cβ=1, σ=σβ). Because Vβ differs from particle to particle, organic-rich particles reach full coverage (Cβ=1) while organic-poor particles are only partially covered; and because Vδ(D) grows as the droplet takes up water, Cβ and hence σ(D) also vary along each particle's Köhler curve. Following Ovadnevaite et al. (2017), we use σβ=30 mN m−1 and nm.
Within the κ-Köhler framework (Petters and Kreidenweis, 2007), the EST enters by replacing the constant water surface tension with the composition-dependent σ(D) in the Kelvin term:
Full details on the implementation in PartMC-MOSAIC and sensitivity tests regarding σβ and δmin are provided in Xu et al. (2026a).
2.2 Composition Averaging and Size Ranges
To simulate the simplification used in modal or sectional aerosol schemes, we apply a composition averaging mapping (Zaveri et al., 2010; Ching et al., 2012). The aerosol population is partitioned into three size regimes based on dry diameter d: Aitken mode (10–100 nm), accumulation mode (100 nm–1 µm), and coarse mode (>1 µm). Within each size range, the chemical composition of individual particles is homogenized. This mapping preserves the original dry diameter d of each particle but replaces its specific species distribution with the mode-average composition. This procedure reduces particle-to-particle compositional variability within each mode, allowing us to isolate the resulting shifts in critical supersaturation sc. The detailed mathematical derivation of this averaging procedure is described in Ching et al. (2012).
2.3 Mixing State Index (χ)
We use the mixing state index χ (Riemer and West, 2013) as a diagnostic tool to quantify the distribution of chemical species across the population. χ is defined as the ratio of average per-particle species diversity (Dα) to the bulk population diversity (Dγ):
A value of χ=0 % represents a fully external mixture, while χ=100 % indicates a perfectly internal mixture. The selection of species for computing χ can depend on specific research objectives, such as elemental composition (O'Brien et al., 2015) or hygroscopicity components (Ching et al., 2017; Hughes et al., 2018). In this study, χ is computed based on hygroscopic and non-hygroscopic components. For each grid cell, Dα and Dγ are evaluated from the per-particle species masses in the WRF-PartMC output (Sect. 2.4), giving one value of χ per grid cell. The index is used only as a diagnostic to interpret CCN prediction errors and does not enter the activation calculations directly.
2.4 WRF-PartMC Simulation Data
All analyses in this study are based on the per-particle output of a single regional-scale, particle-resolved simulation using WRF-PartMC (Curtis, 2019). For each simulated particle, this output provides its dry diameter, per-species mass, and number concentration, from which all quantities reported here (e.g., κ, sc, CCN concentrations, and χ) are derived. The simulation covers a California domain at 4×4 km horizontal resolution. We examine a representative near-surface snapshot at 12:00 LST, 18 June 2010, focusing on land grid cells to capture variability in anthropogenic emissions and aerosol mixing state. WRF-PartMC explicitly tracks the evolution of individual particles through emission, coagulation, transport, and multiphase partitioning of semi-volatile species, providing the heterogeneous particle populations needed for the present CCN analysis. Although this partitioning is treated dynamically within the simulation, our CCN calculations are based on the fixed snapshot and assume that dry particle composition does not change during activation. In particular, the additional co-condensation of semi-volatile and intermediate-volatility organics that can occur as relative humidity increases toward activation is not represented. Such co-condensation would add organic mass to the growing droplets, increasing both the soluble and the surface-active material at the droplet surface (Topping et al., 2013; Serrano Damha et al., 2024), and because it preferentially raises the organic fraction, its neglect most plausibly leads the surfactant-related CCN differences reported here conservative. The simulation used here should be interpreted as a process-level case study rather than a climatological evaluation. In particular, new particle formation and biogenic secondary organic aerosol are not included in the simulation. Full details on the meteorological setup, emission inventory, gas-phase chemistry and aerosol thermodynamics are provided in Curtis (2019).
The Results section proceeds from mechanism to manifestation. We first show how composition averaging redistributes particles across the activation threshold under CST and EST assumptions, then use a κ-σ decomposition to explain the resulting compensation at the particle level. We finally demonstrate how these competing responses translate into bulk CCN biases, including the model-relevant bias of a modal-like representation relative to the particle-resolved reference, and how these biases depend on aerosol mixing state.
3.1 Composition averaging under CST: particle-level origin of CCN error
We first isolate the impact of composition averaging while retaining the constant surface tension (CST) assumption. The analysis shown in Fig. 2 is based on a representative near-surface grid cell from the WRF-PartMC simulation, selected to illustrate particle-level behavior in a polluted coastal region. This comparison separates the structural effect of homogenizing particle composition within size ranges from any surfactant-related changes in surface tension. Figure 2 presents a two-dimensional histogram comparing the particle-level critical supersaturation sc in the particle-resolved CST case (PR-CST, x-axis) and the composition-averaged CST case (Comp-CST, y-axis).
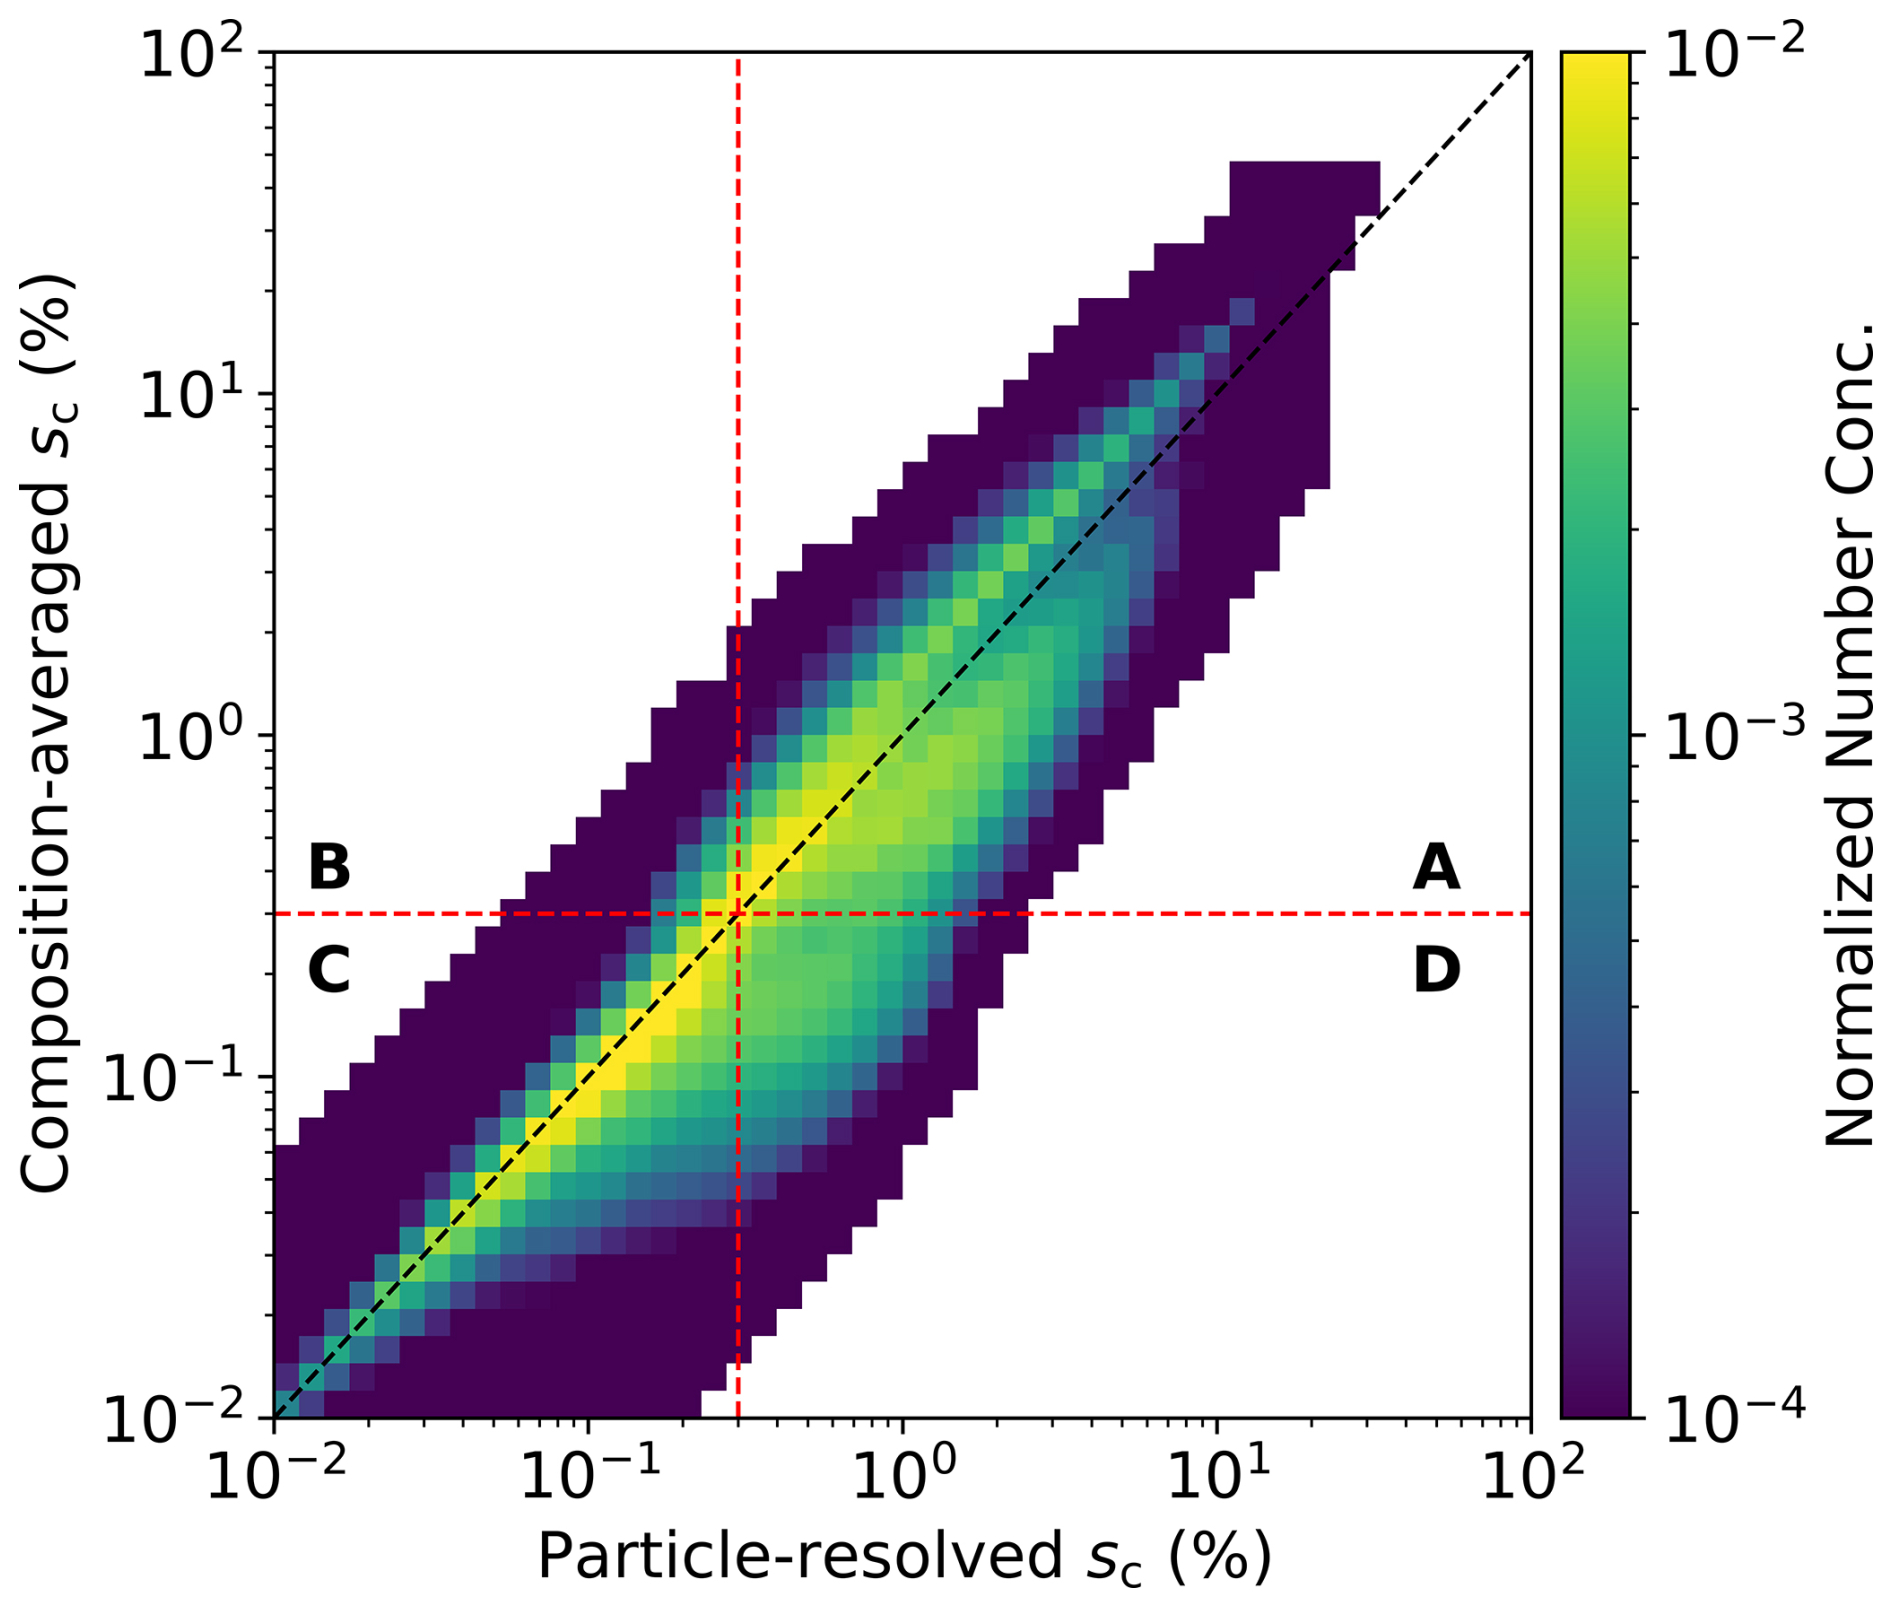
Figure 2Two-dimensional histogram of particles' critical supersaturations before and after composition averaging under the constant surface tension (CST) assumption. The dashed black line shows the 1:1 relationship. Red dashed lines indicate the environmental supersaturation threshold senv=0.3 % used to diagnose CCN activity. Quadrants A and C represent particles that remain inactive or active, respectively, while quadrant B denotes CCN losses and quadrant D denotes CCN gains induced by composition averaging.
The dashed 1:1 line separates particles whose critical supersaturation increases after composition averaging (points above the line) from those whose critical supersaturation decreases (points below the line). To diagnose CCN activation, we impose an environmental supersaturation threshold senv of 0.3 % (red dashed lines), chosen as a representative polluted continental supersaturation and because it places both Aitken and accumulation particles near the activation threshold. Particles to the left of the vertical line activate in the particle-resolved reference case, and particles below the horizontal line activate in the composition-averaged case.
This partition defines four quadrants (Ching et al., 2017). Particles in quadrant A remain inactive in both cases, while particles in quadrant C activate in both cases. These particles do not contribute to bulk CCN bias despite shifts in their critical supersaturation. In contrast, quadrant B contains particles that activate in the reference case but not after composition averaging (CCN losses), and quadrant D contains particles that activate after composition averaging but not in the reference case (CCN gains). The net CCN bias under CST is therefore determined by the imbalance between particle gains (quadrant D) and losses (quadrant B), consistent with Ching et al. (2017), who found that composition averaging generally leads to CCN overestimation except at very low supersaturation thresholds.
This gain-loss framework establishes that bulk CCN bias arises from threshold-crossing behavior at the particle level. We next examine how this balance is modified when surfactant effects alter critical supersaturation through changes in surface tension.
3.2 Composition averaging under EST: modified gain-loss balance
We next examine composition averaging within the effective surface tension (EST) framework. Figure 3 shows the corresponding sc-sc comparison between the particle-resolved EST reference (PR-EST, x-axis) and the composition-averaged EST case (Comp-EST, y-axis). As in the CST case, most particles cluster near the 1:1 line, and the same environmental supersaturation threshold partitions the diagram into gain and loss quadrants.
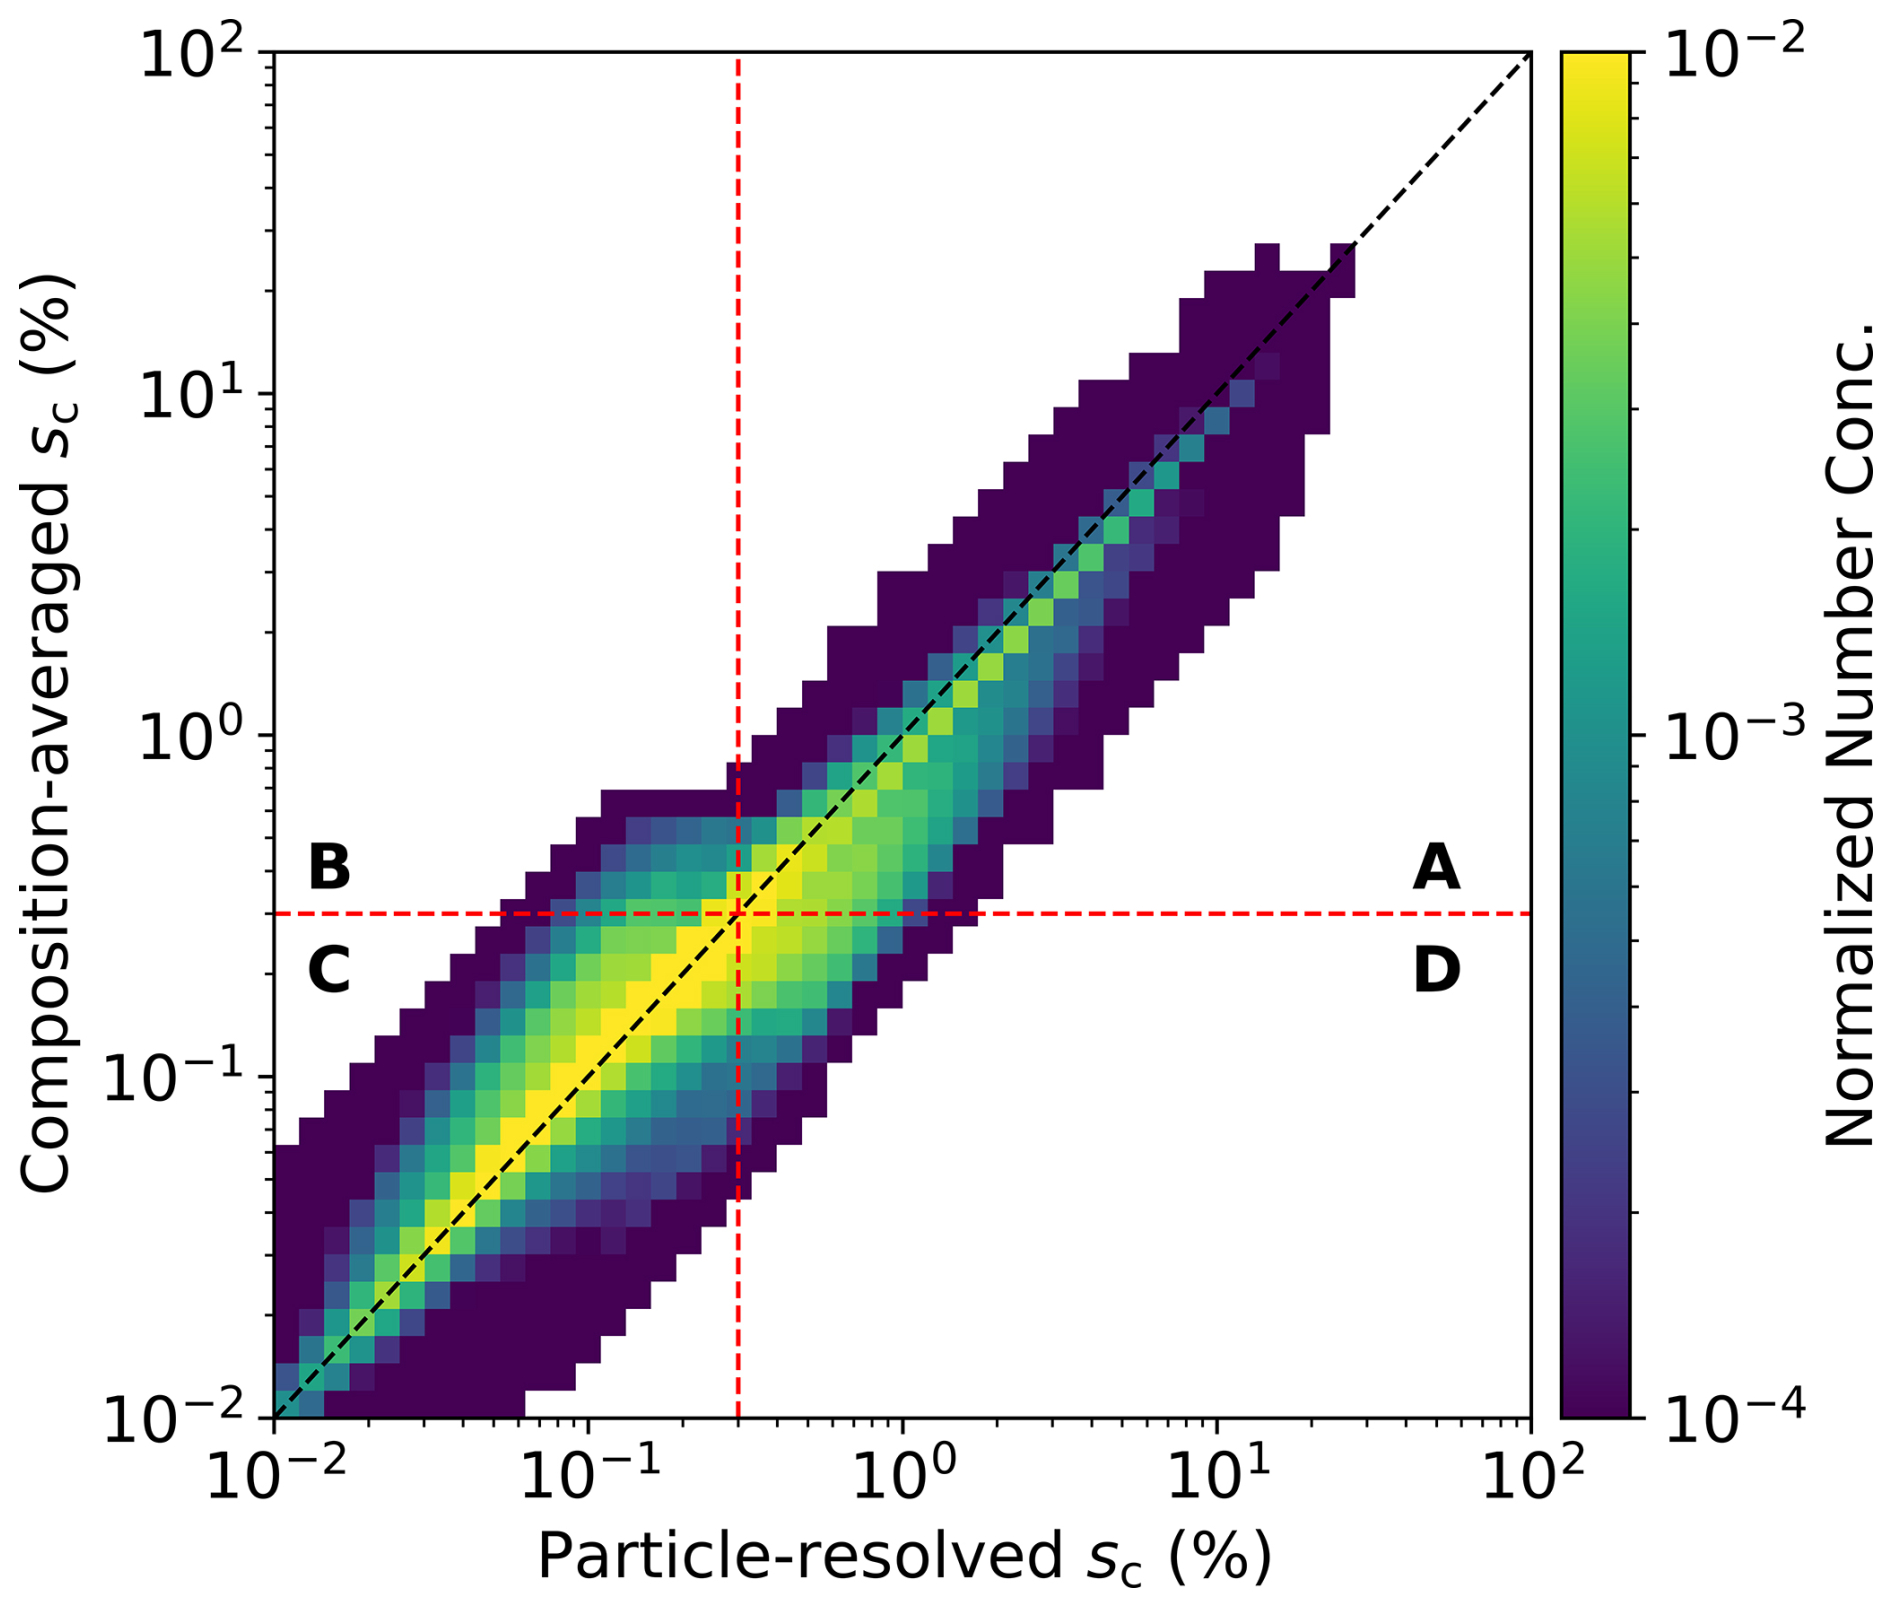
Figure 3Same as Fig. 2 but evaluated within the effective surface tension (EST) framework. The x-axis shows particle-resolved sc computed with EST (), and the y-axis shows sc after composition averaging, also evaluated with EST (). The dashed black 1:1 line and red dashed senv=0.3 % threshold define the same gain-loss quadrants as in Fig. 2.
Because surface tension now depends on composition and organic surface coverage, changes in sc are no longer governed solely by shifts in hygroscopicity. The combined influence of κ and σ modifies the distribution of particles relative to the activation threshold. Compared to the CST case mapping, the imbalance between CCN losses (quadrant B) and gains (quadrant D) is reduced. In other words, when activation is evaluated under EST, composition averaging produces a smaller net gain-loss asymmetry than under CST. This behavior indicates that the CCN bias introduced by composition averaging depends on the assumed surface tension framework.
To clarify the origin of this redistribution, we next quantify how changes in hygroscopicity (κ) and surface tension (σ) jointly influence critical supersaturation through Δln sc.
3.3 Mechanistic decomposition: κ-σ competition in Δln sc
To understand why composition averaging produces a smaller net CCN bias under EST than under CST, we examine how changes in hygroscopicity and surface tension jointly influence critical supersaturation at the particle level. The κ-Köhler analytical approximation provides a convenient scaling framework for separating these contributions.
Starting from the κ-Köhler analytical approximation (Petters and Kreidenweis, 2007),
which holds for small supersaturation (sc≪1), we obtain the logarithmic sensitivity
This expression provides a first-order sensitivity of critical supersaturation to changes in hygroscopicity and surface tension and is used here to interpret the dominant mechanisms driving particle-level shifts in activation.
For perturbations at fixed dry diameter d, this simplifies to
For each particle j, composition averaging under EST modifies both hygroscopicity and effective surface tension. Relative to the particle-resolved EST reference state, we define
where the superscripts “PR” and “comp” denote particle-resolved and composition-averaged populations, respectively, both evaluated with EST.
Substituting these perturbations into Eq. (7) yields the particle-level decomposition
so that the predicted total response becomes
This formulation explicitly separates the EST-consistent perturbation into thermodynamic (surface tension) and hygroscopic (κ) contributions.
Figure 4 visualizes this competition by plotting on the x-axis and on the y-axis for all particles, as well as separately for Aitken and accumulation modes. The origin represents no change in activation properties. Positive values correspond to an increase in critical supersaturation and thus suppressed activation, whereas negative values decrease supersaturation and thus enhance activation.
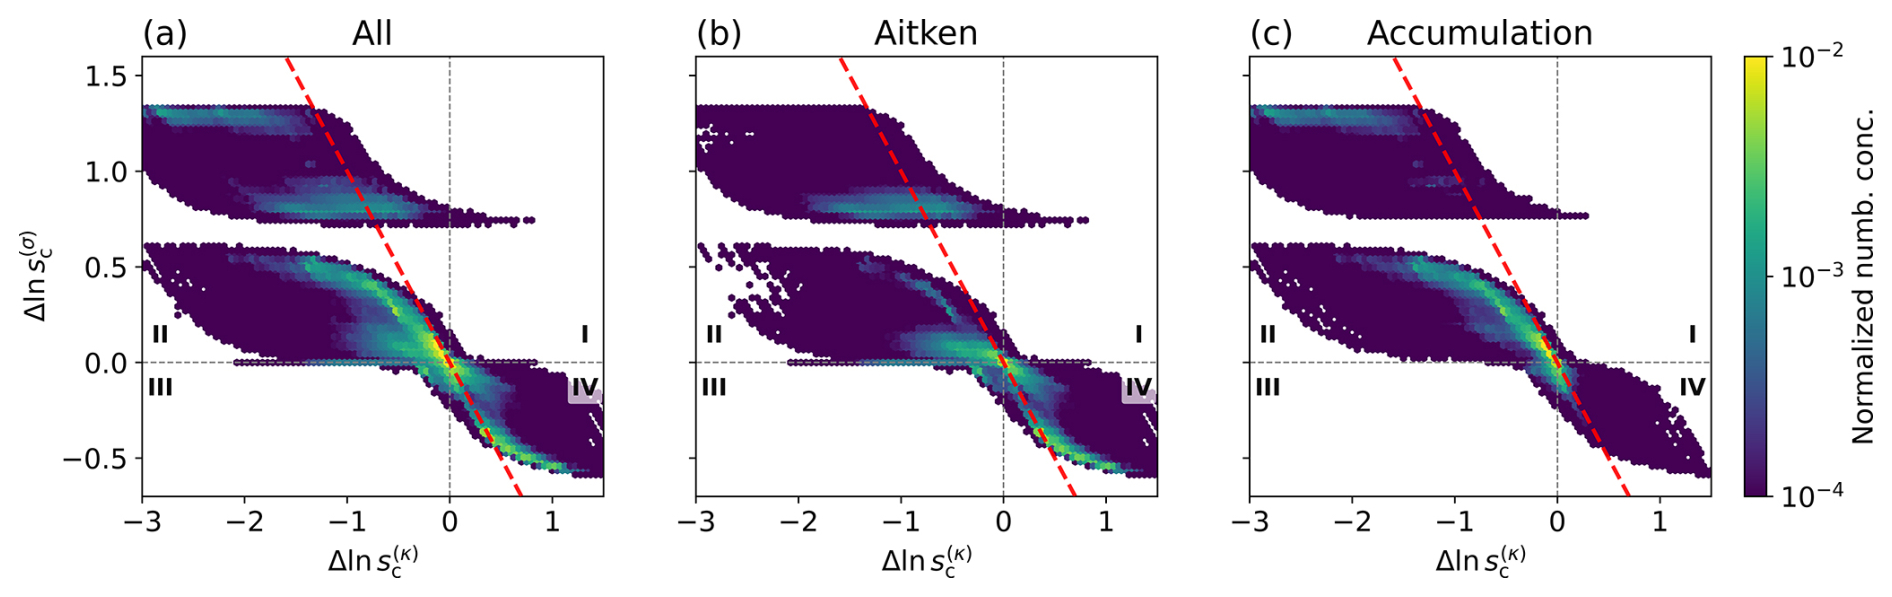
Figure 4Particle-level decomposition of changes in critical supersaturation induced by composition averaging under the EST framework, with the x-axis showing the hygroscopicity contribution and the y-axis showing the surface tension contribution (Eq. 7). Colors indicate the normalized particle number concentration. The origin corresponds to no change in activation properties; positive (negative) values indicate an increase (decrease) in sc and thus suppressed (enhanced) activation. The four quadrants identify regimes where κ and σ effects reinforce (Quadrants I and III) or compensate (Quadrants II and IV). The red dashed line marks , where the κ and σ contributions exactly compensate and the net change in ln sc is zero. Panels show all particles and mode-separated subsets (Aitken and accumulation), highlighting the mode-dependent weighting of the compensating regime.
The four quadrants correspond to distinct physical regimes:
-
Quadrant I (reinforcing suppression): both κ and σ contributions increase sc and suppress activation.
-
Quadrant II (compensation): hygroscopicity promotes activation while surface tension suppresses it.
-
Quadrant III (reinforcing activation): both mechanisms promote activation.
-
Quadrant IV (reverse compensation): surface tension promotes activation while hygroscopicity suppresses it.
When considering all particles together, the compensating regimes (Quadrants II and IV) dominate the distribution, indicating that κ and σ contributions frequently oppose each other. The predominance of compensating regimes reflects the dual role of organic material in CCN activation. Increasing organic fraction simultaneously reduces hygroscopicity (lower κ) and reduces surface tension, producing opposing contributions to the critical supersaturation. This predominance of compensating particle-level responses foreshadows the modal and spatial error cancellation seen in the bulk CCN fields below.
When separated by size mode, the dominant compensating configuration differs. Aitken particles are more frequently found in Quadrant IV, whereas accumulation particles preferentially occupy Quadrant II. This mode-dependent partitioning reflects differences in the internal composition variability within each mode and how composition averaging redistributes organic and inorganic material across particles.
3.4 From particle-level competition to bulk εCCN: spatial patterns and mode dependence
Section 3.1–3.3 established the particle-level mechanisms that govern CCN biases. Composition averaging redistributes particles across the activation threshold (Sect. 3.1), while surfactant-induced surface tension changes introduce an additional response that competes with hygroscopicity (Sect. 3.2). The κ-σ decomposition further showed that these contributions frequently act in opposition at the particle level (Sect. 3.3). We now examine how these mechanisms manifest in bulk CCN biases across the WRF-PartMC domain.
The error metrics reported here refer to CCN concentrations (εCCN), not directly to cloud droplet number concentration (CDNC). CCN represents the particles that can activate at a specified supersaturation, whereas CDNC represents the number of droplets that actually form in a cloud parcel. In rising cloud parcels the peak environmental supersaturation adjusts to aerosol loading and composition, which partially buffers CDNC against CCN uncertainties. For example, Ervens et al. (2010) showed that a twofold uncertainty in CCN typically produces only about a 15 % change in CDNC. The CCN errors quantified below should therefore be regarded as an upper bound on potential CDNC impacts, while still providing process-level evidence of how surfactants may bias simulated aerosol-cloud interactions.
Before quantifying regional CCN biases, we first summarize the spatial context of the WRF-PartMC case. Figure 5 shows the near-surface total particle number concentration and CCN activation fraction for the land grid cells analyzed in this study. These fields highlight the pronounced contrast between polluted coastal regions and cleaner inland areas, which provides an important background for interpreting the regional error patterns associated with composition averaging and surfactant effects.
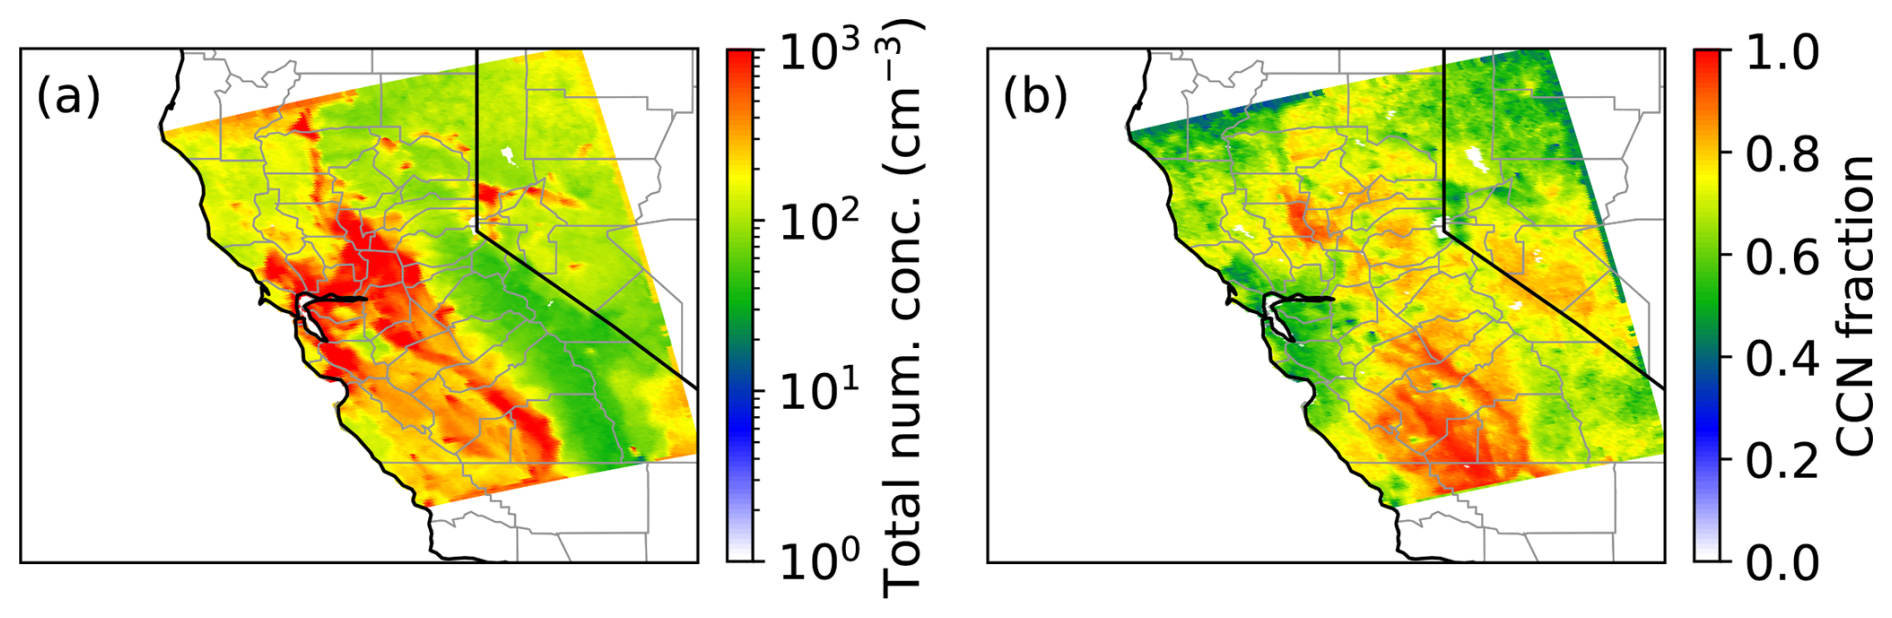
Figure 5Spatial context of the WRF-PartMC case over California (12:00 LST, 18 June 2010) for the land grid cells analyzed in this study. Panel (a) shows the near-surface total particle number concentration, and panel (b) shows the CCN activation fraction at senv=0.3 %.
3.4.1 Domain-wide CCN biases
We now turn to the central model-relevant question: how large is the CCN bias introduced by the modal-like aerosol representation commonly used in large-scale models? In this study, all relative differences ε are defined such that negative values indicate underprediction relative to the reference and positive values indicate overprediction. Based on Fig. 1, our primary metric (Eq. 13) is the diagonal comparison between the composition-averaged CST representation and the particle-resolved EST reference, which captures the combined effect of composition averaging and the constant surface tension assumption.
This quantity represents the net bias of a modal-like aerosol treatment relative to the most physically detailed reference available in the present framework. It therefore combines the effects of two simplifications that are usually made simultaneously in large-scale models: composition averaging within size ranges and neglect of surfactant-driven surface tension reduction.
To determine which of these two simplifications contributes most strongly to εrep, we define three additional diagnostic relative differences, that isolate individual process contributions:
Here, is the relative CCN difference between the two particle-resolved cases, PR-CST and PR-EST. Since both retain full particle-level composition, it isolates the effect of surface tension alone, i.e., the CCN change caused by using CST (neglecting surfactants) instead of EST (including them). Further, quantifies the composition-averaging bias in the conventional no-film framework, and quantifies the residual composition-averaging bias once surfactant effects are included. Figure 6 shows that εrep is predominantly negative, indicating that the modal-like Comp-CST representation systematically underpredicts CCN relative to the particle-resolved EST reference. The decomposition clarifies why. The surfactant-related term is uniformly negative, with a domain-mean value of −29 %, showing that neglecting surfactant-driven surface tension reduction introduces a broad negative CCN bias. In contrast, is positive on average and reflects the particle-level gain-loss redistribution identified in the sc-sc diagrams (Sect. 3.1): composition averaging shifts particles across the activation threshold in both directions, producing a positive domain-mean bias (15 %). This positive bias is consistent with earlier findings on CCN errors introduced by composition averaging and mixing state simplification (Zaveri et al., 2010; Ching et al., 2017). The new contribution here is to show how this familiar effect interacts with surfactant-induced surface tension reduction in the full bias decomposition. Thus, the modal-like bias does not arise from a single simplification alone, but from incomplete cancellation between two biases of opposite sign.
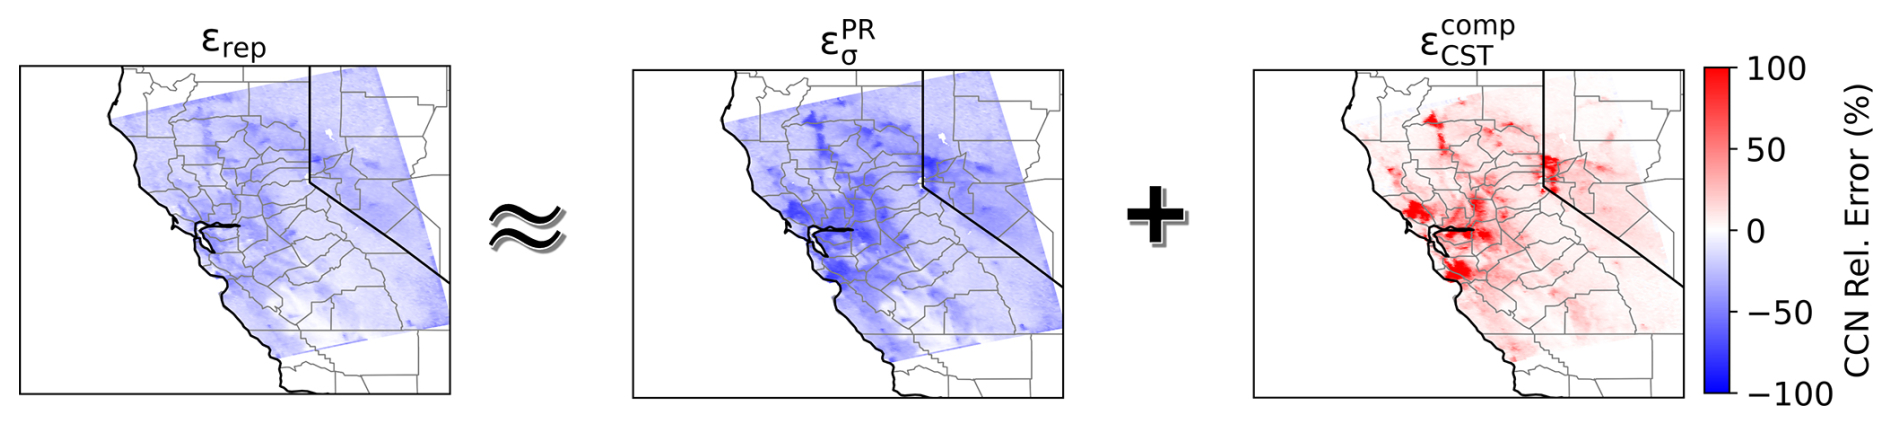
Figure 6Spatial distribution of the primary model-relevant CCN bias, εrep, and its decomposition into contributions from surfactant-induced surface tension effects () and composition averaging under constant surface tension () at senv=0.3 %.
This framing also clarifies the practical significance of Fig. 7. Compared with εrep, the residual composition-averaging bias under EST, , is much smaller, with a domain-mean value of only 6.0 % in this case study. Consistent with the particle-level κ-σ competition identified in Sect. 3.3, composition averaging under EST introduces opposing perturbations that partially compensate when aggregated to bulk CCN. In other words, once surfactant effects are represented, the remaining discrepancy associated with composition averaging alone is substantially reduced. This does not imply that the Comp-EST representation is a physically complete representation, but it does show that the apparent severity of composition-averaging error depends strongly on whether surfactant effects are omitted. Although the quantitative magnitude of this improvement depends on the adopted EST formulation, the comparison remains useful for identifying how the inclusion of surfactant effects changes the structure of CCN bias within the present framework.
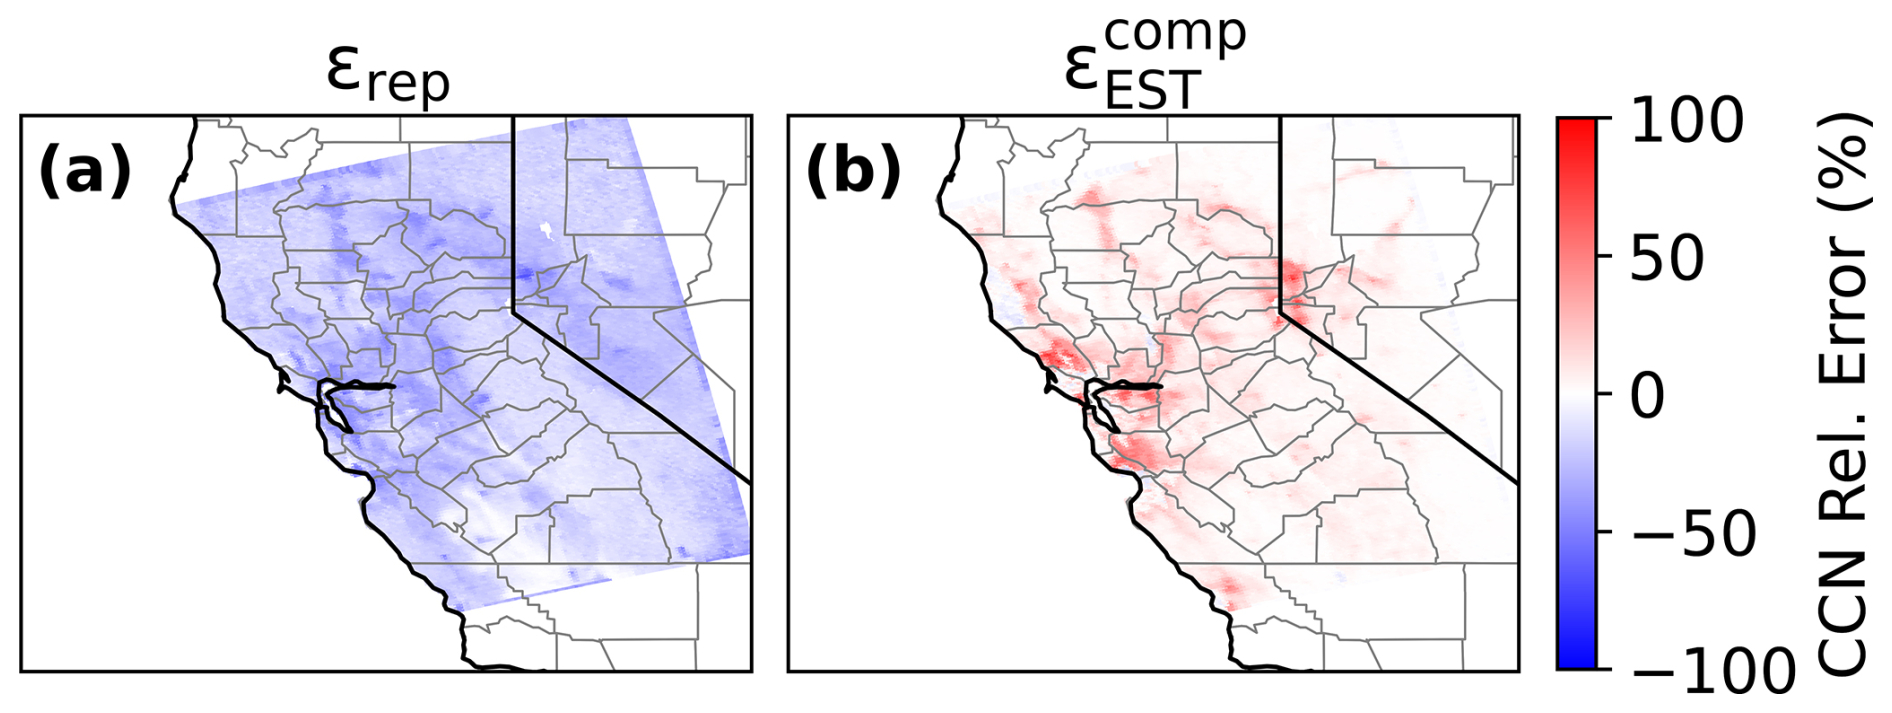
Figure 7Comparison between the primary model-relevant bias εrep and the composition-averaging-induced bias under effective surface tension, , at senv=0.3 %. This comparison isolates the residual impact of composition averaging when surfactant effects are included.
Taken together, these results lead to two conclusions: First, the negative modal-like bias arises primarily because the Comp-CST representation combines two simplifications, of which neglecting surfactant effects produces the broader and more systematic negative shift. Second, among the simplified representations examined here, Comp-EST is closest to the PR-EST reference. This finding points to effective surface tension as a promising and computationally feasible refinement for large-scale modal aerosol models, even when particle-resolved compositional variability remains unresolved.
3.4.2 Mode-resolved CCN biases
To understand why the domain-integrated modal-like bias remains negative, we next separate εrep by particle size mode. All mode-resolved relative differences are computed using the same definitions as in Sect. 3.4.1, but with CCN concentrations restricted to each mode and normalized by the corresponding mode-specific CCN in the reference case. Figure 8 shows that the Comp-CST representation underpredicts CCN relative to the PR-EST reference in both the Aitken and accumulation modes over most of the domain. However, the Aitken mode exhibits positive εrep in polluted coastal regions, indicating that composition averaging locally overcompensates the negative bias introduced by neglecting surfactant effects.
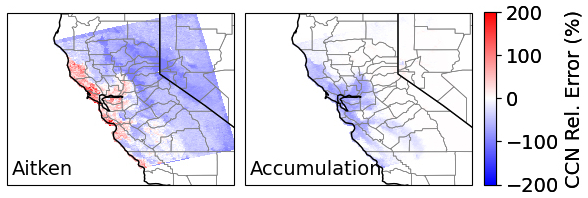
Figure 8Mode-resolved spatial patterns of the primary model-relevant CCN bias εrep at senv=0.3 %, shown separately for Aitken and accumulation modes.
Figure 9 shows how the three component error metrics behave within each size mode. This decomposition reveals that the two simplifications do not merely offset one another in the bulk, but do so in a strongly size-dependent way. Due to the limited number of coarse mode particles in this simulation, coarse mode results are not shown.
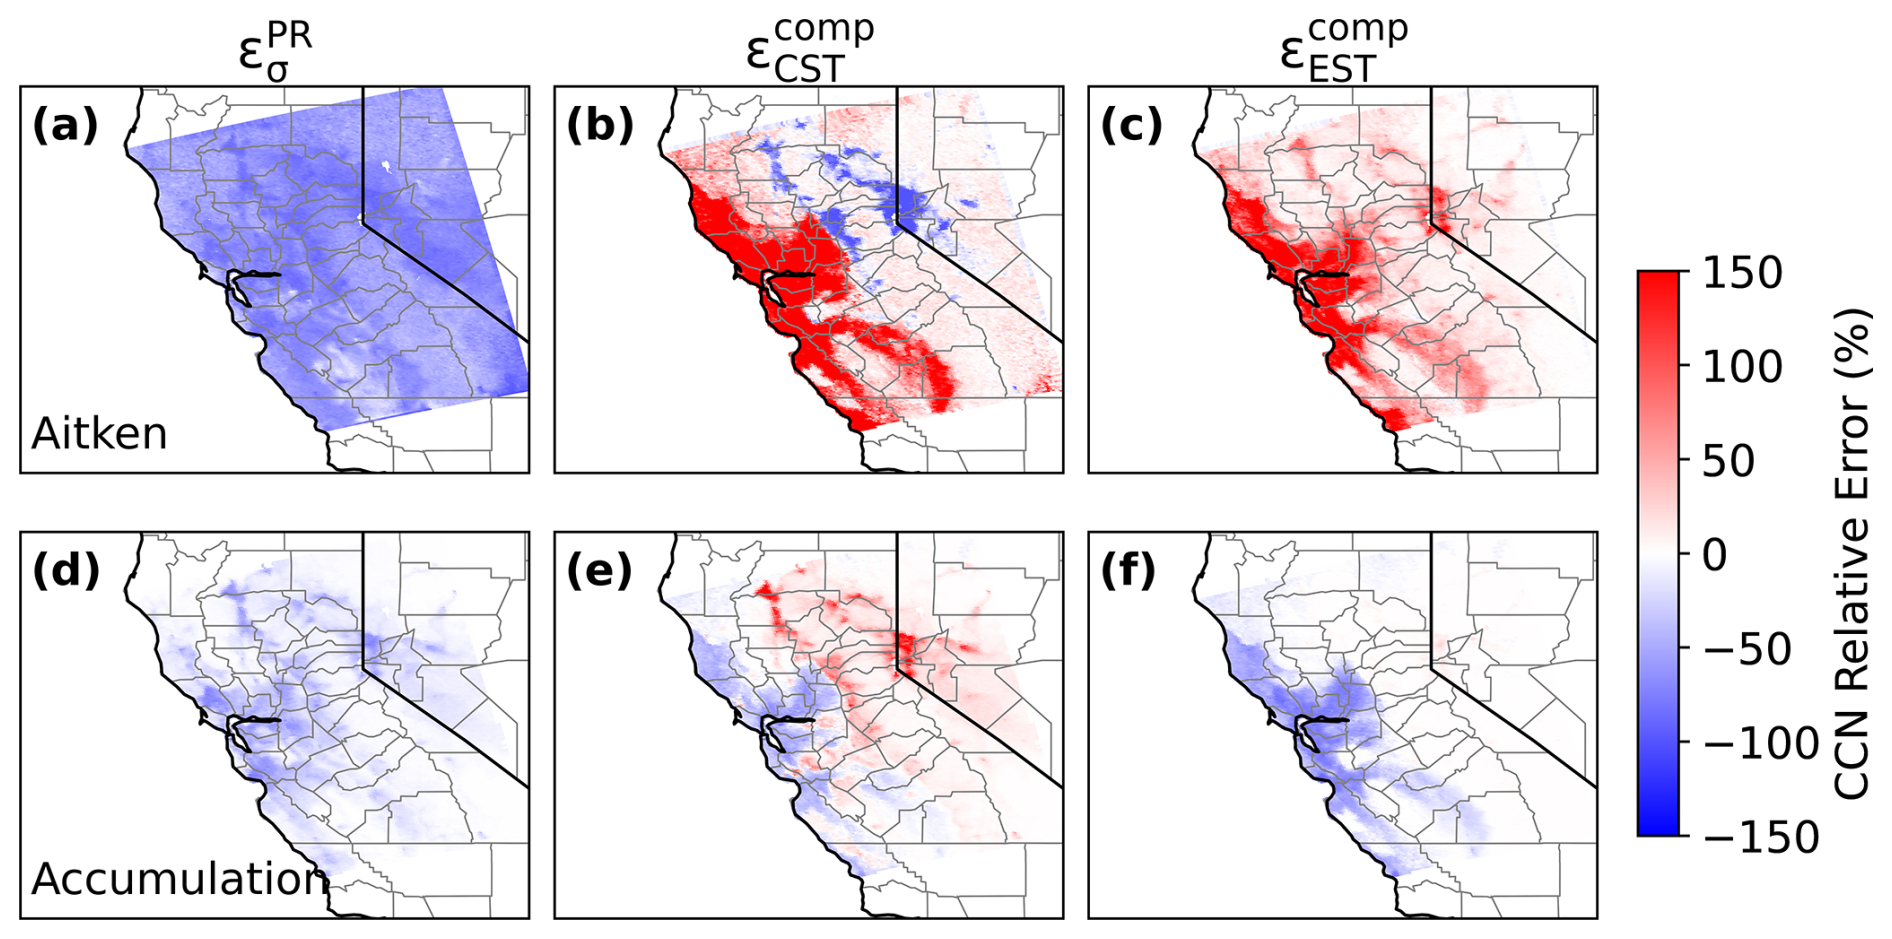
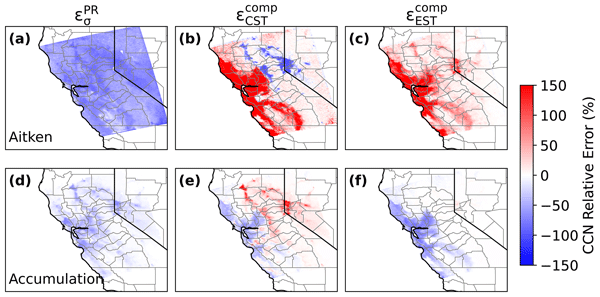
Figure 9Mode-resolved spatial patterns of CCN relative differences at senv=0.3 % for (a–c) Aitken and (d–f) accumulation particles.
For the Aitken mode (Fig. 9a–c), is consistently negative, confirming that surfactants have a stronger influence on activation for smaller particles (Xu et al., 2026a). The composition averaging bias under CST () changes sign across the domain: it is positive in polluted coastal regions but negative in many inland areas. When EST is included, however, the composition-averaging bias becomes positive throughout the domain. This indicates that, in the Aitken mode, the κ-σ competition identified in Sect. 3.3 shifts the net effect of composition averaging toward enhanced activation.
In the accumulation mode, remains negative, but is substantially smaller in magnitude than in the Aitken mode, consistent with the weaker sensitivity of larger particles to surface tension (Xu et al., 2026a). The CST composition-averaging bias, , exhibits the opposite spatial pattern from the Aitken mode, with negative values in polluted coastal regions and positive values inland. Under EST, the composition-averaging bias becomes uniformly negative.
The residual composition-averaging bias under EST, , provides the clearest view of what remains once surfactant effects are represented consistently. In the Aitken mode, is positive throughout the domain, indicating that under EST the homogenization of composition tends to shift small particles toward enhanced activation. In the accumulation mode, is uniformly negative, showing that composition averaging continues to suppress activation of larger particles even when surface tension effects are treated consistently. Thus, including EST does not remove the structural bias associated with composition averaging, but it changes its sign and magnitude in a strongly mode-dependent way. This mode-dependent behavior can be related back to Fig. 4: while the quadrants indicate the directions of the individual κ and σ contributions, the net effect on activation is determined by whether particles fall above or below the red dashed line. In the accumulation mode (panel c), particles lie predominantly above this line, indicating that the σ contribution outweighs the κ contribution, yielding a net increase in sc and thus negative .
Taken together, Figs. 8 and 9 show why apparently reasonable bulk CCN agreement between Comp-CST and PR-EST can be misleading. In polluted Aitken populations, composition averaging can offset part of the negative bias caused by neglected surfactant effects, whereas in the accumulation mode the bias remains negative. The total CCN error therefore reflects partial cancellation across modes rather than uniformly accurate activation physics. The compensation is real, but incomplete: it can improve agreement in bulk CCN while still leaving systematic size-dependent errors in the underlying activation response. In this way, the mode-resolved analysis reinforces the central result of the paper: simplified aerosol representations can benefit from compensating errors, but those compensations do not guarantee physically correct CCN predictions. More broadly, this result suggests caution in interpreting apparently good bulk CCN agreement with observations, since compensating structural errors may mask process-level biases in the underlying activation representation.
3.5 Mixing state dependence of CCN prediction errors
The preceding sections showed that CCN biases arise from particle-level κ-σ competition and modal error compensation. We now examine how these effects depend on aerosol mixing state. This diagnostic links the structural simplifications examined above to a widely used metric of aerosol population heterogeneity (Bondy et al., 2018; Yu et al., 2020).
Figure 10 shows the spatial distribution of χ across the near-surface land grid cells. The lowest values of χ, corresponding to the most externally mixed aerosol populations (with respect to hygroscopic and non-hygroscopic species), occur primarily in polluted coastal regions, whereas inland regions tend to exhibit higher χ and thus more internally mixed aerosol. This pattern is physically plausible: near source regions, freshly emitted particles from different sources remain more compositionally distinct, whereas farther inland atmospheric aging and condensational processing drive the population toward a more internally mixed state. This spatial structure helps explain why the strongest CCN sensitivities to composition averaging and surfactant effects are concentrated near source regions.
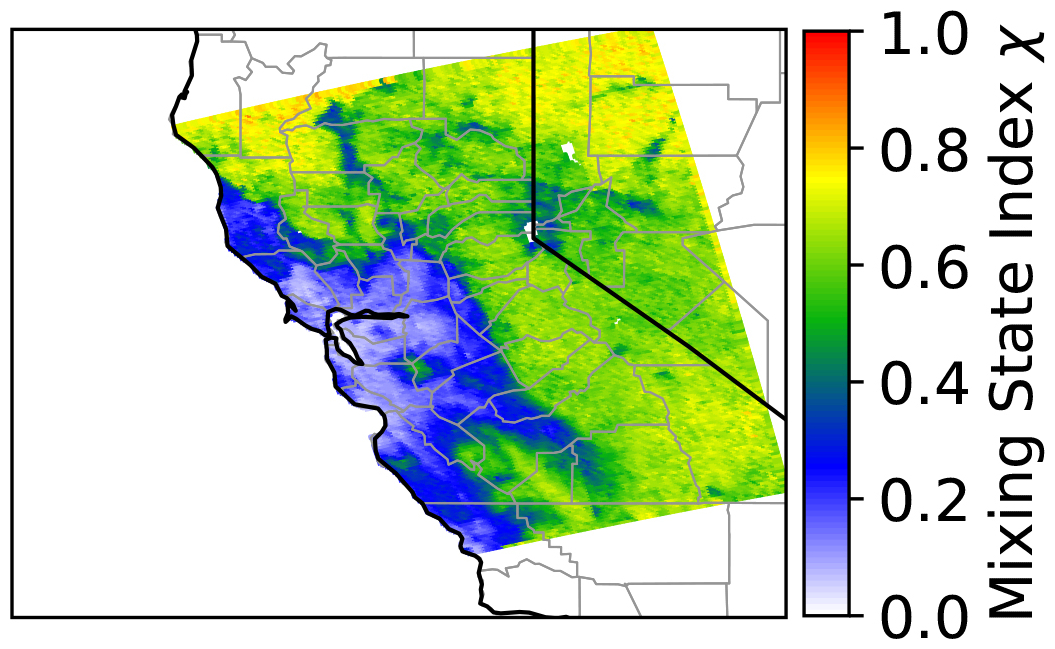
Figure 10Spatial distribution of the aerosol mixing state index χ for the near-surface land grid cells analyzed in this study. Low χ regions correspond to more externally mixed aerosol populations, whereas high χ regions indicate more internally mixed aerosol.
To improve sampling across mixing states, this analysis combines data from two representative time steps (daytime: 12:00 LST on 18 June and nighttime: 00:00 LST on 19 June 2010). Figure 11 shows all four bias metrics as a function of χ for the total aerosol population. For the three component differences (, , and ), the magnitudes decrease monotonically with increasing χ. Both surfactant effects and composition averaging produce the largest CCN biases under strongly externally mixed conditions, and these biases diminish progressively as the populations approach a more internally mixed state. This is physically consistent with the expectation that composition averaging introduces less structural error as particle-to-particle compositional variability decreases. However, their asymptotic behavior differs: the composition-averaging errors ( and ) approach zero as χ→100 %, whereas the surfactant-related difference () levels off at a finite negative value. This behavior has direct implications for large-scale aerosol models. As composition-averaged representations effectively assume internally mixed populations, the error associated with composition averaging becomes small, whereas the bias introduced by neglecting surfactant-driven surface tension reduction remains finite and may therefore represent a more persistent source of CCN bias.
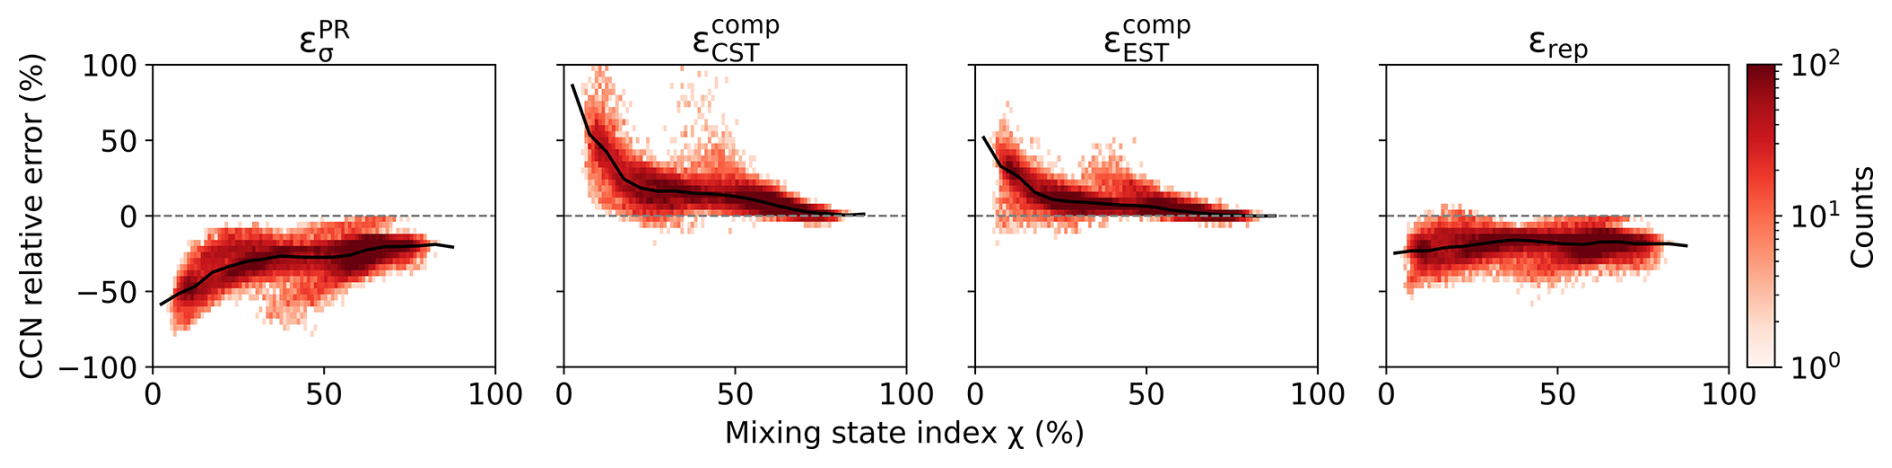
Figure 11CCN relative differences (, , , and εrep) as a function of aerosol mixing state index χ for all particles. Black lines indicate binned median values and the color scale represents data density on a logarithmic scale. To improve sampling across mixing states, data from two representative time steps (12:00 LST on 18 June and 00:00 LST on 19 June 2010) are combined.
By contrast, the model-relevant bias εrep remains approximately constant and negative across the full range of χ, with binned median values near −20 %. This behavior shows that the overall modal-like bias is not primarily controlled by mixing state in this case study. Rather, as χ increases, and the composition-averaging contribution weakens, the persistent negative bias from omitted surfactant effects becomes relatively more important. This finding has an important implication. Improving the representation of mixing state alone is unlikely to remove the dominant structural CCN bias if surfactant effects are still neglected.
This study examined how two common simplifications in large-scale aerosol models jointly affect predictions of cloud condensation nuclei (CCN) activation: composition averaging within size ranges and neglect of surfactant-driven surface tension reduction. Using WRF-PartMC as a particle-resolved reference, we showed that these two simplifications introduce systematic but opposing biases, so that apparent agreement in bulk CCN concentration can arise from compensating errors rather than from a physically faithful representation of activation.
At the particle level, composition averaging redistributes particles across the activation threshold by changing their effective hygroscopicity, while surfactant effects alter activation through changes in surface tension. A κ-σ decomposition showed that these contributions frequently oppose one another, producing compensating shifts in critical supersaturation.
When aggregated across the aerosol population, these particle-level responses translate into offsetting CCN biases across particle sizes, with composition averaging tending to enhance activation in the Aitken mode but suppress it in the accumulation mode. For model applications, the most relevant comparison is between the composition-averaged constant-surface-tension case, which serves as an analogue of a modal aerosol treatment in large-scale models, and the particle-resolved effective-surface-tension reference. In this comparison, the modal-like representation remains negatively biased overall because the underprediction caused by neglecting surfactant effects is only partially offset by composition-averaging errors.
Thus, bulk CCN agreement can be misleading: Total CCN may appear reasonable even when the underlying activation physics is incompletely represented. This may help explain why surfactant-driven surface tension reduction, despite its importance for particle-level activation, has not emerged more prominently in large-scale model evaluation.
At the same time, our results show that once effective surface tension is included, the residual bias associated with composition averaging alone is substantially reduced. In this case study, the composition-averaged effective-surface-tension representation is the closest simplified case to the particle-resolved effective-surface-tension reference. This does not imply that composition averaging is physically accurate; rather, it shows that the bias attributed to composition averaging depends strongly on whether surfactant effects are represented consistently. Put differently, a model that includes film/surfactant effects but still composition-averages aerosol may perform much better for CCN than would be inferred from analyses that neglect films altogether. Across the full range of mixing states examined here, the modal-like bias remains persistently negative because reductions in composition-averaging error are offset by the continued influence of surfactant-driven surface tension effects. This suggests that improving the representation of mixing state alone is unlikely to remove the dominant structural CCN bias if surfactant effects are still omitted.
Although the magnitude of these biases is case-dependent and the EST treatment is itself idealized, the underlying mechanism follows directly from the competing roles of hygroscopicity and surface tension in Köhler theory and is therefore likely to apply more broadly. This finding suggests that incorporating physically consistent surfactant effects may be an important and practical step toward improving CCN predictions in large-scale models, even when particle-resolved compositional variability cannot be fully represented. Evaluating the extent to which this mechanism generalizes across environments and model frameworks, and its implications for aerosol-cloud radiative forcing, remains an important direction for future work.
PartMC-MOSAIC (v2.6.0) is available at https://doi.org/10.5281/zenodo.5644422 (West et al., 2021). WRF-PartMC is available upon request from Nicole Riemer (nriemer@illinois.edu).
The simulation data and the Python scripts to process the data are available at https://doi.org/10.13012/B2IDB-7834698_V1 (Xu et al., 2026b).
Xiaotian Xu and Nicole Riemer conceived and designed the study. Xiaotian Xu performed the data analysis and generated the figures. Xiaotian Xu wrote the initial manuscript draft with guidance from Nicole Riemer. All authors contributed to the interpretation of the results and to the writing of the manuscript.
The contact author has declared that none of the authors has any competing interests.
Publisher's note: Copernicus Publications remains neutral with regard to jurisdictional claims made in the text, published maps, institutional affiliations, or any other geographical representation in this paper. The authors bear the ultimate responsibility for providing appropriate place names. Views expressed in the text are those of the authors and do not necessarily reflect the views of the publisher.
This research has been supported by the US Department of Energy, Office of Science, Biological and Environmental Research program (grant no. DE-SC0019192), and by the National Science Foundation, Directorate for Geosciences (grant no. AGS 19-41110).
This paper was edited by Anna Possner and reviewed by two anonymous referees.
Andreae, M. and Rosenfeld, D.: Aerosol–cloud–precipitation interactions. Part 1. The nature and sources of cloud-active aerosols, Earth-Sci. Rev., 89, 13–41, 2008. a
Bondy, A. L., Bonanno, D., Moffet, R. C., Wang, B., Laskin, A., and Ault, A. P.: The diverse chemical mixing state of aerosol particles in the southeastern United States, Atmos. Chem. Phys., 18, 12595–12612, https://doi.org/10.5194/acp-18-12595-2018, 2018. a
Bzdek, B. R., Reid, J. P., Malila, J., and Prisle, N. L.: The surface tension of surfactant-containing, finite volume droplets, P. Natl. Acad. Sci. USA, 117, 8335–8343, 2020. a, b
Ching, J., Riemer, N., and West, M.: Impacts of black carbon mixing state on black carbon nucleation scavenging: Insights from a particle-resolved model, J. Geophys. Res.-Atmos., 117, D23209, https://doi.org/10.1029/2012JD018269, 2012. a, b, c
Ching, J., Fast, J., West, M., and Riemer, N.: Metrics to quantify the importance of mixing state for CCN activity, Atmos. Chem. Phys., 17, 7445–7458, https://doi.org/10.5194/acp-17-7445-2017, 2017. a, b, c, d, e
Cruz, C. N. and Pandis, S. N.: The effect of organic coatings on the cloud condensation nuclei activation of inorganic atmospheric aerosol, J. Geophys. Res.-Atmos., 103, 13111–13123, 1998. a
Curtis, J. H.: Particle-resolved aerosol modeling on the regional scale–insights into importance of capturing aerosol mixing state, PhD thesis, University of Illinois at Urbana-Champaign, http://hdl.handle.net/2142/105004 (last access: 27 July 2026), 2019. a, b, c
Ervens, B., Cubison, M. J., Andrews, E., Feingold, G., Ogren, J. A., Jimenez, J. L., Quinn, P. K., Bates, T. S., Wang, J., Zhang, Q., Coe, H., Flynn, M., and Allan, J. D.: CCN predictions using simplified assumptions of organic aerosol composition and mixing state: a synthesis from six different locations, Atmos. Chem. Phys., 10, 4795–4807, https://doi.org/10.5194/acp-10-4795-2010, 2010. a
Gill, P., Graedel, T., and Weschler, C.: Organic films on atmospheric aerosol particles, fog droplets, cloud droplets, raindrops, and snowflakes, Rev. Geophys., 21, 903–920, 1983. a
Hallquist, M., Wenger, J. C., Baltensperger, U., Rudich, Y., Simpson, D., Claeys, M., Dommen, J., Donahue, N. M., George, C., Goldstein, A. H., Hamilton, J. F., Herrmann, H., Hoffmann, T., Iinuma, Y., Jang, M., Jenkin, M. E., Jimenez, J. L., Kiendler-Scharr, A., Maenhaut, W., McFiggans, G., Mentel, Th. F., Monod, A., Prévôt, A. S. H., Seinfeld, J. H., Surratt, J. D., Szmigielski, R., and Wildt, J.: The formation, properties and impact of secondary organic aerosol: current and emerging issues, Atmos. Chem. Phys., 9, 5155–5236, https://doi.org/10.5194/acp-9-5155-2009, 2009. a
He, J., Zhang, Y., Glotfelty, T., He, R., Bennartz, R., Rausch, J., and Sartelet, K.: Decadal simulation and comprehensive evaluation of CESM/CAM 5.1 with advanced chemistry, aerosol microphysics, and aerosol-cloud interactions, J. Adv. Model. Earth Sy., 7, 110–141, 2015. a
Hughes, M., Kodros, J. K., Pierce, J. R., West, M., and Riemer, N.: Machine learning to predict the global distribution of aerosol mixing state metrics, Atmosphere, 9, 15, 2018. a
IPCC: Summary for Policymakers, in: Climate Change 2021: The Physical Science Basis. Contribution of Working Group I to the Sixth Assessment Report of the Intergovernmental Panel on Climate Change, edited by: Masson-Delmotte, V., Zhai, P., Pirani, A., Connors, S. L., Péan, C., Berger, S., Caud, N., Chen, Y., Goldfarb, L., Gomis, M. I., Huang, M., Leitzell, K., Lonnoy, E., Matthews, J. B. R., Maycock, T. K., Waterfield, T., Yelekçi, O., Yu, R., and Zhou, B., Cambridge University Press, Cambridge, United Kingdom and New York, NY, USA, 3–32, https://doi.org/10.1017/9781009157896.001, 2021. a
Liu, X., Easter, R. C., Ghan, S. J., Zaveri, R., Rasch, P., Shi, X., Lamarque, J.-F., Gettelman, A., Morrison, H., Vitt, F., Conley, A., Park, S., Neale, R., Hannay, C., Ekman, A. M. L., Hess, P., Mahowald, N., Collins, W., Iacono, M. J., Bretherton, C. S., Flanner, M. G., and Mitchell, D.: Toward a minimal representation of aerosols in climate models: description and evaluation in the Community Atmosphere Model CAM5, Geosci. Model Dev., 5, 709–739, https://doi.org/10.5194/gmd-5-709-2012, 2012. a
Lowe, S., Partridge, D. G., Topping, D., and Stier, P.: Inverse modelling of Köhler theory – Part 1: A response surface analysis of CCN spectra with respect to surface-active organic species, Atmos. Chem. Phys., 16, 10941–10963, https://doi.org/10.5194/acp-16-10941-2016, 2016. a
Moore, R., Ingall, E., Sorooshian, A., and Nenes, A.: Molar mass, surface tension, and droplet growth kinetics of marine organics from measurements of CCN activity, Geophys. Res. Lett., 35, L07801, https://doi.org/10.1029/2008GL033350, 2008. a
Neale, R. B., Gettelman, A., Park, S., Chen, C.-C., Lauritzen, P. H., Williamson, D. L., Conley, A. J., Kinnison, D., Marsh, D., Smith, A. K., Vitt, F., Garcia, R., Lamarque, J.-F., Mills, M., Tilmes, S., Morrison, H., Cameron-Smith, P., Collins, W. D., Iacono, M. J., Easter, R. C., Liu, X., Ghan, S. J., Rasch, P. J., and Taylor, M. A.: Description of the NCAR community atmosphere model (CAM 5.0), NCAR Tech. Note Ncar/tn-486+ STR, 1, National Center for Atmospheric Research, 1–12, https://doi.org/10.5065/wgtk-4g06, 2010. a
Nozière, B., Baduel, C., and Jaffrezo, J.-L.: The dynamic surface tension of atmospheric aerosol surfactants reveals new aspects of cloud activation, Nat. Commun., 5, 3335, 2014. a, b
O'Brien, R. E., Wang, B., Laskin, A., Riemer, N., West, M., Zhang, Q., Sun, Y., Yu, X.-Y., Alpert, P., Knopf, D. A., and Shiraiwa, M.: Chemical imaging of ambient aerosol particles: Observational constraints on mixing state parameterization, J. Geophys. Res.-Atmos., 120, 9591–9605, 2015. a
Ovadnevaite, J., Zuend, A., Laaksonen, A., Sanchez, K. J., Roberts, G., Ceburnis, D., Decesari, S., Rinaldi, M., Hodas, N., Facchini, M. C., Seinfeld, J. H., and O'Dowd, C. D.: Surface tension prevails over solute effect in organic-influenced cloud droplet activation, Nature, 546, 637–641, 2017. a, b, c, d, e
Petters, M., Kreidenweis, S., and Ziemann, P.: Prediction of cloud condensation nuclei activity for organic compounds using functional group contribution methods, Geosci. Model Dev., 9, 111–124, 2016. a
Petters, M. D. and Kreidenweis, S. M.: A single parameter representation of hygroscopic growth and cloud condensation nucleus activity, Atmos. Chem. Phys., 7, 1961–1971, https://doi.org/10.5194/acp-7-1961-2007, 2007. a, b, c
Prisle, N. L., Raatikainen, T., Sorjamaa, R., Svenningsson, B., Laaksonen, A., and Bilde, M.: Surfactant partitioning in cloud droplet activation: a study of C8, C10, C12 and C14 normal fatty acid sodium salts, Tellus B, 60, 416–431, https://doi.org/10.1111/j.1600-0889.2008.00352.x, 2008. a
Pruppacher, H. R., Klett, J. D., and Wang, P. K.: Microphysics of clouds and precipitation, Taylor & Francis, https://doi.org/10.1080/02786829808965531, 1998. a
Riemer, N. and West, M.: Quantifying aerosol mixing state with entropy and diversity measures, Atmos. Chem. Phys., 13, 11423–11439, https://doi.org/10.5194/acp-13-11423-2013, 2013. a
Riipinen, I., Pierce, J. R., Yli-Juuti, T., Nieminen, T., Häkkinen, S., Ehn, M., Junninen, H., Lehtipalo, K., Petäjä, T., Slowik, J., Chang, R., Shantz, N. C., Abbatt, J., Leaitch, W. R., Kerminen, V.-M., Worsnop, D. R., Pandis, S. N., Donahue, N. M., and Kulmala, M.: Organic condensation: a vital link connecting aerosol formation to cloud condensation nuclei (CCN) concentrations, Atmos. Chem. Phys., 11, 3865–3878, https://doi.org/10.5194/acp-11-3865-2011, 2011. a
Rosenfeld, D., Andreae, M. O., Asmi, A., Chin, M., de Leeuw, G., Donovan, D. P., Kahn, R., Kinne, S., Kivekäs, N., Kulmala, M., Lau, W., Schmidt, K. S., Suni, T., Wagner, T., Wild, M., and Quaas, J.: Global observations of aerosol-cloud-precipitation-climate interactions, Rev. Geophys., 52, 750–808, 2014. a
Ruehl, C. R., Davies, J. F., and Wilson, K. R.: An interfacial mechanism for cloud droplet formation on organic aerosols, Science, 351, 1447–1450, 2016. a
Sareen, N., Schwier, A. N., Lathem, T. L., Nenes, A., and McNeill, V. F.: Surfactants from the gas phase may promote cloud droplet formation, P. Natl. Acad. Sci. USA, 110, 2723–2728, 2013. a
Seinfeld, J. H., Bretherton, C., Carslaw, K. S., Coe, H., DeMott, P. J., Dunlea, E. J., Feingold, G., Ghan, S., Guenther, A. B., Kahn, R., Kraucunas, I., Kreidenweis, S. M., Molina, M. J., Nenes, A., Penner, J. E., Prather, K. A., Ramanathan, V., Ramaswamy, V., Rasch, P. J., Ravishankara, A. R., Rosenfeld, D., Stephens, G., and Wood, R.: Improving our fundamental understanding of the role of aerosol- cloud interactions in the climate system, P. Natl. Acad. Sci. USA, 113, 5781–5790, 2016. a
Serrano Damha, C., Cummings, B. E., Schervish, M., Shiraiwa, M., Waring, M. S., and Zuend, A.: Capturing the Relative-Humidity-Sensitive Gas-Particle Partitioning of Organic Aerosols in a 2D Volatility Basis Set, Geophys. Res. Lett., 51, e2023GL106095, https://doi.org/10.1029/2023GL106095, 2024. a
Sorjamaa, R., Svenningsson, B., Raatikainen, T., Henning, S., Bilde, M., and Laaksonen, A.: The role of surfactants in Köhler theory reconsidered, Atmos. Chem. Phys., 4, 2107–2117, https://doi.org/10.5194/acp-4-2107-2004, 2004. a
Topping, D., Connolly, P., and McFiggans, G.: Cloud droplet number enhanced by co-condensation of organic vapours, Nat. Geosci., 6, 443–446, https://doi.org/10.1038/ngeo1809, 2013. a
West, M., Riemer, N., Curtis, J., Michelotti, M., Tian, J., and Arabas, S.: compdyn/partmc: Version 2.6.0, Zenodo, https://doi.org/10.5281/zenodo.5644422, 2021. a
Xu, X., Curtis, J. H., Yao, Y., Liu, Y., West, M., and Riemer, N.: Role of liquid-liquid phase separation-induced surface tension changes in cloud droplet activation, Aerosol Sci. Tech., 60, 963–981, https://doi.org/10.1080/02786826.2026.2631789, 2026a. a, b, c, d, e
Xu, X., Curtis, J. H., West, M., and Riemer, N.: Data for “Compensating biases in CCN predictions from composition averaging and neglected surfactant effects”, University of Illinois Urbana-Champaign [data set], https://doi.org/10.13012/B2IDB-7834698_V1, 2026b. a
Yao, Y., Curtis, J. H., Ching, J., Zheng, Z., and Riemer, N.: Quantifying the effects of mixing state on aerosol optical properties, Atmos. Chem. Phys., 22, 9265–9282, https://doi.org/10.5194/acp-22-9265-2022, 2022. a
Yu, C., Liu, D., Broda, K., Joshi, R., Olfert, J., Sun, Y., Fu, P., Coe, H., and Allan, J. D.: Characterising mass-resolved mixing state of black carbon in Beijing using a morphology-independent measurement method, Atmos. Chem. Phys., 20, 3645–3661, https://doi.org/10.5194/acp-20-3645-2020, 2020. a
Zaveri, R. A., Barnard, J. C., Easter, R. C., Riemer, N., and West, M.: Particle-resolved simulation of aerosol size, composition, mixing state, and the associated optical and cloud condensation nuclei activation properties in an evolving urban plume, J. Geophys. Res.-Atmos., 115, D17210, https://doi.org/10.1029/2009JD013616, 2010. a, b