the Creative Commons Attribution 4.0 License.
the Creative Commons Attribution 4.0 License.
 | 11 Aug 2025
Enhanced atmospheric oxidation and particle reductions driving changes to nitrate formation mechanisms across coastal and inland regions of north China
Zhenze Liu
Jianhua Qi
Yuanzhe Ni
Likun Xue
Xiaohuan Liu
Nitrate () has surpassed sulfate as the dominant secondary inorganic ion, posing a significant challenge to air quality improvement measures in China. We utilized the WRF–CMAQ (Weather Research and Forecasting and Community Multiscale Air Quality) model and isotope analysis to investigate the nitrate formation mechanisms driving regional changes in inland and coastal cities in north China during the winters of 2013 and 2018. Among the nitrate formation pathways, the oxidation reaction of OH radicals with NO2 (OH+NO2) and the heterogeneous reaction of N2O5 (hetN2O5) were determined to be the dominant pathways (88 %–95.5 %), whereas the other pathways contributed less than 12.4 % to the total amount of nitrate formation. In inland cities, 63.7 %–85.6 % of nitrate was formed via OH+NO2 and 8.3 %–27.7 % was formed from hetN2O5. In coastal cities, approximately half of the nitrate (48.2 %–56.5 %) was produced from OH+NO2, whereas hetN2O5 contributed 37.0 %–45.7 % due to higher N2O5 concentrations and longer NO3 radical lifetimes. Compared with that in 2013, the OH+NO2 contribution in 2018 increased by 7.6 % in inland cities and 3.6 % in coastal cities due to the increased atmospheric oxidizing capacity. Scenario simulations indicated that a 60 % reduction in NOx emissions led to a 4.5 % decrease in nitrate concentrations in Beijing. The reduction reached 32.4 % reduction in Qingdao. A 60 % combined reduction in NH3, NOx, and volatile organic compounds (VOCs) yielded 44.2 % and 60.0 % reductions in nitrate in Beijing and Qingdao, respectively, underscoring the necessity of multipollutant control strategies.
- Article
(8047 KB) - Full-text XML
-
Supplement
(834 KB) - BibTeX
- EndNote


As a key component of fine particulate matter (PM2.5), nitrate () exacerbates health risks (Tie et al., 2009; Sun et al., 2014) and affects the physical and chemical properties of particulates, such as their hygroscopicity, light absorption, and acidity (Cao et al., 2013; Wang et al., 2023). These properties directly influence the atmospheric radiation balance (Ramanathan and Feng, 2009; Tegen et al., 2000), atmospheric visibility, and air quality. Furthermore, nitrate serves as a key source of cloud condensation nuclei, affecting cloud formation and precipitation patterns which subsequently influence the global water cycle and climate regulation (Yu et al., 2020; Kalkavouras et al., 2019). Moreover, the photolysis process of nitrate in atmospheric boundary layers is highly active, serving as an important source of NOx and regulating the atmospheric oxidation capacity, thus influencing the formation of secondary pollutants such as sulfate () and brown carbon (BrC) (Ye et al., 2016; Xue et al., 2019; Zheng et al., 2020; Yang et al., 2021). Therefore, nitrate is closely related to regional haze pollution occurrence (Zhai et al., 2021; Zhang et al., 2021; Xu et al., 2019a, b; Fu et al., 2020). Understanding the formation mechanism of nitrate is essential not only for advancing the atmospheric chemical processes but also for mitigating regional haze pollution.
In tropospheric atmospheres, nitrate formation primarily follows two pathways (Fig. 1). During the daytime, NO2 is oxidized by hydroxyl radicals (OH) to produce gaseous HNO3 (Reaction R1). Conversely, at night, O3 oxidizes NO2, leading to the formation of the NO3 radical, which combines with NO2 to form N2O5. This compound can subsequently be adsorbed onto particles via heterogeneous reactions, resulting in the formation of HNO3 (Reaction R2) (Hallquist et al., 1999; Pathak et al., 2011). These dynamics highlight the intrinsic dependence of atmospheric nitrate formation on NOx and oxidants, especially O3 and OH radicals. The generation of OH and O3 is intricately linked to the photochemical reactions of NOx and volatile organic compounds (VOCs) (Atkinson, 2000). OH radicals and hydroperoxyl radicals (HO2) are produced via the photolysis of ozone (O3), nitrous acid (HONO), oxygenated volatile organic compounds (OVOCs), and hydrogen peroxide (H2O2) and via reactions between O3 and VOCs. OH subsequently reacts with VOCs to generate organic peroxy radicals (RO2) and HO2, which are then recycled back to OH via their interaction with nitrogen monoxide (NO). During this cycle, NO is transformed into NO2, which yields O3 upon photolysis (Fu et al., 2020).
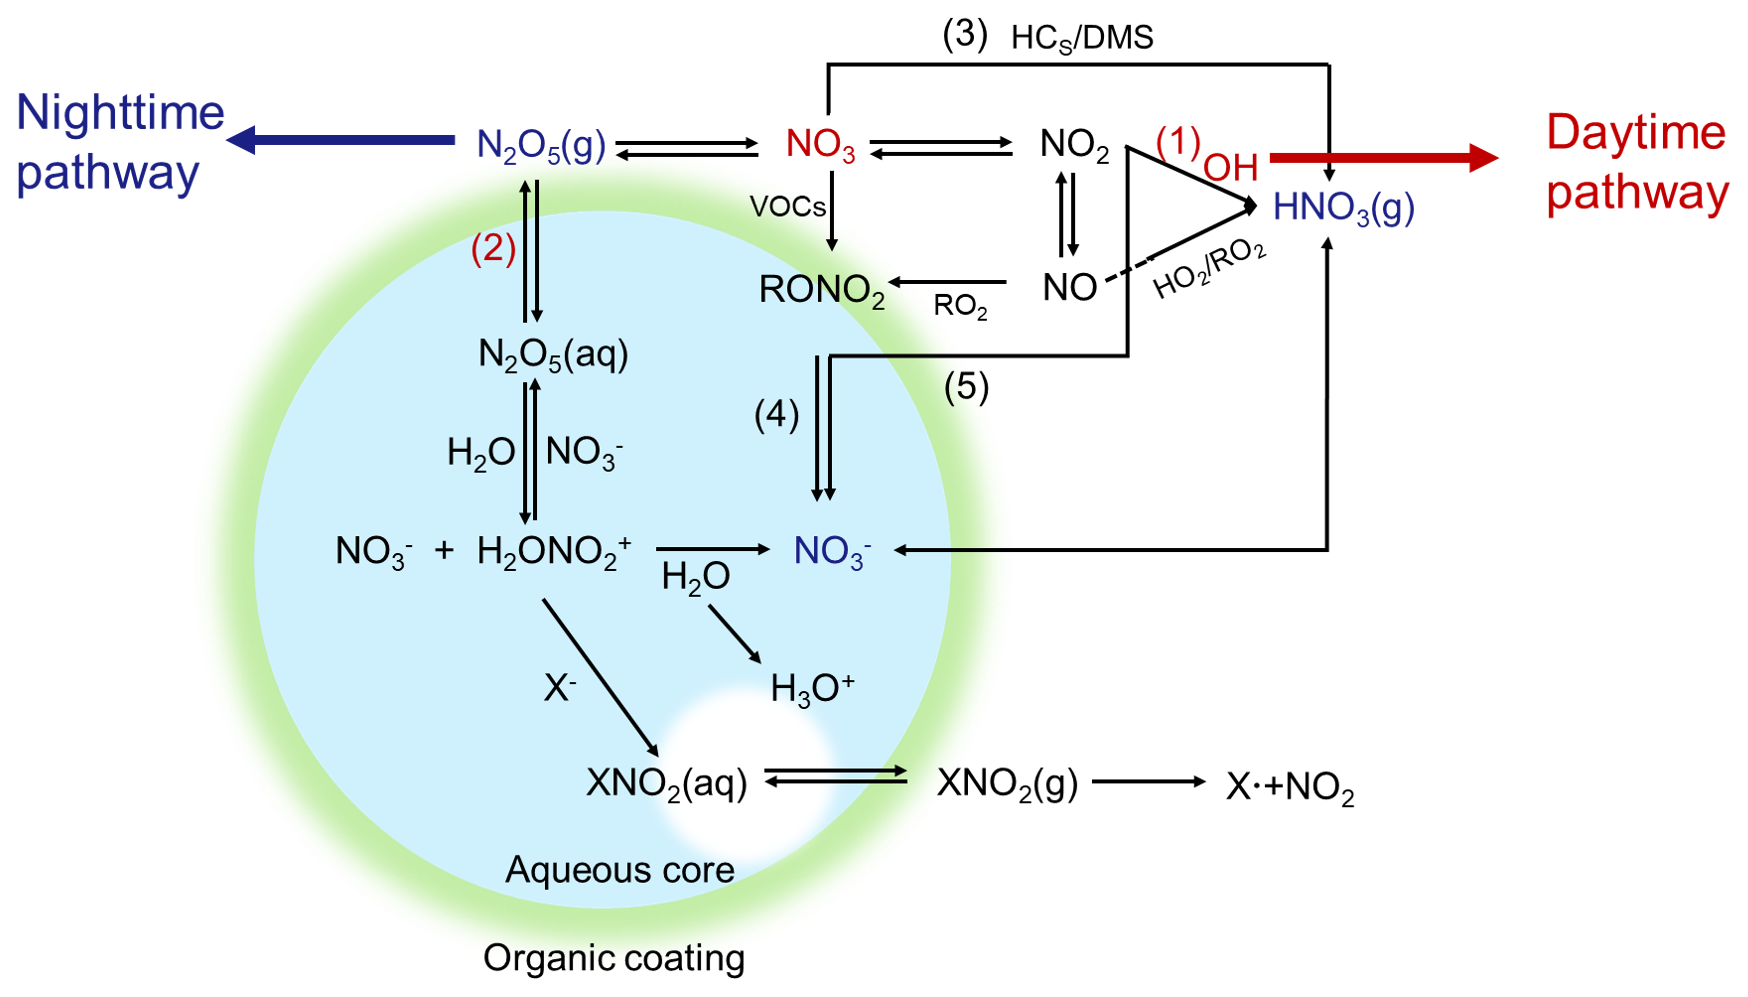
Figure 1Formation mechanisms of nitrate in the atmosphere (Wang et al., 2023).
Nitrate formation mechanisms exhibit significant regional differences, especially in winter. Some studies based on isotope analysis have shown that the OH pathway is important for nitrate formation in inland cities. For example, in Beijing, the OH pathway contributes 66 %–92 % to winter nitrate formation, whereas the heterogeneous reaction of the N2O5 (hetN2O5) pathway contributes 8 %–34 % to nitrate (Chen et al., 2020). In Xi'an, the contribution of the hetN2O5 pathway to winter nitrate formation ranges from 13 % to 35 % (Wu et al., 2021). In coastal areas, which are influenced by high humidities, high sea salt levels, and the combined effects of marine emissions and air masses (Zhong et al., 2023; Athanasopoulou et al., 2008; Zhao et al., 2024), the contribution of the OH pathway is smaller than that in inland cities, whereas the hetN2O5 pathway plays a more significant role. For example, isotope analysis revealed that the contribution of the OH+NO2 pathway to winter nitrate formation is 48 %–74 % in Shanghai (He et al., 2020), whereas the contributions of the OH, hetN2O5, and NO3+HC pathways to winter nitrate formation are 20.2 %, 38.2 %, and 21.6 %, respectively, in Xiamen (Li et al., 2022). Broad coastal studies have revealed similar significant regional differences. Michalski et al. (2003) noted that in coastal California, approximately 90 % of winter nitrate originates from the hetN2O5 pathway. In the polar environment of Greenland (Kunasek et al., 2008), nearly all nitrate is formed via the and hetN2O5 pathways in winter, with contributions of 60 % and 40 %, respectively. Furthermore, the impacts of continental and marine air masses on nitrate formation mechanisms differ. In the south Yellow Sea, under the dominance of marine air masses, the contributions of the OH+NO2, , and hetN2O5 pathways to nitrate formation are 43.9 %, 22.4 %, and 33.6 %, respectively, whereas the contributions (12.6 %, 59.0 %, and 28.4 %, respectively) in the Bohai and north Yellow seas are affected by continental pollution (Zhao et al., 2024). These studies have confirmed substantial regional differences in nitrate formation mechanisms.
In addition to isotope analysis, model simulation studies have provided significant support for elucidating nitrate formation mechanisms. Global models such as GEOS-Chem have revealed significant land–ocean differences in nitrate formation pathways. Alexander et al. (2020), using the GEOS-Chem model at a global scale, reported that the OH+NO2 reaction (41 %–42 %) and N2O5 hydrolysis (28 %–41 %) were the main pathways involved below 1 km altitude, with N2O5 hydrolysis dominating in winter in the mid- to high-latitude northern continents; however, in remote marine regions, XNO3 hydrolysis emerged as the primary pathway. However, owing to their relatively low resolution (typically 0.5° × 0.625° or coarser) and simplified treatment of aerosol–surface heterogeneous reactions, global models clearly have limitations in capturing regional differences (Heald et al., 2012). Consequently, the average outputs from global models may not accurately reflect the nitrate formation mechanisms of specific regions (Alexander et al., 2020), leading to potential overestimations or underestimations of local nitrate formation, particularly in terms of ammonia emissions and nitrate production rates. Compared with global models, regional models, such as WRF-Chem (Weather Research and Forecasting model coupled with Chemistry) and WRF–CMAQ (Weather Research and Forecasting and Community Multiscale Air Quality model), can offer greater accuracy in capturing local chemical processes. For example, Sun et al. (2022) used the WRF–CMAQ model to study the Yangtze River Delta (YRD) and reported that during winter, the OH+NO2 reaction contributed 69.3 % of nitrate formation in Shanghai (a coastal area) and 66.9 % in Hefei (an inland area), whereas the contribution of hetN2O5 in Hefei was 27.1 %. Similarly, Li et al. (2021) used the WRF-Chem model to investigate the North China Plain (NCP) and YRD and reported that near the surface, the OH+NO2 reaction dominated nitrate formation (60 %–92 %), with hetN2O5 contributing 8 %–40 %. Moreover, Kim et al. (2014b) applied the WRF–CMAQ model to the Great Lakes region of North America and reported that hetN2O5 accounted for 57 % of nitrate formation, highlighting the regional variability. For targeted regions, especially heavily polluted urban areas or those with unique ecosystems, employing high-resolution regional simulations and more detailed chemical mechanisms allows for a more precise characterization of nitrate formation processes.
The North China Plain (NCP) region is a focal point for studying air pollution due to its severe winter haze issues, which consistently rank among the areas with the highest PM2.5 concentrations globally (Chen et al., 2016). Before 2013, sulfate was the dominant pollutant during haze events in the NCP, accounting for a significant proportion of the total PM2.5 (Li et al., 2019). However, following the implementation of the Clean Air Action Plan (CAAP) in 2013, which aimed to reduce PM2.5 concentrations and improve air quality (Zhang et al., 2023a), the composition of winter haze pollution shifted from being sulfate-dominated to nitrate-dominated (Li et al., 2019; Xu et al., 2019a). Data from the Multiresolution Emission Inventory for China (MEIC) (Zheng et al., 2018) show that from 2013 to 2017, anthropogenic emissions of SO2, NOx, CO, and NH3 decreased by 59 %, 21 %, 23 %, and −3 %, respectively. Correspondingly, the national annual average PM2.5 level decreased by 30 %–50 % from 2013–2018 (Zhai et al., 2019). While these emission reduction measures led to significant declines in CO and SO2 levels and in particulate sulfate concentrations, the reduction in particulate nitrate levels was smaller than expected. In fact, nitrate mass concentrations have increased in some major cities (Xu et al., 2019b; Shao et al., 2018; Zhou et al., 2019; Fu et al., 2020). This divergence in the responses of sulfate and nitrate to emission controls underscores the complex chemistry of nitrate formation and its precursors. Most studies have focused on nitrate formation mechanisms in inland cities such as Beijing–Tianjin–Hebei (Fan et al., 2020b; Fu et al., 2020; Yang et al., 2024; Chen et al., 2020); thus, the formation mechanisms in coastal cities remain poorly understood. The coastal regions of China experience monsoon transitions, where marine air masses are transported inland under the influence of sea and land breezes, affecting the formation of nitrate over terrestrial areas.
To understand the factors controlling nitrate concentration variations in inland and coastal cities, especially during periods dominated by different primary pollutants, we selected the winters of 2013, when the CAAP was initiated, and 2018, after the project had concluded, to explore the nitrate formation mechanisms in five inland cities and two coastal cities on the NCP via a regional multiscale model combined with isotope analysis. The primary objectives of this study were to quantify the contributions of different nitrate formation pathways, such as OH+NO2 and hetN2O5, in inland and coastal cities, investigate the impacts of emission control measures on nitrate formation, and provide insights into regional differences in nitrate control.
2.1 Model configuration
The Community Multiscale Air Quality (CMAQ) model (version 5.3.3) was used to simulate the chemical reactions and physical processes that contributed to and TNO3 () formation in the NCP region. Two distinct periods were considered, i.e., one period from 1 December 2013 to 28 February 2014, representing the period when the CAAP was initiated, and one period from 1 December 2018 to 28 February 2019, representing the period after the CAAP was completed. As shown in Fig. 2, a dual-layer grid nesting method was implemented in our simulations. Domain 1 (D01) encompassed the majority of China with a 36 km horizontal resolution, whereas domain 2 (D02) covered the NCP with a 12 km horizontal resolution. The major cities within the NCP included Beijing (BJ), Tianjin (TJ), Shijiazhuang (SJZ), Jinan (JN), Zhengzhou (ZZ), Qingdao (QD), and Yantai (YT). The terrain elevation data used in Fig. 2 came from the GEBCO 2024 Grid provided by the GEBCO Bathymetric Compilation Group (2024, https://doi.org/10.5285/1c44ce99-0a0d-5f4f-e063-7086abc0ea0f). The model was vertically segmented into 14 layers, stretching from the Earth's surface to the troposphere, with the first layer height at approximately 31 m. The CB6 chemical mechanism was chosen to simulate gas-phase chemistry (Luecken et al., 2019; Yan et al., 2021) and the aerosol mechanism. Aerosol module version 7 (AERO7; Appel et al., 2021) was used to simulate particulate-phase chemistry. The initial and boundary conditions used as the inputs of D01 were provided via the GEOS-Chem global simulation results, and D02 was provided via D01. To minimize the impact of the initial conditions, we initiated the model run 7 d before the analysis period. Anthropogenic emission data were sourced from the Multiresolution Emission Inventory for China (MEIC) source emission inventory maintained by Tsinghua University (http://meicmodel.org/, last access: 17 June 2024), while biogenic emission estimates were derived from the Model of Emissions of Gases and Aerosols from Nature version 2.0.4 (MEGANv2.0.4, https://bai.ess.uci.edu/megan, last access: 3 June 2024).
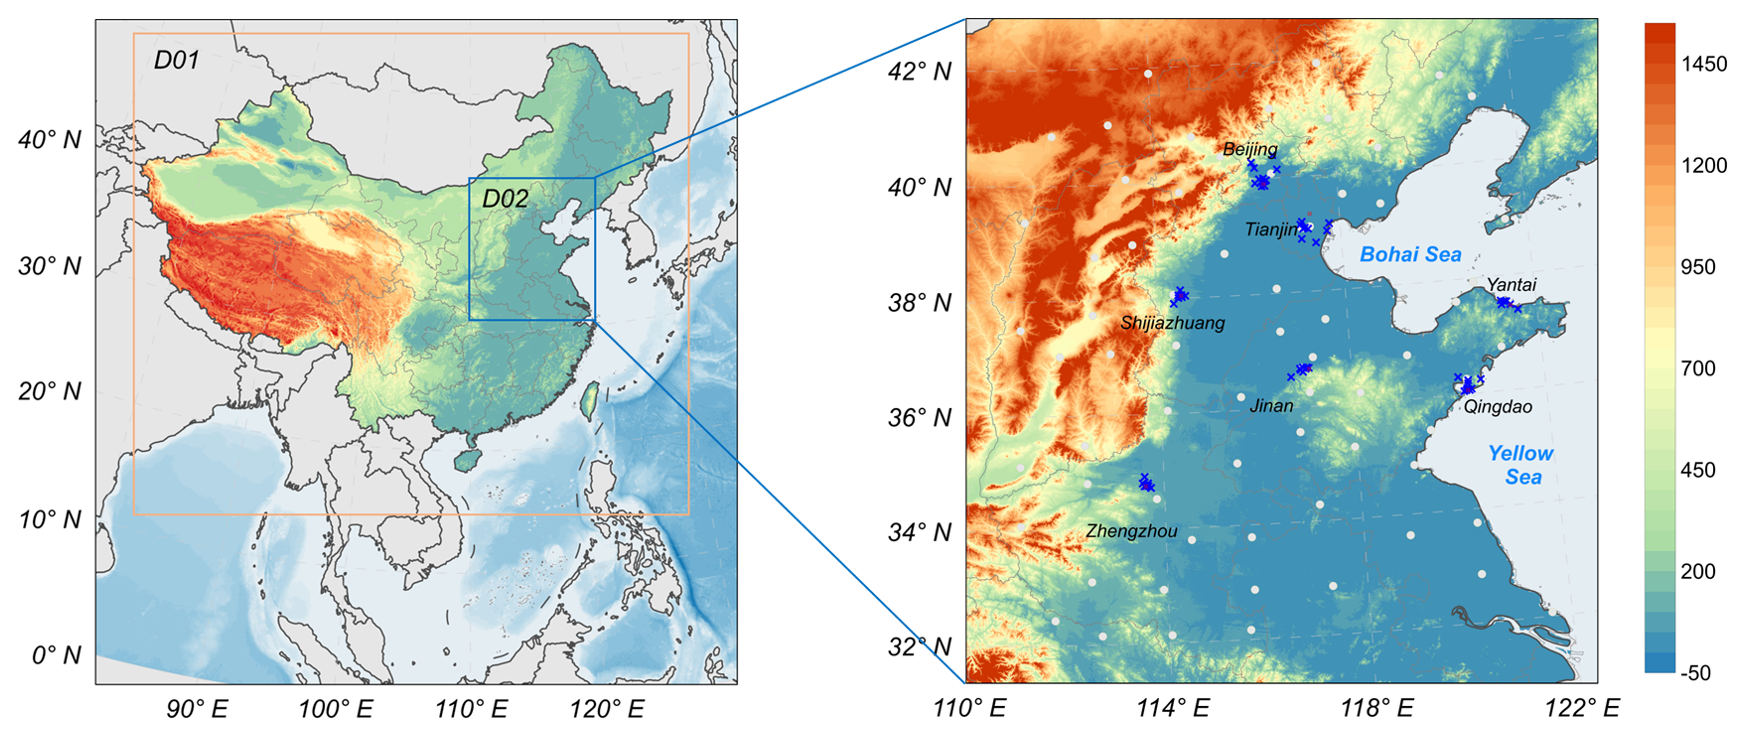
Figure 2Terrain heights of the NCP region and locations of the major cities (Beijing, Tianjin, Shijiazhuang, Jinan, Zhengzhou, Qingdao, and Yantai) within the study domain. The white dots indicate meteorological observation stations, and the blue crosses indicate air quality monitoring stations. Publisher's remark: please note that the above figure contains disputed territories.
The required meteorological data were generated with the Weather Research and Forecasting (WRF) model version 3.7, a system for predicting mesoscale weather patterns. The selection of physics options for this model conformed with the methodologies applied in our earlier studies (Liu et al., 2021; Chen et al., 2021). The WRF simulations in this study depended on the final operational global analysis (FNL) datasets, which are global reanalysis data with temporal and spatial resolutions of 6 h and 1° × 1°, respectively, provided by the U.S. Environmental Prediction Center and the National Center for Atmospheric Research (https://rda.ucar.edu/datasets/ds083-2/, last access: 12 March 2024). The WRF model outputs were subsequently processed via Model-3/CMAQ Modeling System Interface Processor (MCIP) version 4.3, ensuring compatibility with the CMAQ model format.
2.2 Process analysis
Within the CMAQ modeling framework, the integrated reaction rate (IRR) module of the process analysis (PA) tool was used to simulate the formation reactions of TNO3 (). The reaction rates of the chemical reactions at each moment were provided by the IRR module, enabling the quantitative evaluation of the target reactions. The complex chemical formation of TNO3 involved seven reaction pathways, which were categorized into three main pathways on the basis of their significance: OH+NO2 (Reaction R1), hetN2O5 (Reaction R2), and other (Reactions R3 to R7). The chemical equations for these seven production reaction pathways could be expressed as follows.
2.3 Observation data
In this study, the simulation results, including meteorological parameters and atmospheric pollutants, for the major cities in the NCP were validated in depth. The meteorological parameters included the 2 m temperature (T2), relative humidity (RH), 10 m wind speed (WS10), and 10 m wind direction (WD10). The atmospheric pollutants included the maximum 8 h moving average ozone (MDA8 O3), NO2, PM2.5, and PM2.5 components.
2.3.1 Meteorological data and sources
Meteorological data, comprising T2, WS10, WD10, and RH, were sourced from the National Climatic Data Center (NCDC) of the National Oceanic and Atmospheric Administration (NOAA) (https://www.ncdc.noaa.gov/cdo-web/, last access: 17 October 2023). Data were collected from a total of 68 stations, with a temporal resolution of either 3 or 1 h.
2.3.2 Atmospheric pollutant concentrations
Data on O3, NO2, and PM2.5 concentrations were retrieved from the real-time national urban air quality dataset disseminated by the China Environmental Monitoring Center (https://air.cnemc.cn:18007/, last access: 13 February 2024). The , , and concentration data were sourced from our own observations in Qingdao and published data (detailed information can be found in Table S3).
In the city of Qingdao, we collected total suspended particle (TSP) samples during two winter seasons. The TSP samples were collected on preheated quartz fiber filters with a high-volume (1.05 m3 min−1) aerosol sampler (Qingdao Laoshan Electronics Co., Ltd., China). The sampling site was situated on the roof of Darwin Hall (36°06′ N, 120°33′ E; 16 m) at the Ocean University of China, approximately 1 km from the beach. Detailed information can be found in Ding et al. (2019). Water-soluble inorganic ions, such as , , and , were extracted from the samples using ultrapure water (> 18.2 MΩ cm), and their concentrations were measured with a Thermo Scientific Dionex ICS-1100 IC system, as described in a previous study (Qi et al., 2020). The ionic concentrations in the TSP samples were calibrated by subtracting the concentrations in the blanks. The δ18O and δ15N values of in the TSP samples were determined via the bacterial denitrifier method (Casciotti et al., 2002; Sigman et al., 2001) with the Gasbench-IRMS system (Delta V model, Thermo Scientific). For analytical calibration, four international reference standards were employed, namely USGS32, USGS34, USGS35, and IAEA-. The standard deviations of the replicates were ±0.2 ‰ for δ15N– and ±0.5 ‰ for δ18O–. The analytical procedures for determining δ15N– and δ18O– were detailed in a previous study (Luo et al., 2021). The blank contributed less than 5 % to the sample results. Additional details are provided in Sect. S1 in the Supplement.
2.4 Dual-isotopic Bayesian mixing model
The Bayesian isotope mixing model (Stable Isotope Analysis in R, SIAR) and dual-isotopic compositions (δ15N– and δ18O–) determined in Qingdao and adapted from a reference study in Beijing (Zong et al., 2020; Fan et al., 2020b) were employed to estimate the contributions of OH radicals and the hetN2O5 pathway to particulate . Equations (S1)–(S7) for calculating the isotopic compositions of nitrogen oxides in the atmosphere are provided in the Supplement. The atmospheric δ15N– and δ18O– can be expressed by Eqs. (S1) and (S2), respectively. The endmembers of [δ15N−HNO3]OH, , [δ18O−HNO3]OH, and are expressed by Eqs. (S3), (S4), (S5), and (S6), respectively (Walters and Michalski, 2016). This study was focused on the seasonal scale, where observations of δ18O– did not reveal a significant diurnal difference (Feng et al., 2020; Zhang et al., 2022), as shown in Fig. S1 in the Supplement. Therefore, we did not account for the diurnal variation in δ18O–NO2 in the calculation of endmembers (Walters et al., 2018; Zhang et al., 2025; Albertin et al., 2021, 2024). The δ15N values of tropospheric NOx and the δ18O values of tropospheric H2O(g), NOx, O3, and •OH occurred within certain ranges, as described in Sect. S2 and Table S1 in the Supplement. Therefore, the endmembers of δ15N and δ18O for the two pathways could be estimated according to fNO2 (the molar ratio of NO2 and NOx) and the isotope fractionation values of nitrogen and oxygen, i.e., , , and . The nitrogen and oxygen isotope fractionations were temperature-dependent and could be estimated via Eq. (S7) and Table S2. On the basis of the endmembers of [δ15N−HNO3]OH, , [δ18O−HNO3]OH, and , the contribution of the OH radical formation pathway (γ) was estimated via the dual-isotopic Bayesian mixing model (Luo et al., 2021). The uncertainty of the Bayesian model mainly stemmed from the standard deviations in the endmember calculations for each formation pathway and the posterior probability distributions output by the model (Moore and Semmens, 2008).
2.5 Model evaluation
The following statistical indicators were used to evaluate the simulation effect: the mean deviation (MB), normalized mean deviation (NMB), normalized mean error (NME), correlation coefficient (R), root mean square error (RMSE), and index of agreement (IOA). The definitions and standards of all the statistical indicators are provided in Table S3. To evaluate model performance, Emery et al. (2001) provided benchmarks of the above statistical indicators for major meteorological parameters such as T2, WS10, and WD10, which are presented in Table 1. Similarly, Emery et al. (2017) and Huang et al. (2021) proposed benchmarks for the concentrations of major air pollutants, including PM2.5, NO2, MDA8 O3, and , as comprehensively detailed in Table 2.
Table 1Statistical performance of the modeled meteorological parameters in the NCP during the winters of 2013 and 2018 (68 sites).
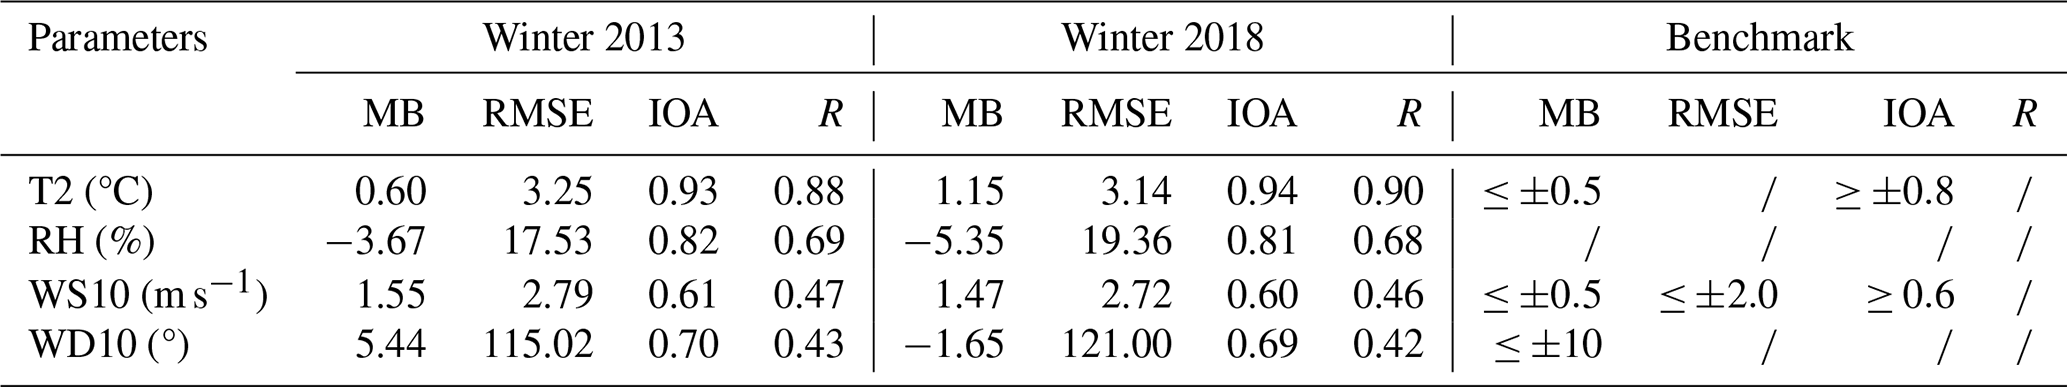
* T2 denotes the 2 m temperature. RH denotes the relative humidity. WS10 denotes the 10 m wind speed. WD10 denotes the 10 m wind direction.
Table 2Model performance for the major air pollutants in typical cities of the NCP during the winters of 2013 and 2018.
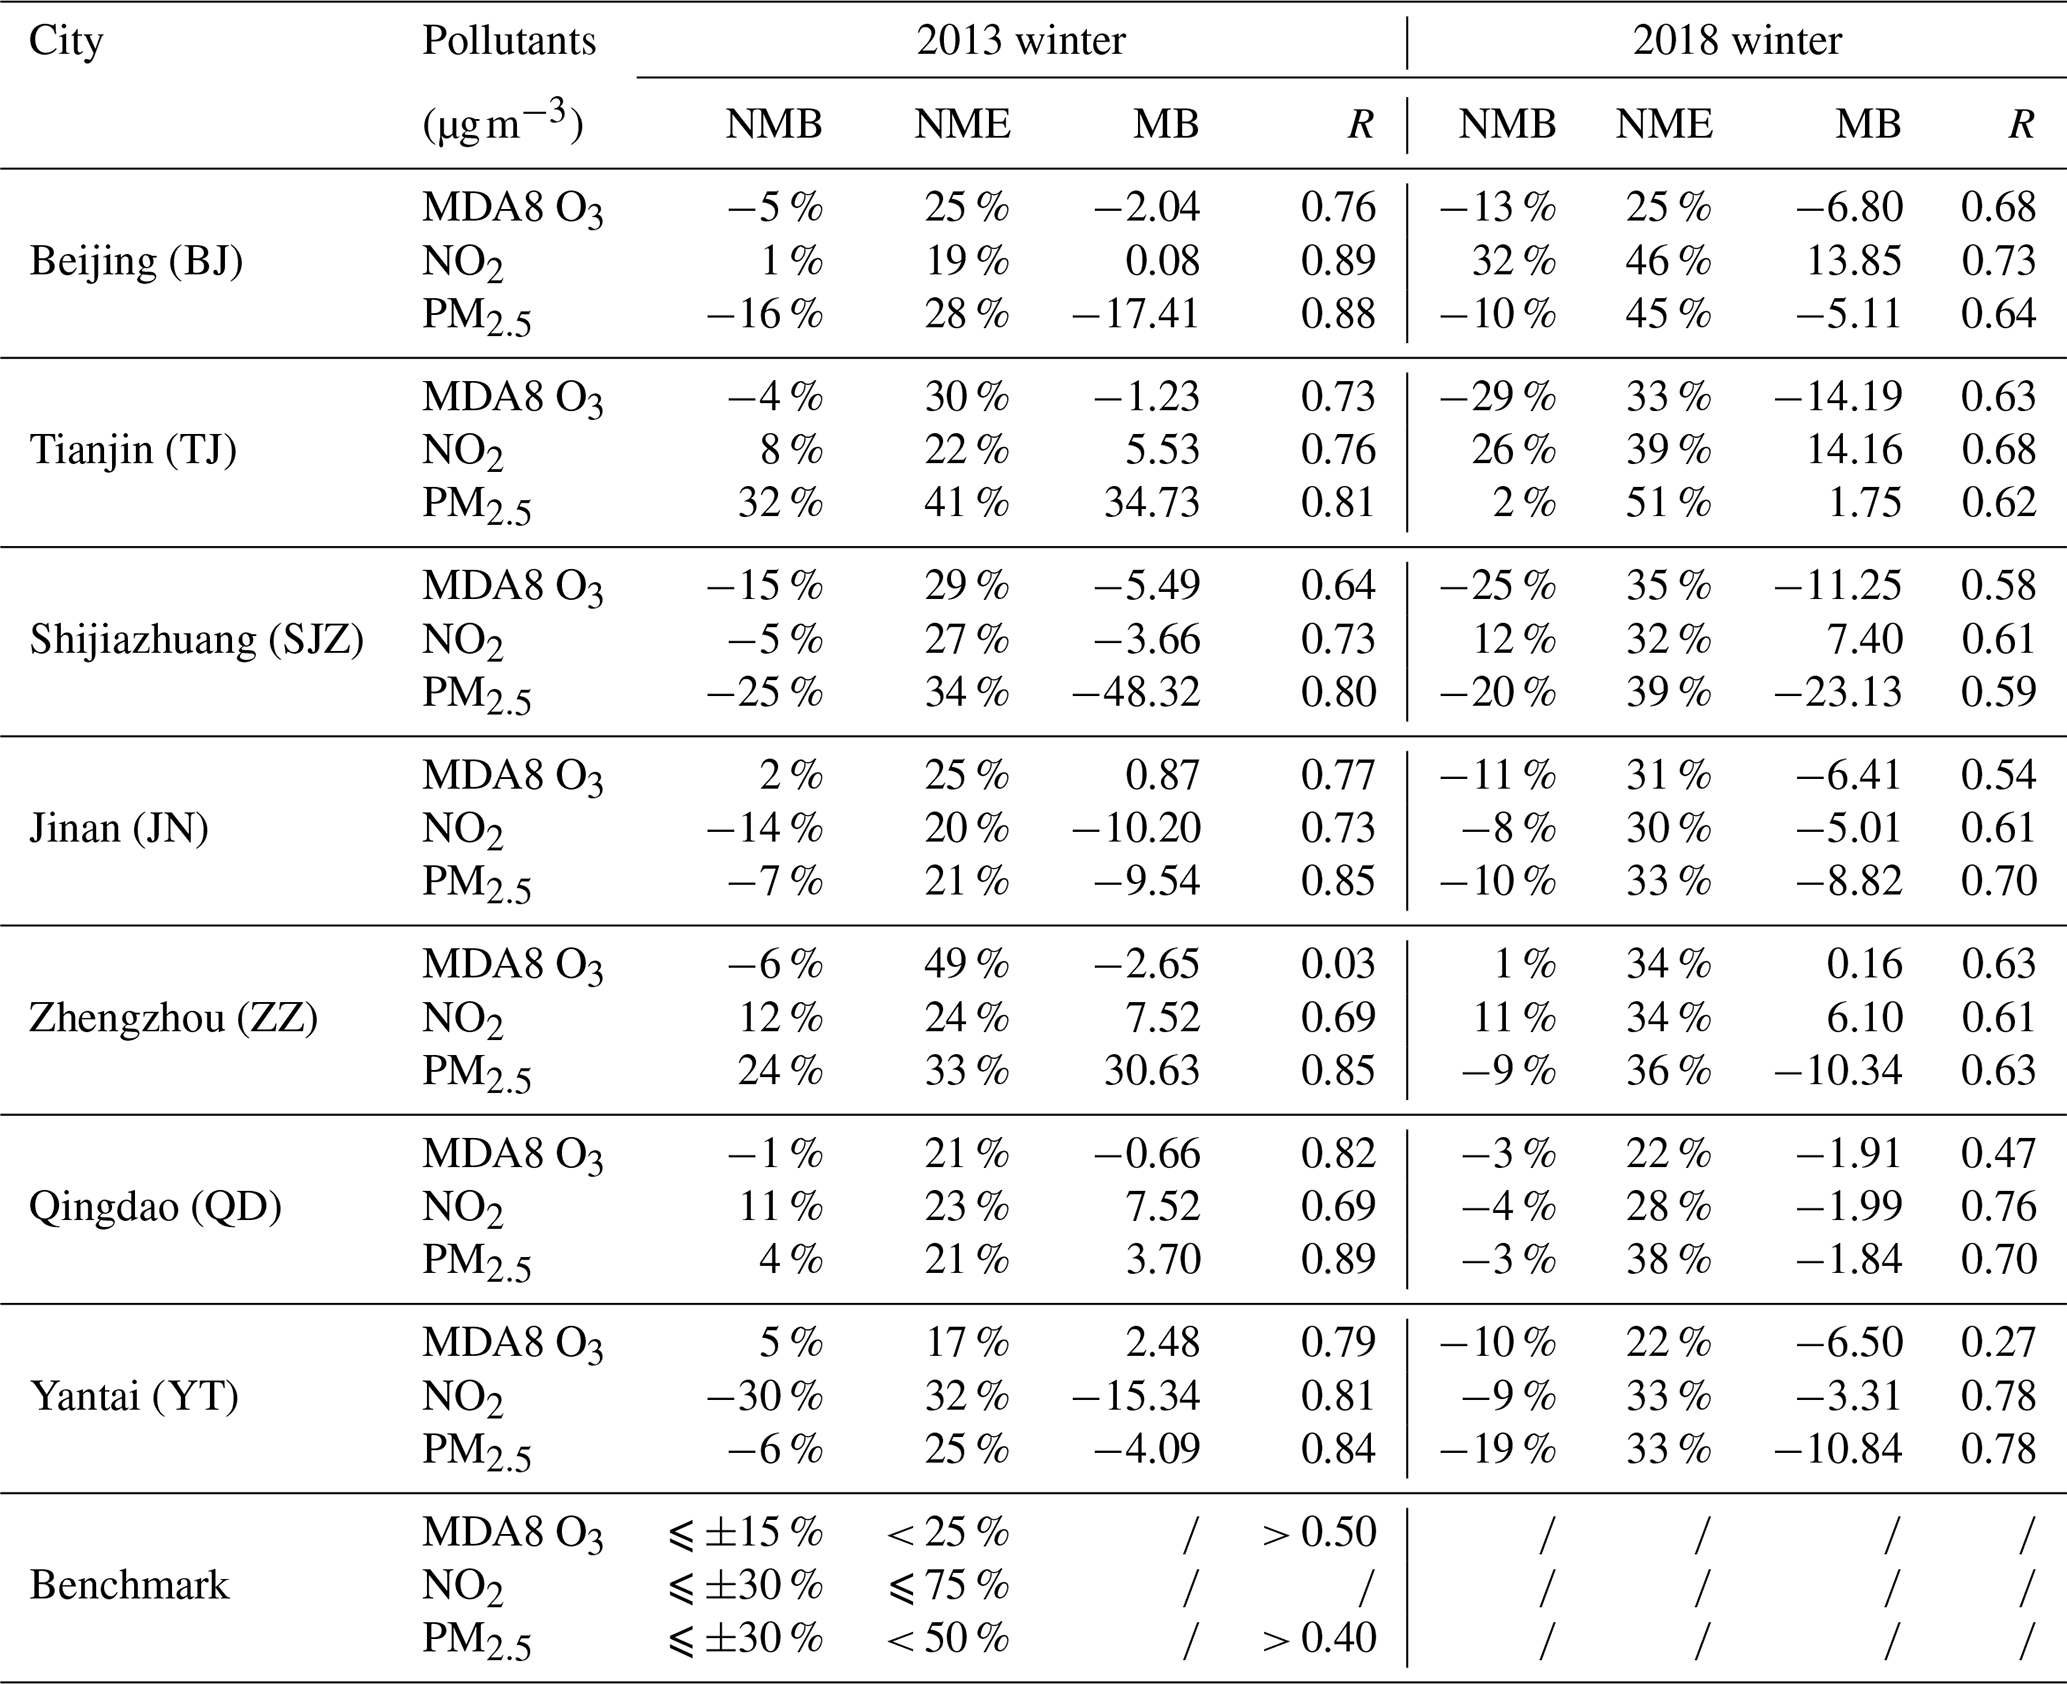
* The benchmarks for these pollutants, including NO2 according to US-EPA (2007), MDA8 O3, and PM2.5, were proposed by Emery et al. (2017) and Huang et al. (2021).
For the comparison between the model simulations and observational data, the model grid cell corresponding to the geographic coordinates of each observation station was first identified. At each station, the observed values were compared with the simulated values from the corresponding grid cell on a point-by-point, hour-by-hour basis. These paired comparisons were then aggregated across all stations, and statistical evaluation metrics were generated from the entire dataset to assess model performance comprehensively. All data processing and comparisons were conducted on an hourly basis.
2.6 Emission reduction scenario simulation design
Notably, emission reduction scenarios were specifically designed to investigate how reductions in NH3, NOx, and VOC emissions affected PM2.5 nitrate concentrations in Beijing and Qingdao, which are typical inland and coastal cities, respectively, in northern China. The simulations included single-pollutant reduction strategies for NH3, NOx, and VOCs and combined reduction scenarios. For each pollutant, emissions were reduced by 20 %, 40 %, and 60 %, with a focus on assessing the resulting influence on nitrate formation. The combined reduction scenarios entailed simultaneous reductions in NH3, NOx, and VOCs to evaluate synergistic effects. The nitrate concentration responses to these reductions were analyzed to determine the most effective strategies for controlling winter nitrate levels.
3.1 Model evaluation
3.1.1 Evaluation of meteorological parameters
The statistical model performance for meteorological parameters such as T2, WS10, WD10, and RH in the NCP is summarized in Table 1, covering the winter months from December 2013 to February 2014 (winter 2013) and from December 2018 to February 2019 (winter 2018). The simulated T2 and RH values exhibited satisfactory reproducibility, with temperature simulations exhibiting MB values slightly higher than the recommended threshold (MB ≤ ±0.5). The simulated wind speeds during both winters were slightly overestimated, with the RMSE slightly exceeding the criterion (2 m s−1; Emery et al., 2001), whereas the wind direction results fully satisfied the criterion. The observed wind speed overestimation by the WRF model could be attributed to its inability to accurately capture the impact of high aerosol loadings on shortwave radiation in winter, which likely reduced the near-surface wind speed (Tan et al., 2017; Jacobson and Kaufman, 2006). In general, the meteorological field simulations of the WRF model were reliable and could effectively reveal the changes in various meteorological elements in the NCP.
3.1.2 Evaluation of atmospheric pollutants
As indicated in Table 2, the model exhibited a favorable simulation ability for the concentrations of NO2, MDA8 O3, and PM2.5 pollutant in the NCP region. Specifically, the simulations accurately captured NO2 concentrations, with NMB values ranging from −30 % to 32 %. Notably, during the winter of 2018, the simulated NO2 concentration in Beijing was slightly higher than the recommended range (by 2 %), whereas that in other cities remained within this range. The MDA8 O3 simulations generally exhibited slight underestimation, whereas in Tianjin, Shijiazhuang, and Zhengzhou, the simulations slightly exceeded the benchmark. This difference was primarily due to the uncertainty in anthropogenic VOC emissions (Wang et al., 2014), making accurate ozone simulations particularly challenging (Sun et al., 2022; Yang et al., 2024). The PM2.5 simulations were generally accurate, although the simulated concentrations in Tianjin during the winter of 2013 were slightly elevated, with an NMB of 32 %, exceeding the standard by 2 %; however, those in the other cities met the standard requirements.
Figure 3 shows a comparison between the simulated and observed concentrations in the six NCP cities during the winters of 2013 and 2018. Yantai was excluded from the comparison because of the inadequacy of the observation data. The data sources are listed in Table S4. The comparison results indicated that the simulated trends in the NCP were accurate during the winters of 2013 and 2018, with R values of 0.61 and 0.72, respectively, meeting the benchmark of 0.60. However, the simulation for 2013 yielded slightly overestimated values, with an MB of 1.27, corresponding to NMB = 7 % and NME = 51 %. In contrast, the simulation results for 2018 were closer to the observed values, with NMB = 5 % and NME = 51 %. Overall, the model demonstrated suitable stability and accuracy in simulating atmospheric pollutants in the NCP region, providing a solid foundation for future analysis.
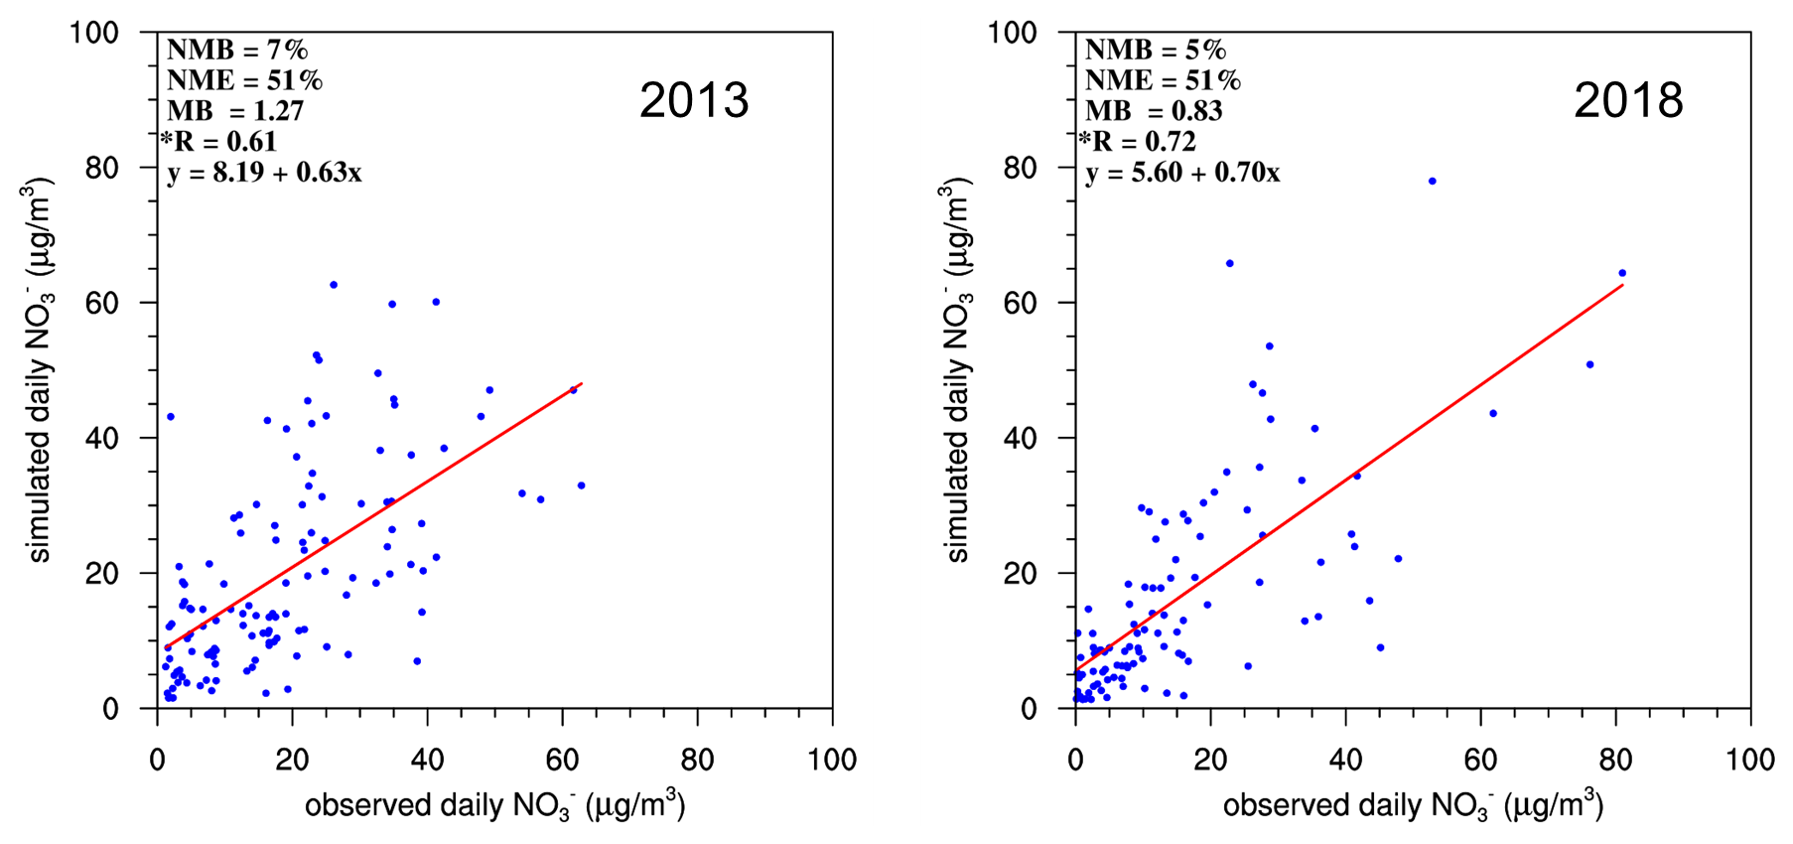
Figure 3Scatter plots of the simulated and observed daily mean concentrations in the NCP during the winter seasons of 2013 and 2018; the * symbol indicates R values that are statistically significant (P < 0.05).
3.2 Variations in the concentrations of PM2.5 and its components between 2013 and 2018
During the winter of 2013, the average PM2.5 concentration in the NCP reached 80.52 ± 77.13 µg m−3, with high-concentration areas mainly concentrated in the provinces of Beijing, Tianjin, southern Hebei, Henan, Shandong, and Anhui (Fig. 4). By 2018, the average PM2.5 concentration had decreased to 50.74 ± 49.26 µg m−3, representing a significant reduction of 37 ± 10 %. Previously, scholars reported similar trends in PM2.5 reduction across China (Li et al., 2023; Zhai et al., 2019). We found that the concentration decreased by 53 ± 5 %, whereas the and concentrations decreased by 13 ± 20 % and 33 ± 13 %, respectively (refer to Fig. S2 for city-specific changes). Our analysis revealed a pronounced difference in nitrate concentration. Specifically, inland cities experienced a more pronounced reduction in nitrate concentrations (4.6 % to 41.7 %), whereas coastal cities showed relatively small changes, with Yantai experiencing a 4.8 % decrease and Qingdao exhibiting a 3.9 % increase. The substantial reduction in the three inorganic components (, , and ) led to significant changes in the PM2.5 composition, with the proportion of nitrate increasing relative to that of sulfate (Fig. 5). Nitrate concentrations demonstrated significantly different patterns of reduction between coastal and inland regions, necessitating the identification of their dominant controlling factors to facilitate effective regional pollution control strategies.
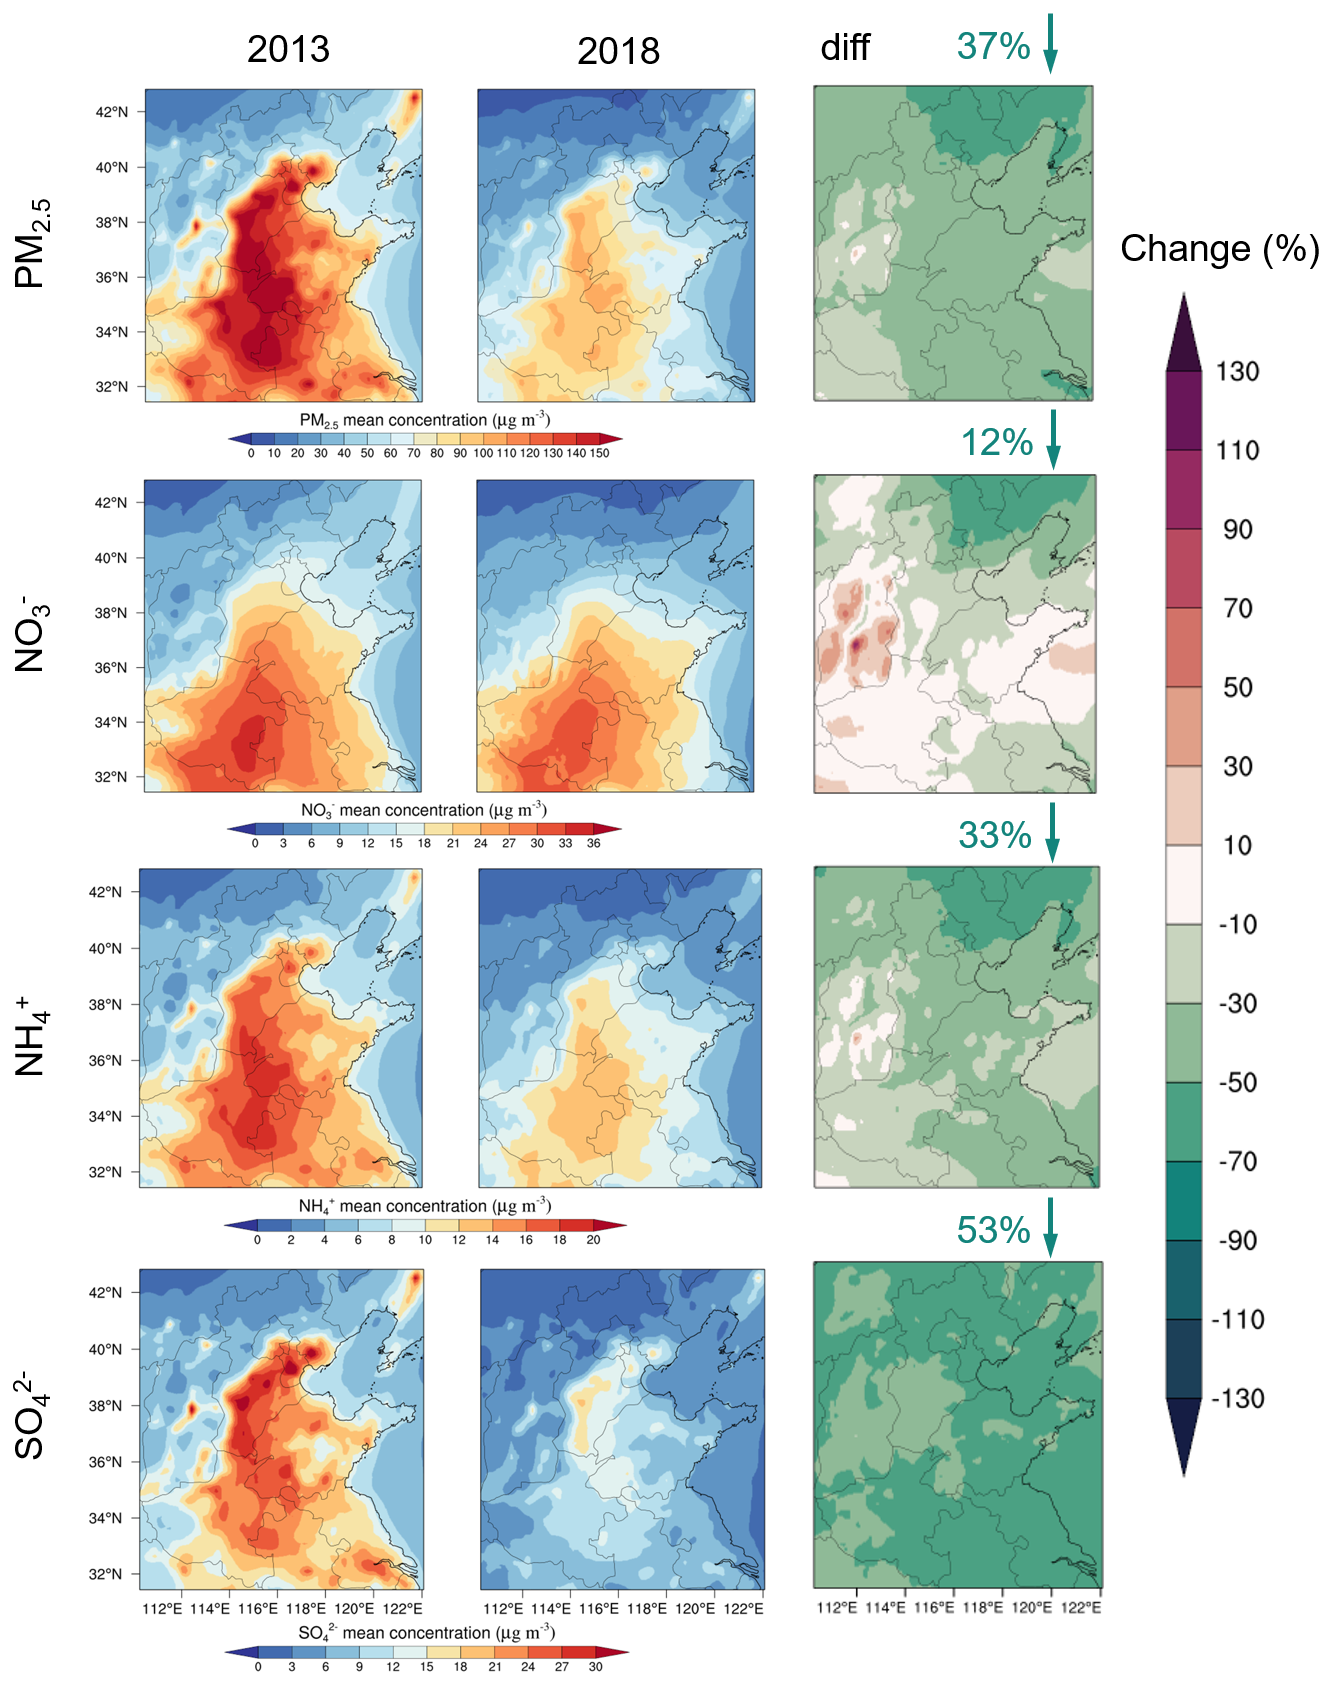
Figure 4Spatial distribution and changes in PM2.5 and its components in the NCP during the winters of 2013 and 2018. The up arrows indicate increases, and the down arrows indicate decreases.
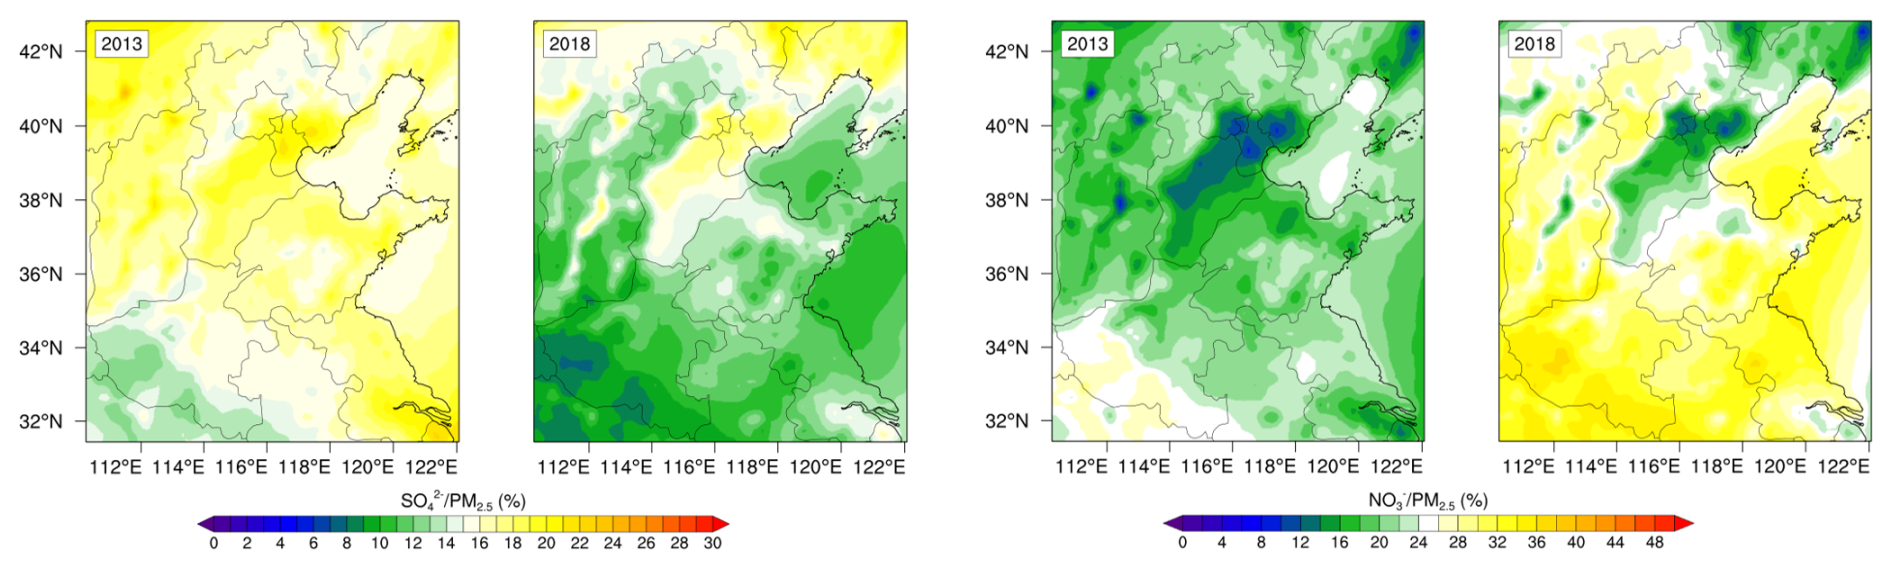
Figure 5Spatial distributions of the nitrate and sulfate proportions in PM2.5 in the NCP region during the winters of 2013 and 2018.
3.3 Rates, contributions, and diurnal variations in nitrate formation reactions in the major cities
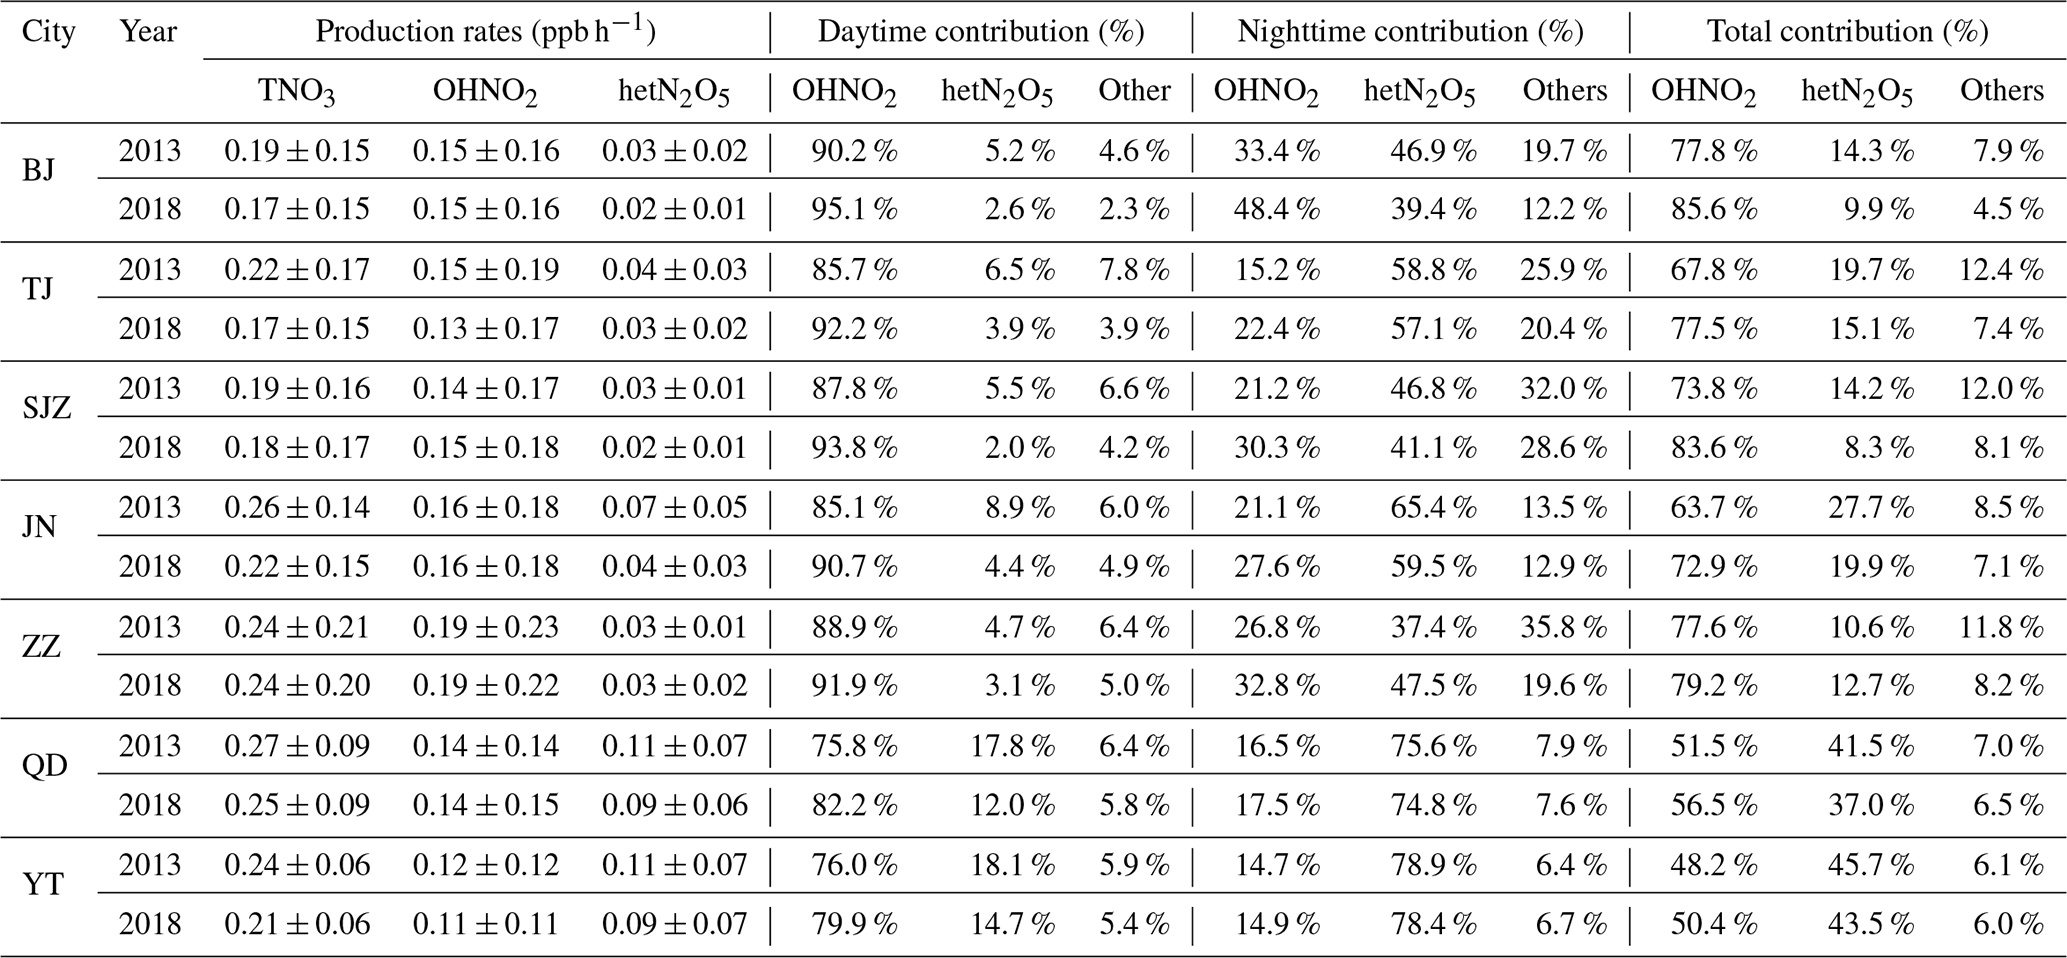
The concentration slightly decreased from 2013 to 2018 due to a decrease in the TNO3 production rate (0–0.05 ppb h−1), which could be attributed to the production rate of the hetN2O5 pathway (0–0.03 ppb h−1). According to Table 3, the contribution increased in Zhengzhou from 2013 to 2018, whereas it decreased in six cities, including Beijing (−4.4 %), Tianjin (−4.6 %), Shijiazhuang (−5.9 %), Jinan (−7.8 %), Qingdao (−4.5 %), Yantai (−2.2 %), and Zhengzhou (+2.1 %). For the OH+NO2 reaction pathway, the rate remained unchanged in all but four cities (Beijing, Jinan, Zhengzhou, and Qingdao); it varied between −0.02 and 0.01 ppb h−1 in the other cities. However, the contribution of the OH+NO2 reaction pathway to TNO3 formation increased overall due to the decreased rate of the hetN2O5 reaction pathway, although the production rate remained almost unchanged. Moreover, the contribution increase was greater in inland cities than in coastal cities. Among the five inland cities (Beijing, Tianjin, Shijiazhuang, Jinan, and Zhengzhou), the OH+NO2 reaction pathway was the main nitrate formation mechanism, with its contribution ratio ranging from 63.7 %–77.8 % in 2013 and increasing to 72.9 %–85.6 % in 2018. In contrast, in the two coastal cities (Qingdao and Yantai), the OH+NO2 reaction pathway contributed to 48.2 %–56.5 % of nitrate formation. However, the contribution of the hetN2O5 pathway ranged from 37.0 %–45.7 %. Therefore, both pathways were equally important in nitrate formation in coastal cities. These findings highlighted notable differences in nitrate formation mechanisms between inland cities and coastal cities, demonstrating that nitrate formation mechanisms were strongly affected by the ocean.
Table 3TNO3 production rates (ppb h−1) in the surface layer and contributions (%) of the major production pathways in the surface atmosphere in seven representative cities of the NCP in 2013 and 2018.
Since the OH+NO2 and hetN2O5 reactions were the major pathways affecting nitrate formation, we comprehensively analyzed the diurnal variations in these two TNO3 formation reactions in the NCP, considering the inland city of Beijing and the coastal city of Qingdao as examples. Figure 6 shows the average diurnal variations in the TNO3 production rates via the different pathways in Qingdao and Beijing. We found that the OH+NO2 reaction pathway exhibited similar diurnal characteristics in these two cities. Specifically, from night to the early morning (00:00 to 08:00 CST (UTC+8)), the reaction rate under this pathway remained almost zero because of the lack of photochemical processes that generated OH radicals; these processes were limited by solar radiation (Liu et al., 2020; Sun et al., 2022; Tan et al., 2021). Observational data from the Pearl River Delta region supported this result, showing that OH radicals only began to accumulate significantly after 06:00 CST (UTC+8) (Hofzumahaus et al., 2009; Lu et al., 2012). After approximately 08:00 CST (UTC+8), the reaction rate rapidly increased, reaching a peak between 11:00 and 13:00 CST (UTC+8) at approximately 0.4 ppb h−1 (∼ 2.8 ), resembling the findings for the NCP and Shanghai (Tan et al., 2021; Sun et al., 2022; Liu et al., 2020). The reaction rate decreased with decreasing sunlight during the afternoon and returned to low levels at night due to a decrease in the number of photochemical processes that occurred. Compared with those during the winter of 2013, the peak reaction rates of the OH pathway decreased from 0.43 to 0.42 ppb h−1 and from 0.45 to 0.44 ppb h−1 in 2018 in Qingdao and Beijing, respectively. The contributions of the OH+NO2 reaction pathway to TNO3 formation were in the ranges of 90.2 %–95.1 % and 75.8 %–82.2 % in Beijing and Qingdao, respectively, during the daytime. However, the other cities in the NCP exhibited similar diurnal variations. Therefore, the OH+NO2 reaction pathway dominated during the daytime in both the inland and coastal cities.
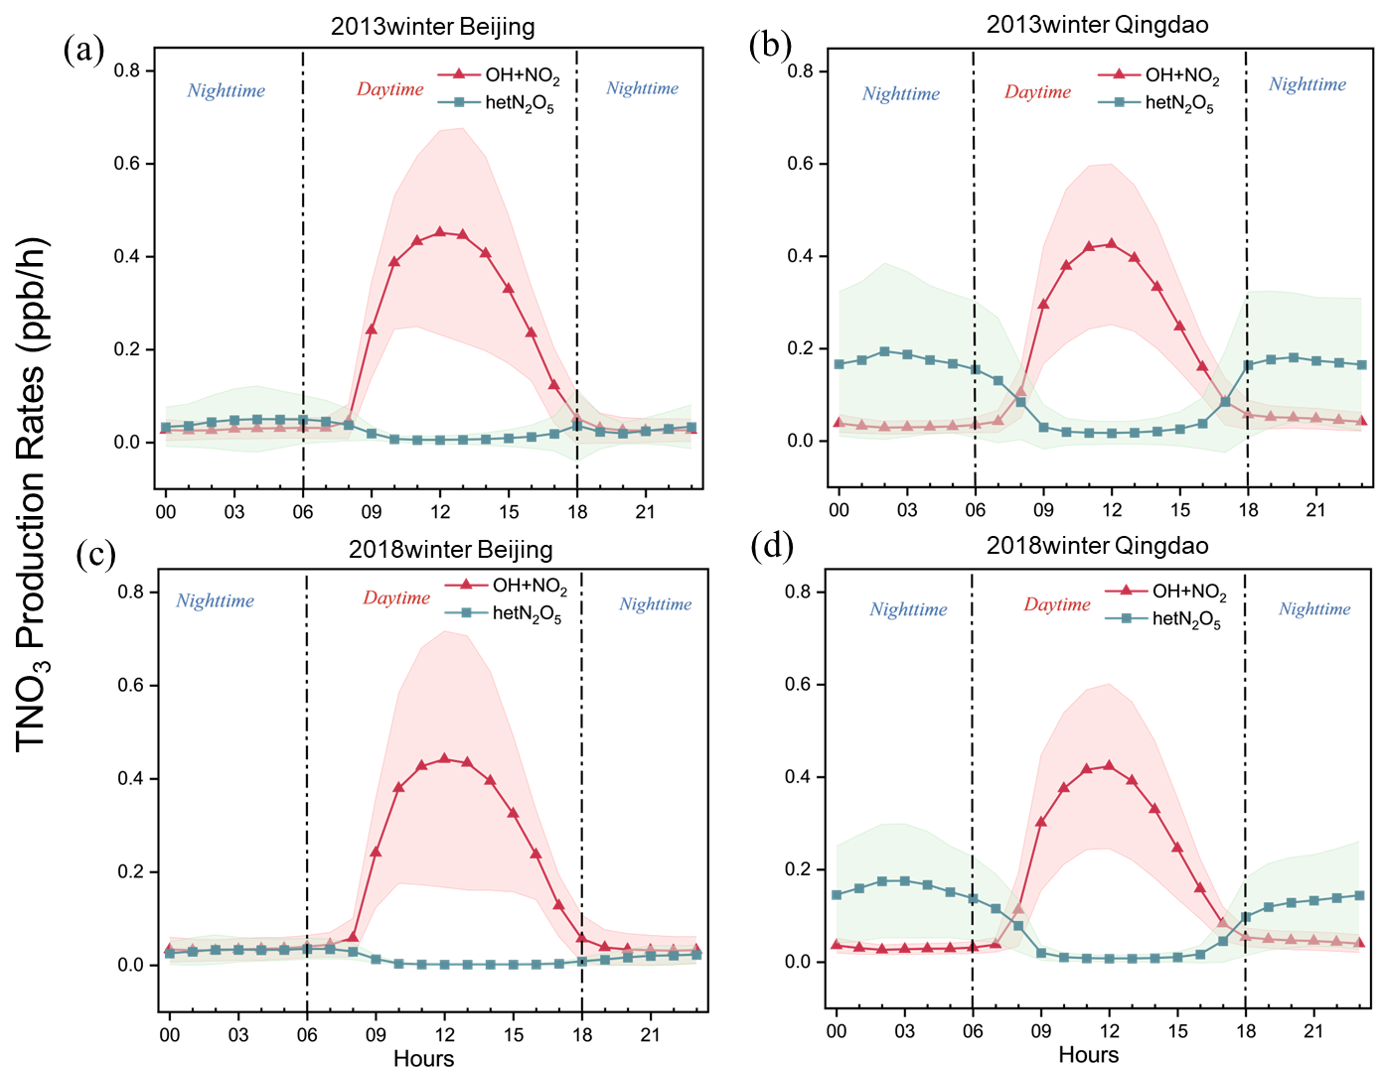
Figure 6Average diurnal variation in the TNO3 production rate under different pathways (daytime: 06:00–18:00 CST (UTC+8); nighttime: 18:00–06:00 CST (UTC+8)): (a) Beijing 2013, (b) Qingdao 2013, (c) Beijing 2018, and (d) Qingdao 2018.
At night, the hetN2O5 reaction pathway notably affected TNO3 formation. The rate of the hetN2O5 reaction pathway showed similar bimodal diurnal variations in Qingdao and Beijing. However, the peak values occurred at 02:00 and 20:00 CST (UTC+8) in Qingdao, with much higher peak values than those in Beijing, where the peak values occurred from 04:00–05:00 and 18:00 CST (UTC+8). The hetN2O5 reaction rate was relatively high at night but decreased rapidly by early morning, reaching its lowest point during the daytime (09:00 to 16:00 CST (UTC+8)). This phenomenon occurred because the N2O5 hydrolysis reaction depended heavily on NO3 radicals and N2O5, which were only stable in weakly illuminated environments (Tie et al., 2003a, b; Atkinson et al., 2004).
High concentrations of NO2 and O3, precursors for N2O5, were considered key in this process (Dentener and Crutzen, 1993).
However, owing to high rates of photolysis during the day, NO3 radicals and N2O5 could accumulate only at night (Zhao et al., 2023; Atkinson et al., 2004). In Beijing, the hetN2O5 reaction rate was relatively low, with a peak value of only 0.03 ppb h−1 and a nighttime contribution rate of 46.9 %. In contrast, Qingdao presented a peak hetN2O5 reaction rate of 0.2 ppb h−1 (approximately 1.4 ) at night, with an average contribution of 75.2 %. This difference arose primarily due to the higher N2O5 concentrations and RH levels in Qingdao than in Beijing, as detailed in Sect. 3.5.3. The other inland cities exhibited diurnal variations similar to those in Beijing, whereas the coastal cities presented trends similar to those in Qingdao. Compared with those during the winter of 2013, the reaction rates of the hetN2O5 pathway in both cities during the winter of 2018 decreased from 0.19 to 0.18 ppb h−1 in Qingdao and from 0.07 to 0.03 ppb h−1 in Beijing. A comparative analysis revealed significant variations in the nitrate formation pathways between the coastal and inland areas, particularly in the hetN2O5 reaction rate (Fig. 7). The factors influencing these variations are discussed in Sect. 3.5.3, which specifically addresses the underlying mechanisms responsible for the differences in hetN2O5 reaction rates between coastal and inland regions.
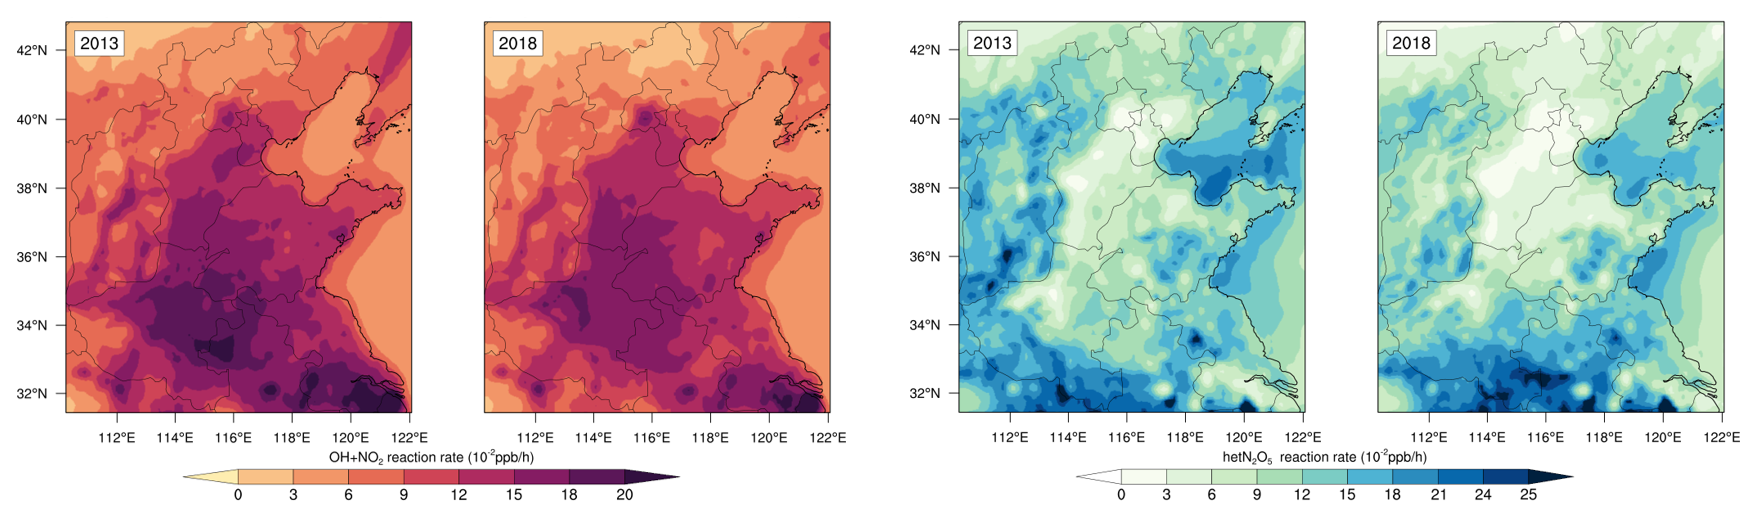
Figure 7Spatial distributions of the mean reaction rates for the nitrate formation pathways (OH+NO2 and hetN2O5) in the NCP during the winters of 2013 and 2018.
3.4 Assessment of the simulated nitrate formation reactions via the isotopic method
To verify the accuracy of nitrate formation reaction simulations, we conducted a comprehensive isotope analysis in Qingdao and Beijing. The isotope analysis conducted in Qingdao and Beijing for the 2013 and 2018 data (Fig. 8) revealed that the model-simulated and isotope-based contributions of formation pathways generally exhibited consistent trends, although some differences were observed. In 2013 in Qingdao, the CMAQ model yielded contribution values of 72.9 % (OH+NO2) and 18.7 % (hetN2O5), whereas the isotope analysis suggested 62.4 ± 22.5 % and 37.6 ± 22.5 %, respectively. By 2018 in Beijing, the model yielded 89.5 % vs. an isotope-derived 76.5 ± 15.8 % for OH+NO2 and 5.4 % vs. 23.5 ± 15.8 % for hetN2O5. Overall, although the differences persisted, the model captured the general trends, and the deviations fell within an acceptable range, indicating that the model simulations generally agreed with the isotope analysis. Several factors could explain these discrepancies. First, the isotope analysis carried intrinsic uncertainties, commonly approximately 10 %–30 %, due to the standard deviations (SDs) in each pathway's endmember calculations and the posterior probability distributions generated by the Bayesian model (Moore and Semmens, 2008). Second, the isotope analysis considered only two principal pathways: OH+NO2 and hetN2O5. Although the other pathways only contributed to a small fraction of formation, their omission could cause biases, especially under specific meteorological or pollution conditions. Third, the IRR module did not consider long-range transport effects, which could further contribute to the discrepancies in the isotope results. In brief, the model simulation results align reasonably well with the isotope analysis findings despite some discrepancies between the two methods.
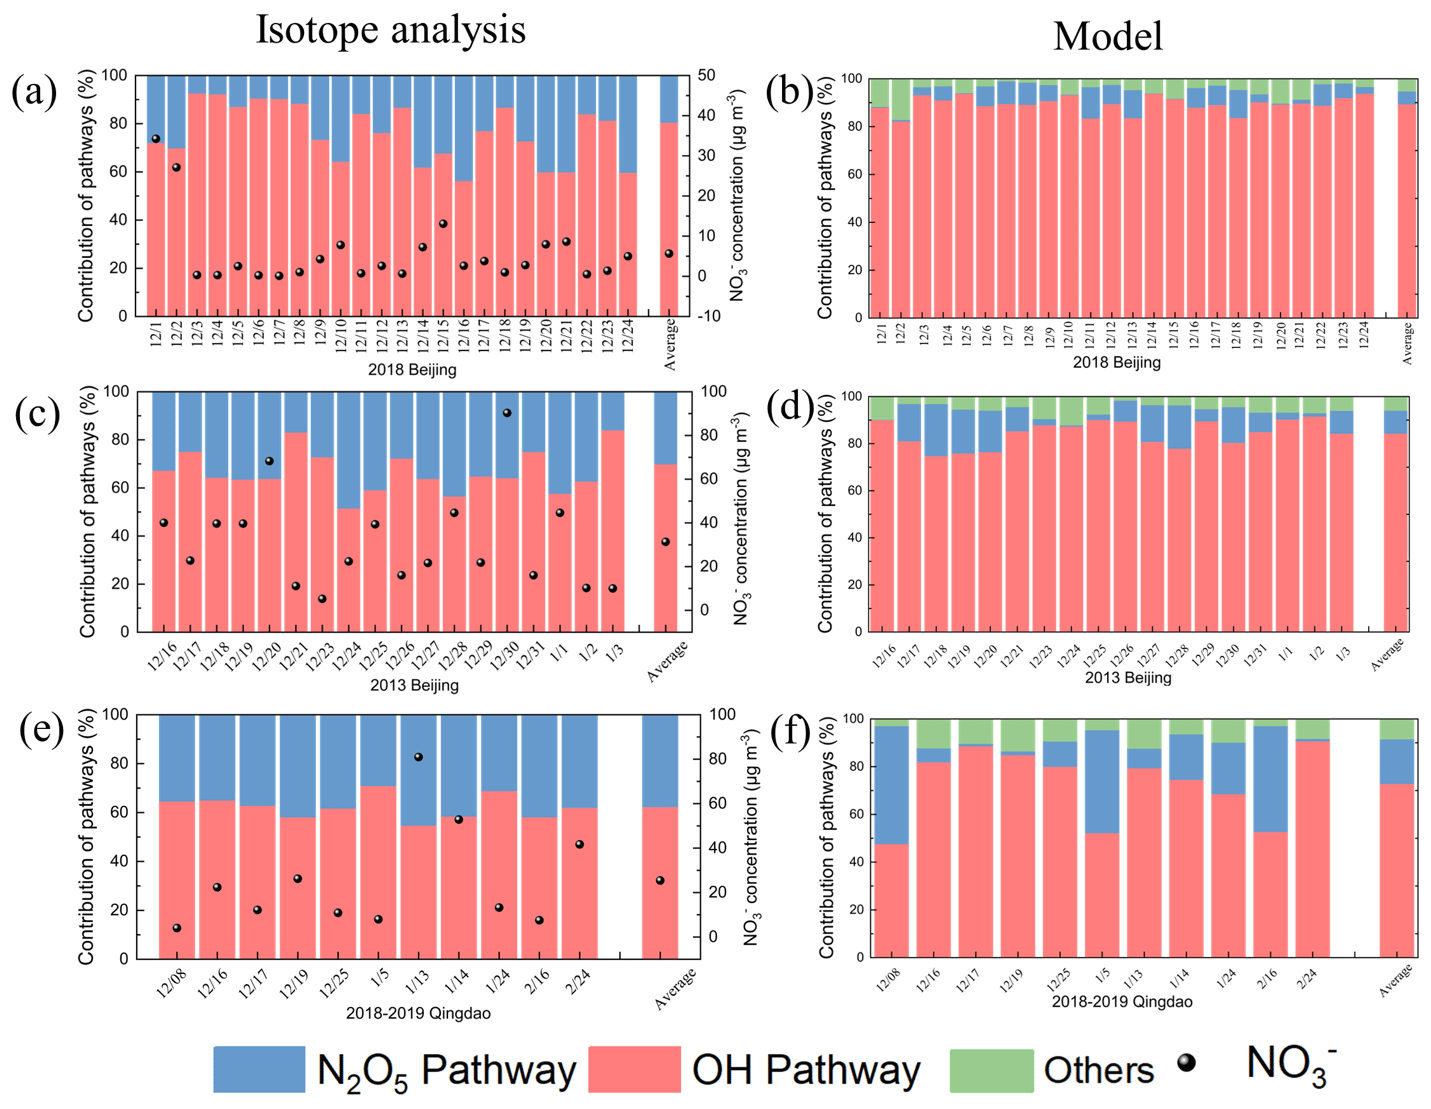
Figure 8Time series of the contributions of the atmospheric formation pathways: (a, b) Beijing 2018, (c, d) Beijing 2013, and (e, f) Qingdao 2018, based on (a, c, e) dual-isotope analysis and (b, d, f) model simulations.
Notably, both the model and isotope results indicated an increasing trend in the OH+NO2 pathway contribution in Beijing from 2013 to 2018 (Fig. 9), with the model and isotope analysis showing increases of 5.1 % and 9.7 %, respectively. This trend reflected the increased atmospheric oxidation capacity in the region. Regional comparative analysis revealed significant differences in nitrate formation pathways between Qingdao and Beijing (Fig. 9). In 2018, the Qingdao model results showed contributions of 72.9 % and 18.7 % to the total nitrate formation for the OH+NO2 and hetN2O5 pathways, respectively, compared with the isotope results of 62.4 ± 22.5 % and 37.6 ± 22.5 %, respectively. In contrast, the Beijing model results indicated contributions of 89.5 % and 5.4 % to the total nitrate formation for the OH+NO2 and hetN2O5 pathways, respectively, whereas the isotope results were 76.5 ± 15.8 % and 23.5 ± 15.8 %, respectively. Both methods demonstrated that the OH+NO2 pathway dominated nitrate formation in Beijing, while the hetN2O5 pathway played a substantial role in Qingdao, highlighting regional differences in the mechanism of nitrate formation and resulting in different changes in the nitrate concentration.
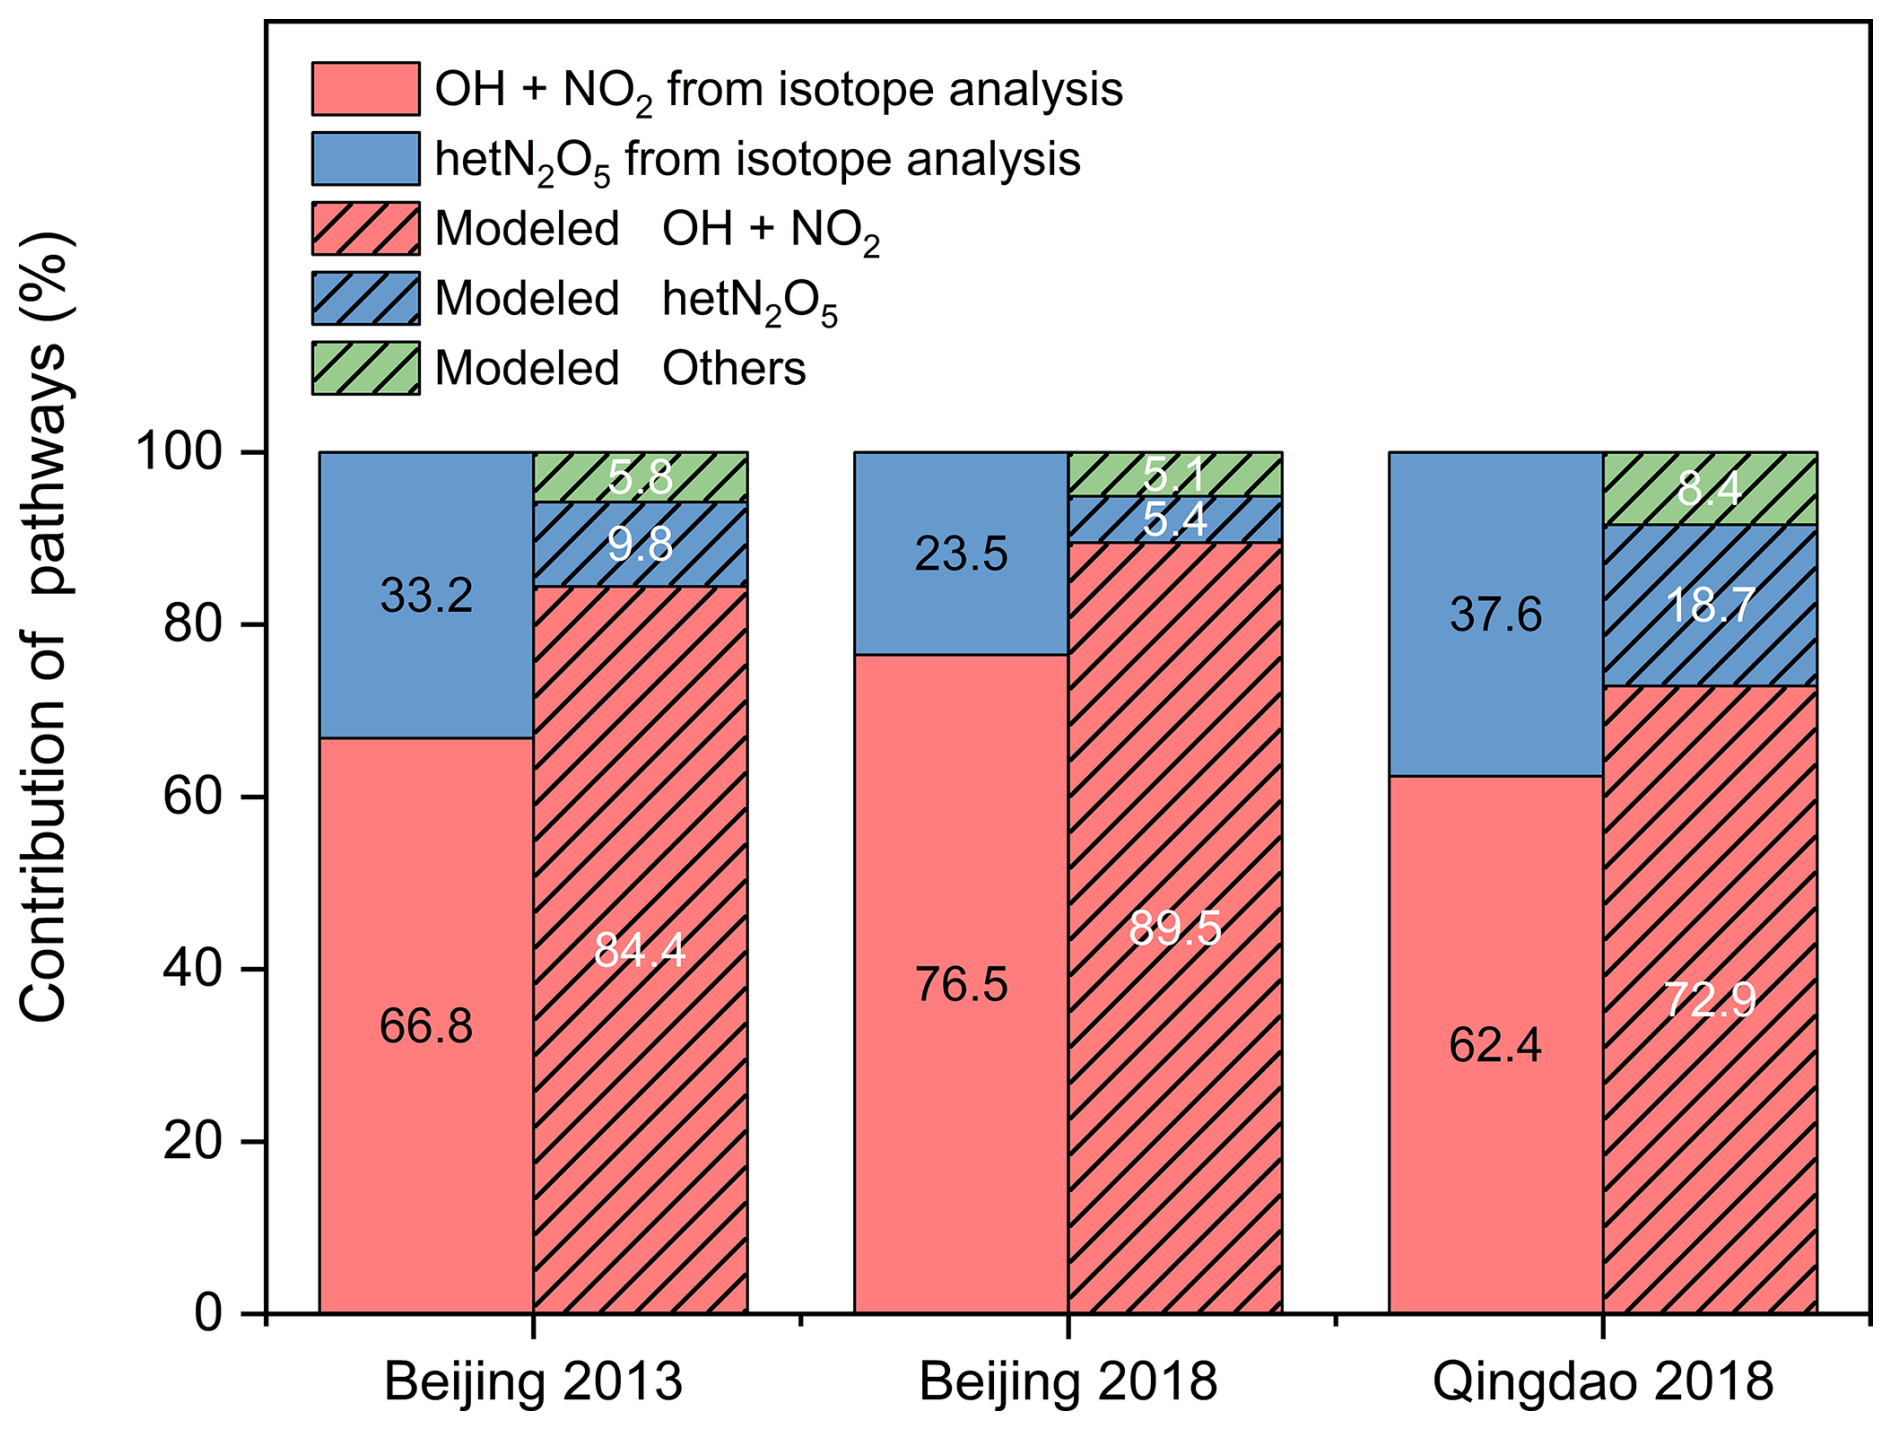
Figure 9Comparison of the contributions of the atmospheric formation pathways based on the dual-isotope results and model simulations for Beijing in 2013 and 2018 and for Qingdao in 2018.
As discussed above, field observation data could include contributions from long-range transport (Walters et al., 2024); however, the CMAQ model's IRR module confined nitrate formation to individual grid cells. To quantify this discrepancy, we employed a backward trajectory analysis method incorporating temporal and spatial constraints to calculate the source regions and their contributions to the nitrate formation pathway.
The backward trajectory correction significantly altered the estimated nitrate formation pathways (Fig. 10). In Qingdao, the corrected model results revealed an average OH+NO2 pathway contribution of 33.3 %, which was substantially lower than the isotope analysis result of 62.4 ± 22.5 %, whereas the hetN2O5 pathway contribution was 58.4 %, which was significantly greater than the isotope result of 37.6 ± 22.5 %. In Beijing, the corrected model in 2013 indicated an OH+NO2 pathway contribution of 48.3 % (isotope: 66.8 ± 26.1 %) and a hetN2O5 pathway contribution of 38.5 % (isotope: 33.2 ± 26.1 %). In 2018, the corrected model showed an OH+NO2 pathway contribution of 57.2 % (isotope: 76.5 ± 15.8 %) and a hetN2O5 pathway contribution of 35.1 % (isotope: 23.5 ± 15.8 %). Compared with the uncorrected model, the backward trajectory correction significantly improved the estimation of the hetN2O5 pathway contribution (Qingdao: from −18.9 % to +20.8 %; Beijing: from −18.1 % to +11.6 %) but exacerbated the discrepancy in the OH+NO2 pathway contribution (Qingdao: from +10.5 % to −29.1 %; Beijing: from +13.0 % to −19.3 %). The effects of this correction exhibited regional differences: the improvement in the hetN2O5 pathway was more pronounced in Qingdao, where regional transport had a greater impact, whereas the overadjustment of the OH+NO2 pathway was more evident in Beijing, where local processes were dominant.
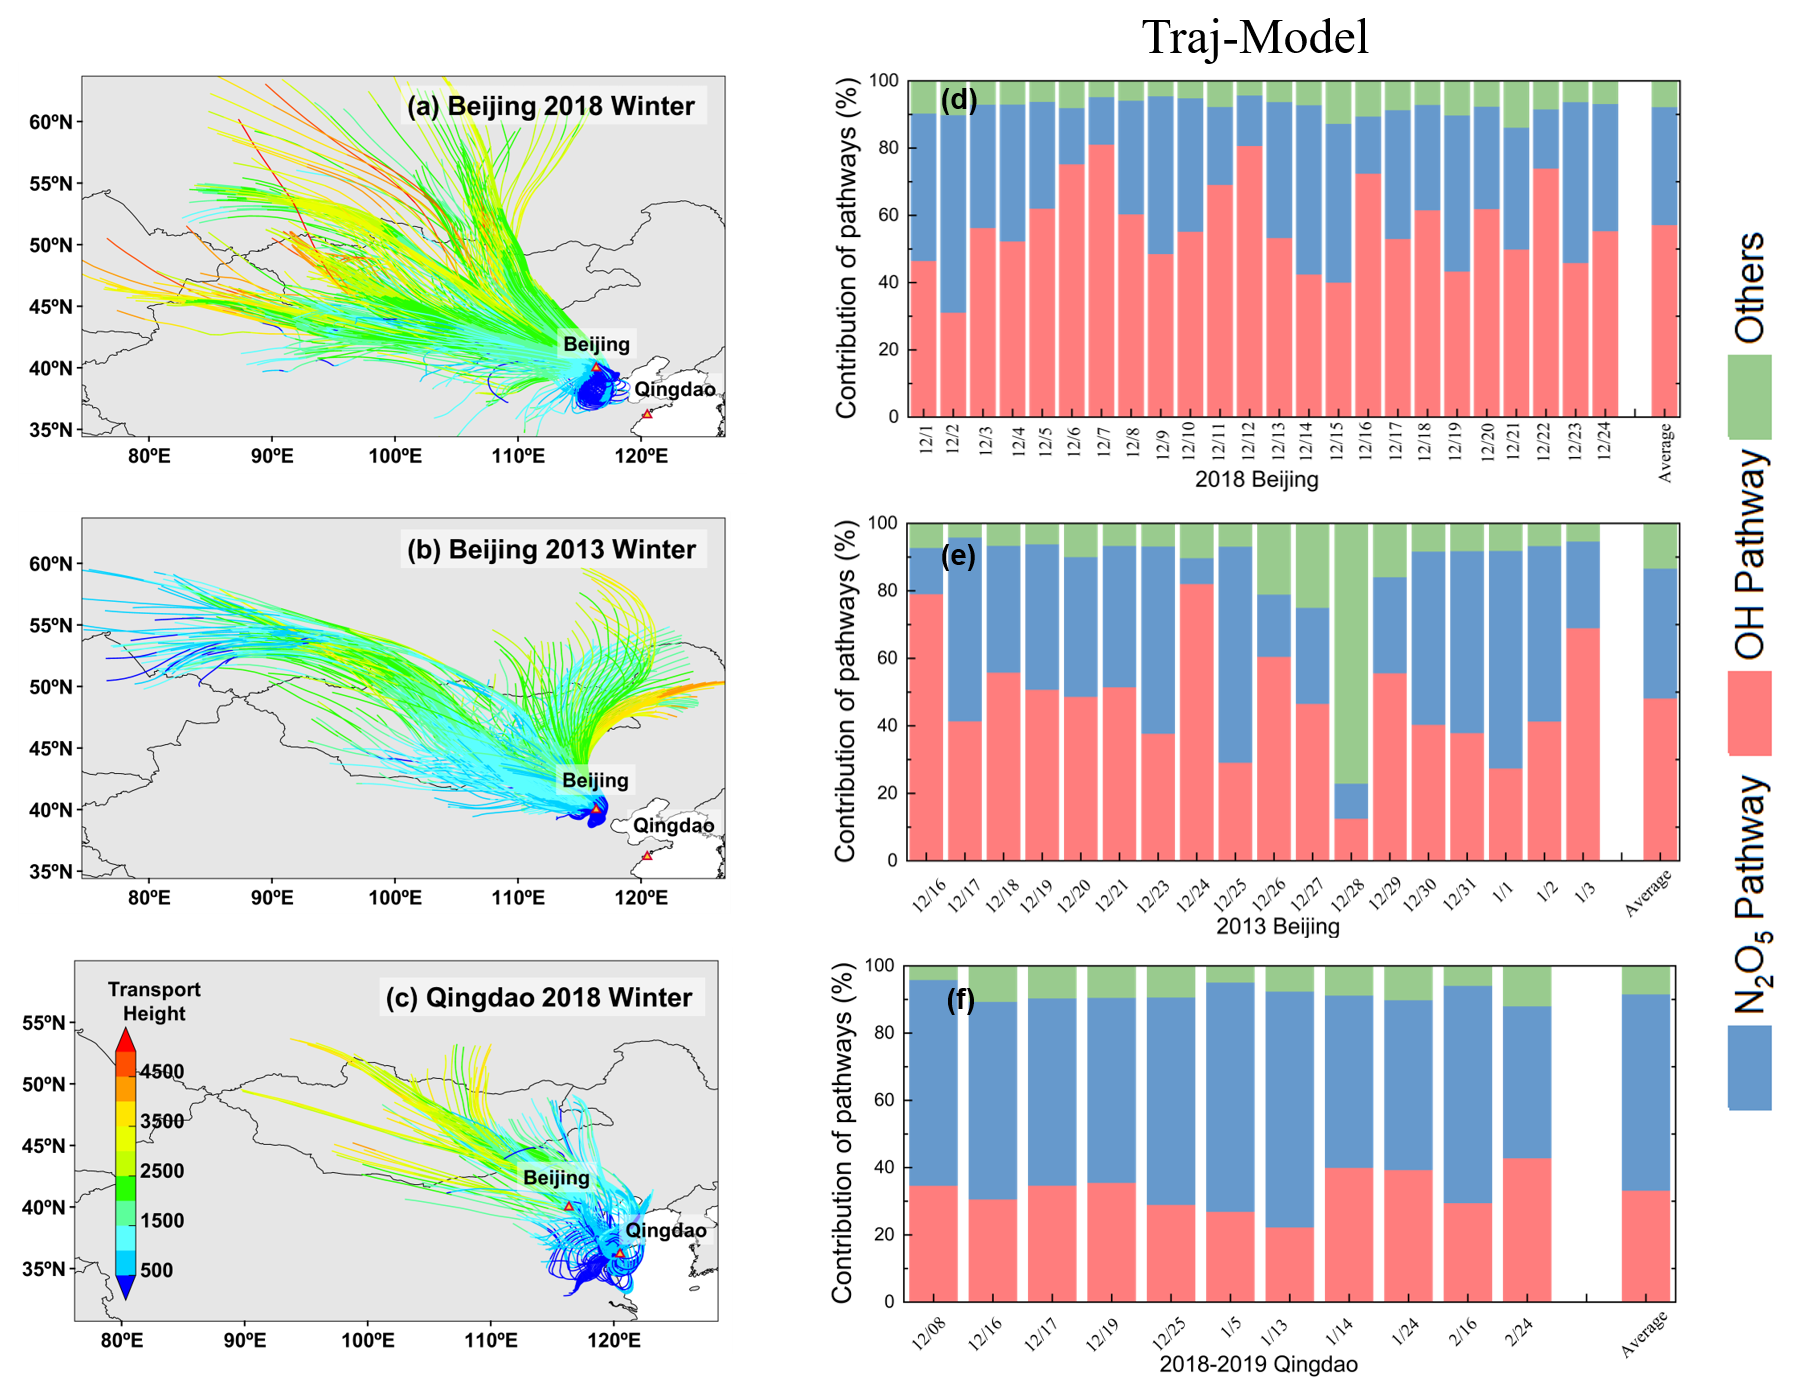
Figure 10Backward trajectories and nitrate formation pathways: (a–c) backward trajectories for (a) Beijing 2018, (b) Beijing 2013, and (c) Qingdao 2018; time series of the contributions of the atmospheric formation pathways based on backward-trajectory-constrained model simulations for (c) Beijing 2018, (d) Beijing 2013, and (e) Qingdao 2018.
Remarkably, Walters et al. (2024) achieved relatively accurate results using the unmodified IRR module without considering transport effects, reporting an overall RMSE of 2.6 ‰ for Δ17O(HNO3) between modeled and observed values. This finding indicated that if the trends in nitrate formation pathways were similar across regions and vertical layers, the impact of transport on the overall simulation accuracy could be limited (Walters et al., 2024). Our results highlighted that in regions with significant spatial heterogeneity in formation pathways, such as Qingdao and Beijing, incorporating transport effects through backward trajectory analysis remained crucial for improving model performance.
These results demonstrated that backward trajectory correction played a positive role in improving the estimation of the hetN2O5 pathway, particularly in regions significantly influenced by regional transport. However, the overadjustment of the OH+NO2 pathway highlighted the need for further optimization of the correction method. Key areas for improvement would include refining OH radical concentration estimates and optimizing the quantification of regional transport. Currently, the overly broad consideration of transport regions could obscure local formation signals, suggesting a need for increasingly precise spatial delineation in transport modeling. These enhancements would be essential for improving the model's applicability across different regions and under varied meteorological conditions. Currently, owing to the lack of successful transport correction methodologies, we discuss the influencing factors without applying correctional procedures.
3.5 Factors influencing nitrate formation pathways
To explore the reasons for the observed coastal–inland differences in nitrate formation, we further investigated the influences of several key factors, including NH3, NO2, OH, O3, RH, NO, and N2O5, on these pathways.
3.5.1 Influence of NH3 on nitrate formation
The reaction of NH3 with nitric acid (HNO3) to form ammonium nitrate (NH4NO3) was considered an important process in the formation of atmospheric aerosols. In the absence of sufficient NH3, the material would first react with H2SO4 to form (NH4)2SO4 and then with HNO3 to form NH4NO3 (Zhai et al., 2021). The availability of NH3 was considered a critical factor governing the partitioning of HNO3 to particulate nitrate (pNO3). The gas ratio (GR) (Fu et al., 2020; Ansari and Pandis, 1998) was used to study whether NH3 limits nitrate formation. The GR could be calculated as follows.
When the GR exceeded 1, the NH3 concentration in the atmosphere was considered sufficient. A GR value between 0 and 1 indicated NH3-neutral conditions, whereas a value less than 0 suggested NH3-poor conditions, thus limiting formation due to insufficient NH3. In the NCP region, the GR values were generally greater than 2 in 2013 and 2018 (Fig. 11), indicating that the region mainly exhibited a state of sufficient NH3. Similar phenomena were observed by other researchers in the NCP region (Zhai et al., 2021; Xu et al., 2019c; Li et al., 2018). Therefore, in the NCP region, the formation of NH4NO3 was not limited by NH3 in terms of supply.
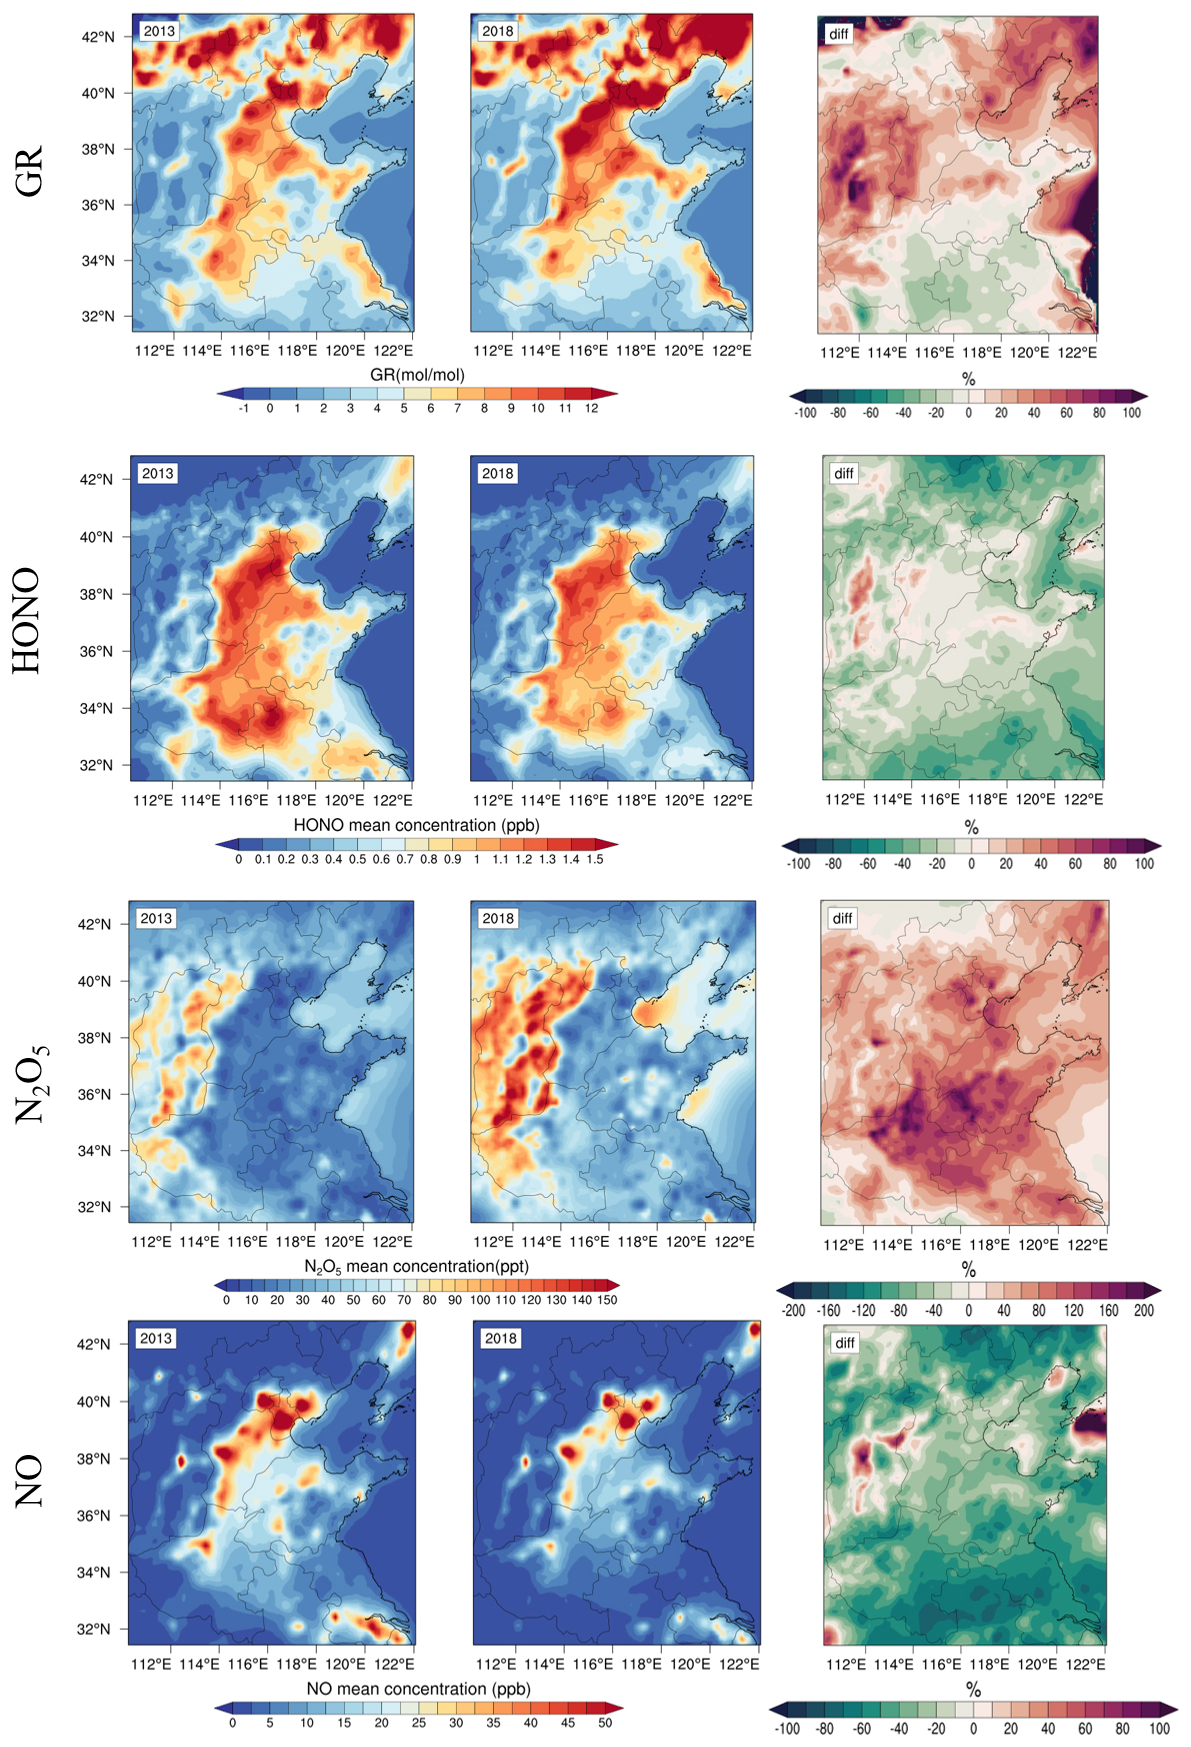
Figure 11Spatial distributions and interannual variations in the GR, HONO, N2O5, and NOx concentrations over the North China Plain during the winters of 2013 and 2018. The percentage changes (diff) represent the relative differences between 2018 and 2013.
The GR in 2018 was greater than that in 2013, indicating an increasing surplus of NH3. We believed that the variation in GR was caused by the significant reduction in sulfate and slight reduction in nitrate in PM2.5 (Fig. 12a) because of the minimal changes in NH3 emissions. This hypothesis could be verified from an emission perspective. The total ammonia emissions in China increased from 9.64 to 9.75 Tg from 2013–2015 and then gradually decreased to 9.12 Tg by 2018 (Liao et al., 2022). Additionally, there were coastal–inland differences in NH3 surplus levels. Notably, the NH3 surplus ratio was consistently greater than 3.4 in inland regions, whereas it ranged from 1.7 to 2.5 in coastal cities. This difference was attributed primarily to intensive industrial activities related to fertilizer production in inland areas, which resulted in increased NH3 emissions. Data showed that NH3 emissions from fertilizer production in the inland regions of the NCP ranged from 1.0 to 40.0 Gg yr−1, whereas emissions in coastal areas were significantly lower, ranging only from 0 to 0.1 Gg yr−1 (Chen et al., 2022).
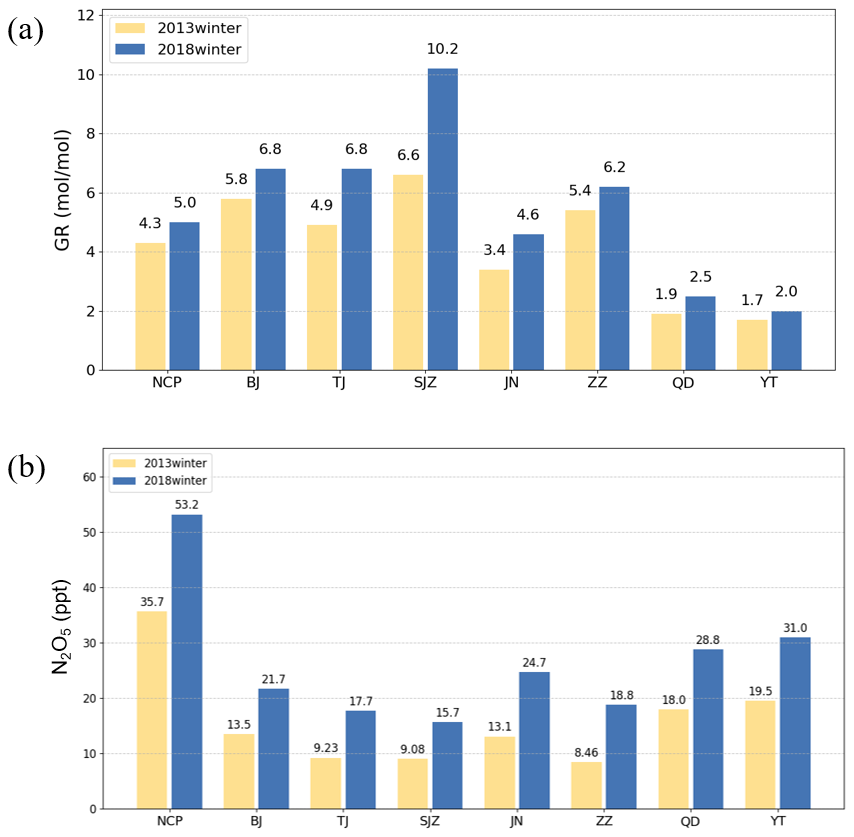
Figure 12(a) GR and (b) N2O5 concentrations across the North China Plain and seven major cities during the winters of 2013 and 2018.
In summary, NH3 played a critical role in influencing particulate nitrate concentrations by affecting the gas-to-particle conversion of HNO3 in the NCP region, although its availability was sufficient. Furthermore, variations in NH3 emissions and distinct land–ocean transport patterns significantly affected the formation and spatial distribution of particulate nitrate.
3.5.2 Factors influencing the OH + NO2 reaction rate
As the OH+NO2 reaction significantly contributed to TNO3 formation, the OH and NO2 concentrations served as key factors. The NO2 concentration in the NCP was 30.3 µg m−3 during the winter of 2013 and decreased to 24.7 µg m−3 during the winter of 2018, and its concentration remained several orders of magnitude greater than that of OH radicals. Figure S3 shows that the molar ratio in the NCP region generally exceeded 108, indicating that the NO2 concentration was in excess under emission reduction measures. Therefore, the reaction primarily depended on the OH radical concentration. Next, we examined the impact of the OH radical concentration on the reaction rate. OH radicals were produced primarily via photochemical reactions, such as by the decomposition of HONO into OH and NO under sunlight (Song et al., 2023), which could account for 20 % to 90 % of the total primary production of OH radicals (Song et al., 2023; Xue et al., 2020; Kim et al., 2014a). Additionally, OH radicals could be produced indirectly via O3 photolysis in the presence of water vapor (Fu et al., 2020; Kim et al., 2014a).
We compare the simulated and observed OH radical concentrations in Table 4. The simulated daily average OH radical concentrations were relatively close to the observed values. However, the peak concentrations of OH radicals were lower than those observed. Underprediction of the OH peak concentration was determined to be a common issue in current model simulations (Czader et al., 2013; Stone et al., 2012; Xue et al., 2020). Although the CMAQ model often underestimated high daytime concentrations (Czader et al., 2013), it satisfactorily captured the diurnal variation in OH radicals, likely because it underestimated HONO concentrations (Zhang et al., 2023b). The data (Fig. 13a–c) revealed that the peak value of OH radicals in Beijing significantly increased by 0.98 × 10⁶ molec. cm−3 in 2018 compared with that in 2013. A similar trend was observed in Qingdao, with an increase of 0.58 × 10⁶ molec. cm−3. The GEOS–Chem simulations (Zhang et al., 2023a) indicated a stable upward trend in OH radical concentrations across the NCP from 2014 to 2017, ranging from 0.05 to 0.17 × 10⁶ molec. cm−3 yr−1. Our study data suggested that despite China's emission reduction measures, these efforts did not effectively control OH radical concentrations. The continuous increase in OH radicals accelerated the nitrate formation rate via the OH+NO2 pathway.
Table 4Observations and CMAQ model simulation results for the winter OH radical concentration.
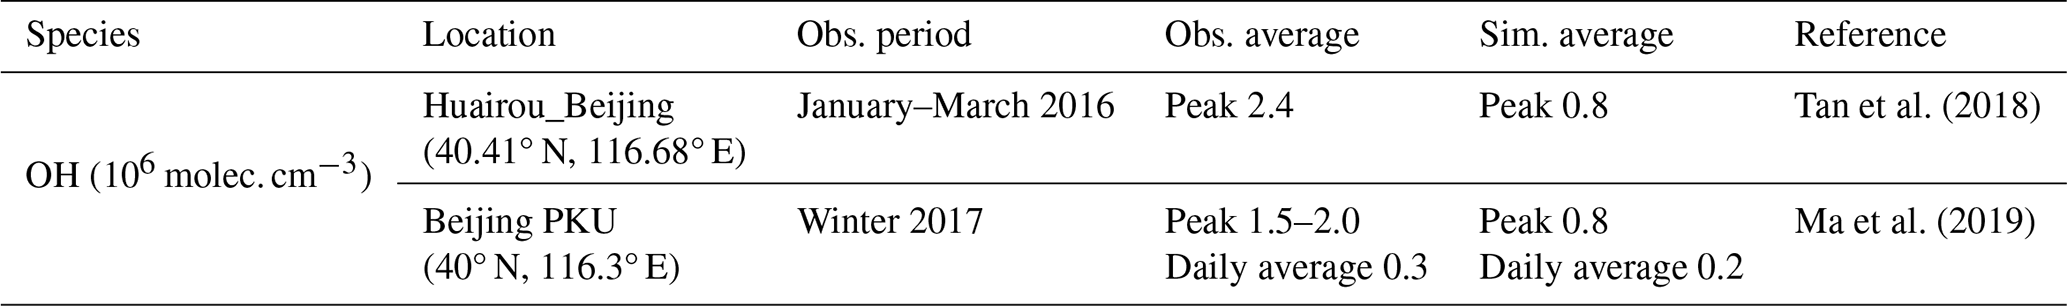
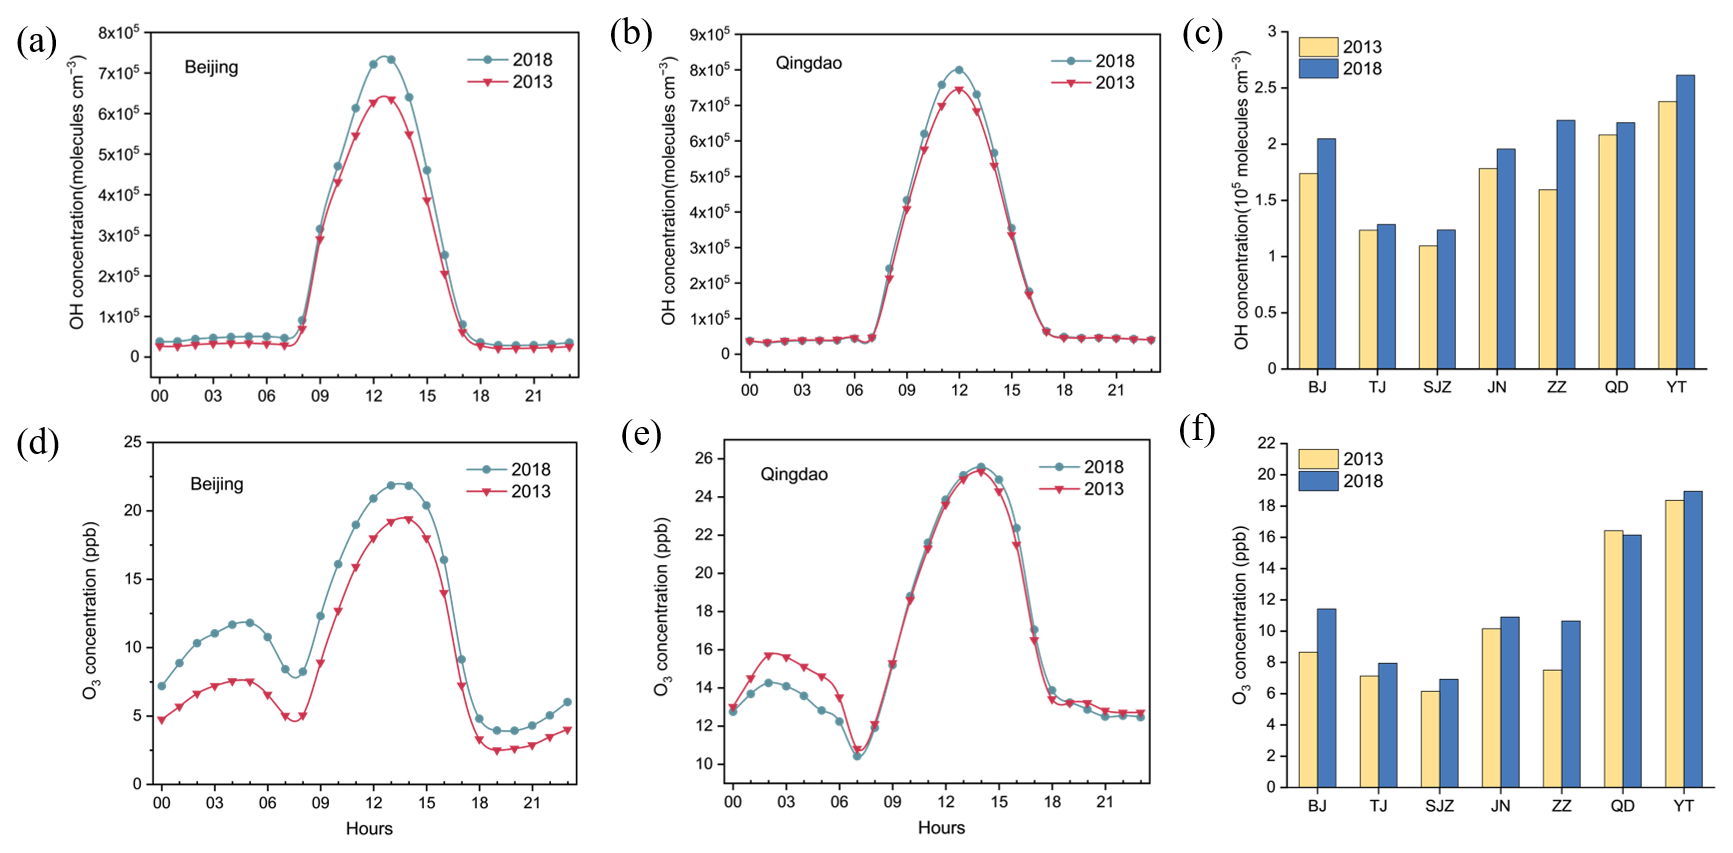
Figure 13Diurnal variations in OH radicals and O3 in Beijing and Qingdao and average concentrations across seven major cities in the NCP (2013, 2018): (a) diurnal variation in OH radicals in Beijing, (b) diurnal variation in OH radicals in Qingdao, (c) average OH radical concentration in the seven cities, (d) diurnal variation in O3 in Beijing, (e) diurnal variation in O3 in Qingdao, and (f) average O3 concentration in the seven cities.
One of the primary pathways for the production of OH radicals was the photolysis of nitrous acid (HONO) in the tropospheric atmosphere. This photolytic reaction can be expressed as follows.
However, the data indicated that the HONO concentration decreased between 2013 and 2018 (Fig. 11), suggesting that this production pathway did not significantly contribute to the increase in the OH radical concentration.
In the atmosphere, another source of OH was the reaction between water vapor (H2O) and excited oxygen atoms (O(1D)). Notably, excited oxygen atoms would typically be produced via O3 photolysis (Kim et al., 2014a; Tan et al., 2019).
The excited oxygen atoms (O(1D)) subsequently reacted with water vapor to produce OH radicals.
Therefore, O3 photolysis played an indirect but crucial role in the formation process. O3 could oxidize NO to NO2, which then could react with OH radicals to form HNO3, significantly influencing the OH+NO2 pathway. As shown in Fig. 13d–f, the increase in the O3 concentration indirectly increased the OH+NO2 reaction rate for nitrate formation. This effect was greater in inland cities, where the increase in the O3 concentration was greater than that in coastal cities, leading to a greater contribution of the OH+NO2 pathway. Thus, the OH and O3 concentrations affected the formation rate and contribution of the OH+NO2 pathway to nitrate formation due to the excess NO2 concentration, although the NO2 emissions decreased. Therefore, inland cities should prioritize controlling the emissions of VOCs and NOx. These pollutants could generate OH radicals through photochemical reactions, which would subsequently dominate nitrate formation via the OH+NO2 pathway. By reducing precursor emissions (VOCs and NOx), the production of OH radicals could be suppressed, thereby slowing the reaction kinetics and mitigating atmospheric nitrate accumulation.
3.5.3 Factors influencing hetN2O5 reaction rates
The heterogeneous N2O5 reaction was considered a major pathway for nitrate formation influenced by many factors, including the N2O5 concentration, aerosol surface area, and uptake coefficient of N2O5 (γN2O5). The value of γN2O5 varied widely, ranging from an extremely low value of 10−4 to a relatively high value of 0.1 (Wang et al., 2023). Experimental results indicated that environmental factors such as temperature and humidity; the composition of aerosols such as , Cl−, and ; the liquid water content in aerosols; the presence of organic compounds; and the mixing state of aerosols were critical factors influencing γN2O5 (Folkers et al., 2003; Mitroo et al., 2019; Thornton and Abbatt, 2005; Wahner et al., 1998; Wang et al., 2020). These factors collectively influenced the reaction rate and yield of heterogeneous N2O5 reactions.
With increasing concentrations of atmospheric O3 (Fig. 13f), the generation rate of N2O5 significantly increased. Consequently, the average N2O5 concentration in the NCP was 35.7 ppt in 2013 and increased to 53.2 ppt in 2018 (Fig. 12b). However, the N2O5 concentrations were generally higher in ocean areas and western mountainous regions than in central inland areas. We found that this spatial distribution of N2O5 was caused by NO. In urban areas, especially during severe haze nighttime periods, the rapid titration of NO with O3 led to near-zero concentrations of surface O3 (Zang et al., 2022), thereby inhibiting the in situ generation of NO3 radicals and N2O5 (Zhao et al., 2023). As shown in Fig. 11, the NO concentration exhibited a spatial distribution inversely correlated with that of N2O5, where higher NO concentrations corresponded to lower N2O5 levels and vice versa. This inverse relationship explains the low N2O5 concentrations in inland cities. Additionally, observations have showed that the lifetime of NO3 radicals in marine atmospheres could reach 30 min because of the low NOx mixing ratio in marine air masses, which was longer than 1 min in inland atmospheres (Crowley et al., 2011) and contributed to the high N2O5 concentrations in coastal cities. Observations in Hebei Province revealed low N2O5 concentrations in summer, with lifetimes ranging from 0.1 to 10 min (Tham et al., 2018). Therefore, the spatial differences in hetN2O5 reaction rates depended on NO and the lifetime of NO3 radicals.
Moreover, we speculated that the decreased rate of heterogeneous N2O5 was influenced not only by N2O5 but also by other factors, such as RH and the surface area of aerosol particles, due to the interannual variations in RH and PM. Compared with 2013, the RH in the NCP decreased by 3.1 % in 2018 (Fig. S4). The sensitivity experiments revealed that both the N2O5 reaction rate and its contribution to total nitrates remained essentially unchanged when the humidity decreased by 10 %. This finding indicated that humidity changes were not the main factor influencing the decrease in the reaction rate of hetN2O5 in the NCP. The total dry surface area of the particles in the CMAQ model was calculated as the sum of the modal dry surface areas, corresponding to the particles in the Aitken, the accumulation levels, and coarse modes (Bergin et al., 2022). During the winter of 2013 in the NCP, the average surface reaction factor (SRF) value was 689 µm2 cm−3, which decreased to 425 µm2 cm−3 during the winter of 2018, indicating a reduction of 38.3 %. This significant reduction in the aerosol surface area likely contributed to the observed decrease in the reaction rate of heterogeneous N2O5. Air quality monitoring data revealed that PM10 decreased by 20 % and PM2.5 decreased by 28 % in China from 2014 to 2018 (Fan et al., 2020a). Therefore, we considered that the reduction in the PM2.5 concentration was a major factor contributing to the decrease in the hetN2O5 generation rate.
In brief, hetN2O5 reaction rates were affected by three key factors: N2O5 concentrations, aerosol surface area, and the spatial distribution of NO. The decline in hetN2O5 reaction rates across the NCP between 2013 and 2018 was driven primarily by a substantial reduction in aerosol surface area, particularly due to decreased PM2.5 concentrations. Furthermore, regional variations in NO concentrations and NO3 radical lifetimes significantly influenced N2O5 concentrations, resulting in distinct spatial patterns. To further mitigate nitrate pollution, coastal cities should prioritize reducing particulate matter concentrations, which would reduce hetN2O5 reaction rates and enhance air quality.
3.6 Impact of reducing NOx and VOC emissions on the nitrate concentration
To reduce the nitrate content in PM2.5, effective control strategies must target key factors, such as OH radicals, O3, and the photochemical reactions of NOx and VOCs. However, a previous study revealed that even with a 30 % reduction in VOC and NOx emissions, the winter nitrate concentration in PM2.5 in the NCP decreased by only 8.6 % (Fu et al., 2020). NH3 played a crucial role in the gas-to-particle conversion process of HNO3 in the NCP region. Therefore, we designed single and combined pollutant reduction strategies for NH3, NOx, and VOCs to examine the effects of the emission of these species on nitrate in PM2.5.
The effectiveness of emission reduction scenarios notably differed between Beijing and Qingdao (Fig. 14). In Beijing, single-pollutant reduction strategies yielded outcomes dependent on target factors. The city showed limited sensitivity to NOx reduction, with nitrate concentrations initially increasing before showing a 4.5 % decrease in nitrate concentration until reaching a 60 % NOx reduction threshold. A 60 % reduction in VOC emissions led to a 10.5 % decrease in nitrate concentration, whereas NH3 reduction led to a 38.4 % decrease at the same level. In contrast, Qingdao demonstrated relatively strong responsiveness to NOx controls, with a 60 % reduction resulting in a 32.4 % decrease in nitrate concentration. However, Qingdao showed relatively weak sensitivity to VOC controls, with a 60 % reduction in VOC emissions resulting in an 11.1 % decrease in nitrate concentration. Qingdao exhibited the strongest response to NH3 reduction measures, where a 60 % decrease in NH3 emissions led to a substantial 51.7 % reduction in nitrate concentration.
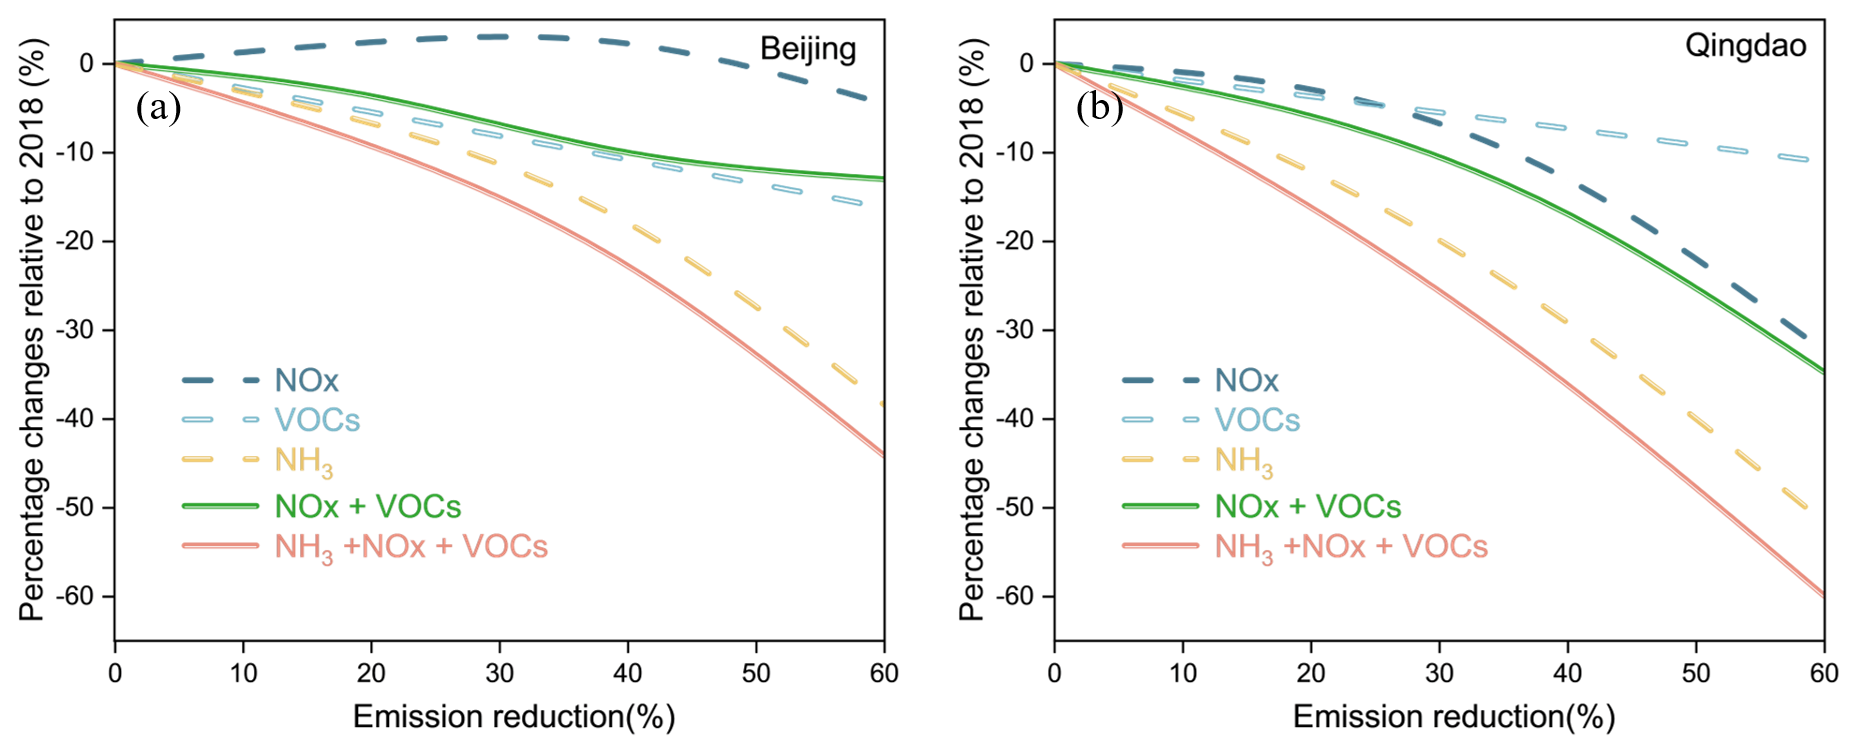
Figure 14Relative changes in the PM2.5 nitrate contribution in response to the emission reduction scenarios in (a) Beijing and (b) Qingdao, compared with the winter 2018 baseline conditions
The comprehensive reduction scenarios revealed more pronounced intercity differences. Beijing showed a relatively weak response to combined NOx and VOC reductions, with only a 13.0 % decrease in nitrate concentration at a 60 % reduction in both pollutants. Qingdao, however, achieved a significantly greater reduction of 34.7 % under the same conditions. The most effective strategy involved simultaneous reductions in NH3, VOCs, and NOx, with Qingdao achieving a 60.0 % reduction and Beijing achieving a 44.2 % reduction at 60 % emission cuts. These findings demonstrated that effective nitrate control measures would require the coordinated reduction of multiple precursors. While multipollutant strategies yielded optimal results, NH3 reductions were determined to be the most effective single-pollutant control measure for both cities.
In this study, nitrate formation mechanisms and influencing factors in seven cities across the NCP during the winters of 2013 and 2018 were investigated. Despite inherent uncertainties, the model simulations and isotopic measurements showed remarkable agreement, demonstrating the reliability of the modeling approach in elucidating nitrate formation mechanisms. Our findings revealed that nitrate formation was significantly influenced by NH3, NO2, OH radicals, O3, NO, and N2O5, with distinct differences between regions. In inland cities, the OH+NO2 reaction pathway dominated, contributing 63.7 %–85.6 % of nitrate formation. This phenomenon was largely driven by the increased concentrations of OH radicals and O3, resulting in a 7.6 % greater contribution of this pathway in inland cities in 2018 than in 2013. In contrast, coastal cities presented a greater contribution of the hetN2O5 pathway (37.0 % to 45.7 %) because of the higher N2O5 concentrations and longer NO3 radical lifetimes. High NO concentrations in inland areas facilitated O3 titration, inhibiting N2O5 formation and further differentiating nitrate formation processes between the two regions.
Our emission reduction experiments revealed distinct regional responses and highlighted the need for tailored, multipollutant strategies to effectively control nitrate pollution. Among the single-pollutant control strategies, NH3 reduction demonstrated the highest effectiveness, with a 60 % emission reduction leading to a 38.4 % decrease in nitrate concentrations in Beijing and a substantial 51.7 % reduction in Qingdao. The combined emission control strategy, which involved simultaneous reductions in multiple pollutants, was more effective than NH3 reduction alone, achieving a 44.2 % nitrate reduction in Beijing and a 60.0 % decrease in Qingdao. This study advanced our understanding of regional variations in atmospheric nitrogen chemistry and provided essential insights for developing targeted measures to mitigate nitrate pollution and improve air quality in northern China. To further advance research in this field, it is recommended that researchers in the future should focus on developing robust methodologies to comprehensively account for the influence of atmospheric transport on nitrate formation.
All datasets supporting the findings of this study are available through the following channels. Primary datasets and analysis results are available from the corresponding authors upon reasonable request. All plotting data and essential research data have been deposited in a publicly accessible repository on Zenodo at https://doi.org/10.5281/zenodo.16717577 (Liu and Qi, 2025).
The supplement related to this article is available online at https://doi.org/10.5194/acp-25-8719-2025-supplement.
ZL: visualization, formal analysis, writing (original draft). XL: project administration, writing (review and editing). YN: validation. LX: resources. JQ: conceptualization, methodology, writing (review and editing).
The contact author has declared that none of the authors has any competing interests.
Publisher's note: Copernicus Publications remains neutral with regard to jurisdictional claims made in the text, published maps, institutional affiliations, or any other geographical representation in this paper. While Copernicus Publications makes every effort to include appropriate place names, the final responsibility lies with the authors.
This work was financially supported by the Key Program of the National Natural Science Foundation of China (42430606). The authors are extremely grateful to Xiaodong Li for his help with the nitrate data.
This research has been supported by the National Natural Science Foundation of China (grant no. 42430606).
This paper was edited by Benjamin A. Nault and reviewed by Pete D. Akers and one anonymous referee.
Albertin, S., Savarino, J., Bekki, S., Barbero, A., and Caillon, N.: Measurement report: Nitrogen isotopes (δ15N) and first quantification of oxygen isotope anomalies (Δ17O, δ18O) in atmospheric nitrogen dioxide, Atmos. Chem. Phys., 21, 10477–10497, https://doi.org/10.5194/acp-21-10477-2021, 2021.
Albertin, S., Savarino, J., Bekki, S., Barbero, A., Grilli, R., Fournier, Q., Ventrillard, I., Caillon, N., and Law, K.: Diurnal variations in oxygen and nitrogen isotopes of atmospheric nitrogen dioxide and nitrate: implications for tracing NOx oxidation pathways and emission sources, Atmos. Chem. Phys., 24, 1361–1388, https://doi.org/10.5194/acp-24-1361-2024, 2024.
Alexander, B., Sherwen, T., Holmes, C. D., Fisher, J. A., Chen, Q., Evans, M. J., and Kasibhatla, P.: Global inorganic nitrate production mechanisms: comparison of a global model with nitrate isotope observations, Atmos. Chem. Phys., 20, 3859–3877, https://doi.org/10.5194/acp-20-3859-2020, 2020.
Ansari, A. S. and Pandis, S. N.: Response of Inorganic PM to Precursor Concentrations, Environ. Sci. Technol., 32, 2706–2714, https://doi.org/10.1021/es971130j, 1998.
Appel, K. W., Bash, J. O., Fahey, K. M., Foley, K. M., Gilliam, R. C., Hogrefe, C., Hutzell, W. T., Kang, D., Mathur, R., Murphy, B. N., Napelenok, S. L., Nolte, C. G., Pleim, J. E., Pouliot, G. A., Pye, H. O. T., Ran, L., Roselle, S. J., Sarwar, G., Schwede, D. B., Sidi, F. I., Spero, T. L., and Wong, D. C.: The Community Multiscale Air Quality (CMAQ) model versions 5.3 and 5.3.1: system updates and evaluation, Geosci. Model Dev., 14, 2867–2897, https://doi.org/10.5194/gmd-14-2867-2021, 2021.
Athanasopoulou, E., Tombrou, M., Pandis, S. N., and Russell, A. G.: The role of sea-salt emissions and heterogeneous chemistry in the air quality of polluted coastal areas, Atmos. Chem. Phys., 8, 5755–5769, https://doi.org/10.5194/acp-8-5755-2008, 2008.
Atkinson, R.: Atmospheric chemistry of VOCs and NOx, Atmos. Environ., 34, 2063–2101, https://doi.org/10.1016/S1352-2310(99)00460-4, 2000.
Atkinson, R., Baulch, D. L., Cox, R. A., Crowley, J. N., Hampson, R. F., Hynes, R. G., Jenkin, M. E., Rossi, M. J., and Troe, J.: Evaluated kinetic and photochemical data for atmospheric chemistry: Volume I - gas phase reactions of Ox, HOx, NOx and SOx species, Atmos. Chem. Phys., 4, 1461–1738, https://doi.org/10.5194/acp-4-1461-2004, 2004.
Bergin, R. A., Harkey, M., Hoffman, A., Moore, R. H., Anderson, B., Beyersdorf, A., Ziemba, L., Thornhill, L., Winstead, E., Holloway, T., and Bertram, T. H.: Observation-based constraints on modeled aerosol surface area: implications for heterogeneous chemistry, Atmos. Chem. Phys., 22, 15449–15468, https://doi.org/10.5194/acp-22-15449-2022, 2022.
GEBCO Bathymetric Compilation Group 2024: The GEBCO_2024 Grid – a continuous terrain model of the global oceans and land, NERC EDS British Oceanographic Data Centre NOC [data set], https://doi.org/10.5285/1c44ce99-0a0d-5f4f-e063-7086abc0ea0f, 2024.
Cao, J., Tie, X., Dabberdt, W. F., Jie, T., Zhao, Z., An, Z., Shen, Z., and Feng, Y.: On the potential high acid deposition in northeastern China, J. Geophys. Res.-Atmos., 118, 4834–4846, https://doi.org/10.1002/jgrd.50381, 2013.
Casciotti, K. L., Sigman, D. M., Hastings, M. G., Böhlke, J. K., and Hilkert, A.: Measurement of the Oxygen Isotopic Composition of Nitrate in Seawater and Freshwater Using the Denitrifier Method, Anal. Chem., 74, 4905–4912, https://doi.org/10.1021/ac020113w, 2002.
Chen, C., Huang, L., Shi, J., Zhou, Y., Wang, J., Yao, X., Gao, H., Liu, Y., Xing, J., and Liu, X.: Atmospheric outflow of anthropogenic iron and its deposition to China adjacent seas, Sci. Total Environ., 750, 141302, https://doi.org/10.1016/j.scitotenv.2020.141302, 2021.
Chen, D., Liu, Z., Fast, J., and Ban, J.: Simulations of sulfate–nitrate–ammonium (SNA) aerosols during the extreme haze events over northern China in October 2014, Atmos. Chem. Phys., 16, 10707–10724, https://doi.org/10.5194/acp-16-10707-2016, 2016.
Chen, X., Wang, H., Lu, K., Li, C., Zhai, T., Tan, Z., Ma, X., Yang, X., Liu, Y., Chen, S., Dong, H., Li, X., Wu, Z., Hu, M., Zeng, L., and Zhang, Y.: Field Determination of Nitrate Formation Pathway in Winter Beijing, Environ. Sci. Technol., 54, 9243–9253, https://doi.org/10.1021/acs.est.0c00972, 2020.
Chen, Y., Zhang, Q., Cai, X., Zhang, H., Lin, H., Zheng, C., Guo, Z., Hu, S., Chen, L., Tao, S., Liu, M., and Wang, X.: Rapid Increase in China's Industrial Ammonia Emissions: Evidence from Unit-Based Mapping, Environ. Sci. Technol., 56, 3375–3385, https://doi.org/10.1021/acs.est.1c08369, 2022.
Crowley, J. N., Thieser, J., Tang, M. J., Schuster, G., Bozem, H., Beygi, Z. H., Fischer, H., Diesch, J.-M., Drewnick, F., Borrmann, S., Song, W., Yassaa, N., Williams, J., Pöhler, D., Platt, U., and Lelieveld, J.: Variable lifetimes and loss mechanisms for NO3 and N2O5 during the DOMINO campaign: contrasts between marine, urban and continental air, Atmos. Chem. Phys., 11, 10853–10870, https://doi.org/10.5194/acp-11-10853-2011, 2011.
Czader, B. H., Li, X., and Rappenglueck, B.: CMAQ modeling and analysis of radicals, radical precursors, and chemical transformations, J. Geophys. Res.-Atmos., 118, 11376–311387, https://doi.org/10.1002/jgrd.50807, 2013.
Dentener, F. J. and Crutzen, P. J.: Reaction of N2O5 on tropospheric aerosols: Impact on the global distributions of NOx, O3, and OH, J. Geophys. Res.-Atmos., 98, 7149–7163, https://doi.org/10.1029/92JD02979, 1993.
Ding, X., Qi, J., and Meng, X.: Characteristics and sources of organic carbon in coastal and marine atmospheric particulates over East China, Atmos. Res., 228, 281–291, https://doi.org/10.1016/j.atmosres.2019.06.015, 2019.
Emery, C., Tai, E., and Yarwood, G.: Enhanced meteorological modeling and performance evaluation for two Texas ozone episodes, Final Report, ENVIRON International Corporation, 235 pp., 2001.
Emery, C., Liu, Z., Russell, A. G., Odman, M. T., Yarwood, G., and Kumar, N.: Recommendations on statistics and benchmarks to assess photochemical model performance, J. Air Waste Manage., 67, 582–598, https://doi.org/10.1080/10962247.2016.1265027, 2017.
Fan, H., Zhao, C., and Yang, Y.: A comprehensive analysis of the spatio-temporal variation of urban air pollution in China during 2014–2018, Atmos. Environ., 220, 117066, https://doi.org/10.1016/j.atmosenv.2019.117066, 2020a.
Fan, M.-Y., Zhang, Y.-L., Lin, Y.-C., Cao, F., Zhao, Z.-Y., Sun, Y., Qiu, Y., Fu, P., and Wang, Y.: Changes of Emission Sources to Nitrate Aerosols in Beijing After the Clean Air Actions: Evidence From Dual Isotope Compositions, J. Geophys. Res.-Atmos., 125, e2019JD031998, https://doi.org/10.1029/2019JD031998, 2020b.
Feng, X., Li, Q., Tao, Y., Ding, S., Chen, Y., and Li, X.-D.: Impact of Coal Replacing Project on atmospheric fine aerosol nitrate loading and formation pathways in urban Tianjin: Insights from chemical composition and 15N and 18O isotope ratios, Sci. Total Environ., 708, 134797, https://doi.org/10.1016/j.scitotenv.2019.134797, 2020.
Folkers, M., Mentel, T. F., and Wahner, A.: Influence of an organic coating on the reactivity of aqueous aerosols probed by the heterogeneous hydrolysis of N2O5, Geophys. Res. Lett., 30, 1644, https://doi.org/10.1029/2003GL017168, 2003.
Fu, X., Wang, T., Gao, J., Wang, P., Liu, Y., Wang, S., Zhao, B., and Xue, L.: Persistent Heavy Winter Nitrate Pollution Driven by Increased Photochemical Oxidants in Northern China, Environ. Sci. Technol., 54, 3881–3889, https://doi.org/10.1021/acs.est.9b07248, 2020.
Hallquist, M., Wängberg, I., Ljungström, E., Barnes, I., and Becker, K.-H.: Aerosol and Product Yields from NO3 Radical-Initiated Oxidation of Selected Monoterpenes, Environ. Sci. Technol., 33, 553–559, https://doi.org/10.1021/es980292s, 1999.
He, P., Xie, Z., Yu, X., Wang, L., Kang, H., and Yue, F.: The observation of isotopic compositions of atmospheric nitrate in Shanghai China and its implication for reactive nitrogen chemistry, Sci. Total Environ., 714, 136727, https://doi.org/10.1016/j.scitotenv.2020.136727, 2020.
Heald, C. L., Collett Jr., J. L., Lee, T., Benedict, K. B., Schwandner, F. M., Li, Y., Clarisse, L., Hurtmans, D. R., Van Damme, M., Clerbaux, C., Coheur, P.-F., Philip, S., Martin, R. V., and Pye, H. O. T.: Atmospheric ammonia and particulate inorganic nitrogen over the United States, Atmos. Chem. Phys., 12, 10295–10312, https://doi.org/10.5194/acp-12-10295-2012, 2012.
Hofzumahaus, A., Rohrer, F., Lu, K., Bohn, B., Brauers, T., Chang, C.-C., Fuchs, H., Holland, F., Kita, K., Kondo, Y., Li, X., Lou, S., Shao, M., Zeng, L., Wahner, A., and Zhang, Y.: Amplified Trace Gas Removal in the Troposphere, Science, 324, 1702–1704, https://doi.org/10.1126/science.1164566, 2009.
Huang, L., Zhu, Y., Zhai, H., Xue, S., Zhu, T., Shao, Y., Liu, Z., Emery, C., Yarwood, G., Wang, Y., Fu, J., Zhang, K., and Li, L.: Recommendations on benchmarks for numerical air quality model applications in China – Part 1: PM2.5 and chemical species, Atmos. Chem. Phys., 21, 2725–2743, https://doi.org/10.5194/acp-21-2725-2021, 2021.
Jacobson, M. Z. and Kaufman, Y. J.: Wind reduction by aerosol particles, Geophys. Res. Lett., 33, L24814, https://doi.org/10.1029/2006GL027838, 2006.
Kalkavouras, P., Bougiatioti, A., Kalivitis, N., Stavroulas, I., Tombrou, M., Nenes, A., and Mihalopoulos, N.: Regional new particle formation as modulators of cloud condensation nuclei and cloud droplet number in the eastern Mediterranean, Atmos. Chem. Phys., 19, 6185–6203, https://doi.org/10.5194/acp-19-6185-2019, 2019.
Kim, S., VandenBoer, T. C., Young, C. J., Riedel, T. P., Thornton, J. A., Swarthout, B., Sive, B., Lerner, B., Gilman, J. B., Warneke, C., Roberts, J. M., Guenther, A., Wagner, N. L., Dubé, W. P., Williams, E., and Brown, S. S.: The primary and recycling sources of OH during the NACHTT-2011 campaign: HONO as an important OH primary source in the wintertime, J. Geophys. Res.-Atmos., 119, 6886–6896, https://doi.org/10.1002/2013JD019784, 2014a.
Kim, Y. J., Spak, S. N., Carmichael, G. R., Riemer, N., and Stanier, C. O.: Modeled aerosol nitrate formation pathways during wintertime in the Great Lakes region of North America, J. Geophys. Res.-Atmos., 119, 12420–12445, https://doi.org/10.1002/2014jd022320, 2014b.
Kunasek, S. A., Alexander, B., Steig, E. J., Hastings, M. G., Gleason, D. J., and Jarvis, J. C.: Measurements and modeling of Δ17O of nitrate in snowpits from Summit, Greenland, J. Geophys. Res.-Atmos., 113, D24302, https://doi.org/10.1029/2008JD010103, 2008.
Li, H., Cheng, J., Zhang, Q., Zheng, B., Zhang, Y., Zheng, G., and He, K.: Rapid transition in winter aerosol composition in Beijing from 2014 to 2017: response to clean air actions, Atmos. Chem. Phys., 19, 11485–11499, https://doi.org/10.5194/acp-19-11485-2019, 2019.
Li, H., Zhang, Q., Zheng, B., Chen, C., Wu, N., Guo, H., Zhang, Y., Zheng, Y., Li, X., and He, K.: Nitrate-driven urban haze pollution during summertime over the North China Plain, Atmos. Chem. Phys., 18, 5293-5306, 10.5194/acp-18-5293-2018, 2018.
Li, M., Zhang, Z., Yao, Q., Wang, T., Xie, M., Li, S., Zhuang, B., and Han, Y.: Nonlinear responses of particulate nitrate to NOx emission controls in the megalopolises of China, Atmos. Chem. Phys., 21, 15135–15152, https://doi.org/10.5194/acp-21-15135-2021, 2021.
Li, R., Gao, Y., Xu, J., Cui, L., and Wang, G.: Impact of Clean Air Policy on Criteria Air Pollutants and Health Risks Across China During 2013–2021, J. Geophys. Res.-Atmos., 128, e2023JD038939, https://doi.org/10.1029/2023JD038939, 2023.
Li, X., Wu, S.-P., Zhang, J., and Schwab, J. J.: Insights into factors affecting size-segregated nitrate formation in a coastal city through measurements of dual isotopes, Atmos. Environ., 290, 119385, https://doi.org/10.1016/j.atmosenv.2022.119385, 2022.
Liao, W., Liu, M., Huang, X., Wang, T., Xu, Z., Shang, F., Song, Y., Cai, X., Zhang, H., Kang, L., and Zhu, T.: Estimation for ammonia emissions at county level in China from 2013 to 2018, Sci. China Earth Sci., 65, 1116–1127, https://doi.org/10.1007/s11430-021-9897-3, 2022.
Liu, Z. and Qi, J.: egusphere-2024-3044-Data, Version v1, Zenodo [data set], https://doi.org/10.5281/zenodo.16717577, 2025.
Liu, L., Bei, N., Hu, B., Wu, J., Liu, S., Li, X., Wang, R., Liu, Z., Shen, Z., and Li, G.: Wintertime nitrate formation pathways in the north China plain: Importance of N2O5 heterogeneous hydrolysis, Environ. Pollut., 266, 115287, https://doi.org/10.1016/j.envpol.2020.115287, 2020.
Liu, X., Chang, M., Zhang, J., Wang, J., Gao, H., Gao, Y., and Yao, X.: Rethinking the causes of extreme heavy winter PM2.5 pollution events in northern China, Sci. Total Environ., 794, 148637, https://doi.org/10.1016/j.scitotenv.2021.148637, 2021.
Lu, K. D., Rohrer, F., Holland, F., Fuchs, H., Bohn, B., Brauers, T., Chang, C. C., Häseler, R., Hu, M., Kita, K., Kondo, Y., Li, X., Lou, S. R., Nehr, S., Shao, M., Zeng, L. M., Wahner, A., Zhang, Y. H., and Hofzumahaus, A.: Observation and modelling of OH and HO2 concentrations in the Pearl River Delta 2006: a missing OH source in a VOC rich atmosphere, Atmos. Chem. Phys., 12, 1541–1569, https://doi.org/10.5194/acp-12-1541-2012, 2012.
Luecken, D. J., Yarwood, G., and Hutzell, W. T.: Multipollutant modeling of ozone, reactive nitrogen and HAPs across the continental US with CMAQ-CB6, Atmos. Environ., 201, 62–72, https://doi.org/10.1016/j.atmosenv.2018.11.060, 2019.
Luo, L., Zhu, R.-g., Song, C.-B., Peng, J.-F., Guo, W., Liu, Y., Zheng, N., Xiao, H., and Xiao, H.-Y.: Changes in nitrate accumulation mechanisms as PM2.5 levels increase on the North China Plain: A perspective from the dual isotopic compositions of nitrate, Chemosphere, 263, 127915, https://doi.org/10.1016/j.chemosphere.2020.127915, 2021.
Ma, X., Tan, Z., Lu, K., Yang, X., Liu, Y., Li, S., Li, X., Chen, S., Novelli, A., Cho, C., Zeng, L., Wahner, A., and Zhang, Y.: Winter photochemistry in Beijing: Observation and model simulation of OH and HO2 radicals at an urban site, Sci. Total Environ., 685, 85–95, https://doi.org/10.1016/j.scitotenv.2019.05.329, 2019.
Michalski, G., Scott, Z., Kabiling, M., and Thiemens, M. H.: First measurements and modeling of Δ17O in atmospheric nitrate, Geophys. Res. Lett., 30, 1870, https://doi.org/10.1029/2003GL017015, 2003.
Mitroo, D., Gill, T. E., Haas, S., Pratt, K. A., and Gaston, C. J.: ClNO2 Production from N2O5 Uptake on Saline Playa Dusts: New Insights into Potential Inland Sources of ClNO2, Environ. Sci. Technol., 53, 7442–7452, https://doi.org/10.1021/acs.est.9b01112, 2019.
Moore, J. W. and Semmens, B. X.: Incorporating uncertainty and prior information into stable isotope mixing models, Ecol. Lett., 11, 470–480, https://doi.org/10.1111/j.1461-0248.2008.01163.x, 2008.
Pathak, R. K., Wang, T., and Wu, W. S.: Nighttime enhancement of PM2.5 nitrate in ammonia-poor atmospheric conditions in Beijing and Shanghai: Plausible contributions of heterogeneous hydrolysis of N2O5 and HNO3 partitioning, Atmos. Environ., 45, 1183–1191, https://doi.org/10.1016/j.atmosenv.2010.09.003, 2011.
Qi, J., Yu, Y., Yao, X., Gang, Y., and Gao, H.: Dry deposition fluxes of inorganic nitrogen and phosphorus in atmospheric aerosols over the Marginal Seas and Northwest Pacific, Atmos. Res., 245, 105076, https://doi.org/10.1016/j.atmosres.2020.105076, 2020.
Ramanathan, V. and Feng, Y.: Air pollution, greenhouse gases and climate change: Global and regional perspectives, Atmos. Environ., 43, 37–50, https://doi.org/10.1016/j.atmosenv.2008.09.063, 2009.
Shao, P., Tian, H., Sun, Y., Liu, H., Wu, B., Liu, S., Liu, X., Wu, Y., Liang, W., Wang, Y., Gao, J., Xue, Y., Bai, X., Liu, W., Lin, S., and Hu, G.: Characterizing remarkable changes of severe haze events and chemical compositions in multi-size airborne particles (PM1, PM2.5 and PM10) from January 2013 to 2016–2017 winter in Beijing, China, Atmos. Environ., 189, 133–144, https://doi.org/10.1016/j.atmosenv.2018.06.038, 2018.
Sigman, D. M., Casciotti, K. L., Andreani, M., Barford, C., Galanter, M., and Böhlke, J. K.: A Bacterial Method for the Nitrogen Isotopic Analysis of Nitrate in Seawater and Freshwater, Anal. Chem., 73, 4145–4153, https://doi.org/10.1021/ac010088e, 2001.
Song, M., Zhao, X., Liu, P., Mu, J., He, G., Zhang, C., Tong, S., Xue, C., Zhao, X., Ge, M., and Mu, Y.: Atmospheric NOx oxidation as major sources for nitrous acid (HONO), npj Climate and Atmospheric Science, 6, 30, https://doi.org/10.1038/s41612-023-00357-8, 2023.
Stone, D., Whalley, L. K., and Heard, D. E.: Tropospheric OH and HO2 radicals: field measurements and model comparisons, Chem. Soc. Rev., 41, 6348–6404, https://doi.org/10.1039/C2CS35140D, 2012.
Sun, J., Qin, M., Xie, X., Fu, W., Qin, Y., Sheng, L., Li, L., Li, J., Sulaymon, I. D., Jiang, L., Huang, L., Yu, X., and Hu, J.: Seasonal modeling analysis of nitrate formation pathways in Yangtze River Delta region, China, Atmos. Chem. Phys., 22, 12629–12646, https://doi.org/10.5194/acp-22-12629-2022, 2022.
Sun, Y., Jiang, Q., Wang, Z., Fu, P., Li, J., Yang, T., and Yin, Y.: Investigation of the sources and evolution processes of severe haze pollution in Beijing in January 2013, J. Geophys. Res.-Atmos., 119, 4380–4398, https://doi.org/10.1002/2014JD021641, 2014.
Tan, J., Zhang, Y., Ma, W., Yu, Q., Wang, Q., Fu, Q., Zhou, B., Chen, J., and Chen, L.: Evaluation and potential improvements of WRF/CMAQ in simulating multi-levels air pollution in megacity Shanghai, China, Stoch. Env. Res. Risk A., 31, 2513–2526, https://doi.org/10.1007/s00477-016-1342-3, 2017.
Tan, Z., Rohrer, F., Lu, K., Ma, X., Bohn, B., Broch, S., Dong, H., Fuchs, H., Gkatzelis, G. I., Hofzumahaus, A., Holland, F., Li, X., Liu, Y., Liu, Y., Novelli, A., Shao, M., Wang, H., Wu, Y., Zeng, L., Hu, M., Kiendler-Scharr, A., Wahner, A., and Zhang, Y.: Wintertime photochemistry in Beijing: observations of ROx radical concentrations in the North China Plain during the BEST-ONE campaign, Atmos. Chem. Phys., 18, 12391–12411, https://doi.org/10.5194/acp-18-12391-2018, 2018.
Tan, Z., Lu, K., Hofzumahaus, A., Fuchs, H., Bohn, B., Holland, F., Liu, Y., Rohrer, F., Shao, M., Sun, K., Wu, Y., Zeng, L., Zhang, Y., Zou, Q., Kiendler-Scharr, A., Wahner, A., and Zhang, Y.: Experimental budgets of OH, HO2, and RO2 radicals and implications for ozone formation in the Pearl River Delta in China 2014, Atmos. Chem. Phys., 19, 7129–7150, https://doi.org/10.5194/acp-19-7129-2019, 2019.
Tan, Z., Wang, H., Lu, K., Dong, H., Liu, Y., Zeng, L., Hu, M., and Zhang, Y.: An Observational Based Modeling of the Surface Layer Particulate Nitrate in the North China Plain During Summertime, J. Geophys. Res.-Atmos., 126, e2021JD035623, https://doi.org/10.1029/2021JD035623, 2021.
Tegen, I., Koch, D., Lacis, A. A., and Sato, M.: Trends in tropospheric aerosol loads and corresponding impact on direct radiative forcing between 1950 and 1990: A model study, J. Geophys. Res.-Atmos., 105, 26971–26989, https://doi.org/10.1029/2000JD900280, 2000.
Tham, Y. J., Wang, Z., Li, Q., Wang, W., Wang, X., Lu, K., Ma, N., Yan, C., Kecorius, S., Wiedensohler, A., Zhang, Y., and Wang, T.: Heterogeneous N2O5 uptake coefficient and production yield of ClNO2 in polluted northern China: roles of aerosol water content and chemical composition, Atmos. Chem. Phys., 18, 13155–13171, https://doi.org/10.5194/acp-18-13155-2018, 2018.
Thornton, J. A. and Abbatt, J. P. D.: N2O5 Reaction on Submicron Sea Salt Aerosol: Kinetics, Products, and the Effect of Surface Active Organics, J. Phys. Chem. A, 109, 10004–10012, https://doi.org/10.1021/jp054183t, 2005.
Tie, X., Madronich, S., Walters, S., Zhang, R., Rasch, P., and Collins, W.: Effect of clouds on photolysis and oxidants in the troposphere, J. Geophys. Res.-Atmos., 108, 4642, https://doi.org/10.1029/2003JD003659, 2003a.
Tie, X., Emmons, L., Horowitz, L., Brasseur, G., Ridley, B., Atlas, E., Stround, C., Hess, P., Klonecki, A., Madronich, S., Talbot, R., and Dibb, J.: Effect of sulfate aerosol on tropospheric NOx and ozone budgets: Model simulations and TOPSE evidence, J. Geophys. Res.-Atmos., 108, 8364, https://doi.org/10.1029/2001JD001508, 2003b.
Tie, X., Wu, D., and Brasseur, G.: Lung cancer mortality and exposure to atmospheric aerosol particles in Guangzhou, China, Atmos. Environ., 43, 2375–2377, https://doi.org/10.1016/j.atmosenv.2009.01.036, 2009.
US EPA: Guidance on the Use of Models and Other Analyses for Demonstrating Attainment of Air Quality Goals for Ozone, PM2.5, and Regional Haze, U.S. Environmental Protection Agency, Office of Air Quality Planning and Standards, Research Triangle Park, NC, Report No. EPA-454/B-07-002, 262 pp., 2007.
Wahner, A., Mentel, T. F., Sohn, M., and Stier, J.: Heterogeneous reaction of N2O5 on sodium nitrate aerosol, J. Geophys. Res.-Atmos., 103, 31103–31112, https://doi.org/10.1029/1998JD100022, 1998.
Walters, W. W. and Michalski, G.: Theoretical calculation of oxygen equilibrium isotope fractionation factors involving various NOy molecules, OH, and H2O and its implications for isotope variations in atmospheric nitrate, Geochim. Cosmochim. Ac., 191, 89–101, https://doi.org/10.1016/j.gca.2016.06.039, 2016.
Walters, W. W., Fang, H., and Michalski, G.: Summertime diurnal variations in the isotopic composition of atmospheric nitrogen dioxide at a small midwestern United States city, Atmos. Environ., 179, 1–11, https://doi.org/10.1016/j.atmosenv.2018.01.047, 2018.
Walters, W. W., Pye, H. O. T., Kim, H., and Hastings, M. G.: Modeling the Oxygen Isotope Anomaly (Δ17O) of Reactive Nitrogen in the Community Multiscale Air Quality Model: Insights into Nitrogen Oxide Chemistry in the Northeastern United States, ACS ES&T Air, 1, 451–463, https://doi.org/10.1021/acsestair.3c00056, 2024.
Wang, F., An, J., Li, Y., Tang, Y., Lin, J., Qu, Y., Chen, Y., Zhang, B., and Zhai, J.: Impacts of uncertainty in AVOC emissions on the summer ROx budget and ozone production rate in the three most rapidly-developing economic growth regions of China, Adv. Atmos. Sci., 31, 1331–1342, https://doi.org/10.1007/s00376-014-3251-z, 2014.
Wang, H., Lu, K., Tan, Z., Chen, X., Liu, Y., and Zhang, Y.: Formation mechanism and control strategy for particulate nitrate in China, J. Environ. Sci., 123, 476–486, https://doi.org/10.1016/j.jes.2022.09.019, 2023.
Wang, H., Chen, X., Lu, K., Tan, Z., Ma, X., Wu, Z., Li, X., Liu, Y., Shang, D., Wu, Y., Zeng, L., Hu, M., Schmitt, S., Kiendler-Scharr, A., Wahner, A., and Zhang, Y.: Wintertime N2O5 uptake coefficients over the North China Plain, Science Bulletin, 65, 765–774, https://doi.org/10.1016/j.scib.2020.02.006, 2020.
Wu, C., Liu, L., Wang, G., Zhang, S., Li, G., Lv, S., Li, J., Wang, F., Meng, J., and Zeng, Y.: Important contribution of N2O5 hydrolysis to the daytime nitrate in Xi'an, China during haze periods: Isotopic analysis and WRF-Chem model simulation, Environ. Pollut., 288, 117712, https://doi.org/10.1016/j.envpol.2021.117712, 2021.
Xu, Q., Wang, S., Jiang, J., Bhattarai, N., Li, X., Chang, X., Qiu, X., Zheng, M., Hua, Y., and Hao, J.: Nitrate dominates the chemical composition of PM2.5 during haze event in Beijing, China, Sci. Total Environ., 689, 1293–1303, https://doi.org/10.1016/j.scitotenv.2019.06.294, 2019a.
Xu, W., Sun, Y., Wang, Q., Zhao, J., Wang, J., Ge, X., Xie, C., Zhou, W., Du, W., Li, J., Fu, P., Wang, Z., Worsnop, D. R., and Coe, H.: Changes in Aerosol Chemistry From 2014 to 2016 in Winter in Beijing: Insights From High-Resolution Aerosol Mass Spectrometry, J. Geophys. Res.-Atmos., 124, 1132–1147, https://doi.org/10.1029/2018JD029245, 2019b.
Xu, Z., Liu, M., Zhang, M., Song, Y., Wang, S., Zhang, L., Xu, T., Wang, T., Yan, C., Zhou, T., Sun, Y., Pan, Y., Hu, M., Zheng, M., and Zhu, T.: High efficiency of livestock ammonia emission controls in alleviating particulate nitrate during a severe winter haze episode in northern China, Atmos. Chem. Phys., 19, 5605–5613, https://doi.org/10.5194/acp-19-5605-2019, 2019c.
Xue, C., Zhang, C., Ye, C., Liu, P., Catoire, V., Krysztofiak, G., Chen, H., Ren, Y., Zhao, X., Wang, J., Zhang, F., Zhang, C., Zhang, J., An, J., Wang, T., Chen, J., Kleffmann, J., Mellouki, A., and Mu, Y.: HONO Budget and Its Role in Nitrate Formation in the Rural North China Plain, Environ. Sci. Technol., 54, 11048–11057, https://doi.org/10.1021/acs.est.0c01832, 2020.
Xue, J., Yu, X., Yuan, Z., Griffith, S. M., Lau, A. K. H., Seinfeld, J. H., and Yu, J. Z.: Efficient control of atmospheric sulfate production based on three formation regimes, Nat. Geosci., 12, 977–982, https://doi.org/10.1038/s41561-019-0485-5, 2019.
Yan, F., Gao, Y., Ma, M., Liu, C., Ji, X., Zhao, F., Yao, X., and Gao, H.: Revealing the modulation of boundary conditions and governing processes on ozone formation over northern China in June 2017, Environ. Pollut., 272, 115999, https://doi.org/10.1016/j.envpol.2020.115999, 2021.
Yang, J., Au, W. C., Law, H., Lam, C. H., and Nah, T.: Formation and evolution of brown carbon during aqueous-phase nitrate-mediated photooxidation of guaiacol and 5-nitroguaiacol, Atmos. Environ., 254, 118401, https://doi.org/10.1016/j.atmosenv.2021.118401, 2021.
Yang, J., Qu, Y., Chen, Y., Zhang, J., Liu, X., Niu, H., and An, J.: Dominant physical and chemical processes impacting nitrate in Shandong of the North China Plain during winter haze events, Sci. Total Environ., 912, 169065, https://doi.org/10.1016/j.scitotenv.2023.169065, 2024.
Ye, C., Zhou, X., Pu, D., Stutz, J., Festa, J., Spolaor, M., Tsai, C., Cantrell, C., Mauldin, R. L., Campos, T., Weinheimer, A., Hornbrook, R. S., Apel, E. C., Guenther, A., Kaser, L., Yuan, B., Karl, T., Haggerty, J., Hall, S., Ullmann, K., Smith, J. N., Ortega, J., and Knote, C.: Rapid cycling of reactive nitrogen in the marine boundary layer, Nature, 532, 489–491, https://doi.org/10.1038/nature17195, 2016.
Yu, F., Luo, G., Nair, A. A., Schwab, J. J., Sherman, J. P., and Zhang, Y.: Wintertime new particle formation and its contribution to cloud condensation nuclei in the Northeastern United States, Atmos. Chem. Phys., 20, 2591–2601, https://doi.org/10.5194/acp-20-2591-2020, 2020.
Zang, H., Zhao, Y., Huo, J., Zhao, Q., Fu, Q., Duan, Y., Shao, J., Huang, C., An, J., Xue, L., Li, Z., Li, C., and Xiao, H.: High atmospheric oxidation capacity drives wintertime nitrate pollution in the eastern Yangtze River Delta of China, Atmos. Chem. Phys., 22, 4355–4374, https://doi.org/10.5194/acp-22-4355-2022, 2022.
Zhai, S., Jacob, D. J., Wang, X., Shen, L., Li, K., Zhang, Y., Gui, K., Zhao, T., and Liao, H.: Fine particulate matter (PM2.5) trends in China, 2013–2018: separating contributions from anthropogenic emissions and meteorology, Atmos. Chem. Phys., 19, 11031–11041, https://doi.org/10.5194/acp-19-11031-2019, 2019.
Zhai, S., Jacob, D. J., Wang, X., Liu, Z., Wen, T., Shah, V., Li, K., Moch, J. M., Bates, K. H., Song, S., Shen, L., Zhang, Y., Luo, G., Yu, F., Sun, Y., Wang, L., Qi, M., Tao, J., Gui, K., Xu, H., Zhang, Q., Zhao, T., Wang, Y., Lee, H. C., Choi, H., and Liao, H.: Control of particulate nitrate air pollution in China, Nat. Geosci., 14, 389–395, https://doi.org/10.1038/s41561-021-00726-z, 2021.
Zhang, C., Liao, H., Li, K., Dai, H., and Gu, Z.: Numerical Simulation of Summertime OH Concentrations in China Since the Implementation of the Air Pollution Prevention and Control Action Plan, Chinese Journal of Atmospheric Sciences, 47, 713–724, 2023a (in Chinese).
Zhang, X., Tong, S., Jia, C., Zhang, W., Wang, Z., Tang, G., Hu, B., Liu, Z., Wang, L., Zhao, P., Pan, Y., and Ge, M.: Elucidating HONO formation mechanism and its essential contribution to OH during haze events, npj Climate and Atmospheric Science, 6, 55, https://doi.org/10.1038/s41612-023-00371-w, 2023b.
Zhang, Y.-L., Zhang, W., Fan, M.-Y., Li, J., Fang, H., Cao, F., Lin, Y.-C., Wilkins, B. P., Liu, X., Bao, M., Hong, Y., and Michalski, G.: A diurnal story of Δ17O(NO) in urban Nanjing and its implication for nitrate aerosol formation, npj Climate and Atmospheric Science, 5, 50, https://doi.org/10.1038/s41612-022-00273-3, 2022.
Zhang, Z., Jiang, Z., Guan, H., Liang, Y., Zheng, N., and Guo, W.: Isotopic Evidence for the High Contribution of Wintertime Photochemistry to Particulate Nitrate Formation in Northern China, J. Geophys. Res.-Atmos., 126, e2021JD035324, https://doi.org/10.1029/2021JD035324, 2021.
Zhang, Z., Zhou, T., Jiang, Z., Ma, T., Su, G., Ruan, X., Wu, Y., Cao, Y., Wang, X., Liu, Z., Li, W., Zhang, H., Lin, M., Liu, P., and Geng, L.: High-Resolution Measurements of Multi-Isotopic Signatures (δ15N, δ18O, and Δ17O) of Winter NO2 in a Megacity in Central China, Environ. Sci. Technol., 59, 3634–3644, https://doi.org/10.1021/acs.est.4c07724, 2025.
Zhao, X., Zhao, X., Liu, P., Chen, D., Zhang, C., Xue, C., Liu, J., Xu, J., and Mu, Y.: Transport Pathways of Nitrate Formed from Nocturnal N2O5 Hydrolysis Aloft to the Ground Level in Winter North China Plain, Environ. Sci. Technol., 57, 2715–2725, https://doi.org/10.1021/acs.est.3c00086, 2023.
Zhao, Z.-Y., Zhang, Y.-L., Lin, Y.-C., Song, W.-H., Yu, H.-R., Fan, M.-Y., Hong, Y.-H., Yang, X.-Y., Li, H.-Y., and Cao, F.: Continental Emissions Influence the Sources and Formation Mechanisms of Marine Nitrate Aerosols in Spring Over the Bohai Sea and Yellow Sea Inferred From Stable Isotopes, J. Geophys. Res.-Atmos., 129, e2023JD040541, https://doi.org/10.1029/2023JD040541, 2024.
Zheng, B., Tong, D., Li, M., Liu, F., Hong, C., Geng, G., Li, H., Li, X., Peng, L., Qi, J., Yan, L., Zhang, Y., Zhao, H., Zheng, Y., He, K., and Zhang, Q.: Trends in China's anthropogenic emissions since 2010 as the consequence of clean air actions, Atmos. Chem. Phys., 18, 14095–14111, https://doi.org/10.5194/acp-18-14095-2018, 2018.
Zheng, H., Song, S., Sarwar, G., Gen, M., Wang, S., Ding, D., Chang, X., Zhang, S., Xing, J., Sun, Y., Ji, D., Chan, C. K., Gao, J., and McElroy, M. B.: Contribution of Particulate Nitrate Photolysis to Heterogeneous Sulfate Formation for Winter Haze in China, Environ. Sci. Tech. Let., 7, 632–638, https://doi.org/10.1021/acs.estlett.0c00368, 2020.
Zhong, X., Shen, H., Zhao, M., Zhang, J., Sun, Y., Liu, Y., Zhang, Y., Shan, Y., Li, H., Mu, J., Yang, Y., Nie, Y., Tang, J., Dong, C., Wang, X., Zhu, Y., Guo, M., Wang, W., and Xue, L.: Nitrous acid budgets in the coastal atmosphere: potential daytime marine sources, Atmos. Chem. Phys., 23, 14761–14778, https://doi.org/10.5194/acp-23-14761-2023, 2023.
Zhou, W., Gao, M., He, Y., Wang, Q., Xie, C., Xu, W., Zhao, J., Du, W., Qiu, Y., Lei, L., Fu, P., Wang, Z., Worsnop, D. R., Zhang, Q., and Sun, Y.: Response of aerosol chemistry to clean air action in Beijing, China: Insights from two-year ACSM measurements and model simulations, Environ. Pollut., 255, 113345, https://doi.org/10.1016/j.envpol.2019.113345, 2019.
Zong, Z., Tan, Y., Wang, X., Tian, C., Li, J., Fang, Y., Chen, Y., Cui, S., and Zhang, G.: Dual-modelling-based source apportionment of NOx in five Chinese megacities: Providing the isotopic footprint from 2013 to 2014, Environ. Int., 137, 105592, https://doi.org/10.1016/j.envint.2020.105592, 2020.