the Creative Commons Attribution 4.0 License.
the Creative Commons Attribution 4.0 License.
 | 05 Aug 2025
Technical note: Towards a stronger observational support for haze pollution control by interpreting carbonaceous aerosol results derived from different measurement approaches
Yuan Cheng
Ying-jie Zhong
Zhi-qing Zhang
Xu-bing Cao
As China's fine particulate matter (PM2.5) has decreased nationwide during the last decade, further improvement of air quality has become more challenging, imposing higher requirements on the observational support for the understanding of aerosol sources. This was particularly the case for the severe cold-climate region in Northeast China, which suffered from relatively slow decrease rate and high exposure risk of PM2.5. Here, we evaluated carbonaceous aerosol data measured by different sampling and analytical approaches based on field campaigns conducted during a frigid winter and an agricultural-fire-impacted spring in Harbin. For both the high- and low-volume sampling, a total of four sets of organic and elemental carbon results were derived by applying two commonly used temperature protocols (IMPROVE-A – i.e., IMPV – and NIOSH) to both untreated filters and those extracted by methanol. Only the IMPV-based results measured before the extraction were found to be indicative of aerosol sources, e.g., in reasonable accordance with secondary aerosol formation in winter and open-burning impacts in spring. Thus, the analytical method of IMPROVE-A with untreated samples is recommended for future field observations and source apportionments of PM2.5 in the studied region. In addition, although the low- and high-volume samplers typically led to comparable measurement results for various species, exceptions were identified for water-soluble potassium (K+) and some fire-emitted chromophores. We suggest that K+ and light absorption coefficients of brown carbon should be compared or integrated with caution across studies using different PM2.5 samplers.
- Article
(2841 KB) - Full-text XML
-
Supplement
(534 KB) - BibTeX
- EndNote


Carbonaceous aerosols are a complex mixture of compounds exhibiting a gradual change in chemical and physical properties (Pöschl, 2005; Andreae and Gelencsér, 2006), e.g., from colorless organics with low molecular weights to “dark-brown” carbon with relatively high thermal stabilities (Chakrabarty et al., 2023) and, finally, to refractory black carbon which is strongly light-absorbing. As important contributors to both fine particulate matter (PM2.5) pollution and radiative forcing, they have long been targeted to achieve a synergistic improvement of air quality and mitigation of climate change (Fuzzi et al., 2015; von Schneidemesser et al., 2015; Liu et al., 2022). However, it remains a challenge to properly represent carbonaceous aerosols in chemical transport models as each step along the way in the estimations of sources and spatiotemporal variations is difficult. For example, considerable uncertainties exist in the open-burning emissions, secondary organic aerosol (SOA) budget, and black carbon lifetime (Andela et al., 2022; Chang et al., 2022; Zhong et al., 2023). This, in turn, introduces substantial uncertainties into the climate and health effects of carbonaceous aerosols (Li et al., 2022).
Field observational data on carbonaceous aerosols, including those derived from ground and aircraft measurements, are essential to constrain the simulation results and, subsequently, to improve the model performance (Philip et al., 2014; Wang et al., 2014b, 2018; Gao et al., 2022; Eckhardt et al., 2023). Relying on online instruments such as the Single Particle Soot Photometer (SP2), aircraft studies typically covered relatively short periods (e.g., up to about 1 month) but provided measurement results with high time and spatial resolutions (Samset et al., 2014). Offline and semi-continuous techniques (e.g., lab and field carbon analyzers for elemental carbon) were more commonly used in ground observations, producing datasets with relatively low time resolutions but spanning several months to decades (Dao et al., 2019; Hand et al., 2024). After accounting for the differences in terms of time resolution, the integration of carbonaceous aerosol data across studies and regions was still not straightforward. A major obstacle was caused by the multitude of measurement principles (Petzold et al., 2013), which was intensively reflected by the considerable and, more importantly, variable discrepancies in black carbon results among different methods (Buffaloe et al., 2014; Li et al., 2019; Pileci et al., 2021; Tinorua et al., 2024). This problem is far from being properly addressed, although great efforts have been devoted to refining measurement approaches such as the thermal–optical (Cavalli et al., 2010), optical (Collaud Coen et al., 2010), and SP2 (Laborde et al., 2012) techniques. In addition, this problem was, to some extent, overlooked in China, which might be partially responsible for the inconsistent source apportionment results obtained by different studies. For example, both Zheng et al. (2015) and Liu et al. (2020) applied the elemental carbon (EC) tracer method to estimate secondary organic carbon (SOC) during winter in Beijing, but the two studies derived conflicting conclusions regarding the contribution of heterogeneous chemistry to SOC formation (i.e., minimal vs. significant) since different analytical methods (i.e., NIOSH vs. IMPROVE-A temperature protocols) for EC were deployed. Such inconsistencies substantially weakened the observational support for the understanding of aerosol sources, and thus, the control of haze pollution.
With a considerable decrease in the national PM2.5 since 2013, it has become more challenging to further improve the air quality in China (Cheng et al., 2021). This has imposed higher requirements on the observational insights into aerosol sources, including the evaluation of carbonaceous aerosol results among various measurement approaches. Here, we focused on the widely used thermal–optical method, which separates carbonaceous components into two fractions with different thermal stabilities and light absorption capacities, i.e., organic carbon (OC) and EC. The basis of the separation includes two points: EC evolves form the filter at higher temperatures than OC, and the removal of EC leads to a rapid increase in the filter transmittance and reflectance signals. A major problem in this method is that a considerable fraction of OC could be transformed into char-OC, which is difficult to robustly distinguish from EC with respect to either thermal or optical behavior. In addition, the amount and optical properties of char-OC were found to depend on the temperature protocol deployed (Yu et al., 2002; Yang and Yu, 2002; Subramanian et al., 2006). This, to a large extent, explained the EC discrepancies among various protocols. However, it remained unclear how the charring process and, thus, the EC measurement were influenced by OC sources and composition (Chiappini et al., 2014). In addition, to reduce or minimize the interference from char-OC, several investigators have tried to remove a fraction of OC from the samples before thermal–optical analysis by extracting the filters using water, methanol, or other solvents (Piazzalunga et al., 2011; Giannoni et al., 2016; Lappi and Ristimäki, 2017; Aakko-Saksa et al., 2018; Hu et al., 2023). However, inconsistent patterns were identified in the effects of OC removal on EC determination, with evidence available for both an increase (e.g., Piazzalunga et al., 2011) and a decrease in EC (e.g., Hu et al., 2023) after the extraction. The discussions above indicated that the thermal–optical methods, including the practicability of sample pretreatment by extraction, merit further investigations.
In this study, we compared carbonaceous aerosol results determined by different analytical and sampling approaches based on filter samples collected in Harbin, the northernmost megacity in China. Compared to other megacities such as Beijing, Harbin is characterized by a frigid winter (with an average temperature of about −20 °C in January) and a massive agricultural sector in surrounding areas (i.e., the Songnen Plain in Northeast China). In addition, Harbin and other cities in Northeast China have largely been overlooked in clean-air actions and, thus, in studies on haze, as indicated by the limited observational data available (Liu et al., 2022). This lack of investigation was partially responsible for the relatively slow decrease rate (Xiao et al., 2022) and high exposure risk (Wei et al., 2023) of PM2.5 in this distinct region. Thus, our study on measurement methods of carbonaceous aerosols is expected to be a support for future efforts on the exploration of PM2.5 sources in Northeast China, which are essential for further improving the regional air quality.
2.1 Field sampling
PM2.5 samples were collected at an urban site in Harbin, i.e., on the campus of the Harbin Institute of Technology, during the winter and spring of 2021. The sampling was done by a mass-flow-controlled high-volume sampler (TE-6070BLX-2.5-HVS; Tisch Environmental Inc., OH, USA) and a low-volume sampler (MiniVol; Airmetrics, OR, USA), operated using quartz-fiber filters (Pall Corporation, NY, USA) at flow rates of 1.13 m3 min−1 and 5 L min−1, respectively. The flow rates, together with the particle-laden filter areas, could be translated into the face velocities of 46.34 and 7.35 cm s−1 for the high- and low-volume (HV and LV) samplers, respectively. This indicated that, when the two samplers were run in parallel, the HV-to-LV ratio of particle loading would be 6.3.
The 2021 winter campaign covered the entirety of January, the coldest month during that year, with an average temperature of −19 °C. In addition, the spring campaign was conducted during 10–30 April 2021, a period with frequent occurrences of agricultural fires (as indicated by the satellite-based active-fire detection results; Fig. S1 in the Supplement). For both seasons, the HV sampler was used to collect daytime (09:00–16:00 local time (LT)) and nighttime (21:00–05:00 LT of the next day) samples, while the LV one was operated on a daily basis (∼ 09:00–09:00 LT of the next day), leading to 24 h integrated samples. Each LV sample generally corresponded to two HV samples, although the two samplers were not exactly parallel. One reason for the relatively short sampling durations of the HV sampler was to avoid high particle loadings that could prohibit proper filter transmittance measurements (Lappi and Ristimäki, 2017).
2.2 Laboratory analysis
For both the HV and LV samples, two punches were prepared to determine OC and EC using a thermal–optical carbon analyzer (DRI-2001; Atmoslytic Inc., CA, USA). One punch was directly measured, while the other one was immersed in methanol (HPLC grade; Fisher Scientific Company L.L.C., NJ, USA) for 1 h without stirring or sonication, dried in air for another hour, and then analyzed. All the pairs of untreated and extracted punches were measured using the IMPROVE-A and NIOSH temperature protocols, both of which were operated with transmittance charring correction (Fig. 1). This correction approach was applied since the intensity of the filter transmittance signal (I) has a clear association with EC, e.g., as assumed by the Aethalometer, another widely used instrument for measuring black carbon. Inter-protocol comparisons showed good repeatability for both the total carbon (TC) and optical attenuation (ATN) results (Fig. 2), demonstrating the robustness of the analyzer for detecting carbon and filter transmittance signals. Here, ATN was calculated as , where Iinitial and Ifinal indicate I measured at the beginning (i.e., when the particle-laden filter has not been heated) and end (i.e., when all of the deposited carbon has been combusted off the filter) of the thermal–optical analysis, respectively. ATN was of interest because it was closely related to EC loading (ECs, in µg cm−2), e.g., typically with a linear dependence for relatively low ECs levels (Chen et al., 2020; Liu et al., 2020). It should be noted that, for the parallel TC and ATN measurements by different protocols, the relative standard deviation (RSD) levels increased after the extraction, e.g., from ∼2 % to 5 % and from ∼2 % to 4 % for the HV samples, respectively. However, the RSD levels, i.e., the uncertainties, were considered to be low enough for both the untreated and extracted filters.
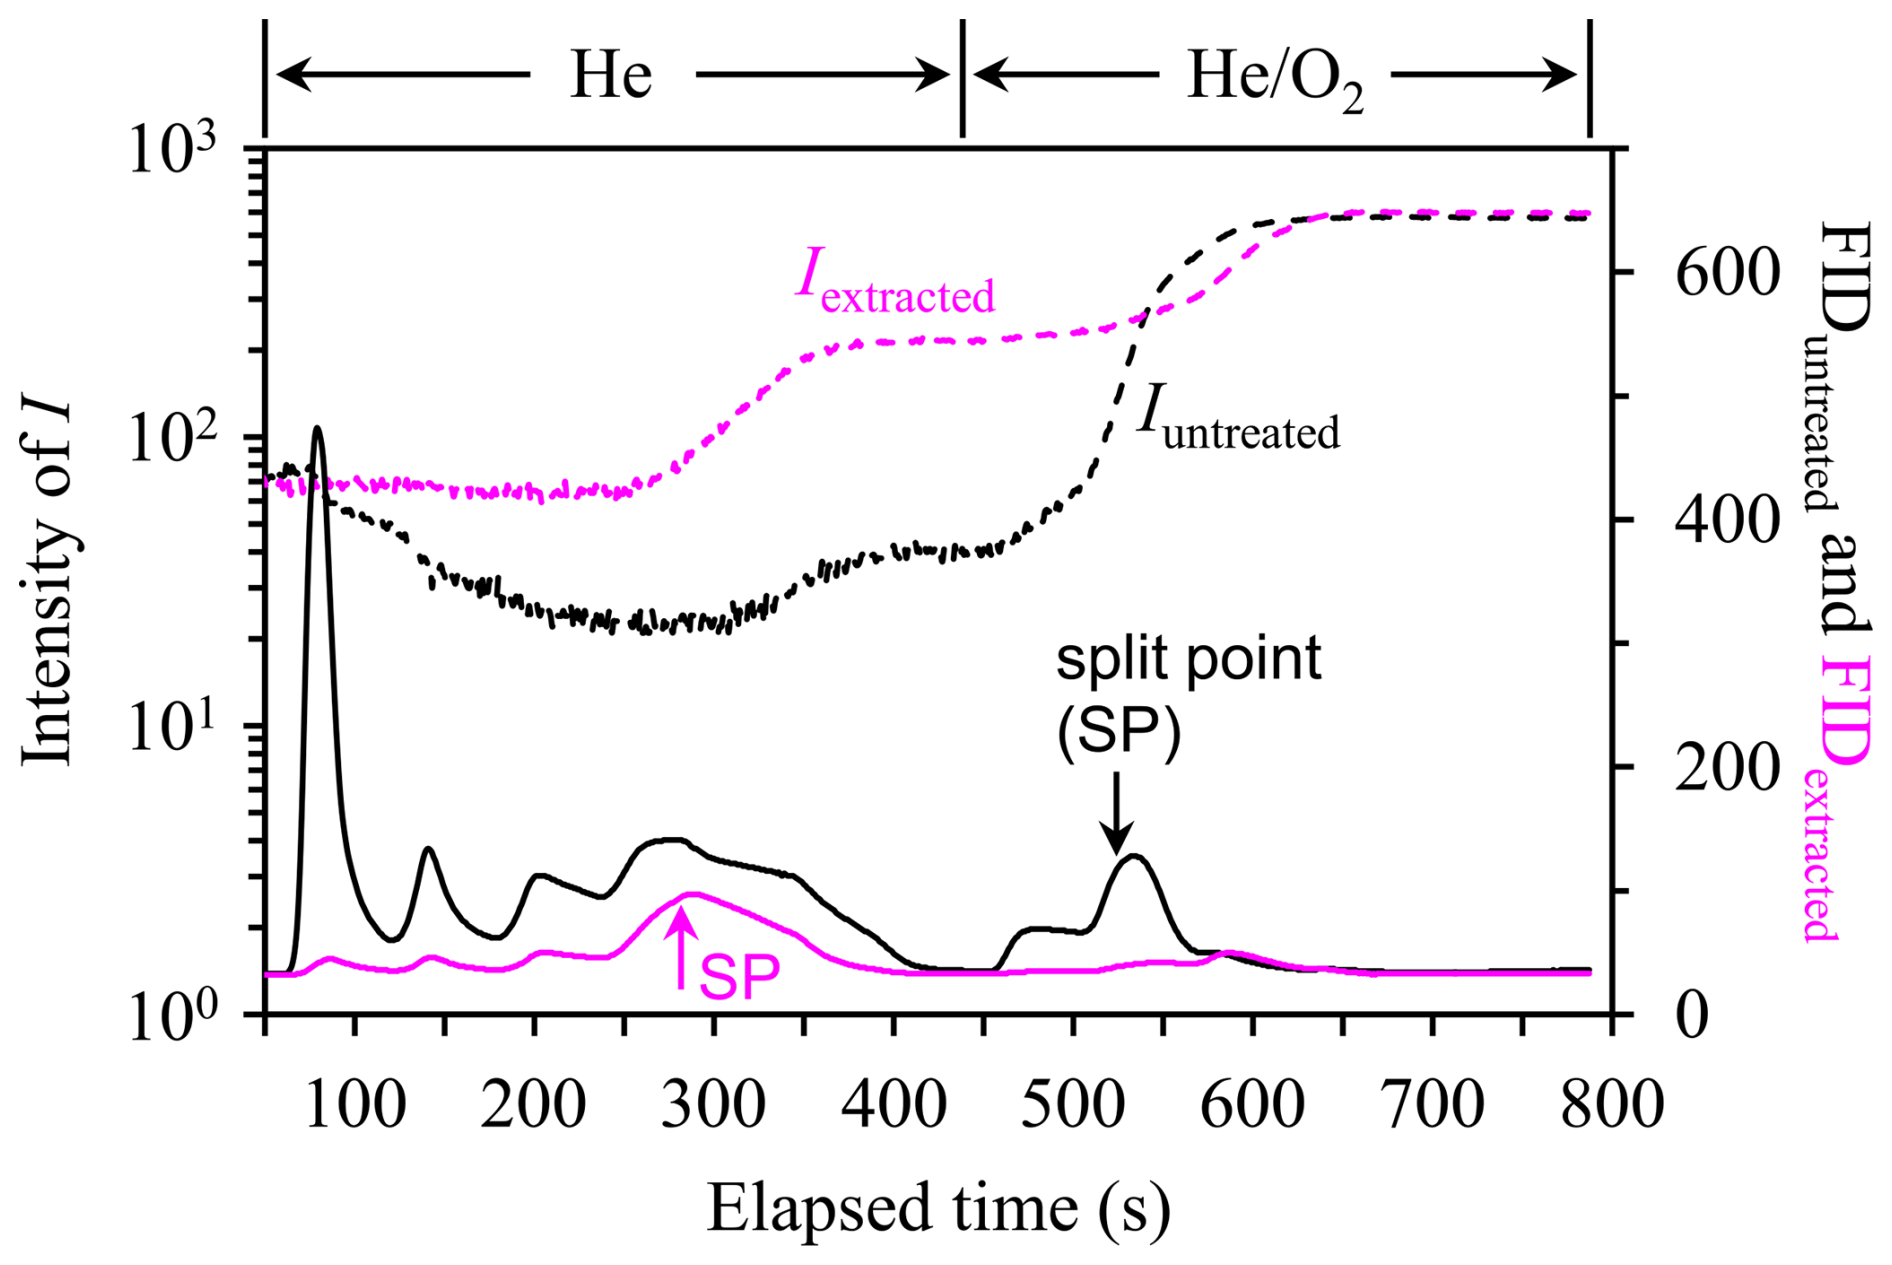
Figure 1Thermograms measured using a pair of untreated and extracted HV filters. The sample was collected during the daytime of 25 January 2021. The temperature protocol used was NIOSH, in which the filter was heated in a He (first to 870 °C stepwise and then cooled down to 550 °C) and a (from 550 to 890 °C stepwise) atmosphere sequentially. NIOSH had fixed durations for the various heating stages and thus was preferred for the comparison of thermograms. I indicates the filter transmittance signal, and FID indicates the carbon signal, which was measured by a flame ionization detector. The subscripts “untreated” and “extracted” distinguished the thermograms measured before and after the extraction, while the split points of OC and EC were marked by the arrows.
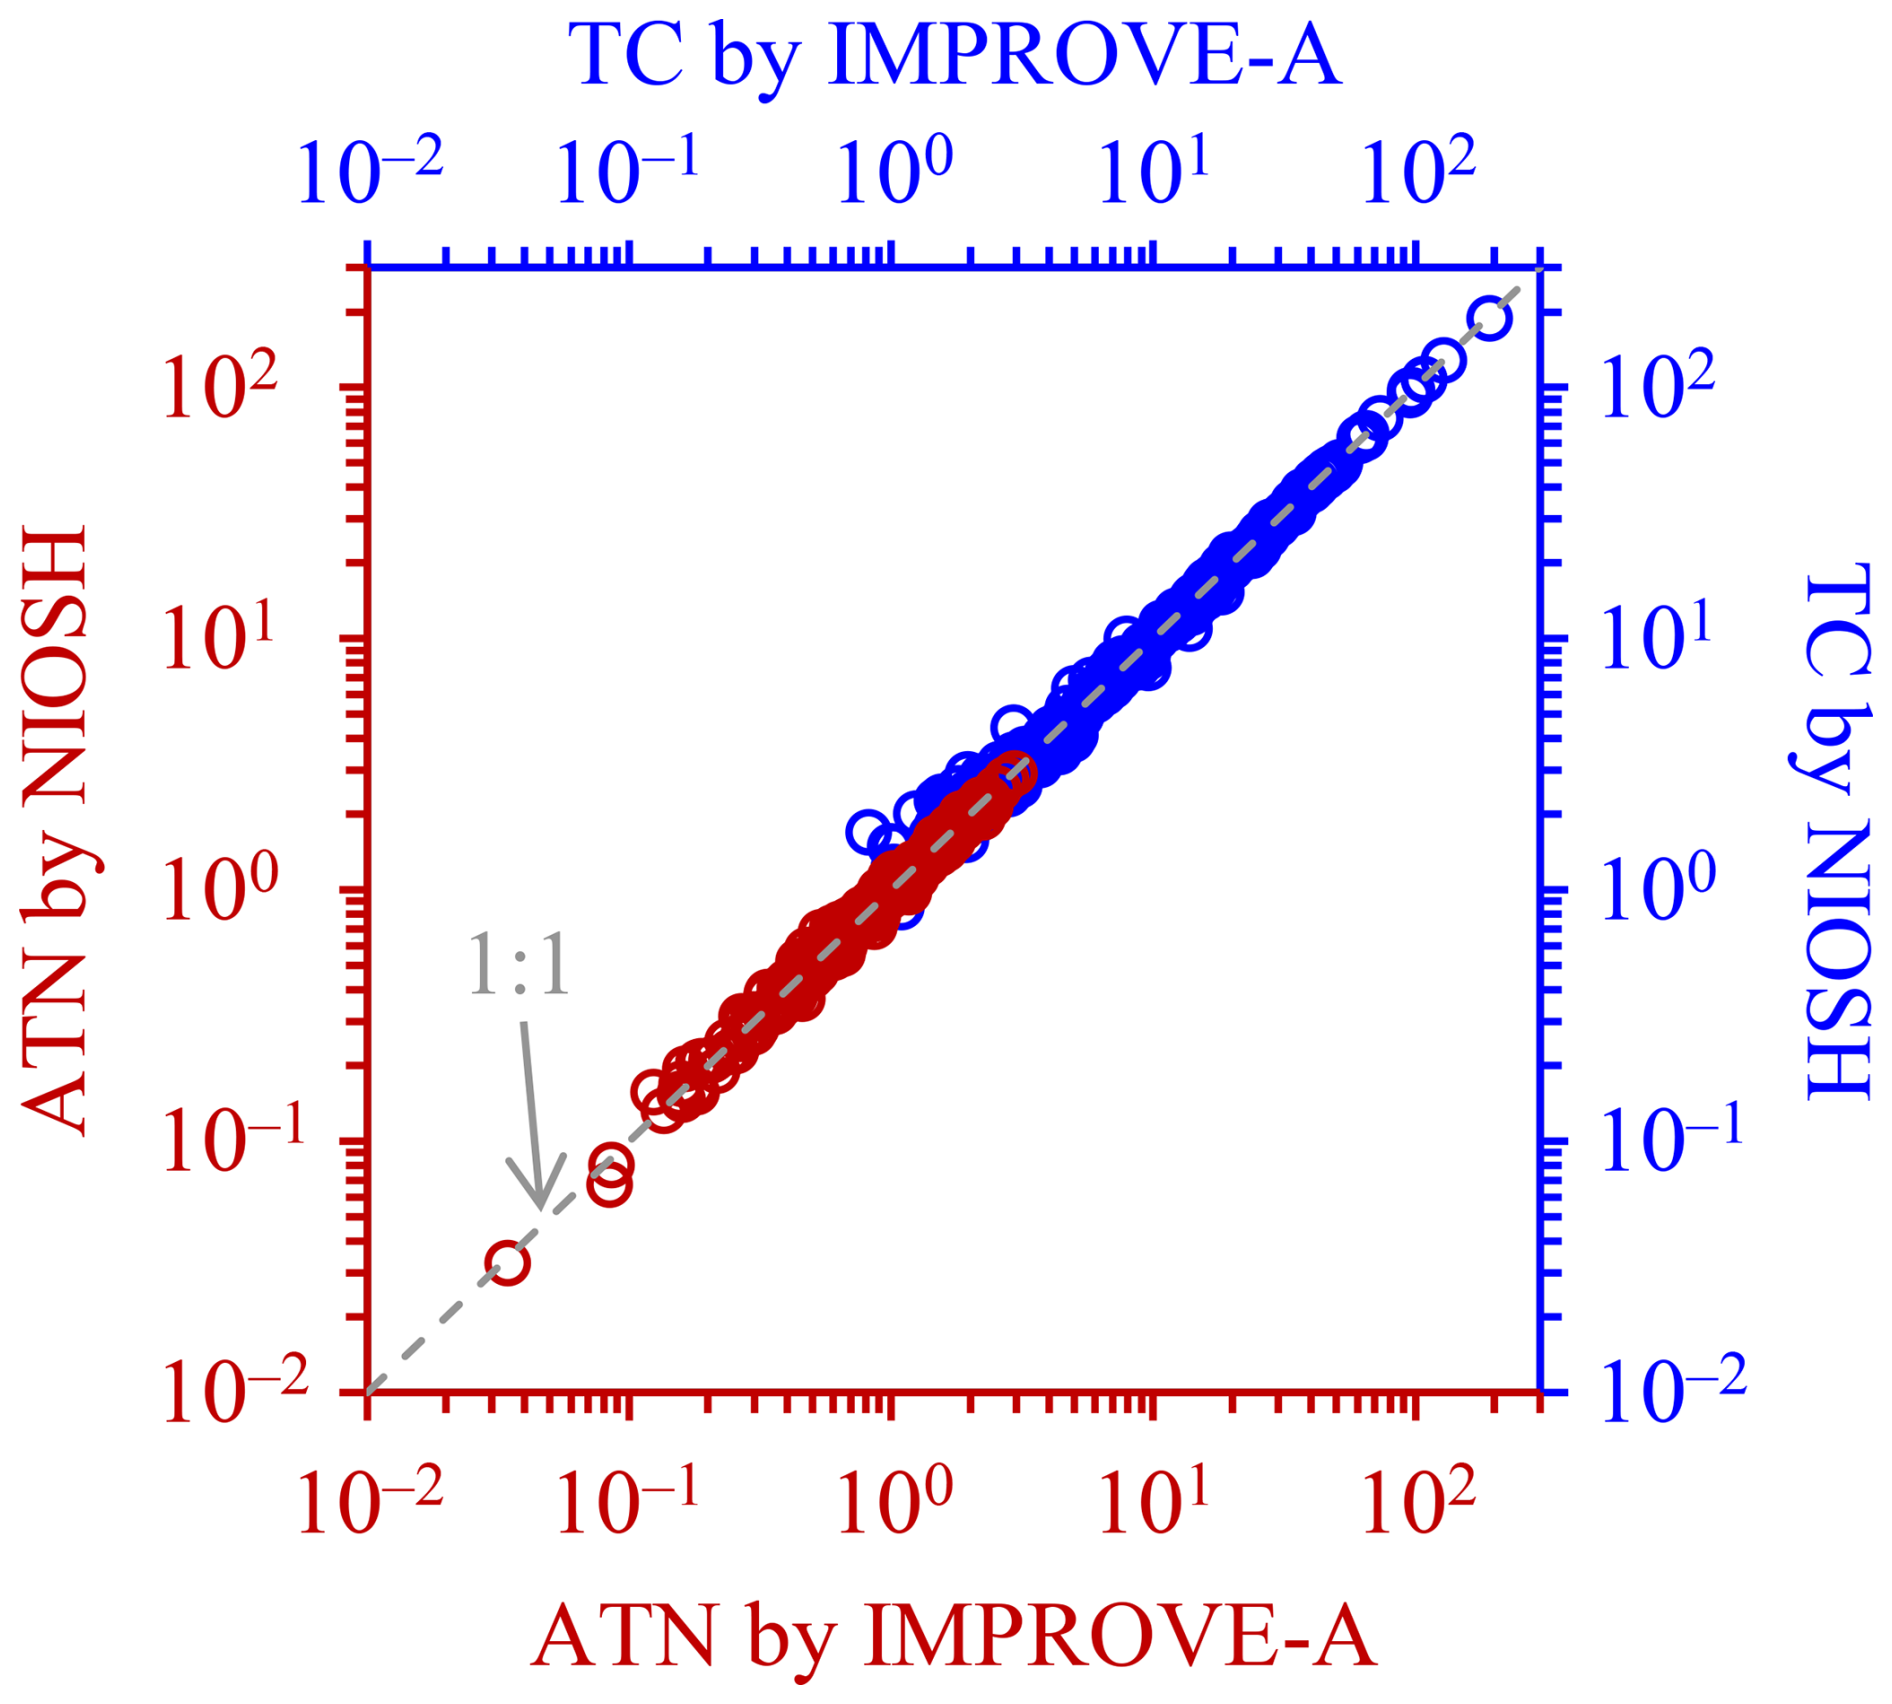
Figure 2Comparisons of TC (in µg C cm−2) and ATN (dimensionless) measured using different temperature protocols. Results from the HV and LV samples, both untreated and extracted, were combined for the comparisons. Linear regression of the NIOSH-based TC against that determined by IMPROVE-A led to a slope of 0.99 ± 0.00 (r=1.00; intercept was set as zero). Similar regression results (i.e., slope=0.99 ± 0.00; r=1.00) were obtained for ATN. On the one hand, the good repeatabilities demonstrated the performance of the carbon analyzer for measuring the carbon and laser transmittance signals, and, on other hand, they indicated a homogeneous distribution of carbonaceous components for not only the untreated but also the extracted filters, i.e., a negligible disturbance of EC, as well as of other insoluble carbon, by the extraction.
In addition, following the method developed by Hecobian et al. (2010), wavelength-resolved light absorption coefficients (babs) of the methanol extracts, i.e., the dissolved brown carbon (BrC), were measured using a spectrophotometer (Ocean Optics Inc., FL, USA) coupled with a 2.5 m long liquid waveguide capillary cell (LWCC; World Precision Instruments, FL, USA). Inorganic ions and levoglucosan were also determined for the HV and HV samples by analyzing their water extracts using a Dionex ion chromatography system (ICS-5000+; Thermo Fisher Scientific Inc., MA, USA).
2.3 Open-access data
Meteorological data (e.g., temperature and relative humidity) and air quality data (e.g., PM2.5, PM10, and CO) for the measurement periods were obtained with a time resolution of 1 h from Weather Underground (https://www.wunderground.com/, last access: 31 July 2025) and the China National Environmental Monitoring Center (CNEMC; https://air.cnemc.cn:18007/, last access: 31 July 2025), respectively.
3.1 Evaluation of EC results from the winter campaign
A precondition for proper separation of OC and EC is that the filter transmittance signal (I) can properly reflect the formation of light-absorbing char-OC during the inert mode (which would result in a decrease in I) and the combustion, i.e., removal, of char-OC and EC during the oxidation mode (which would result in an increase in I). An empirical approach to evaluate this precondition is to examine the dependence of ATN on ECs (Subramanian et al., 2006). A linear relationship was typically observed for relatively low ECs levels, and, in this case, the precondition was commonly believed to be valid. However, the linearity did not necessarily extend when ECs increased further since previous studies frequently found that the measured ATN could be considerably lower than expected for heavily loaded samples (Shen et al., 2013; Costa et al., 2016; Chen et al., 2020). The deviation of ATN vs. ECs dependence from a linear relationship was usually termed as the loading effect, and a traditional explanation was that ATN became less sensitive to the variation of ECs as filter loading increased. An extreme case was observed during winter in Beijing in that the ATN values were largely unchanged for heavily loaded filters, with TC varying between 150 and 300 µg C cm−2 (Liu et al., 2019). For the samples showing non-linear ATN vs. ECs dependence, their EC results should be interpreted with caution.
We first investigated the relationship between ATN and ECs for the wintertime HV samples, focusing on the results from IMPROVE-A. For the untreated filters, ATN correlated linearly with ECs (leading to a regression slope of 42.8 ± 1.9 m2 (g C)−1 and a close-to-zero intercept; r=0.95) when the filters were lightly to moderately loaded, i.e., when the ECs levels were below 5 µg C cm−2 (Fig. 3a). The physical meaning of the slope was the mass absorption efficiency (MAE) of black carbon, but with artifacts such as that caused by the multiple-scattering effect (Lack et al., 2014). The overall impact of various artifacts results in an overestimation of MAE, typically by factors of ∼3 (Knox et al., 2009; Qin et al., 2018). The linearity determined for the ECs range of below 5 µg C cm−2 did not hold for the more heavily loaded samples (N=3, as highlighted by the solid circles in Fig. 3a), showing evidence of the loading effect. For the extracted samples, a linear correlation between ATN and ECs was also identified for relatively low EC loadings (Fig. 3b), with a similar relationship (i.e., a regression slope of 41.5 m2 (g C)−1 and a close-to-zero intercept; r=0.95) to that derived from the untreated filters. However, it was noteworthy that ECmax, the upper limit of EC loading for a linear ATN vs. ECs dependence, was only 3 µg C cm−2 for the extracted filters, much lower than that determined for the untreated ones. Due to the shift of ECmax, 51 % of the extracted samples showed evidence of the loading effect, whereas this fraction was only 5 % before extraction.
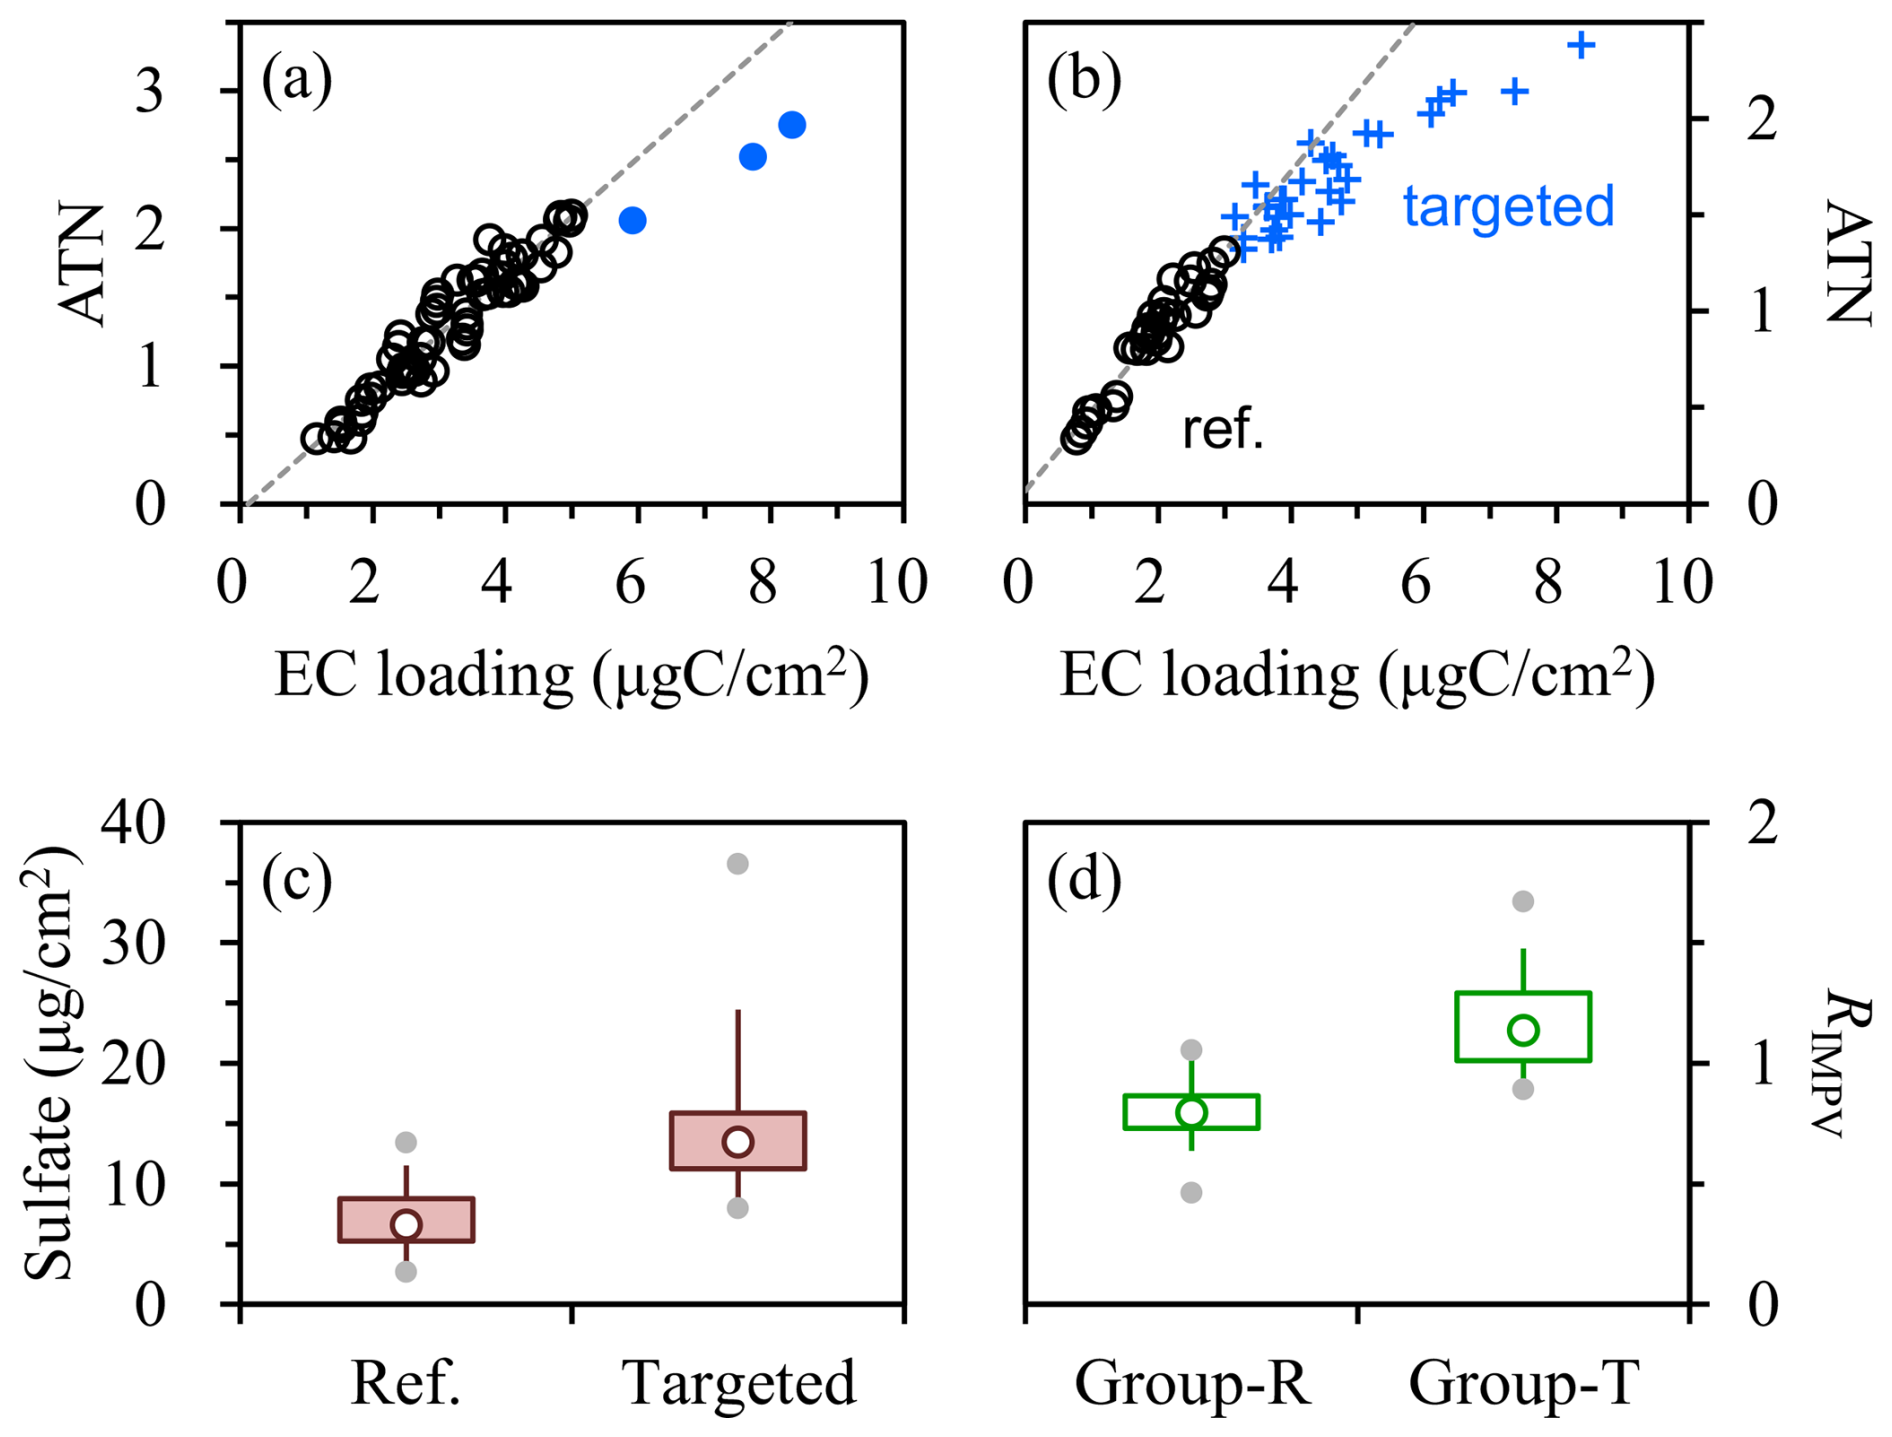
Figure 3Relationships between ATN and EC loading, i.e., ECs, for the (a) untreated and (b) extracted HV filters collected in winter, using the IMPROVE-A protocol. Linear dependences were observed for the untreated samples with ECs below 5 µg C cm−2 and for the extracted samples with ECs below 3 g C cm−2, as indicated by the dashed lines in (a) and (b), respectively. Three untreated samples had ECs above 5 µg C cm−2, as highlighted by the solid circles in (a). In (b), the extracted filters showing non-linear ATN vs. ECs dependence were termed as the targeted samples; correspondingly, the others were referred to as the reference ones (labeled as ref.). (c) Comparison of sulfate loadings between the reference and targeted samples. (d) Comparison of the ECextracted-to-ECuntreated ratios, i.e., RIMPV, between the reference and targeted groups of wintertime HV samples (labeled as group-R and group-T, respectively). The targeted group indicated the targeted filters and the corresponding untreated ones, while the reference group indicated the remaining pairs. Lower and upper box bounds indicate the 25th and 75th percentiles, the whiskers below and above the box indicate the 5th and 95th percentiles, the solid circles below and above the box indicate the minimum and maximum, and the open circle within the box marks the median. All of the EC results involved were measured by IMPROVE-A.
The discussions above raised the question of why the extraction significantly reduced ECmax for the HV samples. In principle, two factors could be responsible for the non-linear dependence of ATN on ECs, including gradual saturation of ATN with increasing filter loading (the traditional explanation; Subramanian et al., 2006) and overestimation of EC mass. The ECmax of untreated samples corresponded to an ATN of 2.1, indicating that the saturation was presumably not a concern for the ATN results below this value. Regarding the extracted samples showing evidence for the loading effect (i.e., the targeted samples), ATN stayed below 2.1 for nearly all of them (28 out of 31); thus, their non-linear ATN vs. ECs dependences should be primarily attributed to the overestimation of EC mass rather than the saturation of ATN. Compared to the other extracted samples, the targeted ones were characterized by substantially higher sulfate loadings (Fig. 3c). It was inferred that, in addition to EC, the abundant sulfate was also a non-negligible contributor to ATN (e.g., through backward scattering; Petzold et al., 2005; Collaud Coen et al., 2010). Thus, when the targeted samples were heated in the carbon analyzer, volatilization of sulfate would lead to a decrease in ATN, i.e., an increase in the filter transmittance signal. This was expected to result in a premature split of OC and EC and, eventually, an overestimation of EC. Other scattering components such as nitrate and secondary organic aerosol (SOA) were not discussed here since they were typically considered to be soluble in methanol and should be absent in the extracted filters.
Comparison of EC between the targeted samples and the corresponding untreated ones (i.e., the targeted group) showed an overall increasing trend after the extraction (Fig. 3d). For these pairs of wintertime HV filters, the ratio of ECextracted (i.e., EC measured in the extracted samples) to ECuntreated (i.e., EC measured in the untreated samples) averaged 1.16 ± 0.20. The extraction-induced increase in EC coincided with the overestimation of elemental carbon mass by ECextracted, which was inferred to be associated with the presence of abundant sulfate in the extracted filters.
For the other pairs of wintertime HV samples (i.e., the reference group), the ECextracted-to-ECuntreated ratios averaged 0.80 ± 0.12, pointing to a decrease in EC after the extraction (Fig. 3d). This was also the case for all of the LV samples collected during the winter campaign, with comparable ECextracted-to-ECuntreated ratios (averaging 0.78 ± 0.12). Here, the LV samples were not divided into subgroups because non-linear dependence of ATN on ECs was identified neither before nor after the extraction (Fig. S2). Given that the loss of insoluble carbon (e.g., EC) was negligible for our extraction procedures (Fig. 2 and Cheng et al., 2024), the extraction-induced decrease in EC likely pointed to the underestimation of elemental carbon mass by ECextracted. A common feature for the HV samples in the reference group and the entirety of the LV samples was the relatively low sulfate loadings. Cheng et al. (2024) inferred that small amounts of sulfate likely favored the transmission of light through the extracted filters (e.g., by forward scattering; Petzold et al., 2005; Collaud Coen et al., 2010). In this case, when the extracted samples were heated during thermal–optical analysis, volatilization of sulfate would induce a drop in the filter transmittance signal, which could not be distinguished from that caused by the formation of char-OC. This was expected to result in an overcorrection for char-OC, i.e., an underestimation of EC.
The contrasting ECextracted-to-ECuntreated ratios observed for the two groups of wintertime HV samples suggested that the influence of sulfate on the transmittance signal of the extracted filter was likely to be loading-dependent. The influence was inferred to be dominated by backward scattering with relatively high sulfate loadings (e.g., for the targeted group), whereas this was dominated by forward scattering when sulfate was less abundant (e.g., for the reference group). This inference was supported by the comparison of evolution patterns of filter transmittance signals under different sulfate loadings (Fig. 4). For the extracted filter with abundant sulfate (i.e., sample-A in Fig. 4), the transmittance signal was largely unchanged during the He mode despite the sufficient organic carbon loading. Correspondingly, the operationally defined char-OC only accounted for a relatively small fraction of the carbon evolving during the mode (i.e., carbon). A possible explanation was that, as the sample was heated, the drop in I induced by char-OC was compensated for by the increase in I due to the reduction in sulfate-driven backward scattering. For the extracted filter with a relatively small amount of sulfate (i.e., sample-B in Fig. 4), however, the transmittance signal decreased significantly during the He mode, and the char-OC contribution to carbon became more considerable correspondingly. Given the much lower organic carbon loading for this sample (e.g., ∼70 % lower than sample-A), the decrease in I was likely to be contributed by not only the formation of char-OC but also the reduction in sulfate-driven forward scattering. The ECextracted results appeared to be biased by different artifacts in the high- and low-sulfate cases, resulting in overestimations or underestimations, respectively, of elemental carbon mass. The sulfate-induced artifacts for ECextracted could be more directly reflected by the positive dependence of the ECextracted-to-ECuntreated ratio on sulfate loading. As shown in Fig. 5, the turning point for the artifact shifting from an underestimation to overestimation of elemental carbon mass by ECextracted occurred in the sulfate-loading range of 10–15 µg cm−2. Figure 5 also suggested that the artifacts for ECextracted were difficult to be accounted for, e.g., by a constant correction factor. This prohibited the use of ECextracted for further analysis of aerosol composition and sources.
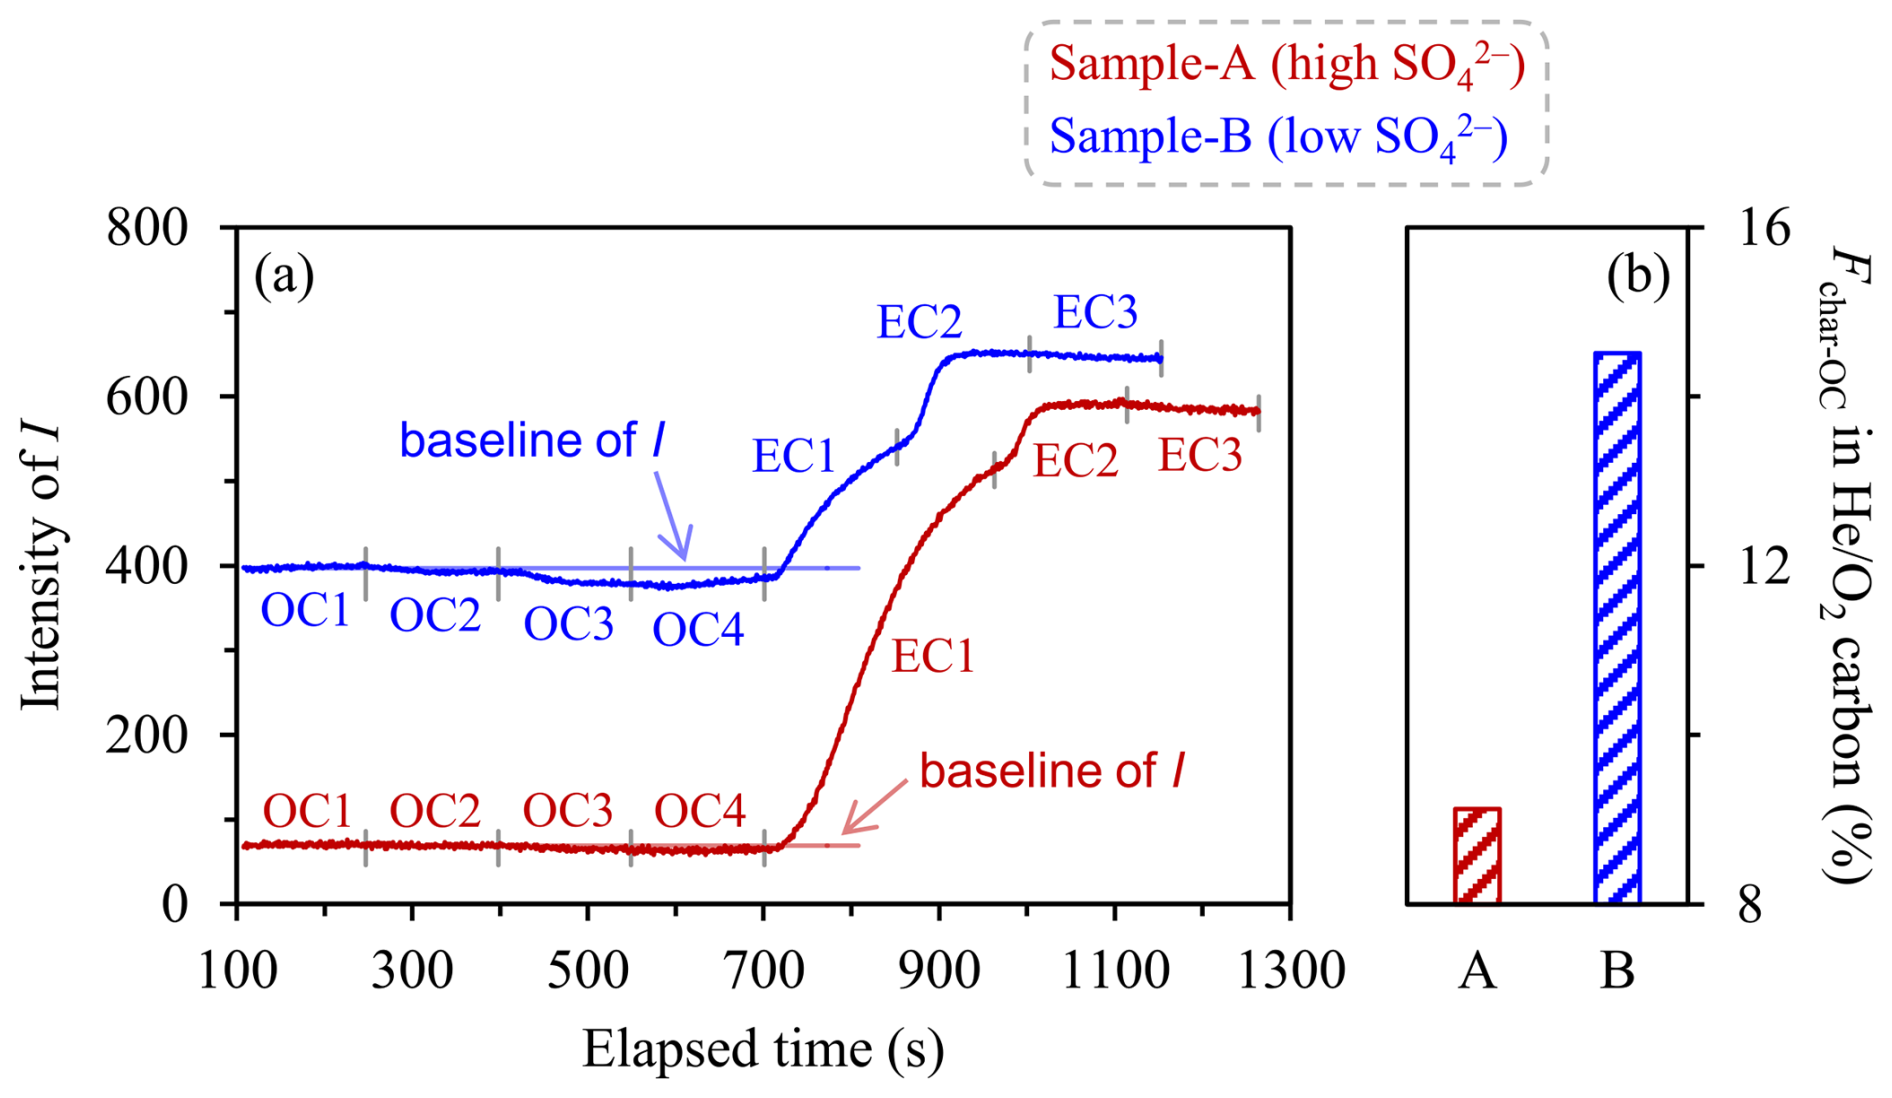
Figure 4Comparisons of (a) the evolution patterns of filter transmittance signal (I) and (b) the fractions of char-OC (i.e., Fchar-OC) in carbon for two extracted HV samples with relatively high and low sulfate loadings (namely sample-A and sample-B, respectively). The two samples were collected during the daytime of 25 January and the nighttime of 6 January 2021, respectively. They had sulfate loadings of 13.21 and 3.29 µg cm−2 and organic carbon loadings of 3.10 and 0.86 µg C cm−2, respectively. The temperature protocol used was IMPROVE-A, in which the filter was first heated to 580 °C in a He atmosphere and then to 840 °C in a atmosphere. The two modes had four (i.e., OC1 to OC4) and three (i.e., EC1 to EC3) heating stages, respectively. carbon indicated the amount of carbon evolving during the oxidizing mode and was typically comprised of char-OC and EC for IMPROVE-A.
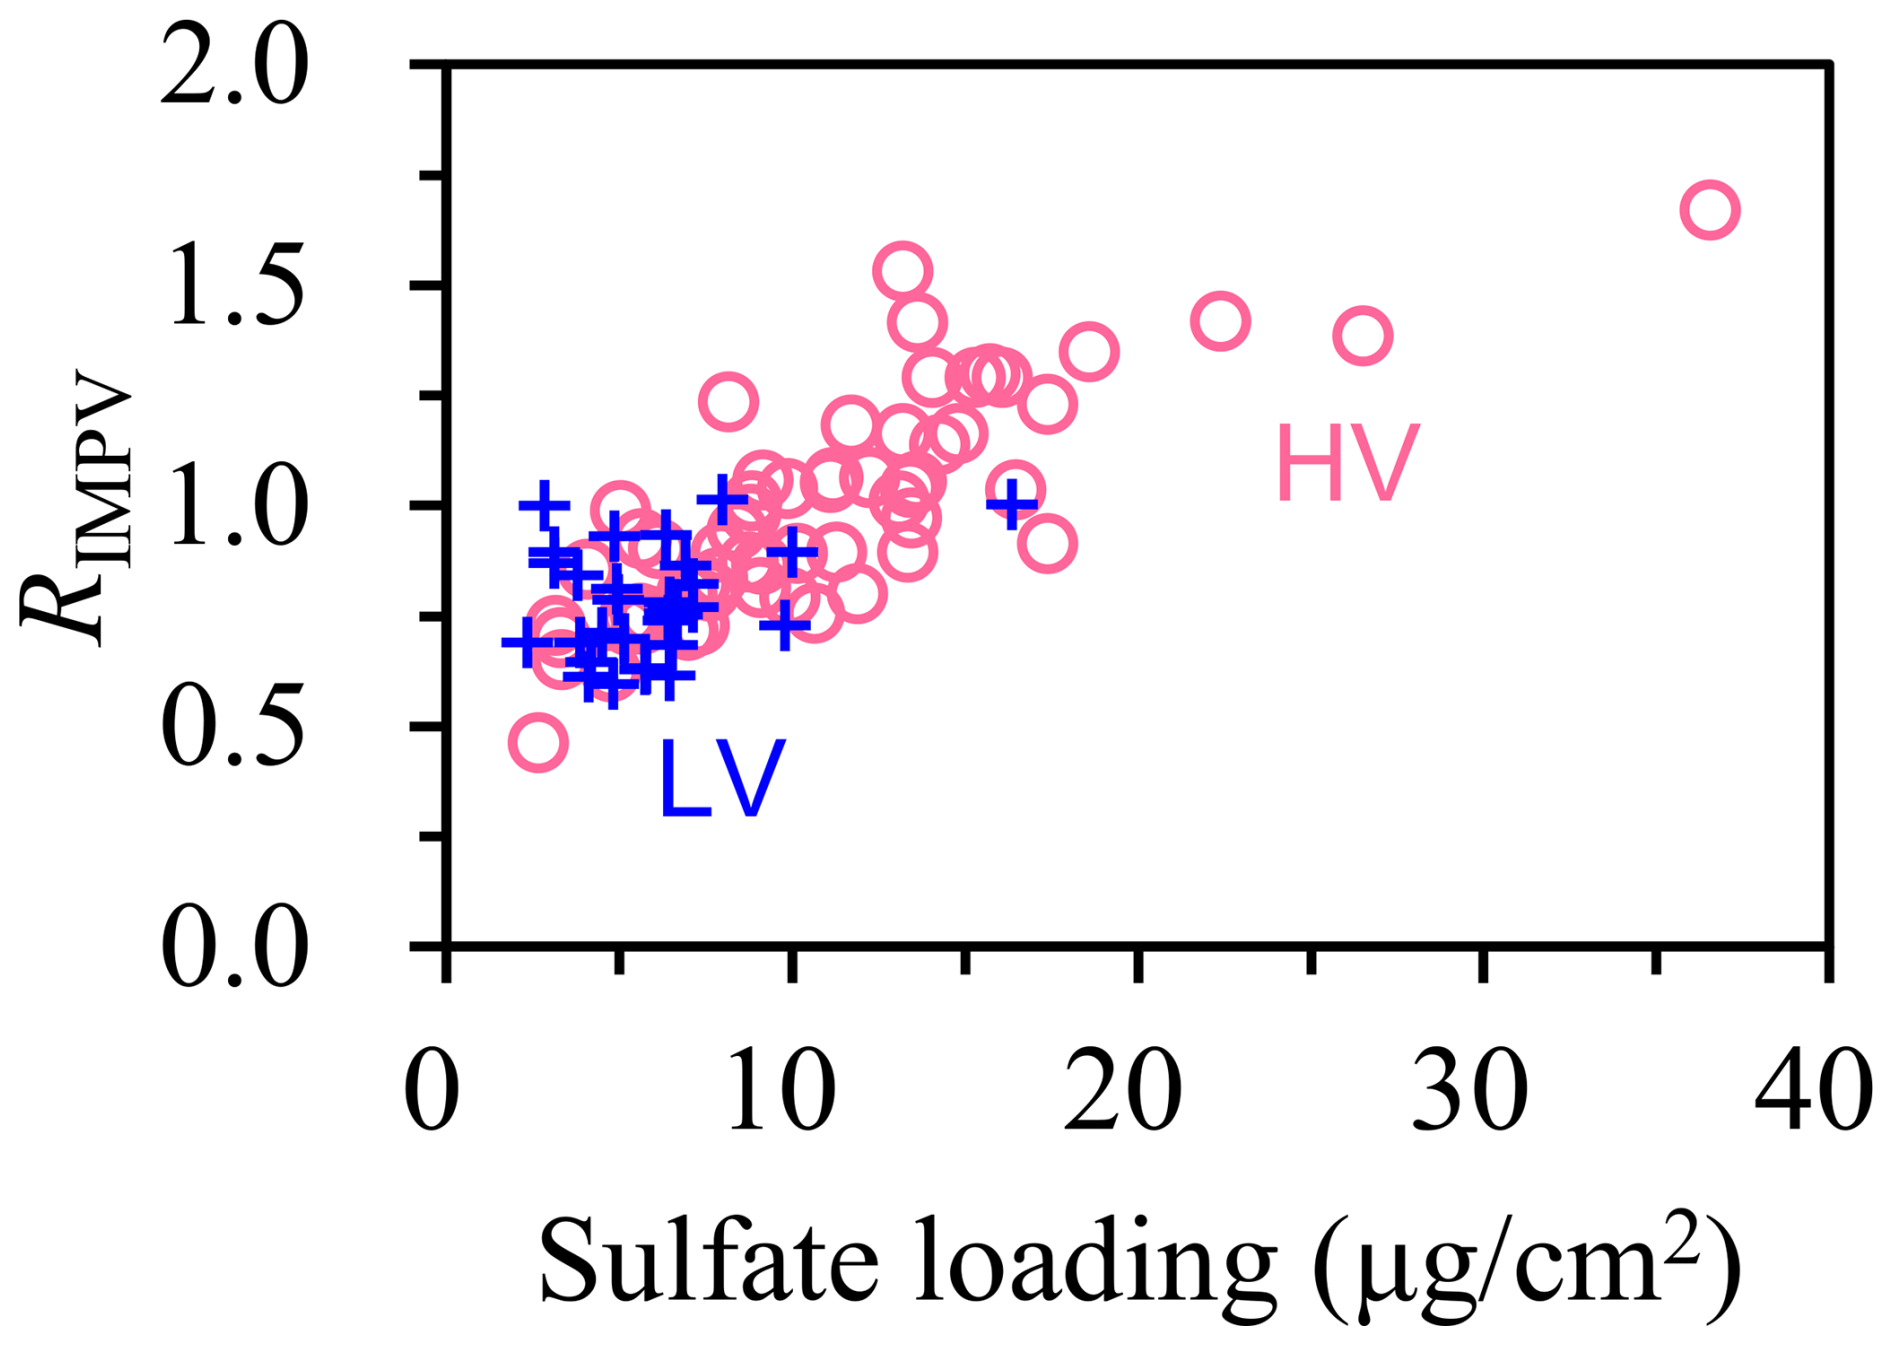
Figure 5Dependence of RIMPV, i.e., the ECextracted-to-ECuntreated ratio determined by IMPROVE-A, on sulfate loading in winter. Consistent trends were observed by the HV and LV samples. The relatively wide range of RIMPV (approximately 0.5–1.5) provided solid evidence for the invalidation of the ECextracted-to-ECuntreated ratio as an indicator for the extraction-induced loss of EC.
For the untreated filters, ATN exhibited a strong linear correlation with ECs for both HV and LV samples, with three heavily loaded HV samples being the only exception. Actually, for the three samples, their ATN vs. ECs relationships did not deviate markedly from the regression line determined for the lower ECs loadings. Therefore, we suggest that, when applying IMPROVE-A to the winter samples, the measurement uncertainties should be less significant for ECuntreated compared to for ECextracted.
The same conclusion could be reached by interpreting the OC-to-EC ratios (OC EC). It has been widely accepted that OC EC depended strongly on SOA formation after excluding the events impacted by irregular emissions such as fireworks and open burning. Such events were not evident throughout the winter campaign, and, thus, OC EC was expected to increase with the enhancement of secondary aerosol production. Here, we used the relative abundance of secondary inorganic ions (sulfate, nitrate, and ammonium, i.e., SNA) compared to carbon monoxide (a typical primary species), i.e., the SNA CO ratio, as an indicator of the significance of secondary aerosols. A benefit of using SNA CO was that it was independent of EC measurement. The OC EC ratio corresponding to ECuntreated (i.e., (OC EC)∗) was determined directly by the thermal–optical results from the untreated samples. For ECextracted, the corresponding OC EC (i.e., (OC EC)#) was calculated as , where TCuntreated indicates the total carbon concentration measured before the extraction. As shown in Fig. 6 for the wintertime HV samples, (OC EC)∗ exhibited reasonable accordance with SNA CO (r=0.72), but (OC EC)# did not (r=0.02). The clear association between (OC EC)∗ and SNA CO, which was also supported by the results from LV (r=0.66; Fig. S3), provided additional evidence of the robustness of ECuntreated as determined by IMPROVE-A.
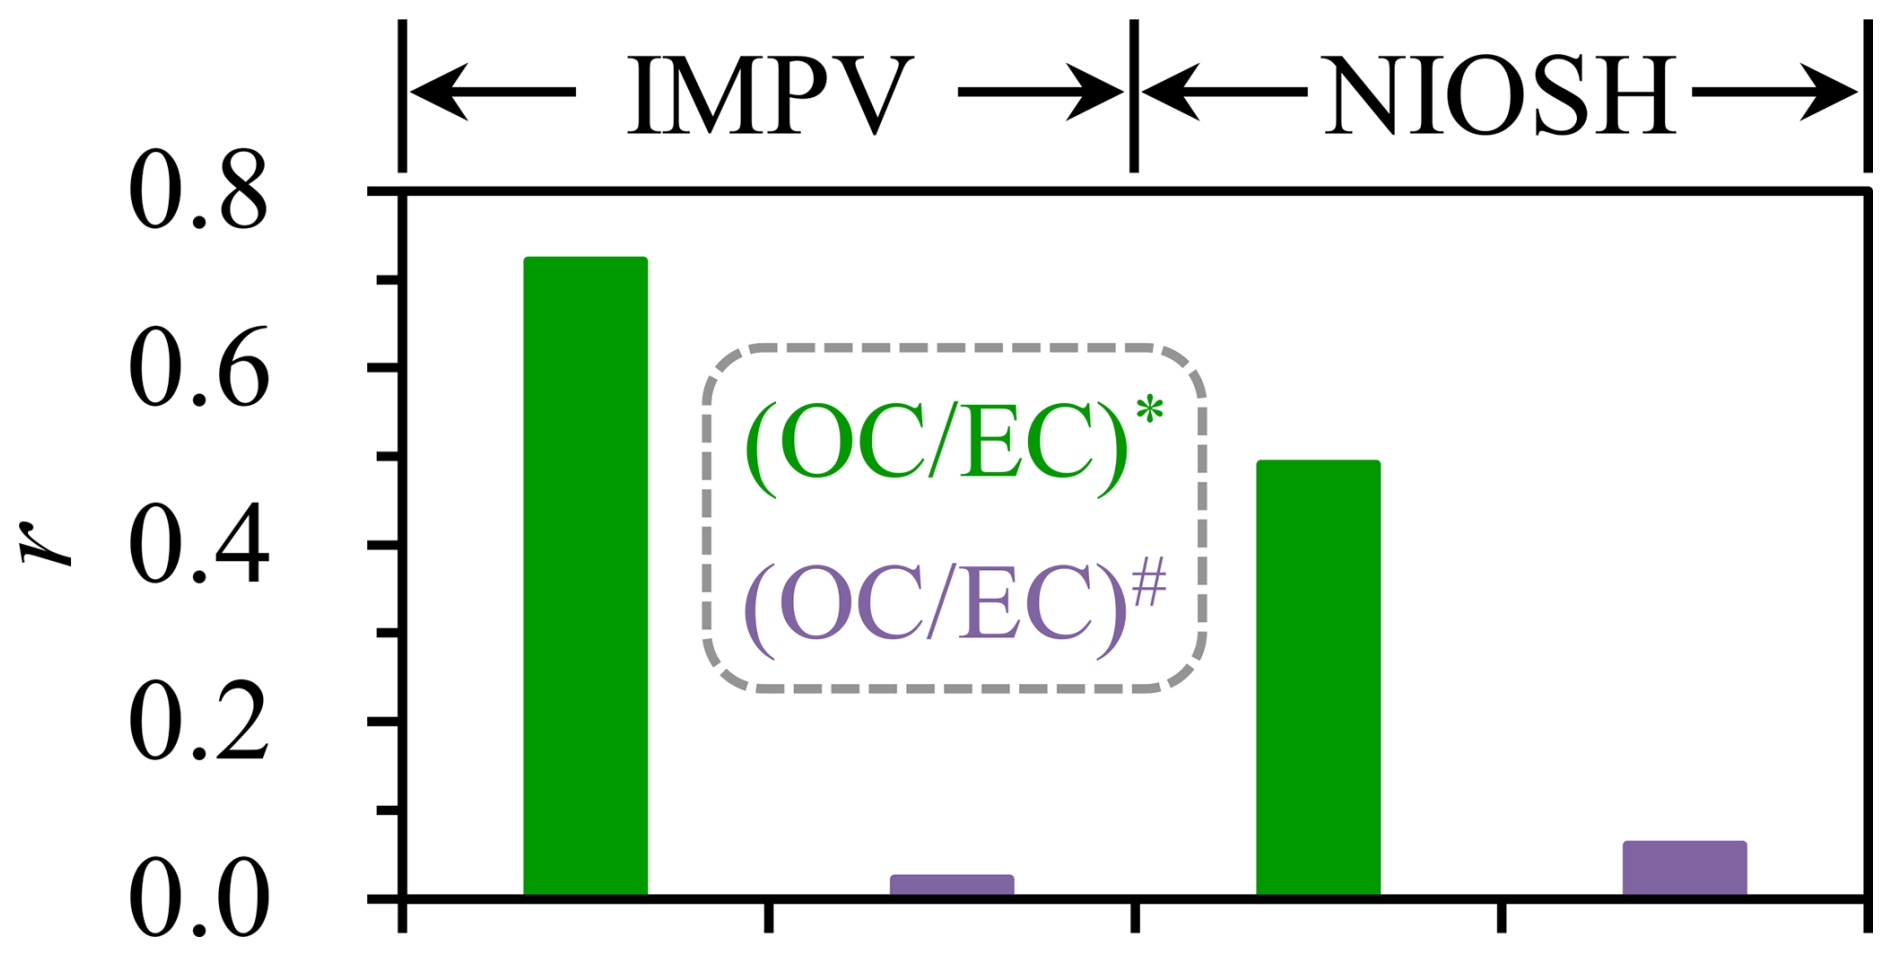
Figure 6Comparison of r values derived from the linear regressions of various OC EC estimations against SNA CO based on the wintertime HV samples. IMPV indicates the IMPROVE-A temperature protocol. A total of four sets of OC EC ratios were determined using different protocols and pre-treatment approaches. The OC EC ratio measured by the untreated samples using IMPROVE-A, i.e., the IMPV-based (OC EC)∗, exhibited the strongest association with SNA CO.
Compared to IMPROVE-A, NIOSH led to weaker correlations between (OC EC)∗ and SNA CO, as indicated by the smaller r values determined (0.49 vs. 0.72 for HV and 0.18 vs. 0.66 for LV; Figs. 6 and S3). In addition, the NIOSH-based (OC EC)# did not exhibit an apparent dependence on SNA CO either (r=0.06 and 0.34 for HV and LV, respectively). Thus, Figs. 6 and S3 clearly reflected the limitations of NIOSH-based OC EC and, thus, NIOSH-based EC, further highlighting the benefit of using ECuntreated as determined by IMPROVE-A.
3.2 Evaluation of EC results from the spring campaign
In this section, we evaluated the EC results from April, also starting with the HV samples analyzed by IMPROVE-A. To highlight the role of agricultural fires, we first separated the April samples into two groups (namely the fire-impacted and typical samples), which were characterized by considerable and insignificant impacts of open burning, respectively. As described in the Supplement, the criteria for fire-impacted samples could be simplified as a levoglucosan-to-TCuntreated ratio (fLG, on the basis of carbon mass) of above 1.8 % based on a synthesis of fLG, the ratio of levoglucosan to water-soluble potassium (LG K+), and satellite-based fire hotspots (Fig. S4). Before filter extraction, the dependence of ATN on ECs could be approximated by a linear function (with a slope of 33.4 ± 1.5 m2 (g C)−1 and a close-to-zero intercept; r=0.97) for all of the typical samples and the majority of the fire-impacted ones (Fig. 7a), leading to an ECmax of 8 µg C cm−2. For three of the fire-impacted samples, ECs exceeded this threshold value, and the ATN vs. ECs relationships were found to deviate significantly from the regression line, especially for the two samples with ECs above 10 µg C cm−2 (as highlighted in Fig. 7a).
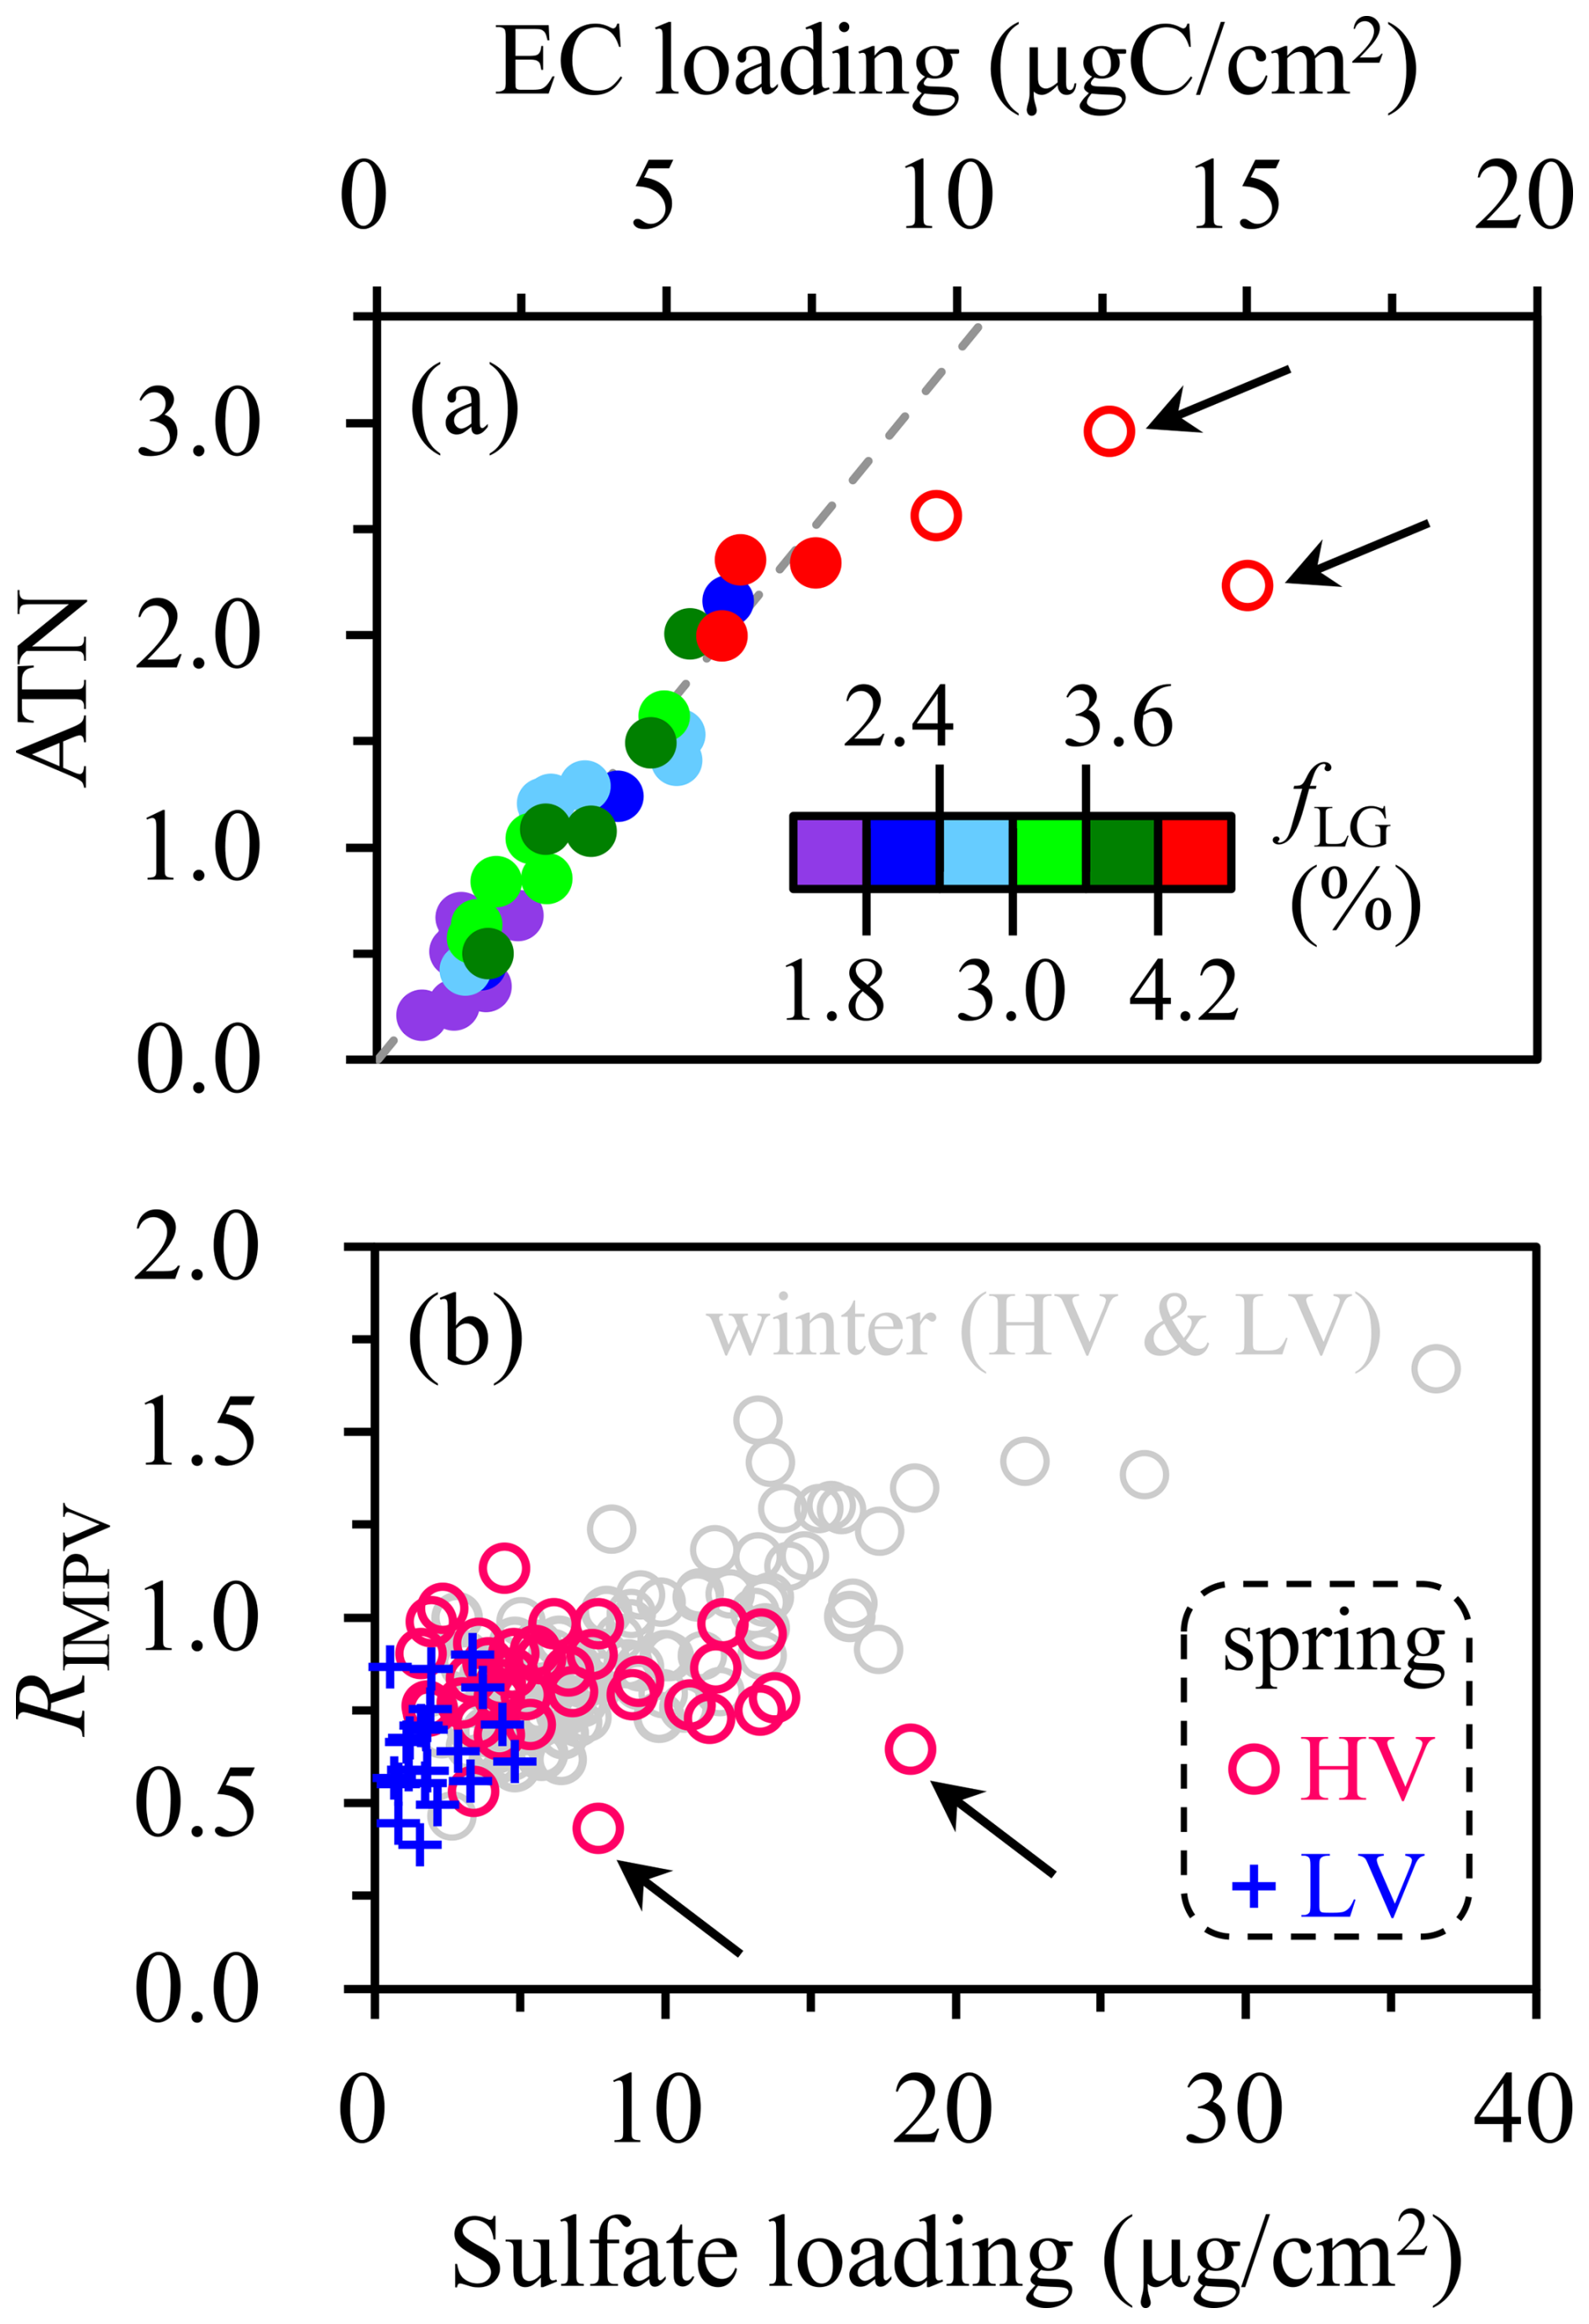
Figure 7(a) Dependence of ATN on EC loading (ECs) for the untreated HV samples collected in spring, color-coded by fLG levels. Samples with linear and non-linear ATN vs. ECs dependence are shown by the solid and open circles, respectively. fLG values higher than 1.8 % indicated significant impacts of agricultural fires. (b) Dependence of RIMPV, i.e., the ECextracted-to-ECuntreated ratio, on sulfate loading in spring. Results from winter were also shown for comparison. In general, a consistent relationship was observed between RIMPV and sulfate loading for the samples, including both HV and LV, from different seasons. Two HV samples collected in spring were identified as outliers, as highlighted by the arrows. The outlier samplers were also highlighted in (a), corresponding to the two points showing significant non-linear dependences of ATN on EC loading. All the EC results involved were measured by IMPROVE-A.
To elucidate factors responsible for the observed non-linear dependence of ATN on ECs, we compared EC results from the untreated and extracted filters. Given the relatively low sulfate loadings observed throughout April (Fig. 7b), it was with expectation that EC generally decreased after the extraction. After excluding the results from two outliers (Fig. 7b), the ECextracted-to-ECuntreated ratios averaged 0.84 ± 0.11, comparable to results from the reference group in winter. The two outlier samples, which were collected on the nights of 10 and 20 April 2021, showed ECextracted-to-ECuntreated ratios of as low as 0.64 and 0.43, respectively. Such significant extraction-induced decreases in EC could hardly be explained by the interference from sulfate in thermal–optical analysis of the extracted filters (Fig. 7b). Instead, the two outlier samples were found to show several noteworthy features: (i) they corresponded to the two samples showing significant non-linear ATN vs. ECs dependences before the extraction (Fig. 7a); (ii) their fLG levels were at the higher end of the fire-impacted samples (with levoglucosan concentrations exceeding 7 µg m−3), indicating extremely strong impacts of open burning (Fig. 7a); (iii) their LG K+ ratios (>1.7) were also at the higher end of the fire-impacted samples, which were characteristic of the emissions from smoldering combustion (Gao et al., 2003; Sullivan et al., 2019); and (iv) their ATN clearly decreased after the extraction by ∼1.0, which was about 1 order of magnitude higher than results from the typical samples (∼0.1). Thus, it was inferred that ECuntreated of the outlier samples likely involved some light-absorbing organic compounds (i.e., BrC) emitted by agricultural fires with relatively low combustion efficiencies, and the absorption capacities of these organics were strong enough to make them a considerable contributor to ATN measured at 632 nm. Indeed, the BrC-related overestimation of elemental carbon mass was expected to be reduced considerably after the extraction. However, such overestimation seemed to be significant only for the two outlier samples (Fig. 7a). In addition, recalling the lower-than-1 ECextracted-to-ECuntreated ratios observed for the other April samples (i.e., the sulfate-related artifact raised for the extracted filters), the methanol extraction actually brought little benefit for the determination of EC by IMPROVE-A.
Unlike HV samples, all of the LV samples showed a consistent relationship between ATN and ECs before the extraction (Fig. S5). It appeared to be the case that the strongly absorbing organics that could interfere with EC measurement were mainly concentrated in some agricultural-fire smoke emitted at night (as indicated by the two outlier HV samples), whereas their influence on EC determination was considerably weakened for the 24 h integrated LV samples. Thus, the linear ATN vs. ECs dependence, which was valid for all of the untreated LV samples analyzed by IMPROVE-A, provided little evidence for the necessity of methanol extraction.
We also investigated the OC EC vs. fLG relationship for the HV samples collected in April. Open burning was considered to be favorable for the increase in ambient OC EC since the aerosols emitted were frequently found to be almost entirely organic (Liu et al., 2016; Garofalo et al., 2019; Gkatzelis et al., 2024). Thus, it was not surprising to observe a moderate correlation between (OC EC)∗ and fLG (r=0.59; Fig. 8), i.e., an increasing trend in (OC EC)∗ with stronger impacts of agricultural fires. In addition, (OC EC)∗ also depended moderately on SNA CO (r=0.49; Fig. 8). This was with expectation as well, given the observational evidence on the concurrent enhancements of secondary inorganic and organic aerosols (e.g., Liu et al., 2020; Cheng et al., 2022). Replacing (OC EC)∗ with (OC EC)# did not effectively strengthen the association of OC EC with fLG or SNA CO (Fig. 8). This conclusion also held for the LV samples (Fig. 8). In summary, we did not observe additional evidence supporting the incorporation of methanol extraction with IMPROVE-A.
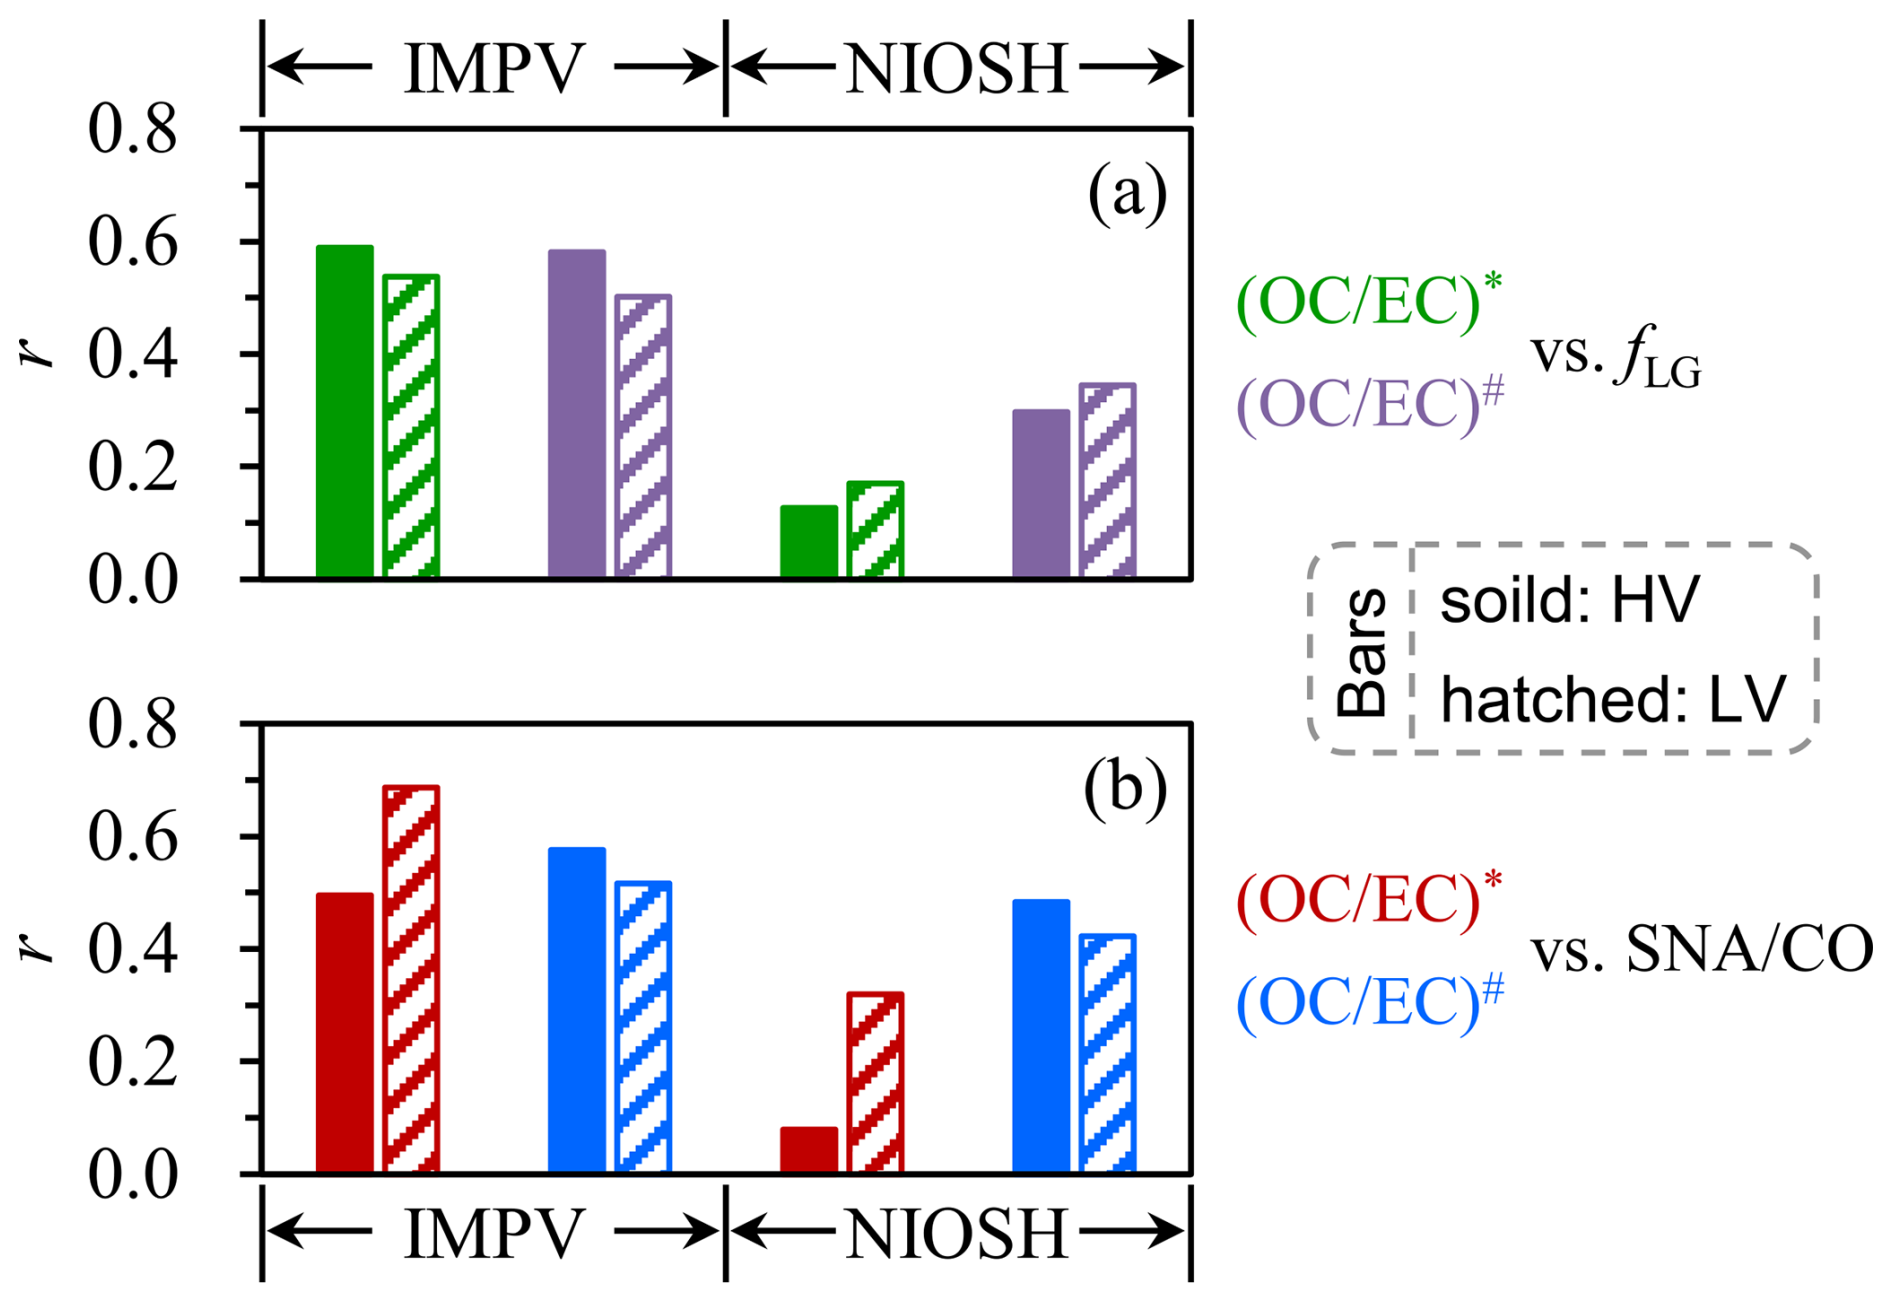
Figure 8Comparisons of r values derived from the linear regressions of various OC EC estimations against (a) fLG and (b) SNA CO based on the spring samples. IMPV indicates the IMPROVE-A temperature protocol. Results from the HV and LV filters are shown by solid and hatched bars, respectively. For both HV and LV samples, a total of four sets of OC EC ratios were determined using different protocols and pre-treatment approaches. In general, OC EC ratios measured by the untreated samples using IMPROVE-A, i.e., the IMPV-based (OC EC)∗, exhibited reasonable associations with aerosol sources. Using other OC EC estimations failed to or did not effectively enhance the associations.
Compared to (OC EC)∗ determined by IMPROVE-A, the NIOSH-based (OC EC)∗ and (OC EC)# were less indicative of aerosol sources which could be reflected by fLG and SNA CO. This was the case for both the HV and LV samples (Fig. 8). Based on the discussions above, ECuntreated determined by IMPROVE-A (EC∗) was also recommended for the conditions with a prevalence of agricultural fires (i.e., April), in line with the conclusion derived for winter. In addition, it should be kept in mind that EC∗ could overestimate elemental carbon mass due to the interference from strongly absorbing BrC. However, such overestimation was generally uncommon, i.e., was significant only for some nighttime samples under extremely strong influences of low-efficiency agricultural fires (as indicated by the two HV samples identified as outliers; Fig. 7).
3.3 Comparison of measurement results from the HV and LV samplers
As mentioned in the Methods section, each LV sample corresponded to a pair of daytime and nighttime HV samples, indicating that measurement results from the HV samples could be averaged and then compared to those determined by the LV sampler. Here, the inter-sampler comparison was performed for several components that are of broad interest in field observations, including elemental and organic carbon, secondary inorganic ions (sulfate, nitrate, and ammonium), other water-soluble ions (potassium and chloride), an organic tracer for biomass burning (levoglucosan), BrC mass concentration, and BrC light absorption coefficient. Based on the evaluation results in previous sections, EC∗ and the corresponding OC, i.e., OC∗ (measured before the extraction using IMPROVE-A), were selected for the comparison. In addition, following Cheng et al. (2024), BrC mass was calculated as the difference in TC between the untreated and extracted filters, while BrC absorption was investigated at a wavelength of 365 nm, i.e., (babs)365.
As shown in Fig. 9, the two samplers generally led to comparable measurement results for all of the species investigated. For example, the LV-to-HV ratios typically fell within the range of 0.8–1.2; i.e., results from the two samples generally agreed within ±20 %. However, it was noticed that K+ was the only component with the majority of the LV results being lower than HV results. In addition, the LV-to-HV ratio of K+ was found to depend positively on the ratio of PM2.5 to PM10 (Fig. 10a). The PM2.5-to-PM10 ratio was strongly associated with the influence of dust, typically exhibiting a decreasing trend as the impact of dust became stronger (Putaud et al., 2010). Thus, the events with decreased LV-to-HV ratios of K+ (all of which occurred in spring) presumably coincided with dust episodes when relatively large particles were expected to be a non-negligible contributor to K+ (Wang et al., 2014a). Thus, a likely cause for the dependence shown in Fig. 10a was that the impactor performances (e.g., the size cut curves) were not exactly the same for the two samplers, such that some relatively large particles, if present, could be more effectively collected on the HV filters compared to LV samples.
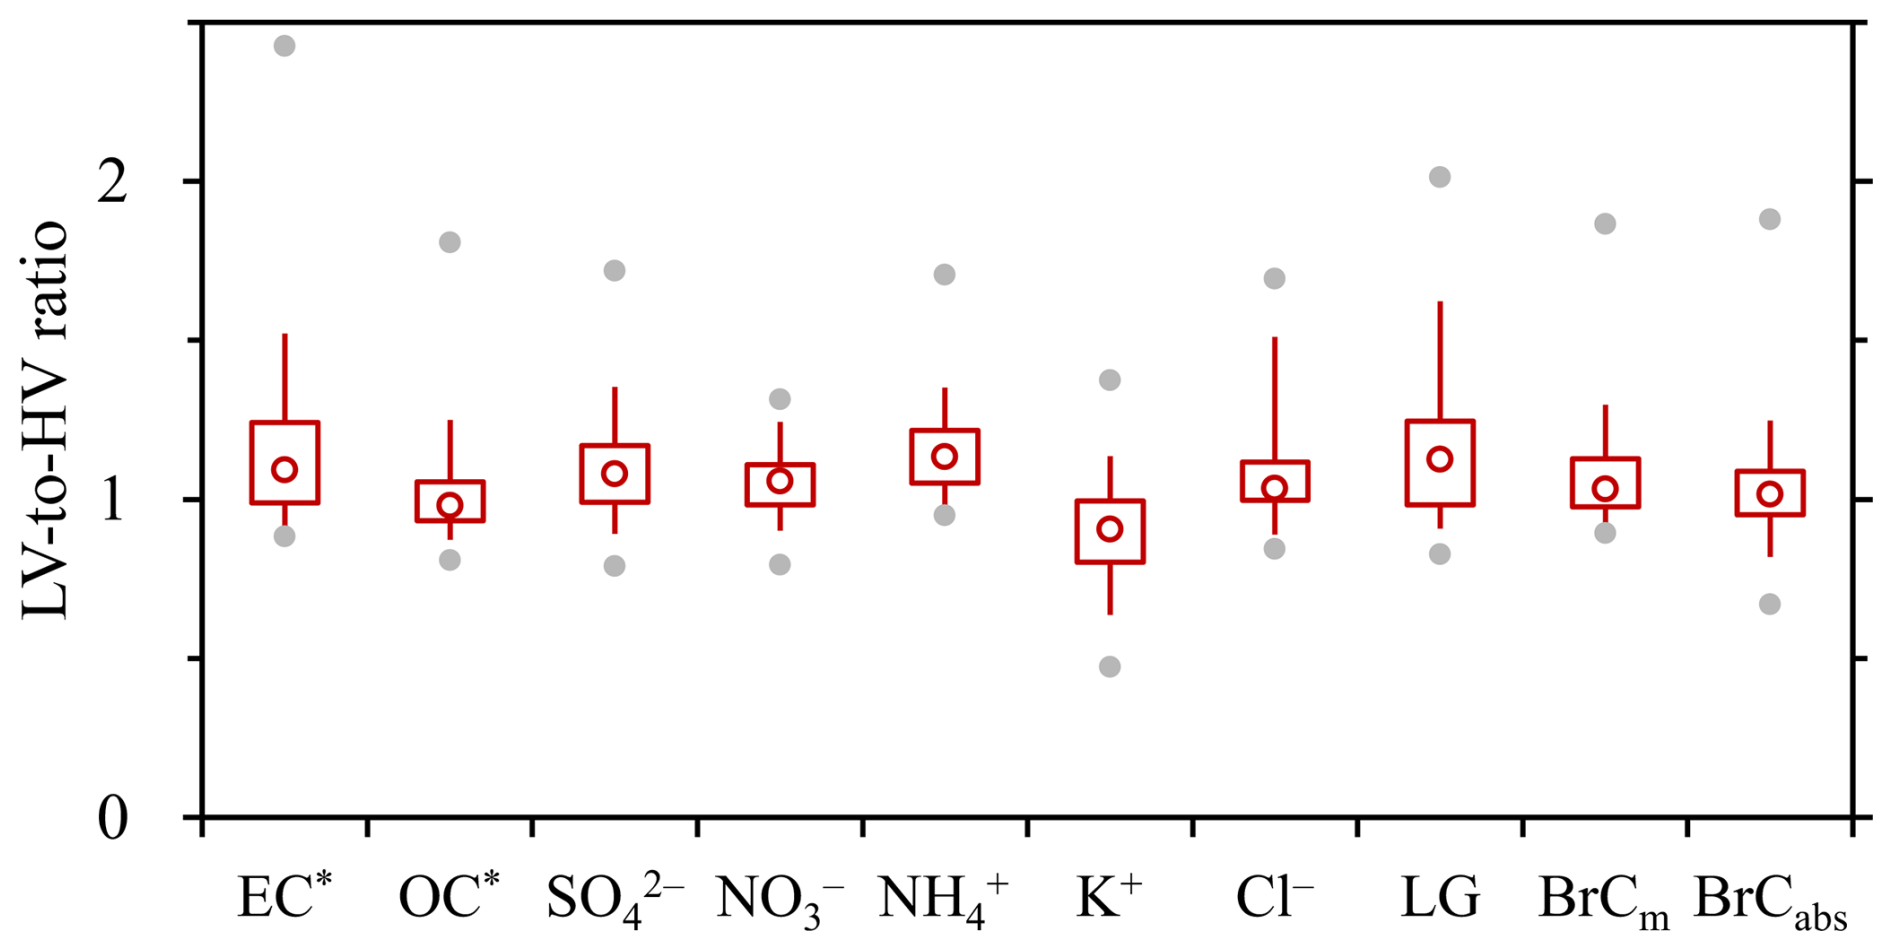
Figure 9The LV-to-HV ratios determined for various species. BrCm and BrCabs indicate the mass concentration and (babs)365 of brown carbon, respectively.
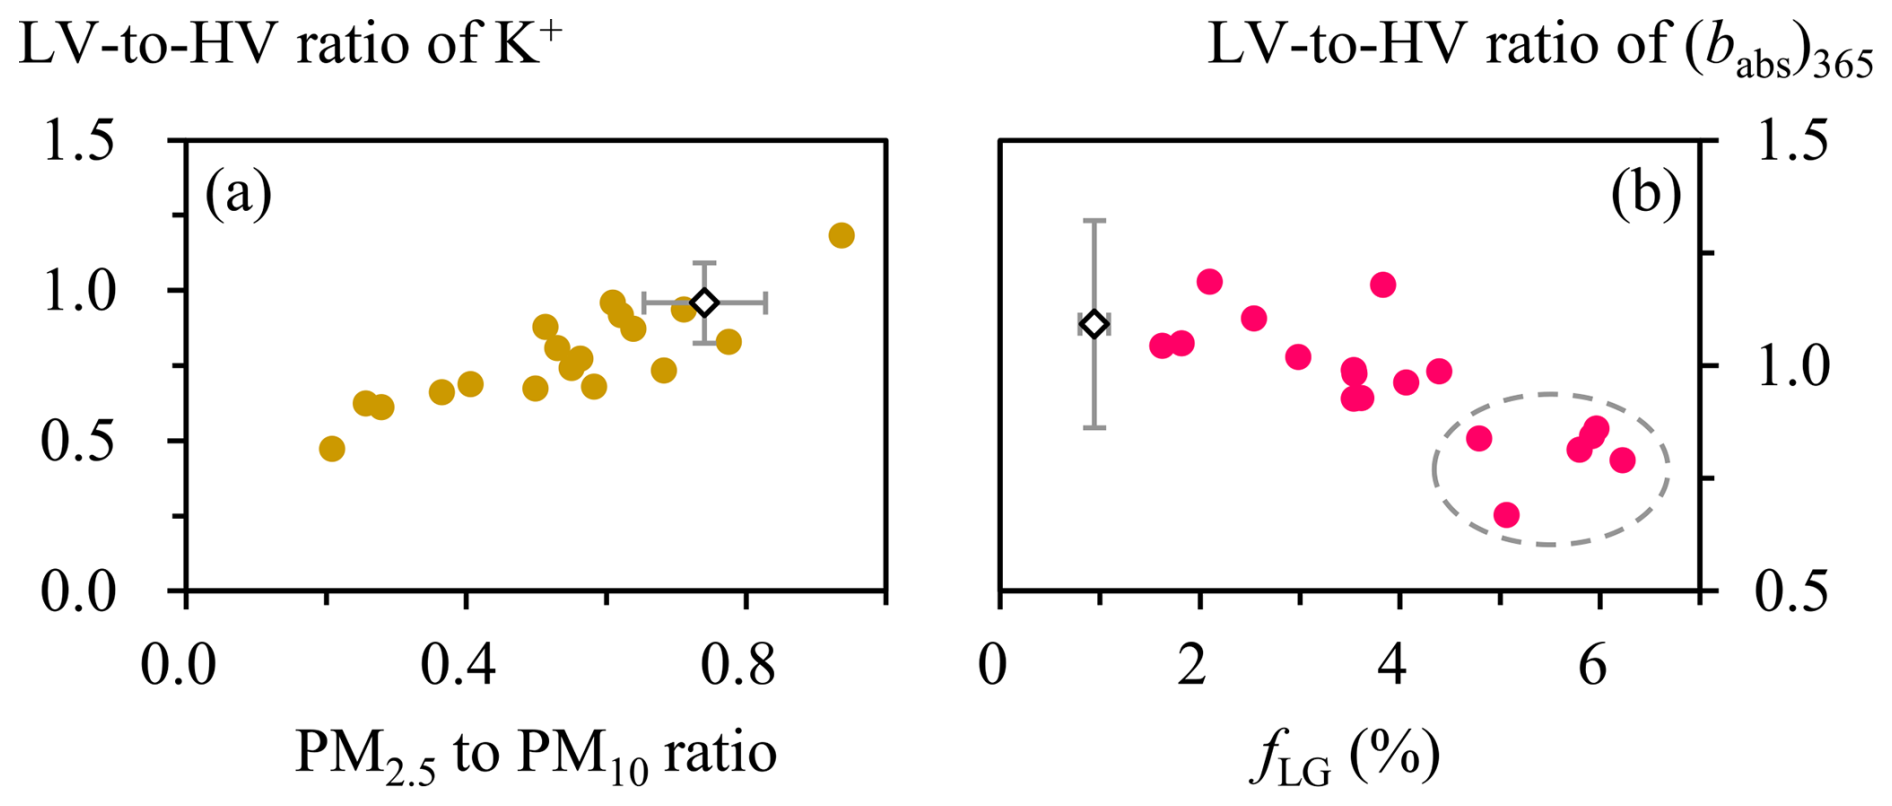
Figure 10(a) Dependence of the LV-to-HV ratio of K+ on the PM2.5-to-PM10 ratio. (b) Dependence of the LV-to-HV ratio of (babs)365 on fLG. Results from spring are shown on a sample-by-sample basis, as indicated by the solid circles. For winter, only the average results are shown, as indicated by the diamonds. In (b), the events with substantially lower LV-to-HV ratios of (babs)365 are highlighted by the dashed oval.
In addition, it was noticed that, although the two samplers led to generally comparable (babs)365 results, the corresponding LV-to-HV ratios decreased substantially (e.g., down to 0.67) for the episodes with extremely strong impacts of agricultural fires (Fig. 10b). A possible explanation was that some fire-emitted chromophores were associated with relatively large particles that would be more effectively collected on the HV filters. Although these chromophores represented an important contributor to BrC absorption, their influence on BrC mass was likely to be insignificant, as indicated by the low influence of agricultural fires on the LV-to-HV ratio of BrC mass (Fig. S6).
Finally, it should be noted that, for the species except K+ and (babs)365, LV-to-HV ratios still showed different patterns of distribution (Fig. 9). Analytical uncertainties should be partially responsible, e.g., as indicated by the more significant variations in the LV-to-HV ratios of EC∗ compared to those of OC∗. Another likely cause was that the sampling duration of a given LV sample (24 h) actually did not equal that of the corresponding HV (15 h), which would result in different LV-to-HV ratios for the species with different diurnal cycles. In summary, many factors could be responsible for the inter-sampler discrepancies shown in Fig. 9. Typically, the overall effects of these factors were higher LV-based concentrations compared to HV-based concentrations, with median LV-to-HV ratios being concentrated in a relatively narrow range of 1–1.15. However, this comparability may not always hold. A possible explanation was that the impactor performances were more or less different between the two samplers; thus, for specific components such as K+ and some fire-emitted chromophores, this difference could exert a significant influence on their sampling.
For the first time, EC results were compared among different sampling and analytical approaches based on field observations in Northeast China. Two samplers with flow rates of 1.13 m3 min−1 and 5 L min−1 were operated together during two distinct seasons, whereas thermal–optical analysis was performed by applying different protocols to both the untreated and extracted filters. Results from different seasons jointly suggested that ECextracted measured by IMPROVE-A (i.e., IMPV) was biased by complex artifacts associated with sulfate. The IMPV-based ECextracted tended to underestimate elemental carbon mass when sulfate was less abundant, whereas overestimations were evident at sufficiently high loadings of sulfate. The turning point for the artifact shifting from an underestimation to overestimation occurred in the sulfate-loading range of 10–15 µg cm−2. Such high sulfate loadings were rarely encountered by the LV samples, and, thus, the corresponding IMPV-based EC typically decreased after the extraction (by ∼20 %). For the HV samples, their sulfate covered a wide range of ∼2–35 µg cm−2 during winter, and, in this case, the extraction-induced changes in EC usually varied between −50 % and +50 % for the IMPV-based results. In addition to the complex sulfate-related artifacts, another problem identified for the IMPV-based ECextracted was that the corresponding OC EC ratio sometimes exhibited no association with the SNA CO ratio, which was used as an indicator for the significance of secondary aerosol production. The NIOSH-based OC EC ratios, determined by either ECextracted or ECuntreated, had the same problem. Thus, the IMPV-based ECuntreated (EC∗) was recommended as the corresponding OC EC could always be reasonably linked to aerosol sources, e.g., secondary aerosol formation in winter and agricultural-fire impacts (as reflected by fLG) in spring.
Inter-sampler comparisons were performed for various species that are of broad interest in field observations, including EC∗. Although the flow rates differed by more than 2 orders of magnitude between the two samplers, the LV and HV samplers generally led to comparable measurement results for the majority of the species, with the median LV-to-HV ratios falling within a relatively narrow range of 1–1.15.
This study also raised two points that merit attention. The first is that the IMPV-based ECuntreated, which was suggested for investigations into aerosol sources, might overestimate elemental carbon mass under extremely strong impacts of open burning. This problem was attributed to strongly absorbing BrC emitted by agricultural fires with relatively low combustion efficiencies. Although uncommon for the ambient samples in Harbin (a megacity located in a main agricultural region in China), this problem could introduce substantial uncertainties into the emission factors and, thus, inventories of biomass burning. We suggested that a key step to refine the EC measurement results was to concurrently minimize the inferences from strongly absorbing BrC and scattering components. Methanol extraction followed by water extraction of filter samples was expected to be a practical approach, which was worthy of further evaluations.
The second point was that some specific components should be interpreted with caution, even when comparing their measurement results from samplers with the same nominal cut point. Our observational results indicated that some relatively large particles, if present, could be more effectively collected by the high-volume PM2.5 sampler compared to the low-volume one. This problem was attributed to the fact that the inlet performances (e.g., the size cut curve) could not be exactly the same between the HV and LV PM2.5 samplers. Among the various species involved in this study, this problem affected the measurements of K+, as well as of some fire-emitted chromophores in the fine mode. Thus, we suggested that the K+ results derived from different PM2.5 samplers may not be directly comparable. In addition, although we could not quantitatively determine the dust contribution to K+ measured by the high-volume PM2.5 sampler, K+ should be used with caution as a biomass burning tracer for source apportionment studies relying on the HV-based observations.
By evaluating the observational results from different measurement approaches for species commonly used in source apportionment, this study contributed to the understanding of aerosol sources in Northeast China and, thus, the development of efficient haze pollution control strategies. Using the recommended OC and EC results together with levoglucosan (rather than K+) as the biomass burning tracer, positive matrix factorization (PMF) analysis was performed for the 2020–2021 heating season based on a total of ∼200 LV samples (including those involved in this study; Cheng et al., 2024). The concentrations of the primary OC resolved were found to be in reasonable agreement with those predicted by an air quality model when agricultural fires were absent. This consistency laid the foundation for the control policy focusing on primary aerosols. Cheng et al. (2024) also found that the model failed to reproduce the observed SOA levels, with large underestimations (by ∼80 %). Thus the observation-based source apportionment results are currently irreplaceable for evaluating the benefits of reducing SOA precursors. In summary, this study highlighted the importance of inter-method comparison for aerosol components (e.g., EC and K+) that are of broad interest in field observations. Such efforts are expected to be more urgently needed for Northeast China since this distinct region was recently targeted by the latest national-level pollution control policy in China (State Council, 2021) and, thus, is facing stronger demand for reducing PM2.5.
Data are available from the corresponding author upon request (jiumengliu@hit.edu.cn).
The supplement related to this article is available online at https://doi.org/10.5194/acp-25-8493-2025-supplement.
YC and JML designed the study and prepared the paper, with inputs from all of the co-authors. YJZ, ZQZ, and XBC carried out the experiments.
The contact author has declared that none of the authors has any competing interests.
Publisher's note: Copernicus Publications remains neutral with regard to jurisdictional claims made in the text, published maps, institutional affiliations, or any other geographical representation in this paper. While Copernicus Publications makes every effort to include appropriate place names, the final responsibility lies with the authors.
The authors thank Zhen-yu Du of the National Research Center for Environmental Analysis and Measurement and Lin-lin Liang of the Chinese Academy of Meteorological Sciences for their help in the sample analysis.
This research has been supported by the National Natural Science Foundation of China (grant no. 42222706), the Natural Science Foundation of Heilongjiang Province (grant no.YQ2024D011), the State Key Laboratory of Urban Water Resource and Environment (grant no.2023DX10), and the Fundamental Research Funds for the Central Universities.
This paper was edited by Guangjie Zheng and reviewed by two anonymous referees.
Aakko-Saksa, P., Koponen, P., Aurela, M., Vesala, H., Piimäkorpi, P., Murtonen, T., Sippula, O., Koponen, H., Karjalainen, P., Kuittinen, N., Panteliadis, P., Rönkkö, T., and Timonen, H.: Considerations in analysing elemental carbon from marine engine exhaust using residual, distillate and biofuels, J. Aerosol Sci., 126, 191–204, 2018.
Andela, N., Morton, D. C., Schroeder, W., Chen, Y., Brando, P. M., and Randerson, J. T.: Tracking and classifying Amazon fire events in near real time, Sci. Adv., 8, eabd2713, https://doi.org/10.1126/sciadv.abd2713, 2022.
Andreae, M. O. and Gelencsér, A.: Black carbon or brown carbon? The nature of light-absorbing carbonaceous aerosols, Atmos. Chem. Phys., 6, 3131–3148, https://doi.org/10.5194/acp-6-3131-2006, 2006.
Buffaloe, G. M., Lack, D. A., Williams, E. J., Coffman, D., Hayden, K. L., Lerner, B. M., Li, S.-M., Nuaaman, I., Massoli, P., Onasch, T. B., Quinn, P. K., and Cappa, C. D.: Black carbon emissions from in-use ships: a California regional assessment, Atmos. Chem. Phys., 14, 1881–1896, https://doi.org/10.5194/acp-14-1881-2014, 2014.
Cavalli, F., Viana, M., Yttri, K. E., Genberg, J., and Putaud, J.-P.: Toward a standardised thermal-optical protocol for measuring atmospheric organic and elemental carbon: the EUSAAR protocol, Atmos. Meas. Tech., 3, 79–89, https://doi.org/10.5194/amt-3-79-2010, 2010.
Chakrabarty, R. K., Shetty, N. J., Thind, A. S., Beeler, P., Sumlin, B. J., Zhang, C. C., Liu, P., Idrobo, J. C., Adachi, K., Wagner, N. L., Schwarz, J. P., Ahern, A., Sedlacek, A. J., Lambe, A., Daube, C., Lyu, M., Liu, C., Herndon, S., Onasch, T. B., and Mishra, R.: Shortwave absorption by wildfire smoke dominated by dark brown carbon, Nat. Geosci., 16, 683–688, 2023.
Chang, X., Zhao, B., Zheng, H. T., Wang, S. X., Cai, S. Y., Guo, F. Q., Gui, P., Huang, G. H., Wu, D., Han, L. C., Xing, J., Man, H. Y., Hu, R. L., Liang, C. R., Xu, Q. C., Qiu, X. H., Ding, D., Liu, K. Y., Han, R., Robinson, A. L., and Donahue, N. M.: Full-volatility emission framework corrects missing and underestimated secondary organic aerosol sources, One Earth, 5, 403–412, 2022.
Chen, P. F., Kang, S. C., Tripathee, L., Ram, K., Rupakheti, M., Panday, A. K., Zhang, Q., Guo, J. M., Wang, X. X., Pu, T., and Li, C. L.: Light absorption properties of elemental carbon (EC) and water-soluble brown carbon (WS-BrC) in the Kathmandu Valley, Nepal: a 5 year study, Environ. Pollut., 261, 114239, https://doi.org/10.1016/j.envpol.2020.114239, 2020.
Cheng, J., Tong, D., Zhang, Q., Liu, Y., Lei, Y., Yan, G., Yan, L., Yu, S., Cui, R. Y., Clarke, L., Geng, G. N., Zheng, B., Zhang, X. Y., Davis, S. J., and He, K. B.: Pathways of China's PM2.5 air quality 2015–2060 in the context of carbon neutrality, Natl. Sci. Rev., 8, nwab078, https://doi.org/10.1093/nsr/nwab078, 2021.
Cheng, Y., Cao, X. B., Yu, Q. Q., Liu, J. M., Ma, W. L., Qi, H., Zhang, Q., and He, K. B.: Synergy of multiple drivers leading to severe winter haze pollution in a megacity in Northeast China, Atmos. Res., 270, 106075, https://doi.org/10.1016/j.atmosres.2022.106075, 2022.
Cheng, Y., Cao, X., Zhu, S., Zhang, Z., Liu, J., Zhang, H., Zhang, Q., and He, K.: Exploring the sources of light-absorbing carbonaceous aerosols by integrating observational and modeling results: insights from Northeast China, Atmos. Chem. Phys., 24, 9869–9883, https://doi.org/10.5194/acp-24-9869-2024, 2024.
Chiappini, L., Verlhac, S., Aujay, R., Maenhaut, W., Putaud, J. P., Sciare, J., Jaffrezo, J. L., Liousse, C., Galy-Lacaux, C., Alleman, L. Y., Panteliadis, P., Leoz, E., and Favez, O.: Clues for a standardised thermal-optical protocol for the assessment of organic and elemental carbon within ambient air particulate matter, Atmos. Meas. Tech., 7, 1649–1661, https://doi.org/10.5194/amt-7-1649-2014, 2014.
Collaud Coen, M., Weingartner, E., Apituley, A., Ceburnis, D., Fierz-Schmidhauser, R., Flentje, H., Henzing, J. S., Jennings, S. G., Moerman, M., Petzold, A., Schmid, O., and Baltensperger, U.: Minimizing light absorption measurement artifacts of the Aethalometer: evaluation of five correction algorithms, Atmos. Meas. Tech., 3, 457–474, https://doi.org/10.5194/amt-3-457-2010, 2010.
Costa, V., Bacco, D., Castellazzi, S., Ricciardelli, I., Vecchietti, R., Zigola, C., and Pietrogrande, M. C.: Characteristics of carbonaceous aerosols in Emilia-Romagna (Northern Italy) based on two fall/winter field campaigns, Atmos. Res., 167, 100–107, 2016.
Dao, X., Lin, Y. C., Cao, F., Di, S. Y., Hong, Y. H., Xing, G. H., Li, J. J., Fu, P. Q., and Zhang, Y. L.: Introduction to the national aerosol chemical composition monitoring network of China: objectives, current status, and outlook, B. Am. Meteorol. Soc., 100, ES337–ES351, 2019.
Eckhardt, S., Pisso, I., Evangeliou, N., Zwaaftink, C. G., Plach, A., McConnell, J. R., Sigl, M., Ruppel, M., Zdanowicz, C., Lim, S., Chellman, N., Opel, T., Meyer, H., Steffensen, J. P., Schwikowski, M., and Stohl, A.: Revised historical Northern Hemisphere black carbon emissions based on inverse modeling of ice core records, Nat. Commun., 14, 271, https://doi.org/10.1038/s41467-022-35660-0, 2023.
Fuzzi, S., Baltensperger, U., Carslaw, K., Decesari, S., Denier van der Gon, H., Facchini, M. C., Fowler, D., Koren, I., Langford, B., Lohmann, U., Nemitz, E., Pandis, S., Riipinen, I., Rudich, Y., Schaap, M., Slowik, J. G., Spracklen, D. V., Vignati, E., Wild, M., Williams, M., and Gilardoni, S.: Particulate matter, air quality and climate: lessons learned and future needs, Atmos. Chem. Phys., 15, 8217–8299, https://doi.org/10.5194/acp-15-8217-2015, 2015.
Gao, C. Y., Heald, C. L., Katich, J. M., Luo, G., and Yu, F. Q.: Remote aerosol simulated during the Atmospheric Tomography (ATom) campaign and implications for aerosol lifetime, J. Geophys. Res.-Atmos., 127, e2022JD036524, https://doi.org/10.1029/2022JD036524, 2022.
Gao, S., Hegg, D. A., Hobbs, P. V., Kirchstetter, T. W., Magi, B. I., and Sadilek, M.: Water-soluble organic components in aerosols associated with savanna fires in southern Africa: identification, evolution, and distribution, J. Geophys. Res., 108, 8491, https://doi.org/10.1029/2002JD002324, 2003.
Garofalo, L. A., Pothier, M. A., Levin, E. J. T., Campos, T., Kreidenweis, S. M., and Farmer, D. K.: Emission and evolution of submicron organic aerosol in smoke from wildfires in the Western United States, ACS Earth Space Chem., 3, 1237–1247, 2019.
Giannoni, M., Calzolai, G., Chiari,M., Cincinelli, A., Lucarelli, F., Martellini, T., and Nava, S.: A comparison between thermal-optical transmittance elemental carbon measured by different protocols in PM2.5 samples, Sci. Total Environ., 571, 195–205, 2016.
Gkatzelis, G. I., Coggon, M. M., Stockwell, C. E., Hornbrook, R. S., Allen, H., Apel, E. C., Bela, M. M., Blake, D. R., Bourgeois, I., Brown, S. S., Campuzano-Jost, P., St. Clair, J. M., Crawford, J. H., Crounse, J. D., Day, D. A., DiGangi, J. P., Diskin, G. S., Fried, A., Gilman, J. B., Guo, H., Hair, J. W., Halliday, H. S., Hanisco, T. F., Hannun, R., Hills, A., Huey, L. G., Jimenez, J. L., Katich, J. M., Lamplugh, A., Lee, Y. R., Liao, J., Lindaas, J., McKeen, S. A., Mikoviny, T., Nault, B. A., Neuman, J. A., Nowak, J. B., Pagonis, D., Peischl, J., Perring, A. E., Piel, F., Rickly, P. S., Robinson, M. A., Rollins, A. W., Ryerson, T. B., Schueneman, M. K., Schwantes, R. H., Schwarz, J. P., Sekimoto, K., Selimovic, V., Shingler, T., Tanner, D. J., Tomsche, L., Vasquez, K. T., Veres, P. R., Washenfelder, R., Weibring, P., Wennberg, P. O., Wisthaler, A., Wolfe, G. M., Womack, C. C., Xu, L., Ball, K., Yokelson, R. J., and Warneke, C.: Parameterizations of US wildfire and prescribed fire emission ratios and emission factors based on FIREX-AQ aircraft measurements, Atmos. Chem. Phys., 24, 929–956, https://doi.org/10.5194/acp-24-929-2024, 2024.
Hand, J. L., Prenni, A. J., Raffuse, S. M., Hyslop, N. P., Malm, W. C., and Schichtel, B. A.: Spatial and seasonal variability of remote and urban speciated fine particulate matter in the United States, J. Geophys. Res.-Atmos., 129, e2024JD042579, https://doi.org/10.1029/2024JD042579, 2024.
Hecobian, A., Zhang, X., Zheng, M., Frank, N., Edgerton, E. S., and Weber, R. J.: Water-Soluble Organic Aerosol material and the light-absorption characteristics of aqueous extracts measured over the Southeastern United States, Atmos. Chem. Phys., 10, 5965–5977, https://doi.org/10.5194/acp-10-5965-2010, 2010.
Hu, Z. F., Kang, S. C., Xu, J. Z., Zhang, C., Li, X. F., Yan, F. P., Zhang, Y. L., Chen, P. F., and Li, C. L.: Significant overestimation of black carbon concentration caused by high organic carbon in aerosols of the Tibetan Plateau, Atmos. Environ., 294, 119486, https://doi.org/10.1016/j.atmosenv.2022.119486, 2023.
Knox, A., Evans, G. J., Brook, J. R., Yao, X., Jeong, C. H., Godri, K. J., Sabaliauskas, K., and Slowik, J. G.: Mass absorption cross-section of ambient black carbon aerosol in relation to chemical age, Aerosol Sci. Tech., 43, 522–532, 2009.
Laborde, M., Schnaiter, M., Linke, C., Saathoff, H., Naumann, K.-H., Möhler, O., Berlenz, S., Wagner, U., Taylor, J. W., Liu, D., Flynn, M., Allan, J. D., Coe, H., Heimerl, K., Dahlkötter, F., Weinzierl, B., Wollny, A. G., Zanatta, M., Cozic, J., Laj, P., Hitzenberger, R., Schwarz, J. P., and Gysel, M.: Single Particle Soot Photometer intercomparison at the AIDA chamber, Atmos. Meas. Tech., 5, 3077–3097, https://doi.org/10.5194/amt-5-3077-2012, 2012.
Lack, D. A., Moosmüller, H., McMeeking, G. R., Chakrabarty, R. K., and Baumgardner, D.: Characterizing elemental, equivalent black, and refractory black carbon aerosol particles: a review of techniques, their limitations and uncertainties, Anal. Bioanal. Chem., 406, 99–122, 2014.
Lappi, M. K. and Ristimäki, J. M.: Evaluation of thermal optical analysis method of elemental carbon for marine fuel exhaust, J. Air Waste Manage., 67, 1298–1318, 2017.
Li, H. Y., Lamb, K. D., Schwarz, J. P., Selimovic, V., Yokelson, R. J., McMeeking, G. R., and May, A. A.: Inter-comparison of black carbon measurement methods for simulated open biomass burning emissions, Atmos. Environ., 206, 156–169, 2019.
Li, J., Carlson, B. E., Yung, Y. L., Lv, D. R., Hansen, J., Penner, J. E., Liao, H., Ramaswamy, V., Kahn, R. A., Zhang, P., Dubovik, O., Ding, A. J., Lacis, A. A., Zhang, L., and Dong, Y. M.: Scattering and absorbing aerosols in the climate system, Nat. Rev. Earth Environ., 3, 363–379, 2022.
Liu, J. M., Du, Z. Y., Liang, L. L., Yu, Q. Q., Shen, G. F., Ma, Y. L., Zheng, M., Cheng, Y., and He, K. B.: Uncertainties in thermal-optical measurements of black carbon: insights from source and ambient samples, Sci. Total Environ., 656, 239–249, 2019.
Liu, J. M., Wang, P. F., Zhang, H. L., Du, Z. Y., Zheng, B., Yu, Q. Q., Zheng, G. J., Ma, Y. L., Zheng, M., Cheng, Y., Zhang, Q., and He, K. B.: Integration of field observation and air quality modeling to characterize Beijing aerosol in different seasons, Chemosphere, 242, 125195, https://doi.org/10.1016/j.atmosenv.2022.119486, 2020.
Liu, S. G., Geng, G. N., Xiao, Q. Y., Zheng, Y. X., Liu, X. D., Cheng, J., and Zhang, Q.: Tracking daily concentrations of PM2.5 chemical composition in China since 2000, Environ. Sci. Technol., 56, 16517–16527, 2022.
Liu, X. X., Zhang, Y., Huey, L. G., Yokelson, R. J., Wang, Y., Jimenez, J. L., Campuzano-Jost, P., Beyersdorf, A. J., Blake, D. R., Choi, Y., St Clair, J. M., Crounse, J. D., Day, D. A., Diskin, G. S., Fried, A., Hall, S. R., Hanisco, T. F., King, L. E., Meinardi, S., Mikoviny, T., Palm, B. B., Peischl, J., Perring, A. E., Pollack, I. B., Ryerson, T. B., Sachse, G., Schwarz, J. P., Simpson, I. J., Tanner, D. J., Thornhill, K. L., Ullmann, K., Weber, R. J., Wennberg, P. O., Wisthaler, A., Wolfe, G. M., and Ziemba, L. D.: Agricultural fires in the southeastern U. S. during SEAC4RS: Emissions of trace gases and particles and evolution of ozone, reactive nitrogen, and organic aerosol, J. Geophys. Res.-Atmos., 121, 7383–7414, 2016.
Petzold, A., Schloesser, H., Sheridan, P. J., Arnott, W. P., Ogren, J. A., and Virkkula, A.: Evaluation of multiangle absorption photometry for measuring aerosol light absorption, Aerosol Sci. Tech., 39, 40–51, 2005.
Petzold, A., Ogren, J. A., Fiebig, M., Laj, P., Li, S.-M., Baltensperger, U., Holzer-Popp, T., Kinne, S., Pappalardo, G., Sugimoto, N., Wehrli, C., Wiedensohler, A., and Zhang, X.-Y.: Recommendations for reporting “black carbon” measurements, Atmos. Chem. Phys., 13, 8365–8379, https://doi.org/10.5194/acp-13-8365-2013, 2013.
Philip, S., Martin, R., van Donkelaar, A., Lo, J. W. H., Wang, Y. X., Chen, D., Zhang, L., Kasibhatla, P. S., Wang, S. W., Zhang, Q., Lu, Z., Streets, D. G., Bittman, S., and MacDonald, D. J.: Global chemical composition of ambient fine particulate matter for exposure assessment, Environ. Sci. Technol., 48, 13060–13068, 2014.
Piazzalunga, A., Bernardoni, V., Fermo, P., Valli, G., and Vecchi, R.: Technical Note: On the effect of water-soluble compounds removal on EC quantification by TOT analysis in urban aerosol samples, Atmos. Chem. Phys., 11, 10193–10203, https://doi.org/10.5194/acp-11-10193-2011, 2011.
Pileci, R. E., Modini, R. L., Bertò, M., Yuan, J., Corbin, J. C., Marinoni, A., Henzing, B., Moerman, M. M., Putaud, J. P., Spindler, G., Wehner, B., Müller, T., Tuch, T., Trentini, A., Zanatta, M., Baltensperger, U., and Gysel-Beer, M.: Comparison of co-located refractory black carbon (rBC) and elemental carbon (EC) mass concentration measurements during field campaigns at several European sites, Atmos. Meas. Tech., 14, 1379–1403, https://doi.org/10.5194/amt-14-1379-2021, 2021.
Pöschl, U.: Atmospheric aerosols: composition, transformation, climate and health effects, Angew. Chem. Int. Edit., 44, 7520–7540, 2005.
Putaud, J. P., Van Dingenen, R., Alastuey, A., Bauer, H., Birmili, W., Cyrys, J., Flentje, H., Fuzzi, S., Gehrig, R., Hansson, H. C., Harrison, R. M., Herrmann, H., Hitzenberger, R., Hüglin, C., Jones, A. M., Kasper-Giebl, A., Kiss, G., Kousa, A., Kuhlbusch, T. A. J., Löschau, G., Maenhaut, W., Molnar, A., Moreno, T., Pekkanen, J., Perrino, C., Pitz, M., Puxbaum, H., Querol, X., Rodriguez, S., Salma, I., Schwarz, J., Smolik, J., Schneider, J., Spindler, G., ten Brink, H., Tursic, J., Viana, M., Wiedensohler, A., and Raes, F.: A European aerosol phenomenology-3: Physical and chemical characteristics of particulate matter from 60 rural, urban, and kerbside sites across Europe, Atmos. Environ., 44, 1308–1320, 2010.
Qin, Y. M., Tan, H. B., Li, Y. J., Li, Z. J., Schurman, M. I., Liu, L., Wu, C., and Chan, C. K.: Chemical characteristics of brown carbon in atmospheric particles at a suburban site near Guangzhou, China, Atmos. Chem. Phys., 18, 16409–16418, https://doi.org/10.5194/acp-18-16409-2018, 2018.
Samset, B. H., Myhre, G., Herber, A., Kondo, Y., Li, S.-M., Moteki, N., Koike, M., Oshima, N., Schwarz, J. P., Balkanski, Y., Bauer, S. E., Bellouin, N., Berntsen, T. K., Bian, H., Chin, M., Diehl, T., Easter, R. C., Ghan, S. J., Iversen, T., Kirkevåg, A., Lamarque, J.-F., Lin, G., Liu, X., Penner, J. E., Schulz, M., Seland, Ø., Skeie, R. B., Stier, P., Takemura, T., Tsigaridis, K., and Zhang, K.: Modelled black carbon radiative forcing and atmospheric lifetime in AeroCom Phase II constrained by aircraft observations, Atmos. Chem. Phys., 14, 12465–12477, https://doi.org/10.5194/acp-14-12465-2014, 2014.
Shen, G. F., Chen, Y. C., Wei, S. Y., Fu, X. F., Zhu, Y., and Tao, S.: Mass absorption efficiency of elemental carbon for source samples from residential biomass and coal combustions, Atmos. Environ., 79, 79–84, 2013.
State Council: Circular on Further Promoting the Pollution Prevention and Control Battle, https://www.gov.cn/zhengce/2021-11/07/content_5649656.htm (last access: 31 July 2025), 2021.
Subramanian, R., Khlystov, A. Y., and Robinson, A. L.: Effect of peak inert-mode temperature on elemental carbon measured using thermal-optical analysis, Aerosol Sci. Tech., 40, 763–780, 2006.
Sullivan, A. P., Guo, H., Schroder, J. C., Campuzano-Jost, P., Jimenez, J. L., Campos, T., Shah, V., Jaeglé, L., Lee, B. H., Lopez-Hilfiker, F. D., Thornton, J. A., Brown, S. S., and Weber, R. J.: Biomass burning markers and residential burning in the WINTER aircraft campaign, J. Geophys. Res.-Atmos., 124, 1846–1861, 2019.
Tinorua, S., Denjean, C., Nabat, P., Pont, V., Arnaud, M., Bourrianne, T., Dias Alves, M., and Gardrat, E.: A 2 year intercomparison of three methods for measuring black carbon concentration at a high-altitude research station in Europe, Atmos. Meas. Tech., 17, 3897–3915, https://doi.org/10.5194/amt-17-3897-2024, 2024.
von Schneidemesser, E., Monks, P. S., Allan, J. D., Bruhwiler, L., Forster, P., Fowler, D., Lauer, A., Morgan, W. T., Paasonen, P., Righi, M., Sindelarova, K., and Sutton, M. A.: Chemistry and the linkages between air quality and climate change, Chem. Rev., 115, 3856–3897, 2015.
Wang, G. H., Cheng, C. L., Huang, Y., Tao, J., Ren, Y. Q., Wu, F., Meng, J. J., Li, J. J., Cheng, Y. T., Cao, J. J., Liu, S. X., Zhang, T., Zhang, R., and Chen, Y. B.: Evolution of aerosol chemistry in Xi'an, inland China, during the dust storm period of 2013 – Part 1: Sources, chemical forms and formation mechanisms of nitrate and sulfate, Atmos. Chem. Phys., 14, 11571–11585, https://doi.org/10.5194/acp-14-11571-2014, 2014a.
Wang, R., Tao, S., Balkanski, Y., Ciais, P., Boucher, O., Liu, J. F., Piao, S. L., Shen, H. Z., Vuolo, M. R., Valari, M., Chen, H., Chen, Y. C., Cozic, A., Huang, Y., Li, B. G., Li, W., Shen, G. F., Wang, B., and Zhang, Y. Y.: Exposure to ambient black carbon derived from a unique inventory and high-resolution model, P. Natl. Acad. Sci. USA, 111, 2459–2463, 2014b.
Wang, X., Heald, C. L., Liu, J., Weber, R. J., Campuzano-Jost, P., Jimenez, J. L., Schwarz, J. P., and Perring, A. E.: Exploring the observational constraints on the simulation of brown carbon, Atmos. Chem. Phys., 18, 635–653, https://doi.org/10.5194/acp-18-635-2018, 2018.
Wei, J., Li, Z. Q., Lyapustin, A., Wang, J., Dubovik, O., Schwartz, J., Sun, L., Li, C., Liu, S., and Zhu, T.: First close insight into global daily gapless 1 km PM2.5 pollution, variability, and health impact, Nat. Commun., 14, 8349, https://doi.org/10.1038/s41467-023-43862-3, 2023.
Xiao, Q. Y., Geng, G. N., Xue, T., Liu, S. G., Cai, C. L., He, K. B., and Zhang, Q.: Tracking PM2.5 and O3 Pollution and the related health burden in China 2013–2020, Environ. Sci. Technol., 56, 6922–6932, 2022.
Yang, H. and Yu, J. Z.: Uncertainties in charring correction in the analysis of elemental and organic carbon in atmospheric particles by thermal/optical methods, Environ. Sci. Technol., 36, 5199–5204, 2002.
Yu, J. Z., Xu, J. H., and Yang, H.: Charring characteristics of atmospheric organic particulate matter in thermal analysis, Environ. Sci. Technol., 36, 754–761, 2002.
Zheng, G. J., Duan, F. K., Su, H., Ma, Y. L., Cheng, Y., Zheng, B., Zhang, Q., Huang, T., Kimoto, T., Chang, D., Pöschl, U., Cheng, Y. F., and He, K. B.: Exploring the severe winter haze in Beijing: the impact of synoptic weather, regional transport and heterogeneous reactions, Atmos. Chem. Phys., 15, 2969–2983, https://doi.org/10.5194/acp-15-2969-2015, 2015.
Zhong, Q. R., Schutgens, N., van der Werf, G. R., Takemura, T., van Noije, T., Mielonen, T., Checa-Garcia, R., Lohmann, U., Kirkevåg, A., Olivié, D. J. L., Kokkola, H., Matsui, H., Kipling, Z., Ginoux, P., Le Sager, P., Rémy, S., Bian, H. S., Chin, M., Zhang, K., Bauer, S. E., and Tsigaridis, K.: Threefold reduction of modeled uncertainty in direct radiative effects over biomass burning regions by constraining absorbing aerosols, Sci. Adv., 9, eadi3568, https://doi.org/10.1126/sciadv.adi3568, 2023.