the Creative Commons Attribution 4.0 License.
the Creative Commons Attribution 4.0 License.
 | 30 Apr 2025
Long-term trends in aerosol properties derived from AERONET measurements
Zhenyu Zhang
Huizheng Che
Yueming Dong
Oleg Dubovik
Thomas Eck
Pawan Gupta
Brent Holben
Jhoon Kim
Elena Lind
Trailokya Saud
Sachchida Nand Tripathi
Tong Ying
Over the past 2 decades, remarkable changes in aerosol concentrations and compositions have been observed worldwide, especially over developing countries, potentially resulting in considerable changes in aerosol properties. The Aerosol Robotic Network (AERONET) offers high-precision measurements of aerosol optical parameters over about 1700 stations globally, many of which have long-term measurements for 1 or more decades. Here we use AERONET Level 2.0 quality-assured measurements to investigate long-term aerosol optical depth (AOD) and Ångström exponent (AE) trends and quality-controlled Level 1.5 inversion products to analyse trends in absorption aerosol optical depth (AAOD) and single scattering albedo (SSA) at stations with long-term records. We also classify the aerosol properties in these sites into six types and analyse the trends in each type. Results reveal decreases in AOD over the majority of the stations, except for northern India and the Arabian Peninsula, where AOD increased. AE (computed from the AOD within the range of 440–870 nm) decreased in Europe, eastern North America, and the Middle East but increased over South Asia and western North America. The decreased AE over Europe and eastern North America is likely due to decreased fine-mode anthropogenic aerosols, whereas that over the Arabian Peninsula is attributed to increased dust activity. Conversely, increased AE over northern India is probably attributed to increased anthropogenic emissions and decreased dust loading. Most stations in Europe, North America, East Asia, and South Asia exhibit negative trends in AAOD, whereas Solar_Village in the Arabian Peninsula has positive trends. SSA at most stations increases and exhibits opposite trends to AAOD but with several stations in North America and central Europe showing decreased SSA values. Trend analysis of different aerosol types further reveals the changes in different aerosol components that are related to AOD, AE, AAOD, and SSA trends. The reductions in aerosols in eastern North America mainly result from non-absorbing species. Reductions in both fine-mode absorbing species and non-absorbing aerosols are found over Europe and East Asia, but the reduction in absorbing species is stronger than that of non-absorbing species. Increased aerosols in Kanpur over northern India should be mainly comprised of fine-mode scattering species, whereas those in Solar_Village over the Arabian Peninsula are mainly dust. The majority of stations exhibit consistent monotonic trends across different seasons for these parameters.
- Article
(10933 KB) - Full-text XML
-
Supplement
(7818 KB) - BibTeX
- EndNote


Aerosols are pivotal in the study of climate change due to their significant effects on the climate system. Understanding the climate effects of aerosols necessitates a comprehensive recognition of their optical and microphysical properties. Variations in aerosol loading and aerosol properties can result in disparate climate impacts, underscoring the importance of accurately comprehending these changes. For example, changes in aerosol loading can directly influence the intensity of aerosol forcing, while a rise in aerosol absorption could even shift the aerosol forcing from negative to positive (Hansen et al., 1997), remarkably altering their climate effects. To quantify the contribution of aerosols to climate variability effectively, it is thus crucial to understand and quantify the long-term change in aerosol properties.
Studies using satellite observations revealed continuous reductions in the loading of aerosols and their precursors in Europe, North America, South America, and Africa in the past several decades but increases over South Asia and the Middle East, as well as increases in the 2000s and decreases in the 2010s over East Asia (Krotkov et al., 2016; Mehta et al., 2016; Zhao et al., 2017; de Meij et al., 2012; Fioletov et al., 2023; Gupta et al., 2022). In situ measurements also suggested negative scattering and absorption coefficient trends in the majority of the stations, which are mainly located in Europe and North America, and revealed an increased scattering aerosol fraction (represented by single scattering albedo, SSA) in Asia, eastern and northern Europe, and the Arctic and negative SSA trends in central Europe and central North America (Collaud Coen et al., 2020a). As satellite observations mainly provide aerosol loading products and may have drifts in long-term calibration which impact aerosol monitoring and as the spatial coverage of in situ measurements is quite limited, ground-based remote sensing networks provide a very accurate data source to analyse trends in multiple aerosol parameters worldwide. Xia (2011) examined 79 stations within the Aerosol Robotic Network (AERONET; Holben et al., 1998), with observations spanning no less than 6 years, and found decreases in aerosol optical depth (AOD) and Ångström exponent (AE) in eastern North America and Europe. Ningombam et al. (2019) analysed long-term AOD trends over 49 AERONET sites and 4 Sky Radiometer Network (SKYNET; Takamura and Nakajima, 2004) sites and reported a decline in AOD over North America, South America, Europe, the Arctic, and Australia.
However, these studies based on ground-based remote sensing data mainly focused on trends in AOD and AE, while the analysis on other aerosol optical properties, such as SSA and absorption aerosol optical depth (AAOD), is still insufficient. Other studies focusing on trends in these parameters are mainly restricted to specific stations with long-term records, which is mainly because of the limited data availability of AERONET Level 2.0 data. Li et al. (2014) utilized quality-controlled AERONET Level 1.5 inversion measurements at 54 selected stations as well as Level 2.0 solar observations at 90 selected stations worldwide for the period 2000–2013 to analyse the trends in AOD, AE, SSA, and AAOD. Decreased AOD and AAOD trends, along with increased SSA trends, were consistently observed in Japan, Europe, and North America. North America exhibited positive AE trends, whereas Europe showed negative AE trends. India was reported to experience increases in AOD, AE, and SSA. The Arabian Peninsula was noted for experiencing increased AOD and AAOD, with decreases in AE and SSA. Eastern China was characterized by a positive SSA trend and a negative AAOD trend, without significant changes in AOD or AE.
A decade later, many regions have experienced significant changes in aerosol loading and compositions. For example, recent studies have highlighted considerable reductions in aerosol loadings in East Asia as evidenced by AERONET measurements (Yu et al., 2022; Ramachandran and Rupakheti, 2022; Eom et al., 2022) and satellite observations (Ramachandran et al., 2020; Krotkov et al., 2016; Mehta et al., 2016; Zhao et al., 2017; Fioletov et al., 2023; Li, 2020; Gupta et al., 2022). Substantial reductions in anthropogenic emissions have been observed in eastern North America (Krotkov et al., 2016), potentially contributing to a decrease in AE. Central Australia has seen reported increases in dust activity (Shao et al., 2013), aligning with observed increases in AOD and decreases in AE (Yang et al., 2021), which might also lead to positive AAOD and negative SSA trends. Some potential variations in aerosol optical properties in certain regions were not captured by Li et al. (2014), partly due to limitations in the spatial and temporal coverages of surface stations at that time, and recent changes in aerosol loadings and compositions might lead to different or reversed trends. AERONET has now expanded from 400 to over 1700 stations globally with longer records. The AERONET algorithm has also been updated to Version 3 with numerous improvements (Giles et al., 2019; Sinyuk et al., 2020). These progresses underscore the need to update trend analysis of AERONET data to capture recent shifts in aerosol optical properties and reflect advancements in data quality and network coverage.
In this study, we analyse AERONET Level 2.0 AOD and AE observations at 172 stations and Level 1.5 quality-controlled AAOD and SSA measurements at 72 stations. We also made a further attempt to categorize aerosol types and analyse the trends in each type. We hope that this study can provide a more recent reference to aerosol changes globally and facilitate the assessment of aerosol climate and environmental impacts.
2.1 AERONET data
AERONET is a ground-based aerosol remote sensing network providing long-term observations of aerosol optical and microphysical properties, covering most of the continental areas around the world (Holben et al., 1998). The AERONET AOD observations are derived from direct solar radiation at several wavelength bands mainly ranging from 340 to 1640 nm, while other aerosol properties, including SSA and AAOD, are derived from diffuse sky radiance at four wavelengths at 440, 675, 870, and 1020 nm (Dubovik and King, 2000). The AE parameter is calculated using AOD measurements within the 440–870 nm interval (Eck et al., 1999; Giles et al., 2019). There is a series of quality-assurance strategies for AERONET Level 2.0 data that ensure an AOD uncertainty of 0.01 (visible) to 0.02 (UV) and an SSA uncertainty of 0.03 at AOD440 (AOD at 440 nm) ∼ 0.4 (Holben et al., 2006; Giles et al., 2019; Sinyuk et al., 2020). However, as Level 2.0 quality assurance for inversion products requires a coincident AOD exceeding 0.4 at 440 nm, many stations do not have enough data samples to produce a long-term record. Therefore, considering both the data quality and data availability, we utilize the all-point Version 3 Level 2.0 direct measurements for AOD and AE and quality-controlled Level 1.5 almucantar inversion products (see below for the quality control scheme) for other parameters. The description and uncertainties of these parameters are detailed in Sect. 2.2.
The stations are selected primarily based on the availability of an extensive data record for the purpose of estimating the long-term trends in aerosol properties. The Level 1.5 almucantar inversion products are first screened based on all the Level 2.0 quality-assurance criteria except for the AOD threshold, such as solar zenith angle > 50°, sky error < 5 %, and coincident Level 2.0 AOD measurements. The Level 2.0 direct measurements and screened Level 1.5 almucantar inversion products are then used to calculate monthly measurements. Long-term trend analysis necessitates homogeneous time series, and outliers would influence the result. We first check the records, removing invalid and abnormally high or low values (such as SSA below 0.7 for all stations and AOD above 2.0 for low-AOD stations) from all-point measurements. Then we calculate the median of all-point measurements to represent the monthly value only if there are more than five all-point measurements on at least 3 different days for that month. To ensure adequate records and data continuity in trend analysis, we require the data to have at least 10 years of records with no less than 8 months of measurements for each year during the 2000–2022 period. Years with less than 8 months of data and seasons with less than 10 years of records are discarded due to poor annual and seasonal representation. We also remove the first or last several months from the time series of certain stations (Canberra and Ilorin) where discontinuities were identified relative to adjacent monthly records. Considering polar stations often have no monthly measurements in winter, the least number of monthly medians for each year are reduced to 4 for stations at latitudes above 65°. Specifically, the 2019–2022 data for Birdsville in Australia are eliminated for more accurate trend estimation, as these data are strongly biased due to a data-filtering artefact in the quality-assurance (QA) process of the algorithm according to Giles et al. (2019), which results in a large jump in AOD (Thomas Eck, personal communication, 2024). This AOD artefact is caused by the erroneous time-stamping of the data that is greatest at some sites in Australia due to a unique data logging system utilized there. The unnatural increase in AOD for Birdsville in 2019 can be found in Yang et al. (2021). As a result, 172 stations for the direct-sun observations and 72 stations for the inversion measurements are retained for trend analysis, covering all major continents in the world. Locations, trends, and time series for all the stations could be found in the Supplement. The distributions of all the selected stations as well as the number of annual mean samples at each station are presented in Fig. 1. Locations of stations mentioned in this article are presented in Fig. 2.
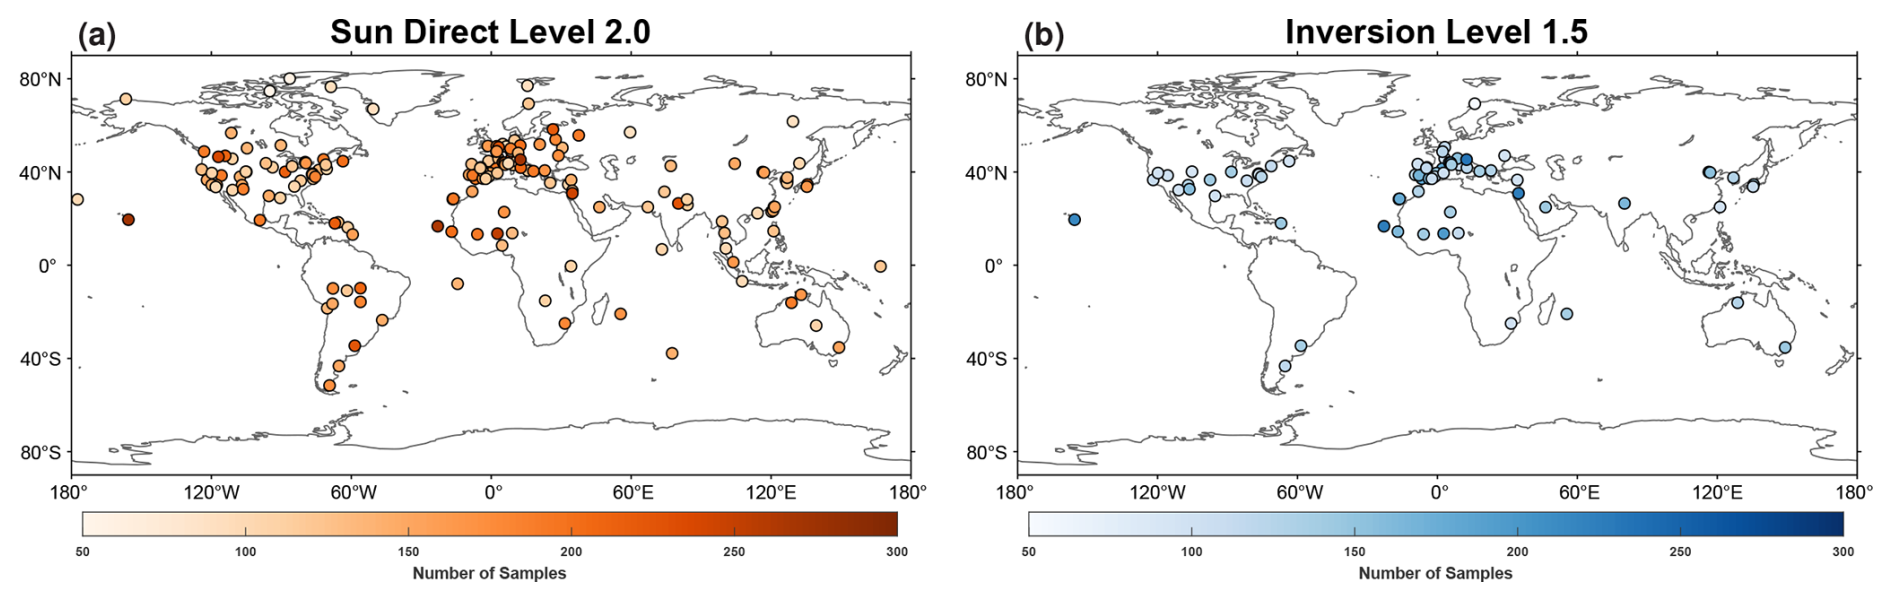
Figure 1Locations of the stations selected for this study. (a) Level 2.0 solar stations. (b) Quality-controlled Level 1.5 almucantar stations. Colour coding denotes the number of monthly samples for each station.
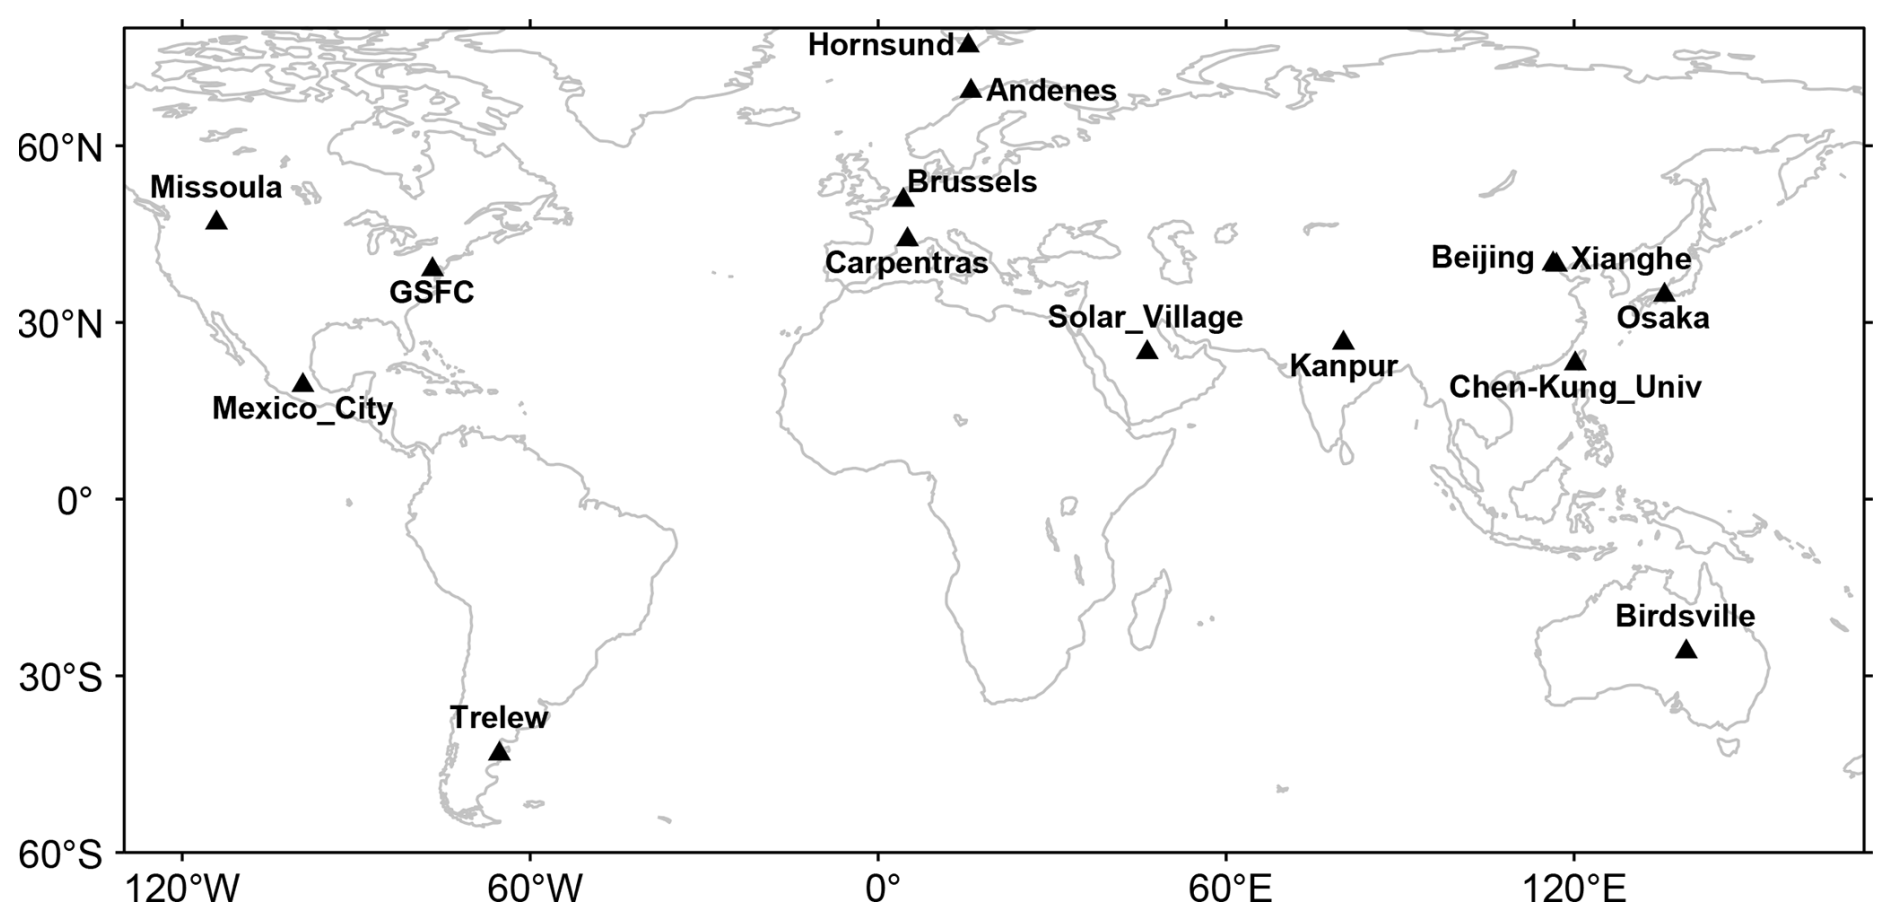
Figure 2Locations of representative stations mentioned in the study.
Here we focus on analysing AOD, SSA, and AAOD trends at 440 nm, which are noted as AOD440, SSA440, and AAOD440, respectively. Trends for parameters at the other wavelengths are very similar and thus skipped. The AE is calculated from all AOD measurements within the 440–870 nm wavelength range (typically including 440, 500, 675, and 870 nm) and are commonly denoted as AE440_870.
2.2 Aerosol parameters
AOD represents the column aerosol extinction, directly reflecting the column loading and concentration of aerosols. AERONET Level 2.0 products provide very accurate AOD measurements under clear-sky conditions, with an uncertainty of 0.01 at visible wavelengths. The patterns of AOD (Fig. 3) and AOD trends (Fig. 4) should always be kept in mind when analysing trends in the other aerosol parameters because uncertainties of the other parameters are closely related to AOD level (see below), whose trends reflect changes in aerosol loading.
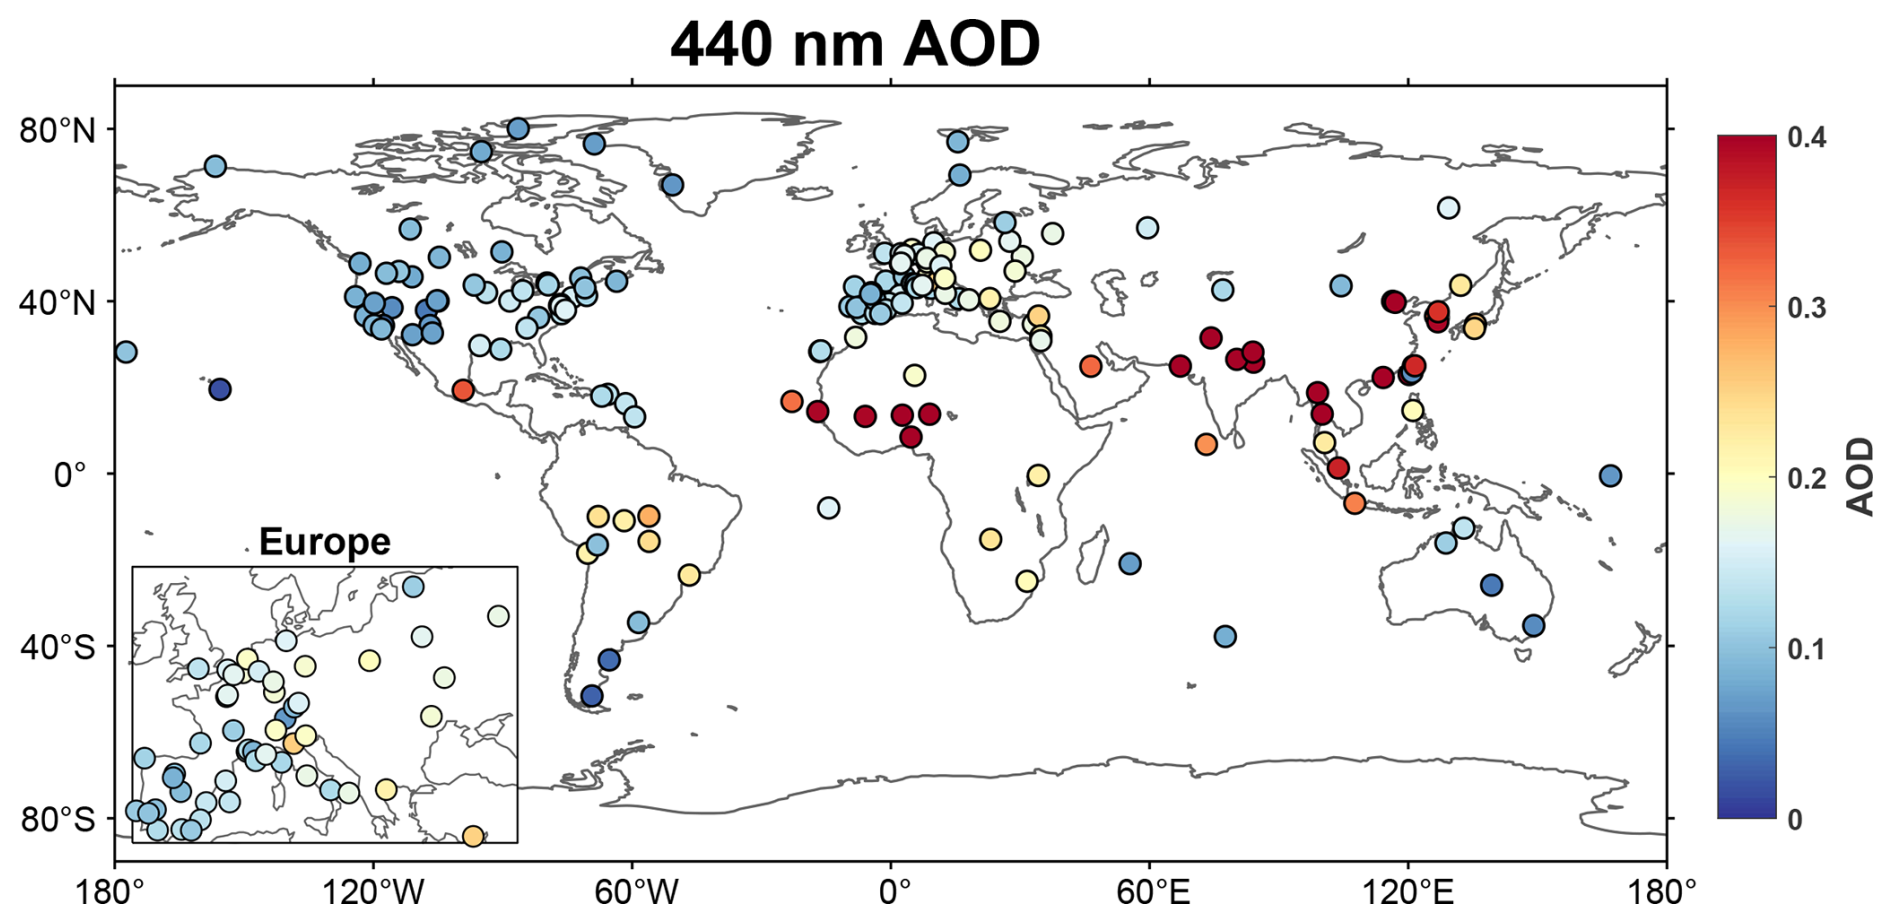
Figure 3Mean AOD at 440 nm.
The AE parameter describes the slope of the logarithm of AOD versus the logarithm of wavelength (Ångström, 1929), characterizing the wavelength dependency of AOD. AERONET AE440_870 products are calculated from the linear regression of AOD and wavelengths on a logarithmic scale within the range of 440–870 nm (Eck et al., 1999; Giles et al., 2019). The AE parameter closely correlates with aerosol particle size distribution and is an indicator of aerosol components. For example, dust particles typically have AE440_870 values of around 0.3 or lower, and the AE440_870 values for fine-mode particles that are mostly anthropogenic usually exceed 1.0 (Farahat et al., 2016; Giles et al., 2012; Russell et al., 2010; Dubovik et al., 2002). Therefore, AE440_870 can reflect the relative fraction of fine- and coarse-mode particles. The error in AE can be estimated by the error in AOD as (Li et al., 2014; Kato et al., 2000)
where ei is the error in the Ångström relationship, n is the number of wavelengths λi used to fit the Ångström relationship, and is the average of the logarithm of the wavelengths. ei can be estimated using the relative error in AOD (), and the uncertainty of AERONET AOD (ΔAOD) is considered to be 0.01 here. According to Eq. (1), the uncertainty of AE is roughly inversely proportional to AOD, with larger errors under lower-AOD conditions. Li et al. (2014) evaluated that the uncertainty of AE440_870 was 0.33 when AOD440 = 0.15, and the uncertainty would rapidly increase to 0.56 when AOD440 decreased to 0.08. Eck et al. (1999) also demonstrated significant variability in AE440_870 for lower AOD, largely attributed to increased relative errors in AOD at these low values. These results correspond to the inverse relationship between ΔAE and AOD. Therefore, it should be noted that AE440_870 is highly uncertain and the AE440_870 trends are less robust for sites with low AOD, even if the trends are statistically significant.
AAOD and SSA together characterize the scattering and absorbing properties of aerosols. AAOD represents the total aerosol absorption optical depth, whereas SSA reflects the relative contribution of scattering to total extinction. Therefore, the AAOD trend directly reflects changes in the amount of absorbing aerosols, while the SSA trend is related to variations in both absorbing and scattering aerosols. The relationship between the two parameters can be expressed as the following equation:
The uncertainties of AAOD and SSA are also closely related to AOD level. AERONET implements a series of quality control criteria for Level 2.0 inversion products. Under these controls, AERONET SSA has an error of ±0.03 when AOD440 ∼ 0.4, and the error increases rapidly (exponentially) at lower AOD levels, i.e. an error of ±0.05 when AOD440 is ∼ 0.2, and of ±0.07 when AOD440 is ∼ 0.1 (Sinyuk et al., 2020). Therefore, although we utilize all the Level 2.0 quality-assurance criteria except for the AOD threshold for AAOD and SSA data, many of the SSA retrievals in this study have larger uncertainties of ∼ 0.03 to ∼ 0.09 due to the low AOD level. Moreover, as SSA typically varies from approximately 0.8 to 1.0 (Dubovik et al., 2002; Giles et al., 2012), this error is remarkable when examining the variation in AAOD and SSA; i.e. a 0.03 error in SSA would lead to a 15 % uncertainty. Therefore, the great uncertainties of AAOD and SSA should be kept in mind when analysing their trends, especially for regions with low aerosol loadings.
2.3 Mann–Kendall test and Sen's slope for trend analysis
Here we use Sen's slope combined with Mann–Kendall test to estimate the trend and its significance. The Mann–Kendall (MK) test (Mann, 1945; Kendall, 1975) is a non-parametric method to assess the significance of monotonic trends in a dataset without assuming any particular distribution. The slope of the trend k can be estimated by the median of the set of slopes (Sen, 1968):
where Yi and Yj are the values of the variable at times ti and tj, respectively.
The significance of the trend could be tested by calculating the MK statistic:
where
which has a normal distribution with zero mean and variance of (Li, 2020)
Sen's slope associated with the MK test is a robust measurement of the trend in a dataset and is not sensitive to outliers. As aerosol optical parameters do not follow a normal distribution and AERONET records often have missing data, Sen's slope is a good estimator of trends.
It should be noted that the MK test requires serially independent data, necessitating the removal of autocorrelation from the time series before calculating trends (Kulkarni and von Storch, 1992; Yue et al., 2002; Li et al., 2014; Collaud Coen et al., 2020b). Several pre-whitening methods are available to remove serial correlation, with Collaud Coen et al. (2020b) providing a comprehensive comparison of these approaches. In this study, we apply the 3PW method developed by Collaud Coen et al. (2020b) to eliminate autocorrelation before computing the trend.
Aerosol parameters typically exhibit strong seasonality, which should be taken into account in the analysis. We conduct seasonal MK tests and calculate seasonal trends on the pre-whitened time series, and we then derive the annual trend as the median of seasonal trends (Hirsch et al., 1982; Hirsch and Slack, 1984). The homogeneity of the seasonal trend is also tested, and the results are marked in the annual trend maps. The definition of the seasons is primarily based on regional climatic characteristics. Specifically, seasons for South Asia are divided into pre-monsoon (March–May), monsoon (June–September), post-monsoon (October–November), and winter (December–February). For the Arabian Peninsula, the seasons are categorized as pre-peak (November–February), peak (March–June), and post-peak (July–October) (Habib et al., 2019). In West Africa, the seasons are classified as Harmattan (November–March) and summer (April–October) (Balarabe et al., 2016; Nwofor et al., 2007). For the other regions, the standard seasonal divisions of spring (March–May), summer (June–August), autumn (September–November), and winter (December–February) are applied.
2.4 Aerosol classification
In addition to the retrieved parameters, we also classify the observations into six aerosol types using the fine-mode fraction (FMF) at 550 nm and SSA at 440 nm (Lee et al., 2010). AOD and fine-mode AOD at 440, 675, 870, and 1020 nm are first interpolated to 550 nm using a second-order polynomial fit on a logarithmic scale (Eck et al., 1999). Then the FMF550 is calculated by AOD and fine-mode AOD at 550 nm. The classification criteria for the six aerosol types (“dust”, “mixture”, and four fine-mode types), as well as the proportion of each type in the total number of quality-controlled Level 1.5 all-point records, are listed in Table 1. Sea salt aerosols typically having FMF550 below 0.4 and SSA440 around 0.98 (included in the “uncertain” type in Table 1) are not considered in the analysis of aerosol type trends (Sect. 3.3) because most AERONET stations are located over land where sea salt is not the predominant type, and sea salt aerosols only account for a negligible proportion (about 2.5 % for the uncertain type).
Table 1Criteria of aerosol classifications defined in Lee et al. (2010).
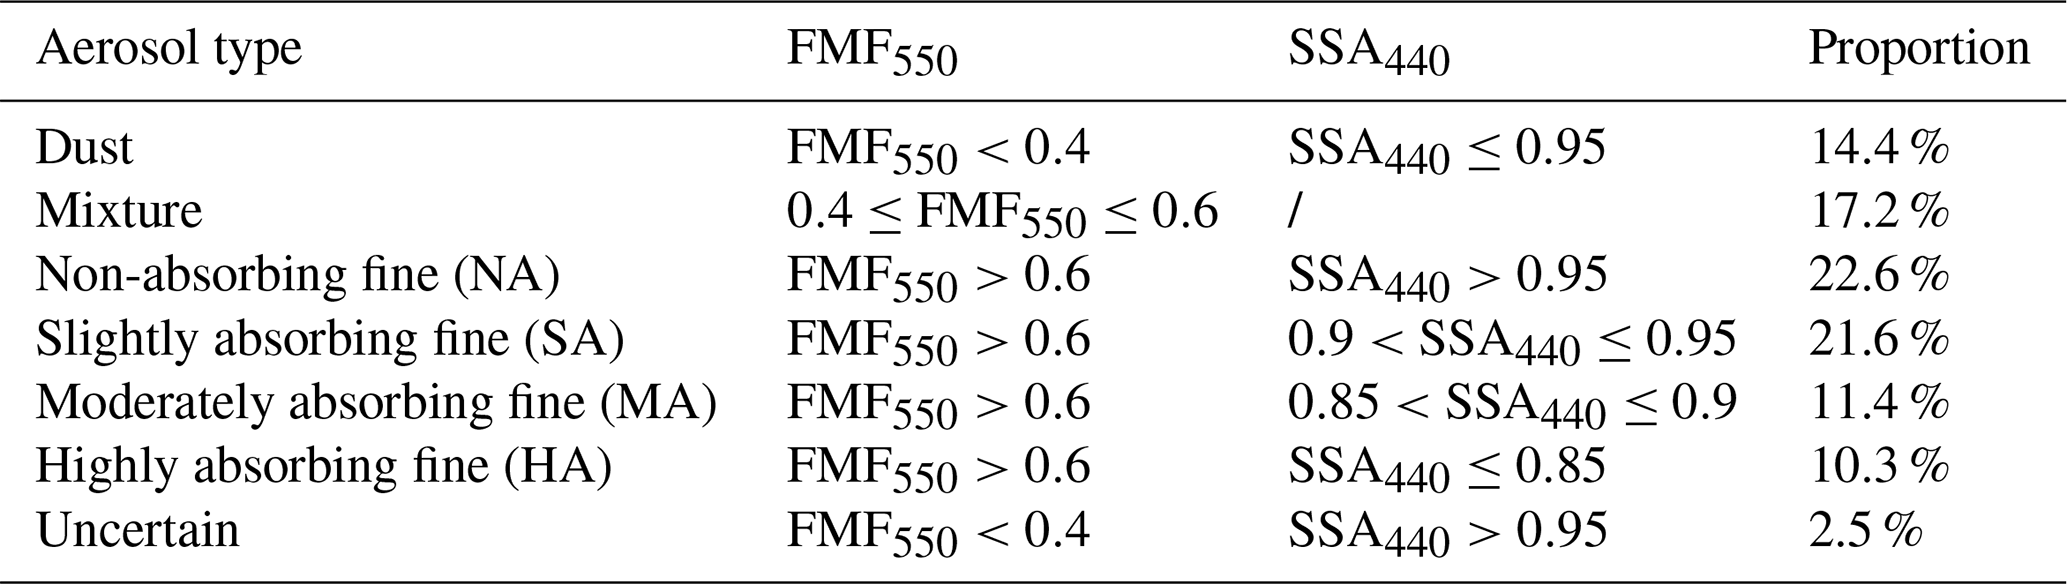
indicates that this type does not require the use of SSA for classification.
Each quality-controlled Level 1.5 inversion all-point measurement is classified as a specific aerosol type according to the classification criteria in Table 1. For each aerosol type, we use coincident Level 2.0 AOD440 measurements to calculate the monthly AOD and analyse its trend.
3.1 Trends for AOD and AE
The AOD440 trends at the 172 selected AERONET stations are presented in Fig. 4. Trends surpassing the 90 % significance level are marked with dots. Trends below the 90 % significance level are marked with triangles. Trends passing the seasonal homogeneity test at the 80 % confidence level are marked with magenta boundaries. The AOD440 time series at several representative sites are shown in Fig. 5. Significant negative AOD440 trends are found for the majority of stations all over the world, demonstrating a global reduction in aerosol loading. This result is consistent with previous studies (Li et al., 2014; Xia, 2011; Ningombam et al., 2019). An increased number of stations with significant trends compared to these previous studies are observed in North America, Europe, and the Mediterranean, likely due to the spatial and temporal expansion of the network in recent years. The rates of AOD440 reduction in western Europe (typically below −0.05 per decade) are not as substantial as that reported in Li et al. (2014), which was −0.1 per decade, suggesting a decelerated aerosol reduction rate in Europe in recent years. This is also in line with the AOD440 time series at representative European sites (Fig. 5g, h). Stations in the Arctic also exhibit coherent negative AOD440 trends, consistent with previous studies (Breider et al., 2017; Wang et al., 2018). Since a significant proportion of aerosols in the Arctic are transported from lower latitudes, the reduction in aerosols in the Arctic is in line with the general reduction in AOD observed in the Northern Hemisphere. Strong negative AOD440 trends are identified at more than 10 stations in East Asia and Southeast Asia, which were previously reported as exhibiting no significant trends in global studies (Li et al., 2014; Xia, 2011; Ningombam et al., 2019). The most considerable AOD440 reductions are observed in East China, with significant declines of −0.1 per decade. However, the trend of AOD440 in East Asia is not coherent throughout the period of 2000–2022. According to the AOD440 time series (Fig. 5a–d), AOD440 increased in the early 2000s and decreased rapidly in the later years since around 2008, consistent with other regional aerosol trend studies (Yoon et al., 2012; de Meij et al., 2012; Ramachandran and Rupakheti, 2022; Ramachandran et al., 2020; Eom et al., 2022; Li, 2020; Gupta et al., 2022; Lyapustin et al., 2011). This result also explains why Li et al. (2014) found no significant AOD440 in East Asia with shorter records, as the increase in AOD440 in the early 2000s offset the reduction after 2008. When applying longer records, the continuous reduction in AOD440 after 2008 becomes dominant.
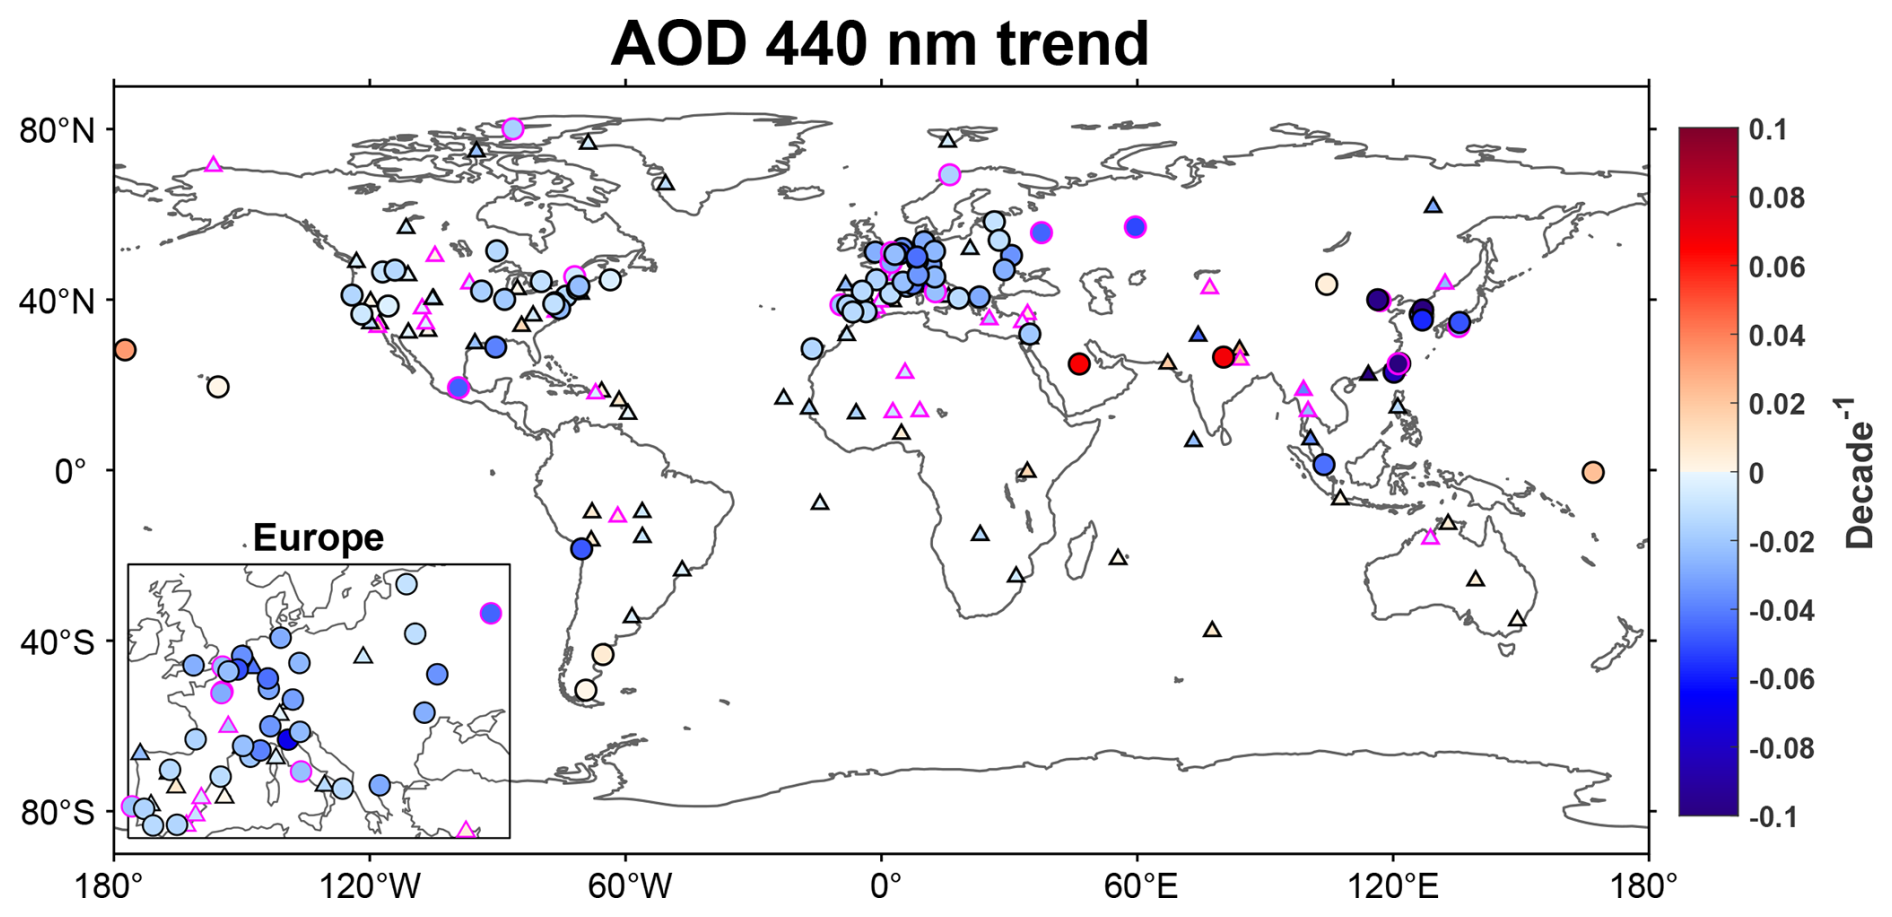
Figure 4Trends in 440 nm AOD at AERONET stations. Triangles indicate trends below 90 % significance level. Dots indicate trends at 90 % significance. Trends passing seasonal homogeneity test at 80 % confidence level are marked with magenta borders. The magnitude of the trend is per decade.
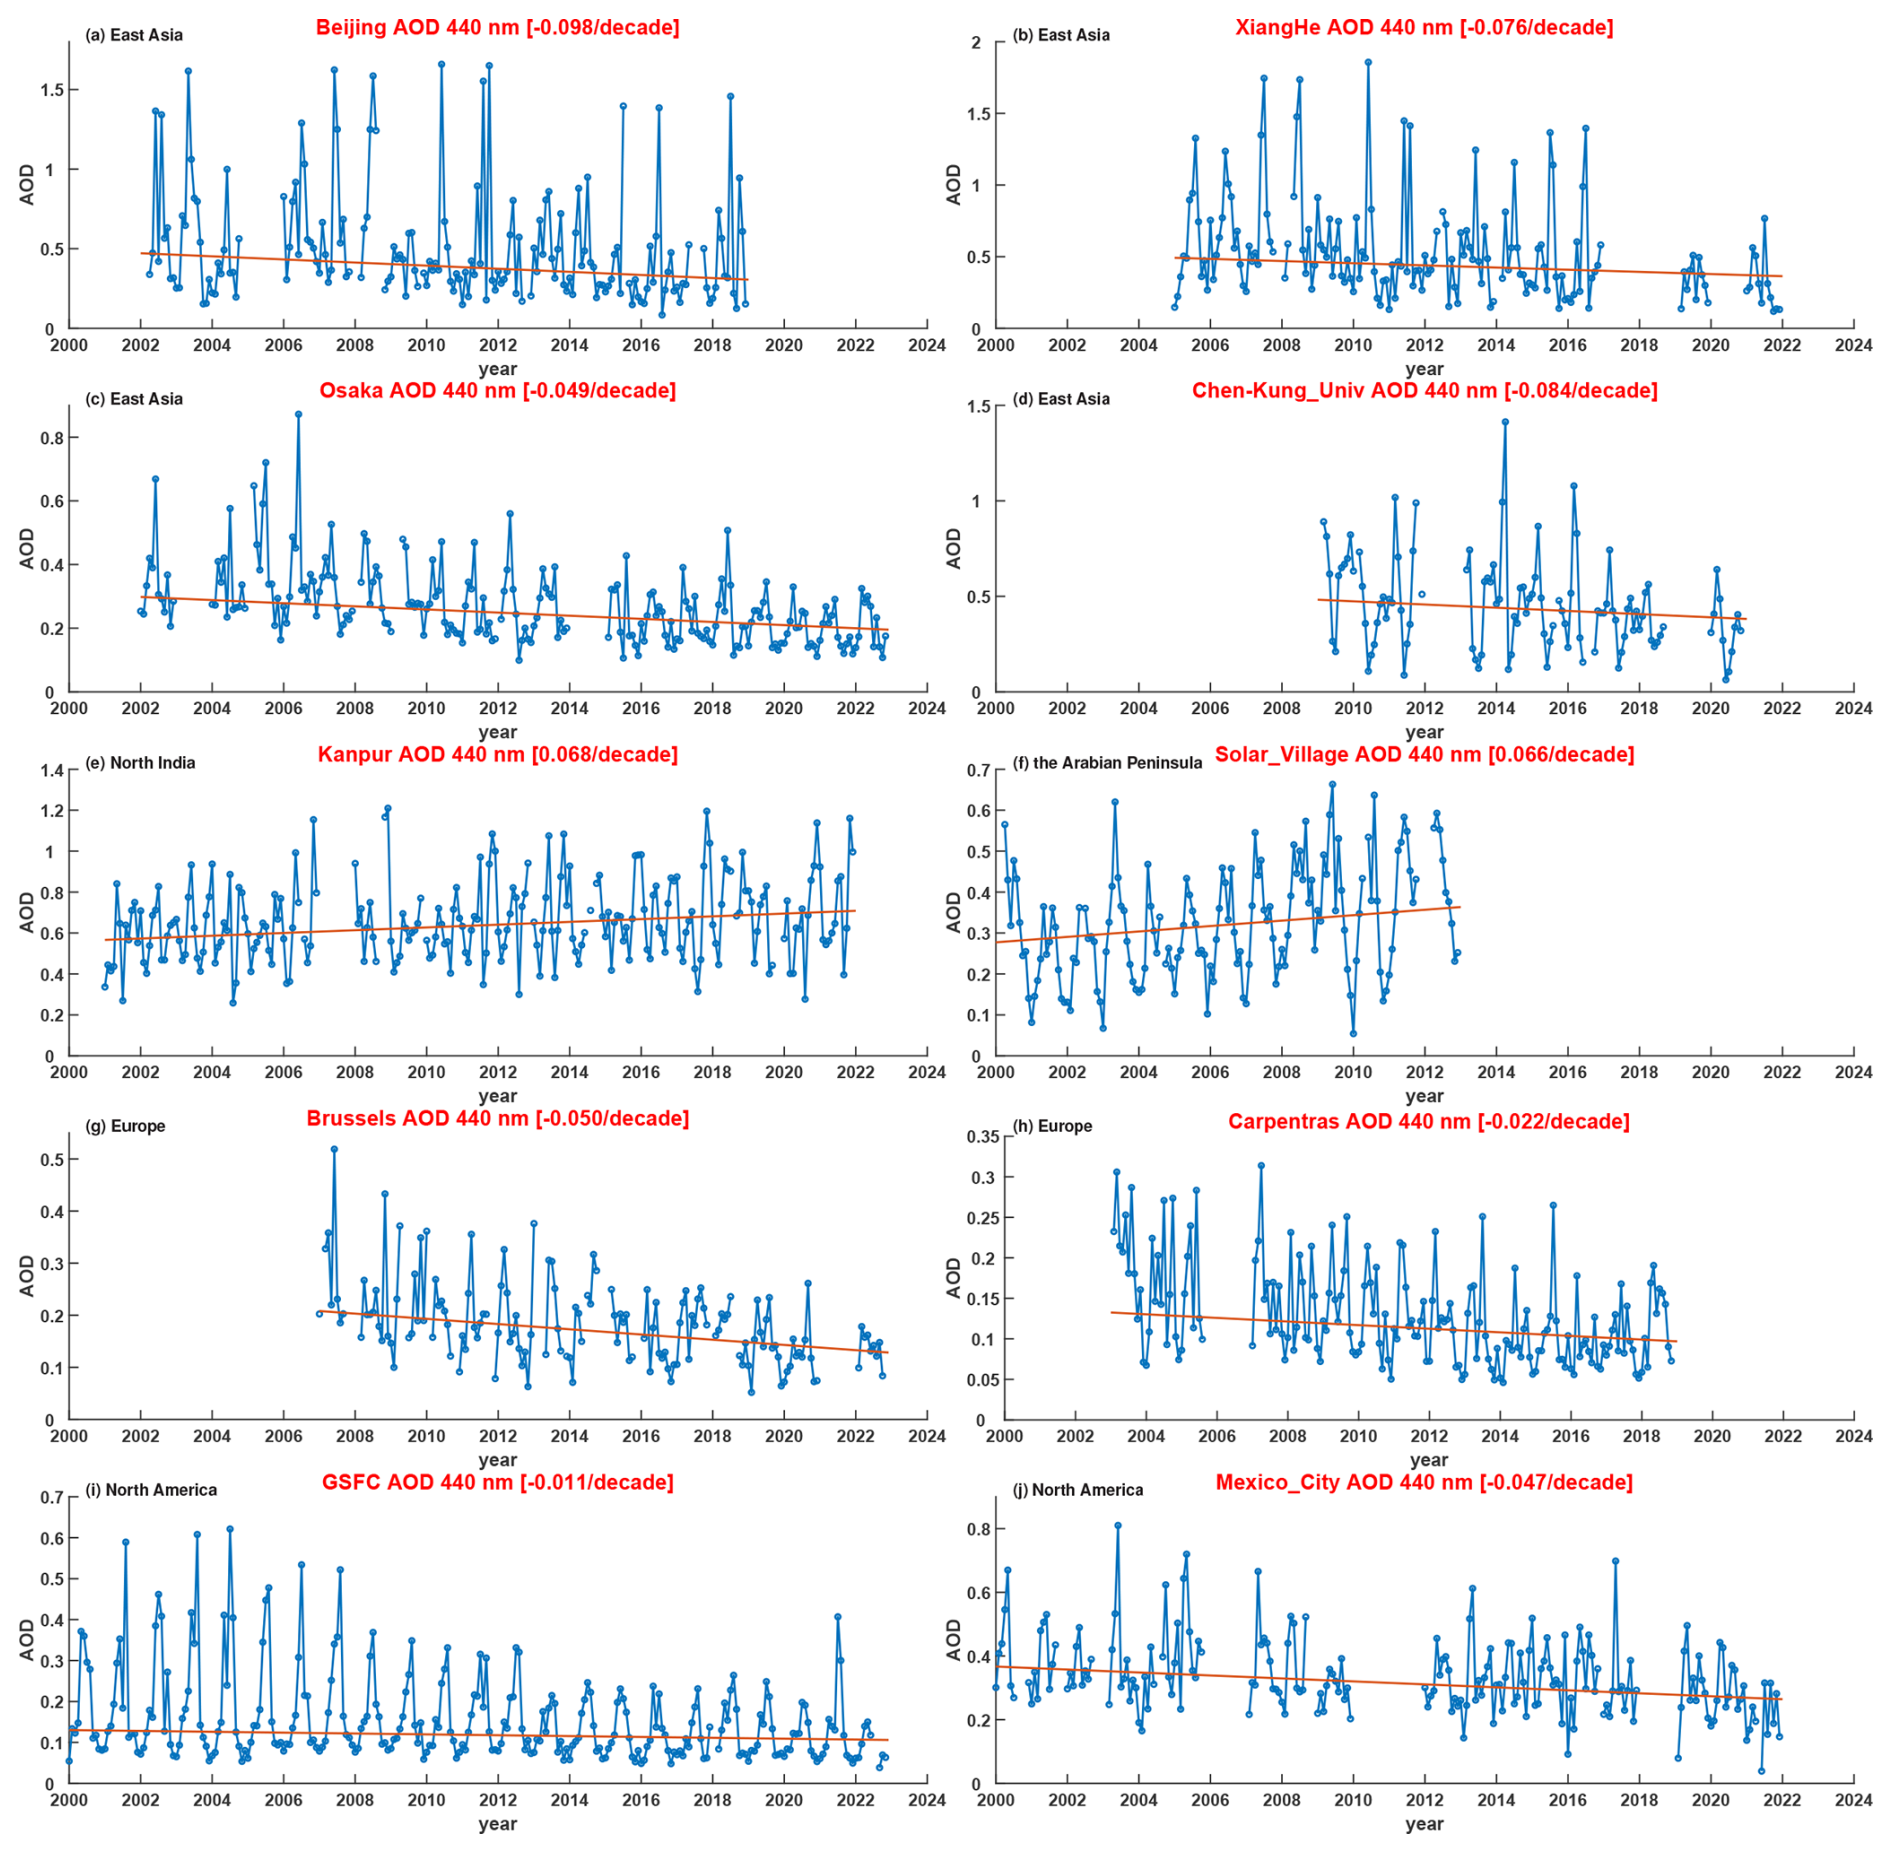
Figure 5Time series of 440 nm AOD at several representative AERONET stations with trends at 90 % significance. (a) Beijing, (b) XiangHe, (c) Osaka, (d) Chen-Kung_Univ, (e) Kanpur, (f) Solar_Village, (g) Brussels, (h) Carpentras, (i) GSFC, and (j) Mexico_City.
Significant positive AOD440 trends are mainly found over Solar_Village in the Arabian Peninsula and over Kanpur in northern India. The Level 2.0 AOD440 records at Solar_Village (Fig. 5f) ended in 2013, limiting current insights into aerosol properties in the Arabian Peninsula. Kanpur (Fig. 5e) has extensive records over the past 2 decades, exhibiting a positive AOD440 trend of 0.068 per decade. This value is close to the trends calculated from different periods in previous studies (Ramachandran and Rupakheti, 2022; Li et al., 2014; Kaskaoutis et al., 2012; Kumar et al., 2022), indicating a steady increase in AOD440 there. Significant positive AERONET AOD440 trends over the other regions, such as Trelew in South America and some oceanic island stations, are generally weak, with magnitudes typically below 0.03 per decade. As these sites have very low AOD440 (typically below 0.1 for monthly values) as well as low AOD440 variability, the results in these stations are typically more uncertain. The positive AOD trend for Birdsville in Australia was confirmed by the independent research conducted by Yang et al. (2021); however this was a false trend resulting from a previously mentioned data screening anomaly. The positive AOD440 trends over oceanic stations worldwide suggest a widespread increase in oceanic aerosols, primarily sea salts. This result is consistent with Hsu et al. (2012), who also reported an increase in oceanic AOD.
Significant negative AE440_870 trends are universally found for stations across Europe, the Mediterranean, and eastern North America (Fig. 6, Fig. 7). The Arabian Peninsula also exhibits a negative AE440_870 trend, although the trend is not significant. Stations in western North America and northern India mainly exhibit positive AE440_870 trends. The significant negative AE440_870 trends for Europe, the Mediterranean, and eastern North America are likely due to reductions in fine-mode anthropogenic aerosol and precursor emissions. The Arabian Peninsula is a well-known dust source (Ginoux et al., 2012), and the AE440_870 values are typically low (Fig. 7b); therefore the negative AE440_870 trend for Solar_Village is likely attributed to increased dust activity. In northern India, considering the seasonal cycle of the AE440_870 value, the positive AE440_870 trends primarily result from increased fine-mode anthropogenic emissions as well as decreased coarse-mode dust loading. These shifts in anthropogenic emissions have been assessed through satellite observations and emission inventories (Pouliot et al., 2015; Szymankiewicz et al., 2021; Krotkov et al., 2016; Zhao et al., 2017; de Meij et al., 2012; Kumar et al., 2021), and the decline in dust loading over South Asia was also verified by satellite observations and AERONET measurements (Pandey et al., 2016, 2017; Ramachandran and Rupakheti, 2022; Kaskaoutis et al., 2011). The increased AE440_870 in western North America might be partly due to both increases in biomass burning aerosols and possibly diminished dust sources. These inferences align with previous studies, as Shao et al. (2013) also reported positive dust trends in the Middle East and negative trends in North America, whereas Eck et al. (2023) and Iglesias et al. (2022) revealed increases in biomass burning emissions over western North America. Two Arctic stations located in Europe (Andenes and Hornsund) exhibit significant positive trends in AE440_870, indicating decreased coarse-mode natural source emissions. However, the results are associated with considerable uncertainty due to the low aerosol loading in the Arctic. East Asia exhibits no significant AE440_870 trends, indicating weak changes in the ratio of fine-mode and coarse-mode aerosols. Therefore, the great decrease in aerosol loading in East Asia revealed in Fig. 4 might be related to similar reductions in both anthropogenic fine-mode aerosols and coarse-mode dust in these areas.
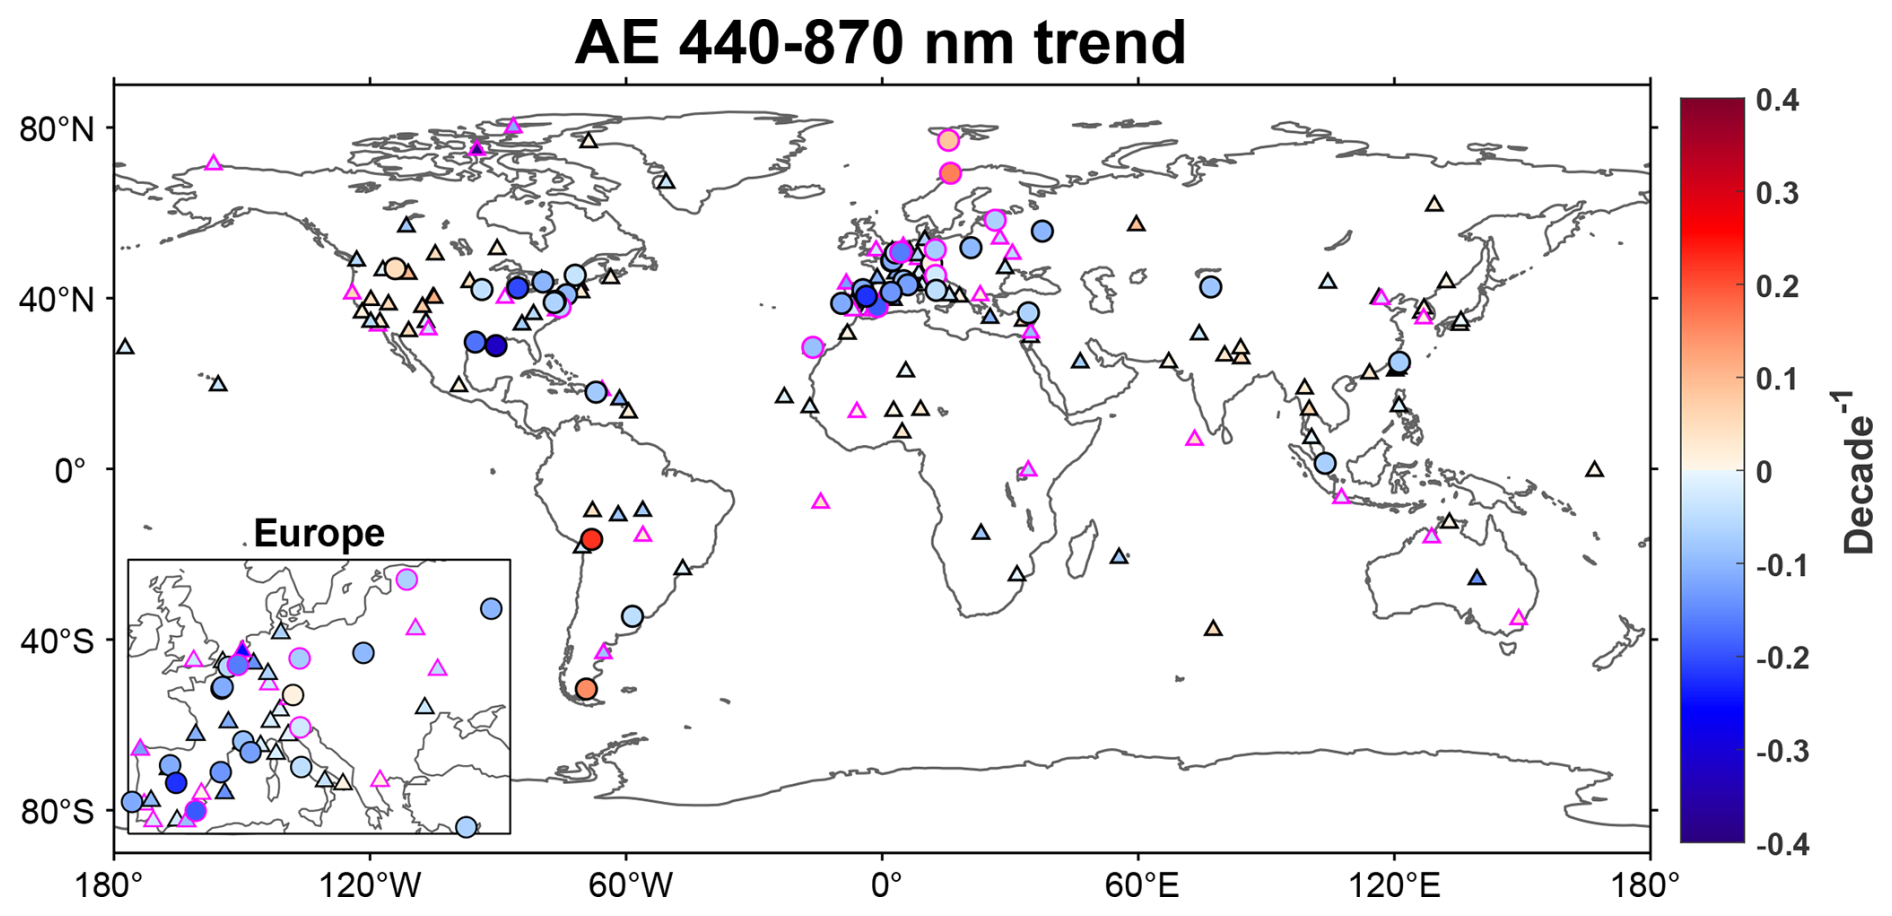
Figure 6Same as Fig. 4, but with trends in AE.
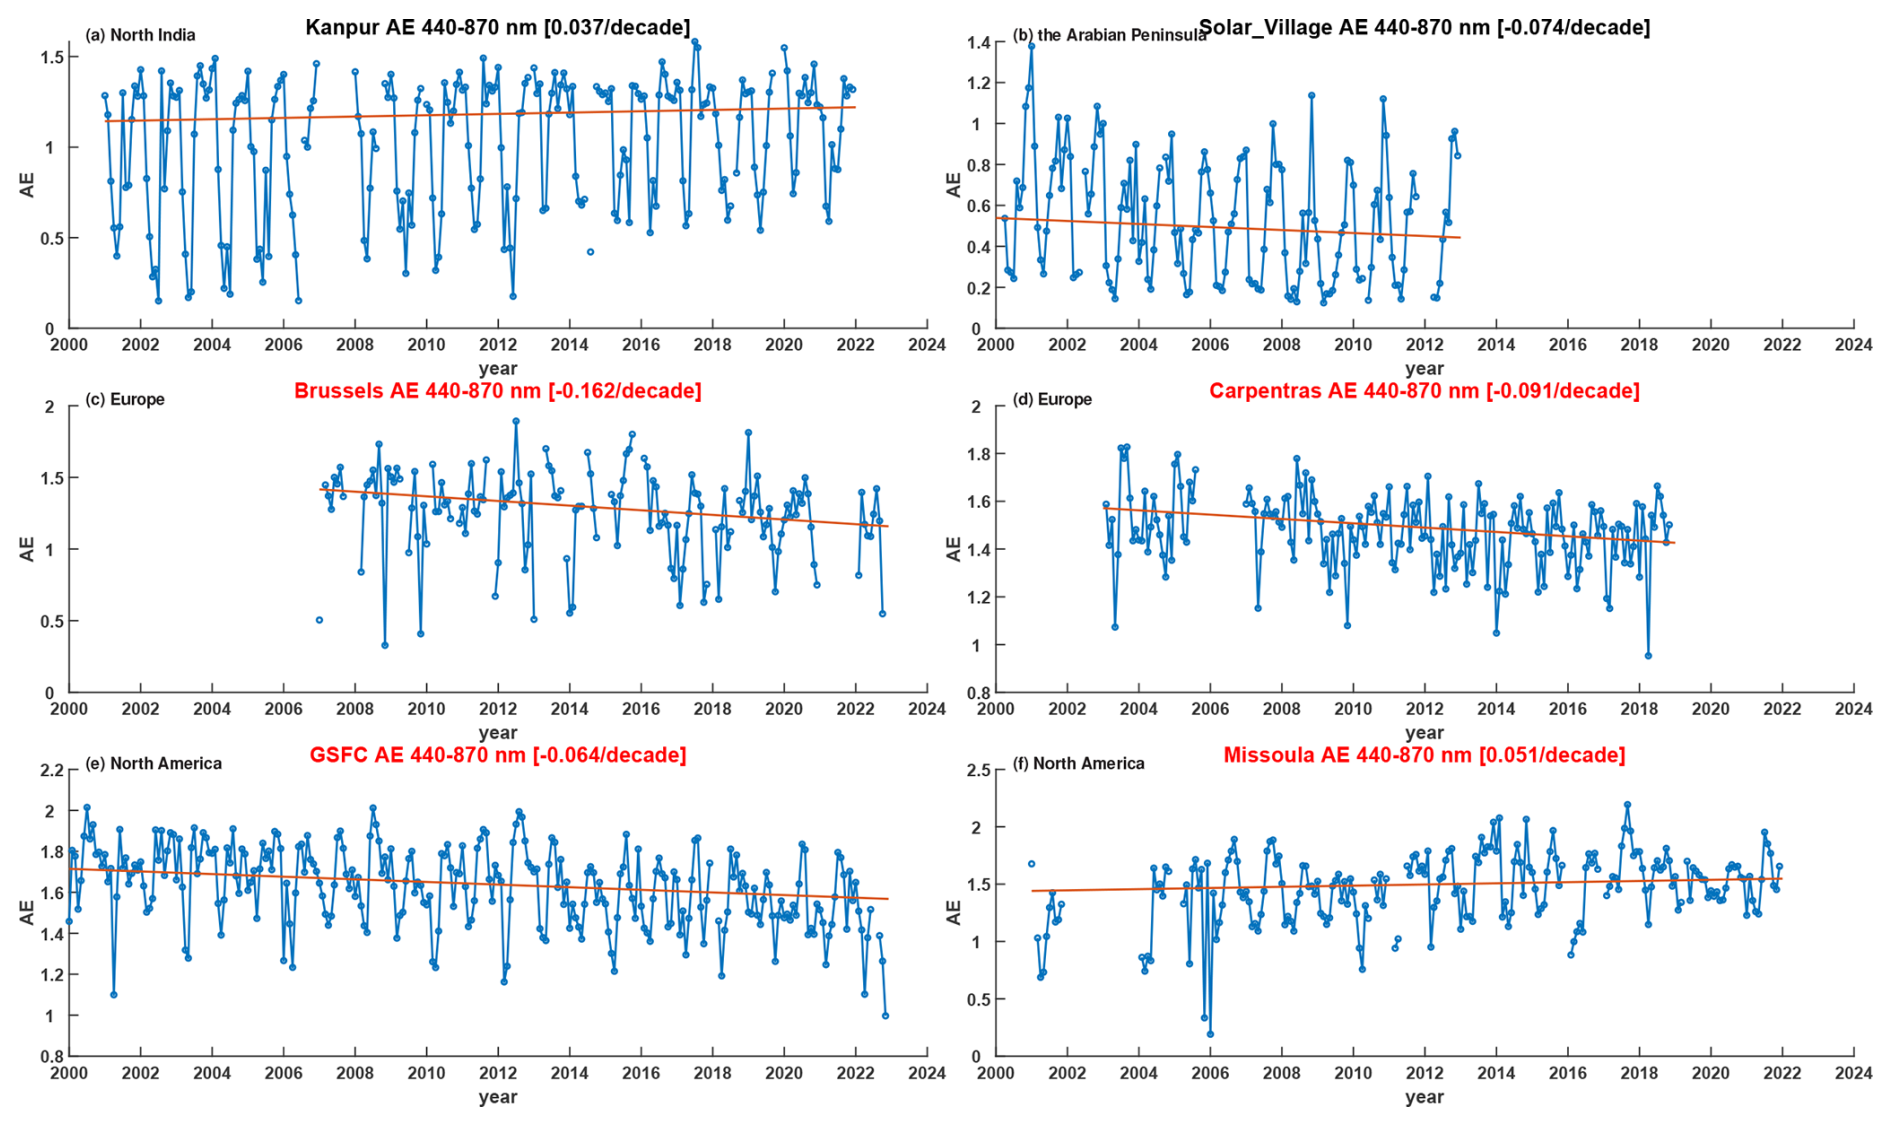
Figure 7Time series of AE at several representative AERONET stations. Red labels indicate trends at 90 % significance. Black labels indicate trends below 90 % significance. (a) Kanpur, (b) Solar_Village, (c) Brussels, (d) Carpentras, (e) GSFC, and (f) Missoula.
The points with black borders in Figs. 4 and 6 indicate that the seasonal trends at these sites are not homogeneous at the 80 % confidence level. This is largely attributed to the seasonal patterns of aerosol emissions and meteorological conditions. However, the spatial distribution of seasonal AOD440 (Fig. 8) and AE440_870 (Fig. 9) trends is generally similar to that of annual results with the same monotonicity despite the magnitude of the trends potentially varying by season. Certain stations also exhibit significant trends only during particular seasons. This variation in trend magnitude and significance accounts for the seasonal heterogeneity of AOD440 and AE440_870, while the consistent monotonicity across different seasons emphasizes that the overall changes in AOD440 and AE440_870 are uniform. Specifically, in Europe and North America, a greater number of stations exhibit significant AOD440 trends in MAM (Fig. 8a), with these trends exhibiting greater magnitude compared to other seasons. Three Arctic stations located in North America also exhibit significant negative AOD440 trends only in MAM. Conversely, AE440_870 trends found for Europe and North America are more pronounced and exhibit greater deviation from the annual results during DJF (Fig. 9d). This is because aerosol concentrations are typically higher in spring and lower in winter in the Northern Hemisphere (see Supplement), allowing for more substantial reductions in spring and more significant compositional variations in winter. However, AE440_870 trends during low-AOD seasons, such as the more pronounced AE440_870 trends in winter in the Northern Hemisphere, should be treated with caution because the uncertainty in AE440_870 becomes large under low-AOD conditions. In northern India, Kanpur only exhibits significant AOD440 trends during the post-monsoon (Fig. 8c) and winter (Fig. 8d), while significant AE440_870 trends predominantly occur in the pre-monsoon (Fig. 9a). We can find that AE440_870 values in northern India (Fig. 7a) significantly exceed 1.0 in the post-monsoon and winter, suggesting the predominance of fine-mode anthropogenic aerosols in these seasons. In contrast, AE440_870 values in the pre-monsoon and monsoon start at approximately 0.2–0.3 in the 2000s, emphasizing the dominance of coarse-mode aerosols, and have risen to about 0.7 in recent years, suggesting a largely increased fraction of fine-mode aerosols. The seasonal patterns of AOD and AE in South Asia have also been verified through multi-year observations (Adhikary et al., 2007; Kaskaoutis et al., 2012). During the pre-monsoon and monsoon seasons, higher wind speeds and stronger precipitation lead to stronger dust activity and higher wet scavenging of aerosols, whereas in the post-monsoon and winter the meteorological conditions become reversed, with weaker dust activity and less efficient wet removal of aerosols occurring (Moorthy and Babu, 2006; Henriksson et al., 2011). As a result, in the post-monsoon and winter, the increases in anthropogenic emissions, mainly post-monsoon crop residue burning and biofuel and fossil fuel burning in winter (Yin, 2020; Bhardwaj et al., 2015; Venkataraman et al., 2018), have a negligible impact on changes in aerosol compositions and AE440_870 values but would lead to the significant positive AOD440 trends under less efficient wet removal. On the other hand, in the pre-monsoon and monsoon, stronger wet scavenging of aerosols makes the AOD trend less pronounced, and the dominant aerosol type, dust, is mainly affected by natural variability (Kaskaoutis et al., 2012) and exhibits a negative trend (Pandey et al., 2017; Ramachandran and Rupakheti, 2022). Therefore, the increase in anthropogenic aerosols, i.e. biomass and biofuel burning emissions, fossil fuel emissions, and industry emissions (Venkataraman et al., 2018; Ramachandran and Rupakheti, 2022), does not have a significant impact on the total AOD440 in these two seasons, but it serves to increase the fine-mode fractions, leading to the insignificant AOD440 trends and significant positive AE440_870 trends.
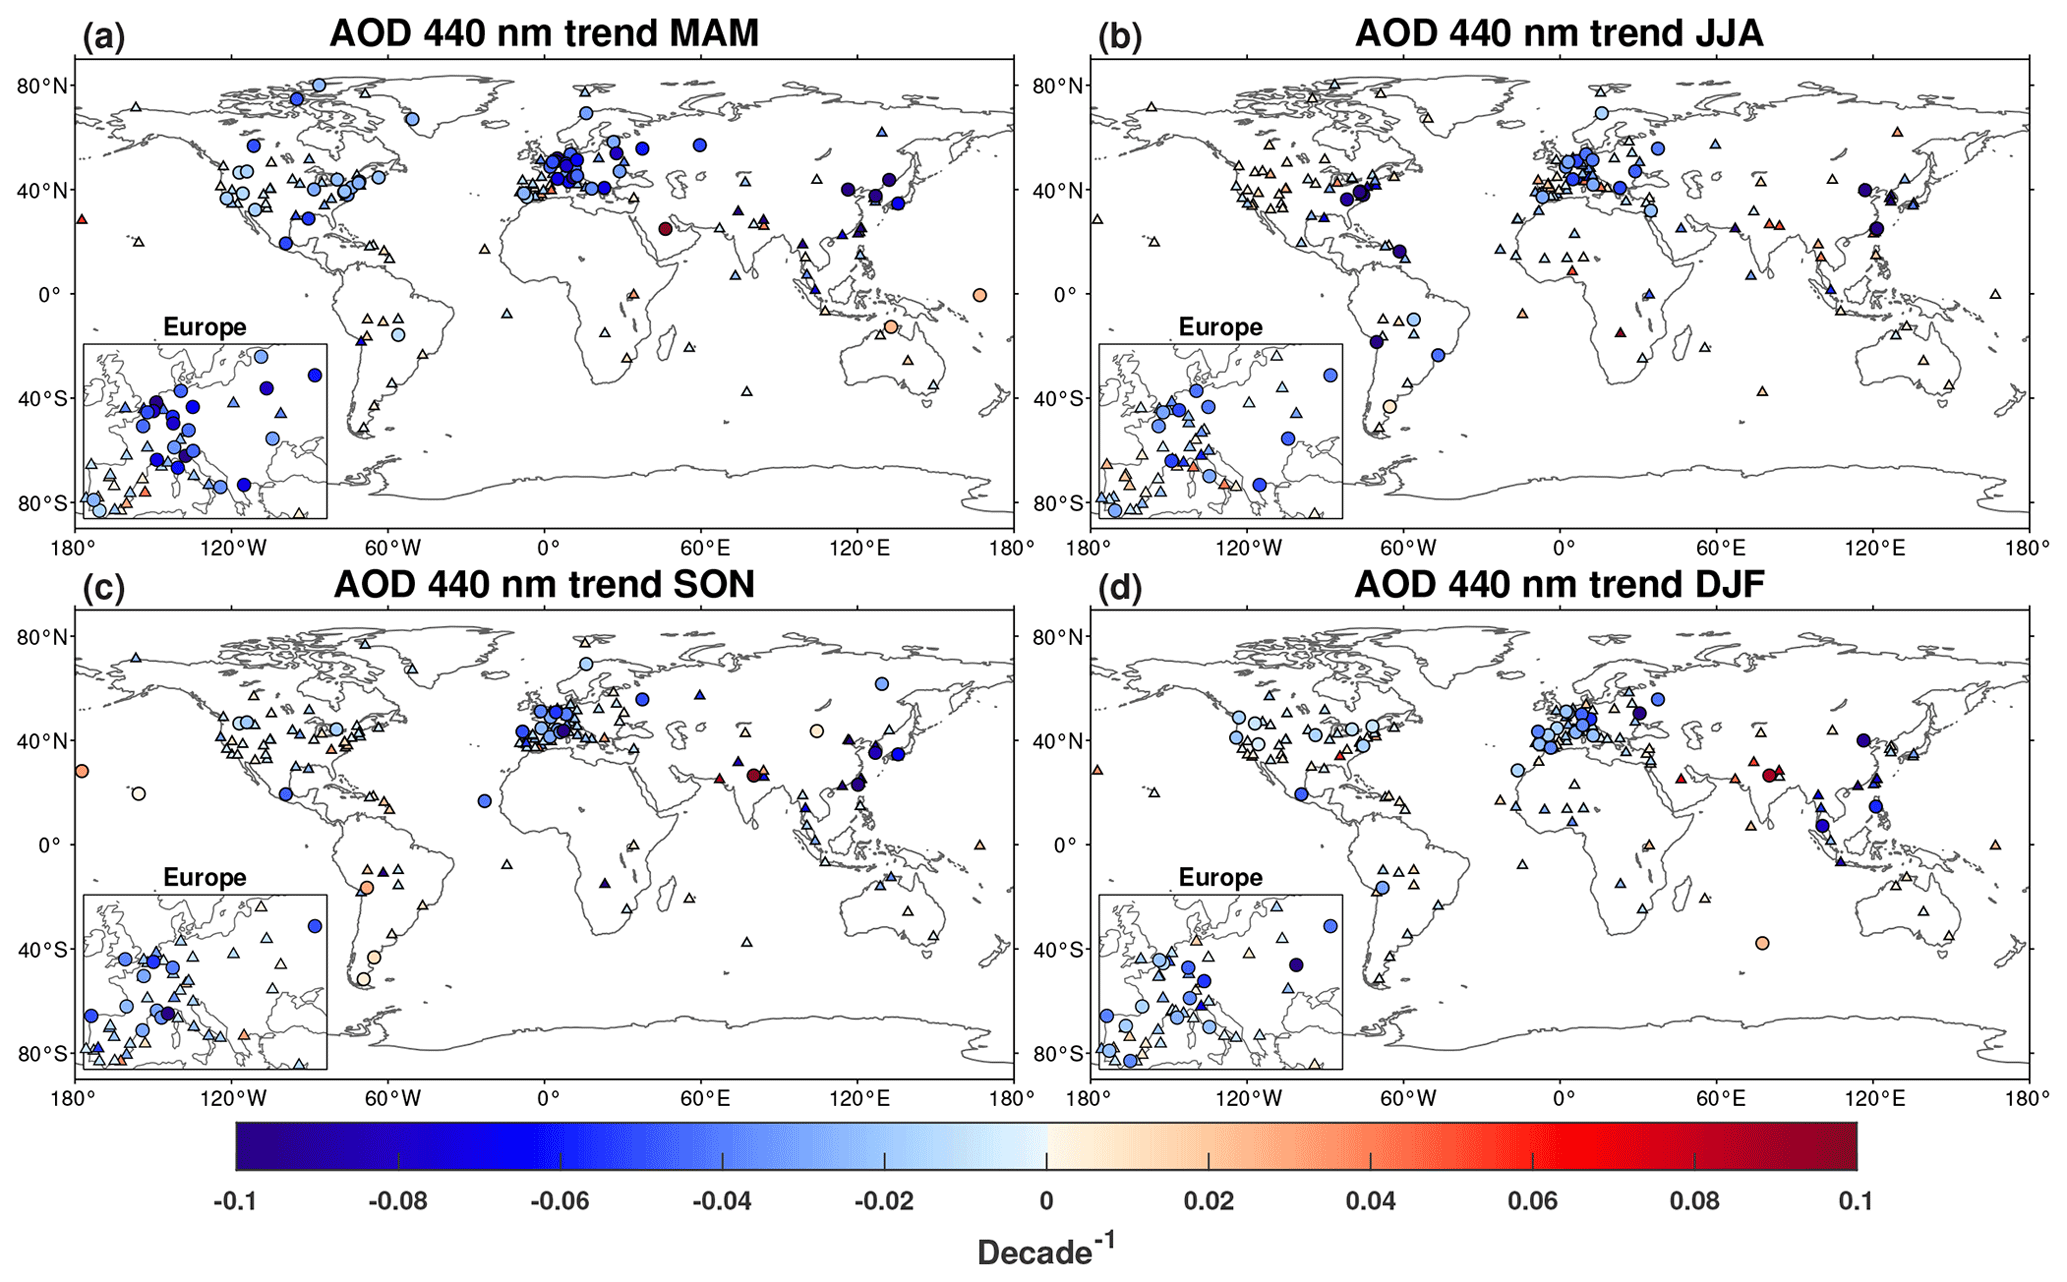
Figure 8Seasonal trends in 440 nm AOD at AERONET stations. Triangles indicate trends below 90 % significance level. Dots indicate trends at 90 % significance. The magnitude of the trend is per decade. (a) Pre-monsoon (South Asia, March–May), peak (the Arabian Peninsula, March–June), and spring (other sites, March–May). (b) Monsoon (South Asia, June–September), post-peak (the Arabian Peninsula, July–October), summer (West Africa, April–October), and summer (other sites, June–August). (c) Post-monsoon (South Asia, October–November) and autumn (other sites, September–November). (d) Winter (South Asia, December–February), pre-peak (the Arabian Peninsula, November–February), Harmattan (West Africa, November–March), and winter (other sites, December–February).
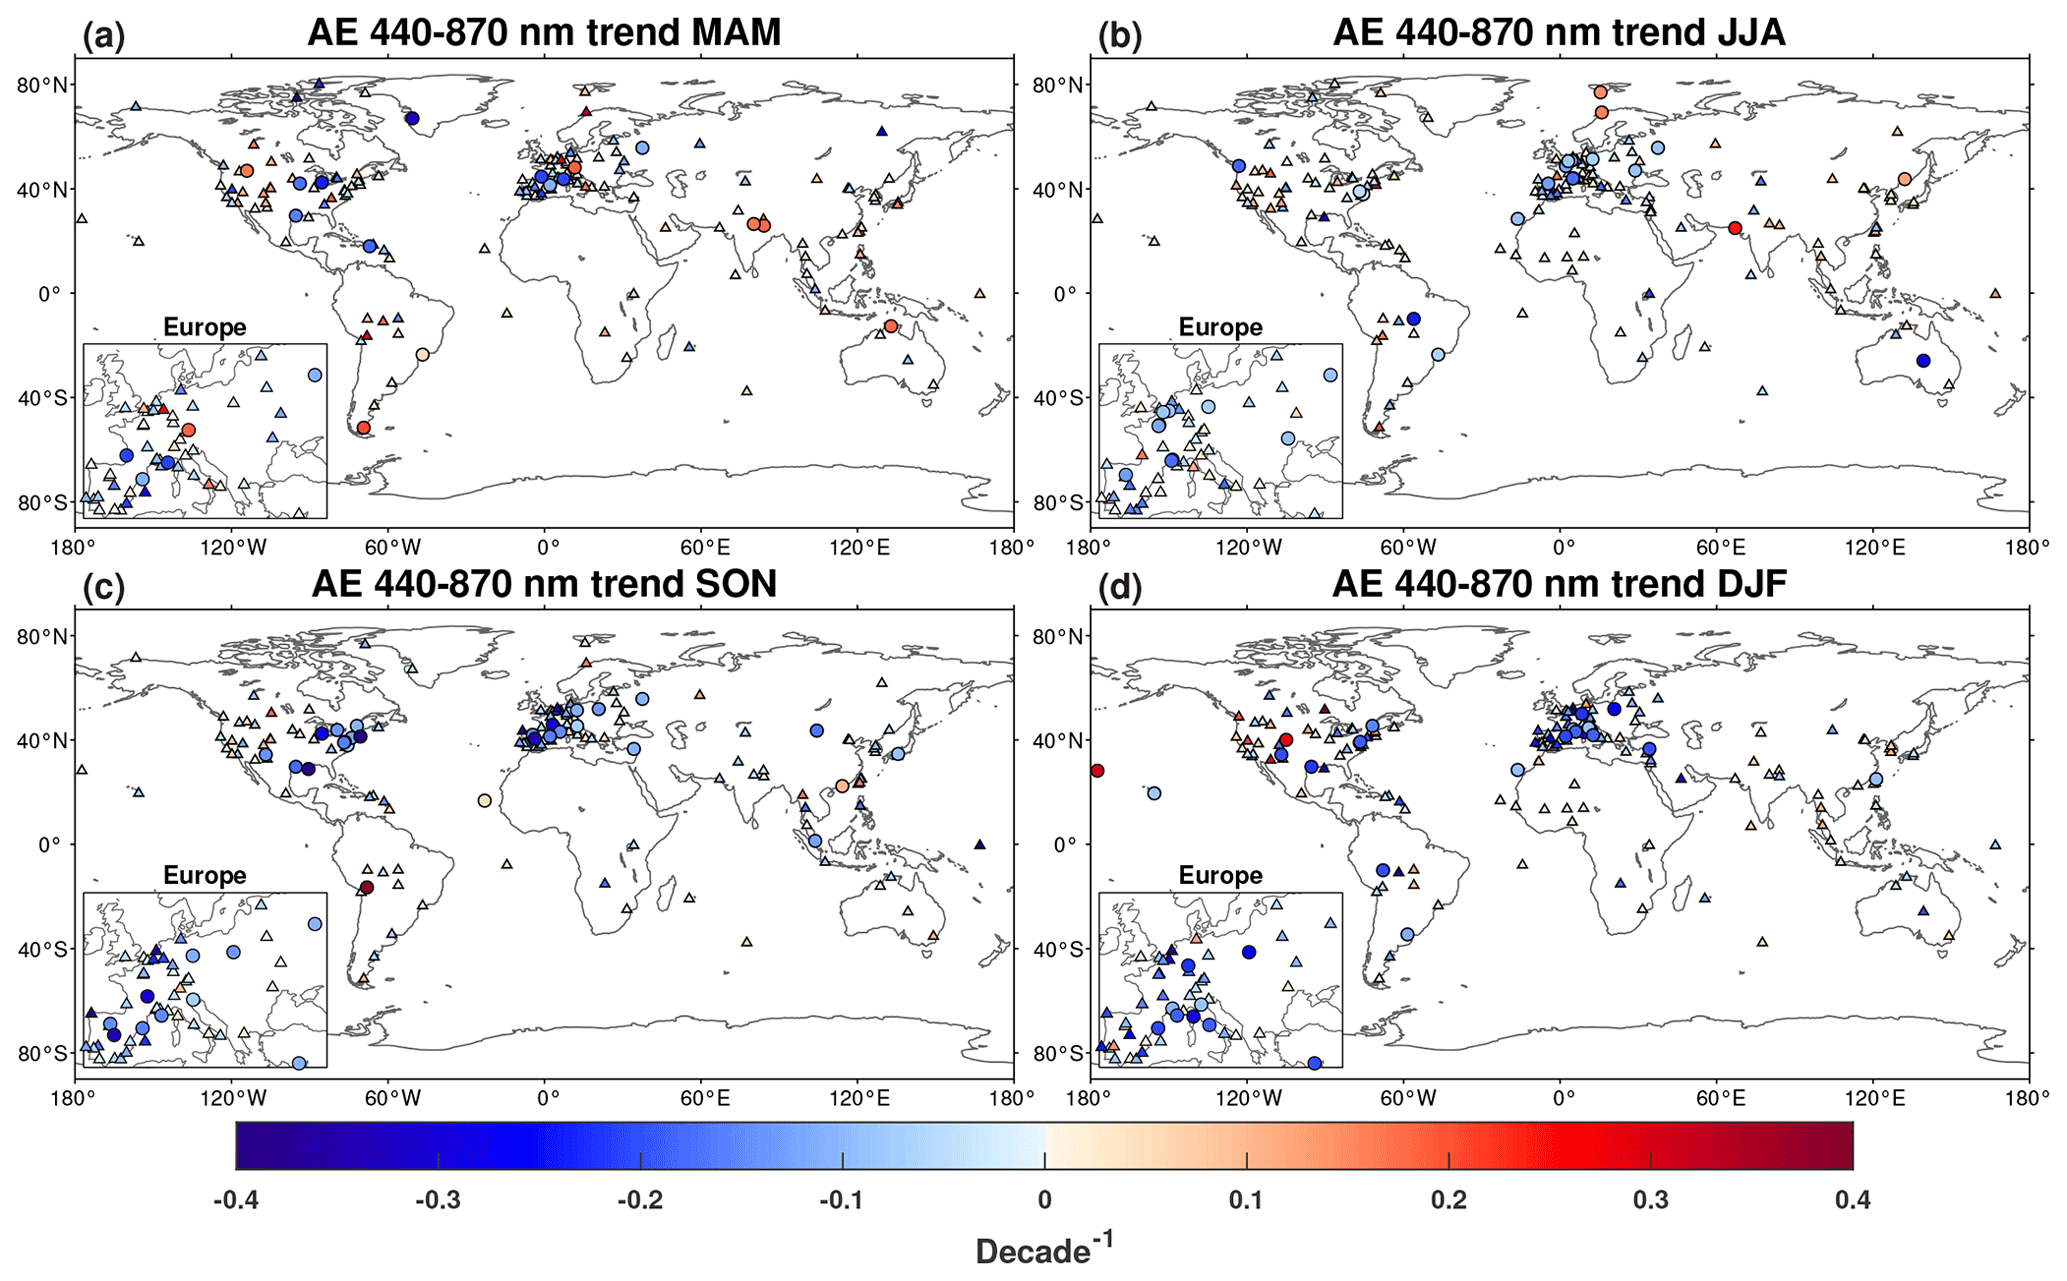
Figure 9Same as Fig. 8, but with trends in AE.
3.2 Trends for AAOD and SSA
Similar to AOD440, significant negative AAOD440 trends (Figs. 10, 11) are universally found for AERONET stations in the Northern Hemisphere, especially in East Asia, northern India, Europe, and North America, indicating reductions in absorbing species, mainly primary aerosols. Conversely, a significant positive AAOD440 trend is mainly found for Solar_Village in the Arabian Peninsula (Fig. 11d), suggesting increases in absorbing aerosols. The reductions in AAOD440 over East Asia, Europe, northern India, and North America are primarily attributed to declines in anthropogenic emissions, such as reduced black carbon (BC) and/or organic carbon (OC) emissions from fossil fuels (Ramachandran and Rupakheti, 2022; He et al., 2023; Li et al., 2024) because aerosols in these regions are mainly of the urban/industrial type (Li et al., 2016). Decreased dust emissions discussed in the previous section might also be a potential contributor to the negative AAOD440 trends in northern India and western North America (Shao et al., 2013; Zhang et al., 2019; Wang et al., 2021; Ramachandran and Rupakheti, 2022; Pandey et al., 2017), but the effect might not be as substantial as that of anthropogenic emissions, since dust is not the dominant type in these regions. The significant positive AAOD440 trend for Solar_Village in the Arabian Peninsula is likely attributed to increased dust loading. As dust mainly exhibits strong absorption for short wavelengths, AAOD trends at other channels with longer wavelengths might not be that significant.

Figure 10Same as Fig. 4, but with trends in AAOD.
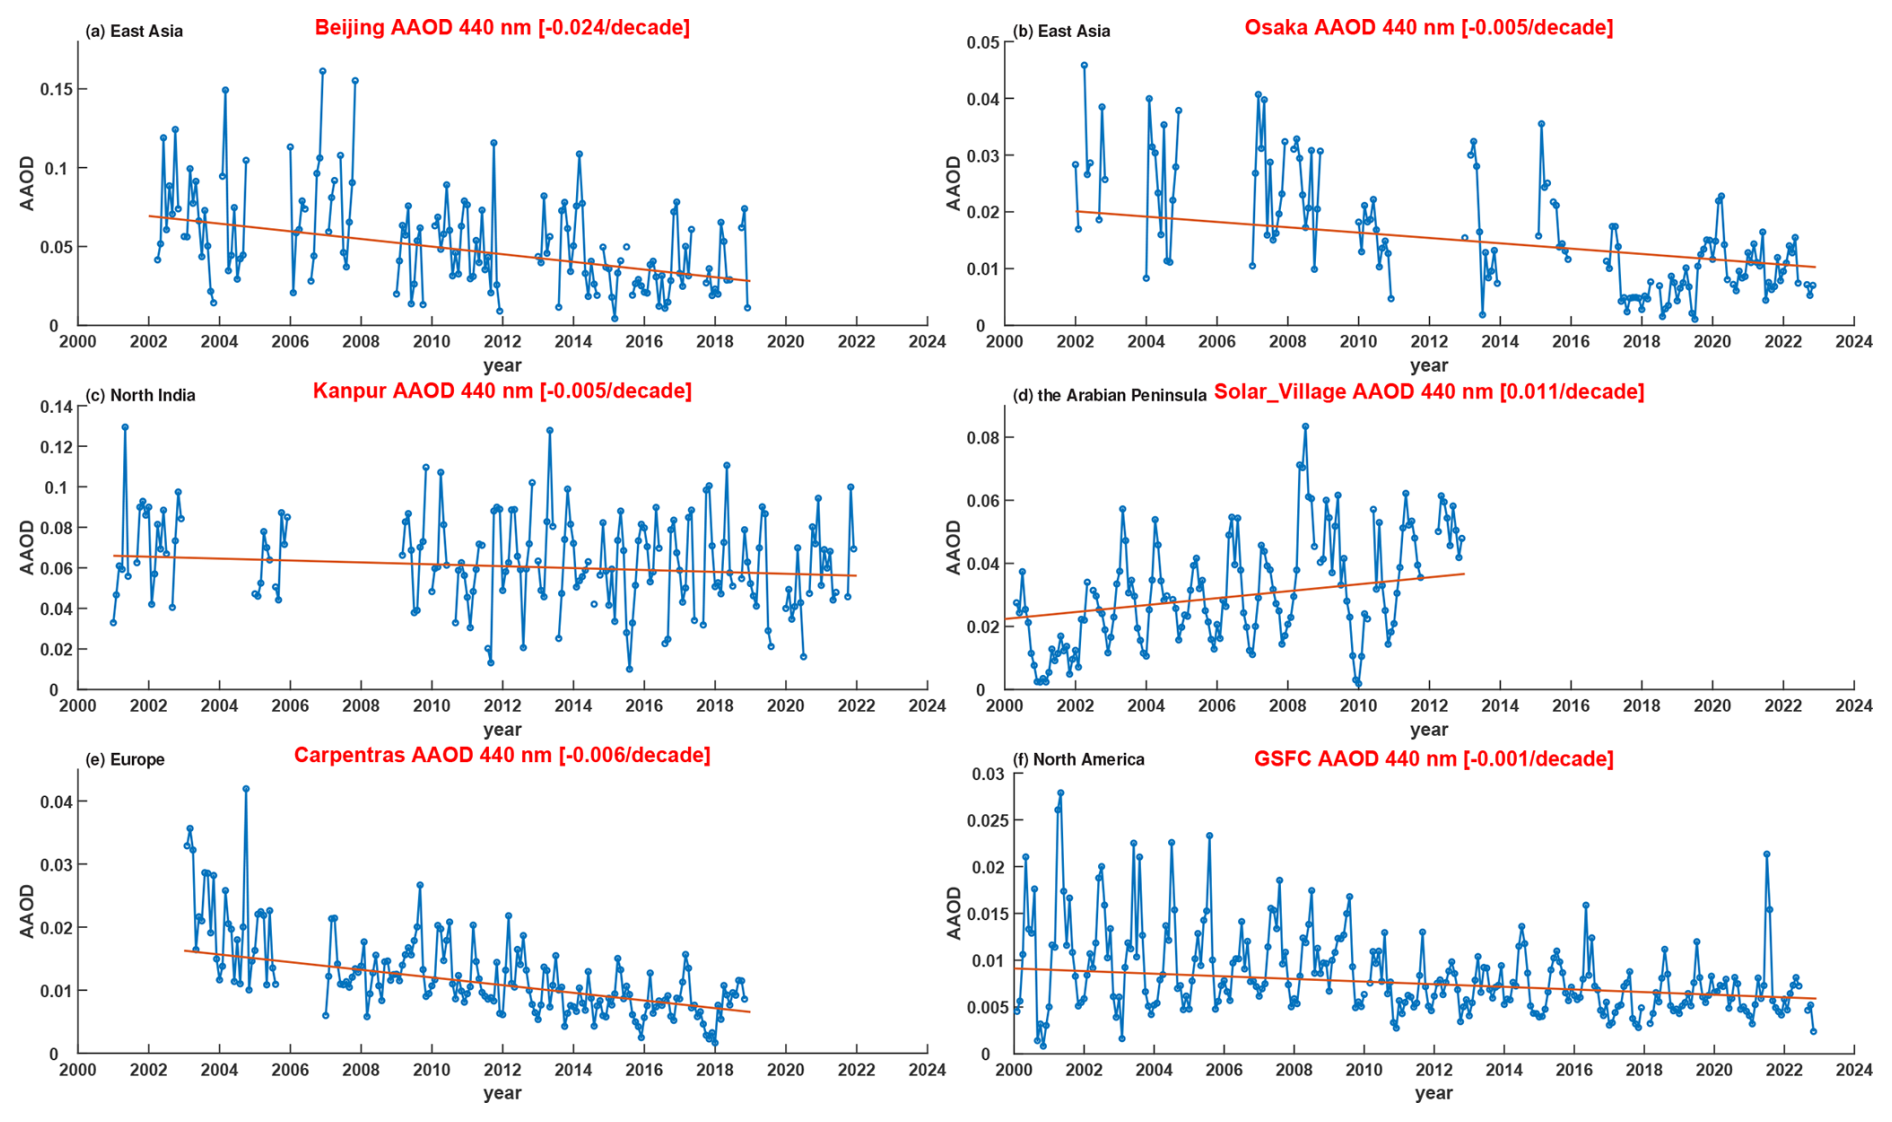
Figure 11Time series of 440 nm AAOD at several representative AERONET stations with trends at 90 % significance. (a) Beijing, (b) Osaka, (c) Kanpur, (d) Solar_Village, (e) Carpentras, and (f) GSFC.
The SSA440 trends (Figs. 12, 13) are generally opposite to the AAOD440 trends, with exceptions in some stations in central Europe and North America. Northern India, East Asia, and Europe primarily exhibit significant positive SSA440 trends, corresponding to a decrease in the fraction of absorbing aerosols over time. The increase in SSA440 in northern India is attributed to both the decrease in absorbing species and a more pronounced increase in scattering aerosols. For East Asia and Europe, the positive SSA440 trends suggest stronger reductions in absorbing species than scattering aerosols. SSA440 trends show large spatial heterogeneity in North America, and most stations do not exhibit significant trends. The positive SSA440 trends for some stations correlate with the reduction in absorbing aerosols. Negative SSA440 trends for other stations in North America and several stations in central Europe are likely attributed to a great reduction in scattering aerosols such as sulfates, thereby increasing the proportion of absorbing aerosols. This result aligns with Collaud Coen et al. (2020a), who also found SSA reductions in North America and central Europe through in situ measurements and attributed them to significant decreases in primarily scattering secondary aerosols. The substantial reductions in precursors of these scattering aerosols were also confirmed by satellite observations and emission inventories (Szymankiewicz et al., 2021; Fioletov et al., 2023; Krotkov et al., 2016; Tong et al., 2015). The significant negative SSA440 trend for Solar_Village (Fig. 13b) in the Arabian Peninsula is attributed to increases in absorbing dust aerosols.
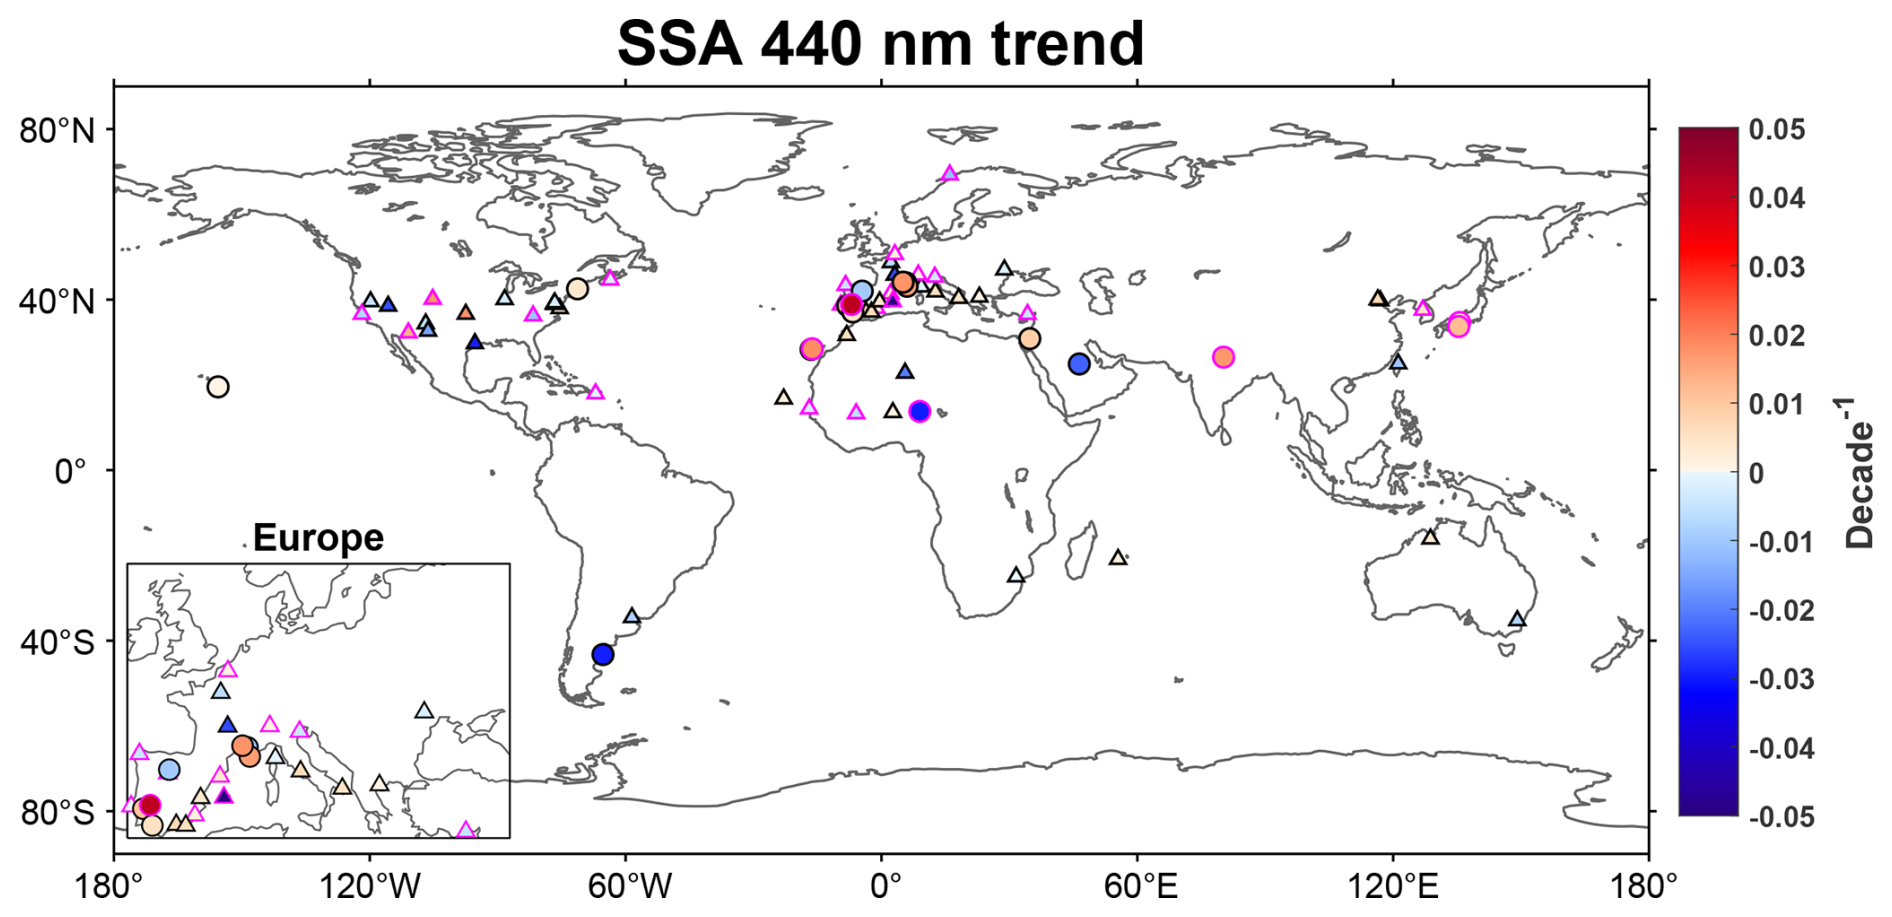
Figure 12Same as Fig. 4, but with trends in SSA.
Figure 13Time series of 440 nm SSA at several representative AERONET stations with trends at 90 % significance. (a) Kanpur, (b) Solar_Village, (c) Carpentras, and (d) Osaka.
The AAOD440 and SSA440 trends also exhibit pronounced seasonality, with half of the stations failing to pass the homogeneity test. However, the spatial patterns of seasonal AAOD440 (Fig. 14) and SSA440 (Fig. 15) trends are still similar to those of annual results. It is notable that Kanpur in northern India exhibits stronger negative AAOD440 trends during the monsoon (Fig. 14b) when dust is the dominant aerosol type, further verifying that the decreased AAOD440 is partly attributed to the decline in dust loading. As for SSA440, the significant positive trends for Kanpur are stronger during the post-monsoon and winter, indicating that the increased anthropogenic emissions in northern India are mainly scattering species.
Figure 14Same as Fig. 8, but with trends in AAOD.
Figure 15Same as Fig. 8, but with trends in SSA.
3.3 Aerosol type changes
To better explain the aerosol parameter changes, we make a further attempt to classify the measurements into six aerosol types, as described in Sect. 2.4, and examine the long-term changes in the loadings for each type. The global AOD440 trends in the six aerosol types are shown in Fig. 16.
Figure 16Same as Fig. 4, but with trends in AOD for six aerosol types: (a) dust, (b) mixture, (c) non-absorbing fine, (d) slightly absorbing fine, (e) moderately absorbing fine, and (f) highly absorbing fine.
A significant positive trend for the dust-type AOD is found for Solar_Village, suggesting increased dust activity over the Arabian Peninsula, which is consistent with the analysis in previous sections and other studies using satellite observations and AERONET measurements (Mehta et al., 2016; Habib et al., 2019; Sabetghadam et al., 2021; Al Otaibi et al., 2019; Li et al., 2014). We do not find significant trends over other dust sources, as dust loading can have strong decadal variability which often does not yield monotonic trends. A dust trend can also be difficult to detect when combined with fine-mode anthropogenic aerosols. The mixture type straddles the boundary between the dust type and fine-mode types and is affected by both coarse-mode and fine-mode particles. Significant negative AOD trends in the mixture type are mainly found over East Asia and Europe (Fig. 16b). Since East Asia and Europe are both dominated by fine-mode aerosols (Li et al., 2016; Zhang and Li, 2019), the decreased mixture aerosols are thus primarily due to reductions in fine-mode anthropogenic emissions.
The majority of stations in Europe, North America, and East Asia exhibit significant negative AOD trends in four fine-mode types (Fig. 16c–f), corresponding to the reduction in both absorbing and scattering anthropogenic emissions revealed by the reductions in AOD (Fig. 4) and AAOD (Fig. 10) in these regions. The great reduction in absorbing types (SA, MA, and HA) is also the possible reason for the increase in SSA (Fig. 12). It is notable that XiangHe in East Asia exhibits a significant positive trend in non-absorbing type (NA) and even larger negative trends in the absorbing types, suggesting a great reduction in BC and/or OC emissions which might potentially lead to a shift in the predominance of aerosol type in pollution events (Zhang and Li, 2019). Several stations in North America exhibit a greater reduction in non-absorbing aerosols than that in absorbing species, thus leading to a decrease in SSA (Fig. 12). Kanpur in northern India exhibits positive trends in SA aerosols and negative trends in the MA type. Compared to MA, the SA type is more scattering with a lower BC proportion. As fine-mode aerosols in Kanpur are initially absorbing types (Pandey et al., 2016), the increase in SA loading suggests a decreased proportion of BC, making the fine-mode aerosols in this region more scattering.
In this study, we investigate trends in aerosol optical parameters using AERONET measurements. Globally, a universal decrease in AOD and AAOD, along with an increase in SSA, is observed at the majority of AERONET stations. The result generally aligns with the previous trend analysis using AERONET Version 2 products ending in 2013 (Li et al., 2014), highlighting the continuity of these trends over time on a global scale. Although our analysis is based on measurements at ground-based stations, coherent spatial patterns over different stations could also indicate regional features, which have been demonstrated by satellite observations, model simulations, and emission inventories (Gupta et al., 2022; de Meij et al., 2012; Fioletov et al., 2023; Mishchenko et al., 2007; Wei et al., 2021b, a; Yoon et al., 2016). Despite only a limited number of stations passing the homogeneity test, the majority of regions exhibit consistent monotonic trends across different seasons for aerosol parameters analysed in this study. Taking advantage of longer records and improved station coverage, this study identifies more detailed regional trends and finds some new spatial patterns.
Spatially, significant negative AOD440 trends are universally observed across East Asia and Southeast Asia. The most substantial reduction in AOD440 occurs in East China, consistent with emission inventories (Kurokawa and Ohara, 2020). The AOD440 time series demonstrates that the pronounced decreases in aerosols within these regions are not coherent in the whole period, with aerosol loading increasing in the early 2000s and decreasing in the later years around 2008, which is also supported by satellite observations and model simulations (Fioletov et al., 2023; de Meij et al., 2012; Zhao et al., 2017; Krotkov et al., 2016; Mehta et al., 2016). This study also finds significant negative AAOD440 trends and positive SSA440 trends for East Asia, which are mainly attributed to decreased absorbing primary aerosols, in agreement with other independent studies utilizing AERONET data (Ramachandran and Rupakheti, 2022; Ramachandran et al., 2020; Tao et al., 2017; Yu et al., 2022; Eom et al., 2022).
Coherent significant decreases in AOD440 and AAOD440 found for Europe and North America are in good agreement with satellite observations (Mehta et al., 2016; Zhao et al., 2017; Krotkov et al., 2016; Fioletov et al., 2023) as well as in situ measurements of recent aerosol absorbing and scattering trends (Collaud Coen et al., 2020a). However, the time series reveals diminished rates in the aerosol reduction in these regions. The decrease in anthropogenic emissions in Europe and North America started in the previous century and has led to a significant reduction in aerosol loading (de Meij et al., 2012; Szymankiewicz et al., 2021; Rafaj et al., 2013), resulting in a diminished rate of reduction in aerosol and aerosol precursor emissions over the last decade (Krotkov et al., 2016; Fioletov et al., 2023; Jiang et al., 2018). The observed decline in AE440_870 and increase in SSA440 in Europe are also in line with previous studies and suggest reductions in anthropogenic emissions (Li et al., 2014; Xia, 2011). Significant negative AE440_870 trends are found for eastern North America, likely attributed to a decline in anthropogenic emissions. Western North America exhibits positive AE440_870 trends, which are likely related to reductions in dust emissions and increases in biomass burning emissions, consistent with dust monitoring results (Aryal and Evans, 2022) and trends in western North America forest fires (Eck et al., 2023; Iglesias et al., 2022). Negative SSA440 trends are found for some stations over North America and central Europe, consistent with those from in situ measurements conducted over similar periods (Collaud Coen et al., 2020a), suggesting a larger decline in scattering aerosols than absorbing species.
Positive AOD440 and AE440_870 trends are found over northern India, highlighting an increase in fine-mode aerosols. We also find a significant negative AAOD440 trend and a positive SSA440 trend for Kanpur, indicating decreases in absorbing aerosols in this region. We further attribute this change to both decreased anthropogenic BC emissions and decreased dust loading according to seasonal trend analysis and aerosol type analysis, consistent with previous studies (Pandey et al., 2016, 2017; Ramachandran and Rupakheti, 2022). These trends align with independent studies utilizing AERONET measurements (Ramachandran and Rupakheti, 2022; Kumar et al., 2022; Kaskaoutis et al., 2012) and satellite observations (Ramachandran et al., 2020; Kaskaoutis et al., 2011), together verifying the alteration of aerosol compositions and suggesting that the increased aerosols are mainly scattering fine-mode species. The trends over northern India exhibit strong seasonality, with significant positive AOD440 trends in the post-monsoon and winter when anthropogenic aerosols are predominant and decreased AAOD440 and increased AE440_870 during the pre-monsoon and monsoon when dust loading is stronger, suggesting that these seasonal trends may be associated with the seasonal cycle of aerosol emissions and meteorological conditions.
The AERONET products for Solar_Village end in 2013; therefore the trends in these aerosol optical parameters are the same as those reported by Li et al. (2014), with positive AOD440 and AAOD440 trends and negative AE440_870 and SSA440 trends, which is probably due to the increased dust activity in the Arabian Peninsula and was also demonstrated in previous studies (Al Otaibi et al., 2019; Habib et al., 2019).
As a further step, we classify the aerosol observations into six types using FMF550 and SSA440 and examine the changes in aerosol loadings of each type. The trends for different aerosol types further verify the trends in AERONET parameters and offer insights into aerosol composition changes. We only find a significant positive dust loading trend in the Arabian Peninsula. Significant trends mainly concentrate on fine-mode types, with declines in both absorbing types and the non-absorbing type globally, consistent with the negative AOD440 and AAOD440 trends. Spatially, the majority of stations in East Asia and Europe exhibit stronger reductions in absorbing aerosols than those in non-absorbing types, whereas in eastern North America the reduction in AOD440 is mainly attributed to non-absorbing species. The results can fully explain the changes in SSA440, which exhibit positive trends over East Asia and Europe and negative trends over eastern North America. The Positive SA loading trend and the negative SA loading trend found in northern India suggest a decrease in BC proportion which leads to increased SSA440.
This study provides insights into temporal variations in aerosol loading, optical properties, and aerosol types. Decreases in AOD across Europe, North America, and East Asia reflect the effectiveness of emission control policies implemented in these regions. For instance, there has been a significant reduction in AOD over China in the past decade due to the Air Pollution Prevention and Control Action Plan (Gupta et al., 2022; Zhao et al., 2017). Conversely, the increase in AOD over northern India and the Arabian Peninsula indicates deteriorating air quality, posing potential risks to public health. The substantial changes in SSA and AAOD observed in many regions are of concern for climate models due to their critical relationship with aerosol climate effects, potentially influencing regional energy budgets, atmospheric circulation, the water cycle, etc. Previous studies have indicated that failure to capture the increase in SSA over northern India in climate models likely contributed to their biases in simulating the negative precipitation trend in this region (Ying et al., 2023). Furthermore, trends in aerosol properties and types are crucial for satellite remote sensing applications, as many algorithms rely on assumed aerosol models clustered from AERONET observations. Updating these models to reflect changes in aerosol types may be necessary (Zhang et al., 2024).
It is important to note that our analysis extends through 2022, encompassing the COVID-19 pandemic. Previous studies have documented significant reductions in aerosol loading and notable changes in aerosol compositions due to decreased anthropogenic emissions in regions implementing lockdown policies, such as East Asia, Europe, and North America (Cao et al., 2021; Clemente et al., 2022; Liang et al., 2023; Sokhi et al., 2021). We observed abnormally low AOD values at certain stations during this period, including XiangHe and Chen-Kung_Univ (Fig. 5b, d). This could potentially lead to a negative bias in AOD trends and contribute to discrepancies between it and other research on aerosol trends at these stations. However, since this period accounts for only about 10 % of our total study period and many stations lack Level 2.0 records for this time, the impact on trend analysis by COVID-19 is likely minimal at the majority of the stations.
The main purpose of this work is to update the trends in aerosol parameters with larger number of stations and longer records with respect to Li et al. (2014). We do note remarkable changes in aerosol trends over regions such as East Asia and the Southern Hemisphere, whereas patterns in other regions remain relatively stable. Most additional stations in this study are located in Europe and North America, where the distribution of stations is already dense enough to deduce general features of aerosol trends in these regions. We still lack insights into aerosol trends across other regions, including Asia, Africa, South America, Australia, and the polar and oceanic regions where the spatial coverage of stations is insufficient, and some stations such as Solar_Village do not have Level 2.0 data for recent years. There is still a need to establish more stations in Asia and the Southern Hemisphere to better capture the rapid change in aerosol properties there.
The 3PW code used in this study is available at https://github.com/mannkendall (last access: 1 April 2025, Collaud Coen et al., 2020b). Other codes utilized in this study can be obtained from the corresponding author upon reasonable request.
The AERONET data used in this study are available at https://aeronet.gsfc.nasa.gov/ (last access: 1 April 2025, Holben et al., 1998).
The supplement related to this article is available online at https://doi.org/10.5194/acp-25-4617-2025-supplement.
JL designed the research. TE, PG, BH, OD, and EL gathered the datasets and applied additional quality assurance and control to the data. ZZ selected the stations with long-term records, computed the trends, and analysed the results. ZZ and JL prepared the manuscript draft. YD, TE, PG, SNT, and JK reviewed and edited the manuscript. All the other co-authors contributed to the measurements of aerosol optical properties applied in this work and to the manuscript review.
The contact author has declared that none of the authors has any competing interests.
Publisher’s note: Copernicus Publications remains neutral with regard to jurisdictional claims made in the text, published maps, institutional affiliations, or any other geographical representation in this paper. While Copernicus Publications makes every effort to include appropriate place names, the final responsibility lies with the authors.
We gratefully thank the AERONET team, especially the PIs and Co-Is and their staff of the 165 selected stations, for establishing and maintaining the sites and providing the data used in this study. The AERONET data are obtained from the AERONET website: https://aeronet.gsfc.nasa.gov/ (last access: 1 April 2025). This study is funded by the National Key Research and Development Program of China (grant no. 2023YFF0805401) and the National Natural Science Foundation of China (NSFC) (grant nos. 42175144 and 42375121).
This research has been supported by the National Key Research and Development Program of China (grant no. 2023YFF0805401) and the National Natural Science Foundation of China (grant nos. 42175144 and 42375121).
This paper was edited by Stelios Kazadzis and reviewed by Martine Collaud Coen and one anonymous referee.
Adhikary, B., Carmichael, G. R., Tang, Y., Leung, L. R., Qian, Y., Schauer, J. J., Stone, E. A., Ramanathan, V., and Ramana, M. V.: Characterization of the seasonal cycle of south Asian aerosols: A regional‐scale modeling analysis, J. Geophys. Res.-Atmos., 112, D22S22, https://doi.org/10.1029/2006jd008143, 2007. a
Al Otaibi, M., Farahat, A., Tawabini, B., Omar, M. H., Ramadan, E., Abuelgasim, A., and P. Singh, R.: Long-Term Aerosol Trends and Variability over Central Saudi Arabia Using Optical Characteristics from Solar Village AERONET Measurements, Atmosphere, 10, 752, https://doi.org/10.3390/atmos10120752, 2019. a, b
Ångström, A.: On the Atmospheric Transmission of Sun Radiation and on Dust in the Air, Geografiska Annaler, 11, 156, https://doi.org/10.2307/519399, 1929. a
Aryal, Y. and Evans, S.: Decreasing Trends in the Western US Dust Intensity With Rareness of Heavy Dust Events, J. Geophys. Res.-Atmos., 127, e2021JD036163, https://doi.org/10.1029/2021jd036163, 2022. a
Balarabe, M., Abdullah, K., and Nawawi, M.: Seasonal Variations of Aerosol Optical Properties and Identification of Different Aerosol Types Based on AERONET Data over Sub-Sahara West-Africa, Atmospheric and Climate Sciences, 6, 13–28, https://doi.org/10.4236/acs.2016.61002, 2016. a
Bhardwaj, P., Naja, M., Kumar, R., and Chandola, H. C.: Seasonal, interannual, and long-term variabilities in biomass burning activity over South Asia, Environ. Sci. Pollut. Res., 23, 4397–4410, https://doi.org/10.1007/s11356-015-5629-6, 2015. a
Breider, T. J., Mickley, L. J., Jacob, D. J., Ge, C., Wang, J., Payer Sulprizio, M., Croft, B., Ridley, D. A., McConnell, J. R., Sharma, S., Husain, L., Dutkiewicz, V. A., Eleftheriadis, K., Skov, H., and Hopke, P. K.: Multidecadal trends in aerosol radiative forcing over the Arctic: Contribution of changes in anthropogenic aerosol to Arctic warming since 1980, J. Geophys. Res.-Atmos., 122, 3573–3594, https://doi.org/10.1002/2016JD025321, 2017. a
Cao, Y., Shao, L., Jones, T., Oliveira, M. L., Ge, S., Feng, X., Silva, L. F., and BéruBé, K.: Multiple relationships between aerosol and COVID-19: A framework for global studies, Gondwana Res., 93, 243–251, https://doi.org/10.1016/j.gr.2021.02.002, 2021. a
Clemente, A., Yubero, E., Nicolás, J. F., Caballero, S., Crespo, J., and Galindo, N.: Changes in the concentration and composition of urban aerosols during the COVID-19 lockdown, Environ. Res., 203, 111788, https://doi.org/10.1016/j.envres.2021.111788, 2022. a
Collaud Coen, M., Andrews, E., Alastuey, A., Arsov, T. P., Backman, J., Brem, B. T., Bukowiecki, N., Couret, C., Eleftheriadis, K., Flentje, H., Fiebig, M., Gysel-Beer, M., Hand, J. L., Hoffer, A., Hooda, R., Hueglin, C., Joubert, W., Keywood, M., Kim, J. E., Kim, S.-W., Labuschagne, C., Lin, N.-H., Lin, Y., Lund Myhre, C., Luoma, K., Lyamani, H., Marinoni, A., Mayol-Bracero, O. L., Mihalopoulos, N., Pandolfi, M., Prats, N., Prenni, A. J., Putaud, J.-P., Ries, L., Reisen, F., Sellegri, K., Sharma, S., Sheridan, P., Sherman, J. P., Sun, J., Titos, G., Torres, E., Tuch, T., Weller, R., Wiedensohler, A., Zieger, P., and Laj, P.: Multidecadal trend analysis of in situ aerosol radiative properties around the world, Atmos. Chem. Phys., 20, 8867–8908, https://doi.org/10.5194/acp-20-8867-2020, 2020a. a, b, c, d
Collaud Coen, M., Andrews, E., Bigi, A., Martucci, G., Romanens, G., Vogt, F. P. A., and Vuilleumier, L.: Effects of the prewhitening method, the time granularity, and the time segmentation on the Mann–Kendall trend detection and the associated Sen's slope, Atmos. Meas. Tech., 13, 6945–6964, https://doi.org/10.5194/amt-13-6945-2020, 2020b (code available at: https://github.com/mannkendall, last access: 1 April 2025). a, b, c, d
de Meij, A., Pozzer, A., and Lelieveld, J.: Trend analysis in aerosol optical depths and pollutant emission estimates between 2000 and 2009, Atmos. Environ., 51, 75–85, https://doi.org/10.1016/j.atmosenv.2012.01.059, 2012. a, b, c, d, e, f
Dubovik, O. and King, M. D.: A flexible inversion algorithm for retrieval of aerosol optical properties from Sun and sky radiance measurements, J. Geophys. Res.-Atmos., 105, 20673–20696, https://doi.org/10.1029/2000jd900282, 2000. a
Dubovik, O., Holben, B., Eck, T. F., Smirnov, A., Kaufman, Y. J., King, M. D., Tanré, D., and Slutsker, I.: Variability of Absorption and Optical Properties of Key Aerosol Types Observed in Worldwide Locations, J. Atmos. Sci., 59, 590–608, https://doi.org/10.1175/1520-0469(2002)059<0590:voaaop>2.0.co;2, 2002. a, b
Eck, T. F., Holben, B. N., Reid, J. S., Dubovik, O., Smirnov, A., O'Neill, N. T., Slutsker, I., and Kinne, S.: Wavelength dependence of the optical depth of biomass burning, urban, and desert dust aerosols, J. Geophys. Res.-Atmos., 104, 31333–31349, https://doi.org/10.1029/1999jd900923, 1999. a, b, c, d
Eck, T. F., Holben, B. N., Reid, J. S., Sinyuk, A., Giles, D. M., Arola, A., Slutsker, I., Schafer, J. S., Sorokin, M. G., Smirnov, A., LaRosa, A. D., Kraft, J., Reid, E. A., O’Neill, N. T., Welton, E., and Menendez, A. R.: The extreme forest fires in California/Oregon in 2020: Aerosol optical and physical properties and comparisons of aged versus fresh smoke, Atmos. Environ., 305, 119798, https://doi.org/10.1016/j.atmosenv.2023.119798, 2023. a, b
Eom, S., Kim, J., Lee, S., Holben, B. N., Eck, T. F., Park, S.-B., and Park, S. S.: Long-term variation of aerosol optical properties associated with aerosol types over East Asia using AERONET and satellite (VIIRS, OMI) data (2012–2019), Atmos. Res., 280, 106457, https://doi.org/10.1016/j.atmosres.2022.106457, 2022. a, b, c
Farahat, A., El-Askary, H., Adetokunbo, P., and Fuad, A.-T.: Analysis of aerosol absorption properties and transport over North Africa and the Middle East using AERONET data, Ann. Geophys., 34, 1031–1044, https://doi.org/10.5194/angeo-34-1031-2016, 2016. a
Fioletov, V. E., McLinden, C. A., Griffin, D., Abboud, I., Krotkov, N., Leonard, P. J. T., Li, C., Joiner, J., Theys, N., and Carn, S.: Version 2 of the global catalogue of large anthropogenic and volcanic SO2 sources and emissions derived from satellite measurements, Earth Syst. Sci. Data, 15, 75–93, https://doi.org/10.5194/essd-15-75-2023, 2023. a, b, c, d, e, f, g
Giles, D. M., Holben, B. N., Eck, T. F., Sinyuk, A., Smirnov, A., Slutsker, I., Dickerson, R. R., Thompson, A. M., and Schafer, J. S.: An analysis of AERONET aerosol absorption properties and classifications representative of aerosol source regions, J. Geophys. Res.-Atmos., 117, D17203, https://doi.org/10.1029/2012jd018127, 2012. a, b
Giles, D. M., Sinyuk, A., Sorokin, M. G., Schafer, J. S., Smirnov, A., Slutsker, I., Eck, T. F., Holben, B. N., Lewis, J. R., Campbell, J. R., Welton, E. J., Korkin, S. V., and Lyapustin, A. I.: Advancements in the Aerosol Robotic Network (AERONET) Version 3 database – automated near-real-time quality control algorithm with improved cloud screening for Sun photometer aerosol optical depth (AOD) measurements, Atmos. Meas. Tech., 12, 169–209, https://doi.org/10.5194/amt-12-169-2019, 2019. a, b, c, d, e
Ginoux, P., Prospero, J. M., Gill, T. E., Hsu, N. C., and Zhao, M.: Global‐scale attribution of anthropogenic and natural dust sources and their emission rates based on MODIS Deep Blue aerosol products, Rev. Geophys., 50, RG3005, https://doi.org/10.1029/2012rg000388, 2012. a
Gupta, G., Venkat Ratnam, M., Madhavan, B., and Narayanamurthy, C.: Long-term trends in Aerosol Optical Depth obtained across the globe using multi-satellite measurements, Atmos. Environ., 273, 118953, https://doi.org/10.1016/j.atmosenv.2022.118953, 2022. a, b, c, d, e
Habib, A., Chen, B., Khalid, B., Tan, S., Che, H., Mahmood, T., Shi, G., and Butt, M. T.: Estimation and inter-comparison of dust aerosols based on MODIS, MISR and AERONET retrievals over Asian desert regions, J. Environ. Sci., 76, 154–166, https://doi.org/10.1016/j.jes.2018.04.019, 2019. a, b, c
Hansen, J., Sato, M., and Ruedy, R.: Radiative forcing and climate response, J. Geophys. Res.-Atmos., 102, 6831–6864, https://doi.org/10.1029/96jd03436, 1997. a
He, C., Niu, X., Ye, Z., Wu, Q., Liu, L., Zhao, Y., Ni, J., Li, B., and Jin, J.: Black carbon pollution in China from 2001 to 2019: Patterns, trends, and drivers, Environ. Pollut., 324, 121381, https://doi.org/10.1016/j.envpol.2023.121381, 2023. a
Henriksson, S. V., Laaksonen, A., Kerminen, V.-M., Räisänen, P., Järvinen, H., Sundström, A.-M., and de Leeuw, G.: Spatial distributions and seasonal cycles of aerosols in India and China seen in global climate-aerosol model, Atmos. Chem. Phys., 11, 7975–7990, https://doi.org/10.5194/acp-11-7975-2011, 2011. a
Hirsch, R. M. and Slack, J. R.: A Nonparametric Trend Test for Seasonal Data With Serial Dependence, Water Resour. Res., 20, 727–732, https://doi.org/10.1029/wr020i006p00727, 1984. a
Hirsch, R. M., Slack, J. R., and Smith, R. A.: Techniques of trend analysis for monthly water quality data, Water Resour. Res., 18, 107–121, https://doi.org/10.1029/wr018i001p00107, 1982. a
Holben, B. N., Eck, T. F., Slutsker, I., Tanré, D., Buis, J. P., Setzer, A., Vermote, E., Reagan, J. A., Kaufman, Y. J., Nakajima, T., Lavenu, F., Jankowiak, I., and Smirnov, A.: AERONET – A Federated Instrument Network and Data Archive for Aerosol Characterization, Remote Sens. Environ., 66, 1–16, https://doi.org/10.1016/S0034-4257(98)00031-5, 1998 (data available at: https://aeronet.gsfc.nasa.gov/, last access: 1 April 2025). a, b, c
Holben, B. N., Eck, T. F., Slutsker, I., Smirnov, A., Sinyuk, A., Schafer, J., Giles, D., and Dubovik, O.: Aeronet’s Version 2.0 quality assurance criteria, in: Remote Sensing of the Atmosphere and Clouds, edited by: Tsay, S.-C., Nakajima, T., Singh, R. P., and Sridharan, R., SPIE, ISSN 0277-786X, https://doi.org/10.1117/12.706524, 2006. a
Hsu, N. C., Gautam, R., Sayer, A. M., Bettenhausen, C., Li, C., Jeong, M. J., Tsay, S.-C., and Holben, B. N.: Global and regional trends of aerosol optical depth over land and ocean using SeaWiFS measurements from 1997 to 2010, Atmos. Chem. Phys., 12, 8037–8053, https://doi.org/10.5194/acp-12-8037-2012, 2012. a
Iglesias, V., Balch, J. K., and Travis, W. R.: U.S. fires became larger, more frequent, and more widespread in the 2000s, Science Advances, 8,eabc0020, https://doi.org/10.1126/sciadv.abc0020, 2022. a, b
Jiang, Z., McDonald, B. C., Worden, H., Worden, J. R., Miyazaki, K., Qu, Z., Henze, D. K., Jones, D. B. A., Arellano, A. F., Fischer, E. V., Zhu, L., and Boersma, K. F.: Unexpected slowdown of US pollutant emission reduction in the past decade, P. Natl. Acad. Sci. USA, 115, 5099–5104, https://doi.org/10.1073/pnas.1801191115, 2018. a
Kaskaoutis, D. G., Kharol, S. K., Sinha, P. R., Singh, R. P., Badarinath, K. V. S., Mehdi, W., and Sharma, M.: Contrasting aerosol trends over South Asia during the last decade based on MODIS observations, Atmos. Meas. Tech. Discuss., 4, 5275–5323, https://doi.org/10.5194/amtd-4-5275-2011, 2011. a, b
Kaskaoutis, D. G., Singh, R. P., Gautam, R., Sharma, M., Kosmopoulos, P. G., and Tripathi, S. N.: Variability and trends of aerosol properties over Kanpur, northern India using AERONET data (2001–10), Environ. Res. Lett., 7, 024003, https://doi.org/10.1088/1748-9326/7/2/024003, 2012. a, b, c, d
Kato, S., Bergin, M. H., Ackerman, T. P., Charlock, T. P., Clothiaux, E. E., Ferrare, R. A., Halthore, R. N., Laulainen, N., Mace, G. G., Michalsky, J., and Turner, D. D.: A comparison of the aerosol thickness derived from ground‐based and airborne measurements, J. Geophys. Res.-Atmos., 105, 14701–14717, https://doi.org/10.1029/2000jd900013, 2000. a
Kendall, M. G.: Rank correlation methods, Griffin, London [u.a.], 4th edn., 2nd impr. edn., ISBN 0852641990, 1975. a
Krotkov, N. A., McLinden, C. A., Li, C., Lamsal, L. N., Celarier, E. A., Marchenko, S. V., Swartz, W. H., Bucsela, E. J., Joiner, J., Duncan, B. N., Boersma, K. F., Veefkind, J. P., Levelt, P. F., Fioletov, V. E., Dickerson, R. R., He, H., Lu, Z., and Streets, D. G.: Aura OMI observations of regional SO2 and NO2 pollution changes from 2005 to 2015, Atmos. Chem. Phys., 16, 4605–4629, https://doi.org/10.5194/acp-16-4605-2016, 2016. a, b, c, d, e, f, g, h
Kulkarni, A. and von Storch, H.: Simulationsexperimente zur Wirkung serieller Korrelation auf den Mann-Kendall Trend test, Meteorol. Z., 4, 82–85, https://doi.org/10.1127/metz/4/1992/82, 1992. a
Kumar, A., Pratap, V., Kumar, S., and Singh, A.: Atmospheric aerosols properties over Indo-Gangetic Plain: A trend analysis using ground – Truth AERONET data for the year 2009–2017, Adv. Space Res., 69, 2659–2670, https://doi.org/10.1016/j.asr.2021.12.052, 2022. a, b
Kumar, S., Singh, A., Srivastava, A. K., Sahu, S. K., Hooda, R. K., Dumka, U. C., and Pathak, V.: Long-term change in aerosol characteristics over Indo-Gangetic Basin: How significant is the impact of emerging anthropogenic activities?, Urban Climate, 38, 100880, https://doi.org/10.1016/j.uclim.2021.100880, 2021. a
Kurokawa, J. and Ohara, T.: Long-term historical trends in air pollutant emissions in Asia: Regional Emission inventory in ASia (REAS) version 3, Atmos. Chem. Phys., 20, 12761–12793, https://doi.org/10.5194/acp-20-12761-2020, 2020. a
Lee, J., Kim, J., Song, C., Kim, S., Chun, Y., Sohn, B., and Holben, B.: Characteristics of aerosol types from AERONET sunphotometer measurements, Atmos. Environ., 44, 3110–3117, https://doi.org/10.1016/j.atmosenv.2010.05.035, 2010. a, b
Li, J.: Pollution Trends in China from 2000 to 2017: A Multi-Sensor View from Space, Remote Sensing, 12, 208, https://doi.org/10.3390/rs12020208, 2020. a, b, c
Li, J., Carlson, B. E., Dubovik, O., and Lacis, A. A.: Recent trends in aerosol optical properties derived from AERONET measurements, Atmos. Chem. Phys., 14, 12271–12289, https://doi.org/10.5194/acp-14-12271-2014, 2014. a, b, c, d, e, f, g, h, i, j, k, l, m, n, o
Li, J., Li, X., Carlson, B. E., Kahn, R. A., Lacis, A. A., Dubovik, O., and Nakajima, T.: Reducing multisensor satellite monthly mean aerosol optical depth uncertainty: 1. Objective assessment of current AERONET locations, J. Geophys. Res.-Atmos., 121, 13609–13627, https://doi.org/10.1002/2016jd025469, 2016. a, b
Li, W., Wang, Y., Yi, Z., Guo, B., Chen, W., Che, H., and Zhang, X.: Evaluation of MERRA-2 and CAMS reanalysis for black carbon aerosol in China, Environ. Pollut., 343, 123182, https://doi.org/10.1016/j.envpol.2023.123182, 2024. a
Liang, Y., Gui, K., Che, H., Li, L., Zheng, Y., Zhang, X., Zhang, X., Zhang, P., and Zhang, X.: Changes in aerosol loading before, during and after the COVID-19 pandemic outbreak in China: Effects of anthropogenic and natural aerosol, Sci. Total Environ., 857, 159435, https://doi.org/10.1016/j.scitotenv.2022.159435, 2023. a
Lyapustin, A., Smirnov, A., Holben, B., Chin, M., Streets, D. G., Lu, Z., Kahn, R., Slutsker, I., Laszlo, I., Kondragunta, S., Tanré, D., Dubovik, O., Goloub, P., Chen, H.-B., Sinyuk, A., Wang, Y., and Korkin, S.: Reduction of aerosol absorption in Beijing since 2007 from MODIS and AERONET, Geophys. Res. Lett., 38, L10803, https://doi.org/10.1029/2011gl047306, 2011. a
Mann, H. B.: Nonparametric Tests Against Trend, Econometrica, 13, 245, https://doi.org/10.2307/1907187, 1945. a
Mehta, M., Singh, R., Singh, A., Singh, N., and Anshumali: Recent global aerosol optical depth variations and trends – A comparative study using MODIS and MISR level 3 datasets, Remote Sens. Environ., 181, 137–150, https://doi.org/10.1016/j.rse.2016.04.004, 2016. a, b, c, d, e
Mishchenko, M. I., Geogdzhayev, I. V., Rossow, W. B., Cairns, B., Carlson, B. E., Lacis, A. A., Liu, L., and Travis, L. D.: Long-Term Satellite Record Reveals Likely Recent Aerosol Trend, Science, 315, 1543–1543, https://doi.org/10.1126/science.1136709, 2007. a
Moorthy, K. K. and Babu, S. S.: Aerosol black carbon over Bay of Bengal observed from an island location, Port Blair: Temporal features and long‐range transport, J. Geophys. Res.-Atmos., 111, D17205, https://doi.org/10.1029/2005jd006855, 2006. a
Ningombam, S. S., Larson, E., Dumka, U., Estellés, V., Campanelli, M., and Steve, C.: Long-term (1995–2018) aerosol optical depth derived using ground based AERONET and SKYNET measurements from aerosol aged-background sites, Atmos. Pollut. Res., 10, 608–620, https://doi.org/10.1016/j.apr.2018.10.008, 2019. a, b, c
Nwofor, O., Chidiezie Chineke, T., and Pinker, R.: Seasonal characteristics of spectral aerosol optical properties at a sub-Saharan site, Atmos. Res., 85, 38–51, https://doi.org/10.1016/j.atmosres.2006.11.002, 2007. a
Pandey, S. K., Bakshi, H., and Vinoj, V.: Recent changes in dust and its impact on aerosol trends over the Indo-Gangetic Plain (IGP), in: Remote Sensing of the Atmosphere, Clouds, and Precipitation VI, edited by: Im, E., Kumar, R., and Yang, S., SPIE, ISSN 0277-786X, https://doi.org/10.1117/12.2223314, 2016. a, b, c
Pandey, S. K., Vinoj, V., Landu, K., and Babu, S. S.: Declining pre-monsoon dust loading over South Asia: Signature of a changing regional climate, Scientific Reports, 7, 16062, https://doi.org/10.1038/s41598-017-16338-w, 2017. a, b, c, d
Pouliot, G., van der Gon, H. A. D., Kuenen, J., Zhang, J., Moran, M. D., and Makar, P. A.: Analysis of the emission inventories and model-ready emission datasets of Europe and North America for phase 2 of the AQMEII project, Atmos. Environ., 115, 345–360, https://doi.org/10.1016/j.atmosenv.2014.10.061, 2015. a
Rafaj, P., Amann, M., Siri, J., and Wuester, H.: Changes in European greenhouse gas and air pollutant emissions 1960–2010: decomposition of determining factors, Climatic Change, 124, 477–504, https://doi.org/10.1007/s10584-013-0826-0, 2013. a
Ramachandran, S. and Rupakheti, M.: Trends in physical, optical and chemical columnar aerosol characteristics and radiative effects over South and East Asia: Satellite and ground-based observations, Gondwana Res., 105, 366–387, https://doi.org/10.1016/j.gr.2021.09.016, 2022. a, b, c, d, e, f, g, h, i, j, k
Ramachandran, S., Rupakheti, M., and Lawrence, M. G.: Aerosol-induced atmospheric heating rate decreases over South and East Asia as a result of changing content and composition, Scientific Reports, 10, 20091, https://doi.org/10.1038/s41598-020-76936-z, 2020. a, b, c, d
Russell, P. B., Bergstrom, R. W., Shinozuka, Y., Clarke, A. D., DeCarlo, P. F., Jimenez, J. L., Livingston, J. M., Redemann, J., Dubovik, O., and Strawa, A.: Absorption Angstrom Exponent in AERONET and related data as an indicator of aerosol composition, Atmos. Chem. Phys., 10, 1155–1169, https://doi.org/10.5194/acp-10-1155-2010, 2010. a
Sabetghadam, S., Alizadeh, O., Khoshsima, M., and Pierleoni, A.: Aerosol properties, trends and classification of key types over the Middle East from satellite-derived atmospheric optical data, Atmos. Environ., 246, 118100, https://doi.org/10.1016/j.atmosenv.2020.118100, 2021. a
Sen, P. K.: Estimates of the Regression Coefficient Based on Kendall's Tau, J. Am. Stat. Assoc., 63, 1379–1389, https://doi.org/10.1080/01621459.1968.10480934, 1968. a
Shao, Y., Klose, M., and Wyrwoll, K.: Recent global dust trend and connections to climate forcing, J. Geophys. Res.-Atmos., 118, 11107–11118, https://doi.org/10.1002/jgrd.50836, 2013. a, b, c
Sinyuk, A., Holben, B. N., Eck, T. F., Giles, D. M., Slutsker, I., Korkin, S., Schafer, J. S., Smirnov, A., Sorokin, M., and Lyapustin, A.: The AERONET Version 3 aerosol retrieval algorithm, associated uncertainties and comparisons to Version 2, Atmos. Meas. Tech., 13, 3375–3411, https://doi.org/10.5194/amt-13-3375-2020, 2020. a, b, c
Sokhi, R. S., Singh, V., Querol, X., Finardi, S., Targino, A. C., Andrade, M. d. F., Pavlovic, R., Garland, R. M., Massagué, J., Kong, S., Baklanov, A., Ren, L., Tarasova, O., Carmichael, G., Peuch, V.-H., Anand, V., Arbilla, G., Badali, K., Beig, G., Belalcazar, L. C., Bolignano, A., Brimblecombe, P., Camacho, P., Casallas, A., Charland, J.-P., Choi, J., Chourdakis, E., Coll, I., Collins, M., Cyrys, J., da Silva, C. M., Di Giosa, A. D., Di Leo, A., Ferro, C., Gavidia-Calderon, M., Gayen, A., Ginzburg, A., Godefroy, F., Gonzalez, Y. A., Guevara-Luna, M., Haque, S. M., Havenga, H., Herod, D., Hõrrak, U., Hussein, T., Ibarra, S., Jaimes, M., Kaasik, M., Khaiwal, R., Kim, J., Kousa, A., Kukkonen, J., Kulmala, M., Kuula, J., La Violette, N., Lanzani, G., Liu, X., MacDougall, S., Manseau, P. M., Marchegiani, G., McDonald, B., Mishra, S. V., Molina, L. T., Mooibroek, D., Mor, S., Moussiopoulos, N., Murena, F., Niemi, J. V., Noe, S., Nogueira, T., Norman, M., Pérez-Camaño, J. L., Petäjä, T., Piketh, S., Rathod, A., Reid, K., Retama, A., Rivera, O., Rojas, N. Y., Rojas-Quincho, J. P., San José, R., Sánchez, O., Seguel, R. J., Sillanpää, S., Su, Y., Tapper, N., Terrazas, A., Timonen, H., Toscano, D., Tsegas, G., Velders, G. J., Vlachokostas, C., von Schneidemesser, E., VPM, R., Yadav, R., Zalakeviciute, R., and Zavala, M.: A global observational analysis to understand changes in air quality during exceptionally low anthropogenic emission conditions, Environ. Int., 157, 106818, https://doi.org/10.1016/j.envint.2021.106818, 2021. a
Szymankiewicz, K., Kaminski, J. W., and Struzewska, J.: Application of Satellite Observations and Air Quality Modelling to Validation of NOx Anthropogenic EMEP Emissions Inventory over Central Europe, Atmosphere, 12, 1465, https://doi.org/10.3390/atmos12111465, 2021. a, b, c
Takamura, T. and Nakajima, T.: Overview of SKYNET and its activities, Optica pura y aplicada, 37, 3303–3308, 2004. a
Tao, M., Wang, Z., Tao, J., Chen, L., Wang, J., Hou, C., Wang, L., Xu, X., and Zhu, H.: How Do Aerosol Properties Affect the Temporal Variation of MODIS AOD Bias in Eastern China?, Remote Sensing, 9, 800, https://doi.org/10.3390/rs9080800, 2017. a
Tong, D. Q., Lamsal, L., Pan, L., Ding, C., Kim, H., Lee, P., Chai, T., Pickering, K. E., and Stajner, I.: Long-term NOx trends over large cities in the United States during the great recession: Comparison of satellite retrievals, ground observations, and emission inventories, Atmos. Environ., 107, 70–84, https://doi.org/10.1016/j.atmosenv.2015.01.035, 2015. a
Venkataraman, C., Brauer, M., Tibrewal, K., Sadavarte, P., Ma, Q., Cohen, A., Chaliyakunnel, S., Frostad, J., Klimont, Z., Martin, R. V., Millet, D. B., Philip, S., Walker, K., and Wang, S.: Source influence on emission pathways and ambient PM2.5 pollution over India (2015–2050), Atmos. Chem. Phys., 18, 8017–8039, https://doi.org/10.5194/acp-18-8017-2018, 2018. a, b
Wang, X., Cai, D., Chen, S., Lou, J., Liu, F., Jiao, L., Cheng, H., Zhang, C., Hua, T., and Che, H.: Spatio-temporal trends of dust emissions triggered by desertification in China, CATENA, 200, 105160, https://doi.org/10.1016/j.catena.2021.105160, 2021. a
Wang, Y., Jiang, J. H., Su, H., Choi, Y.-S., Huang, L., Guo, J., and Yung, Y. L.: Elucidating the Role of Anthropogenic Aerosols in Arctic Sea Ice Variations, J. Climate, 31, 99–114, https://doi.org/10.1175/JCLI-D-17-0287.1, 2018. a
Wei, J., Li, Z., Lyapustin, A., Sun, L., Peng, Y., Xue, W., Su, T., and Cribb, M.: Reconstructing 1-km-resolution high-quality PM2.5 data records from 2000 to 2018 in China: spatiotemporal variations and policy implications, Remote Sens. Environ., 252, 112136, https://doi.org/10.1016/j.rse.2020.112136, 2021a. a
Wei, J., Li, Z., Xue, W., Sun, L., Fan, T., Liu, L., Su, T., and Cribb, M.: The ChinaHighPM10 dataset: generation, validation, and spatiotemporal variations from 2015 to 2019 across China, Environ. Int., 146, 106290, https://doi.org/10.1016/j.envint.2020.106290, 2021b. a
Xia, X.: Variability of aerosol optical depth and Angstrom wavelength exponent derived from AERONET observations in recent decades, Environ. Res. Lett., 6, 044011, https://doi.org/10.1088/1748-9326/6/4/044011, 2011. a, b, c, d
Yang, X., Zhao, C., Yang, Y., and Fan, H.: Long-term multi-source data analysis about the characteristics of aerosol optical properties and types over Australia, Atmos. Chem. Phys., 21, 3803–3825, https://doi.org/10.5194/acp-21-3803-2021, 2021. a, b, c
Yin, S.: Biomass burning spatiotemporal variations over South and Southeast Asia, Environ. Int., 145, 106153, https://doi.org/10.1016/j.envint.2020.106153, 2020. a
Ying, T., Li, J., Jiang, Z., Liu, G., Zhang, Z., Zhang, L., Dong, Y., and Zhao, C.: Increased aerosol scattering contributes to the recent monsoon rainfall decrease over the Gangetic Plain, Sci. Bull., 68, 2629–2638, https://doi.org/10.1016/j.scib.2023.08.052, 2023. a
Yoon, J., von Hoyningen-Huene, W., Kokhanovsky, A. A., Vountas, M., and Burrows, J. P.: Trend analysis of aerosol optical thickness and Ångström exponent derived from the global AERONET spectral observations, Atmos. Meas. Tech., 5, 1271–1299, https://doi.org/10.5194/amt-5-1271-2012, 2012. a
Yoon, J., Pozzer, A., Chang, D., Lelieveld, J., Kim, J., Kim, M., Lee, Y., Koo, J.-H., Lee, J., and Moon, K.: Trend estimates of AERONET-observed and model-simulated AOTs between 1993 and 2013, Atmos. Environ., 125, 33–47, https://doi.org/10.1016/j.atmosenv.2015.10.058, 2016. a
Yu, X., Nichol, J., Lee, K. H., Li, J., and Wong, M. S.: Analysis of Long-Term Aerosol Optical Properties Combining AERONET Sunphotometer and Satellite-Based Observations in Hong Kong, Remote Sensing, 14, 5220, https://doi.org/10.3390/rs14205220, 2022. a, b
Yue, S., Pilon, P., Phinney, B., and Cavadias, G.: The influence of autocorrelation on the ability to detect trend in hydrological series, Hydrol. Process., 16, 1807–1829, https://doi.org/10.1002/hyp.1095, 2002. a
Zhang, L. and Li, J.: Variability of Major Aerosol Types in China Classified Using AERONET Measurements, Remote Sensing, 11, 2334, https://doi.org/10.3390/rs11202334, 2019. a, b
Zhang, Y., Luo, G., and Yu, F.: Seasonal Variations and Long‐Term Trend of Dust Particle Number Concentration Over the Northeastern United States, J. Geophys. Res.-Atmos., 124, 13140–13155, https://doi.org/10.1029/2019jd031388, 2019. a
Zhang, Z., Li, J., Dong, Y., Zhang, C., Ying, T., and Li, Q.: Long-Term Trends in Aerosol Single Scattering Albedo Cause Bias in MODIS Aerosol Optical Depth Trends, IEEE T. Geosci. Remote, 62, 1–9, https://doi.org/10.1109/tgrs.2024.3424981, 2024. a
Zhao, B., Jiang, J. H., Gu, Y., Diner, D., Worden, J., Liou, K.-N., Su, H., Xing, J., Garay, M., and Huang, L.: Decadal-scale trends in regional aerosol particle properties and their linkage to emission changes, Environ. Res. Lett., 12, 054021, https://doi.org/10.1088/1748-9326/aa6cb2, 2017. a, b, c, d, e, f