the Creative Commons Attribution 4.0 License.
the Creative Commons Attribution 4.0 License.
 | 19 Dec 2025
An updated microphysical model for particle activation in contrails: the role of volatile plume particles
Joel Ponsonby
Roger Teoh
Bernd Kärcher
Marc E. J. Stettler
Global simulations suggest the mean annual contrail cirrus net radiative forcing is comparable to that of aviation's accumulated CO2 emissions. Currently, these simulations assume non-volatile particulate matter (nvPM) and ambient particles are the only source of condensation nuclei, omitting activation of volatile particulate matter (vPM) formed in the nascent plume. Here, we extend a microphysical model to include vPM and benchmark this against a more advanced parcel model (pyrcel) modified to treat contrail formation. We explore how the apparent emission index (EI) of contrail ice crystals (AEIice) scales with EInvPM, vPM properties, ambient temperature, and aircraft/fuel characteristics. We find model agreement within 10 %–30 % in the previously defined “soot-poor” regime. However, discrepancies increase non-linearly (up to 60 %) in the “soot-rich” regime, due to differing treatment of droplet growth. Both models predict that, in the “soot-poor” regime, AEIice approaches 1016 kg−1 for low ambient temperatures (< 210 K) and sulfur-rich vPM, which is comparable to estimates in the “soot-rich” regime. Moreover, our sensitivity analyses suggest that the point of transition between the “soot-poor” and “soot-rich” regimes is a dynamic threshold that ranges from 1013–1016 kg−1 and depends sensitively on ambient temperature and vPM properties, underlining the need for vPM emission characterisation measurements. We suggest that existing contrail simulations omitting vPM activation may underestimate AEIice, especially for flights powered by lean-burn engines. Furthermore, our results imply that, under these conditions, AEIice might be reduced by (i) reducing fuel sulfur content, (ii) minimising organic emissions, and/or (iii) avoiding cooler regions of the atmosphere.
- Article
(3582 KB) - Full-text XML
-
Supplement
(1913 KB) - BibTeX
- EndNote


The aviation industry contributes approximately 3.5 % towards global anthropogenic effective radiative forcing (ERF) (Lee et al., 2021). This share is projected to increase, as the sector is comparatively challenging to decarbonise (Grewe et al., 2021), notwithstanding anticipated compound annual growth in global passenger traffic of 3.6 % from 2027–2043 (Airbus, 2024). Estimates for 2018 indicate that the largest contribution towards net aviation ERF (+100.9 m Wm−2) is from contrail cirrus (+57.4 m Wm−2), with remaining contributions from accumulated CO2 emissions (+34.3 m Wm−2), followed by NOx (+17.5 m Wm−2) (Lee et al., 2021). The sign and magnitude of the contrail cirrus ERF depend inter alia on optical thickness and spatiotemporal coverage (Kärcher, 2018; Schumann et al., 2012), which are determined by ice crystal microphysics and hence the contrail formation pathway.
Provided the aircraft exhaust plume satisfies the Schmidt–Appleman Criterion (SAC), linear contrail formation occurs within 1 s behind the engine exit plane (Schumann, 1996). In the nascent plume, exhaust gases mix with cooler ambient air, resulting in a locally water-supersaturated environment. Under these conditions, particles in the plume can activate to form water droplets, which later nucleate ice homogeneously to form contrail ice crystals. Hence, this pathway is regulated by the number concentration of particles able to activate, which is controlled by their particle size distribution characteristics and chemical composition (Petters and Kreidenweis, 2007). If fewer particles are able to activate, the resulting ice crystals will be larger and less numerous (Teoh et al., 2022), which may decrease both the optical thickness and the spatiotemporal coverage of the cloud. Therefore, contrail cirrus ERF is inherently sensitive to the characteristics of particles in the mixing plume.
Particles within an exhaust plume are either released by the engine (aircraft mode) or entrained during atmospheric mixing (ambient mode). Aircraft mode particles that evaporate (above) below 350 °C (623 K) (Saffaripour et al., 2020) are defined as (non-)volatile particulate matter, (n)vPM. The largest vPM particles are formed from chemi-ions, which are generated during the combustion process (Yu and Turco, 1997). These chemi-ions scavenge sulfuric acid–water clusters and/or condensable particulate organic matter (POM) in the cooling plume to generate liquid aerosol particles with a number emission index EIvPM ∼ 1017 kg−1 (Yu et al., 1998). A smaller, more numerous population of vPM is generated from binary homogeneous nucleation of sulfuric acid and water (Kärcher and Fahey, 1997). However, these particles are efficiently scavenged by the larger particles, enhancing their growth depending on available sulfuric acid and/or POM (Kärcher et al., 2000). They are therefore unlikely to compete with the larger population for plume supersaturations, so we consider the larger population to be plume vPM within this work. The geometric mean diameter (dg) and hygroscopicity of plume vPM depend on the nature and availability of condensable gases in the aircraft exhaust (Kärcher et al., 2000); dg,vPM is typically < 5 nm (Schumann et al., 2002) prior to contrail formation. Depending on the engine architecture, (semi-)vPM lubrication oil may also be released as larger droplets or gaseous emissions, with the latter capable of either nucleating new particles or contributing towards the condensable organic fraction (Decker et al., 2024; Ungeheuer et al., 2022). By contrast, EInvPM and dg,nvPM do not change in young exhaust plumes, besides a minor increase to dg,nvPM by accretion of condensable material. Under cruise thrust settings, nm (Durdina et al., 2024) and exhibits dependence on fuel and combustor type (Moore et al., 2017; Voigt et al., 2021).
EInvPM varies by several orders of magnitude depending on the fuel and engine type (EASA, 2025), with most engines operating in the “soot-rich” regime, where the majority of contrail ice crystals form via nvPM particles (Kärcher and Yu, 2009). Larger nvPM particles (dg,nvPM > dg,vPM) activate preferentially in the plume and can suppress water uptake on plume vPM particles, defining “soot-rich” baseline conditions of approximately EInvPM>1015 kg−1 (Kärcher, 2018). Upon reducing EInvPM, size differences no longer compensate for differences in relative abundance, and concentrations of activated nvPM and plume vPM become comparable, characterising the “transition regime” (Kärcher and Yu, 2009). Here, baseline conditions depend sensitively on the characteristics of all particle species. Recent developments in lean-burn technology have been shown to further reduce EInvPM into the “soot-poor” regime, where activated number concentrations become independent of EInvPM as EInvPM decreases. “Soot-poor” baseline conditions have been shown to depend on the relative concentration of ambient particles and the characteristics of plume vPM, including EIvPM and dg,vPM (Yu et al., 2024). Nevertheless, while the role of vPM has been evidenced in model simulations of individual contrails, these effects have not yet been incorporated into global mean contrail cirrus ERF estimates (Bier and Burkhardt, 2022; Teoh et al., 2024).
Generally, two complementary classes of models are used to describe contrail formation (Bier et al., 2022): those that focus on jet dynamics and those that focus on plume microphysics. The former include 3D large eddy simulations (LESs), which provide insight into the spatial heterogeneity within contrail mixing plumes (Lewellen et al., 2014). Inevitably, the high spatial resolution achieved in these simulations is achieved at the expense of detailed microphysical descriptions (Ferreira et al., 2024). To that end, several LES models prescribe water saturation as the critical condition for contrail ice formation (Paoli et al., 2013; Picot et al., 2015) or heterogeneous ice nucleation as the primary formation pathway (Khou et al., 2017, 2015), both of which have been rejected by in situ observations (Kärcher et al., 2015). More representative microphysical treatment can be achieved using 0D box- and parcel model simulations (Bier et al., 2022; Rojo et al., 2015; Yu et al., 2024). Here, the dilution of a parcel of exhaust air is simulated, and microphysical phase transitions, such as particle activation and homogeneous ice nucleation, are tracked. While these models are unable to incorporate feedback between different plume parcels, which may otherwise lead to a diversity of particle history (Lewellen, 2020), they are configured for sophisticated treatment of complex ice microphysics, which is critical for describing contrail properties (Yu et al., 2024).
Here, we undertake a literature review of the microphysical pathway to contrail formation, to better understand the role of plume vPM in contrail formation. We then extend two parcel models using detailed microphysics to account for the activation of plume vPM. In both models, we prescribe plume vPM properties at the time of droplet formation and ice nucleation (0.1–1 s after emission) rather than explicitly modelling their formation. The two models include (i) a minimal microphysical framework developed by Kärcher et al. (2015), henceforth referred to using the shorthand K15, and (ii) a more complex numerical parcel model (pyrcel) developed by Rothenberg and Wang (Rothenberg and Wang, 2016). The extended K15 model is designed for future integration into global contrail simulations, while the modified pyrcel model serves as a benchmark to highlight model discrepancies. After examining these discrepancies, we use the modified pyrcel model to perform a suite of sensitivity analyses, studying the influence of the prescribed vPM size distribution characteristics and hygroscopicity, ambient temperature, and aircraft/fuel properties.
In Sect. 2, we provide an overview of elementary contrail thermodynamics (Sect. 2.1), a description of particle activation in contrail mixing plumes (Sect. 2.2), and implications for the SAC (Sect. 2.3). Next, we provide an overview of the underlying model framework (Sect. 3.1) and extensions (Sect. 3.2 and 3.3) and of the assumed particle characteristics used in this work (Sect. 3.4). We then evaluate the two models in Sect. 4.1 and 4.2, justifying the use of the modified pyrcel model for several sensitivity analyses (Sect. 4.3–4.6). Finally, we comment on several implications for future modelling studies and wider impacts (Sect. 5).
Here, we review the thermodynamic pathway to contrail formation and define the SAC framework (Sect. 2.1). We describe several fundamental principles of particle activation (Sect. 2.2) and use these to justify an extension to the original SAC framework (Sect. 2.3). Finally, we provide a theoretical framework for the parcel models used within this work (Sect. 2.4).
2.1 Thermodynamics of contrail formation
A cruising aircraft releases combustion emissions at a typical engine exhaust temperature TE∼600 K, which depends on the engine architecture and bypass ratio (Cumpsty, 2003). The emissions are dispersed into the turbulent jet plume of the aircraft and are rapidly diluted by upper-tropospheric air, cooling to the ambient temperature (TA) within 1 s. We can use the partial pressure of water in the mixing plume (pv,M) to navigate the transition between exhaust and ambient conditions. For isobaric conditions, this property scales linearly between exhaust and ambient conditions (Rogers and Yau, 1996):
where pv,E and pv,A represent the partial pressure of water in the exhaust and ambient air, respectively, and G is the gradient of the mixing line. Provided we know the ambient conditions (pv,A, TA) and TE, to fully constrain Eq. (1), we must also define either pv,E or G. Conveniently, the latter has been shown to depend on the aircraft and fuel properties (Schumann, 1996):
where PT is the ambient air pressure, cp is the isobaric specific heat of air (1004 J kg−1), EIw is the mass emission index of water vapour, ε is the ratio of gas constants for water vapour and dry air (0.622), and η is the overall efficiency such that (1–η) represents the fraction of the total heat released per mass of fuel burned (Q) that is transferred to the exhaust gas. We can describe pv,M by re-arranging Eq. (1):
Often, it is useful to describe how the water or ice saturation ratio of the plume (Sv,M and Si,M, respectively) evolves during the mixing process (Fig. 1). Here, we define Sv,M and Si,M within the mixing plume as follows:
pliq(T) and pice(T) represent the saturation vapour pressure above a plane surface of supercooled liquid water or ice, respectively (Murphy and Koop, 2005). In turn, we use Eq. (4) to define the liquid water supersaturation within the contrail mixing plume as sv,M = Sv,M − 1.
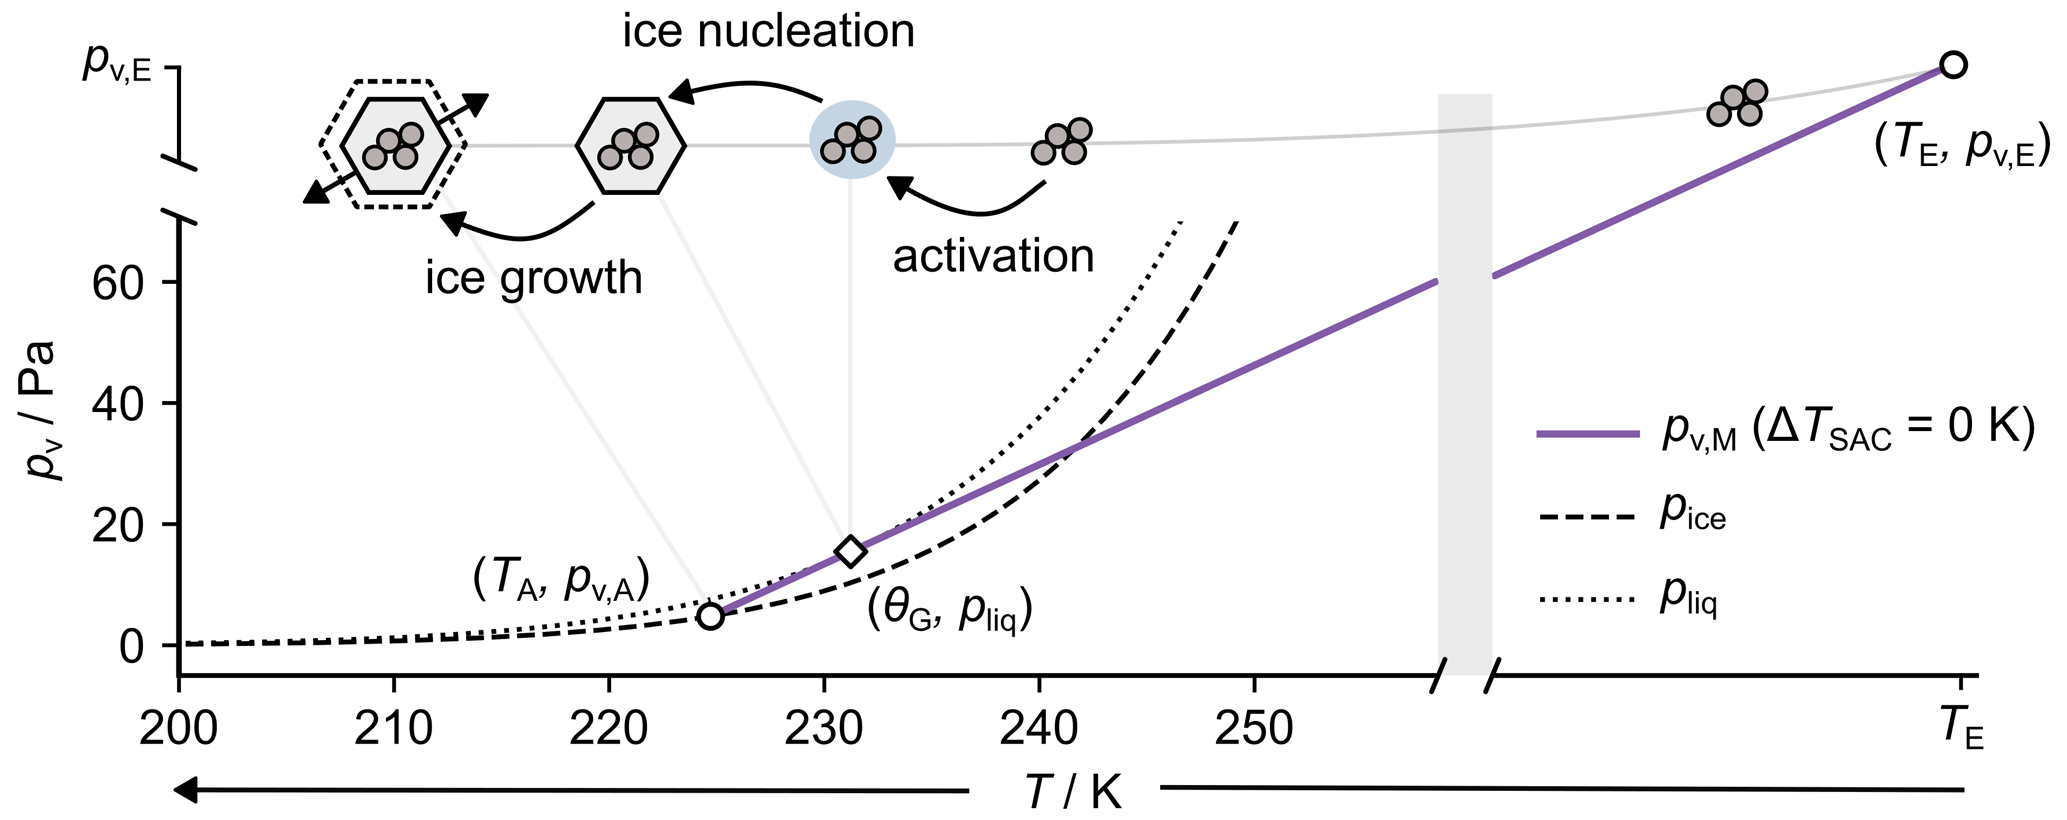
Figure 1Partial pressure of water vapour (pv) and temperature of the plume (T) during contrail mixing (purple line) under threshold conditions (TA=TSAC). Saturation vapour pressures above ice (pice) and water (pliq) are also shown. Finally, a schematic representation of particle emission, activation, and ice nucleation is shown. The latter two occur simultaneously within the original SAC framework. Here, we assume typical aircraft and fuel properties of PT, EIw, Q, and η of 25 kPa, 1.23 kg kg−1, 43.2 MJ, and 0.3 for temperatures TA and TE of ∼224 and 600 K, respectively.
To illustrate several features associated with contrail formation, we have shown an example of mixing behaviour for typical aircraft and fuel properties; see Fig. 1. The first feature is the crux of the SAC: contrail formation can only occur if Sv,M > 1 (sv,M > 0). However, this represents only an approximate requirement for the activation of particles into liquid droplets, which we will discuss further in Sect. 2.2 and 2.3. Nevertheless, as originally defined, the SAC may be interpreted quantitatively as
where θG is the temperature at which the contrail mixing line tangentially intersects pliq. Under this definition, θG represents the highest temperature at which contrail formation can occur in a water-saturated plume. For ambient relative humidities below water saturation , this corresponds to a projected ambient temperature known as the Schmidt–Appleman threshold temperature (TSAC) (Schumann et al., 1996). Accordingly, TSAC represents the highest ambient temperature at which contrail formation can occur. The mixing behaviour presented in Fig. 1 is consistent with this threshold condition. Notably, for lower TA and fixed pv,A, the mixing line would be translated towards cooler T by an amount ΔTSAC, and the plume would become supersaturated during mixing. Hence, the parameter ΔTSAC provides a useful indicator for the degree of supersaturation experienced by a contrail mixing plume. Importantly, the SAC implies that the activation of particles into liquid droplets occurs before ice nucleation takes place.
This water saturation constraint is consistent with observations of young contrails (Kärcher et al., 2015) and implies a formation pathway of condensation followed by homogeneous ice nucleation (Murray et al., 2012). As such, we omit heterogeneous ice nucleation in our analysis, which would otherwise contradict this mechanism. The water saturation constraint is also motivated by particle properties because (a) aircraft-emitted nvPM particles have previously been shown as inactive heterogeneous ice nuclei (Testa et al., 2024); (b) only a small subset of ambient tropospheric aerosol particles (mineral dust, ammonium sulfate, and amorphous organic) are efficient heterogeneous ice nuclei (Kärcher et al., 2023), and these have low number concentrations at cruise altitudes (relative to lean-burn EInvPM); and (c) plume vPM is likely to be at least partly soluble and therefore inactive as heterogeneous ice nuclei. Therefore, in the context of nvPM, the water saturation constraint implies that particles first activate to form water droplets, after which they act as passive inclusions, with rates of homogeneous ice nucleation controlled by the ambient temperature and volume of adsorbed water. In the context of plume vPM and ambient particles, we extend this analysis and demonstrate that the process of ice formation is again strictly sequential, with particle activation occurring before homogeneous ice nucleation; see Sect. S1 in the Supplement. For this reason, contrail formation is dictated by the conditions under which particle activation takes place, which are addressed in Sect. 2.2.
2.2 Aerosol particle activation and the κ–Köhler framework
The equilibrium saturation ratio over a particle may be described as a balance of two interactions (Seinfeld and Pandis, 2016). The first of these is the Kelvin (also commonly referred to as the “surface curvature”) effect. Consider the situation whereby a particle with a (dry-particle) diameter dd is activated to form a pure liquid droplet with a (wet-particle) diameter of dw. Due to surface tension at the water–air interface, a decrease in the droplet diameter leads to an increase in the partial pressure of water vapour at the droplet surface and hence to an increase in the water saturation ratio (Sv). This effect is parameterised as
where σs is the surface tension of the liquid–air interface, Mw is the molar mass of water, ρw is the density of the liquid, R is the global gas constant, T is the temperature, and aw is the activity of water in solution (Petters and Kreidenweis, 2007). For particles that are entirely insoluble, the liquid surrounding the particle will be pure water, and we can approximate aw=1, reducing Eq. (7) to the Kelvin equation (Pruppacher and Klett, 2010). This simplified treatment of insoluble particle activation has been revisited by several studies that consider multilayer adsorption mechanisms (Kumar et al., 2009; Sorjamaa and Laaksonen, 2007), although the application of these approaches is limited by the availability of experimental data. In contrast, if the particle is not entirely insoluble (for example, the insoluble core may contain a soluble coating), the value of aw (and Sv) is reduced, thus defining the second, solute effect. In this case, the activity of water in solution may be treated using the parameterisation proposed by Petters and Kreidenweis (2007). Here, the particle is described using a hygroscopicity parameter (κ), which is related to the bulk material solubility (Sullivan et al., 2009), and aw is given by
where, for an internally mixed particle, κ is given as a volume-weighted sum over the individual components. Note that Eq. (7) collapses to aw=1 if κ=0, which is the approximate limit for a non-hygroscopic (insoluble) particle. Above this limit, κ is typically represented on a logarithmic scale, with slightly hygroscopic materials (κ<0.01) less capable of water uptake than very hygroscopic materials (κ>0.5) (Petters and Kreidenweis, 2007). Combining Eqs. (7) and (8), we recover the final form of κ-Köhler theory,
According to Eq. (9), Sv increases with dw up to a maximum at (dw,c, Sv,c), beyond which it declines; see Fig. 2a. These critical parameters may be estimated for a given particle type and at a given T by setting the derivative of Eq. (9) equal to zero and solving numerically. In the context of particle activation, it is more instructive to explore how dw depends on the ambient saturation ratio, remaining mindful that the inverse function dw=dw(Sv) is multivalued. To that end, as the ambient Sv is increased over a particle, growth is initially regulated by the solute effect, and the particle diameter increases by slow, hygroscopic growth. Upon further increasing Sv, the relative magnitudes of the Kelvin and solute effects balance at the critical point (Seinfeld and Pandis, 2016). Here, the particle is said to have been activated, and subsequent growth is regulated by kinetic droplet growth outlined in Sect. S2. In summary, a particle is considered activated to form a water droplet once the ambient Sv exceeds Sv,c.
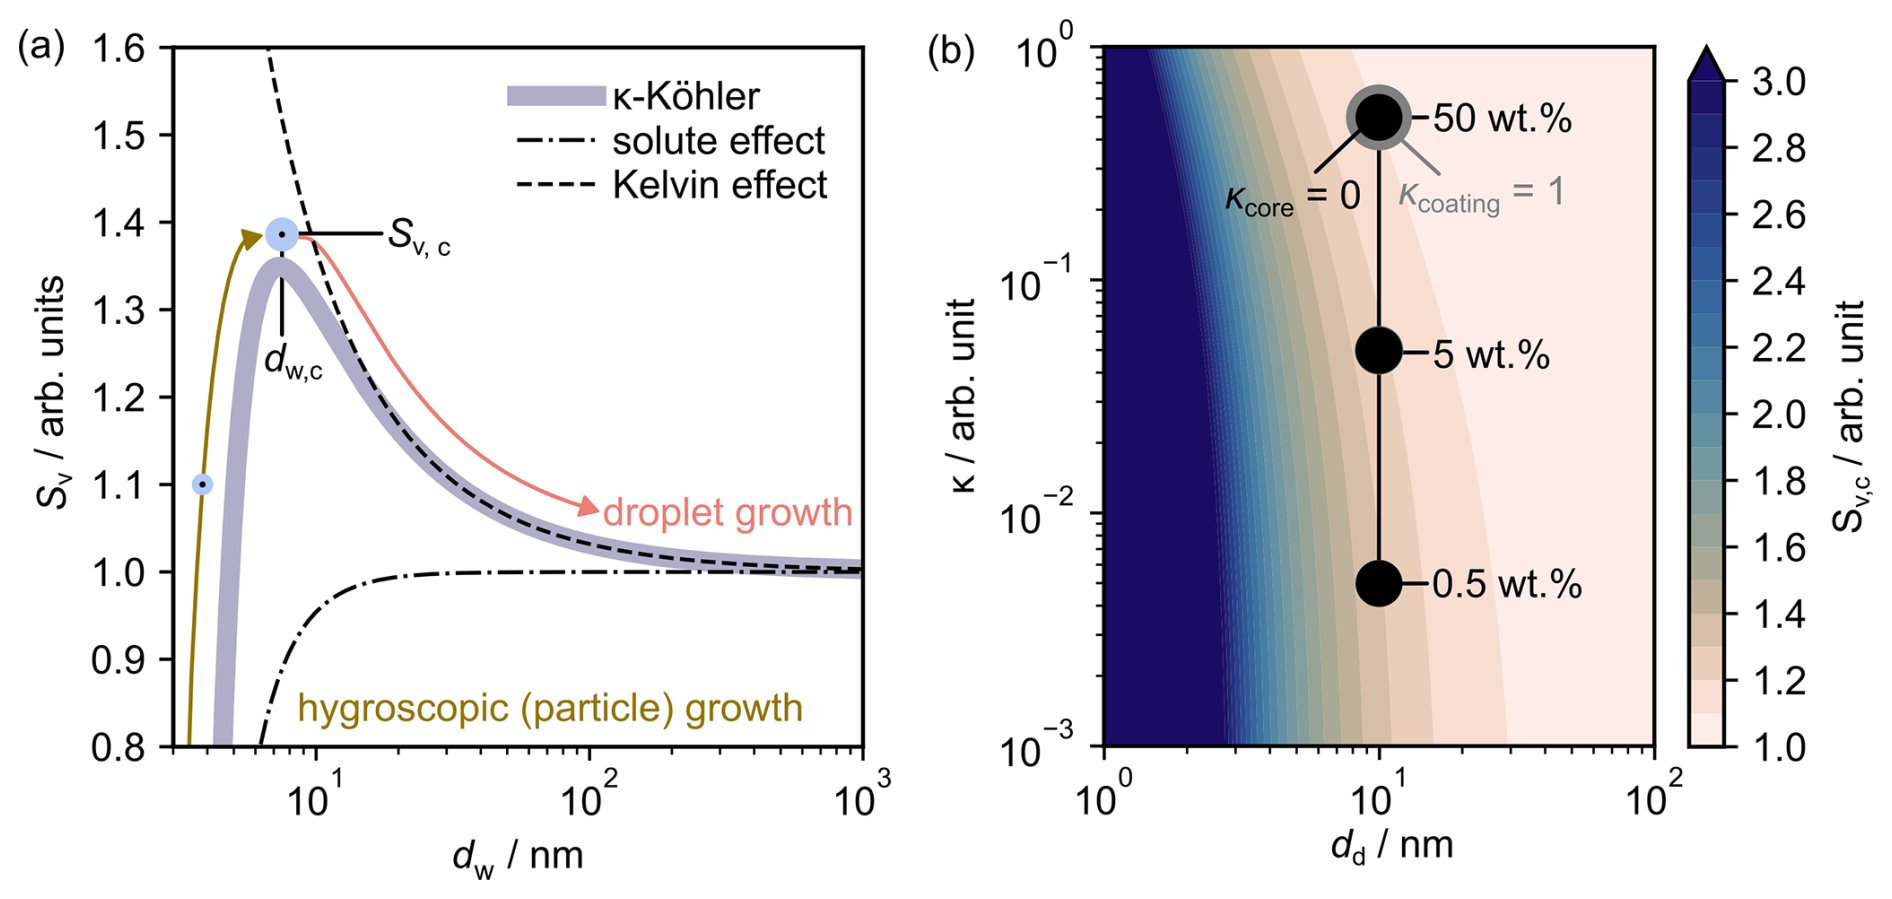
Figure 2(a) Water saturation ratio (Sv) with increasing wet-particle diameter (dw) as the combination of the solute and Kelvin effects. The critical diameter (dw,c) and the associated critical saturation ratio (Sv,c) mark the point at which a particle is considered activated. (b) Sv,c is shown as a function of the dry-particle diameter (dd) and particle hygroscopicity. Values for insoluble (κ=0) particles with variable highly soluble (κ=1) coatings have been shown for reference.
Figure 2b shows that Sv,c exhibits three key trends: (i) it increases with both dd and κ; (ii) it is more sensitive to changes in dd than κ (i.e. ); and (iii) it approaches 1 in the limit ), , for which additional justification is provided in Sect. S3. In Fig. 2b, we also show how Sv,c varies for a series of mixed particles with insoluble (κ=0) cores and variable coatings of hygroscopic (κ=1) material (0.5 wt %–50 wt %) with similar total dry-particle diameters dd=10 nm. These highlight the importance of soluble coatings when considering plume particle activation, which is a feature we return to in Sect. 4.5.
2.3 Extended Schmidt–Appleman framework
As discussed in Sect. 2.1, the SAC assumes that contrails are formed if the mixing line becomes (super)saturated with respect to water during plume evolution (Sv≥1). However, as outlined in Sect. S3, this criterion cannot be reconciled with the minimum requirement for (even hygroscopic) particle activation.
Instead, suppose that a contrail mixing contains a single particle mode with properties (dd, κ). Now, the criterion for contrail formation is that the contrail mixing line must contact pliq ⋅ Sv,c at least once during the mixing process. Figure 3a shows that, when these particle properties are included, the threshold requirement for activation (previously water-saturated conditions, dotted black line) is elevated (grey/green dotted line). Using Eq. (9), the particle dependence of ΔTSAC=ΔTSAC can be determined and is shown in Fig. 3b. Alternatively, we can reframe the parameter ΔTSAC presented in Fig. 3b to be an effective Schmidt–Appleman temperature, TSAC (dd,κ), the ambient temperature below which contrail formation takes place when the plume contains particles with properties dd and κ. Figure 3b also enables us to estimate for which particle types the SAC framework (as outlined in Sect. 2.1) remains applicable, under a specified temperature uncertainty.
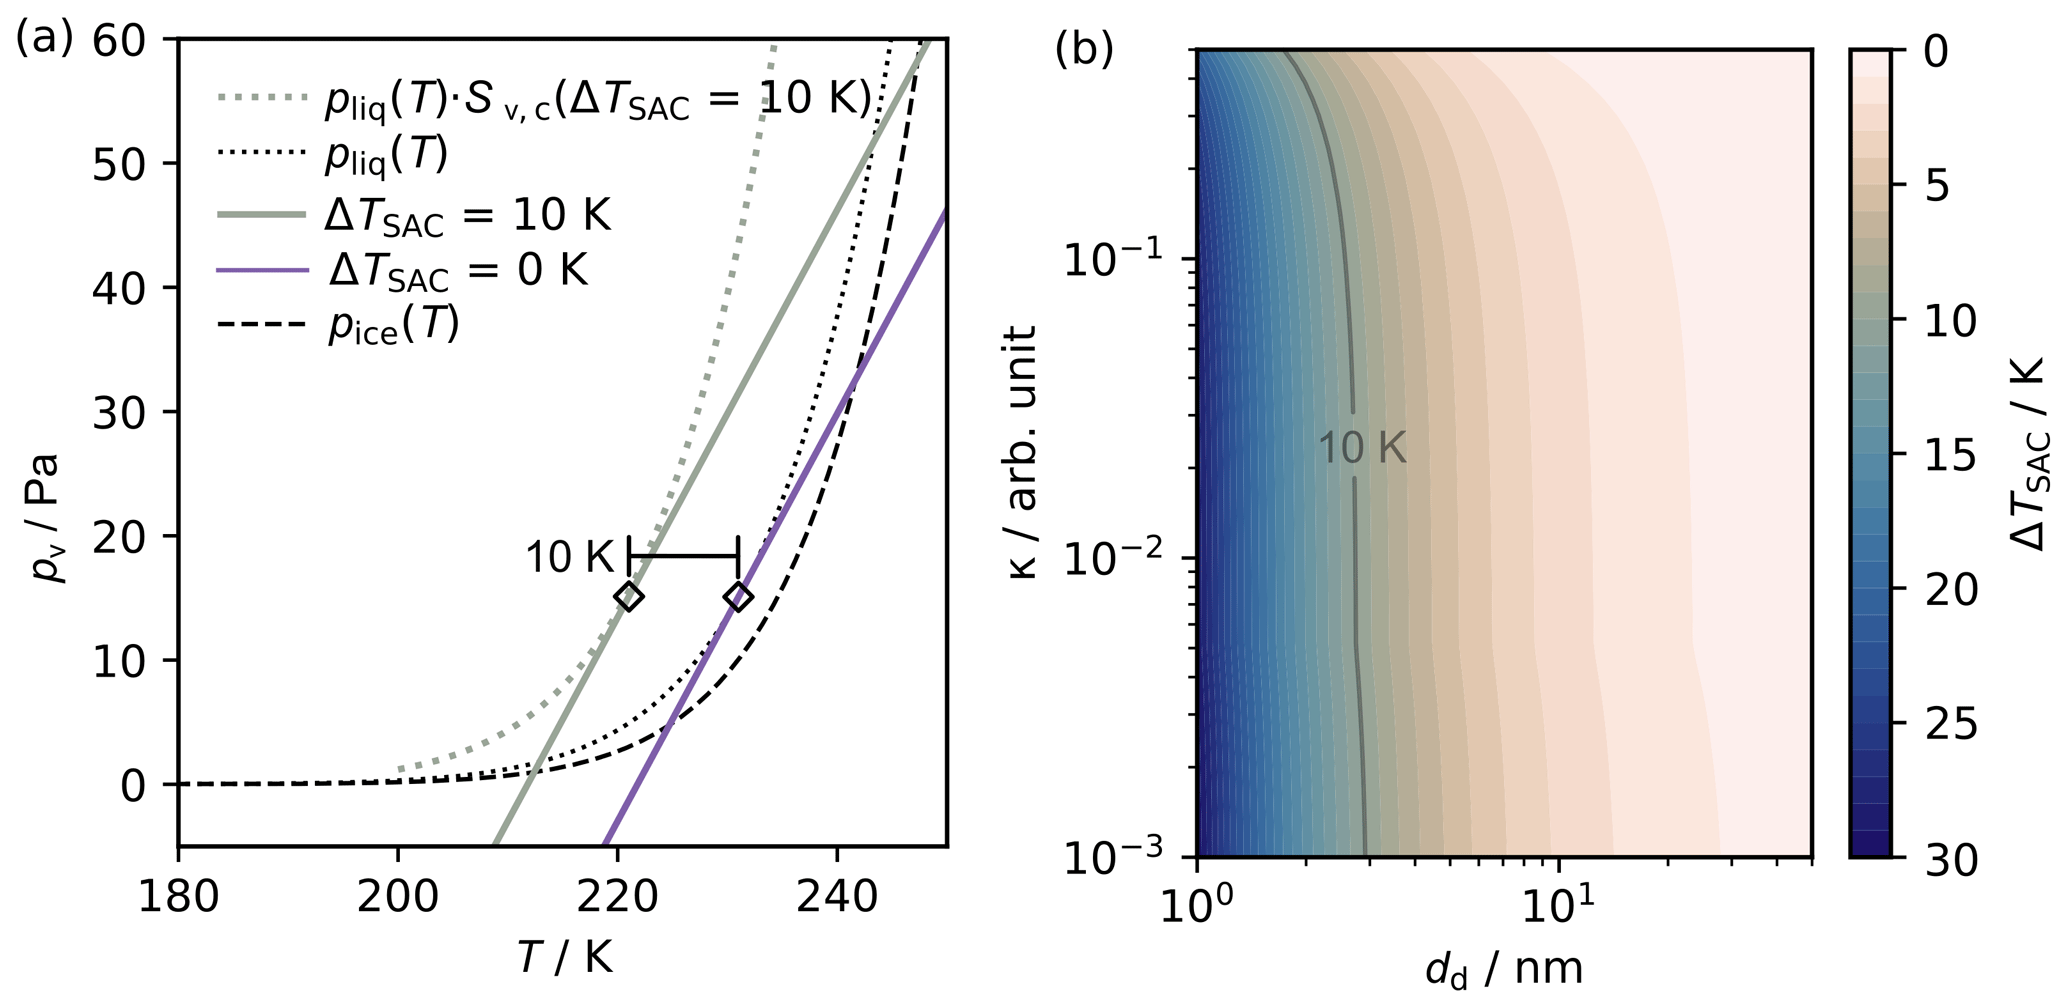
Figure 3(a) Saturation vapour pressure above water (pliq) (purple, dotted) and a contrail mixing line (purple, solid) for threshold conditions, ΔTSAC=0 K. Particle properties (dd, κ) have been chosen so that the modified saturation vapour pressure above water pliq ⋅ Sv,c (dd, κ) (grey/green, dotted) translates threshold conditions by 10 K, so ΔTSAC=10 K (grey/green, solid). (b) Extension of panel (a) to show dependence of ΔTSAC on dd and κ. Combinations of particle properties resulting in ΔTSAC=10 K are shown (grey/green, solid). In all cases, Sv,c is estimated conservatively using T=220 K.
For particles with κ>0.6 and/or dd>20 nm, ΔTSAC K, which is close to the typical uncertainty associated with low-altitude temperature measurements during in situ campaigns, K (Bräuer et al., 2021). Therefore, for “soot-rich” emissions, where the typical nvPM particles have dd>20 nm, the condition for applying the original SAC is valid within measurement uncertainty. This explains the success of this approach over the past decades and across various measurement campaigns (Schumann et al., 2017). However, with reduced soot emissions, exhaust material will be enriched with smaller plume vPM particles. Under these circumstances, the SAC is less effective at predicting the temperature at which most particles activate; see Fig. 3b.
Here, we outline the fundamental relations used to describe a parcel model for contrail formation (Sect. 3.1), including a basic overview of the original K15 model. Next, we outline several extensions made to the K15 model so that it can be applied to treat plume vPM activation (Sect. 3.2). Then, we outline modifications made to a pre-existing cloud parcel model, pyrcel (Rothenberg and Wang, 2016), to simulate the early stages of contrail formation (Sect. 3.3). Finally, we describe the parameter space used in our model simulations (Sect. 3.4).
3.1 Contrail parcel model
As discussed in Sect. 2.2, the critical parameter governing the uptake of water onto particles is the water saturation ratio, Sv. The water saturation ratio within a parcel of air can be described as
where ε (=0.622) is the ratio of the molar mass of water (18.02 g mol−1) to the molar mass of dry air (28.97 g mol−1) and wv is the water vapour mixing ratio, the mass of water vapour per unit mass of dry air contained within the parcel. We can simplify Eq. (10) further using several features of contrail mixing. Within a contrail, the maximum partial pressure of water vapour in the plume is given by the maximum of Sv⋅pliq. This is bounded by , since isobaric mixing is the only process that acts to increase the parcel saturation ratio. Assuming that the ambient environment is ice-saturated, we also know that pv,M is bounded by (pv,M)max = ), provided we prescribe an anomalously-low TA of 200 K. Rearranging Eq. (10), we can therefore bound wv as
Using TE=600 K, TSAC=224 K, G=1.64 PaK−1, and PT=23 000 Pa, we have wv<0.02. Therefore, the inequality wv≪ε is satisfied for all conditions, which enables us to simplify Eq. (10) as
Next, we assume that contrail mixing occurs at constant atmospheric pressure so that, upon differentiating Eq. (12) with respect to time and collecting like terms, we have
Equation (14) is a statement of mass conservation: any change in the water vapour content of the parcel must result either from particle microphysical processes (i.e. particle activation and droplet/ice crystal growth) or from plume mixing vapour. Using Eq. (10), we can express the mixing term as
where is the cooling rate in the plume. Then, combining Eqs. (12)–(15), we arrive at the governing equation
This is almost identical to the result given by Kärcher et al. (2015). However, we find that, on the right-hand side of Eq. (16), the actual plume saturation ratio (Sv) is present rather than the saturation ratio assumed from mixing alone (Sv,M). This equation can be solved numerically, for example, by using a numerical parcel model. However, the equation cannot be solved analytically. Under these circumstances, a solution may be derived by firstly approximating on the right-hand side of Eq. (16) as in the original K15 model, which effectively decouples the equation. In this purely analytical case, we can generalise Eq. (16) in the form
where Pw represents the rate of change of the water saturation ratio without particles in the plume and Lw represents the rate of change of the water saturation ratio resulting from (a) particle activation to form water droplets and (b) the growth of droplets and/or ice crystals. The description for Pw follows from the description of contrail mixing outlined in Sect. 2.1 and is given by Kärcher et al. (2015):
Using the description of mixing provided by Kärcher et al. (2015), next we will outline the equations necessary to estimate the cooling rate. For a full description of the parameters and underlying approximations, the reader is directed to the original text and references therein. The contrail mixing plume cools as it is diluted with ambient air according to the dilution factor
which describes how the cross-sectional area of the plume decreases with decreasing ambient temperature. The temporal evolution of the plume is then described by
where τm is the timescale over which the contrail mixing parcel is unaffected by entrainment and β is a constant dilution parameter. Note that we choose to omit effects associated with latent heat within our simulations, which we found to have a negligible impact on projected ice crystal number concentrations. Therefore, if we have knowledge of the aircraft and ambient conditions, using Eqs. (19)–(21), we are now able to describe Pw within the contrail mixing parcel at a given temperature. These relations also govern particle dilution within the cooling contrail mixing parcel. To that end, the total particle number concentration of aircraft (nT) and ambient (na,T) particle modes are, respectively,
where ρa is the mass density of ambient air, EI represents the emission index of the aircraft mode, na,0 represents the ambient number concentration far from the plume, and N0 is the mass-based mixing ratio according to the K15 model. Particle types are assumed to conform to lognormal particle size distributions and described using a fixed (total) hygroscopicity parameter, κ. For this reason, only a fraction of the total particles within a given mode will be able to activate under a given set of ambient conditions. The activated number concentration can be estimated by integrating over the particle size distribution using Eq. (9), using a methodology outlined in Sect. S4. The second term in Eq. (17), Lw, may be expressed as in Korolev and Mazin (2003):
where nw,i is the number concentration of droplets, rw,i is the droplet radius, and is the droplet growth rate of these droplets; see Sect. S2. In Eq. (24), we summed contributions from each of the droplets at a given time t. Another useful formulation of Eq. (24) is
where is the number density of aerosol particles that activate between times t0 and t + dt0, is related to the volumetric flux of water towards water droplets at time t that first formed at time t0<t, and is the growth rate of these droplets at time t (Kärcher and Lohmann, 2002a). We also integrated over the size distribution of activated particles, . In Eq. (25), rather than summing over contributions from each droplet at a given time t, we have instead integrated over each time t0<t and estimated the projected contribution towards the final time t. Equations (24) and (25) are therefore equivalent representations that are suited to different applications.
Finally, the contrail mixing behaviour can be described using Pw in combination with either expression for Lw. The formulation in Eq. (24) is used in traditional cloud parcel models using discretised particle and droplet size distributions, which enables Eq. (17) to be solved iteratively as a function of time. This forms the basis for the pyrcel model, which is described in more detail in Sect. 3.3. On the other hand, in the K15 model, the formulation in Eq. (25) is solved analytically at each time step, assuming that particle activation and droplet growth at time t<t0 do not affect Sv at time t0. At each time t, we estimate the critical droplet number concentration required to prevent any further change in the plume saturation ratio . Using Eq. (25), we can define the mean supersaturation loss rate per droplet as Rw = and reformulate this critical droplet number concentration as . As time evolves and Sv increases, so too will the number concentration of droplets, . At some threshold time, the number concentration of droplets will be equal to the critical droplet number concentration; i.e. . Assuming the plume saturation ratio has equilibrated, no further activation can take place after this time (Twomey, 1959). Hence, this condition defines a lower bound for the maximum number of water droplets that can form during the mixing process, providing an estimate for the contrail ice crystal number concentration. This process forms the basis of the K15 model approach, for which several extensions are described in Sect. 3.3.
3.2 Model extensions for K15
The original K15 model only considers aircraft-emitted nvPM and ambient particles, both of which contain a single particle type and are described using assumed lognormal particle size distribution characteristics and κ. This approach is applicable to nvPM particles because their size distribution characteristics do not change significantly over time and because κ is dominated by the insoluble nvPM fraction. This approach is also applicable to ambient solution droplets because, once entrained into the plume, these droplets are readily activated due to the high (Sv≫1) plume supersaturations. Therefore, small changes in their size distribution characteristics that are not captured by the K15 model are relatively insignificant. Considering this, our first extension to the K15 model is to introduce plume vPM (Yu et al., 1998) as an additional particle type. We define plume vPM to consist of condensable gaseous material, including (but not limited to) sulfuric acid, organic material, and engine lubrication oil. Simulations show that the size distribution characteristics of plume vPM evolve over time due to condensational growth and coagulation (Kärcher et al., 2000). However, here we are concerned with the contrail formation phase 0.1–1 s into plume dilution, so we prescribe plume vPM properties expected at these timescales. As such, our model cannot be used to predict the properties of plume vPM. Instead, we prescribe plume vPM using a fixed emission index, κ, and particle size distribution characteristics, and we evaluate the model sensitivity to these variables under typical ranges. In Sect. S5, we also investigate the use of a more complex ambient particle description comprising seven independent particle types. The particle size distribution characteristics and hygroscopicity of these particle types are estimated using outputs from the global aerosol–climate model ECHAM-HAM (Zhang et al., 2012). Overall, we suggest that incorporating these additional ambient particle types could enhance AEIice by 1 order of magnitude when most ice crystals form via ambient particles. Next, there are several microphysical processes within the K15 model which are described using analytical approximations. Our extensions focus on either improving the accuracy of these approximations or removing them altogether in favour of numerical solutions. Firstly, the analytical approximation used to estimate the activated number concentrations for a given particle type can lead to overpredictions for (dg, κ, T) (Sect. S6). To address this, we updated the methodology to estimate activated particle number concentrations using an exact analytical solution.
Secondly, the K15 model estimates using an approximate analytical solution derived from Eq. (9). We compared this with the full numerical solution and show that the K15 approximation systematically underpredicts critical supersaturations for κ (<0.2), with larger discrepancies upon reducing dg (Sect. S7). Hence, we solve Eq. (9) numerically when identifying critical supersaturations, in line with Bier and Burkhardt (2022).
The aforementioned approximations each indirectly relate to the Pw term; however, the final approximation relates to the Lw term. The methodology for estimating contrail ice crystal number concentrations outlined in K15 relies on analytical solutions for both Pw and Lw. In Sect. S8, we provide an overview of the relevant equations used to estimate Lw and give an account of the various approximations used in its derivation. After considering these, we suggest the following modification. The solution to Lw provided in K15 is valid only for when particle activation occurs more quickly than droplet growth, i.e. the “slow-growth” regime (Kärcher and Lohmann, 2002b). After incorporating a plume vPM particle mode, this condition is not necessarily satisfied, so we use a regime-independent analytical solution (Kärcher et al., 2006).
There are two outstanding limitations in the extended K15 model that cannot be resolved. Firstly, we found no means of introducing the Kelvin correction into the solution for Lw (via the droplet growth equation). Omitting the Kelvin effect in the droplet growth equation acts to increase the radial growth rate (Sect. S2). Hence, the ability for droplets to deplete the plume supersaturation is increased, so a lower droplet number concentration is required to quench the ambient supersaturation. This effect is relevant for smaller particles such as plume vPM, where the magnitude of the Kelvin correction is increased. Secondly, an analytical solution for the inner integral of Eq. (25) requires that Lw is independent of the plume supersaturation so that droplet formation at time t0<t does not deplete the plume supersaturation at time t. However, as defined in Eq. (25), Lw is coupled to the plume supersaturation via the droplet growth equation. We anticipate this may be problematic when two or more particle types with comparable number concentrations but different Sv,c coexist. Here, one particle type will preferentially activate and grow, subsequently depleting the supersaturation available for the second particle type and thereby inhibiting its activation and growth. For this reason, the extended K15 does not account for the temporal depletion of supersaturation or competition between particle types.
3.3 Model modifications for pyrcel
pyrcel is a 0D cloud parcel model used to simulate the evolution of a parcel of air as it ascends adiabatically at a constant updraft speed (Rothenberg and Wang, 2016). The model is initialised by defining the aerosol population using lognormal particle size distributions, which are discretised into bins. These particle properties are used in combination with the initial ambient conditions to establish an equilibrium wet-particle size distribution. Next, the conservation relations Eqs. (11), (13), and (21) are iterated forward in time, and the wet-particle radii within each bin are tracked using a Lagrangian grid. For a fuller description of the underlying model mechanics, the reader is directed to the original paper and references therein (Rothenberg and Wang, 2016). In contrast to the K15 model, pyrcel explicitly considers the feedback of water vapour between different droplet populations and Pw. However, pyrcel was originally written to describe the formation of warm-phase clouds; therefore, several modifications were made for application to contrail formation.
Firstly, we replace the original Pw term (deriving from parcel updraft) with the definition in Eq. (18). Secondly, we remove the time dependence of altitude and pressure, under the assumption of an adiabatic expansion at constant atmospheric pressure as described in Sect. 3.1. Finally, we derive initial particle number concentrations for the aircraft modes from the associated emission indices using Eqs. (18) and (19). After these changes, the modified pyrcel model and extended K15 models provide an identical description of Pw. However, the coupling of Pw to Lw is fully represented only within the modified pyrcel model.
Additionally, we also extended pyrcel to include homogeneous ice nucleation within growing water droplets. For a complete description of the relations used to arrive at an estimate for the homogeneous ice nucleation temperature, the reader is directed to Sect. S1. In brief, we estimate the rate of homogeneous ice nucleation within a droplet using its water activity (Koop et al., 2000), identified using Eq. (8) as in Lewellen (2020). The probability for ice nucleation within the droplet is then determined by assuming a pulse-like freezing process according to the methodology employed in K15. If the probability equals unity, we assume that the supercooled droplet freezes. The growth of ice crystals by deposition of (ice) supersaturated water vapour is then described using equations analogous to those in Sect. S2, where water saturation in the numerator is replaced with ice saturation, which represents the driving force for vapour deposition. For additional information on the exact form of these expressions, the reader is directed towards Pruppacher and Klett (2010). As outlined above, our implementation is sufficiently flexible to capture homogeneous ice nucleation events within droplets that may not (yet) be considered activated ().
3.4 Assumed particle properties
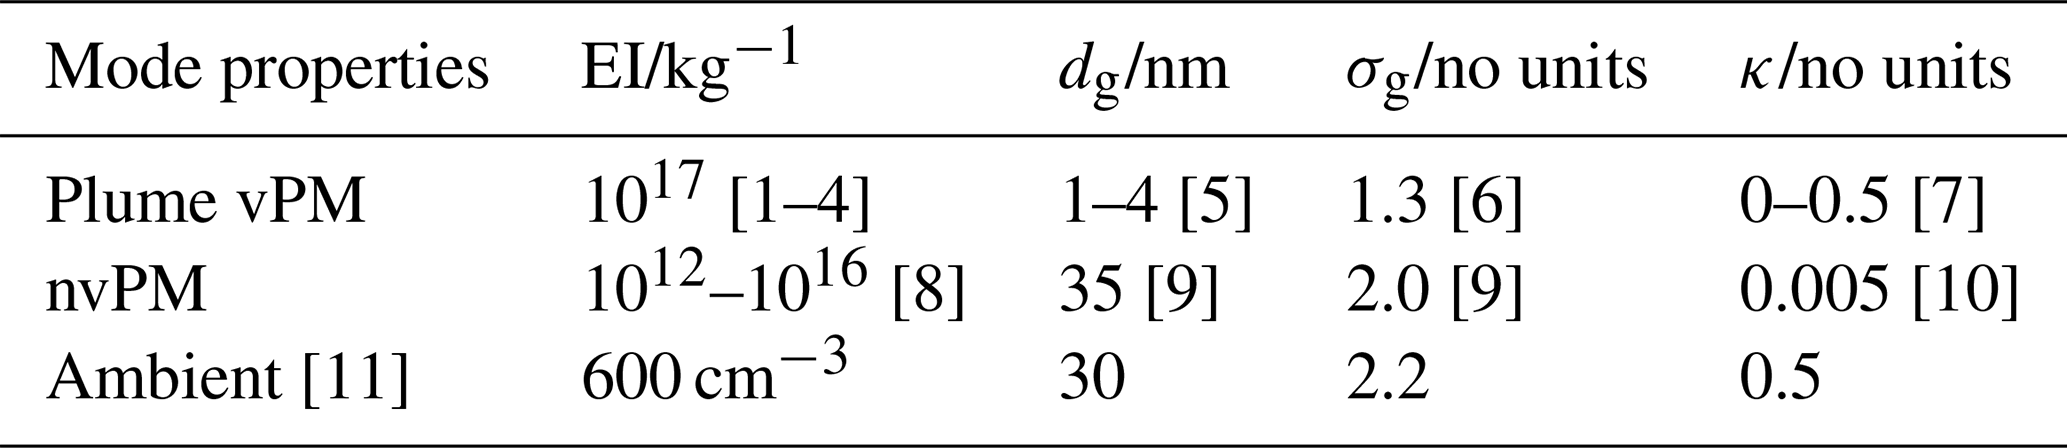
We use a conservative parameter space for the properties of each particle mode; see Table 1. We note that both EInvPM and the particle size distribution characteristics can change with the use of sustainable aviation fuel (SAF) (Märkl et al., 2024; Schripp et al., 2022); however, these fall within larger uncertainties in our simulations. Recently, contrail parcel model simulations have been performed assuming a smaller dg,nvPM, consistent with the primary particle diameter rather than the aggregate particle diameter (Yu et al., 2024). While the ice-nucleating ability of larger soot particles has been shown to depend on particle morphology (Marcolli et al., 2021), there is a paucity of data available for activation and ice nucleation on surrogate aircraft nvPM. Therefore, here we choose to identify dg,nvPM as the aggregate particle diameter in line with other studies (Kärcher et al., 2015). Nevertheless, we evaluate the model sensitivity to the choice of nvPM primary particle or aggregate diameter in detail (see Sect. S10) and find that (i) AEIice predictions agree within 40 % and that (ii) the functional behaviour is similar. Finally, we assume that the nvPM mode contains a 1 wt % coating of soluble material as observed for ground-based emissions testing at moderate fuel sulfur content (FSC) (Gysel et al., 2003) and is therefore characterised by κ = 0.005 in accordance with the original K15.
The properties of the ambient mode are taken directly from the original K15 model inputs. We argue that these properties are sufficient to investigate the competition between the three modes under most conditions; however, a more sophisticated description would be required to examine sensitivity if most ice crystals formed via ambient particles (Bier et al., 2024); see Sect. S5.
For the plume vPM mode, we identify a provisional size range of 1 < dg,vPM nm < 4 and a σg,vPM of 1.3 (Kärcher et al., 2000; Yu et al., 1998). Similarly, we assume a fixed emission index EIvPM=1017 kg−1 in line with modelling and observational evidence (Arnold et al., 2000; Haverkamp et al., 2004; Schumann et al., 2002; Sorokin and Mirabel, 2001). This is also supported by newer observational evidence (Voigt et al., 2025) that the total particle emission index (particle sizes > 5 nm) is on the order 1015 kg−1, which is consistent with EIvPM=1017 kg−1 if nm and . Concerning particle hygroscopicity, we assume a mixed plume vPM mode comprising sulfuric acid (κ=0.5) and condensable POM, for which we use a conservative lower bound of κ=0 in line with measurements of non-hygroscopic lubrication oil droplets (Ponsonby et al., 2024). However, we acknowledge that the value of κ for condensable POM is likely to vary with changes in fuel and/or engine architecture. To that end, we evaluate our sensitivity analyses in the extreme cases of both sulfur-rich plume vPM (volume mixing ratio of 95:5 sulfuric acid : condensable POM; 0.05⋅κPOM + ) and organic-rich plume vPM (volume mixing ratio of 5:95 for sulfuric acid : condensable POM; 0.95⋅κPOM + ). In Sect. S9, we investigate the impact of assuming all plume vPM particles have the same chemical composition (κ). To achieve this, we divide the plume vPM mode into two distinct plume vPM modes, prescribing these with identical physical characteristics but dissimilar κ. We find that the results of the two-mode system are similar to those of the single-mode system, with a modified value of κ. Therefore, we argue that our range of κ is sufficient to capture a degree of variation in chemical composition between vPM particles.
In the above, we have described vPM characteristics at the timescale of particle activation and droplet growth in the nascent contrail mixing plume (∼ 1 s). Separately, we can also estimate the (maximum) equilibrium plume vPM diameters (deq,vPM) that would be reached at t≫1 s using a mass balance. Among other factors, the characteristics of the plume vPM particle size distribution are constrained by the quantity of available sulfuric acid and POM. The former contribution is produced by oxidation of FSC,
where εs is the conversion efficiency of sulfur to sulfuric acid, which is typically on the order of 3 % (Yu et al., 2024). The latter contribution represents the sum of condensable gaseous emissions, which has previously been estimated in the range 1–40 mg kg−1 for relevant, combustion-related organics (Yu et al., 1999) in addition to potential non-combustion lubrication oil emissions of 110 mg kg−1 (Decker et al., 2024). As outlined in Sect. 1, we can assume that the plume vPM mode can be treated as monomodal, as the smaller mode (i) requires a higher critical supersaturation for activation and (ii) is effectively scavenged by the larger mode. Conservation of mass enables us to estimate deq,vPM for the plume vPM mode (Kärcher et al., 2000):
where ρvPM is the density of the volatile mode. Using Eq. (27), we can therefore estimate deq,vPM for given EIPOM and FSC, which is explored in Sect. 4.5.
Table 1Assumed characteristics and associated ranges for each particle type used within our parcel model simulations. List of references in the table: [1] Arnold et al. (2000); [2] Haverkamp et al. (2004); [3] Schumann et al. (2002); [4] Sorokin and Mirabel (2001); [5] Kärcher et al. (2000); [6] Yu et al. (1998); [7] Ponsonby et al. (2024); [8] EASA (2025); [9] Durdina et al. (2024); [10] Petzold et al. (2005); [11] Kärcher et al. (2015).
Here, we present the results of both the extended K15 model and the modified pyrcel models. Based on these results, we then use the modified pyrcel models to run a set of sensitivity analyses and explore how the apparent emission index of ice crystals (AEIice) within a contrail depends upon particle properties (Sect. 4.3 and 4.5), TA (Sect. 4.4), and aircraft parameters (Sect. 4.6).
4.1 Contrail mixing behaviour
Figure 4 shows the typical mixing behaviour as predicted by extended K15 and modified pyrcel models. These are compared to profiles in the absence of any particle intervention (SAC-type mixing behaviour), which is encapsulated by Pw. In both the extended K15 model and the modified pyrcel model, the partial pressure of water within the plume follows a similar trend. When the conditions in the plume are subsaturated (i.e. Sv<1), both models align with SAC-type mixing behaviour, since very few particles can activate. Hence, Lw∼0, and the mixing is dominated by Pw. However, once the plume becomes supersaturated, a proportion of the particles activate to form aqueous solution/water droplets. Here, Lw gradually increases to a maximum, before equilibrating with Pw at water-saturated conditions.
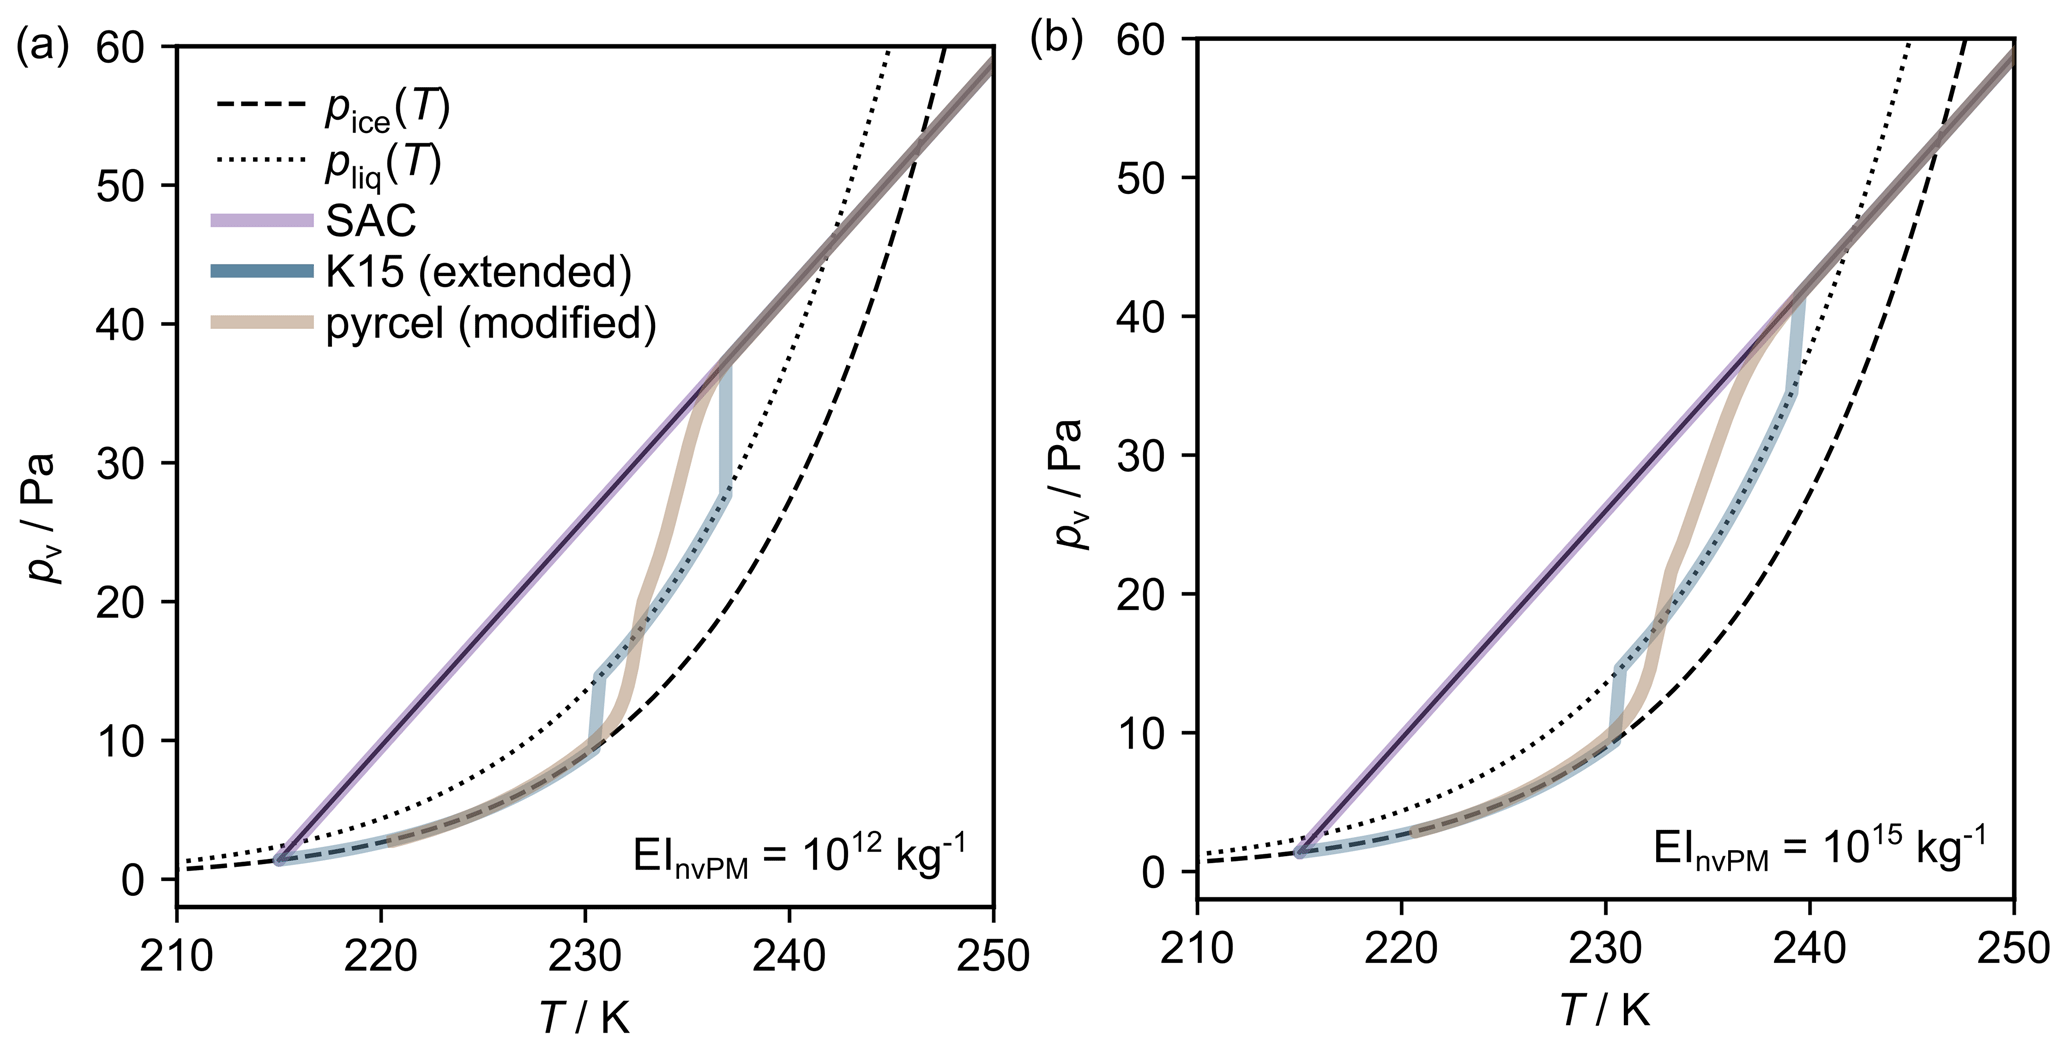
Figure 4Contrail mixing lines simulated with assumed EInvPM of (a) 1012 kg−1 and (b) 1015 kg−1. For both scenarios, the mixing lines are simulated using the original SAC framework (purple lines), the extended K15 model (blue lines), and the modified pyrcel model (brown lines). Each of the simulations has been set to terminate at ice-saturated conditions. These model predictions have been made with plume vPM (EIvPM=1017 kg−1).
This process of “activation–relaxation” (see warmer-temperature vertical regions of the blue lines in Fig. 4) is approximated within the extended K15 model by estimating the supersaturation at which this takes place and an associated timescale; see Sect. S8. Note that, because particles require supersaturated conditions to activate (), the onset temperature for “activation–relaxation” within the extended K15 model occurs after the point of intersection between the contrail mixing line and pliq. These findings are in qualitative agreement with the modified pyrcel outputs, although they cannot be directly compared. Moreover, the temperature difference is more pronounced for lower EInvPM (∼2, 5 K for EInvPM=1015 kg−1, 1012 kg−1), as the number-weighted particle diameter is smaller, which increases Sv,c. This again highlights the importance of considering particle properties when determining the point at which most particles activate (see Sect. 2.3).
4.2 Peak plume supersaturation
On average across EInvPM, the maximum plume supersaturations predicted by the extended K15 model are ∼10 %–70 % lower than those predicted by the modified pyrcel model; see Fig. 5. Without plume vPM, the largest discrepancies occur when competition between nvPM and ambient particles is largest (at EInvPM∼1012 kg−1; see Fig. 5a). However, when vPM is included, model discrepancies are largest when most contrail ice crystals form via nvPM; see Fig. 5b. Given that both pyrcel and the extended K15 model employ an identical treatment of Pw (Eq. 18), these model discrepancies must arise from the treatment of Lw. It follows that underestimating the supersaturation at which activation relaxation takes place implies the extended K15 likely overestimates the ability for water droplets to deplete the plume supersaturation. In the final part of Sect. 3.2, we comment on a fundamental limitation of the extended (and original) K15 model that could lead to this discrepancy, which centres around the treatment of Lw. In brief, preparing an analytical solution to Eq. (25) demands that (a) the plume supersaturation is unaffected by particle activation and subsequent droplet growth between adjacent time steps and that (b) the Kelvin effect is discarded from the droplet growth equations. A combination of these effects accounts for the observed behaviour shown in Fig. 5, which underlines the principal limitations of the extended K15 model.
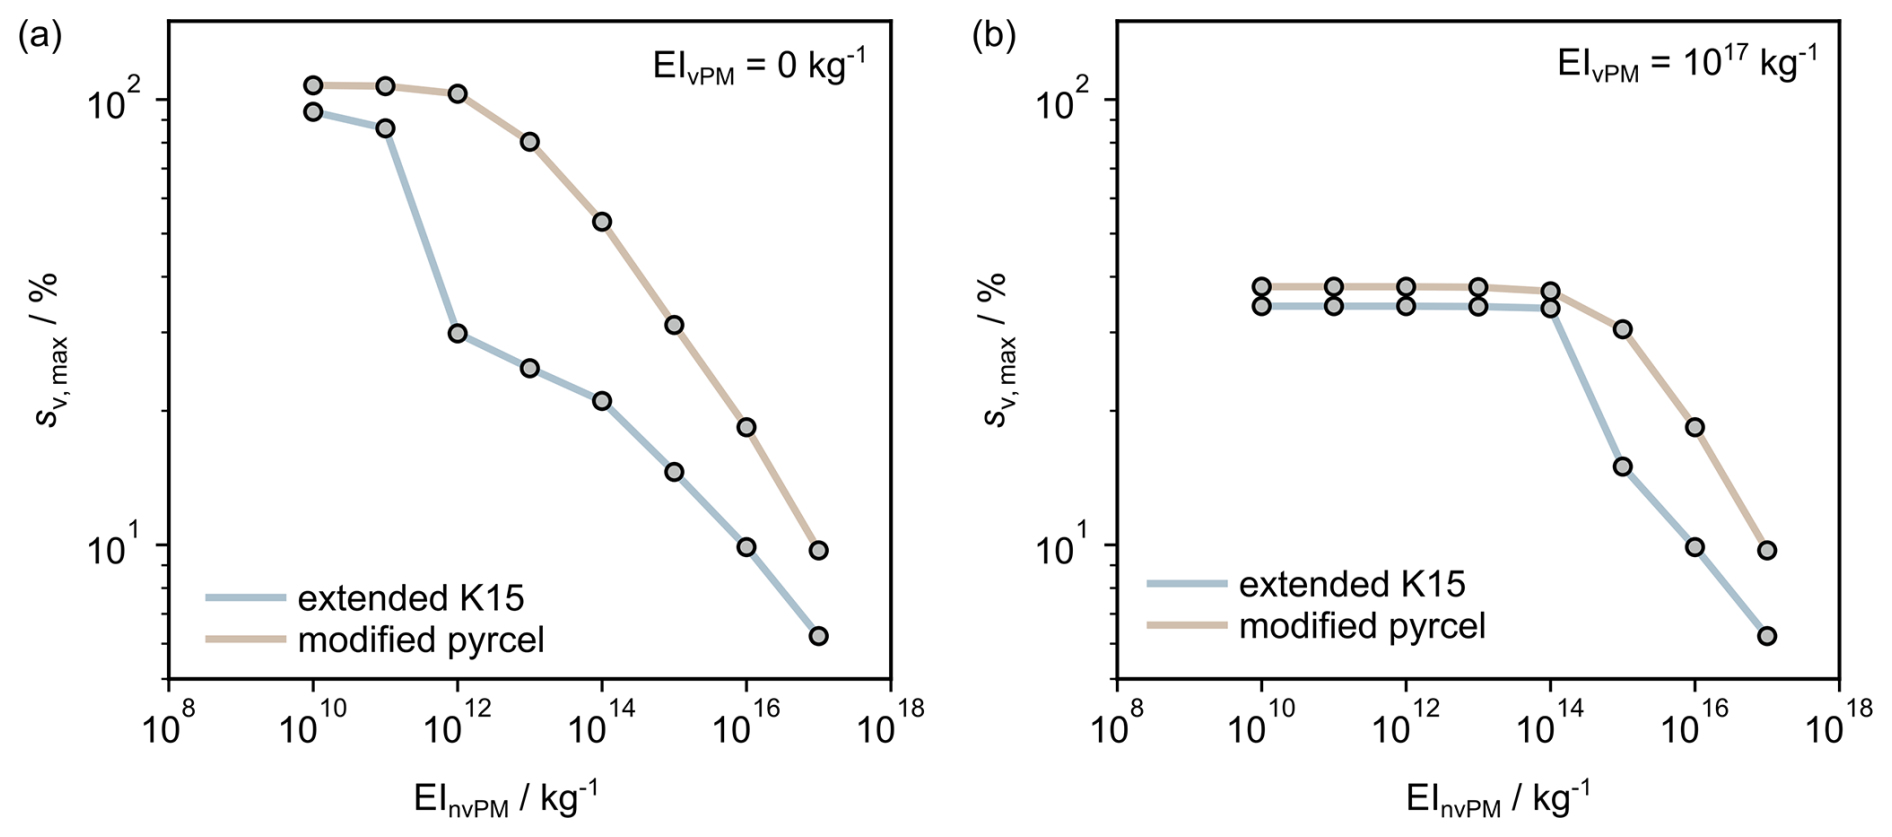
Figure 5The maximum plume supersaturation (sv,max) across a range of EInvPM as predicted by the modified pyrcel (brown lines) and extended K15 (blue lines) models. These model predictions have been made (a) without and (b) with the presence of plume vPM (EIvPM=1017 kg−1).
4.3 Sensitivity to EInvPM
In Fig. 6, we show how the ice crystal number concentration scales with EInvPM in both the extended K15 and modified pyrcel models. This is presented in terms of AEIice, using Eq. (22), so that the results can be more readily compared to other model predictions. Without plume vPM, we find the model agreement for AEIice is within 35 % when EInvPM<1016 kg−1; see Fig. 6a. When plume vPM is included, we find that, under this range of EInvPM, differences in model predictions for AEIice and sv,max exhibit similar trends; see Fig. 5b. Note that AEIice predictions made using the modified pyrcel model were found to have a maximum uncertainty of ±10 %; see Sect. S11. These derive principally from discretising the vPM mode, which necessarily approximates the analytic particle size distribution; see Sect. S4. These errors are shown in Fig. 6 and in future analysis, where appropriate.
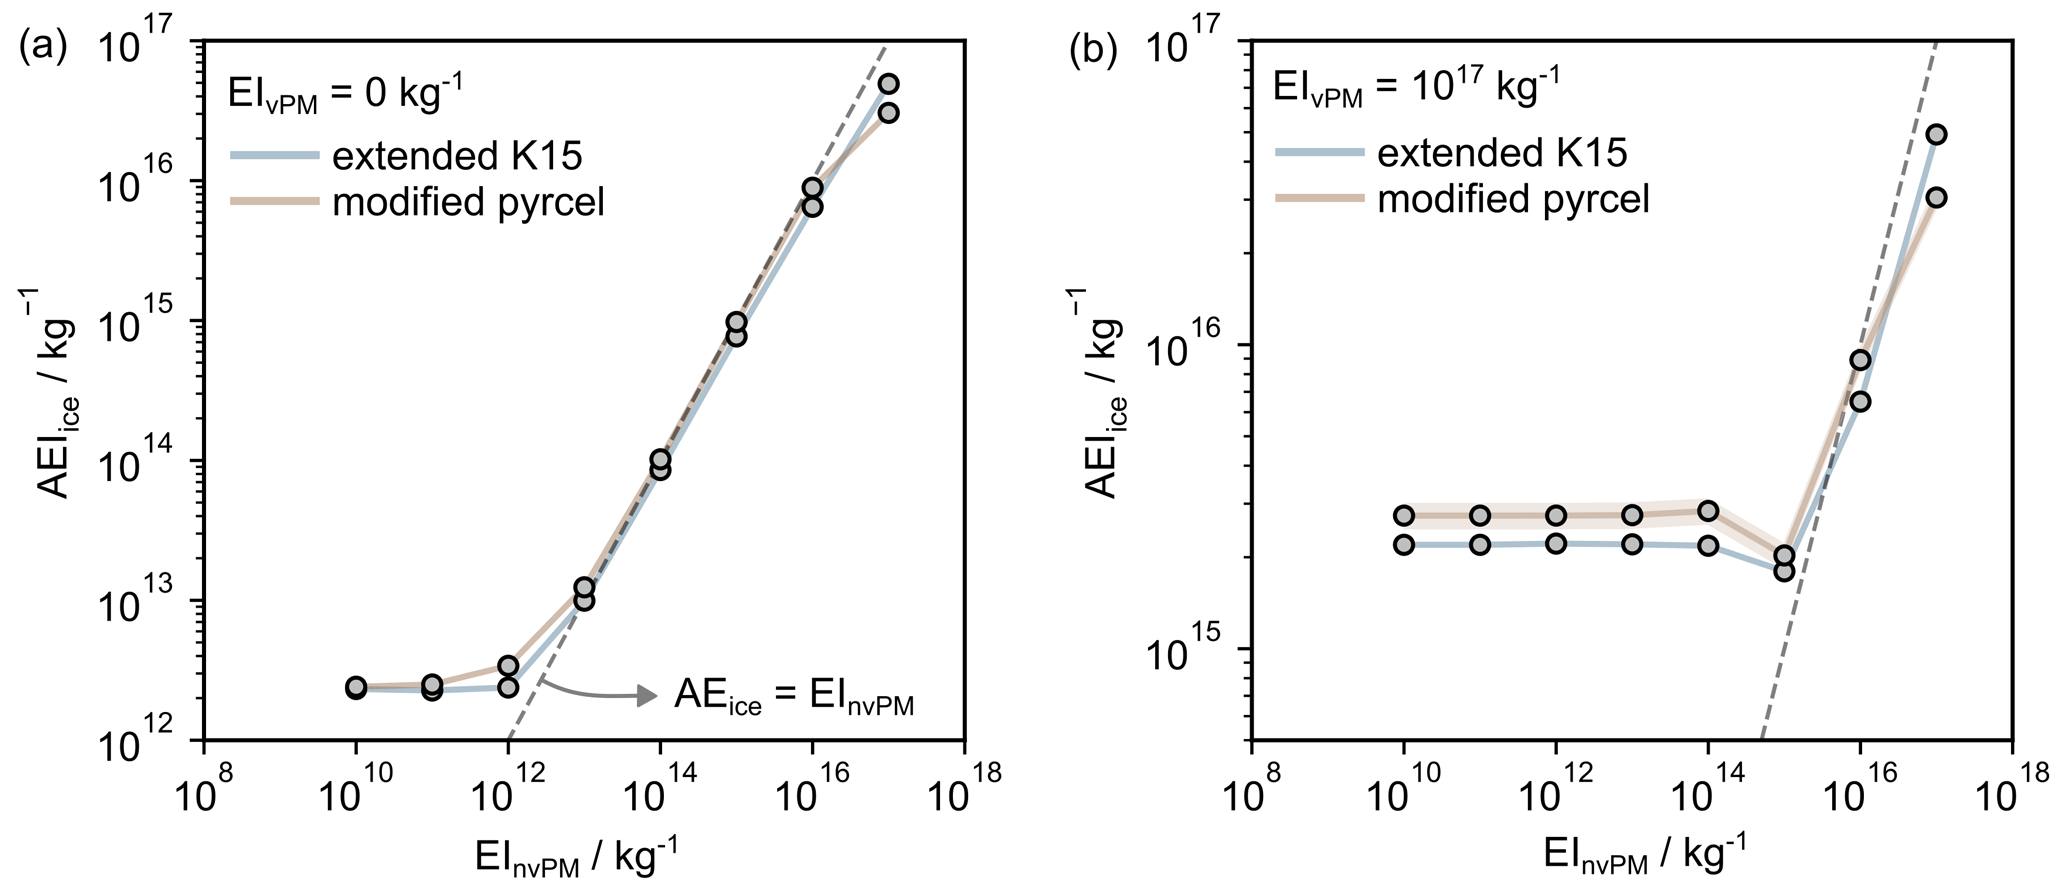
Figure 6The dependence of contrail AEIice on EInvPM as predicted by the modified pyrcel and extended K15 models. Model predictions have been made without (a) and with (b) the inclusion of plume vPM.
For EInvPM≥1016 kg−1, the extended K15 predicts higher AEIice than the modified pyrcel model because the extended K15 model does not consider feedback of water vapour between water droplets and ice crystals. To illustrate this effect, suppose we identify a temperature that is warm enough to avoid homogeneous ice nucleation but nonetheless cool enough to promote substantial particle activation, we find that the characteristics of the activated nvPM particles are different in the limit of small and large EInvPM. Note that these limiting values depend on particle size distribution characteristics and properties specified for the contrail mixing line; however, in the case of Fig. 6b, they are separated at EInvPM∼1016 kg−1. To that end, for EInvPM≥1016 kg−1, the available water vapour in the plume is distributed among many particles, and activated nvPM particles typically have values nm. Comparatively, for EInvPM<1016 kg−1, the nvPM wet-particle diameters are distributed quasi-normally and have values nm. For this reason, the condition for homogeneous ice nucleation is satisfied for each activated nvPM particle for EInvPM<1016 kg−1, since this is sensitive to the relative difference between wet- and dry-particle diameters, dw−dd. Hence, we find that the AEIice is always at least as large as the apparent emission index of activated particles. By comparison, for EInvPM≥1016 kg−1, given that the smaller activated nvPM particles have comparatively low dw−dd, their size is more sensitive to changes in local supersaturation. Therefore, when the largest activated nvPM particles begin to nucleate ice, this can result in smaller activated nvPM particles evaporating at their expense. In general terms, this is referred to as the Wegener–Bergeron–Findeisen (WBF) process (Korolev, 2007) and provides a rationale for the opposite trend observed in Figs. 6 and 5 for EInvPM≥1016 kg−1.
We have previously discussed the importance of vapour feedback between growing droplets and the evolving contrail mixing plume as a source of model agreement, highlighting the coupled nature of growing droplets. These effects are exacerbated by the WBF process, which implies that coupled feedback of water vapour occurring between ice crystals and growing droplets can also contribute to model disagreement. Only the modified pyrcel model is able to describe the kinetic treatment of vapour feedback between hydrometeors and the contrail mixing plume. For this reason, we can place more confidence in model predictions made by the modified pyrcel model than the extended K15 model. Additionally, inclusion of the Kelvin effect in the radial growth equation is only represented in the modified pyrcel model, which is critical for describing water uptake on plume vPM. Hence, we choose to use the modified pyrcel model for the following sensitivity studies.
4.4 Sensitivity to ambient temperature
An evaluation of the modified pyrcel model sensitivity across a range of TA and EInvPM revealed several key findings (Fig. 7). Firstly, AEIice follows a quasi-linear relationship with EInvPM only when EInvPM exceeds a temperature-dependent threshold that ranges between 1013 and 1016 kg−1. In this quasi-linear region, most ice crystals form via nvPM particles, which defines the “soot-rich” regime. Increasing TA decreases the peak plume supersaturation so that a reduced proportion of the nvPM particles can activate (Bräuer et al., 2021), which has a similar effect to decreasing dg,nvPM (see Sect. S10). The threshold EInvPM marks the point at which an equal number of contrail ice crystals are formed via nvPM particles and other particles in the plume. Therefore, below this threshold, EInvPM, the majority of ice crystals do not form via nvPM particles, which defines the “soot-poor” regime. Owing to the results in Fig. 7, “soot-poor” conditions always satisfy the baseline condition EInvPM≤1012 kg−1. Here, for warmer TA (∼TSAC), most contrail ice crystals form via ambient particles, and AEIice approaches an asymptotic limit governed by the assumed ambient particle number concentration. Recall that most ambient particles assumed in our simulations (see Table 1) are able to activate at ΔTSAC<1 K (see Fig. 3). As TA is reduced further (<TSAC), the increased peak plume supersaturation enables a greater proportion of plume vPM particles to activate (in addition to the ambient particles), and the limiting value of AEIice increases. Generally, the position of the threshold EInvPM increases with decreasing TA as a larger proportion of vPM particles can activate and therefore compete with nvPM particles for the plume supersaturation (Yu et al., 2024). These findings suggest that the EInvPM threshold separating the “soot-rich” and “soot-poor” regime should not be treated as a fixed value but rather as a dynamic threshold that varies with TA.
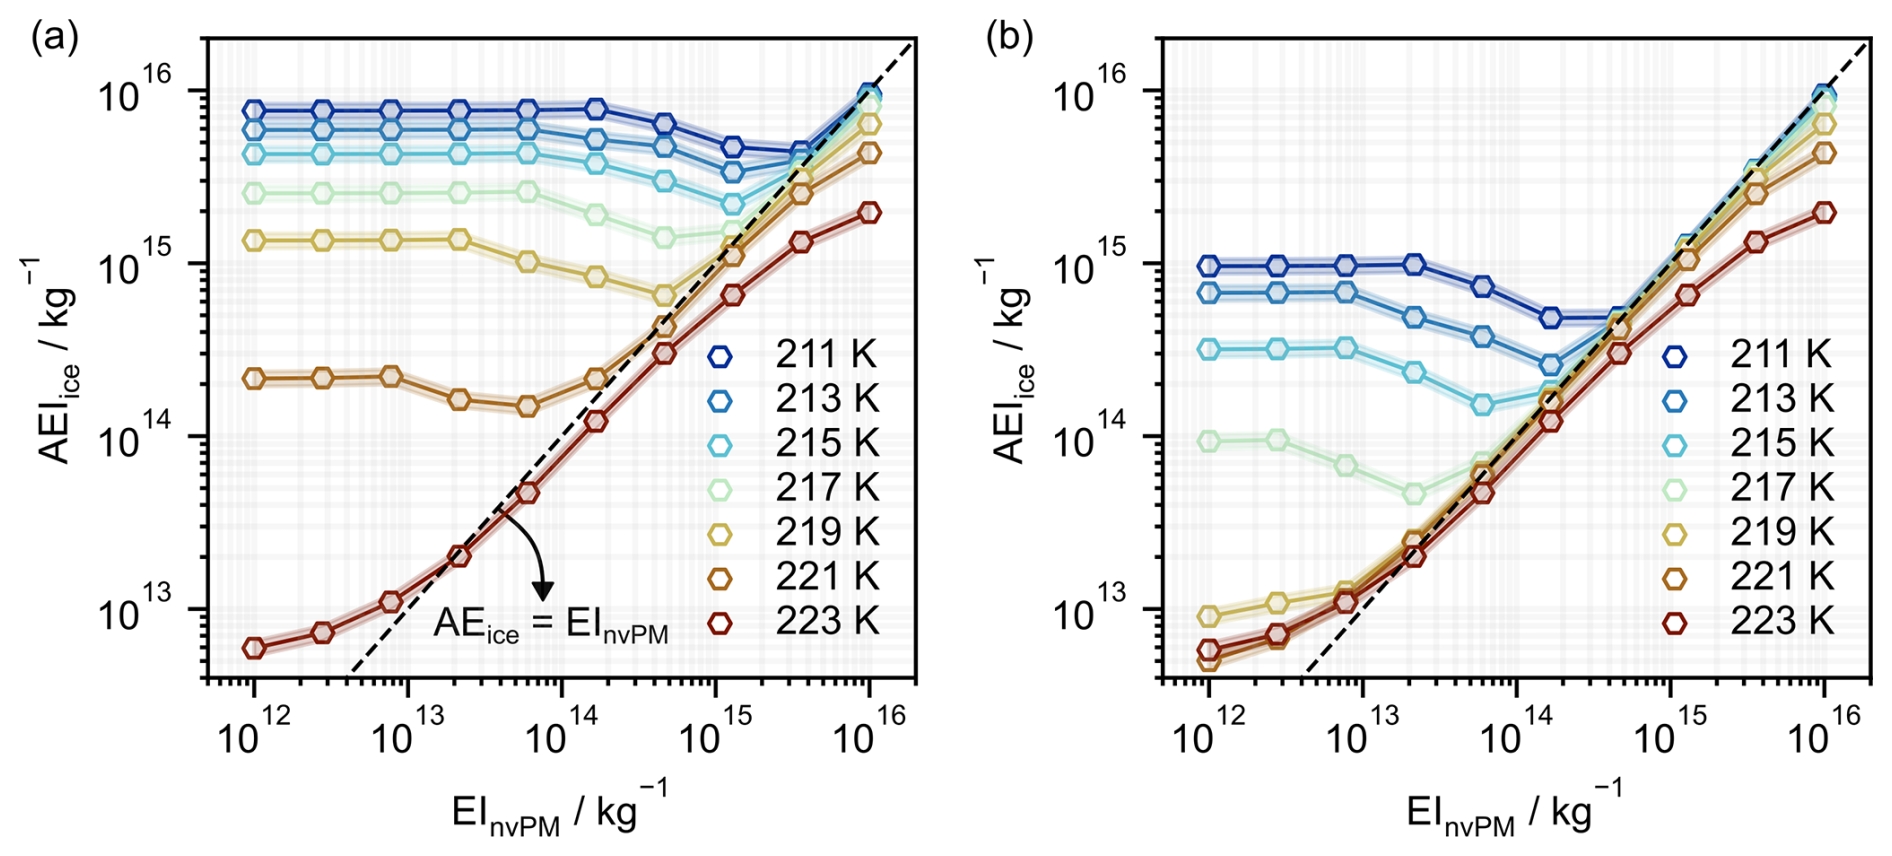
Figure 7The dependence of contrail AEIice on TA (211–223 K, corresponding to ΔTSAC of 2–13 K) and EInvPM for (a) sulfur-rich and (b) organic-rich plume vPM.
4.5 Sensitivity to plume vPM properties
Before continuing with our analysis, we emphasise that deq,vPM calculated using Eq. (27) provide us with an upper bound on the diameter of the volatile mode prior to maximum plume supersaturation; due to the kinetics of particle growth, this diameter is likely reached only after a timescale of minutes to hours (Kärcher et al., 2000). Furthermore, it is possible that some volatile material may condense on nvPM (if present), which would further reduce deq,vPM. Therefore, the equilibrium plume vPM diameters quoted in Fig. 8a should only be interpreted as upper bounds.
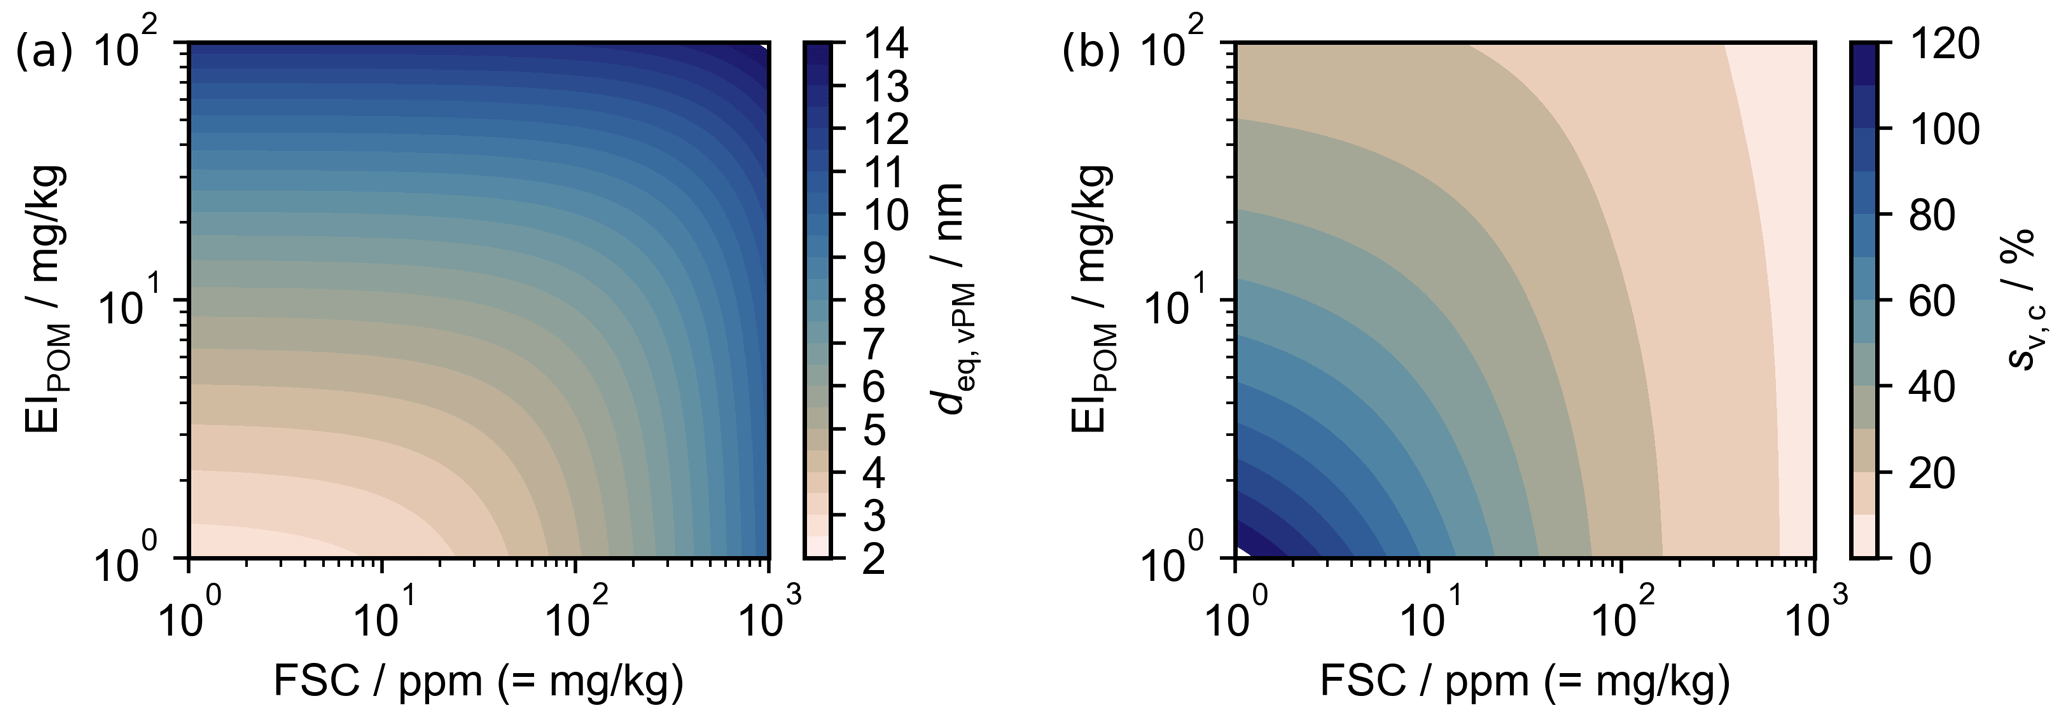
Figure 8(a) Equilibrium volatile particle modal diameter as a function of fuel sulfur content and the emission index of organic particulate matter, assuming a monomodal distribution and omitting the condensation of plume vPM on nvPM. (b) Peak plume supersaturation required to activate volatile particles described in panel (a). We have approximated , ε=3 %, and ρvPM as a mass-weighted sum of the densities of sulfuric acid and POM (1800 and 1000 kg m−3, respectively), assuming ideal mixing.
Figure 8a shows that dvPM increases with EIPOM and FSC. For high FSC values (∼1000 ppm), deq,vPM can reach values upwards of 10 nm. By contrast, for low FSC, the size becomes limited by POM, without which deq,vPM reaches 2–3 nm at most. In Fig. 8b, we use the hygroscopicity parameter for sulfuric acid and POM (assuming κPOM=0) to show how the critical saturation ratio depends on both FSC and POM. For low FSC and EIPOM, critical supersaturations exceeding 100 % are required for particle activation. However, the presence of nvPM typically precludes such high supersaturations (see Fig. 5); therefore, given that , volatile contributions to AEIice are likely low in the “soot-rich” regime. On the other hand, with increasing FSC, plume vPM activation becomes increasingly likely, as there are fewer nvPM particles available to quench the plume supersaturation.
As discussed, the results presented above are valid only for providing insight into the approximate equilibrium behaviour of plume vPM formation. Within a real contrail mixing plume, the time available for volatile particle growth by accretion of POM and/or sulfuric acid is reduced, and kinetics become important. To that end, the dependence of volatile mode characteristics on POM (including lubrication oil) and FSC has previously been investigated in simulations performed at cruise (Cantin et al., 2025; Rojo et al., 2015) and ground level (Jones and Miake-Lye, 2024; Wong et al., 2014, 2015). Next, we investigate the dependence of contrail AEIice on prescribed vPM properties in the modified pyrcel model
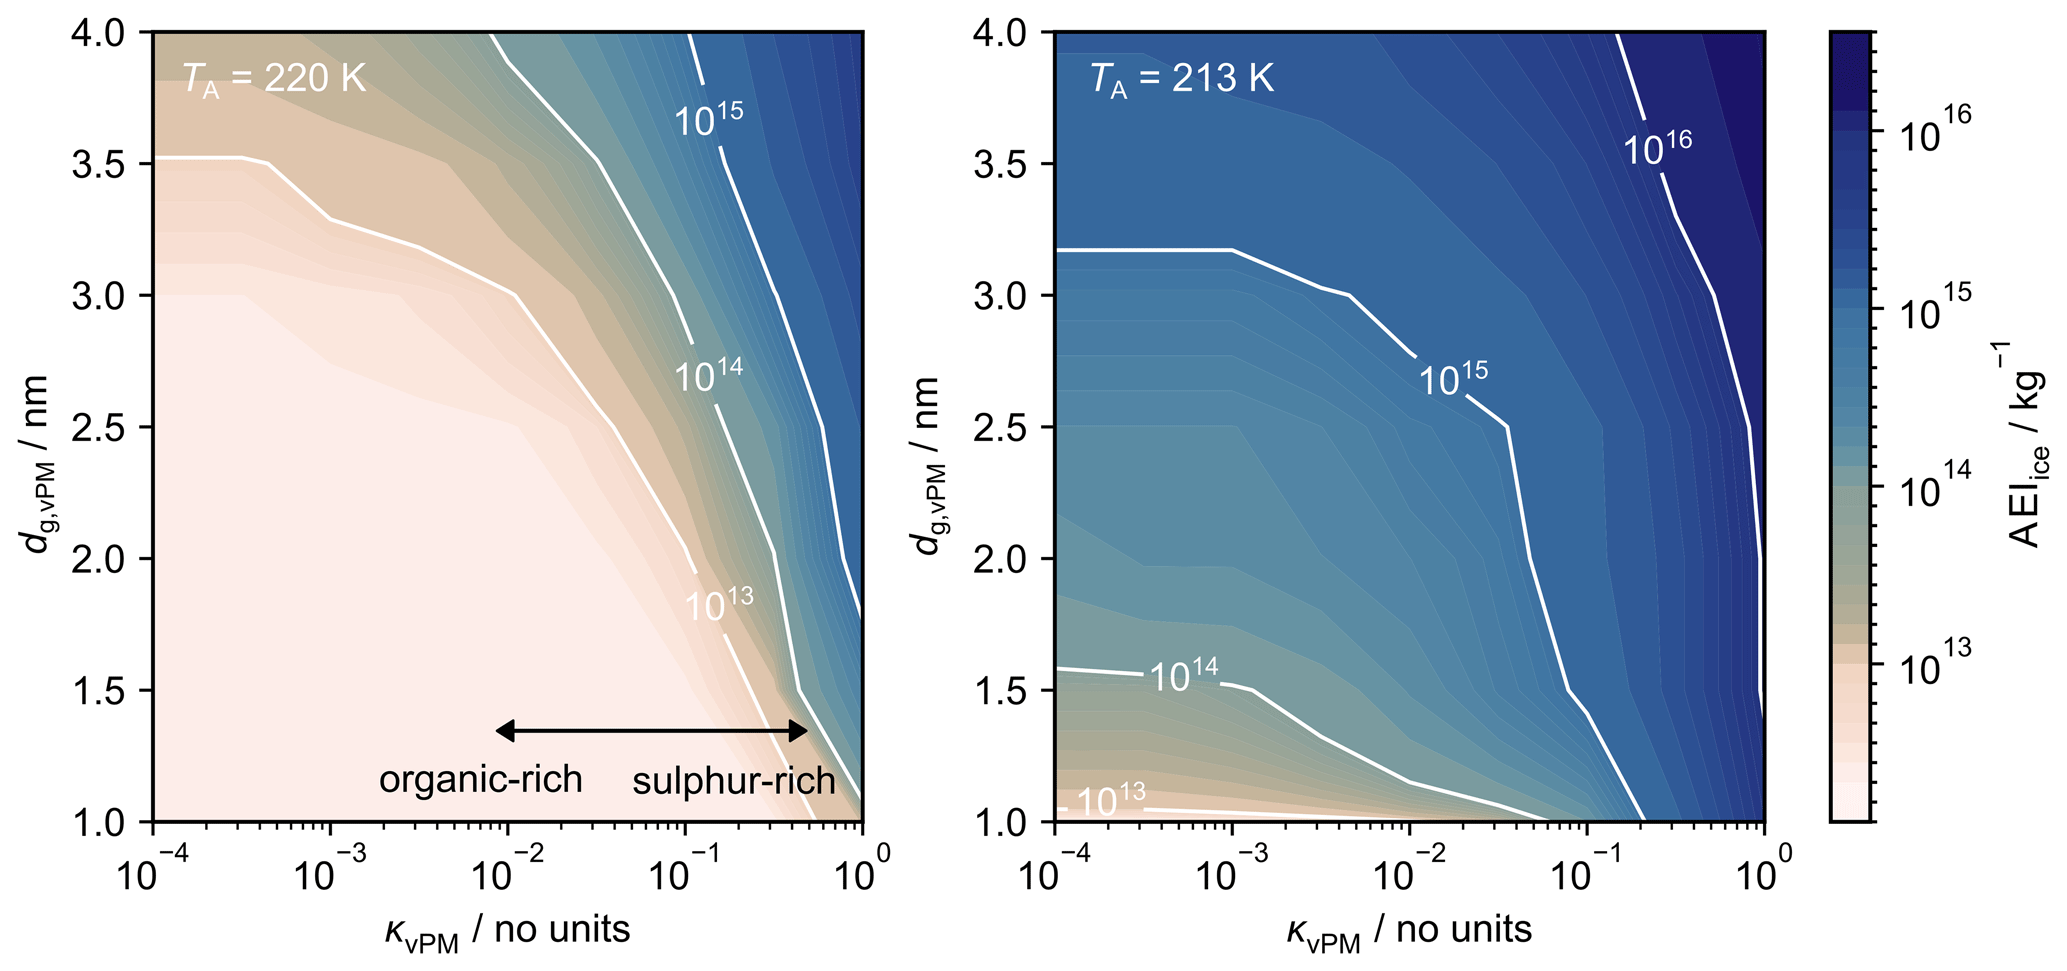
Figure 9The dependence of contrail AEIice on the plume vPM properties (dg,vPM and κvPM) at ambient temperatures of (a) 220 K and (b) 213 K. For both scenarios, the assumed particle properties are outlined in Table 1; EIvPM and EInvPM are assumed to be 1017 and 1012 kg−1, respectively (in line with the “soot-poor” baseline conditions described in Sect. 4.4); and the contrail AEIice is simulated using the modified pyrcel model with model time steps of 0.1 ms and a maximum duration of 0.5 s.
Figure 9 demonstrates the sensitivity of the modified pyrcel model to the properties of the plume vPM mode in the “soot-poor” regime, subject to our assumptions on the hygroscopicity of the condensable POM. Our results suggest that a sulfur-rich plume vPM mode can lead to AEIice>1015 kg−1, even when nm. Conversely, when the plume vPM mode is organic-rich, the AEIice only rises above 1015 kg−1 under extremal conditions (i.e. low TA and high dg,vPM). For most other cases, AEIice≪1015 kg−1, and the organic-rich plume vPM mode competes with ambient particles for plume supersaturation. Therefore, if soot particle emissions could be reduced in the vicinity of 1012 kg−1, provided the volatile particle mode is largely composed of sulfuric acid, we anticipate only a small reduction in AEIice values relative to “soot-rich” exhausts. On the other hand, if the volatile particle mode is largely composed of organic material, we find that AEIice values could be reduced by a factor of up to 100, with benefits ultimately constrained by the size of the plume vPM particles and the properties of entrained ambient particles.
4.6 Sensitivity to aircraft parameters
The final sensitivity analysis will focus on the gradient of the SAC contrail mixing line (Kärcher et al., 2015), which contains important information about aircraft and fuel properties; see Sect. 2.1. Simultaneously, we will explore the sensitivity to ambient temperature so that the resulting output, AEIice (G,TA), provides a useful reference for estimating AEIice for various combinations of aircraft properties and ambient conditions under “soot-poor” conditions, as defined in Sect. 4.4. For both these scenarios, a sulfur-rich volatile mode was prescribed, as in Sect. 3.4.
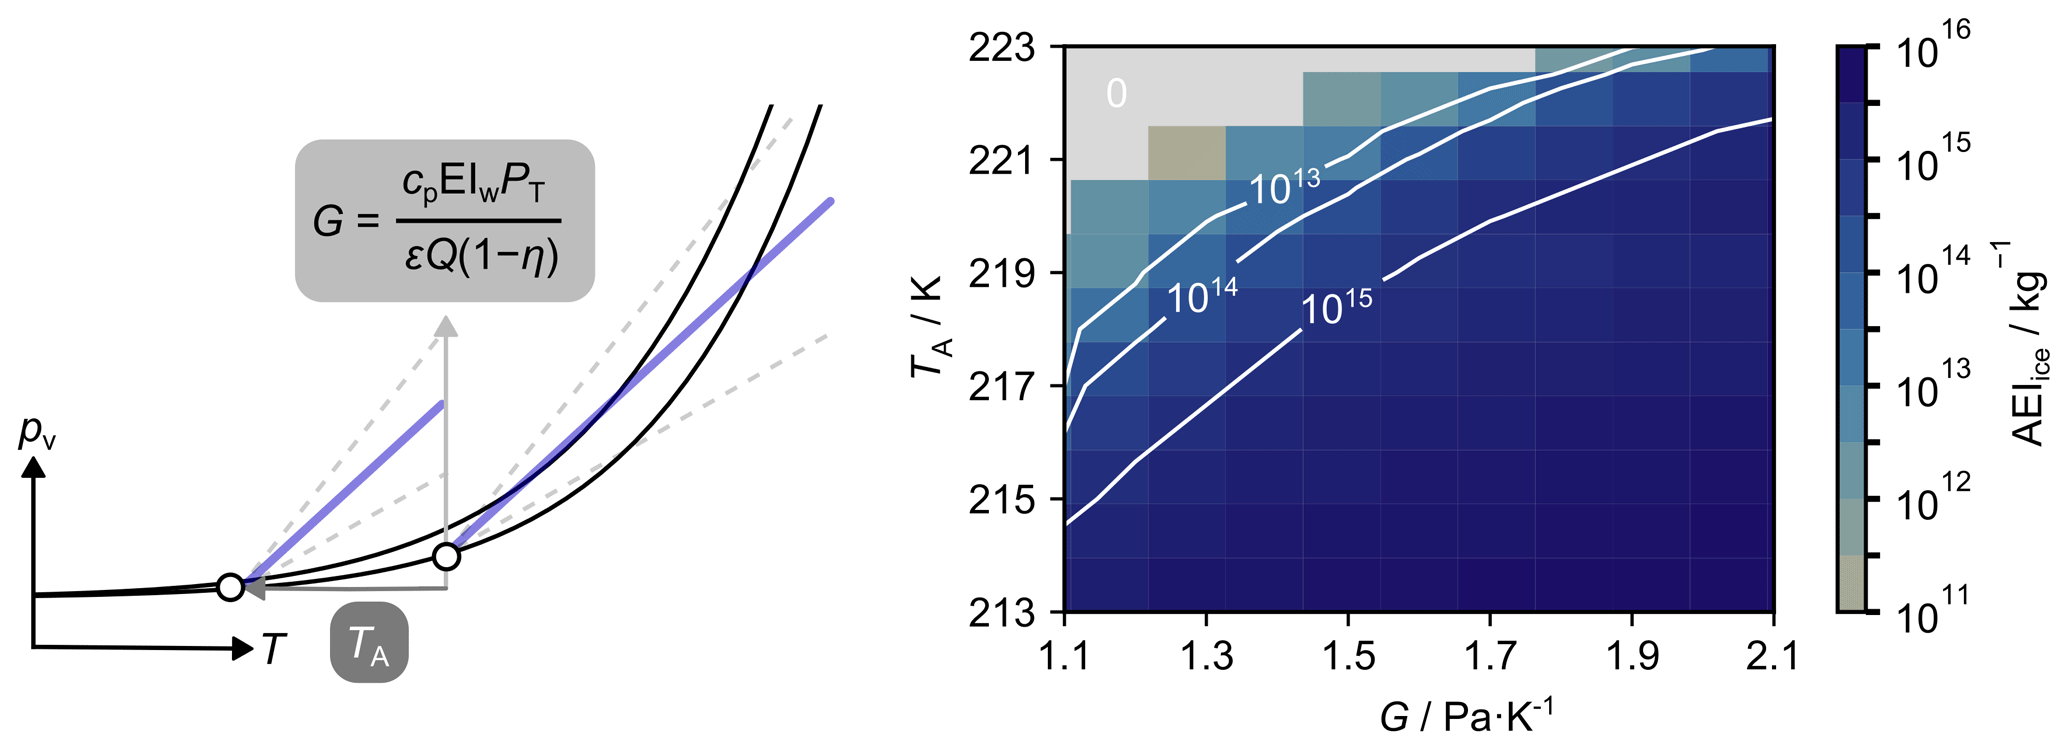
Figure 10The dependence of contrail AEIice on TA and the gradient of the contrail mixing line, as defined in Eq. (1). The simulation was performed for sulfur-rich plume vPM and EInvPM of 1012 kg−1, in line with the “soot-poor” baseline conditions described in Sect. 4.4. The region shaded in grey corresponds to AEIice = 0. Physically, this represents mixing lines that do not intersect the water saturation line.
Figure 10 shows how the AEIice varies as a function of G and TA for “soot-poor” baseline conditions as described in Sect. 4.4 and sulfur-rich plume vPM. For a fixed ambient temperature, increasing G leads to an increased peak plume supersaturation and hence an increase in AEIice. For ambient temperatures with ΔTSAC>10 K (here, TA>215 K), enhancements of up to 3 orders of magnitude are observed within the prospective range of G values for kerosene-based fuel (1.1–2.2). This aligns with results from the original SAC framework, namely that parameters such as overall efficiency (Schumann, 2000), cruise altitude (Gryspeerdt et al., 2024), and water vapour emissions are critical for estimating the resulting contrail ice crystal properties and hence the radiative impact of contrail cirrus.
Here, we contextualise several of the key findings from Sect. 4 for global contrail simulations (Sect. 5.1), contrail mitigation (Sect. 5.2), and engine and fuel technologies (Sect. 5.3).
5.1 Global contrail simulations
Several contrail simulations rely on nvPM (and ambient particle) properties to parameterise AEIice in young contrails (Bier and Burkhardt, 2022; Teoh et al., 2024). In the “soot-poor” regime, we find that including the activation of plume vPM might enhance AEIice by up to 3 orders of magnitude. Increased AEIice is correlated with contrail RF (Burkhardt et al., 2018), implying that these current global contrail simulations may underestimate global contrail forcing. Importantly, as the AEIice predictions are sensitive to the assumed properties of plume vPM and as these are highly uncertain at present, a global contrail simulation relying on the extended K15 model would serve only as a sensitivity study.
5.2 Contrail mitigation
Operational contrail mitigation has hitherto focused on circumventing regions where si>0 in order to mitigate contrail persistence. Our simulations imply that, under “soot-poor” conditions and for flights within 5 K of TSAC, increasing the ambient temperature by 2 K may reduce AEIice by up to a factor of 10 (see Fig. 9). If this behaviour could be experimentally validated, an analogous strategy might be possible by circumventing cooler regions of the upper troposphere, to mitigate contrail formation under “soot-poor” conditions. Moreover, maximum predictive biases between the European Centre for Medium-Range Weather Forecasts (ECMWF) ERA5 atmospheric reanalysis model and In-service Aircraft for A Global Observing System (IAGOS) observations of TA and si are −0.2 % and −5.5 %, respectively (Wolf et al., 2025), which implies that atmospheric requirements for contrail formation can be predicted more accurately than for contrail persistence. Assuming an upper-tropospheric lapse rate of −6.5 K km−1 per the ICAO standard atmosphere (ICAO, 1993), a 2 K temperature difference corresponds to approximately 10 flight levels (1000 ft or 305 m). This is equivalent to the reduced vertical separation minima between aircraft in the FL 290–FL 410 flight band (ICAO, 2012), which implies that it might be possible to adjust TA by making relatively small changes in elevation. Using TA data from ECMWF, we explore this further in Sect. S12. Nevertheless, avoidance of local cold spots would likely involve reducing aircraft cruise altitudes, which may increase (a) the likelihood for aircraft emissions to perturb clouds in the mixed-phase regime, (b) the number of turbulence events (Dehghan et al., 2014), and (c) direct emissions of CO2. Therefore, we reiterate that this approach is subject to both inherent model uncertainties and the aforementioned concerns (a)–(c), which need to be resolved before this is explored further.
5.3 Engine and fuel technologies
Aircraft powered by lean-burn combustors have EInvPM that range between 1010 and 1012 kg−1 (EASA, 2025), which coincides with our definition for the “soot-poor” regime given in Sect. 4.4. Under these conditions, AEIice is controlled by the properties of plume vPM emissions and TA (see Fig. 9). Therefore, AEIice can be reduced practically by (a) avoiding cooler ambient temperatures (see Sect. 5.1) and (b) reducing the mass of condensable volatile material. To that end, we suggest the removal of lubrication oil emissions and diminution of FSC. In Sect. 4.4, we demonstrate that FSC scales with the mass of condensable sulfuric acid. Therefore, for fixed EIvPM, increasing FSC may produce plume vPM particles with higher dg,vPM and higher κvPM. This intuition agrees with results collated across various flight campaigns, showing that EIvPM for particles larger than 5 nm increases with increasing FSC (Schumann et al., 2002). In the “soot-poor” regime, AEIice and hence the potential contrail climate impact increase with dg,vPM and κvPM. Therefore, we would advise that FSC is reduced as low as practicably possible, as FSC levels of several ppm (assuming EIPOM=0 kg−1) are sufficient to produce plume vPM particles with deq,vPM on the order of several nm (see Sect. 4.5). We note that comparable FSC reductions have been successfully demonstrated in other sectors (IMO, 2022) and that the largest benefits would be achieved if low-FSC fuels were used in lean-burn engines, where AEIice values are most sensitive to the properties of plume vPM emissions.
Finally, measurements show that SAF can reduce both EInvPM and dg,nvPM relative to conventional fuel (Moore et al., 2017; Voigt et al., 2021). Under conditions where most contrail ice crystals form via nvPM particles, both changes would reduce AEIice, as fewer particles are able to activate at a given supersaturation. These effects have previously been reported using contrail parcel model simulations to compare with ECLIF (Emission and CLimate Impact of alternative Fuels) measurements (Yu et al., 2024). Additionally, for variable EInvPM and fixed plume vPM properties, decreasing dg,nvPM would increase the position of the minimum in Fig. 9 (see Sect. S10).
Here, we extended two parcel models to describe particle microphysics during the early stages (t < 1 s) of contrail plume evolution. Firstly, the minimal framework originally developed by Kärcher et al. (2015) was extended to account for plume vPM by incorporating an additional particle mode. We replaced several analytical approximations with numerical solutions and increased the accuracy of others so that the model could be more applicable for describing the activation of plume vPM. Secondly, using similar parameterisations for the mixing process but a higher-fidelity description of Lw, a cloud parcel model (pyrcel) (Rothenberg and Wang, 2016) was modified to treat contrail formation and used as a benchmark for model comparison.
We found the extended K15 model systematically underpredicted the peak plume supersaturations when compared to the modified pyrcel model. This is likely because it does not incorporate the Kelvin effect and therefore overpredicts droplet growth rates. Generally, the estimated AEIice from both models are within 35 % for EInvPM≤1016 kg−1, when activation of plume vPM is excluded. However, when plume vPM activation is included, the modified pyrcel model predicts higher ice crystal number concentrations by 10 %–30 % for EInvPM≤1013 kg−1. Discrepancies are more pronounced for EInvPM>1013 kg−1 due to differing treatment of kinetics and water vapour competition between hydrometeors between models.
Using the modified pyrcel model, we performed several sensitivity studies and found that, across EInvPM, the AEIice decreases with decreasing peak plume supersaturations as predicted by the original SAC mixing line. This is controlled by the ambient relative humidity, TA, and the gradient of the mixing line. Therefore, decreasing the overall efficiency and water vapour emissions results in fewer contrail ice crystals being produced. Also, we find that the threshold between “soot-rich” and “soot-poor” conditions (as defined in Sect. 4.4) is sensitive to the properties of plume vPM (EIvPM, dg,vPM, κvPM) and TA and should therefore be treated as a dynamic threshold. Notably, we find that the threshold EInvPM increases with decreasing TA as an increasing proportion of vPM particles are able to compete with nvPM particles for the plume supersaturation. In the “soot-poor” regime, including plume vPM activation leads to AEIice enhancements by up to 3 orders of magnitude; these are maximised if the material is highly hygroscopic (e.g. sulfur-rich).
As the aviation industry reduces EInvPM and therefore approaches the “soot-poor” regime, we find that existing contrail cirrus models that do not extend to include plume vPM activation will underestimate AEIice and therefore global climate forcing. Future research should be directed towards (i) ground-based and in situ measurements focusing on the “soot-poor” regime and its transition towards the “soot-rich” regime, with near-field characterisation of both nvPM and plume vPM properties; (ii) laboratory measurements of the activation properties and/or ice-nucleating ability of particles representative of plume vPM present in nascent contrail exhausts; and (iii) validation of plume aerosol and contrail formation models (parcel model/LES simulations) using in situ observations.
| SAC | Schmidt–Appleman Criterion |
| nvPM | Non-volatile particulate matter |
| vPM | Volatile particulate matter |
| EIvPM, EInvPM | Number emission index of vPM, nvPM |
| SAF | Sustainable aviation fuel |
| dg | Geometric mean diameter |
| σg | Geometric standard deviation |
| K15 | Microphysical model developed by Kärcher et al. (2015) |
| TE | Gas temperature at the engine exit plane |
| TA | Ambient temperature |
| T | Plume temperature |
| G | Gradient of average contrail mixing line |
| pv,M | Partial pressure of water vapour in the contrail mixing plume |
| pv,E | Partial pressure of water vapour at the engine exit plane |
| pv,A | Partial pressure of water vapour in the ambient environment |
| cp | Isobaric specific heat capacity of air |
| EIw | Mass emission index of water vapour |
| PT | Total air pressure |
| ε | Ratio of gas constants for water vapour and dry air |
| Q | Total heat released per mass of fuel burned |
| η | Overall aircraft efficiency |
| pliq, pice | Saturation vapour pressure above a plane surface of supercooled water, ice |
| Sv,M, Si,M | Water, ice saturation ratio in a contrail mixing plume |
| sv,M | Water supersaturation in a contrail mixing plume |
| TSAC | SAC temperature |
| ΔTSAC | Difference between the ambient and SAC temperatures (TSAC–TA) |
| Sv | Water saturation ratio above a liquid droplet |
| aw | Water activity |
| σs | Surface tension at the droplet–air interface |
| Mw | Molar mass of water |
| ρw | Density of water |
| R | Global gas constant |
| dw | Wet-particle diameter |
| dd | Dry-particle diameter |
| κ | Hygroscopicity parameter |
| dw,c, rw,c | Critical wet-particle diameter, radius |
| Sv,c | Critical water saturation ratio |
| wv | Water vapour mixing ratio |
| wc | Mixing ratio of condensed water vapour |
| Pw | Water (super)saturation production rate in the absence of particles |
| Lw | Water (super)saturation depletion rate due to particle activation and droplet growth |
| β | Plume dilution parameter |
| D | Plume dilution factor |
| τm | Timescale over which contrail mixing is unaffected by entrainment |
| N0 | Mass-based mixing factor |
| nT | Total number concentration of aircraft-mode particles |
| na,T | Total number concentration of ambient-mode particles |
| na,0 | Ambient particle number concentration |
| ρa | Mass density of ambient air |
| Radial droplet growth rate | |
| nw | Droplet number concentration |
| Rate of change of droplet number concentration | |
| FSC | Fuel sulfur content |
| POM | Particulate organic matter |
| Mass emission index of sulfuric acid | |
| EIPOM | Mass emission index of POM |
| εs | Conversion efficiency of sulfur to sulfuric acid |
| deq,vPM | vPM equilibrium diameter |
| ρvPM | Density of condensed vPM |
| θG | threshold contrail formation temperature at pliq |
Code for the modified pyrcel model and extended K15 model is available at https://doi.org/10.5281/zenodo.16901327 (Rothenberg et al., 2025) and https://doi.org/10.5281/zenodo.16901290 (Ponsonby, 2025). The results shown in study can be generated using this code.
The supplement related to this article is available online at https://doi.org/10.5194/acp-25-18617-2025-supplement.
JP and MEJS conceptualised the project. JP developed the software, conducted the initial investigation, and wrote the original article. All the authors developed the methodology and edited the article. MEJS supervised the project and acquired funding.
The contact author has declared that none of the authors has any competing interests.
Publisher's note: Copernicus Publications remains neutral with regard to jurisdictional claims made in the text, published maps, institutional affiliations, or any other geographical representation in this paper. While Copernicus Publications makes every effort to include appropriate place names, the final responsibility lies with the authors. Views expressed in the text are those of the authors and do not necessarily reflect the views of the publisher.
We would like to thank Daniel Rothenberg for helpful discussions on revising pyrcel to describe contrail formation, Fangqun Yu for his insight on the model description of plume vPM, and Christiane Voigt for useful discussions on model comparison with in situ measurement data. Finally, we would like to thank Yu Wang for providing the ECHAM-HAM data used in Sect. S5.
This research has been supported by the Engineering and Physical Sciences Research Council (grant no. EP/S023593/1). Funding was also received from the European Union's Horizon Europe Research and Innovation programme (grant agreement no. 101192301).
This paper was edited by Ken Carslaw and reviewed by two anonymous referees.
Airbus: Airbus Global Market Forecast 2025–2044, https://www.airbus.com/en/products-services/commercial-aircraft/global-market-forecast/ (last access: 14 October 2025), 2024.
Arnold, F., Kiendler, A., Wiedemer, V., Aberle, S., Stilp, T., and Busen, R.: Chemiion concentration measurements in jet engine exhaust at the ground: Implications for ion chemistry and aerosol formation in the wake of a jet aircraft, Geophysical Research Letters, 27, 1723–1726, https://doi.org/10.1029/1999GL011096, 2000.
Bier, A. and Burkhardt, U.: Impact of Parametrizing Microphysical Processes in the Jet and Vortex Phase on Contrail Cirrus Properties and Radiative Forcing, JGR Atmospheres, 127, e2022JD036677, https://doi.org/10.1029/2022JD036677, 2022.
Bier, A., Unterstrasser, S., and Vancassel, X.: Box model trajectory studies of contrail formation using a particle-based cloud microphysics scheme, Atmos. Chem. Phys., 22, 823–845, https://doi.org/10.5194/acp-22-823-2022, 2022.
Bier, A., Unterstrasser, S., Zink, J., Hillenbrand, D., Jurkat-Witschas, T., and Lottermoser, A.: Contrail formation on ambient aerosol particles for aircraft with hydrogen combustion: a box model trajectory study, Atmos. Chem. Phys., 24, 2319–2344, https://doi.org/10.5194/acp-24-2319-2024, 2024.
Bräuer, T., Voigt, C., Sauer, D., Kaufmann, S., Hahn, V., Scheibe, M., Schlager, H., Diskin, G. S., Nowak, J. B., DiGangi, J. P., Huber, F., Moore, R. H., and Anderson, B. E.: Airborne Measurements of Contrail Ice Properties – Dependence on Temperature and Humidity, Geophysical Research Letters, 48, e2020GL092166, https://doi.org/10.1029/2020GL092166, 2021.
Burkhardt, U., Bock, L., and Bier, A.: Mitigating the contrail cirrus climate impact by reducing aircraft soot number emissions, npj Clim Atmos Sci, 1, 37, https://doi.org/10.1038/s41612-018-0046-4, 2018.
Cantin, S., Chouak, M., and Garnier, F.: Effects of fuel sulfur content and nvPM emissions on contrail formation: A CFD-microphysics study including the role of organic compounds, Journal of Aerosol Science, 188, 106612, https://doi.org/10.2139/ssrn.5138455, 2025.
Cumpsty, N. A.: Jet propulsion: a simple guide to the aerodynamics and thermodynamic design and performance of jet engines, 2nd ed., Cambridge University Press, Cambridge, U.K., New York, NY, USA, 303 pp., 2003.
Decker, Z. C. J., Alpert, P. A., Ammann, M., Anet, J. G., Bauer, M., Cui, T., Durdina, L., Edebeli, J., Gysel-Beer, M., Prévôt, A. S. H., Qi, L., Slowik, J. G., Spirig, C., Tinorua, S., Ungeheuer, F., Vogel, A., Zhang, J., and Brem, B. T.: Emission and Formation of Aircraft Engine Oil Ultrafine Particles, ACS EST Air, 1, 1662–1672, https://doi.org/10.1021/acsestair.4c00184, 2024.
Dehghan, A., Hocking, W. K., and Srinivasan, R.: Comparisons between multiple in situ aircraft turbulence measurements and radar in the troposphere, Journal of Atmospheric and Solar-Terrestrial Physics, 118, 64–77, https://doi.org/10.1016/j.jastp.2013.10.009, 2014.
Durdina, L., Durand, E., Edebeli, J., Spirig, C., Brem, B. T., Elser, M., Siegerist, F., Johnson, M., Sevcenco, Y. A., and Crayford, A. P.: Characterizing and Predicting nvPM Size Distributions for Aviation Emission Inventories and Environmental Impact, Environ. Sci. Technol., 58, 10548–10557, https://doi.org/10.1021/acs.est.4c02538, 2024.
EASA: ICAO Aircraft Engine Emissions Databank, https://www.easa.europa.eu/en/domains/environment/icao-aircraft-engine-emissions-databank (last access date: 14 October 2025), 2025.
Ferreira, T., Alonso, J. J., and Gorlé, C.: Developing a Numerical Framework for the High-Fidelity Simulation of Contrails: Sensitivity Analysis for Conventional Contrails, in: AIAA AVIATION FORUM AND ASCEND 2024, AIAA AVIATION FORUM AND ASCEND 2024, Las Vegas, Nevada, https://doi.org/10.2514/6.2024-3775, 2024.
Grewe, V., Gangoli Rao, A., Grönstedt, T., Xisto, C., Linke, F., Melkert, J., Middel, J., Ohlenforst, B., Blakey, S., Christie, S., Matthes, S., and Dahlmann, K.: Evaluating the climate impact of aviation emission scenarios towards the Paris agreement including COVID-19 effects, Nat Commun, 12, 3841, https://doi.org/10.1038/s41467-021-24091-y, 2021.
Gryspeerdt, E., Stettler, M. E. J., Teoh, R., Burkhardt, U., Delovski, T., Driver, O. G. A., and Painemal, D.: Operational differences lead to longer lifetimes of satellite detectable contrails from more fuel efficient aircraft, Environ. Res. Lett., 19, 084059, https://doi.org/10.1088/1748-9326/ad5b78, 2024.
Gysel, M., Nyeki, S., Weingartner, E., Baltensperger, U., Giebl, H., Hitzenberger, R., Petzold, A., and Wilson, C. W.: Properties of jet engine combustion particles during the PartEmis experiment: Hygroscopicity at subsaturated conditions, Geophysical Research Letters, 30, 2003GL016896, https://doi.org/10.1029/2003GL016896, 2003.
Haverkamp, H., Wilhelm, S., Sorokin, A., and Arnold, F.: Positive and negative ion measurements in jet aircraft engine exhaust: concentrations, sizes and implications for aerosol formation, Atmospheric Environment, 38, 2879–2884, https://doi.org/10.1016/j.atmosenv.2004.02.028, 2004.
ICAO: Manual Of The Icao Standard Atmosphere – extended to 80 kilometres / 262,500 feet (Doc 7488), 3rd edn., https://store.icao.int/en/manual-of-the-icao-standard-atmosphere-extended-to-80-kilometres-262500-feet-doc-7488 (last access 14 October 2025), 1993.
ICAO: Manual on Implementation Vertical Separation (Doc 9574), 3rd edn., https://store.icao.int/en/manual-on-implementation-vertical-separation-doc-9574 (last access 14 October 2025), 2012.
IMO: Amendment MEPC.234(75) of the International Convention for the Prevention of Pollution from Ships (MARPOL) Annex VI: Regulations for the Prevention of Air Pollution from Ships, https://wwwcdn.imo.org/localresources/en/OurWork/Environment/Documents/Air pollution/MEPC.324(75).pdf (last access: 14 October 2025), 2022.
Jones, S. H. and Miake-Lye, R. C.: Parameterization of H2 SO4 and organic contributions to volatile PM in aircraft plumes at ground idle, Journal of the Air & Waste Management Association, 74, 490–510, https://doi.org/10.1080/10962247.2024.2354820, 2024.
Kärcher, B.: Formation and radiative forcing of contrail cirrus, Nat Commun, 9, 1824, https://doi.org/10.1038/s41467-018-04068-0, 2018.
Kärcher, B. and Fahey, D. W.: The role of sulfur emission in volatile particle formation in jet aircraft exhaust plumes, Geophysical Research Letters, 24, 389–392, https://doi.org/10.1029/97GL00119, 1997.
Kärcher, B. and Lohmann, U.: A Parameterization of cirrus cloud formation: Homogeneous freezing including effects of aerosol size, Journal of Geophysical Research: Atmospheres, 107, AAC 9-1–AAC 9-10, https://doi.org/10.1029/2001JD001429, 2002a.
Kärcher, B. and Lohmann, U.: A parameterization of cirrus cloud formation: Homogeneous freezing of supercooled aerosols, Journal of Geophysical Research: Atmospheres, 107, AAC 4-1–AAC 4-10, https://doi.org/10.1029/2001JD000470, 2002b.
Kärcher, B. and Yu, F.: Role of aircraft soot emissions in contrail formation, Geophysical Research Letters, 36, 2008GL036649, https://doi.org/10.1029/2008GL036649, 2009.
Kärcher, B., Turco, R. P., Yu, F., Danilin, M. Y., Weisenstein, D. K., Miake-Lye, R. C., and Busen, R.: A unified model for ultrafine aircraft particle emissions, J. Geophys. Res., 105, 29379–29386, https://doi.org/10.1029/2000JD900531, 2000.
Kärcher, B., Hendricks, J., and Lohmann, U.: Physically based parameterization of cirrus cloud formation for use in global atmospheric models, Journal of Geophysical Research: Atmospheres, 111, https://doi.org/10.1029/2005JD006219, 2006.
Kärcher, B., Burkhardt, U., Bier, A., Bock, L., and Ford, I. J.: The microphysical pathway to contrail formation, JGR Atmospheres, 120, 7893–7927, https://doi.org/10.1002/2015JD023491, 2015.
Kärcher, B., Marcolli, C., and Mahrt, F.: The Role of Mineral Dust Aerosol Particles in Aviation Soot-Cirrus Interactions, JGR Atmospheres, 128, e2022JD037881, https://doi.org/10.1029/2022JD037881, 2023.
Khou, J. C., Ghedhaïfi, W., Vancassel, X., Montreuil, E., and Garnier, F.: CFD simulation of contrail formation in the near field of a commercial aircraft: Effect of fuel sulfur content, metz, 26, 585–596, https://doi.org/10.1127/metz/2016/0761, 2017.
Khou, J.-C., Ghedhaïfi, W., Vancassel, X., and Garnier, F.: Spatial Simulation of Contrail Formation in Near-Field of Commercial Aircraft, Journal of Aircraft, 52, 1927–1938, https://doi.org/10.2514/1.C033101, 2015.
Koop, T., Luo, B., Tsias, A., and Peter, T.: Water activity as the determinant for homogeneous ice nucleation in aqueous solutions, Nature, 406, 611–614, https://doi.org/10.1038/35020537, 2000.
Korolev, A.: Limitations of the Wegener–Bergeron–Findeisen Mechanism in the Evolution of Mixed-Phase Clouds, Journal of the Atmospheric Sciences, 64, 3372–3375, https://doi.org/10.1175/JAS4035.1, 2007.
Korolev, A. V. and Mazin, I. P.: Supersaturation of Water Vapor in Clouds, Journal of the Atmospheric Sciences, 60, 2957–2974, https://doi.org/10.1175/1520-0469(2003)060<2957:SOWVIC>2.0.CO;2, 2003.
Kumar, P., Sokolik, I. N., and Nenes, A.: Parameterization of cloud droplet formation for global and regional models: including adsorption activation from insoluble CCN, Atmos. Chem. Phys., 9, 2517—2532, https://doi.org/10.5194/acp-9-2517-2009, 2009.
Lee, D. S., Fahey, D. W., Skowron, A., Allen, M. R., Burkhardt, U., Chen, Q., Doherty, S. J., Freeman, S., Forster, P. M., Fuglestvedt, J., Gettelman, A., De León, R. R., Lim, L. L., Lund, M. T., Millar, R. J., Owen, B., Penner, J. E., Pitari, G., Prather, M. J., Sausen, R., and Wilcox, L. J.: The contribution of global aviation to anthropogenic climate forcing for 2000 to 2018, Atmospheric Environment, 244, 117834, https://doi.org/10.1016/j.atmosenv.2020.117834, 2021.
Lewellen, D. C.: A Large-Eddy Simulation Study of Contrail Ice Number Formation, Journal of the Atmospheric Sciences, 77, 2585–2604, https://doi.org/10.1175/JAS-D-19-0322.1, 2020.
Lewellen, D. C., Meza, O., and Huebsch, W. W.: Persistent Contrails and Contrail Cirrus. Part I: Large-Eddy Simulations from Inception to Demise, Journal of the Atmospheric Sciences, 71, 4399–4419, https://doi.org/10.1175/JAS-D-13-0316.1, 2014.
Marcolli, C., Mahrt, F., and Kärcher, B.: Soot PCF: pore condensation and freezing framework for soot aggregates, Atmos. Chem. Phys., 21, 7791–7843, https://doi.org/10.5194/acp-21-7791-2021, 2021.
Märkl, R. S., Voigt, C., Sauer, D., Dischl, R. K., Kaufmann, S., Harlaß, T., Hahn, V., Roiger, A., Weiß-Rehm, C., Burkhardt, U., Schumann, U., Marsing, A., Scheibe, M., Dörnbrack, A., Renard, C., Gauthier, M., Swann, P., Madden, P., Luff, D., Sallinen, R., Schripp, T., and Le Clercq, P.: Powering aircraft with 100 % sustainable aviation fuel reduces ice crystals in contrails, Atmos. Chem. Phys., 24, 3813–3837, https://doi.org/10.5194/acp-24-3813-2024, 2024.
Moore, R. H., Thornhill, K. L., Weinzierl, B., Sauer, D., D'Ascoli, E., Kim, J., Lichtenstern, M., Scheibe, M., Beaton, B., Beyersdorf, A. J., Barrick, J., Bulzan, D., Corr, C. A., Crosbie, E., Jurkat, T., Martin, R., Riddick, D., Shook, M., Slover, G., Voigt, C., White, R., Winstead, E., Yasky, R., Ziemba, L. D., Brown, A., Schlager, H., and Anderson, B. E.: Biofuel blending reduces particle emissions from aircraft engines at cruise conditions, Nature, 543, 411–415, https://doi.org/10.1038/nature21420, 2017.
Murphy, D. M. and Koop, T.: Review of the vapour pressures of ice and supercooled water for atmospheric applications, Q. J. R. Meteorol. Soc., 131, 1539–1565, https://doi.org/10.1256/qj.04.94, 2005.
Murray, B. J., O'Sullivan, D., Atkinson, J. D., and Webb, M. E.: Ice nucleation by particles immersed in supercooled cloud droplets, Chem. Soc. Rev., 41, 6519, https://doi.org/10.1039/c2cs35200a, 2012.
Paoli, R., Nybelen, L., Picot, J., and Cariolle, D.: Effects of jet/vortex interaction on contrail formation in supersaturated conditions, Physics of Fluids, 25, 053305, https://doi.org/10.1063/1.4807063, 2013.
Petters, M. D. and Kreidenweis, S. M.: A single parameter representation of hygroscopic growth and cloud condensation nucleus activity, Atmos. Chem. Phys., 7, 1961–1971, https://doi.org/10.5194/acp-7-1961-2007, 2007.
Petzold, A., Fiebig, M., Fritzsche, L., Stein, C., Schumann, U., Wilson, C. W., Hurley, C. D., Arnold, F., Katragkou, E., Baltensperger, U., Gysel, M., Nyeki, S., Hitzenberger, R., Giebl, H., and Hughes, K.: Particle emissions from aircraft engines a survey of the European project PartEmis, metz, 14, 465–476, https://doi.org/10.1127/0941-2948/2005/0054, 2005.
Picot, J., Paoli, R., Thouron, O., and Cariolle, D.: Large-eddy simulation of contrail evolution in the vortex phase and its interaction with atmospheric turbulence, Atmos. Chem. Phys., 15, 7369–7389, https://doi.org/10.5194/acp-15-7369-2015, 2015.
Ponsonby, J.: jponvc/extended-K15-model: extended K15 model (v1.0), Zenodo [code], https://doi.org/10.5281/zenodo.16901290, 2025.
Ponsonby, J., King, L., Murray, B. J., and Stettler, M. E. J.: Jet aircraft lubrication oil droplets as contrail ice-forming particles, Atmos. Chem. Phys., 24, 2045–2058, https://doi.org/10.5194/acp-24-2045-2024, 2024.
Pruppacher, H. R. and Klett, J. D.: Microphysics of clouds and precipitation, in: Atmospheric and Oceanographic Sciences Library, 2nd edn., Springer Dordrecht, 714 pp., ISBN: 9780792342113, 2010.
Rogers, R. R. and Yau, M. K.: A short course in cloud physics, in: International Series in Natural Philosophy, 3rd edn., Butterworth-Heinemann, Burlington, Massachusetts, Vol. 113, ISBN: 9780750632157, 1996.
Rojo, C., Vancassel, X., Mirabel, P., Ponche, J.-L., and Garnier, F.: Impact of alternative jet fuels on aircraft-induced aerosols, Fuel, 144, 335–341, https://doi.org/10.1016/j.fuel.2014.12.021, 2015.
Rothenberg, D. and Wang, C.: Metamodeling of Droplet Activation for Global Climate Models, Journal of the Atmospheric Sciences, 73, 1255–1272, https://doi.org/10.1175/JAS-D-15-0223.1, 2016.
Rothenberg, D., Ponsonby, J., and lompar: jponvc/pyrcel-for-contrails: pyrcel for contrails (v1.0), Zenodo [code], https://doi.org/10.5281/zenodo.16901327, 2025.
Saffaripour, M., Thomson, K. A., Smallwood, G. J., and Lobo, P.: A review on the morphological properties of non-volatile particulate matter emissions from aircraft turbine engines, Journal of Aerosol Science, 139, 105467, https://doi.org/10.1016/j.jaerosci.2019.105467, 2020.
Schripp, T., Anderson, B. E., Bauder, U., Rauch, B., Corbin, J. C., Smallwood, G. J., Lobo, P., Crosbie, E. C., Shook, M. A., Miake-Lye, R. C., Yu, Z., Freedman, A., Whitefield, P. D., Robinson, C. E., Achterberg, S. L., Köhler, M., Oßwald, P., Grein, T., Sauer, D., Voigt, C., Schlager, H., and LeClercq, P.: Aircraft engine particulate matter emissions from sustainable aviation fuels: Results from ground-based measurements during the NASA/DLR campaign ECLIF2/ND-MAX, Fuel, 325, 124764, https://doi.org/10.1016/j.fuel.2022.124764, 2022.
Schumann, U.: On conditions for contrail formation from aircraft exhausts, Meteorologische Zeitschrift, 4–23, https://doi.org/10.1127/metz/5/1996/4, 1996.
Schumann, U.: Influence of propulsion efficiency on contrail formation, Aerospace Science and Technology, 4, 391–401, https://doi.org/10.1016/S1270-9638(00)01062-2, 2000.
Schumann, U., Arnold, F., Busen, R., Curtius, J., Kärcher, B., Kiendler, A., Petzold, A., Schlager, H., Schröder, F., and Wohlfrom, K.-H.: Influence of fuel sulfur on the composition of aircraft exhaust plumes: The experiments SULFUR 1–7, Journal of Geophysical Research: Atmospheres, 107, AAC 2-1–AAC 2-27, https://doi.org/10.1029/2001JD000813, 2002.
Schumann, U., Mayer, B., Graf, K., and Mannstein, H.: A Parametric Radiative Forcing Model for Contrail Cirrus, J. Appl. Meteorol. Climatol., 51, 1391–1406, https://doi.org/10.1175/JAMC-D-11-0242.1, 2012.
Schumann, U., Baumann, R., Baumgardner, D., Bedka, S. T., Duda, D. P., Freudenthaler, V., Gayet, J.-F., Heymsfield, A. J., Minnis, P., Quante, M., Raschke, E., Schlager, H., Vázquez-Navarro, M., Voigt, C., and Wang, Z.: Properties of individual contrails: a compilation of observations and some comparisons, Atmos. Chem. Phys., 17, 403–438, https://doi.org/10.5194/acp-17-403-2017, 2017.
Seinfeld, J. H. and Pandis, S. N.: Atmospheric chemistry and physics: from air pollution to climate change, 3rd edn., John Wiley & Sons, Inc, New York, 1326 pp., ISBN: 9781118947401, 2016.
Sorjamaa, R. and Laaksonen, A.: The effect of H2O adsorption on cloud drop activation of insoluble particles: a theoretical framework, Atmos. Chem. Phys., 7, 6175–6180, https://doi.org/10.5194/acp-7-6175-2007, 2007.
Sorokin, A. and Mirabel, P.: Ion recombination in aircraft exhaust plumes, Geophysical Research Letters, 28, 955–958, https://doi.org/10.1029/2000GL011801, 2001.
Sullivan, R. C., Moore, M. J. K., Petters, M. D., Kreidenweis, S. M., Roberts, G. C., and Prather, K. A.: Effect of chemical mixing state on the hygroscopicity and cloud nucleation properties of calcium mineral dust particles, Atmos. Chem. Phys., 9, 3303–3316, https://doi.org/10.5194/acp-9-3303-2009, 2009.
Teoh, R., Schumann, U., Gryspeerdt, E., Shapiro, M., Molloy, J., Koudis, G., Voigt, C., and Stettler, M. E. J.: Aviation contrail climate effects in the North Atlantic from 2016 to 2021, Atmos. Chem. Phys., 22, 10919–10935, https://doi.org/10.5194/acp-22-10919-2022, 2022.
Teoh, R., Engberg, Z., Schumann, U., Voigt, C., Shapiro, M., Rohs, S., and Stettler, M. E. J.: Global aviation contrail climate effects from 2019 to 2021, Atmos. Chem. Phys., 24, 6071–6093, https://doi.org/10.5194/acp-24-6071-2024, 2024.
Testa, B., Durdina, L., Alpert, P. A., Mahrt, F., Dreimol, C. H., Edebeli, J., Spirig, C., Decker, Z. C. J., Anet, J., and Kanji, Z. A.: Soot aerosols from commercial aviation engines are poor ice-nucleating particles at cirrus cloud temperatures, Atmos. Chem. Phys., 24, 4537–4567, https://doi.org/10.5194/acp-24-4537-2024, 2024.
Twomey, S.: The nuclei of natural cloud formation part II: The supersaturation in natural clouds and the variation of cloud droplet concentration, Geofisica Pura e Applicata, 43, 243–249, https://doi.org/10.1007/BF01993560, 1959.
Ungeheuer, F., Caudillo, L., Ditas, F., Simon, M., Van Pinxteren, D., Kýlýç, D., Rose, D., Jacobi, S., Kürten, A., Curtius, J., and Vogel, A. L.: Nucleation of jet engine oil vapours is a large source of aviation-related ultrafine particles, Commun Earth Environ, 3, 319, https://doi.org/10.1038/s43247-022-00653-w, 2022.
Voigt, C., Kleine, J., Sauer, D., Moore, R. H., Bräuer, T., Le Clercq, P., Kaufmann, S., Scheibe, M., Jurkat-Witschas, T., Aigner, M., Bauder, U., Boose, Y., Borrmann, S., Crosbie, E., Diskin, G. S., DiGangi, J., Hahn, V., Heckl, C., Huber, F., Nowak, J. B., Rapp, M., Rauch, B., Robinson, C., Schripp, T., Shook, M., Winstead, E., Ziemba, L., Schlager, H., and Anderson, B. E.: Cleaner burning aviation fuels can reduce contrail cloudiness, Commun Earth Environ, 2, 114, https://doi.org/10.1038/s43247-021-00174-y, 2021.
Voigt, C., Märkl, R., Sauer, D., Dischl, R., Kaufmann, S., Bräuer, T., Jurkat, T., Renard, C., Seeliger, K., Chenadec, G. L., Moreau, J., Yu, F., Bonne, N., Roche, A., Zelina, J., Dörnbrack, A., Eirenschmalz, L., Heckl, C., Horst, E., Lichtenstern, M., Marsing, A., Roiger, A., Scheibe, M., Stock, P., Giez, A., Eckel, G., Neumann, G., Vals, M., Requena-Esteban, E., and Clercq, P. L.: Substantial aircraft contrail formation at low soot emission levels, Nature Portfolio [preprint], https://doi.org/10.21203/rs.3.rs-6559440/v1, 9 May 2025.
Wolf, K., Bellouin, N., Boucher, O., Rohs, S., and Li, Y.: Correction of ERA5 temperature and relative humidity biases by bivariate quantile mapping for contrail formation analysis, Atmos. Chem. Phys., 25, 157–181, https://doi.org/10.5194/acp-25-157-2025, 2025.
Wong, H.-W., Jun, M., Peck, J., Waitz, I. A., and Miake-Lye, R. C.: Detailed Microphysical Modeling of the Formation of Organic and Sulfuric Acid Coatings on Aircraft Emitted Soot Particles in the Near Field, Aerosol Science and Technology, 48, 981–995, https://doi.org/10.1080/02786826.2014.953243, 2014.
Wong, H.-W., Jun, M., Peck, J., Waitz, I. A., and Miake-Lye, R. C.: Roles of Organic Emissions in the Formation of Near Field Aircraft-Emitted Volatile Particulate Matter: A Kinetic Microphysical Modeling Study, Journal of Engineering for Gas Turbines and Power, 137, 072606, https://doi.org/10.1115/1.4029366, 2015.
Yu, F. and Turco, R. P.: The role of ions in the formation and evolution of particles in aircraft plumes, Geophysical Research Letters, 24, 1927–1930, https://doi.org/10.1029/97GL01822, 1997.
Yu, F., Turco, R. P., Kärcher, B., and Schröder, F. P.: On the mechanisms controlling the formation and properties of volatile particles in aircraft wakes, Geophysical Research Letters, 25, 3839–3842, https://doi.org/10.1029/1998GL900012, 1998.
Yu, F., Turco, R. P., and Kärcher, B.: The possible role of organics in the formation and evolution of ultrafine aircraft particles, J. Geophys. Res., 104, 4079–4087, https://doi.org/10.1029/1998JD200062, 1999.
Yu, F., Kärcher, B., and Anderson, B. E.: Revisiting Contrail Ice Formation: Impact of Primary Soot Particle Sizes and Contribution of Volatile Particles, Environ. Sci. Technol., 58, 17650–17660, https://doi.org/10.1021/acs.est.4c04340, 2024.
Zhang, K., O'Donnell, D., Kazil, J., Stier, P., Kinne, S., Lohmann, U., Ferrachat, S., Croft, B., Quaas, J., Wan, H., Rast, S., and Feichter, J.: The global aerosol-climate model ECHAM-HAM, version 2: sensitivity to improvements in process representations, Atmos. Chem. Phys., 12, 8911–8949, https://doi.org/10.5194/acp-12-8911-2012, 2012.