the Creative Commons Attribution 4.0 License.
the Creative Commons Attribution 4.0 License.
 | 22 Oct 2025
Bridging the polarimetric structure and lightning activity of isolated thunderstorm cells during the cloud life cycle
Yijun Zhang
Huiyan Zhai
Zhe Li
Dong Zheng
Xueyan Peng
Wen Yao
Sai Du
Yuanmou Du
Polarimetric structures detected by radar can characterize cloud microphysics and dynamics. Many studies have indicated that differential reflectivity (ZDR) and specific differential phase (KDP) columns, which serve as proxies for updraught strength, are related to lightning activity; moreover, the quantities of ice and supercooled liquid water strongly influence the occurrence of lightning flashes via non-inductive charging. However, the sequence or interactions among these factors with dynamics and microphysics from the perspective of the cloud life cycle are uncertain. Here, we improve the “3D mapping columns” method to identify and quantify the columns, which is based on Cartesian grid datasets; this method is sensitive in the early phase of cloud formation. Our study bridges the polarimetric structure and lightning activity within 15 isolated thunderstorms during the cloud life cycle. The results indicate that microphysical variations in supercooled liquid water and graupel yield better correlation coefficients for the lightning activity prediction at short warning times (e.g. 6 min) than dynamical variations in the ZDR column volume do; however, the trend of the ZDR column volume implies good performance at longer warning times (e.g. 12 min). The KDP column is probably absent in the early phase of convection development; however, it will occur in the later stage with heavily cold cloud processes, replacing the ZDR column to indicate updraughts within the reflectivity core when obvious graupels and hailstones occur. Our study improves the understanding of the polarimetric structure, which is related to dynamics and microphysics, and is also associated with lightning activity.
- Article
(13312 KB) - Full-text XML
- BibTeX
- EndNote


Lightning is a traditional indication of severe weather (tornado, hail, microbursts, etc.). Trends in lightning activity are useful for determining the severity of a thunderstorm (e.g. Gatlin and Goodman, 2010; Goodman et al., 2005; Williams et al., 1999; Zhang et al., 2009). Lightning activity is the electrical response to dynamic conditions (updraught or turbulence) and cloud microphysics during storm evolution, which is supported by both theoretical and field observational studies of dynamics, microphysics and lightning activity (lightning initiation or total lightning flash rate) (e.g. Baker et al., 1999; Baker et al., 1995; Carey and Rutledge, 2000; Mitzeva and Saunders, 1990; Souza and Bruning, 2021; Williams et al., 1989; Zhang et al., 2004a; Zhao et al., 2021a). Notably, many studies have focused on the relationship between lightning activity and cloud updraught or microphysics (e.g. Carey and Rutledge, 1996, 2000; Deierling and Petersen, 2008; Lang and Rutledge, 2011; López and Aubagnac, 1997; Sharma et al., 2024; Sharma et al., 2021).
Polarimetric radar can provide observations to improve our understanding of the coupling between convective dynamics and storm microphysics (e.g. Sharma et al., 2024). Lightning location technology can be used to monitor the occurrence of lightning flashes in real time (e.g. Rison et al., 1999). In this way, radar and lightning observations can be used to link cloud updraughts and microphysics with lightning activity.
Carey and Rutledge (2000) utilized a C-band polarimetric radar to study the relationship between precipitation and lightning during tropical island convection events; their results indicated that lightning activity and the surface electric field are strongly correlated with the mixed-phase ice mass and rainfall properties during the mature phase of convection. Cloud-to-ground (CG) lightning was associated with the production and subsequent descent of graupel and frozen drops from the −10 to −20 °C region; moreover, peaks in the CG lightning flash rate typically lagged behind peaks in the graupel mass aloft (Carey and Rutledge, 2000). This observational phenomenon reflects the non-inductive charging between ice-phase hydrometeors, mainly graupel and ice crystals (e.g. Latham and Dye, 1989; Reynolds et al., 1957; Saunders, 2008; Takahashi, 1978).
Before the formation of ice particles (e.g. graupel), the supercooled raindrops present in the mixed-phase zone throughout the developing and mature phases play crucial roles in storm kinematics, microphysics, and electrification. During freezing, supercooled raindrops probably provide (i) an instantaneous and abundant supply of millimetre-sized ice, (ii) a potential source of secondary ice particles, and (iii) an enhancement in the updraught owing to the latent heat of freezing (Carey and Rutledge, 2000; Rosenfeld et al., 2008; Zhao et al., 2024; Zhao et al., 2022). Moreover, millimetre-sized ice and secondary ice particles contribute to cloud electrification (Bringi et al., 1996; Sharma et al., 2024). The intensity of convective updraughts through the modulation of microphysical factors, the collision efficiency of ice particles, and the electrification temperature influence the charge structure of storms (Liu et al., 2024; Marshall et al., 1995; Qie et al., 2000; Yan et al., 1996a, b; Zhang et al., 2004b), the flash size (Bruning and MacGorman, 2013; Zheng and Zhang, 2021), and the associated lightning flash rate (Deierling and Petersen, 2008; Deierling et al., 2008; Fridlind, et al., 2019; Souza and Bruning, 2021; Zhao, et al., 2021a).
Moreover, supercooled raindrops produce a differential reflectivity (ZDR) column, one of the most notable polarimetric radar signatures of convective storms. High ZDR values (e.g. > 1 dB) above the 0 °C isotherm height (melting level) are associated with large supercooled raindrops and wet hail suspended in deep convective updraughts (e.g. Krause and Klaus, 2024; Kumjian et al., 2014; Snyder et al., 2015; Zhao et al., 2020). Depending on the intensity of the updraught, the region of high ZDR can extend several kilometres above the 0 °C isotherm height. This narrow vertical extension of high ZDR values above the environmental 0 °C level associated with updraughts in strong convective storms is called the ZDR column (Krause and Klaus, 2024; Kumjian et al., 2014; Zhao et al., 2020).
The ZDR columns, owing to the vertical size sorting of drops in warm-rain precipitation processes, encompass the signals of both microphysical features and updraughts; however, these signals are not present throughout the life cycle of strong convective storms, except in the early phase of cloud development. During the initial phase of a thunderstorm, the ZDR column above the melting level indicates the presence of a low concentration of large raindrops (> 2 mm); in addition, the ZDR column expands downwards from above owing to the collision and coalescence of drops and the accretion of droplets, resulting in the formation of larger raindrops (> 4–5 mm) (Kumjian et al., 2014). During the mature phase of a thunderstorm, the ZDR column above the melting level may continue expanding upwards and outwards because stronger updraughts loft raindrops upwards into the mixed-phase layer, but smaller drops reach their nucleation temperature and begin to freeze while ascending to higher altitude. As these supercooled raindrops begin to freeze and mix with water-coated graupel and hail, the corresponding ZDR values decrease, denoting top of the ZDR column. As updraughts subsequently weaken and large ice particles (high-density graupel or hailstones) increase in abundance, the ZDR column starts to collapse; however, lightning activity may exhibit an inverse trend compared with that of the ZDR column at this moment. For example, as shown by Sharma et al. (2024), after the first lightning jump, the subsequent lightning jumps are associated with a decreasing trend in the ZDR column volume.
On the other hand, in the specific differential phase (KDP) column, high values (> 0.75° km−1, the value reported by Loney et al. (2002)) above the melting level occur and are strongly associated with a high concentration of water-coated ice (e.g. water-coated graupel and hail with a non-spherical shape) and raindrops (1–2 mm) that shed from hailstones growing in a wet regime (Bringi et al., 1996; Hubbert et al., 1998; Loney et al., 2002). Thus, the formation of a KDP column is tied to cold cloud microphysics, which usually lag behind the appearance of the ZDR column.
van Lier-Walqui et al. (2016) attempted to constrain cloud-resolving models on the basis of ground-based remote sensing observations, namely, polarimetric radar data. In their study, the KDP column (specifically, the column volume) was strongly related to the updraught mass flux, lightning activity, and rainfall intensity in four deep convection events observed during the Midlatitude Continental Convective Clouds Experiment. Recently, Sharma et al. (2024) utilized polarimetric radar observations of three severe storms during the VORTEX-Southeast field campaign to quantify the correlation between the volumes of ZDR and KDP columns (representative of mixed-phase microphysics as well as updraught intensity and size) and total lightning flash rates. They indicated that the volume of the KDP columns exhibited high co-variability with the total flash rate in three such cases (a tornadic supercell embedded in a stratiform precipitation system, a non-tornadic supercell, and a supercell embedded within a quasilinear convective system).
Sharma et al. (2024) conducted a study on the basis of hypotheses, that is, that the deeper and wider the ZDR and KDP columns were in cases with robust and wide updraughts (e.g. Homeyer and Kumjian, 2015; Snyder et al., 2017), the more an increase in the volumes of the ZDR and KDP columns would correspond to an increase the mixed-phase ice mass flux, resulting in an increase in the total flash rate; the correlation coefficient (−0.47–0.37 for the ZDR column; 0.54–0.74 for the KDP column) between ZDR or KDP columns and lightning activity was not as high as the microphysical parameters explored in previous studies (e.g. Carey and Rutledge, 2000). Moreover, the results seem to be inconsistent with those of Sharma et al. (2021), who reported that the variability in flash rates is best explained by fluctuations in the ZDR column volume, with a high correlation coefficient value (0.72). One possible explanation is that the effect of the time lag may decrease this correlation coefficient. As reported by Carey and Rutledge (2000), they obtained a very high one-lag (7 min) correlation coefficient (ρ=0.9) between the graupel mass within the mixed-phase zone and the CG lightning flash rate, suggesting that the directly related microphysics with non-inductive charging have a greater correlation coefficient with lightning activity. Another possible way is that the interactions of the column with dynamics and microphysics are uncertain, which affects the results under the current hypotheses. This is also emphasized in Sharma et al. (2021) and raised as a retained question in the appendix. Thus, further exploration is needed.
In summary, dynamical and microphysical characteristics derived from polarimetric radar can provide forecasting information about lightning activity on the basis of non-inductive charging: (i) the precipitation-sized (e.g. graupel) ice mass within the mixed-phase zone; (ii) the content of supercooled raindrops; and (iii) the quantified ZDR and KDP columns (e.g. the column volume or height). Our goal in this study is to link these polarimetric radar variables for forecasting lightning activity within isolated thunderstorm cells during the cloud life cycle over South China, and determine how the cloud microphysics and dynamics related to these polarimetric radar variables should be assessed. Notably, the close relationship between these polarimetric radar variables and lightning activity has been noted in many studies (e.g. Carey and Rutledge, 2000; Hayashi et al., 2021; Sharma et al., 2024; Sharma et al., 2021; Snyder et al., 2015; van Lier-Walqui et al., 2016; Woodard et al., 2012); thus, we believe that this study is sufficient for connecting these polarimetric radar variables and lightning activity via the anatomy of an isolated thunderstorm cell during the cloud life cycle and the statistical results of 15 isolated thunderstorm cells.
This paper is organized as follows. In Sect. 2, an overview of the radar and lightning data is given, and the analysis methods and the approach for quantifying the columns are described. In Sect. 3, we present the results of column quantification and the related characteristics of the polarimetric structure and microphysics with the column. The vertical structures of polarimetric radar variables and microphysics are explored in combination with three-dimensional (3D) lightning location data. The relationship between lightning activity and these polarimetric characteristics in cases and statistics is presented. Finally, we summarize the results in Sect. 4.
2.1 Radar and lightning observations
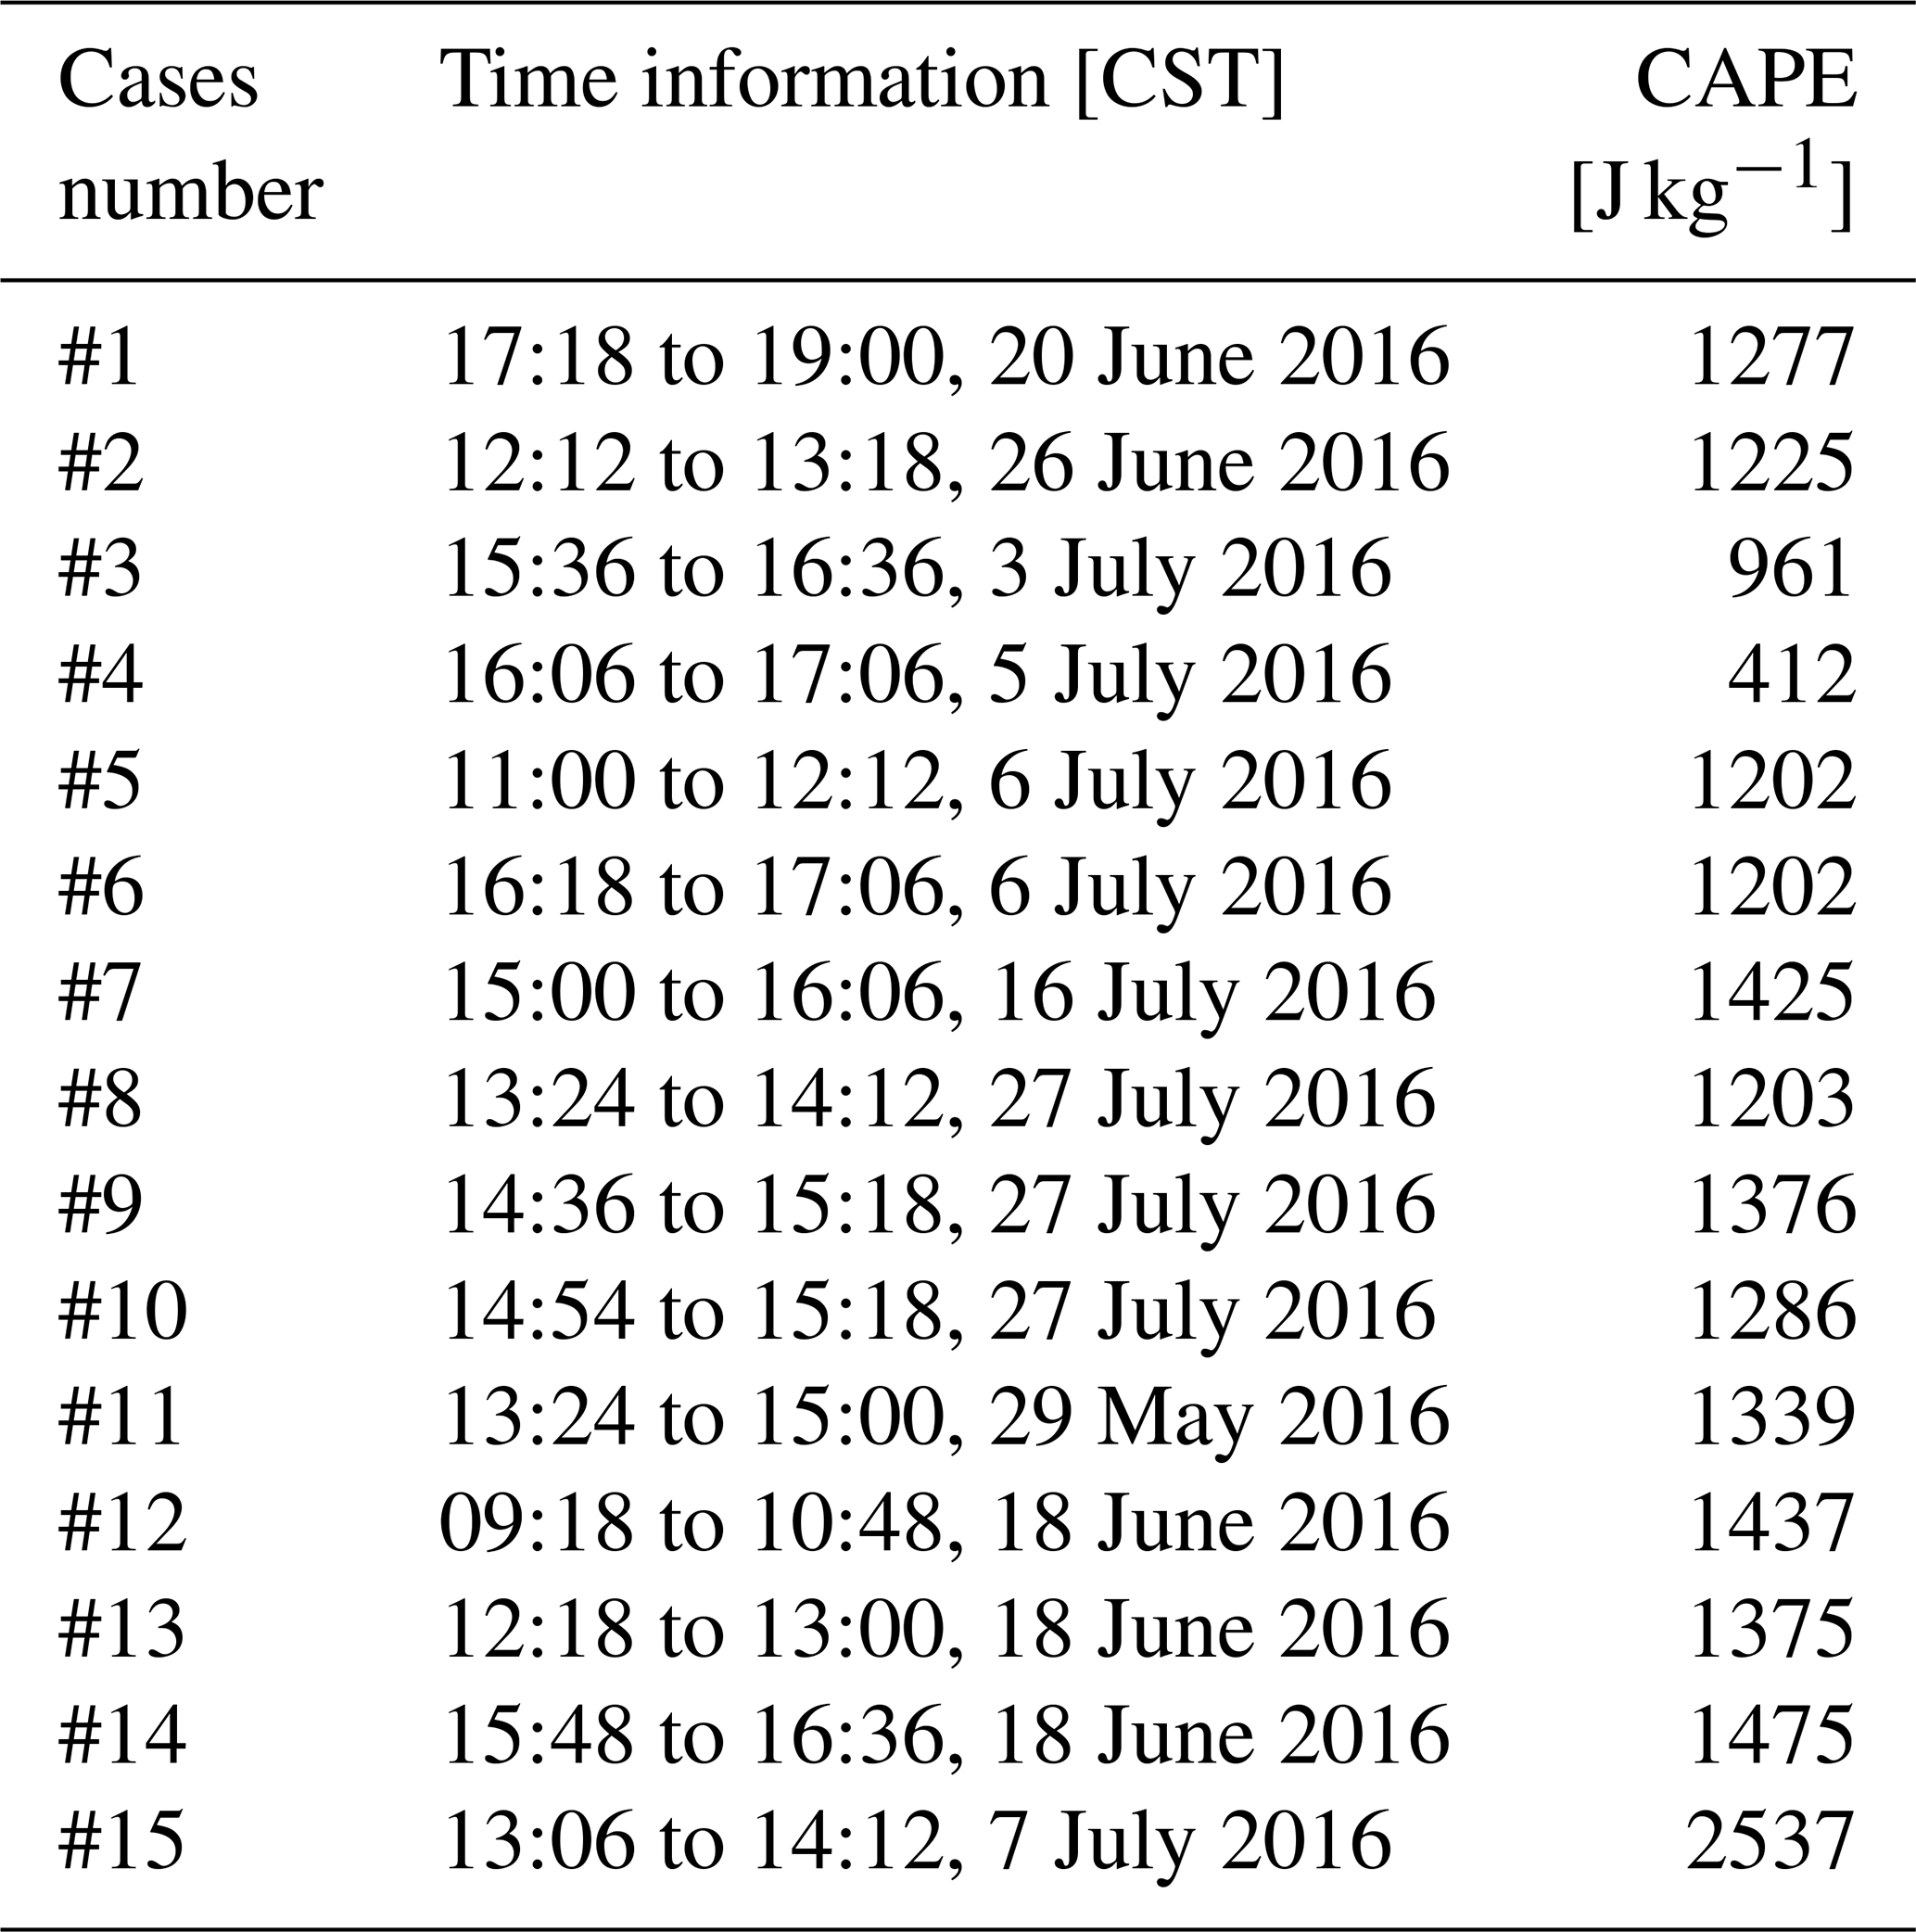
This study included 15 isolated thunderstorm cells that produced lightning, which was observed via an S-band dual-polarization radar deployed in Guangzhou city (GZ radar) and a low-frequency E-field detection array (LFEDA) (Table 1). These isolated thunderstorms were selected in accordance with the rules in Zhao et al. (2021a, 2022). The initiation of such thunderstorms was defined as the first radar volume scan in cases where the composite reflectivity was ≥ 5 dBZ and the locations of thunderstorms were within the effective range of the radar and lightning array. When the maximum reflectivity of this cell starts to fade with a value of less than 30 dBZ later, the evolutionary process of a cell is marked as the end. Moreover, we required the subsequent lightning activity to be present after the first lightning occurrence in this study. The average 6-hourly convective available potential energy (CAPE) of these thunderstorms was obtained from ERA-Interim reanalysis data, as in Zhao et al. (2022). The detailed examination of lightning activity with related dynamics and microphysics in case #1 was conducted first, and then the statistical results of all cases were given. On 20 June 2016, one isolated thunderstorm cell was observed by the GZ radar (Fig. 1). The composite reflectivity data revealed that this thunderstorm (the boundary was determined via manual inspection; the black lines in Fig. 1) was nearly stationary and that the cloud life cycle lasted approximately 2 h. Lightning activity occurred when values of composite reflectivity > 35 dBZ were present; this phenomenon seemingly supported the results of Hayashi et al. (2021), highlighting the importance of graupel in cloud electrification.
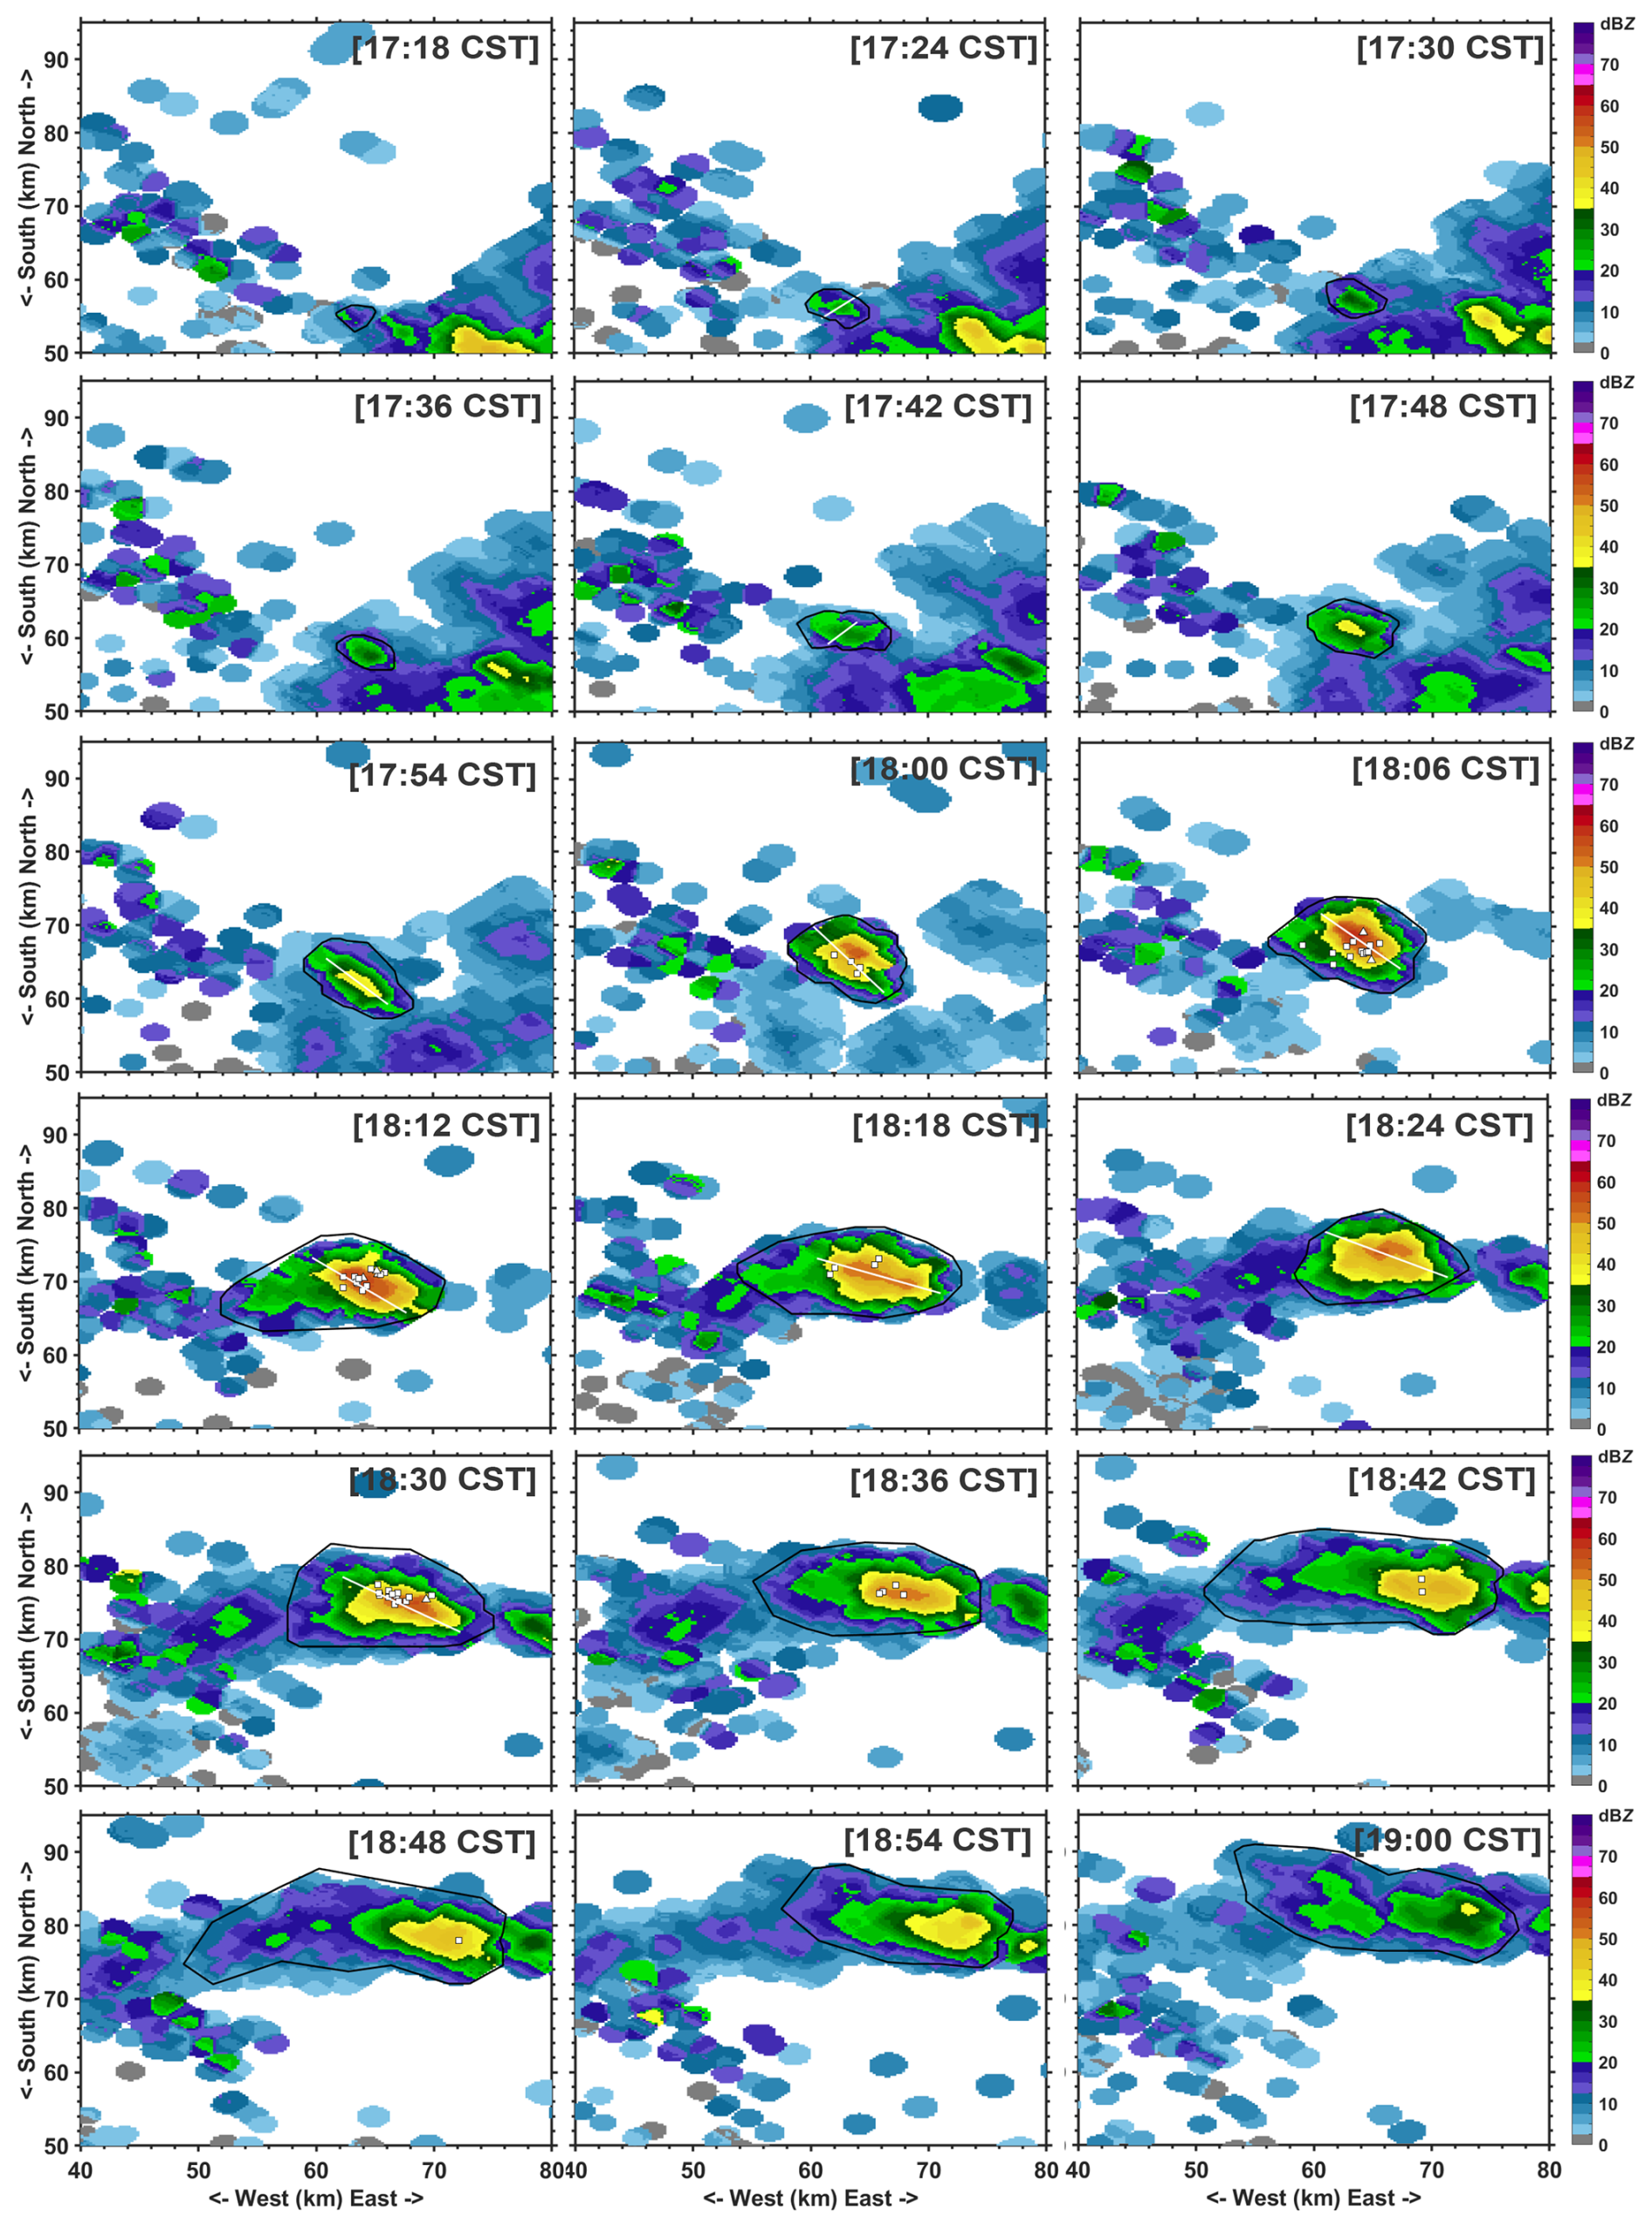
Figure 1The composite reflectivity of the isolated thunderstorm cell on 20 June 2016 (case #1), which initiated at 17:18 and ended at 19:00 (China Standard Time, CST). The black lines indicate the boundary of this thunderstorm. The white squares (intracloud flashes) and triangles (CG flashes) indicate the lightning flashes, and the location of once lightning flash is represented by the location of the first discharge pulse event. The positions for the plotted cross section are shown as white lines over the composite reflectivity data.
The beam width of the GZ radar is ≤ 1°, and the azimuth and range resolutions are 1° and 250 m, respectively. A full radar volume scan lasted 6 min at nine elevation angles. The GZ radar data were processed via the Python ARM Radar Toolkit (Py-ART), including quality control (Helmus and Collis, 2016; Li et al., 2023; Li et al., 2024). The ZDR offset of the raw data was corrected via drizzle, and the calibration accuracy was expected to be 0.1–0.2 dB (Bringi and Chandrasekar, 2001). We utilized two methods to smooth the differential phase ΦDP, namely, “lightly filtering” (2 km) and “heavily filtering” (6 km), as in Park et al. (2009). Two estimates of KDP were subsequently obtained from a slope of a least-squares fit of the filtered ΦDP; a lightly filtered KDP was subsequently used in the case of horizontal reflectivity > 40 dBZ, and a heavily filtered KDP was selected otherwise (Ryzhkov and Zrnić, 1996). The radar data were gridded via Py-ART gridding routines on a Cartesian grid with a 0.25 km horizontal resolution and a 500 m vertical resolution (“Barnes2” method).
The lightning flashes within this thundercloud were detected via LFEDA, which is a 3D mapping detection system for intracloud and CG lightning, with 10 sensors. Previous studies (Fan et al., 2018; Shi et al., 2017) utilized information from triggered lightning flashes to evaluate LFEDA detection results; the results show the detection efficiency of the LFEDA can reach 100 %, and the mean location error is 102 m. Discharge pulse events were grouped into a lightning flash via the same method as described by Liu et al. (2020). A potential discharge pulse event of one lightning flash should occur within 0.4 s of the previous discharge pulse event and within 0.6 s and 4 km of any other discharge pulse event of this lightning flash. If any source within one lightning flash is below the 2 km height, this lightning flash is regarded as one CG flash, as suggested by Zhao et al. (2021a).
The lightning flashes were assigned to the isolated thunderstorm on the basis of the boundary of the thunderstorm, as well as a constraint every 6 min (according to the duration of a full radar volume scan). The life cycle of this isolated thunderstorm initiated from the first radar echo (i.e. the presence of a maximum horizontal reflectivity (ZH)≥5 dBZ in a full radar volume scan within this cloud was first detected by the GZ radar, as suggested by Zhao et al. (2021a, 2022, 2024)) and ended when the maximum ZH started to decrease and the ZH reached ≤ 40 dBZ. The distributions of these detection systems, including radar and lightning location system, were illustrated by in Zhao et al. (2024).
2.2 Cloud microphysical parameter retrieval methods
To estimate the precipitation-sized ice mass (e.g. graupel, hail, and frozen drops) and the content of supercooled raindrops within the mixed-phase zone, an approach on the basis of difference reflectivity (ZDP, dB) is applied (Carey and Rutledge, 2000; Straka et al., 2000):
where Sij refers to an element of the backscattering matrix of a hydrometeor (Zrnić, 1991). The first subscript i indicates the polarization of the backscattered field (h is horizontal, v is vertical), and the second subscript j indicates the polarization of the incident field; is the factor associated with the dielectric constant of water, ϵw is the dielectric constant, and λ is the radar wavelength. The brackets indicate expectations expressed in terms of the distribution of mean hydrometeor properties such as shape, size, fall orientation, particle density, canting angle, dielectric constant, and others.
Pruppacher and Klett (1997) assumed that precipitation-sized ice particles were more spherically symmetrical or tumble. The low dielectric constant and significant canting behaviour of ice particles probably result in a near-zero ZDR (e.g. Seliga and Bringi, 1976). Therefore, the horizontal reflectivity and vertical reflectivity are equal for ice particles, as “effective spheres”, and ZDP is solely influenced by raindrops. If the relationship between horizontal reflectivity and ZDP (raindrops) is known, the horizontal reflectivity of raindrops can be derived. The relationship between the horizontal reflectivity of raindrops and ZDP (raindrops) is derived from 2-year disdrometer data in Guangdong Province (Li et al., 2019), which is suitable for the current radar used in this study:
Then, the ice echo intensity can be expressed as . The standard error for the relationship between horizontal reflectivity and ZDP is consistently approximately 1 dB (Carey and Rutledge, 2000). If dB, which is below the melting layer, mm6 m−3, , and . In contrast, above the melting layer, if dB, then mm6 m−3, and (Carey and Rutledge, 2000). The estimates of rain mass (Mw, g m−3) and ice mass (Mice, g m−3) are derived via the following reflectivity-mass relationships (Chang et al., 2015; Zhao et al., 2022):
where ρi indicates the ice density (kg m−3) and m−4. The estimated ice mass from the horizontal reflectivity of ice particles is proportional to the actual ice mass and depends on the variability in the intercept parameter of an assumed inverse exponential distribution for ice and the ice density; thus, the trends of the estimated ice mass are deemed sufficient to investigate lightning activity. Importantly, the value of ZDP can differentiate between ice and rain only if the ZH is sufficiently large (i.e. diameter ≥ 1 mm); under such conditions, the raindrop is characterized by significant oblateness (Carey and Rutledge, 2000; Green, 1975).
The estimated ice masses are assigned to graupel masses on the basis of scattering properties, that is, where the ZH values exceed 35 dBZ (Carey and Rutledge, 2000; Kumjian, 2013a, b; Zhao et al., 2021b). The threshold value is usually applied to identify graupel in the hydrometeor identification method (Park et al., 2009). The rain water content above the melting level (0 °C isotherm height; sounding data from the Qingyuan meteorological observatory are used to obtain the environmental temperature) is defined as the supercooled raindrop mass.
ZDR columns are associated with low concentration of large raindrops (> 2 mm); thus, the median volume diameter D0 of raindrops is retrieved via the method described by Hu and Ryzhkov (2022) to provide supporting evidence for identifying ZDR columns. Notably, D0 is not used to identify ZDR columns directly but rather to ensure the threshold value of ZDR, which is utilized to identify ZDR columns directly. The fractional standard deviation of the D0 estimation is approximately 10 % (Hu and Ryzhkov, 2022).
To further explore the characteristics of the microphysics related to the column and lightning within these thunderstorms, the hydrometeor identification method involving the fuzzy-logic algorithm (as in Zhao et al., 2021b), and the microphysical fingerprint (following Kumjian et al., 2022) are conducted. Identifying polarimetric radar “fingerprints” of ongoing microphysical processes was introduced by Kumjian (2012); these fingerprints are defined as vertical changes in two (e.g. ZH, ZDR) or more of the dual-polarization radar variables (Kumjian et al., 2022).
As suggested by Kumjian et al. (2022), the co-polar correlation coefficient (CC) is neglected in most of the fingerprints discussed but it is important to indicate the melting process; thus, we added the changes in the CC towards the ground to identify the melting process. The changes in the polarimetric radar variables towards the ground for riming and aggregation are the same (Kumjian et al., 2022); however, the riming process is valuable for studying lightning activity. Thus, we followed the method for identifying the aggregation and graupel particles in Park et al. (2009), that is, we utilized the discriminated convective and stratiform echoes to determine where riming or aggregation processes occur. If the echo is classified as convective, then the aggregation process is not allowed within a whole vertical column; conversely, the riming process is excluded in the stratiform case.
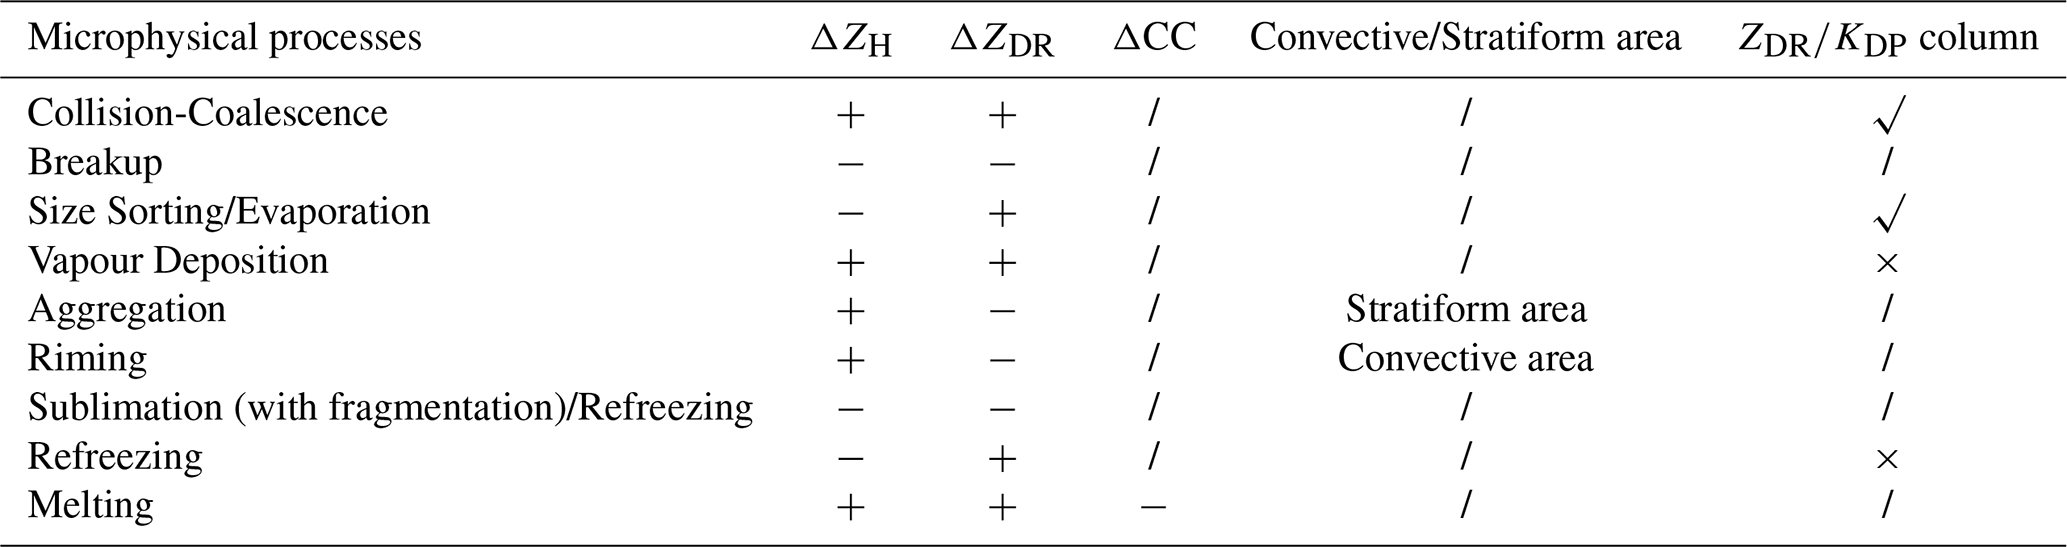
In addition, the 0 °C isotherm height is used to discriminate warm-rain processes and mixed-phase processes; notably, this rule introduces potential errors when it is used where the column is used. Specifically, the polarimetric characteristics of collision–coalescence and size sorting (or evaporation) processes above the 0 °C isotherm height are regarded as vapour deposition and refreezing processes, respectively. In this study, we utilize the identified and quantified columns to correct this possible error. A summary of the changes in the polarimetric radar variables towards the ground and additional conditions for different microphysical processes is listed in Table 2. To characterize the microphysical fingerprints in this study, the changes in the polarimetric radar variables towards the ground are computed between two adjacent grids in the vertical direction (for example, ΔZH (, x, y, and z are the three dimensions in the Cartesian coordinate system; z1 is 500 m in height, and z2 is 1000 m in height). The minimum thresholds of ΔZH> 0.002 dB km−1 and ΔZDR> 0.0001 dB km−1 are applied to avoid false classifications based on noise present in the data, as in Kumjian et al. (2022).
Table 2Changes in the polarimetric radar variables towards the ground for different microphysical processes. An increase in that radar variable between the top and bottom of the profile is indicated by a positive sign +, whereas a decrease is indicated by a negative sign.
2.3 Previous automatic identification and quantification methods for columns
Currently, a few methods are available to automatically identify and quantify columns (e.g. Woodard et al., 2012; Krause and Klaus, 2024; Sharma et al., 2024; Snyder et al., 2015; van Lier-Walqui et al., 2016). These methods are constructed on the basis of the morphology of the columns and/or the high values (e.g. ZDR > 1 dB; KDP> 1° km−1) above the melting level.
In the stage of cloud formation, high ZDR values above the melting level are simply used to identify ZDR columns; however, these high values are not always associated with the ZDR columns. Notably, three-body scatter signatures (Zrnić, 1987), depolarization streaks associated with the canting behaviour of ice in regions of strong electrification (Kumjian, 2013c), and oblate ice particles can lead to enhanced positive ZDR values (Kumjian, 2013a). Thus, additional requirements were imposed to avoid identification errors, e.g. the reflectivity threshold value (ZH≥40 dBZ) (Woodard et al., 2012) and the height should be below the homogeneous melting level, and the maximum height of the ZDR column should be associated with the height at which ZDR displays a negative vertical gradient (van Lier-Walqui et al., 2016).
Recently, Krause and Klaus (2024) utilized the hotspot technique to identify the base of the ZDR column on the basis of constant altitude plan projection indicators. Although their results indicated an improvement in the plan region identified on the basis of the ZDR column approach over the results of two different existing algorithms (Thunderstorm Risk Estimation from Nowcasting Development via Size Sorting algorithm and the algorithm introduced by Snyder et al. (2015)), the depth and volume information for ZDR columns was lost, which was not beneficial for forecasting lightning activity. In addition, the reflectivity threshold value (ZH > 25 dBZ) was required in this algorithm. Sharma et al. (2024) used an algorithm in the “scikit-image” Python package to identify columns from Cartesian grid data via threshold values (ZDR≥1 dB; KDP≥1° km−1); they restricted the ZH values to exceed 20 dBZ, and any instances of obvious data contamination or unrealistic values during the gridding process were manually removed prior to analysis. They focused on three supercells during lightning activity, and violent convection in such case will ignore the formation of columns at weak echo intensities, i.e. in the initiation stage of convective clouds.
2.4 Automatic 3D mapping of columns during the life cycle of an isolated cell storm
Our objective in this study is to explore the performance of microphysics retrieved via radar for forecasting lightning activity within isolated thunderstorm cells during the cloud life cycle. As depicted in Fig. 1, our radar observations indicate that before the initiation of lightning, the echo intensity is weak during the early stage of a cloud. Moreover, we seek to determine whether ZDR columns form in the early stages of cloud formation. In addition, KDP columns are representative of small drops with high concentration shed from large ice particles (e.g. hailstones) growing in a wet regime (Hubbert et al., 1998; Loney et al., 2002).
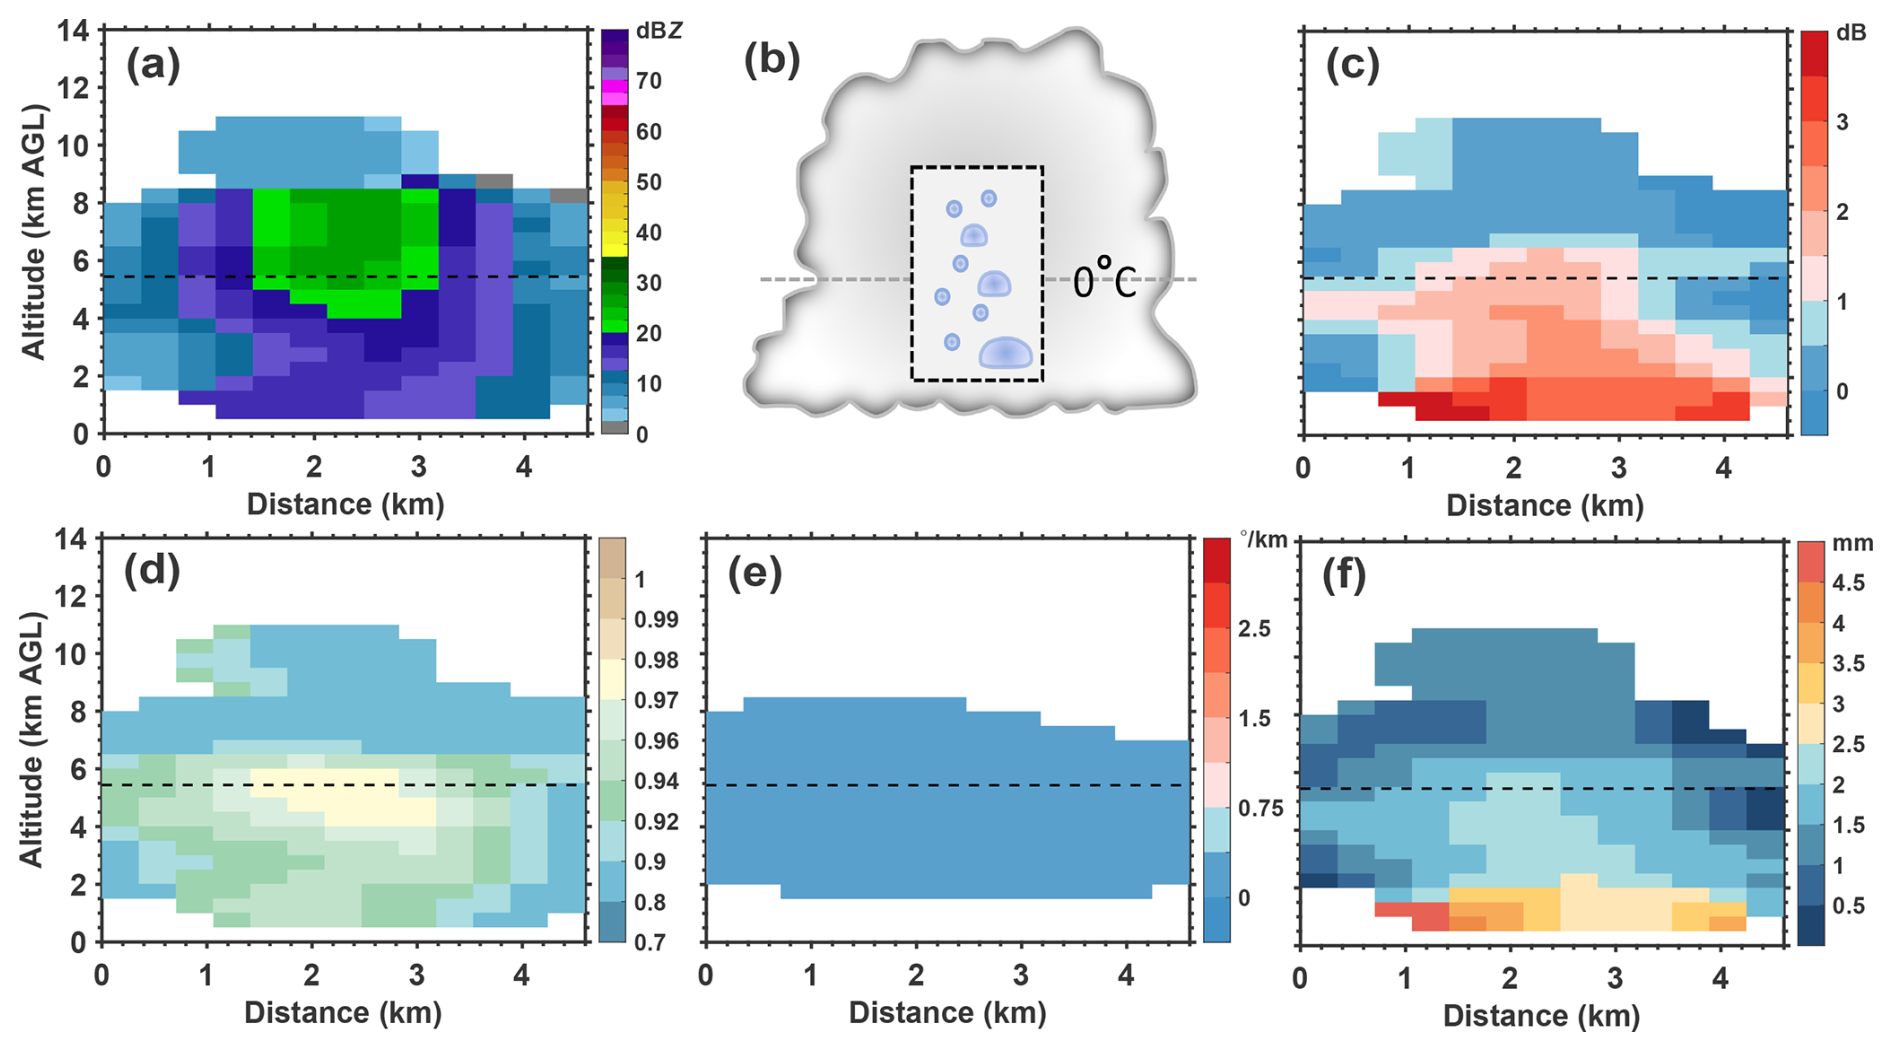
Figure 2Cross section from the Cartesian grid of the studied isolated thunderstorm (case #1) at 17:24 CST. (a) ZH. (b) Conceptual model of the microphysical structure within high ZDR values. (c) ZDR, (d) CC, (e) KDP. (f) Median volume diameter D0 of raindrops. The black dashed line indicates the 0 °C isotherm height. AGL (above ground level).
Figure 2 shows the first appearance of the ZDR column at 17:24 (China Standard Time, CST), which is approximately 36 min earlier than the first lightning occurrence and only lags behind the first radar echo by 6 min. The high values of ZDR extend to the mixed-phase region from the cloud bottom, and the height of the ZDR column is approximately 1 km (Fig. 2c). The corresponding ZH values are smaller than 30 dBZ, but with the values of the CC are relatively high (Fig. 2a, d). These characteristics indicate the presence of large raindrops with low concentrations; the low KDP values and large size of raindrops (exceeding 2 mm) support that (Fig. 2e, f). We illustrate the microphysical structure corresponding to high ZDR values in Fig. 2b. The threshold value for identifying the ZDR column in this study is 1.5 dB, considering that the size of raindrops should exceed 2 mm within the ZDR column during the initial phase of a storm (e.g. Kumjian et al., 2014). In addition, the KDP column is absent in the initial phase of this storm, not appearing until 18:30 CST.
In this study, we improved a method that only depends on the ZDR parameter for identifying and easily quantifying the ZDR column (e.g. height and volume) during the whole life cycle of a storm, specifically, including the initial phase of a convective cloud; the morphology of the ZDR column resulting from size sorting and the high ZDR values (≥ 1.5 dB) in Cartesian grid data are combined as the basis of this method. A flow chart of this method is depicted in Fig. 3.
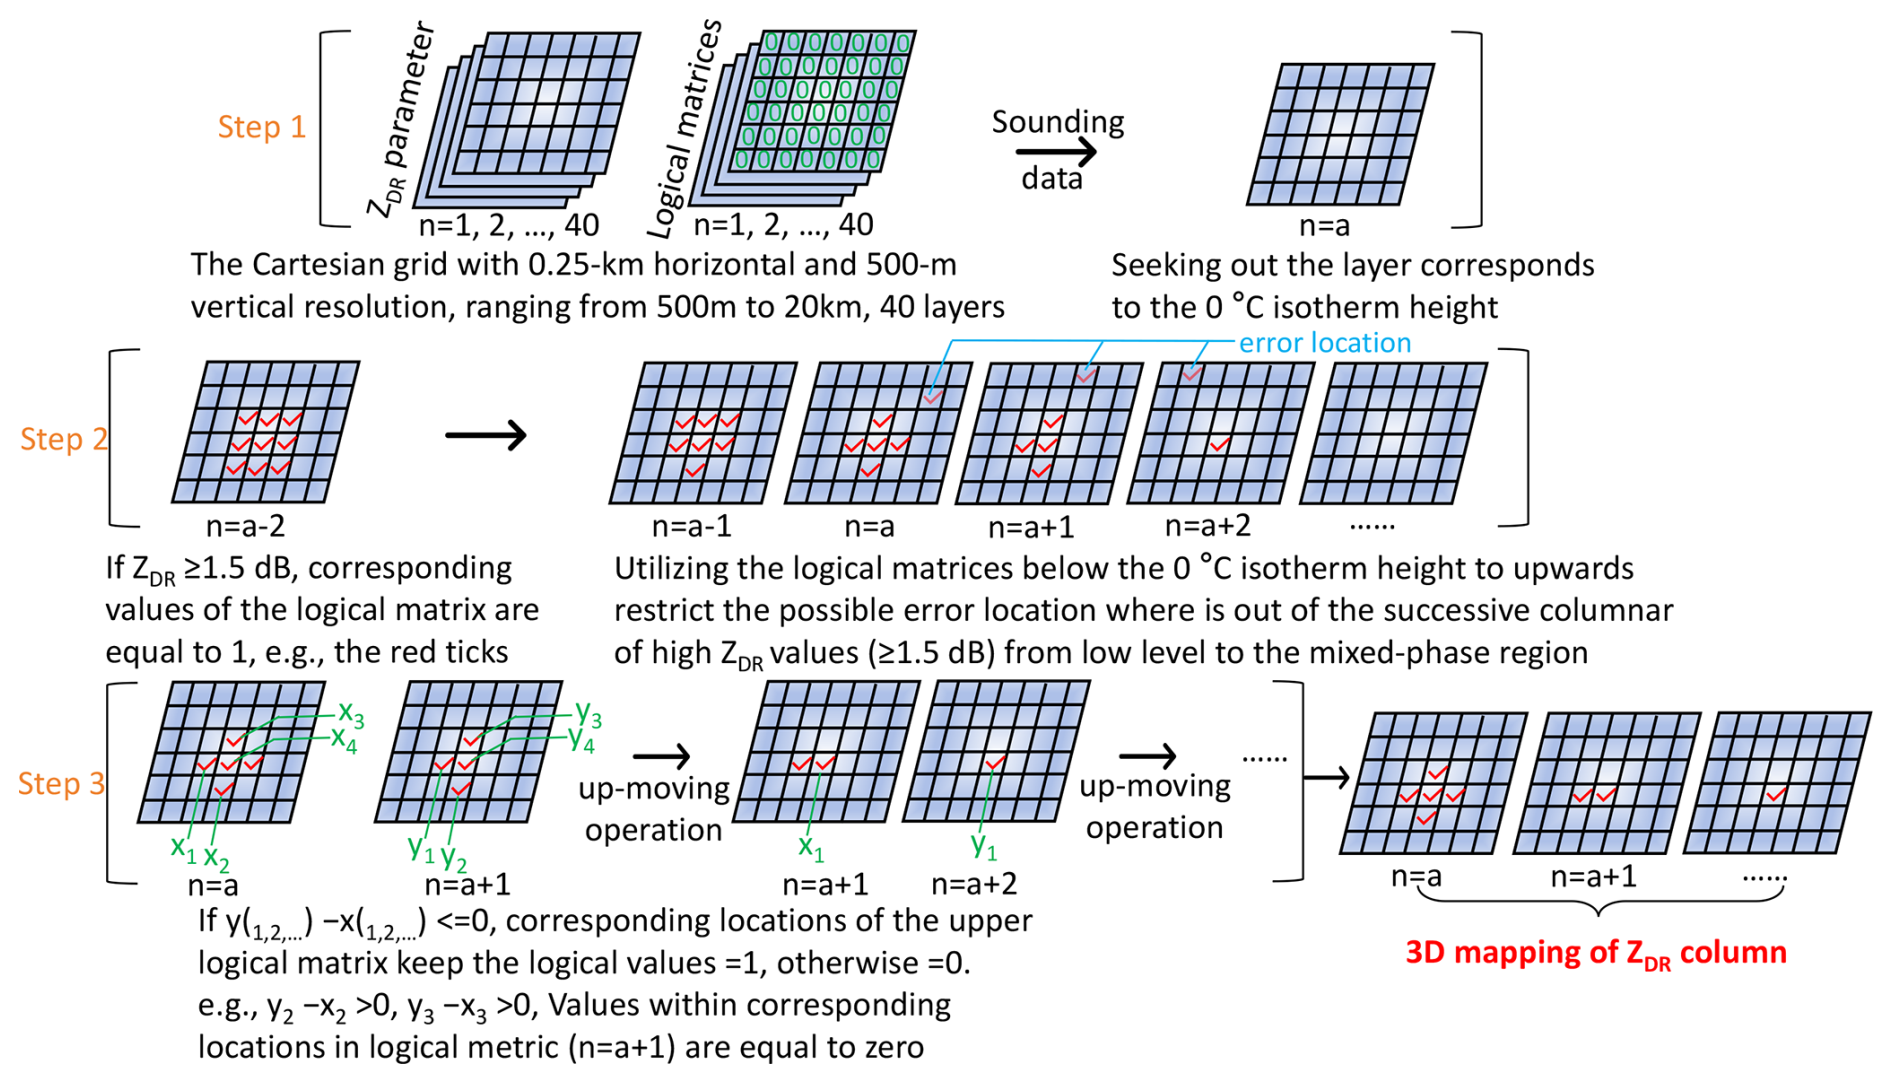
First, we establish logic matrices with the same specifications as the ZDR matrices and identify the layer that corresponds to the 0 °C isotherm height (with sounding data used to determine the environmental temperature). Second, from the 1 km height below the melting level to the mixed-phase region, if ZDR≥1.5 dB, the corresponding logic values in the logic matrix are equal to 1. Notably, we utilize the lower portion of the logic matrix to upwardly restrict the possible errors associated with including locations outside the successive column of high ZDR values (≥ 1.5 dB). This restriction condition is based on the column morphology (columnar shape), which results from drop size sorting. Specifically, the region of the ZDR column contracts upwards from the 0 °C isotherm height below the mixed-phase region (e.g. as shown in Amiot et al., 2019, Hubbert et al., 2018, Kumjian et al., 2014, Snyder et al., 2015 and Tuttle et al., 1989). In the Cartesian grid data, this phenomenon is particularly obvious (Fig. 2c).
Third, the size distribution of raindrops within the ZDR column is determined by size sorting; thus, we utilize the negative vertical gradient of ZDR on the basis of every grid between two adjacent layers from the 0 °C isotherm height to the uppermost limit height to further ensure that the grids are associated with the ZDR column. Finally, a 3D mapping of the ZDR column is constructed. We can use the grid information to compute the height and volume of the ZDR column. Although the formation mechanism of the KDP column is different from that of the ZDR column, the morphology of the KDP column is highly consistent with that of the ZDR column; thus, this method can be applied to map the KDP column with a 3D grid based on the threshold value for identifying the KDP column (e.g. ≥ 1° km−1).
3.1 Assessment of columns identified via the “3D mapping columns” method
Snapshots of the identified ZDR columns via the “3D mapping columns” method at four moments (the KDP column only existed at one moment during the life cycle of this thunderstorm) are shown in Fig. 4. The identified regions of the columns are represented by white dots. We verify that the 3D mapping columns method performs well in identifying the columns via manual inspection.
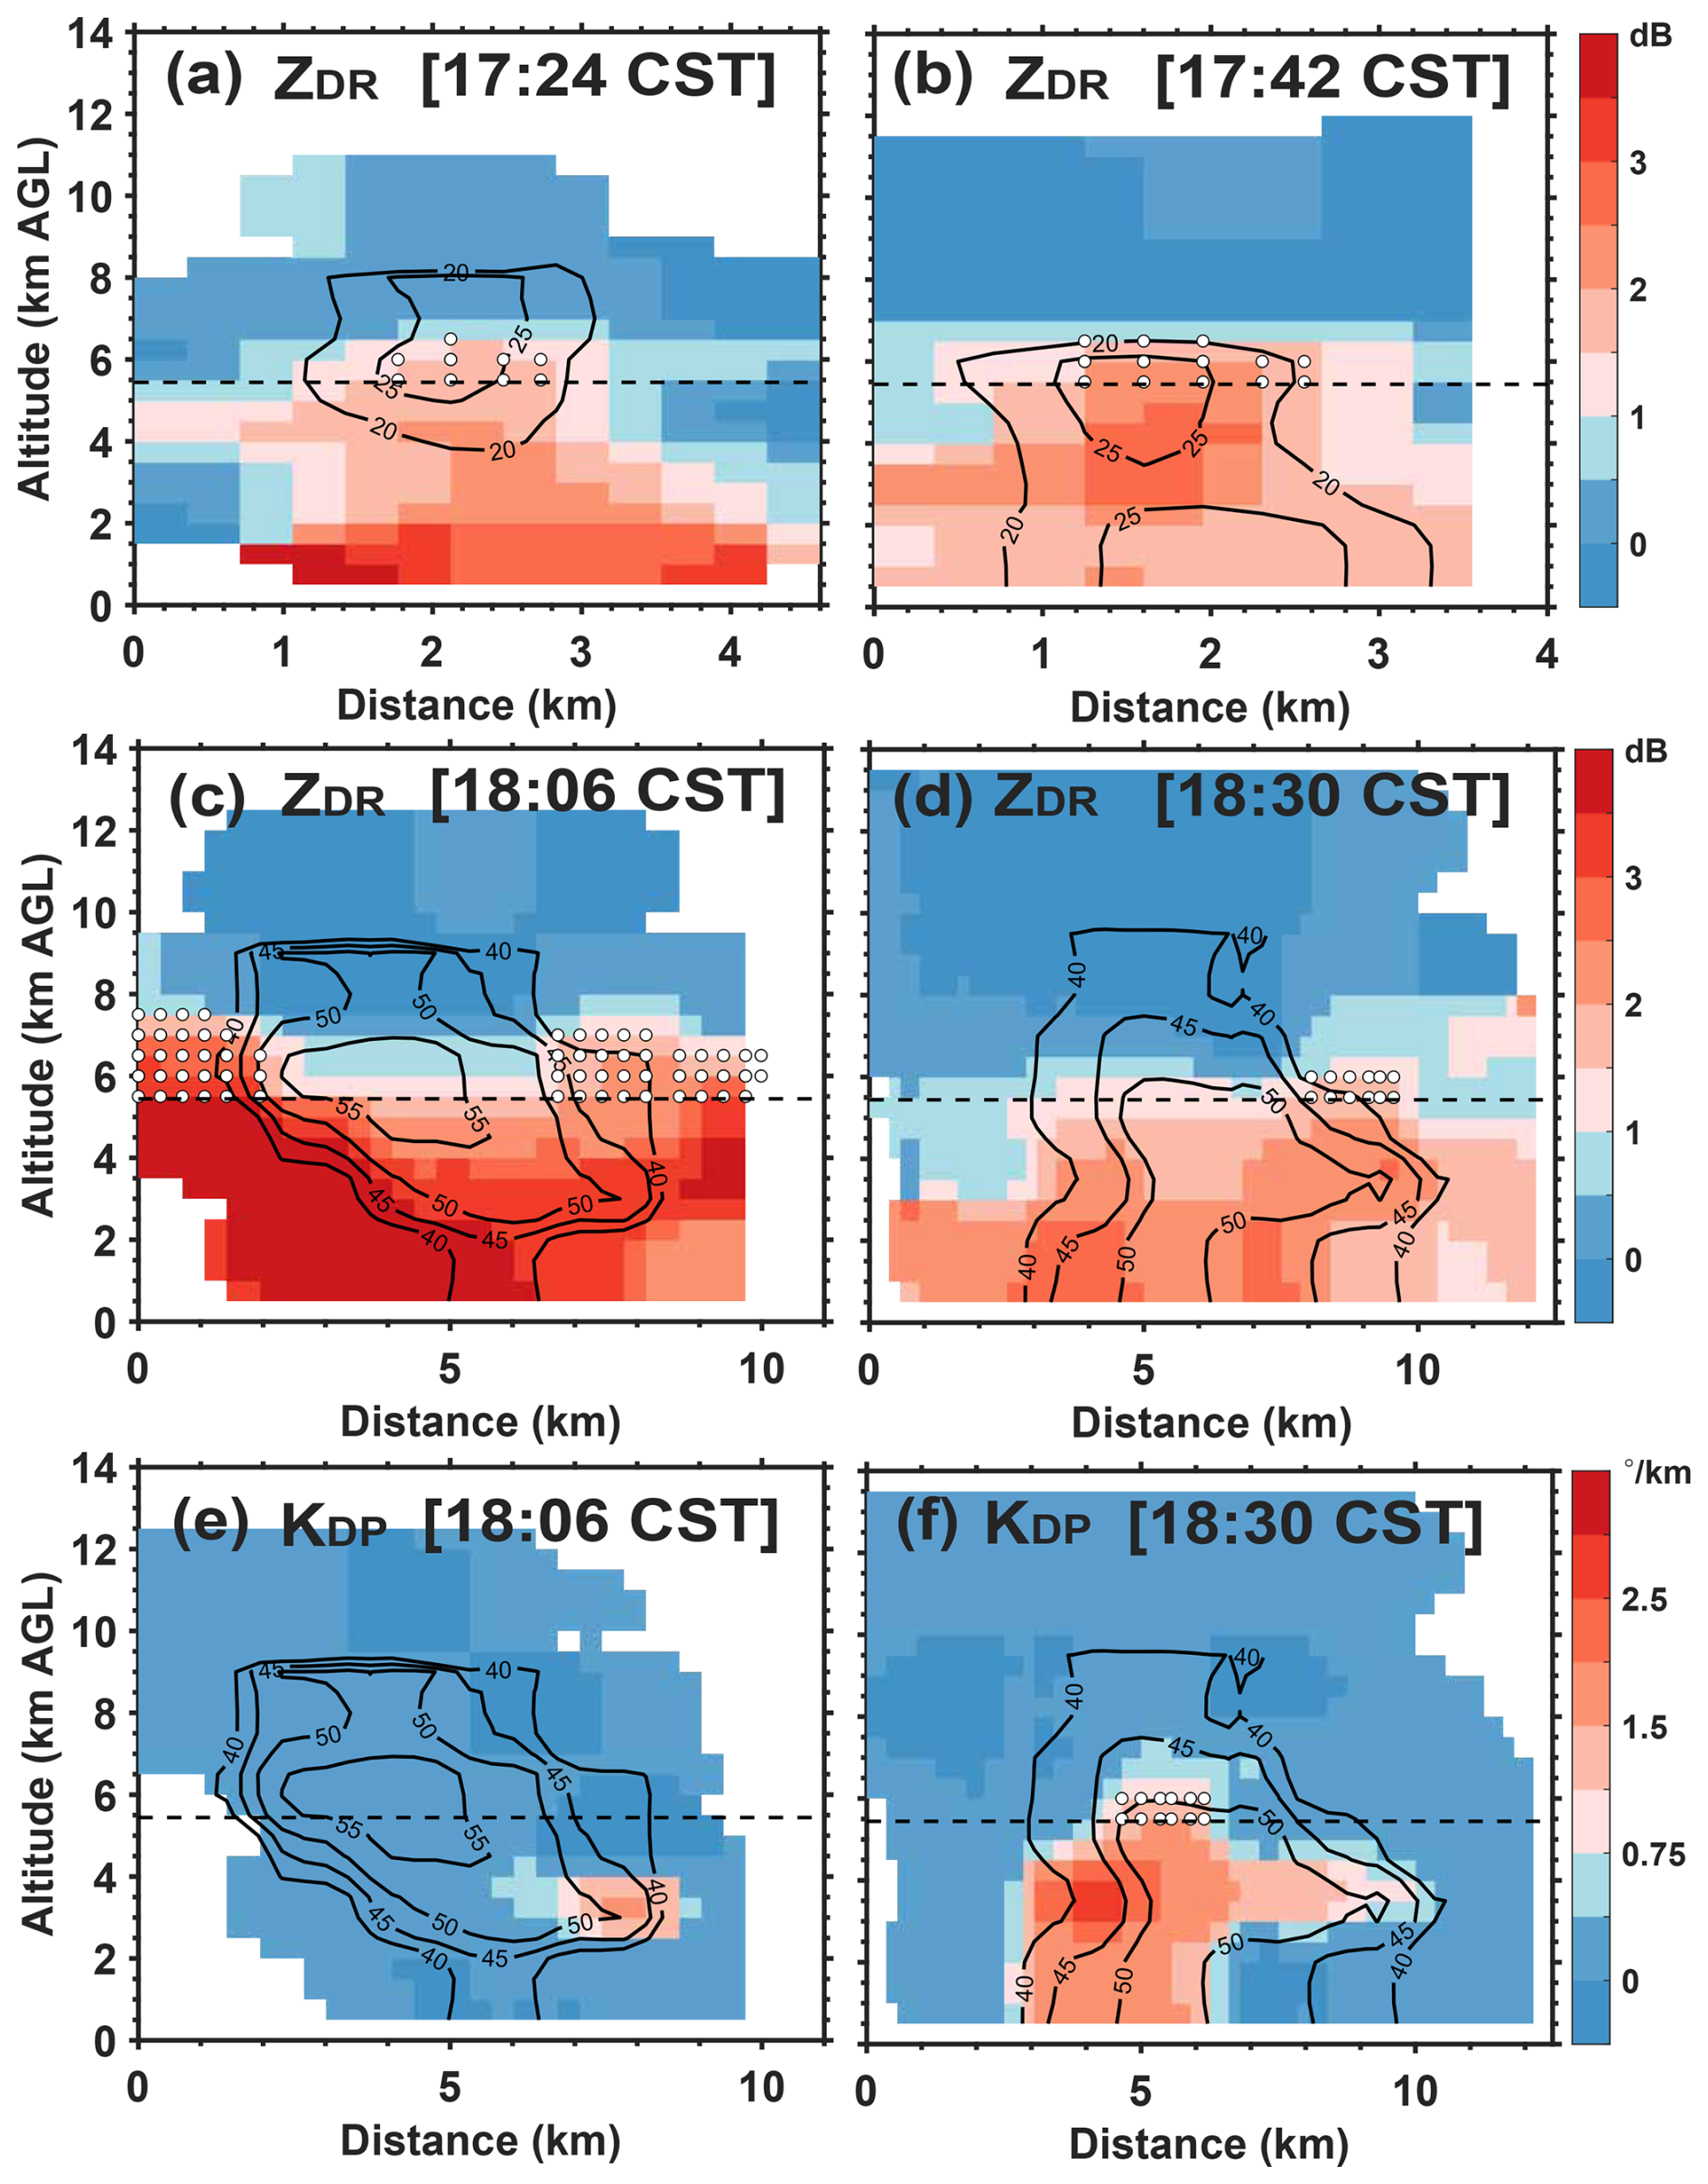
Figure 4Cross sections from the Cartesian grid of the studied isolated thunderstorm (case #1) at (a) 17:24 CST, ZDR; (b) 17:42 CST, ZDR; (c) 18:06 CST, ZDR; (d) 18:30 CST, ZDR; (e) 18:06 CST, KDP; and (f) 18:30 CST, KDP. The black dashed line indicates the 0 °C isotherm height. The white dots indicate the areas of the identified columns. The black contours with values indicate the reflectivity structure. AGL (above ground level).
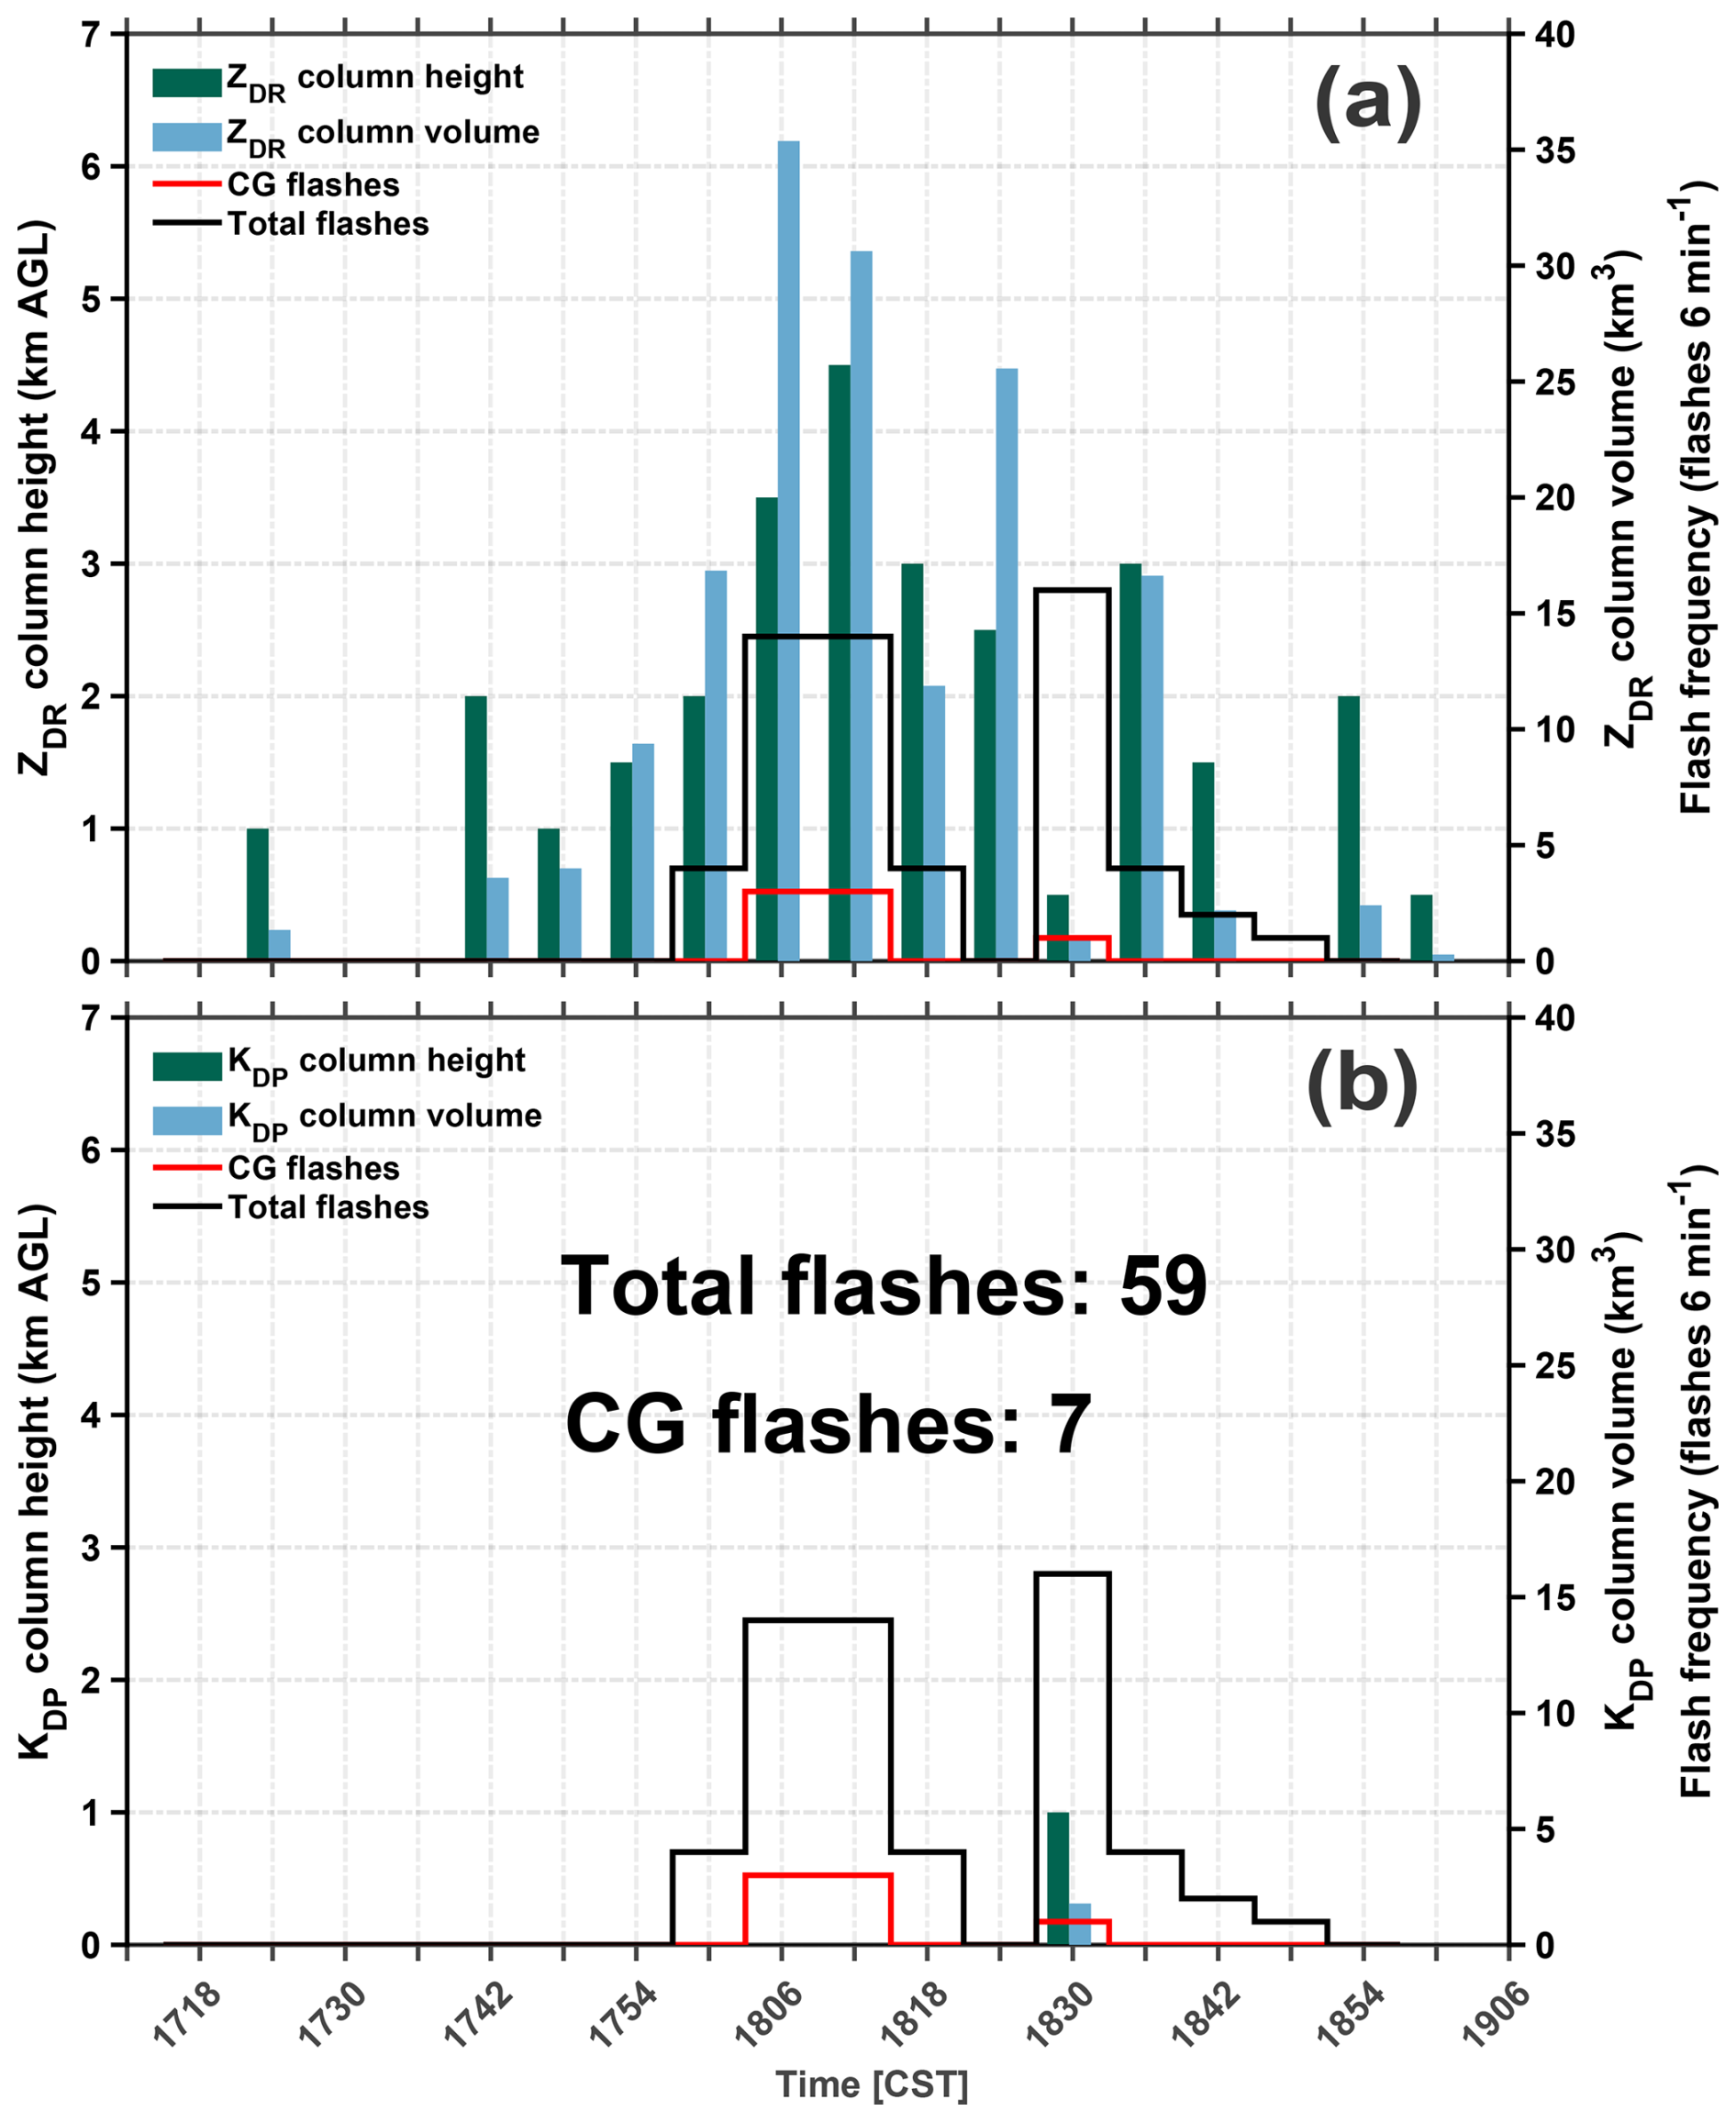
Figure 5Time–height (volume) variation in the ZDR column (a) and KDP column (b). The dark green bars indicate the column heights and the light blue bars indicate the column volumes. The black (red) stepped line indicates the total flashes (CG flashes) from the LFEDA. AGL (above ground level).
The first ZDR column in this isolated thunderstorm occurred at 17:24 CST (Figs. 4a, 5a). The second ZDR column subsequently occurred at 17:42 CST after 18 min (Figs. 4b, 5a). At 18:06 CST, the lightning activity reached the first peak (Fig. 6; to compare the radar and lightning data, the lightning flash frequency was counted every 6 min), and the ZDR column was the largest (in volume) at this time (Fig. 5a). However, the overlap region between the ZDR column and reflectivity core at 17:24 and 17:42 CST disappeared at 18:06 CST (Fig. 4c); i.e. the ZDR column within the reflectivity core began to collapse because of the falling of large-sized (represented by ZH values exceeding 40 dBZ) ice particles.
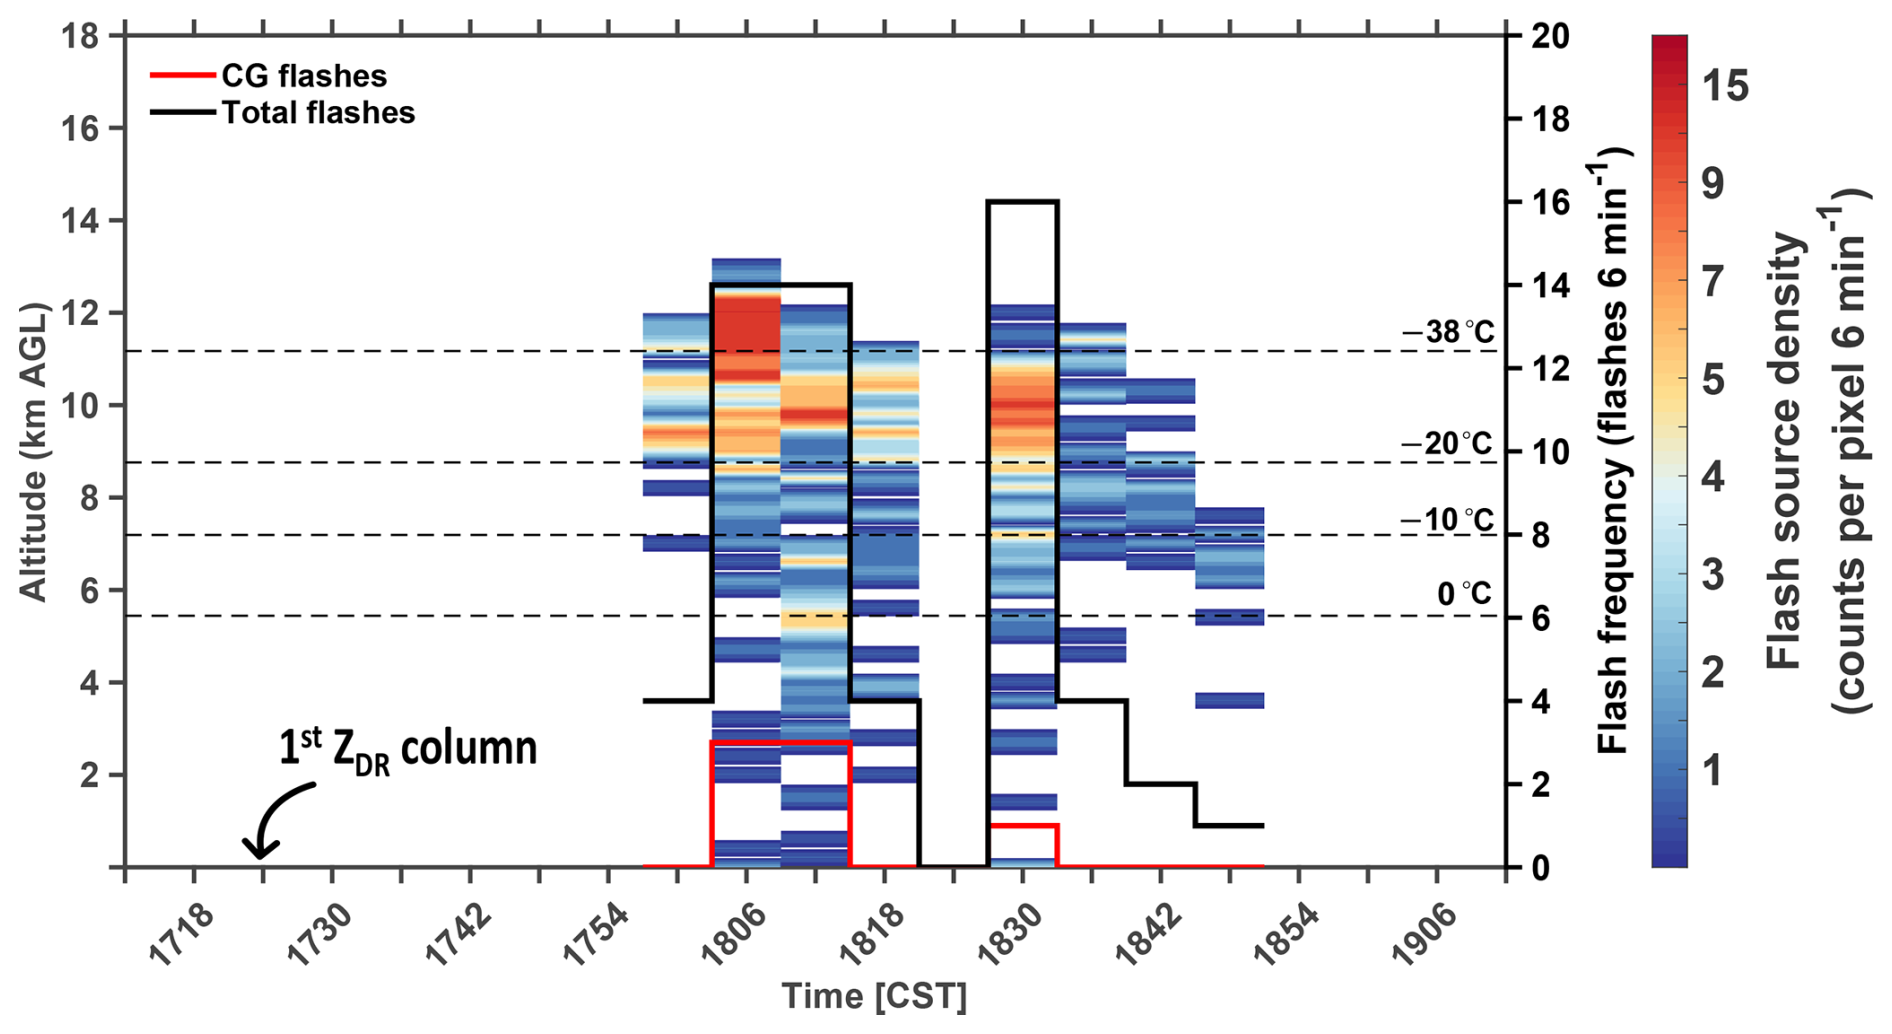
Figure 6Time–height variation in flash source density (count per pixel, 6 min−1). The black (red) stepped line indicates the total flashes (CG flashes) from the LFEDA. The dashed lines indicate the isotherm heights from 0 to −38 °C. AGL (above ground level).
Although large ice particles form and fall, the KDP column is absent. However, a KDP core with high values (≥ 1° km−1) occurs near the location where large ice particles (approximately 50 dBZ) melt, and a shedding process may occur, resulting in a KDP core (Fig. 4e). At 18:30 CST, the lightning activity reaches the second peak (Fig. 6), but the ZDR column almost disappears; interestingly, the KDP column forms, with high values expanding downwards to the bottom of the cloud (Fig. 4d, f). In addition, the KDP column only occurs at 18:30 CST, which corresponds to the second peak of lightning activity (Fig. 5b).
3.2 Vertical structures of microphysics related to lightning activity
To study the vertical thunderstorm structure related to lightning activity, we explore the vertical structures of polarimetric radar variables and microphysics, in combination with 3D lightning location data. Figure 7 displays the cross sections of polarimetric radar variables (ZH, ZDR, and KDP) and microphysics (hydrometeor types and microphysical fingerprints) from the Cartesian grid of the studied isolated thunderstorm. Figure 7a1–e1 shows the polarimetric structure prior to initiation of lightning. The ZDR column and reflectivity core (≥ 25 dBZ) begin to separate, having previously been overlapping during the initial development stage of the thunderstorm (Fig. 4a, b). Riming and graupel are present; specifically, the locations of graupel particles are associated with low ZDR values. At 18:00 CST (Fig. 7a2–e2), the lightning activity begins, and the locations of the flash sources are high and correspond mainly to graupel particles. Riming occurrence surrounds the flash sources. The ZDR column and reflectivity core (≥ 40 dBZ) are almost separated. Then, at 18:06 CST (Fig. 7a3–e3), riming has increased, the echoes strengthen (≥ 55 dBZ), and the heights of the strong echoes are lifted. The lightning activity reached the first peak, where the locations of the flash sources mainly corresponded to graupel and ice particles. This finding indicates that the convective strength is obviously increased and that the cold cloud processes are heavy. Moreover, the ZDR column is located at the periphery of the reflectivity core, and high KDP values occur and correspond to heavy rain particles, which are associated with large ice particles (e.g. hailstones) melting, raindrop coalescence and/or break. This phenomenon is consistent with that the KDP tends to be directly proportional to the rain mixing ratio (Snyder et al., 2017).
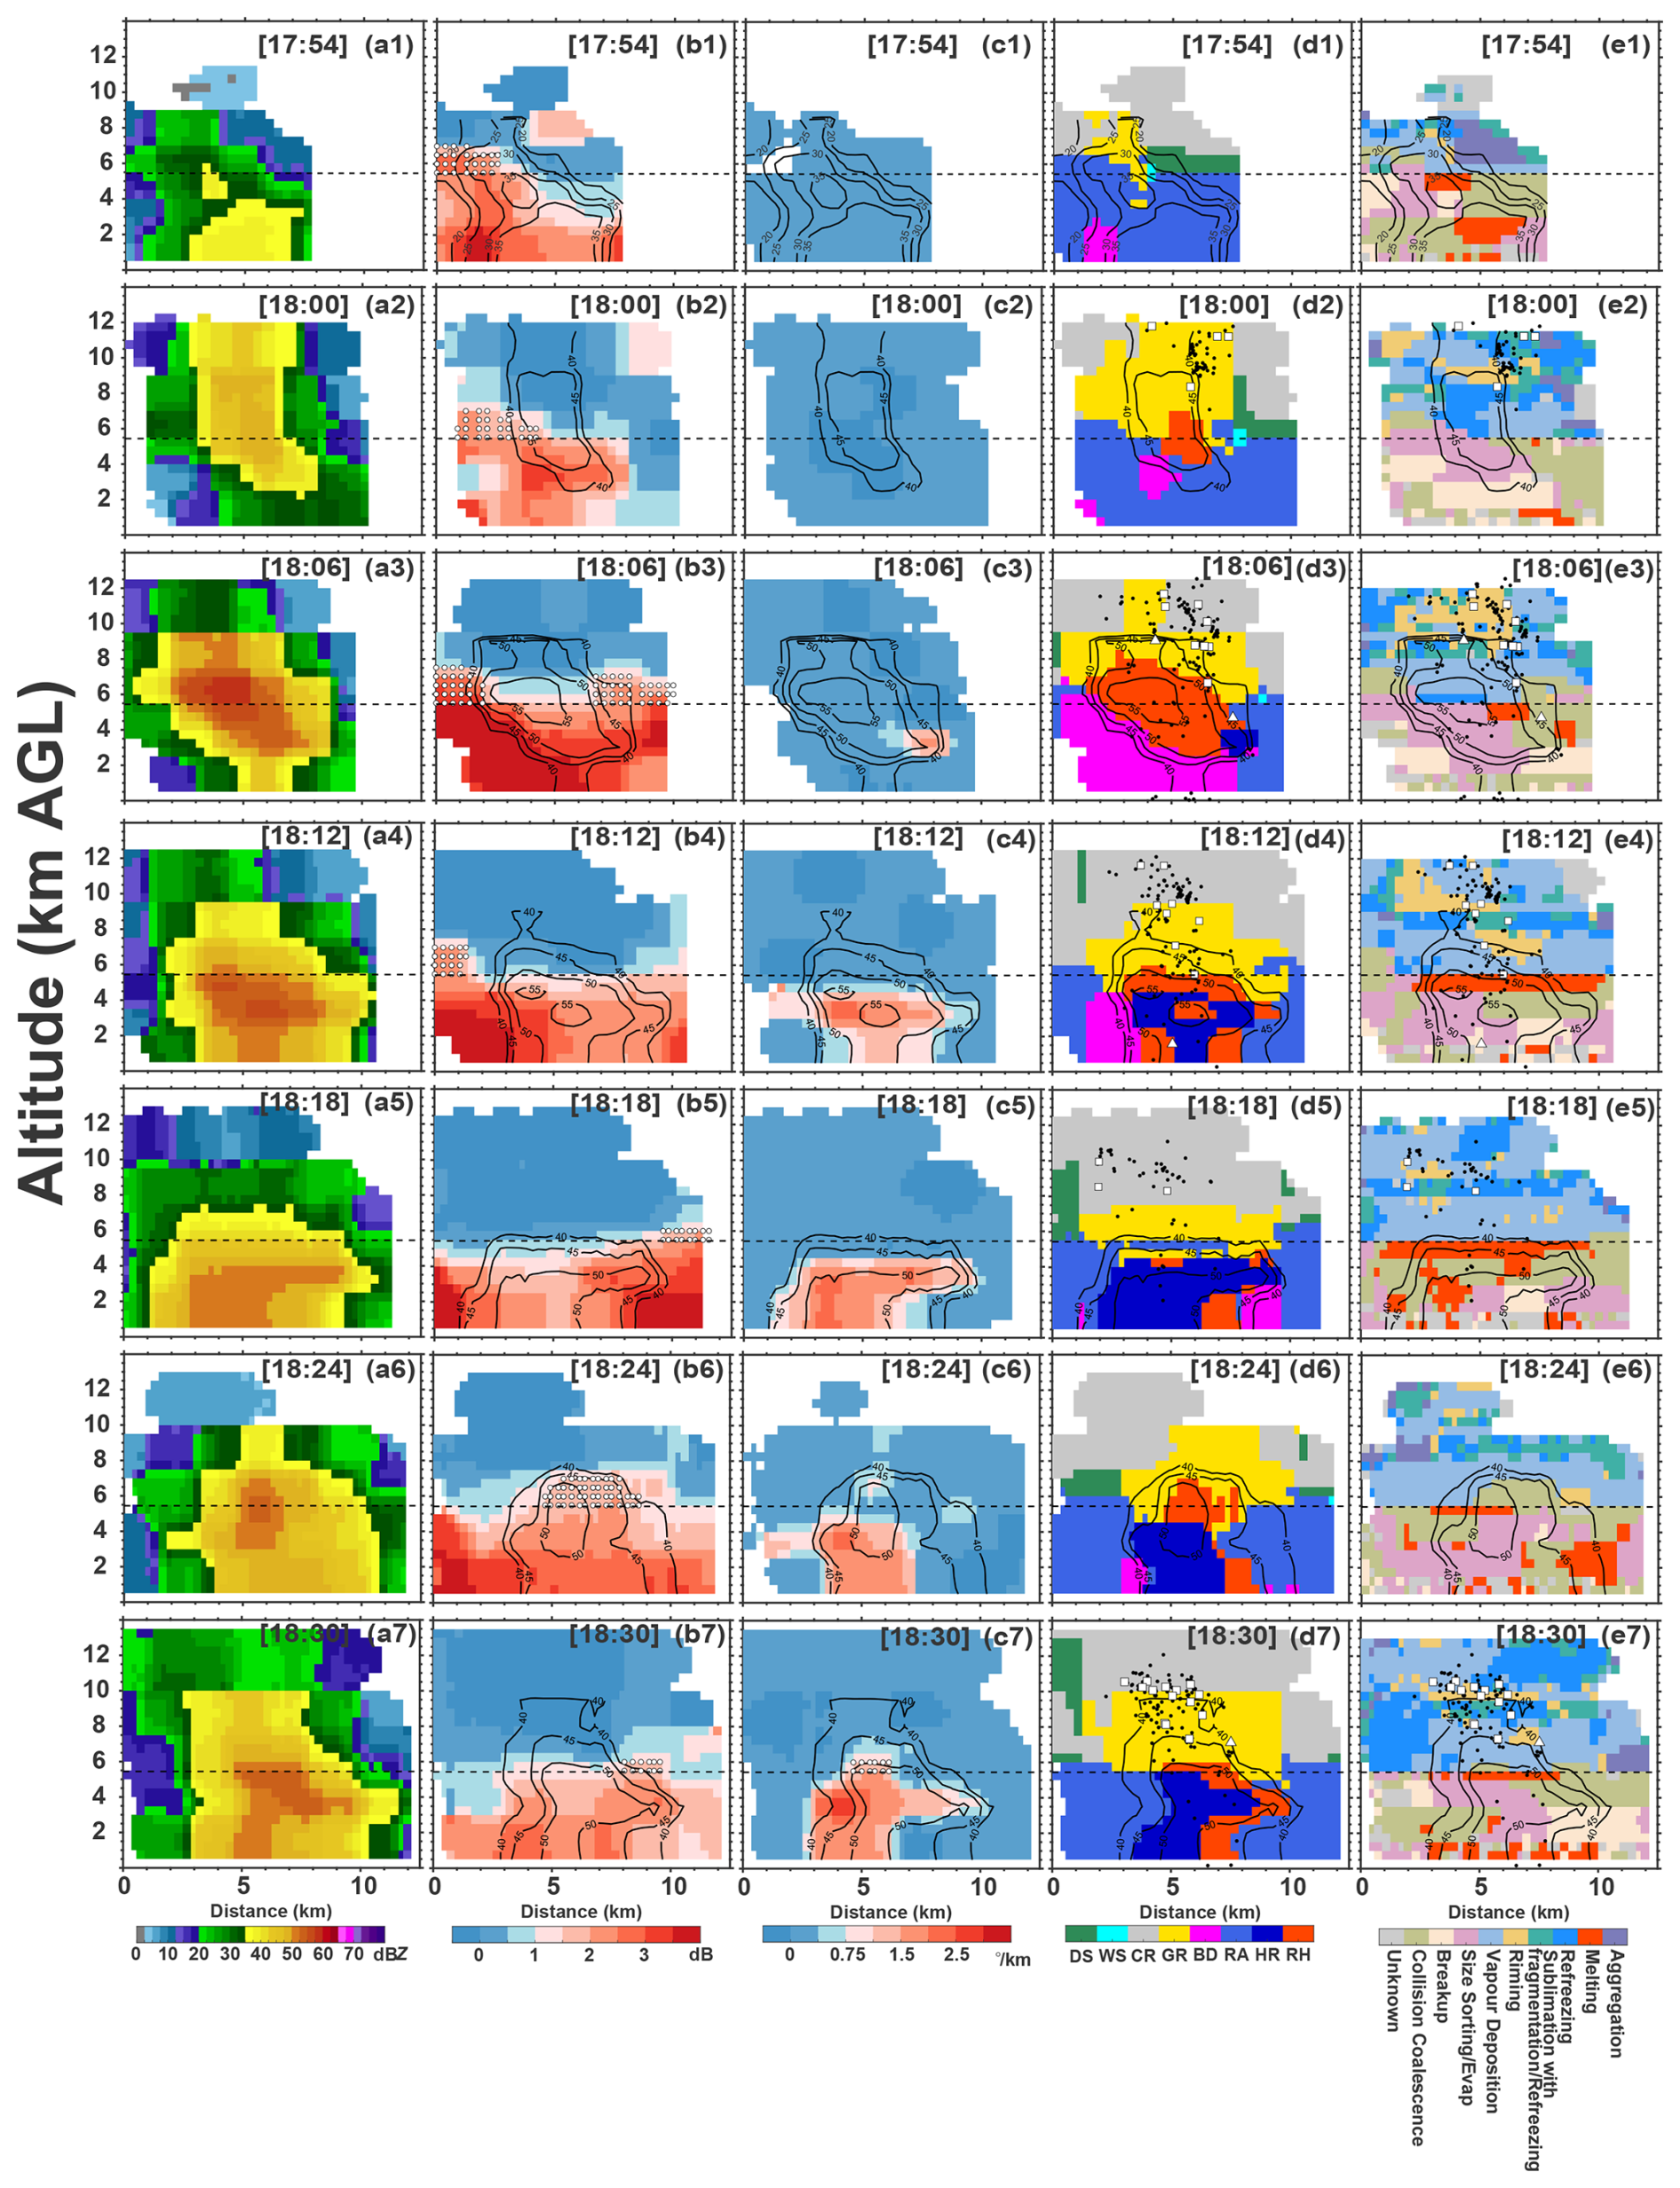
Figure 7Cross sections of polarimetric radar variables (ZH, ZDR, and KDP) and microphysics (hydrometeor types and microphysical fingerprints) from the Cartesian grid of the isolated thunderstorm (case #1). At 17:54 CST (a1–e1), 18:00 CST (a2–e2), 18:06 CST (a3–e3), 18:12 CST (a4–e4), 18:18 CST (a5–e5), 18:24 CST (a6–e6), and 18:30 CST (a7–e7). The black dashed line indicates the 0 °C isotherm height. The white dots indicate the areas of the identified columns. The black contours with values indicate the reflectivity structure. The black dots indicate the flash sources, the white square represents the first source of the intracloud flash, and the triangle represents the CG flash. Hydrometeor types are abbreviated: “DS” is dry aggregate snow, “WS” is wet snow, “CR” indicates crystals of various orientations, “GR” is graupel, “BD” is big drops, “RA” indicates light and moderate rain, “HR” is heavy rain, and “RH” indicates a mixture of rain and hail.
Subsequently, the lightning activity weakened at 18:12 and 18:18 CST. During this stage (Fig. 7a4–e4, a5–e5), the reflectivity core is landing and large ice particles above the melting level decrease, corresponding to heavy melting and indicating increasing downdraughts. Although ZDR columns are present, they can only indicate updraughts around the reflectivity core. However, the reflectivity core was lifted again at 18:24 CST (Fig. 7a6). The contents of rain and hail mixtures and graupel clearly increased (Fig. 7d6). This indicates that the convective strength is increased. Notably, the ZDR column and reflectivity core overlap again, just as occurred during the initial development of the thunderstorm (Figs. 4a, b; 7b6). Although a few high KDP values occurred above the melting level, a KDP column formed during the next 6 min (Fig. 7c6, c7). At 18:30 CST (Fig. 7a7–e7), the lightning activity reaches the second peak, and the riming process surrounds these flash sources. The ZDR column within the reflectivity core quickly collapses with the occurrence of abundant graupel particles.
In total, this thunderstorm shows two impulses in convective strength, which correspond to two lightning activity peaks. When the first impulse event initially develops, the ZDR column is obvious and overlaps or partly overlaps with the reflectivity core (Figs. 4a, b, and 7b1); however, the region of the ZDR column within the reflectivity core collapses, with abundant graupel particles forming by riming or freezing, stimulating updraughts and intensified lightning. When large ice particles (e.g. graupel or hailstone) subsequently decrease, indicating the end of the first impulse event, melting and shedding processes occur, resulting in more raindrops (many moderate-to-large and small raindrops) contributing to high values. These raindrops could recirculate into the updraughts and be lifted to the mixed-phase region, forming the ZDR column first, and raindrops could transfer to abundant graupel and even hailstones, promoting convection, i.e. increasing lightning activity (indicating the second impulse event). However, the ZDR column within the reflectivity core will collapse with increasing amounts of graupel and/or hailstone particles, but the KDP column will occur; this can be explained by the increased KDP values at the column top being associated with an increasing number of small-to-moderate hailstones with significant water fraction (Snyder et al., 2017). The lightning activity also reaches a peak value.
Thus, the ZDR column within the reflectivity core is probably an indicator of imminent ice microphysics, and then, the formation of abundant graupel particles promotes lightning activity via non-inductive charging; the KDP column is highly related to cold cloud processes, replacing the ZDR column to indicate updraughts within the reflectivity core when obvious graupels and hailstones occur.
3.3 The polarimetric and microphysical characteristics within the ZDR columns
Figure 8 shows the normalized distributions of the polarimetric and microphysical characteristics within the series of ZDR columns during the life cycle of the studied thunderstorm. The ZH values within the ZDR columns range from approximately 10 to 55 dBZ; specifically, weak reflectivity is present in the initial phase of the thundercloud (Fig. 8a). This suggests the use of the ZH threshold value (e.g. 25, 40, or 35–50 dBZ) to help select ZDR columns results in the loss of information, especially for the initial phase of clouds. The increase in reflectivity intensity within the ZDR columns can be used to predict lightning activity, and the peaks in both reflectivity intensity and lightning activity are consistent. A strong reflectivity intensity peak is associated with a high number of lightning flashes (Fig. 8a).
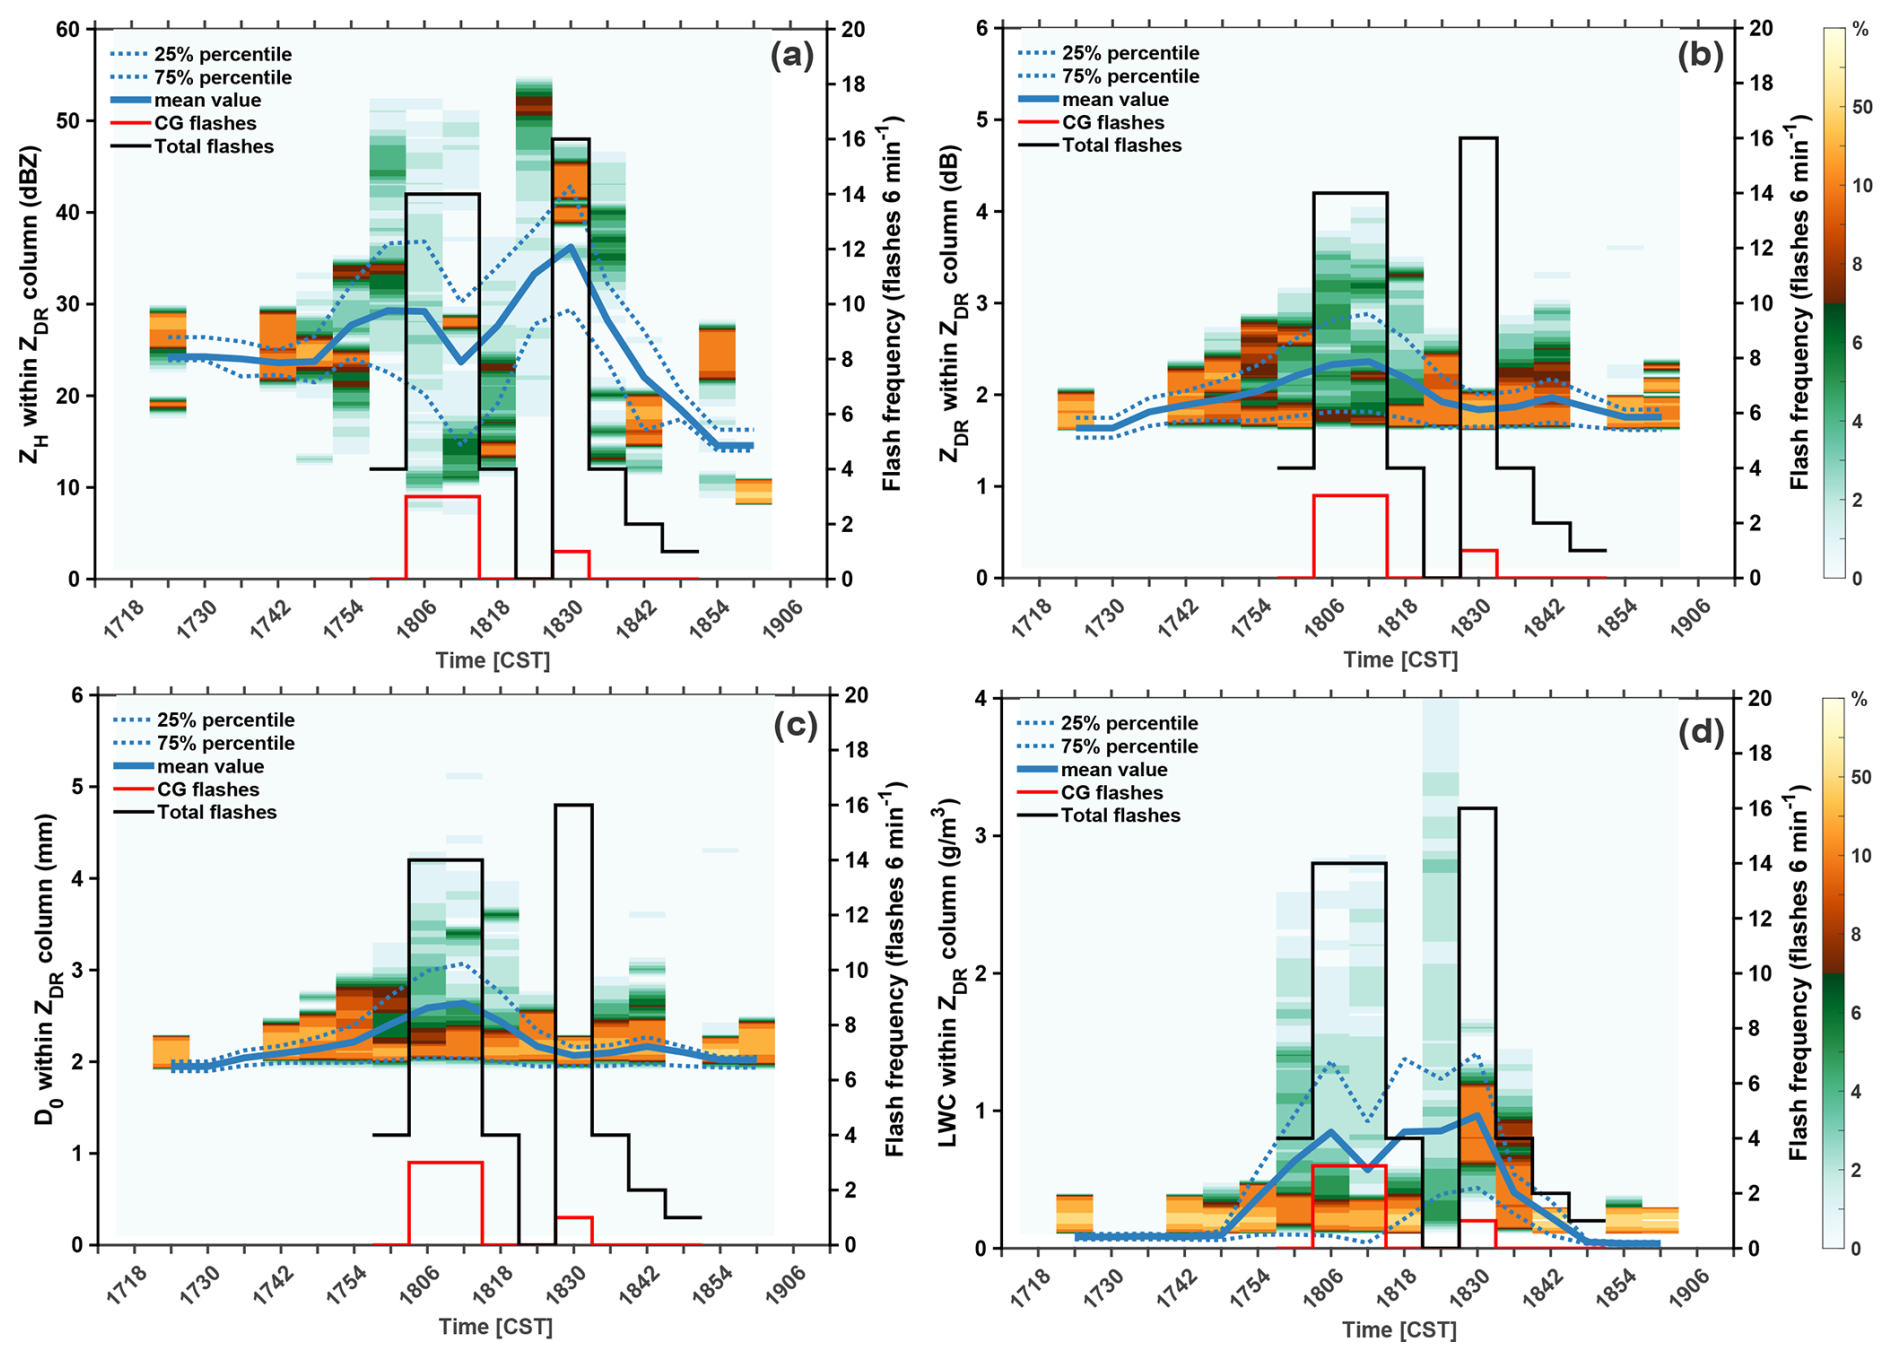
Figure 8The normalized distributions of the polarimetric and microphysical characteristics within the series of ZDR columns. (a) ZH. (b) ZDR. (c) Median volume diameter (D0) of raindrops. (d) Liquid water content (LWC). The blue solid line indicates the mean value. The shading indicates the normalized occurrence frequency (unit: %). The blue dashed lines indicate the 25 % and 75 % percentiles. The black (red) stepped line indicates the total flashes (CG flashes) from LFEDA, and the lightning flash frequency is counted every 6 min.
The ZDR values within the ZDR columns range from approximately 1.5 to 4 dB, and the increasing trend of the ZDR values is consistent with the first peak of lightning activity but has a low correlation with the second peak of lightning activity (Fig. 8b). The pattern of D0 within the ZDR columns is similar to that of the ZDR values, depending on the strong linear relationship between D0 and ZDR (Fig. 8c). The liquid water content within the ZDR columns ranges from approximately 0.1 to 4 gm−3, and the peaks correspond to the two peaks of lightning activity (Fig. 8d).
In addition, the percentage of hydrometeors within the ZDR columns is investigated on the basis of the retrieved contents of ice (including graupel) or raindrops, as described in Sect. 2.2. The results of hydrometeor identification are dominated by large-size particles. Thus, we count the grids of ice (graupel) or raindrops via the results of the ZDP method to investigate the percentage of hydrometeors within the ZDR columns, avoiding neglecting the grid that possesses both ice (graupel) particles and liquid drops simultaneously. The obvious phenomenon is that the percentage of graupel within the ZDR columns suddenly peaks before the first peak of lightning activity, but the second peak of lightning activity is not related to the presence of graupel within the ZDR columns; the hydrometeor type within the ZDR column at 18:30 CST is raindrops (Fig. 9). Notably, the results neglect raindrops smaller than 1 mm; although these small raindrops are a minority within the ZDR column. This indicate the collapse of the ZDR column within the reflectivity core at 18:30 CST, which is consistent with the results shown in Fig. 4d; the large-sized ice particles (i.e. graupel, corresponding to the reflectivity core) fall from aloft, and the smaller ZDR values of such ice particles result in this collapse phenomenon. Thus, the retained ZDR column corresponds to the periphery of the reflectivity core, indicating relatively weak updraughts and raindrops. Notably, the absence of graupel within the ZDR columns does not mean that the graupel particles are eliminated within the clouds. On the other hand, the sudden increase in graupel within the ZDR column at 18:00 CST may support the presence of a coalescence−freezing mechanism that led to graupel formation in the warm-based clouds. The hypothesis about the coalescence–freezing mechanism was proposed in previous studies (e.g. Braham, 1986; Bringi et al., 1997; Carey and Rutledge, 2000; Herzegh and Jameson, 1992).
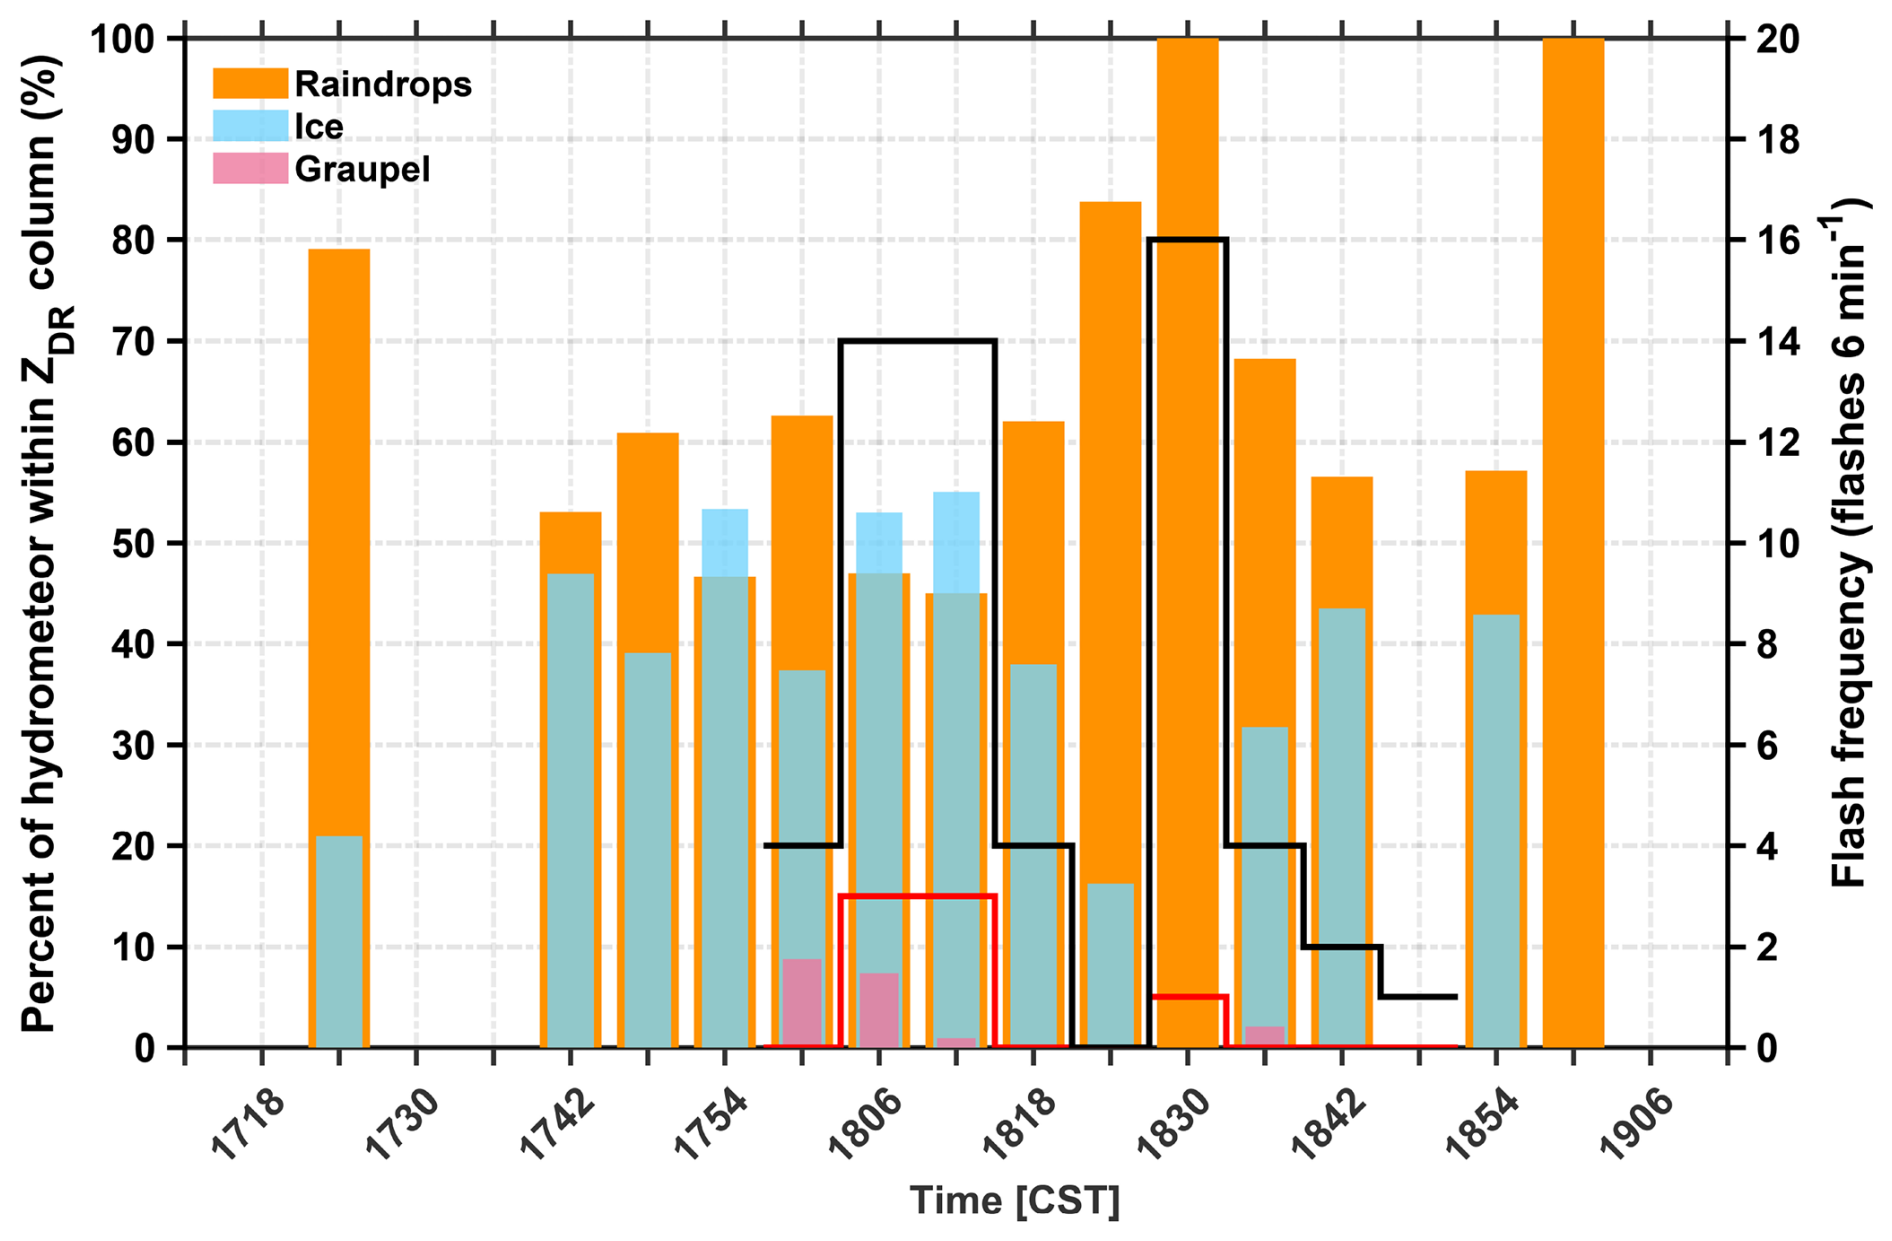
Figure 9The percentages of hydrometeors within the series of ZDR columns. The orange bars indicate the percentage of raindrops. The blue bars indicate the percentage of ice particles (including graupel). The pink bars indicate the percentage of graupel. The black (red) stepped line indicates the total flashes (CG flashes) from LFEDA, and the lightning flash frequency is counted every 6 min.
3.4 Statistical results
To determine the relationship between lightning activity and the quantified ZDR columns, the height and volume of the ZDR column are calculated via the 3D mapping column method; the volume is based on the accumulation of all grids within the ZDR column, and the volume of a single grid is 0.03125 km3, with 0.25 km horizontal and 500 m vertical resolutions. The height of the ZDR column is determined by counting the grid number (n) from the melting level to the highest grid within the ZDR column; if n is determined, the ZDR column height is n×0.5 km.
The variations in the column height and volume with the life cycle of the remaining 14 cases are displayed in Fig. 10 (cases #2 to #15), as are the variations in the percentages of hydrometeor types and microphysical fingerprints. The grid is assigned to specific particle type based on the results of hydrometeor identification, and the percentage of grids for each hydrometeor type is calculated. Similarly, this process is applied to determine the percentage of grids associated with microphysical fingerprints. Each of them has a ZDR column (Fig. 10a1–a14); however, the absence of a KDP column is possible (Fig. 10b1–b14). The results of our study, from 15 isolated thunderstorms over South China, indicate lightning is not observed in the absence of a ZDR column, and that a KDP column is not observed without a ZDR column, which is consistent with the observations of Bruning et al. (2024). Moreover, although the highest lightning flash frequency (in case #11) is observed when the ZDR and KDP columns are copresent, the total flashes in cases (e.g. #6, #10, and #15) with only the ZDR column are not lower than those in cases (e.g. #2, #3, and #5) where both ZDR and KDP columns are present. In addition, our results suggest that the signal in the KDP column within these small, isolated, subtropical thunderstorms over South China is not as steady as that in the ZDR column during the life cycle.
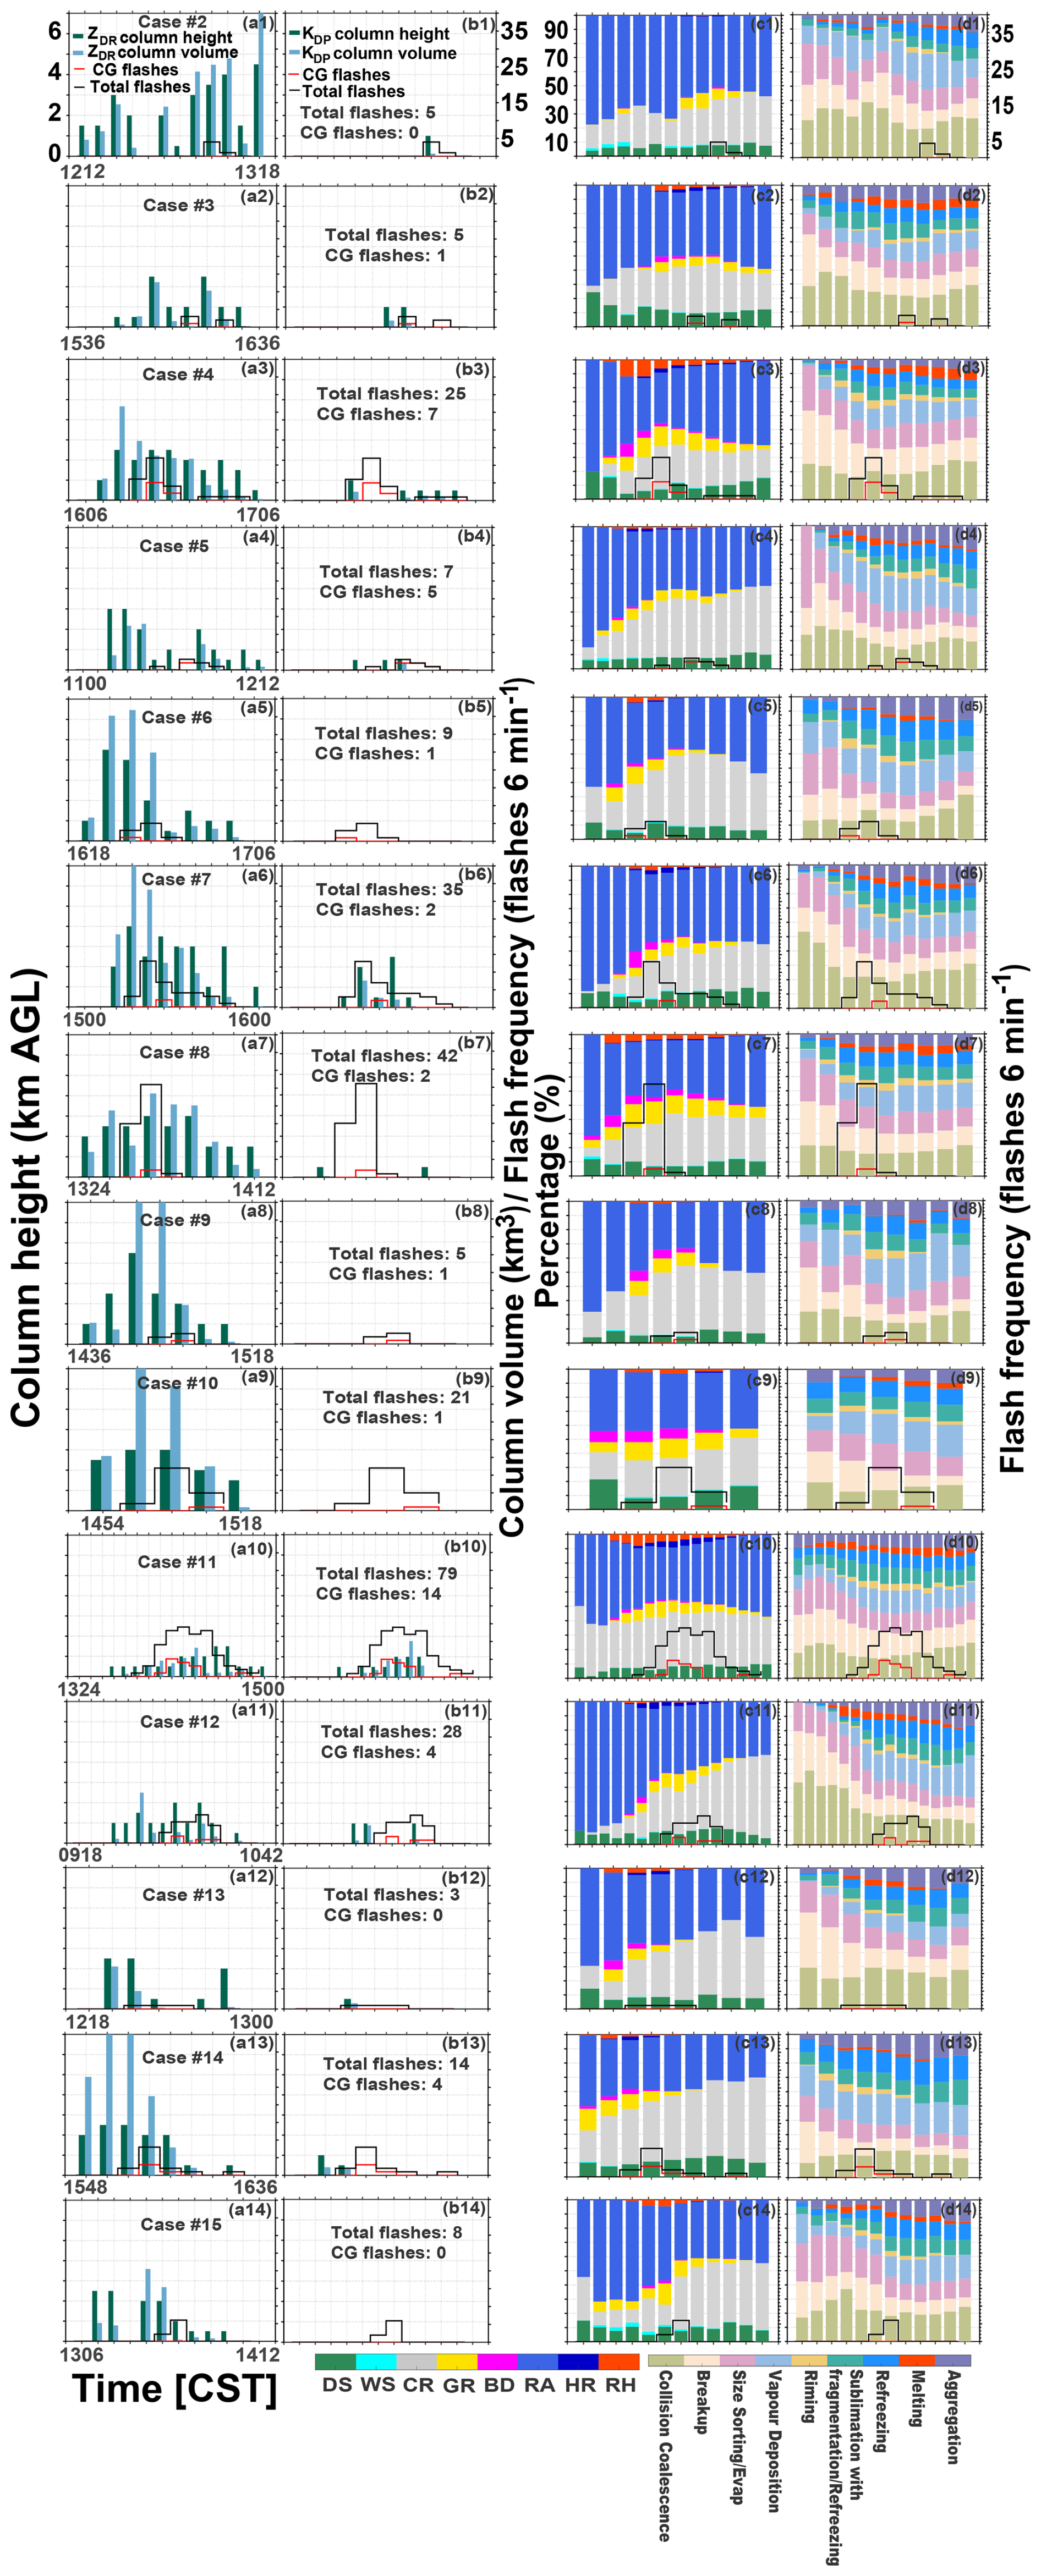
Figure 10The variation in ZDR column height and volume with the life cycle of thunderstorms (cases #2 to #15) (a1–a14). The variation in the KDP column height and volume with the life cycle of thunderstorms (cases #2 to #15) (b1–b14). The dark green bars indicate the column heights, and the light blue bars indicate the column volumes. The texts display the number of total flashes and CG flashes in a thunderstorm. The variation in percentages of hydrometeor types with the life cycle of thunderstorms (cases #2 to #15) (c1–c14). The variation in percentages of microphysical fingerprints with the life cycle of thunderstorms (cases #2 to #15) (d1–d14). The black stair lines indicate the total flashes, and the red stair lines indicate the CG flashes. Hydrometeor types are abbreviated: “DS” is dry aggregate snow, “WS” is wet snow, “CR” indicates crystals of various orientations, “GR” is graupel, “BD” is big drops, “RA” indicates light and moderate rain, “HR” is heavy rain, and “RH” indicates a mixture of rain and hail.
The results show that the percentages of identified graupel particles and riming process are closely related to lightning activities (Fig. 10c1–c14, d1–d14); consistent with that shown in Fig. 7. The cross-correlation approach can be used to examine the correlation considering the time lag, which is important for verifying whether a parameter is appropriate for forecasting another parameter. To further determine the correlation between lightning activity and the polarimetric structure. The cross correlations between the lightning activity and polarimetric structure during the life cycles in all the cases are examined, and the results are displayed in Fig. 11.
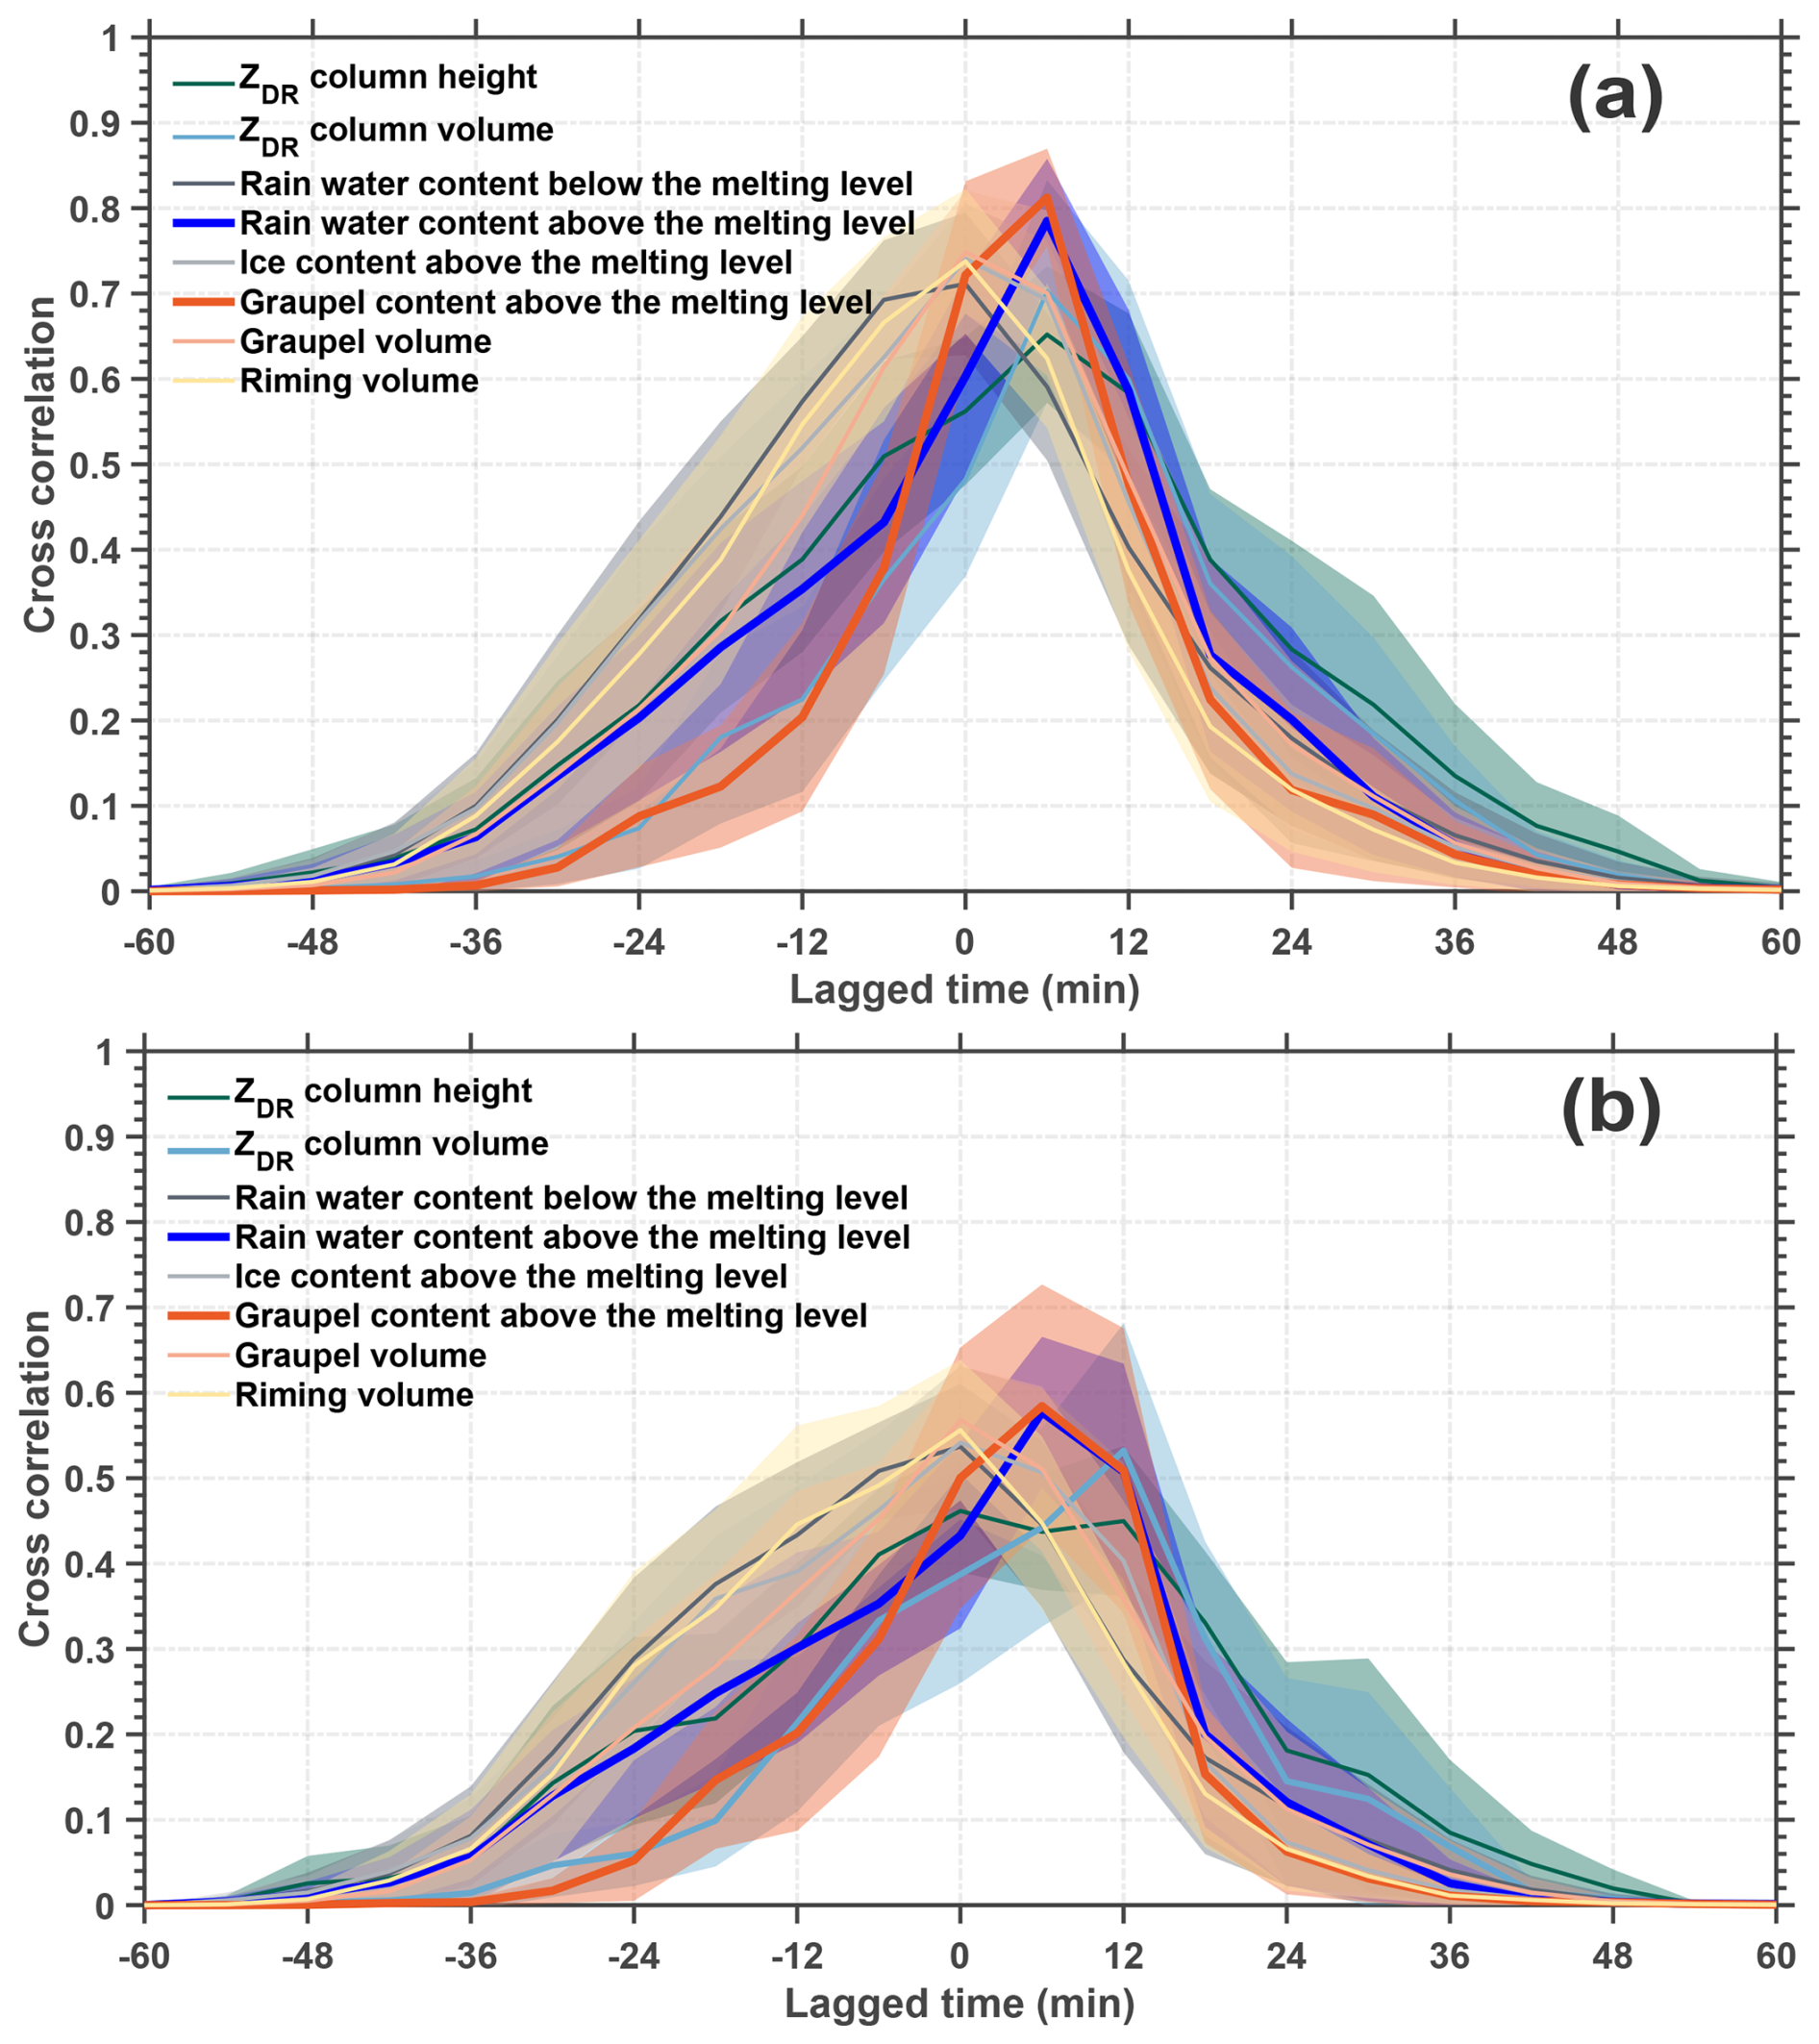
Figure 11Cross-correlations between flash frequency (total flashes (a), CG flashes (b)) and eight radar-retrieved variables (ZDR column height/volume, rain water content below/above the melting level, ice content above the melting level, graupel content above the melting level, graupel volume, and riming volume); the lines indicate the mean values and the shaded area indicates the 95 % confidence interval. Positive lagged time means that an increase in the variable comes before the increase in lightning.
Figure 11a shows that the variation in the graupel or rain water content above the melting level within the cloud can predict the lightning activity (total flashes) after 6 min well, and the correlation coefficient is approximately 0.8. However, other parameters (e.g. ZDR column volume, ice content above the melting level, and graupel volume) also exhibit good performance in forecasting lightning activity, and the correlation coefficient can reach approximately 0.7. The graupel volume is calculated based on the identification results of hydrometeors. Although the variation in the graupel or rain water content above the melting level within the cloud can also forecast the lightning activity (CG flashes) after 6 min, the correlation coefficient decreases to approximately 0.56 (Fig. 11b). Notably, the trend of the ZDR column volume implies that it may perform well with a longer warning time (e.g. 12 min) for lightning activity. In addition, the autocorrelation of each variable in time series would overestimate the strength of the relationship by approximately 0.15.
The relationship between the polarimetric structure and lightning activity is evaluated within 15 isolated thunderstorm cells during the cloud life cycle in this study. We focus on the proxies of cloud updraughts and supercooled liquid raindrops (ZDR or KDP columns) and the content of ice or rainwater, which have been demonstrated to be related to the variations in the number of lightning flashes in previous studies (e.g. Bruning et al., 2024; Carey and Rutledge, 2000; Hayashi et al., 2021; Sharma et al., 2024; Sharma et al., 2021; van Lier-Walqui et al., 2016). Furthermore, we explore the microphysical fingerprints, which should be related to column formation and lightning activity. Therefore, the objective of this study is to clarify the sequence and interactions of these parameters for predicting lightning activity during the cloud life cycle and understanding the corresponding cloud microphysics.
To precisely identify and quantify the ZDR or KDP columns within an isolated thunderstorm during the whole cloud life cycle, the 3D mapping columns method is improved; it is based on the morphology and high values of the ZDR or KDP columns in Cartesian grid data. The 3D mapping columns method has advantages in identifying ZDR columns in the initiation phase of convective clouds, avoiding the utilization threshold value of ZH. The volume and height of the ZDR columns are quantified via the 3D mapping columns method, and the correlation coefficient indicates that the volume of the ZDR column is better for forecasting lightning activity than the column height is. In addition, both the volume and height of a ZDR column have some limitations in forecasting lightning activity, except during the early phase. This phenomenon is similar to the results of Sharma et al. (2024). In their study, the correlation coefficient between the ZDR column volume and total flash rate generally monotonically decreased after the initial lightning jump, and the volume of the KDP columns exhibited relatively high co-variability with the total flash rate, except in the early phase. The time lag between the formation of the ZDR column and that of the KDP column was consistent with the results of this study, indicating the different formation mechanisms of the ZDR and KDP columns described in Sect. 1.
As discussed in Sect. 3.2, lightning activity is indeed related to dynamic and microphysical variation and impulses in convective strength, which is consistent with the findings of previous studies (e.g. Bruning et al., 2024; Sharma et al., 2024, 2021). The unsteady ZDR and KDP columns are tied to unsteady convective strength associated with thermal bubbles, and warm- and cold-phase microphysics. In this way, the variations in the ZDR and KDP columns can indicate lightning activity. Although this hypothesis is reasonable and supported by observations through the microphysical signatures of large-drop lofting and glaciation corresponding to the ZDR and KDP columns (Bruning et al., 2024; Fridlind et al., 2019); however, the observations of Sharma et al. (2024) and Sharma et al. (2021) revealed that the KDP column volumes (or mean KDP values within a segmented KDP column) have noticeably different pattern than the ZDR column volumes (or mean ZDR values within a segmented ZDR column), which has remained a question in Sharma et al. (2021).
In this study, we explore the polarimetric and microphysical structures related to impulse events, indicated by lightning activity. The results indicate that the column within the reflectivity core is only the ZDR column in which the impulse event initially develops; then, the supercooled raindrops indicated by the ZDR column transfer to abundant graupel and/or hailstone particles; accompanying the ZDR column within the reflectivity core, it collapses, and lightning intensifies. Moreover, the formation of the KDP column requires melting and shedding processes from large ice particles (e.g. graupel or hailstones) that produce many raindrops of moderate-to-large and small sizes, which contribute to high values. These raindrops can recirculate into updraughts and be lifted to the mixed-phase region, forming the ZDR column first, but then, it collapses as graupel and/or hailstone particles increase. Convection and lightning are enhanced, and a KDP column is formed, which is associated with an increasing number of small-to-moderate hailstones with a significant water fraction. Thus, the ZDR and KDP columns within the reflectivity core are associated with the different stages of an impulse event, the ZDR column indicates the stage in which cold cloud processes are weak, and the KDP column is the opposite of the ZDR column. This may explain the remaining question in Sharma et al. (2021), namely, why the KDP column has a noticeably different pattern than the ZDR column does. Notably, the ZDR column is located at the periphery of the reflectivity core when the ZDR column collapses within the reflectivity core.
We bridged the polarimetric structure (the column, supercooled liquid water, and graupel content below 0 °C) and lightning activity on the basis of observations of 15 isolated thunderstorm cells (the variation curve is conceptualized in Fig. 12). The two peaks of lightning activity in Fig. 12 suggest multiple impulse events in convection; specifically, the first peak refers to the initial impulse event, but the second peak suggests subsequent impulse events.
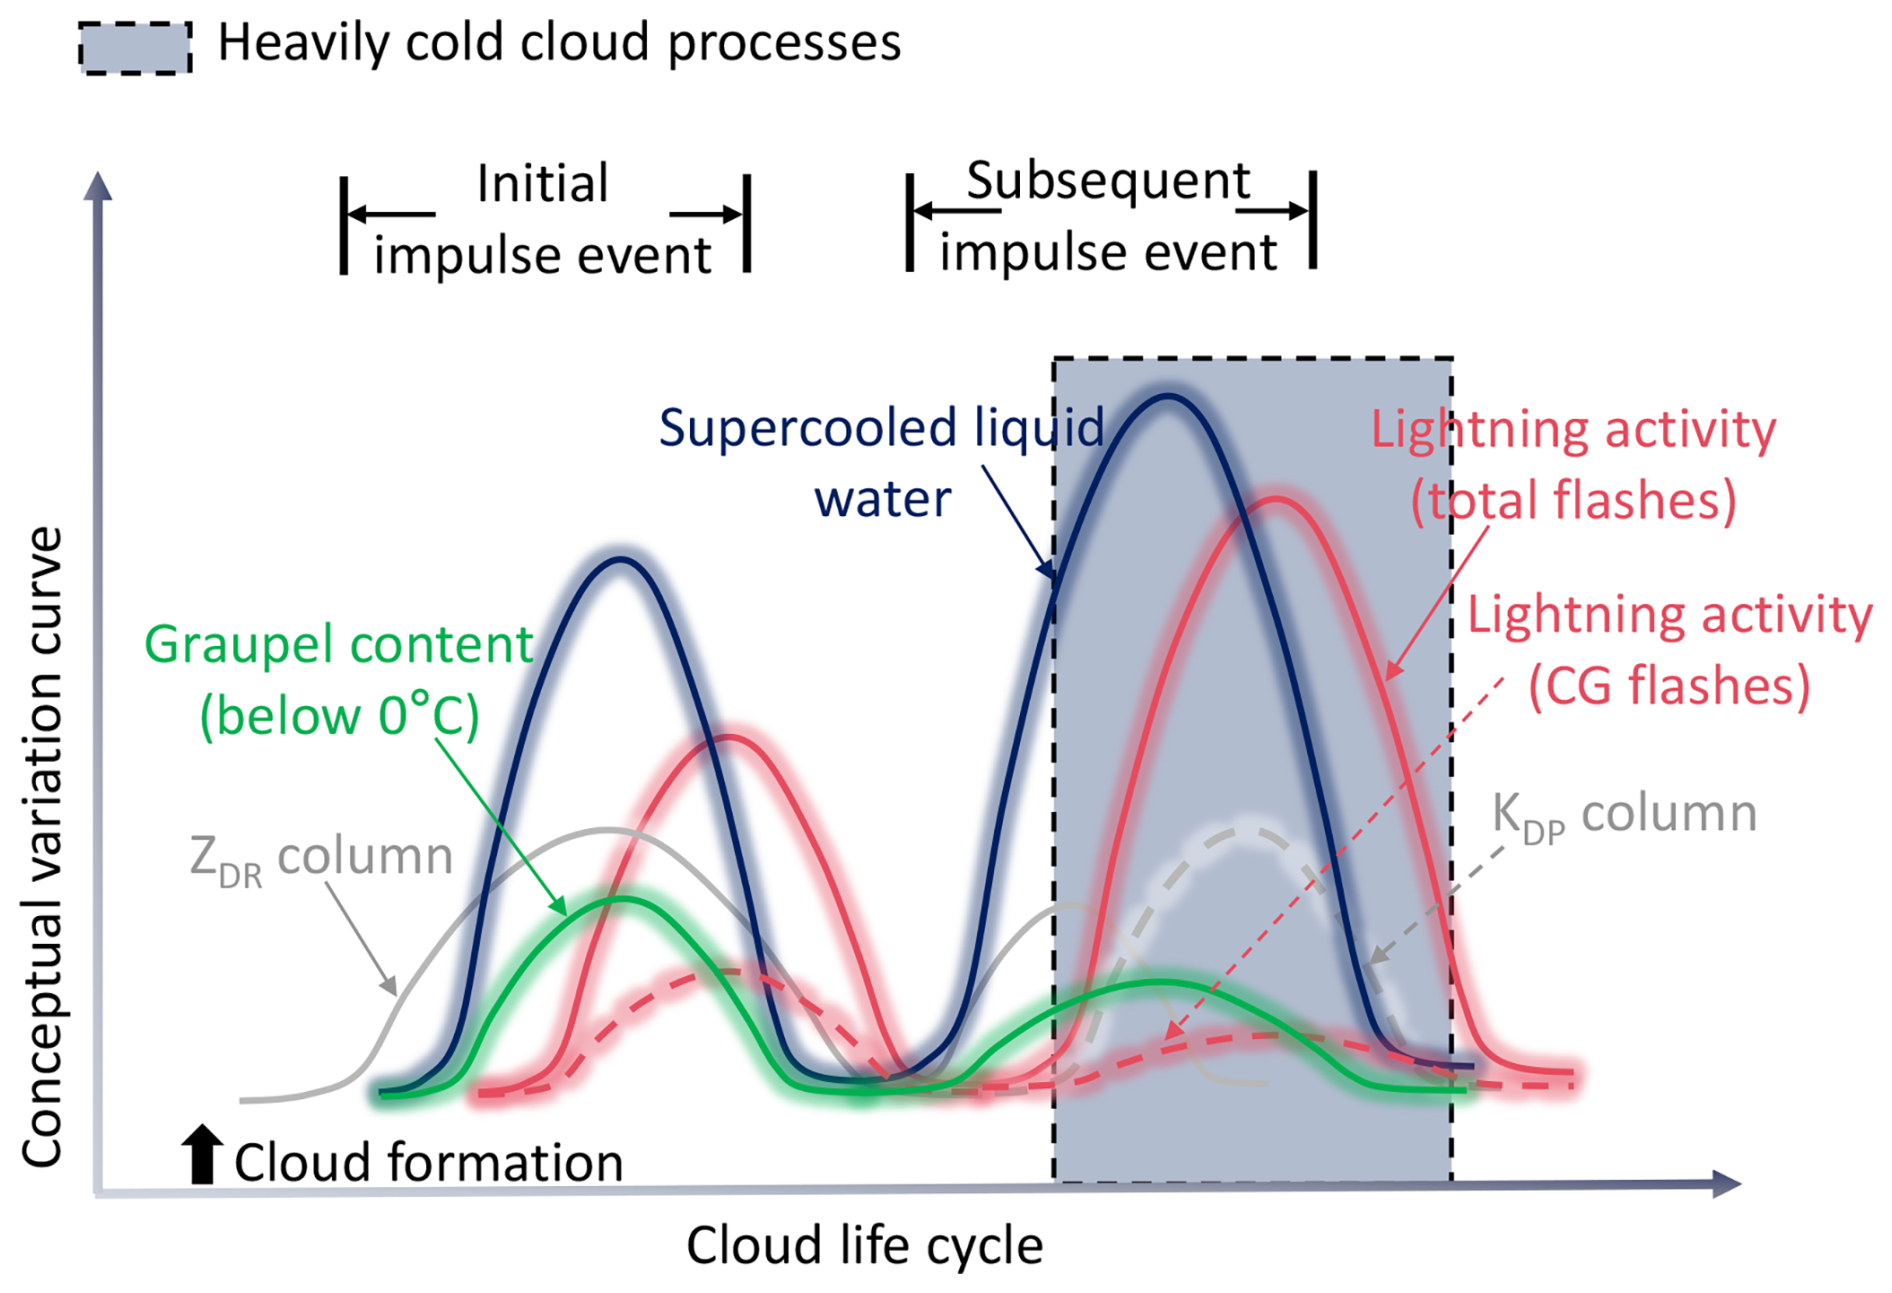
Figure 12A conceptual model bridging the polarimetric structure and lightning activity. Cloud formation is defined as the first radar volume scan in cases where the composite reflectivity is ≥ 5 dBZ. The end of the thunderstorm cloud life cycle is defined as the radar volume scan in cases where the maximum reflectivity starts to fade with a value of less than 30 dBZ. The impulse events in terms of the convective strength correspond to be lightning activity peaks. The magnitude of the amplitudes among these curves has no practical meaning; it is merely for visualization purposes.
In our opinion (Fig. 12), the ZDR column within the reflectivity core is probably an indicator of increasing convective strength, after which the formation of abundant graupel particles promotes lightning activity via non-inductive charging. Therefore, graupel content is more directly related to lightning activity than is the ZDR column. Moreover, the observations reveal that the microphysical variations in supercooled liquid water and graupel yield better correlation coefficients for the prediction of lightning activity at short warning times (e.g. 6 min in this study) than do the dynamical variations in the ZDR column volume. However, the trend of the ZDR column volume implies that it may perform well with a longer warning time (e.g. 12 min in this study) for lightning activity. The KDP column is highly related to cold cloud processes. Thus, the KDP column is probably absent when the impulse event initially develops; however, it will be present later with heavily cold cloud processes, replacing the ZDR column to indicate updraughts within the reflectivity core when obvious graupels and hailstones are occurring. In addition, the 6 min or 12 min warning time in our results is probably due to the temporal resolution (6 min) of the radar data used in this study; the update time of a full volume scan of phased-array radar is approximately 1 min; thus, the high temporal resolution observations provided by phased-array radar may decrease the uncertainty resulting from the radar scanning strategy.
Notably, the threshold value for identifying the ZDR column (≥ 1.5 dB) in this study is different from that (≥ 1 dB) in previous studies (e.g. Sharma et al., 2024). Although this threshold value is selected according to the retrieved raindrop diameter, which should exceed 2 mm within the ZDR column during the initial phase of a storm (Kumjian et al., 2014), the results for quantifying the ZDR column (i.e. height and volume) may be different from those of previous studies that used the 1 dB threshold (e.g. Sharma et al., 2024). However, this study focuses on the trend of the ZDR column height or volume; thus, the differences resulting from different thresholds are negligible. The threshold value for identifying the KDP column (≥ 1° km−1) in this study is consistent with that used by Sharma et al. (2024). However, the different estimation methods for KDP may introduce additional uncertainty, as discussed in Sharma et al. (2021).
Moreover, the height of the melting layer (0 °C), which is derived from environmental soundings, is assumed to be constant for identifying and quantifying the column; however, the melting level is frequently elevated within updraught cores because of latent heat release, which is influenced by the strength of updraughts relative to the ambient environment. Thus, a more accurate melting level will decrease the biased estimations of the 3D mapping columns method in this study. In addition, although our results support some observations in Bruning et al. (2024) and seem to explain the remaining question in Sharma et al. (2024) and Sharma et al. (2021), whether there are differences between such small, isolated, subtropical thunderstorms and other thunderstorm types (i.e. mesoscale convective systems, supercells, or tropical thunderstorms) should be further analysed to reduce the probability of uncertainty in our study. Finally, although the results retrieved from hydrometeor identification and microphysical fingerprint methods are reasonable and consistent with [expectations from] theory in this study, the potentially biased estimates may result from isothermal height and the status of the hydrometeor (e.g. canting angle).
All data in this study can be obtained from an open repository Figshare (https://doi.org/10.6084/m9.figshare.28070105.v3, Zhao, 2024).
Conceptualization: CZ and YZ. Data curation: CZ, YZ, DZ, SD, and WY. Formal analysis: CZ, YZ, XP, and YD. Funding acquisition: YZ and CZ. Investigation: CZ, YZ, and XP. Methodology: CZ, YZ, HZ, ZL, and DZ. Project administration: YZ. Resources: CZ and YZ. Software: CZ, HZ, and ZL. Supervision: YZ. Validation: CZ and YZ. Visualization: CZ and YZ. Writing (original draft): CZ, YZ, and XP.
The contact author has declared that none of the authors has any competing interests.
Publisher’s note: Copernicus Publications remains neutral with regard to jurisdictional claims made in the text, published maps, institutional affiliations, or any other geographical representation in this paper. While Copernicus Publications makes every effort to include appropriate place names, the final responsibility lies with the authors. Views expressed in the text are those of the authors and do not necessarily reflect the views of the publisher.
We thank Prof. Eric Bruning and the anonymous referees for their professional and constructive comments and suggestions. We acknowledge the Guangzhou Institute of Tropical and Marine Meteorology for collecting and archiving the radar observations. And we also acknowledge the State Key Laboratory of Severe Weather Meteorological Science and Technology & CMA Key Laboratory of Lightning for 3D lightning location data.
This research has been supported by the National Natural Science Foundation of China (grant nos. 42175090 and 42305079), the China Postdoctoral Science Foundation (grant no. 2023M730619), the Natural Science Foundation of Sichuan Province (grant no. 2024NSFSC0771), and the Scientific Research Fund of Chengdu University of Information Technology (grant nos. KYTZ202213, KYQN202301, and KYQN202307).
This paper was edited by Philip Stier and reviewed by Eric Bruning and two anonymous referees.
Amiot, C. G., Carey, L. D., Roeder, W. P., McNamara, T. M., and Blakeslee, R. J.: C-band Dual-Polarization Radar Signatures of Wet Downbursts around Cape Canaveral, Florida, Weather and Forecasting, 34, 103–131, https://doi.org/10.1175/waf-d-18-0081.1, 2019.
Baker, M. B., Christian, H. J., and Latham, J.: A computational study of the relationships linking lightning frequency and other thundercloud parameters, Quarterly Journal of the Royal Meteorological Society, 121, 1525–1548, https://doi.org/10.1002/qj.49712152703, 1995.
Baker, M. B., Blyth, A. M., Christian, H. J., Latham, J., Miller, K. L., and Gadian, A. M.: Relationships between lightning activity and various thundercloud parameters: satellite and modelling studies, Atmospheric Research, 51, 221–236, https://doi.org/10.1016/S0169-8095(99)00009-5, 1999.
Braham Jr., R. R.: The cloud physics of weather modification. Part 1: Scientific basis, WMO Bulletin, 35, 215–221, 1986.
Bringi, V. N. and Chandrasekar, V.: Polarimetric Doppler Weather Radar: Principles and Applications, Cambridge University Press, Cambridge, ISBN 978-0-521-62384-1, 2001.
Bringi, V. N., Liu, L., Kennedy, P. C., Chandrasekar, V., and Rutledge, S. A.: Dual Multiparameter Radar Observations of Intense Convective Storms: The 24 June 1992 Case Study, Meteorology and Atmospheric Physics, 59, 3–31, https://doi.org/10.1007/BF01031999, 1996.
Bringi, V. N., Knupp, K., Detwiler, A., Liu, L., Caylor, I. J., and Black, R. A.: Evolution of a Florida Thunderstorm during the Convection and Precipitation/Electrification Experiment: The Case of 9 August 1991, Monthly Weather Review, 125, 2131–2160, https://doi.org/10.1175/1520-0493(1997)125<2131:EOAFTD>2.0.CO;2, 1997.
Bruning, E. C. and MacGorman, D. R.: Theory and Observations of Controls on Lightning Flash Size Spectra, Journal of the Atmospheric Sciences, 70, 4012–4029, https://doi.org/10.1175/jas-d-12-0289.1, 2013.
Bruning, E. C., Brunner, K. N., van Lier-Walqui, M., Logan, T., and Matsui, T.: Lightning and Radar Measures of Mixed-Phase Updraft Variability in Tracked Storms during the TRACER Field Campaign in Houston, Texas, Monthly Weather Review, 152, 2753–2769, https://doi.org/10.1175/MWR-D-24-0060.1, 2024.
Carey, L. D. and Rutledge, S. A.: A Multiparameter Radar Case Study of the Microphysical and Kinematic Evolution of a Lightning Producing Storm, Meteorology and Atmospheric Physics, 59, 33–64, https://doi.org/10.1007/BF01032000, 1996.
Carey, L. D. and Rutledge, S. A.: The Relationship between Precipitation and Lightning in Tropical Island Convection: A C-Band Polarimetric Radar Study, Monthly Weather Review, 128, 2687–2710, https://doi.org/10.1175/1520-0493(2000)128<2687:TRBPAL>2.0.CO;2, 2000.
Chang, W., Lee, W., and Liou, Y.: The kinematic and microphysical characteristics and associated precipitation efficiency of subtropical convection during SoWMEX/TiMREX, Monthly Weather Review, 143, 317–340, https://doi.org/10.1175/MWR-D-14-00081.1, 2015.
Deierling, W. and Petersen, W. A.: Total lightning activity as an indicator of updraft characteristics, Journal of Geophysical Research: Atmospheres, 113, https://doi.org/10.1029/2007jd009598, 2008.
Deierling, W., Petersen, W. A., Latham, J., Ellis, S., and Christian, H. J.: The relationship between lightning activity and ice fluxes in thunderstorms, Journal of Geophysical Research: Atmospheres, 113, https://doi.org/10.1029/2007jd009700, 2008.
Fan, X. P., Zhang, Y. J., Zheng, D., Zhang, Y., Lyu, W. T., Liu, H. Y., and Xu, L. T.: A New Method of Three-Dimensional Location for Low-Frequency Electric Field Detection Array, Journal of Geophysical Research: Atmospheres, 123, 8792–8812, https://doi.org/10.1029/2017jd028249, 2018.
Fridlind, A. M., van Lier-Walqui, M., Collis, S., Giangrande, S. E., Jackson, R. C., Li, X., Matsui, T., Orville, R., Picel, M. H., Rosenfeld, D., Ryzhkov, A., Weitz, R., and Zhang, P.: Use of polarimetric radar measurements to constrain simulated convective cell evolution: a pilot study with Lagrangian tracking, Atmos. Meas. Tech., 12, 2979–3000, https://doi.org/10.5194/amt-12-2979-2019, 2019.
Gatlin, P. N. and Goodman, S. J.: A Total Lightning Trending Algorithm to Identify Severe Thunderstorms, Journal of Atmospheric and Oceanic Technology, 27, 3–22, https://doi.org/10.1175/2009jtecha1286.1, 2010.
Green, A. W.: An Approximation for the Shapes of Large Raindrops, Journal of Applied Meteorology and Climatology, 14, 1578–1583, https://doi.org/10.1175/1520-0450(1975)014<1578:AAFTSO>2.0.CO;2, 1975.
Goodman, S. J., Blakeslee, R., Christian, H., Koshak, W., Bailey, J., Hall, J., McCaul, E., Buechler, D., Darden, C., Burks, J., Bradshaw, T., and Gatlin, P.: The North Alabama Lightning Mapping Array: Recent severe storm observations and future prospects, Atmospheric Research, 76, 423–437, https://doi.org/10.1016/j.atmosres.2004.11.035, 2005.
Hayashi, S., Umehara, A., Nagumo, N., and Ushio, T.: The relationship between lightning flash rate and ice-related volume derived from dual-polarization radar, Atmospheric Research, 248, https://doi.org/10.1016/j.atmosres.2020.105166, 2021.
Helmus, J. J. and Collis, S. M.: The Python ARM Radar Toolkit (Py-ART), a Library for Working with Weather Radar Data in the Python Programming Language, Journal of Open Research Software, 4, https://doi.org/10.5334/jors.119, 2016.
Herzegh, P. H. and Jameson, A. R.: Observing Precipitation through Dual-Polarization Radar Measurements, Bulletin American Meteorological Society, 73, 1365–1376, https://doi.org/10.1175/1520-0477(1992)073<1365:OPTDPR>2.0.CO;2, 1992.
Homeyer, C. R. and Kumjian, M. R.: Microphysical Characteristics of Overshooting Convection from Polarimetric Radar Observations, Journal of the Atmospheric Sciences, 72, 870–891, https://doi.org/10.1175/jas-d-13-0388.1, 2015.
Hu, J. and Ryzhkov, A.: Climatology of the Vertical Profiles of Polarimetric Radar Variables and Retrieved Microphysical Parameters in Continental/Tropical MCSs and Landfalling Hurricanes, Journal of Geophysical Research: Atmospheres, 127, https://doi.org/10.1029/2021jd035498, 2022.
Hubbert, J., Bringi, V. N., Carey, L. D., and Bolen, S.: CSU-CHILL Polarimetric Radar Measurements from a Severe Hail Storm in Eastern Colorado, Journal of Applied Meteorology and Climatology, 37, 749–775, https://doi.org/10.1175/1520-0450(1998)037<0749:CCPRMF>2.0.CO;2, 1998.
Hubbert, J. C., Wilson, J. W., Weckwerth, T. M., Ellis, S. M., Dixon, M., and Loew, E.: S-Pol's Polarimetric Data Reveal Detailed Storm Features (and Insect Behavior), Bulletin of the American Meteorological Society, 99, 2045–2060, https://doi.org/10.1175/bams-d-17-0317.1, 2018.
Krause, J. and Klaus, V.: Identifying ZDR Columns in Radar Data with the Hotspot Technique, Weather and Forecasting, 39, 581–595, https://doi.org/10.1175/waf-d-23-0146.1, 2024.
Kumjian, M. R.: The Impact of Precipitation Physical Processes on the Polarimetric Radar Variables, Ph.D. Dissertation, The University of Oklahoma, Norman, OK, USA, 327 pp., https://hdl.handle.net/11244/319188 (last access: 20 October 2025), 2012.
Kumjian, M. R.: Principles and applications of dual-polarization weather radar. Part I: Description of the polarimetric radar variables, Journal of Operational Meteorology, 1, 226–242, https://doi.org/10.15191/nwajom.2013.0119, 2013a.
Kumjian, M. R.: Principles and applications of dual-polarization weather radar. Part II: Warm- and cold-season applications, Journal of Operational Meteorology, 1, 243–264, https://doi.org/10.15191/nwajom.2013.0120, 2013b.
Kumjian, M. R.: Principles and applications of dual-polarization weather radar. Part III: Artifacts, Journal of Operational Meteorology, 1, 265–274, https://doi.org/10.15191/nwajom.2013.0121, 2013c.
Kumjian, M. R., Khain, A. P., Benmoshe, N., Ilotoviz, E., Ryzhkov, A. V., and Phillips, V. T. J.: The Anatomy and Physics of ZDR Columns: Investigating a Polarimetric Radar Signature with a Spectral Bin Microphysical Model, Journal of Applied Meteorology and Climatology, 53, 1820–1843, https://doi.org/10.1175/jamc-d-13-0354.1, 2014.
Kumjian, M. R., Prat, O. P., Reimel, K. J., van Lier-Walqui, M., and Morrison, H. C.: Dual-Polarization Radar Fingerprints of Precipitation Physics: A Review, Remote Sensing, 14, 3706, https://doi.org/10.3390/rs14153706, 2022.
Lang, T. J. and Rutledge, S. A.: A Framework for the Statistical Analysis of Large Radar and Lightning Datasets: Results from STEPS 2000, Monthly Weather Review, 139, 2536–2551, https://doi.org/10.1175/mwr-d-10-05000.1, 2011.
Latham, J. and Dye, J. E.: Calculations on the electrical development of a small thunderstorm, Journal of Geophysical Research: Atmospheres, 94, 13141–13144, https://doi.org/10.1029/JD094iD11p13141, 1989.
Li, H., Moisseev, D., Luo, Y., Liu, L., Ruan, Z., Cui, L., and Bao, X.: Assessing specific differential phase (KDP)-based quantitative precipitation estimation for the record- breaking rainfall over Zhengzhou city on 20 July 2021, Hydrol. Earth Syst. Sci., 27, 1033–1046, https://doi.org/10.5194/hess-27-1033-2023, 2023.
Li, H., Yin, J., and Kumjian, M.: Z Backwards Arc: Evidence of Multi-Directional Size Sorting in the Storm Producing 201.9 mm Hourly Rainfall, Geophys. Res. Lett., 51, e2024GL109192, https://doi.org/10.1029/2024GL109192, 2024.
Li, H. Q., Wan, Q., Peng, D., Liu, X., and Xiao, H.: Multiscale analysis of a record-breaking heavy rainfall event in Guangdong, China, Atmospheric Research, 232, 104703, https://doi.org/10.1016/j.atmosres.2019.104703, 2019.
Liu, D., Li, F., Qie, X., Sun, Z., Wang, Y., Yuan, S., Sun, C., Zhu, K., Wei, L., Lyu, H., and Jiang, R.: Charge Structure and Lightning Discharge in a Thunderstorm Over the Central Tibetan Plateau, Geophysical Research Letters, 51, e2024GL109602, https://doi.org/10.1029/2024GL109602, 2024.
Liu, Z., Zheng, D., Guo, F., Zhang, Y., Zhang, Y., Wu, C., Chen, H., and Han, S.: Lightning activity and its associations with cloud structures in a rainstorm dominated by warm precipitation, Atmospheric Research, 246, https://doi.org/10.1016/j.atmosres.2020.105120, 2020.
Loney, M. L., Zrnić, D. S., Straka, J. M., and Ryzhkov, A. V.: Enhanced Polarimetric Radar Signatures above the Melting Level in a Supercell Storm, Journal of Applied Meteorology, 41, 1179–1194, https://doi.org/10.1175/1520-0450(2002)041<1179:EPRSAT>2.0.CO;2, 2002.
López, R. E. and Aubagnac, J.-P.: The lightning activity of a hailstorm as a function of changes in its microphysical characteristics inferred from polarimetric radar observations, Journal of Geophysical Research: Atmospheres, 102, 16799–16813, https://doi.org/10.1029/97JD00645, 1997.
Marshall, T. C., Rust, W. D., and Stolzenburg, M.: Electrical structure and updraft speeds in thunderstorms over the southern Great Plains, Journal of Geophysical Research: Atmospheres, 100, 1001–1015, https://doi.org/10.1029/94JD02607, 1995.
Mitzeva, R. and Saunders, C. P. R.: Thunderstorm charging: calculations of the effect of ice crystal size and graupel velocity, Journal of Atmospheric and Terrestrial Physics, 52, 241–245, https://doi.org/10.1016/0021-9169(90)90090-A, 1990.
Park, H. S., Ryzhkov, A. V., Zrnić, D. S., and Kim, K.: The Hydrometeor Classification Algorithm for the Polarimetric WSR-88D: Description and Application to an MCS, Weather and Forecasting, 24, 730–748, https://doi.org/10.1175/2008WAF2222205.1, 2009.
Pruppacher, H. R. and Klett, J. D.: Microphysics of Clouds and Precipitation, 2nd Edn., Kluwer Academic, 954 pp., https://doi.org/10.1007/978-0-306-48100-0, 1997.
Qie, X., Yu, Y., Liu, X., Guo, C., Wang, D., Watanabe, T., and Ushio, T.: Charge analysis on lightning discharges to the ground in Chinese inland plateau (close to Tibet), Ann. Geophys., 18, 1340–1348, https://doi.org/10.1007/s00585-000-1340-z, 2000.
Reynolds, S. E., Brook, M., and Gourley, M. F.: THUNDERSTORM CHARGE SEPARATION, Journal of Atmospheric Sciences, 14, 426–436, https://doi.org/10.1175/1520-0469(1957)014<0426:TCS>2.0.CO;2, 1957.
Rison, W., Thomas, R. J., Krehbiel, P. R., Hamlin, T., and Harlin, J.: A GPS-based three-dimensional lightning mapping system: Initial observations in central New Mexico, Geophysical Research Letters, 26, 3573–3576, https://doi.org/10.1029/1999GL010856, 1999.
Rosenfeld, D., Lohmann, U., Raga, G. B., O'Dowd, C. D., Kulmala, M., Fuzzi, S., Reissell, A., and Andreae, M. O.: Flood or Drought: How Do Aerosols Affect Precipitation?, Science, 321, 1309–1313, https://doi.org/10.1126/science.1160606, 2008.
Ryzhkov, A. and Zrnić, D.: Assessment of Rainfall Measurement That Uses Specific Differential Phase, Journal of Applied Meteorology and Climatology, 35, 2080–2090, https://doi.org/10.1175/1520-0450(1996)035<2080:AORMTU>2.0.CO;2, 1996.
Saunders, C.: Charge Separation Mechanisms in Clouds, Space Science Reviews, 137, 335–353, https://doi.org/10.1007/s11214-008-9345-0, 2008.
Seliga, T. A. and Bringi, V. N.: Potential Use of Radar Differential Reflectivity Measurements at Orthogonal Polarizations for Measuring Precipitation, Journal of Applied Meteorology and Climatology, 15, 69–76, https://doi.org/10.1175/1520-0450(1976)015<0069:PUORDR>2.0.CO;2, 1976.
Sharma, M., Tanamachi, R. L., Bruning, E. C., and Calhoun, K. M.: Polarimetric and Electrical Structure of the 19 May 2013 Edmond–Carney, Oklahoma, Tornadic Supercell, Monthly Weather Review, 149, 2049–2078, https://doi.org/10.1175/MWR-D-20-0280.1, 2021.
Sharma, M., Tanamachi, R. L., and Bruning, E. C.: Investigating Temporal Characteristics of Polarimetric and Electrical Signatures in Three Severe Storms: Insights from the VORTEX-Southeast Field Campaign, Monthly Weather Review, 152, 1511–1536, https://doi.org/10.1175/MWR-D-23-0144.1, 2024.
Shi, D., Zheng, D., Zhang, Y., Zhang, Y., Huang, Z., Lu, W., Chen, S., and Yan, X.: Low-frequency E-field Detection Array (LFEDA) – Construction and preliminary results. Science China Earth Sciences, 60, 1896–1908, https://doi.org/10.1007/s11430-016-9093-9, 2017.
Snyder, J. C., Ryzhkov, A. V., Kumjian, M. R., Khain, A. P., and Picca, J.: A ZDR Column Detection Algorithm to Examine Convective Storm Updrafts, Weather and Forecasting, 30, 1819–1844, https://doi.org/10.1175/WAF-D-15-0068.1, 2015.
Snyder, J. C., Bluestein, H. B., Dawson II, D. T., and Jung, Y.: Simulations of Polarimetric, X-Band Radar Signatures in Supercells. Part I: Description of Experiment and Simulated ρhv Rings, Journal of Applied Meteorology and Climatology, 56, 1977–1999, https://doi.org/10.1175/JAMC-D-16-0138.1, 2017.
Souza, J. C. S. and Bruning, E. C.: Assessment of Turbulence Intensity in Different Spots of Lightning Flash Propagation, Geophysical Research Letters, 48, e2021GL095923, https://doi.org/10.1029/2021GL095923, 2021.
Straka, J. M., Zrnić, D. S., and Ryzhkov, A. V.: Bulk Hydrometeor Classification and Quantification Using Polarimetric Radar Data: Synthesis of Relations, Journal of Applied Meteorology and Climatology, 39, 1341–1372, https://doi.org/10.1175/1520-0450(2000)039<1341:BHCAQU>2.0.CO;2, 2000.
Takahashi, T.: Riming Electrification as a Charge Generation Mechanism in Thunderstorms, Journal of Atmospheric Sciences, 35, 1536–1548, https://doi.org/10.1175/1520-0469(1978)035<1536:REAACG>2.0.CO;2, 1978.
Tuttle, J. D., Bringi, V. N., Orville, H. D., and Kopp, F. J.: Multiparameter Radar Study of a Microburst: Comparison with Model Results, Journal of Atmospheric Sciences, 46, 601–620, https://doi.org/10.1175/1520-0469(1989)046<0601:MRSOAM>2.0.CO;2, 1989.
van Lier-Walqui, M., Fridlind, A. M., Ackerman, A. S., Collis, S., Helmus, J., MacGorman, D. R., North, K., Kollias, P., and Posselt, D. J.: On Polarimetric Radar Signatures of Deep Convection for Model Evaluation: Columns of Specific Differential Phase Observed during MC3E, Monthly Weather Review, 144, 737–758, https://doi.org/10.1175/MWR-D-15-0100.1, 2016.
Williams, E., Boldi, B., Matlin, A., Weber, M., Hodanish, S., Sharp, D., Goodman, S., Raghavan, R., and Buechler, D.: The behavior of total lightning activity in severe Florida thunderstorms, Atmospheric Research, 51, 245–265, https://doi.org/10.1016/S0169-8095(99)00011-3, 1999.
Williams, E. R., Weber, M. E., and Orville, R. E.: The relationship between lightning type and convective state of thunderclouds, Journal of Geophysical Research: Atmospheres, 94, 13213–13220, https://doi.org/10.1029/JD094iD11p13213, 1989.
Woodard, C. J., Carey, L. D., Petersen, W. A., and Roeder, W. P.: Operational utility of dual-polarization variables in lightning initiation forecasting, Electronic J. Operational Meteor., 13, 79–102, 2012.
Yan, M., Guo, C., and Ge, Z.: Numerical study of cloud dynamic-electrification in an axisymmetric, time-dependent cloud model. I: Theory and model, Acta Geophysica Sinica, 39, 52–64, 1996a.
Yan, M., Guo, C., and Ge, Z.: Numerical study of cloud dynamic-electrification in an axisymmetric, time-dependent cloud model. II: Calculation results. Acta Geophysica Sinica, 39, 65–77, 1996b.
Zhang, Y., Sun, A., Yan, M., Guo, F., Qie, X., and Huang, M.: Numerical modeling for effects of electric activity during thunderstorms upon the growth of hail particles, Chinese Journal of Geophysics, 47, 25–32, 2004a.
Zhang, Y., Dong, W., Zhao, Y., Zhang, G., Zhang, H., Chen, C., and Zhang, T.: Study of charge structure and radiation characteristic of intracloud discharge in thunderstorms of Qinghai-Tibet Plateau, Science in China Series D: Earth Sciences, 47, 108–114, https://doi.org/10.1007/BF02880986, 2004b.
Zhang, Y., Yan, M., Sun, A., and Guo, F.: Thunderstorm Electricity, China Meteorology Press, Beijing, 384 pp., ISBN 9787502947682, 2009.
Zhao, C.: Data for “Bridging the polarimetric structure and lightning activity of isolated thunderstorm cells during the cloud life cycle”, Figshare [data set], https://doi.org/10.6084/m9.figshare.28070105.v3, 2024.
Zhao, C., Zhang, Y., Zheng, D., Zhou, Y., Xiao, H., and Zhang, X.: An improved hydrometeor identification method for X-band dual-polarization radar and its application for one summer Hailstorm over Northern China, Atmospheric Research, 245, 105075, https://doi.org/10.1016/j.atmosres.2020.105075, 2020.
Zhao, C., Zheng, D., Zhang, Y., Liu, X., Zhang, Y., Yao, W., and Zhang, W.: Turbulence Characteristics of Thunderstorms Before the First Flash in Comparison to Non-Thunderstorms, Geophysical Research Letters, 48, e2021GL094821, https://doi.org/10.1029/2021GL094821, 2021a.
Zhao, C., Zheng, D., Zhang, Y. J., Liu, X., Zhang, Y., Yao, W., and Zhang, W.: Characteristics of cloud microphysics at positions with flash initiations and channels in convection and stratiform areas of two squall lines, Journal of Tropical Meteorology, 37, 358–369, https://doi.org/10.16032/j.issn.1004-4965.2021.035, 2021b.
Zhao, C., Zhang, Y., Zheng, D., Liu, X., Zhang, Y., Fan, X., Yao, W., and Zhang, W.: Using Polarimetric Radar Observations to Characterize First Echoes of Thunderstorms and Nonthunderstorms: A Comparative Study, Journal of Geophysical Research: Atmospheres, 127, e2022JD036671, https://doi.org/10.1029/2022JD036671, 2022.
Zhao, C., Zhang, Y., Zheng, D., Li, H., Du, S., Peng, X., Liu, X., Zhao, P., Zheng, J., and Shi, J.: Technical note: On the ice microphysics of isolated thunderstorms and non-thunderstorms in southern China – a radar polarimetric perspective, Atmos. Chem. Phys., 24, 11637–11651, https://doi.org/10.5194/acp-24-11637-2024, 2024.
Zheng, D. and Zhang, Y.: New Insights Into the Correlation Between Lightning Flash Rate and Size in Thunderstorms, Geophysical Research Letters, 48, e2021GL096085, https://doi.org/10.1029/2021GL096085, 2021.
Zrnić, D. S.: Three-body scattering produces precipitation signature of special diagnostic value, Radio Science, 22, 76–86, https://doi.org/10.1029/RS022i001p00076, 1987.
Zrnić, D. S.: Complete Polarimetric and Doppler Measurements with a Single Receiver Radar, Journal of Atmospheric and Oceanic Technology, 8, 159–165, https://doi.org/10.1175/1520-0426(1991)008<0159:CPADMW>2.0.CO;2, 1991.