the Creative Commons Attribution 4.0 License.
the Creative Commons Attribution 4.0 License.
 | 01 Oct 2025
Retention during freezing of raindrops – Part 1: Investigation of single and binary mixtures of nitric, formic, and acetic acids and 2-nitrophenol
Alexander Theis
Jackson Seymore
Moritz Hey
Stephan Borrmann
Karoline Diehl
Subir K. Mitra
The influence of freezing processes and vertical transport of trace gases into the upper atmosphere during deep convection is critical to understanding the distribution of aerosol precursors and their climate effects. We conducted experimental studies inside a walk-in cold room for freely levitating raindrops (drop diameter: 2 mm) using an acoustic levitator apparatus. We investigated the effect of freezing raindrops on the retention of organic species for the first time with silver iodide as the ice-nucleating agent. Quantitative chemical analysis determined the retention coefficient, which is defined as the fraction of a chemical species remaining in the ice phase compared to their initial liquid-phase concentrations. We measured the retention coefficients of nitric acid, formic acid, acetic acid, and 2-nitrophenol as single components. Furthermore, we determined the retention coefficients of these substances as binary mixtures. Our results show the dominance of physical aspects such as drop size and ice shell formation over their chemical counterparts with regard to overall retention for the investigated large drops. Thus, for rain-sized drops, almost everything is fully retained during the freezing process, i.e., retention coefficients close to 1, even for species with low effective Henry's law constants (). An ice shell is formed within 4.8 ms around the drops just after the freezing is initiated. This ice shell formation was found to be the controlling factor for the overall retention of the investigated species, which inhibited any further expulsion of dissolved substances from the drop.
- Article
(2851 KB) - Full-text XML
- Companion paper
-
Supplement
(421 KB) - BibTeX
- EndNote


The Earth's atmosphere consists of a diverse range of chemical constituents, from ever-present gases such as nitrogen, oxygen, carbon dioxide, and ozone to a wide range of chemicals in trace amounts. Biogenic and anthropogenic source contributors are known to be important for understanding the role that trace constituents play in the atmosphere over long timescales (Kolb et al., 2010; Andreae, 2019). However, vertical redistribution can be just as critical (Martini et al., 2011; Ervens, 2015; Wang et al., 2016). During convective transport, there is a rapid redistribution of trace gases and aerosols from the boundary layer and troposphere that can alter the overall concentration of the chemical constituents (Warneck, 1999; Corti et al., 2008; Ervens, 2015).
Organic aerosol mass is usually underestimated in the boundary layer and beyond (Carlton et al., 2009; Hodzic et al., 2020). As a consequence, the potential impact of aerosols on the global radiation budget, radiative forcing, and overall climate can be misrepresented (Lohmann and Feichter, 2005; Tsigaridis et al., 2014; Shrivastava et al., 2017; Sporre et al., 2020). Williamson et al. (2019) also reported that there is an under-representation of total organic mass due to low estimations for new particle formation, particularly in tropical convective regions.
During vertical transport in deep convective systems, there is a phase change of the water droplets as they undergo cooling and subsequent freezing at lower temperature regimes higher up in the atmosphere. Trace gases dissolved in these droplets could be either retained, revolatized, or scavenged during the freezing process (Pruppacher and Klett, 2010). The fraction of chemical species remaining inside the frozen hydrometeor compared to their initial concentration in the liquid phase before freezing results in the so-called retention coefficient. Substances that are completely retained after freezing will have a retention coefficient of 1. Modeling studies concerning convective transport and redistribution of trace gases have stressed the importance of experimentally determined retention coefficients (Mari et al., 2000; Barth et al., 2001, 2007; Tost et al., 2010; Long et al., 2010; Bela et al., 2016; Cuchiara et al., 2020; Ryu and Min, 2022; Cuchiara et al., 2023). However, there are few such experimental databases in this regard.
Previous studies on experimentally determining retention coefficients in the context of riming of supercooled droplets of single substances help bridge the uncertainty gap and provide a backbone for effective parameterization for modeling frameworks (Iribarne et al., 1983; Lamb and Blumenstein, 1987; Iribarne et al., 1990; Snider et al., 1992; Snider and Huang, 1998; von Blohn et al., 2011, 2013; Jost et al., 2017; Borchers et al., 2024). The term “riming retention” will be used to refer to these abovementioned studies collectively. The following substances were studied for retention during riming of supercooled droplets: SO2, H2O2, O2, HNO3, HCl, NH4, formic acid, acetic acid, malonic acid, oxalic acid, formaldehyde, α-pinene oxidation derivatives, and nitro-aromatic compounds. These experimental studies revealed dependencies of the retention of trace gases on both chemical and physical properties. There is an established correlation with the effective Henry's law coefficient (H*) and a retention indicator (RI) parameter, which relates experimentally derived retention coefficients to model-derived values (Stuart and Jacobson, 2003, 2004). H* shows the dependence on the solubility and dissociative properties of trace gases, whereas RI provides a ratio of expulsion timescales to freezing timescales. A freezing time significantly lower than the solute expulsion time would result in a chemical substance being retained. These expulsion timescales are described in Schwartz (1986), taking into account the aqueous, interfacial, and gaseous mass transfer rates and the aqueous-phase kinetics, as explained in Jost et al. (2017). In addition to these chemical properties, physical properties such as drop size, ventilation around the drop, temperature, and liquid-water content are the major contributing factors affecting retention (Jost et al., 2017; Jost, 2017). All of the abovementioned experimental studies concerning riming retention were mostly related to cloud droplets (i.e., diameters in the µm size range) for which the chemical properties were determined to be the dominant factors. The present study focuses on large raindrops (diameters in the mm size range), which have not been experimentally investigated thus far. A significant difference from a physical perspective in terms of the retention of trace gases for cloud droplets and raindrops is the freezing mechanism. For riming experiments involving cloud droplets, freezing is initiated upon contact with a frozen substrate, whereas, for raindrops investigated in the present study, immersion freezing was the main mechanism. The geometry of the droplets upon contact also changes, leading to spreading of the droplets under ventilated conditions in the riming-retention experiments. This change in geometry influences the heat transfer into the ice as it freezes (Jost et al., 2017). Moreover, the surface-to-volume ratio for cloud droplets is about 3 orders of magnitude higher as compared to that for raindrops. This higher surface-to-volume ratio facilitates a faster mass expulsion time for cloud droplets. Freezing of raindrops is especially important for the case of convective clouds with warm bases, where collision and coalescence can produce such large millimeter-sized drops, which can be further transported into the upper troposphere during deep convection. Henceforth, the term “freezing retention” will be used to refer to the present study, investigating retention during the freezing of raindrops.
The motivation for this study was to investigate and understand the retention of chemical species dissolved in larger drops and thereby to augment experimental databases to further enhance modeling frameworks. To visualize our experimental outlook, we selected four chemical substances, namely 2-nitrophenol, acetic acid, formic acid, and nitric acid, with increasing H* values of 3.50×10³, 1.28×10⁵, 8.31×10⁵, and 7.56×10¹¹, respectively, at 0 °C and at a pH of about 4 for all. These substances are commonly found in the atmosphere, and their previously measured retention coefficient values in riming cloud droplets lie between 0 to 1 and scale with H*. In addition to investigating these four substances as single components, we also studied their potential interactions as binary mixtures. Binary mixtures were studied to improve our understanding of the retention process with regard to how the differential incorporation or segregation of two substances during freezing might affect their overall retention.
2.1 Experimental setup
In this study, we used the Mainz acoustic levitator (M-AL) setup (Fig. 1), placed inside a walk-in cold room. The M-AL employs an ultrasonic wave source (58 kHz) and a metal reflector to produce a standing wave. Water drops can be injected with a syringe and levitated contact-free at the intersection of the incident and reflected waves (i.e., at the nodes of the standing wave). The diameters of the levitated water drops used in this study were 2.0±0.1 mm. The M-AL is enclosed inside a Plexiglas housing to minimize any external interference to the standing wave. More details about the M-AL can be found in Diehl et al. (2014) and Szakáll et al. (2021).
In addition to the ultrasonic source, an infrared thermometer (KT 19.82 II, Heitronics) was used to measure the surface temperature of the levitated drops, and a USB camera (USB-103H, PHYTEC GmbH, Germany) was used to record the drop size information. The top-left section of the schematic (Fig. 1) shows the placement of the video camera, which had a wide video graphics array of 752×480 pixels and a minimum pixel size of 6×6 µm. The infrared thermometer can be seen in the bottom-right section of the schematic. A small heating element was incorporated into the infrared thermometer to maintain its internal components when it was operated at temperatures lower than −15 °C. Both the video camera and the infrared thermometer were placed on adjustable stands, which allowed for vertical and horizontal adjustments. In addition to the infrared thermometer, another temperature sensor (PT-100) was placed inside the Plexiglas housing to monitor the thermal stability of the setup during the experiments.
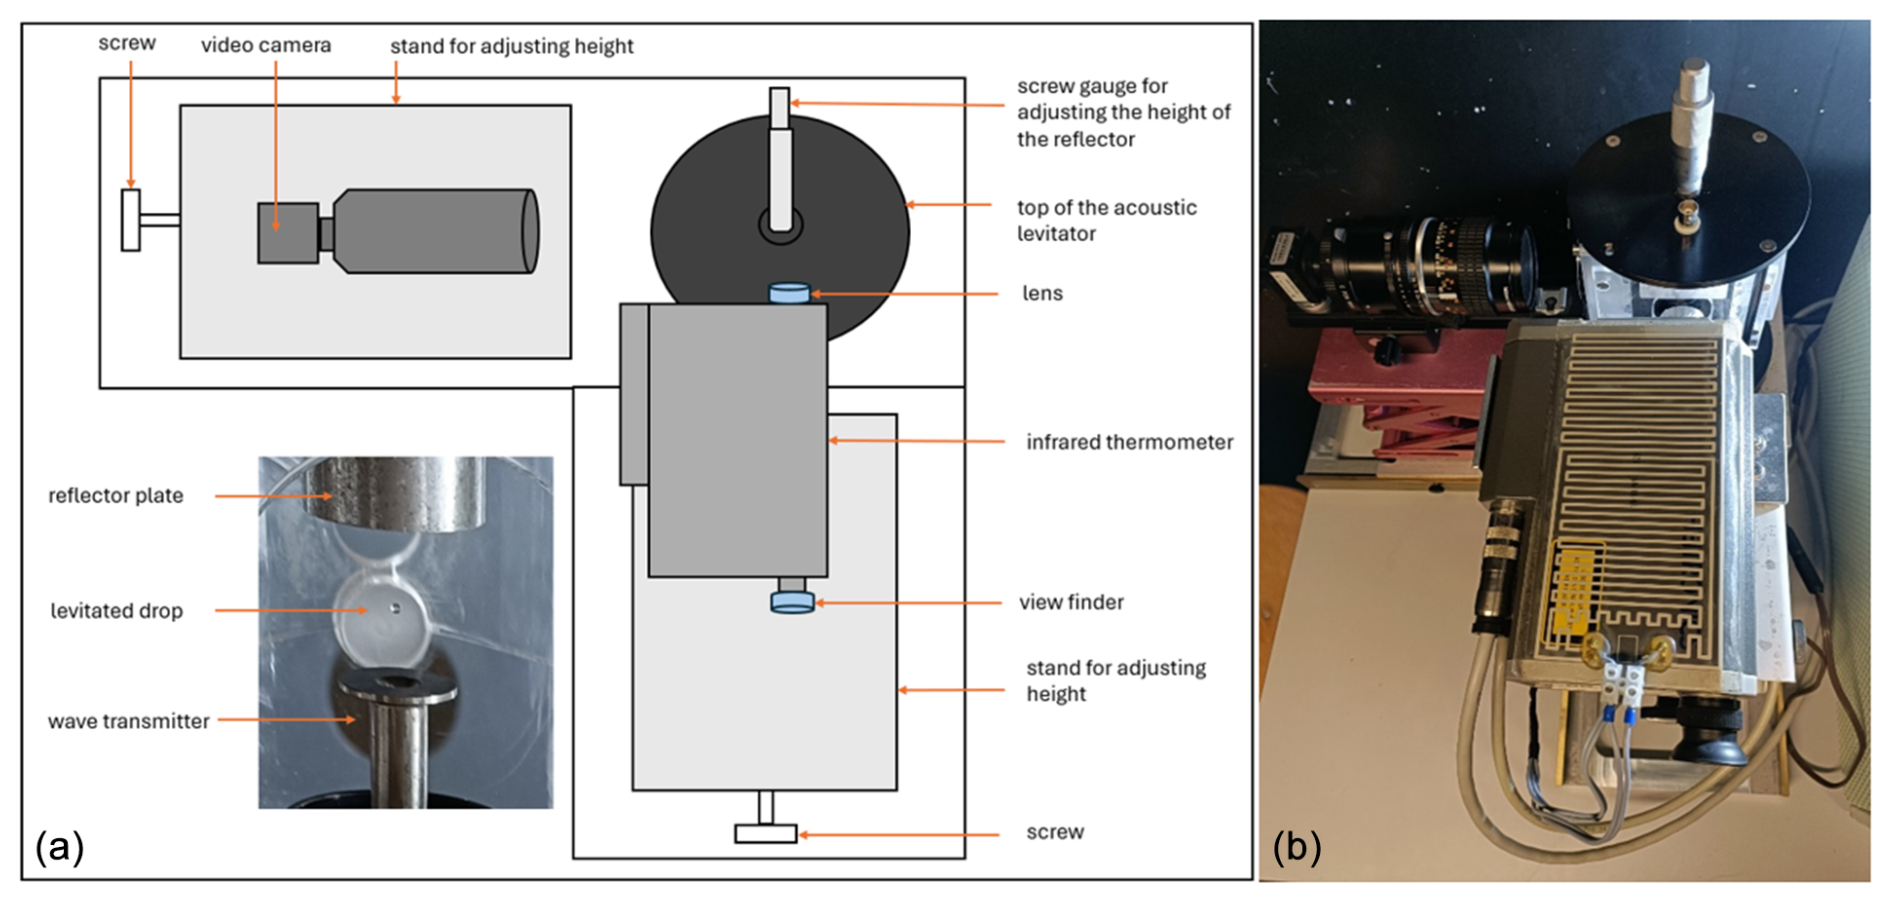
Figure 1The Mainz acoustic levitator (M-AL) setup. (a) A schematic of the setup. (b) Setup in situ.
The retention experiments were carried out inside the walk-in cold room of the laboratory at temperatures between −15 and −28 °C. Silver iodide (AgI; Sigma Aldrich, 99 %) was used as the ice-nucleating particle (INP) to initiate the freezing process. We first characterized the INP at three different concentrations (0.2, 0.01, and 0.0003 g L−1) at three different cold-room temperatures (−15, −20, and −28 °C). This provided the freezing curves of silver iodide at various temperatures and concentrations (Fig. A2 in the Appendix); more details can be found in Appendix A. These steps were a pre-requisite for retention experiments to infer the correct drop-freezing temperature ranges during our measurements.
2.2 Sampling procedure
In total, the retentions of four single components and three binary mixtures were investigated. Nitric acid, formic acid, acetic acid, and 2-nitrophenol were measured as single components. Two sets of combinations were studied for the binary mixture of a strong and a weak acid, namely nitric acid and acetic acid (mixture A1) and nitric acid and formic acid (mixture A2). Another set of binary mixtures was the combination of a small and a large molecule due to their differences in terms of molecular size and mobility. Here, we investigated the mixture of formic acid and 2-nitrophenol (mixture B). The substances, along with their purity labels, are listed in Table 1.
Table 1Substances and mixtures investigated in this study.
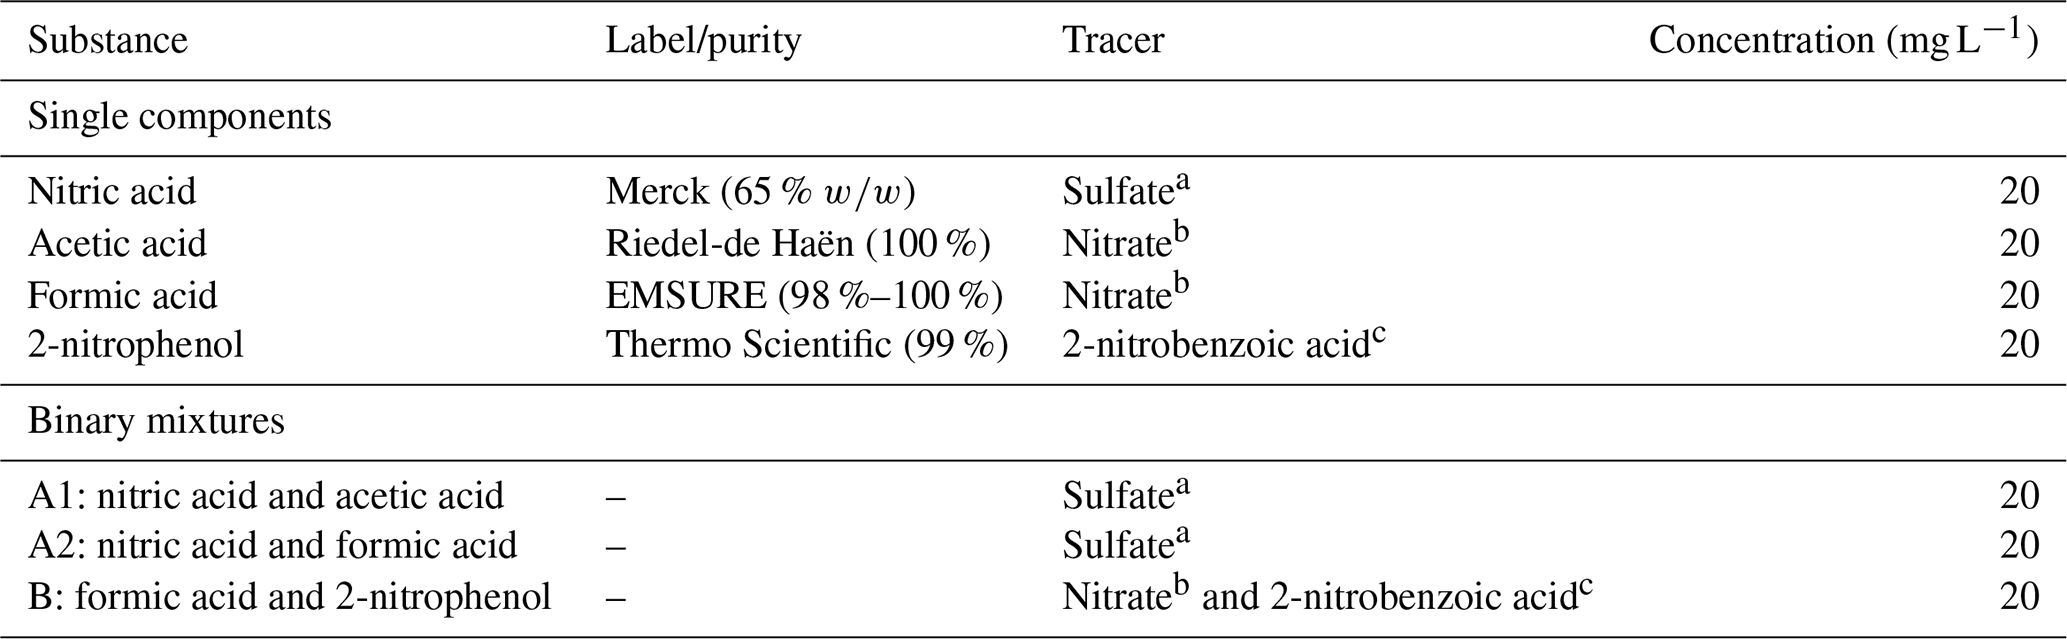
a Sulfate standard (SO4): TraceCERT (99 %); b nitrate standard (NO3): TraceCERT (99 %); c 2-nitrobenzoic acid: Thermo Scientific (95 %). Hydrochloric acid (HCl) (Carl Roth, 37 % ) and sodium hydroxide (NaOH) (Merck, 99 %) were used to adjust the pH in the sensitivity studies. The label or purity of the substances in binary mixtures is the same as that of the single components.
Aqueous solutions of the investigated substances were prepared at an initial concentration of about 20 mg L−1. A typical mixing ratio of dissolved gases in the atmosphere lies in the range of ppb to tens of ppm (on a mass basis). This higher concentration of 20 mg L−1 helped us maintain proper detection levels during our quantitative analysis. A high initial concentration of 20 mg L−1 would also imply that the internal partial pressures of any dissolved substances were high enough to overcome the internal resistances inside the liquid drop. Higher concentrations used in our experiments served as the upper limit for minimum possible retention of the dissolved substances. Additionally, a high solute concentration could decrease the freezing rate (Pruppacher, 1967). For 20 mg L−1, the effect of dissolved substances influencing the freezing process could be considered to be negligible as compared to that for pure water. In terms of molar concentration, 20 mg L−1 corresponds to mol L−1 for formic acid – which has the lowest molar mass among the investigated species – and is about 2 orders of magnitude lower to significantly affect the freezing process (Pruppacher, 1967).
The prepared solutions were transferred to a syringe to inject a single drop into the M-AL. For each experiment, 11 measurement points were recorded. Each measurement point consisted of a total of 10 frozen drops collected in a vial. The volume of one frozen drop was approximately 4.2 µL, which makes the total volume for one measurement point about 42 µL. These frozen drops were diluted 10 times in order to increase the injection volume for chemical analysis and were filtered with a 2 µm pore size filter (Carl Roth GmbH).
Subsequent quantitative analysis was done using a Dionex ICS-1000 anion ion chromatography unit (IonPac AS9-HC column, 9 µm particle size, 4×250 mm dimension, Thermo Fisher Scientific Inc.) for nitric, formic, and acetic acid. 2-nitrophenol and 2-nitrobenzoic acid were analyzed with a high-performance liquid chromatography (HPLC) unit (Hypersil GOLD column, 9 µm particle size, 150×2.1 mm dimension, Vanquish, Thermo Fisher Scientific Inc.).
For each of the investigated substances, a concentration tracking tracer was added in order to track changes in mass concentration during the quantitative analyses. A tracer is a known chemical substance that is completely retained in ice; i.e., it has a retention coefficient of 1. The tracers used in this study were nitrate, sulfate, and 2-nitrobenzoic acid, which had a known retention of 1 based on previous riming-retention studies (von Blohn et al., 2011; Borchers et al., 2024).
2.3 Calculation of retention coefficient
The retention during freezing was quantified by the retention coefficient R. This is the fraction of the chemical species that remains inside the frozen drops in the ice phase and the original solution in the liquid phase. The mathematical expression for calculating the initial retained fraction is given by
In Eq. (1), the square brackets indicate the concentration of the investigated chemical species and the tracers, and Ri is the retention coefficient without any correction for desorption. The numerator is the ratio of the ice-phase concentration of the measured species with their specific tracer, whereas the denominator is the ratio of liquid-phase concentrations.
Correction for desorption
The freezing of the levitated drops is not an instantaneous process when injected into the acoustic trap. The drop is initially at a temperature higher than 0 °C. It then undergoes gradual supercooling until the freezing is initiated (Fig. A1). During this stage, starting from the injection of the drop into the acoustic field of the levitator and following with its subsequent progression to the supercooling stage, the drop is exposed to external and internal forces until it is in equilibrium with its surroundings. Effects from the acoustic field potentially enhance ventilation, while thermal stabilization can produce evaporation and desorption, leading to changes in aqueous concentration in the supercooled state. To account for all of these effects, a correction parameter, called the desorption correction parameter D, was introduced:
To determine D, experiments were conducted under similar conditions as the retention experiments, with the exception of not adding any INPs. In this case, the freezing process was not initiated, and the liquid drop remained at a supercooled stage for a longer time. The drop was kept suspended for about 15 to 20 s, which is a typical time for the onset of freezing of the levitated drops under these experimental conditions (Fig. A1). Afterwards, the supercooled drops were instantly frozen inside a liquid-nitrogen bath, which has a temperature of about −197 °C (Scott, 1976; Jost et al., 2017). At such cold temperatures, all substances inside the drops are retained during freezing. Quantitative analysis of these drops provided us with the concentration of the chemical substances in their supercooled stage and allowed for the characterization of the desorption process.
The final retention coefficients R of the investigated chemical substances were calculated as follows:
Colder temperatures essentially slow down the reaction kinetics in order for desorption to be effective (Mitra and Hannemann, 1993; Seinfeld and Pandis, 2016). For experimental temperatures below −15 °C, desorption would play a negligible role. We applied the desorption corrections measured at −15 °C for substances measured at lower temperatures as well. The experimental data for retention coefficients of the investigated species and their desorption can be accessed at Gautam (2024).
2.4 Sensitivity studies
Retention experiments with the investigated substances were also carried out at different pH levels and temperatures. The pH sensitivity of the single components and the binary mixtures were studied at pH values of 3, 4, and 6–7. Hydrochloric acid (HCl) was used to lower the pH of the original solution, and sodium hydroxide (NaOH) was used to increase the pH of the solution. The temperature sensitivity studies were performed at and °C drop-freezing temperatures. These two different temperature ranges were evaluated from the temperature graph (more details in Appendix A2). From the temperature profile obtained for experiments conducted at −15 °C cold-room temperature and 0.2 g L−1 AgI, the median drop-freezing temperature was found to be under these experimental conditions (Fig. A2). Similarly, retention experiments were conducted at −23 °C cold-room temperatures and at an AgI concentration of 0.008±0.001 g L−1 as the second experimental condition. The median drop-freezing temperature for this second set of experimental conditions was obtained by extrapolating the temperature graph obtained at −20 °C cold-room temperature and 0.1 g L−1 AgI (Fig. A2) as the drop surface temperature cooling rates at −20 and −23 °C were practically identical (0.4 °C s−1). The median drop-freezing temperature for −23 °C cold-room temperature was found to be °C. The two temperature ranges were selected to compare the temperature sensitivity in earlier experiments concerning retention coefficients for cloud droplets (von Blohn et al., 2011, 2013; Jost et al., 2017; Borchers et al., 2024). The average size of the droplets was 21.5±8.5 µm in the abovementioned studies involving riming retention. In the present freezing-retention study with large levitated drops, the average drop sizes were 2.0±0.1 mm.
3.1 Retention coefficient
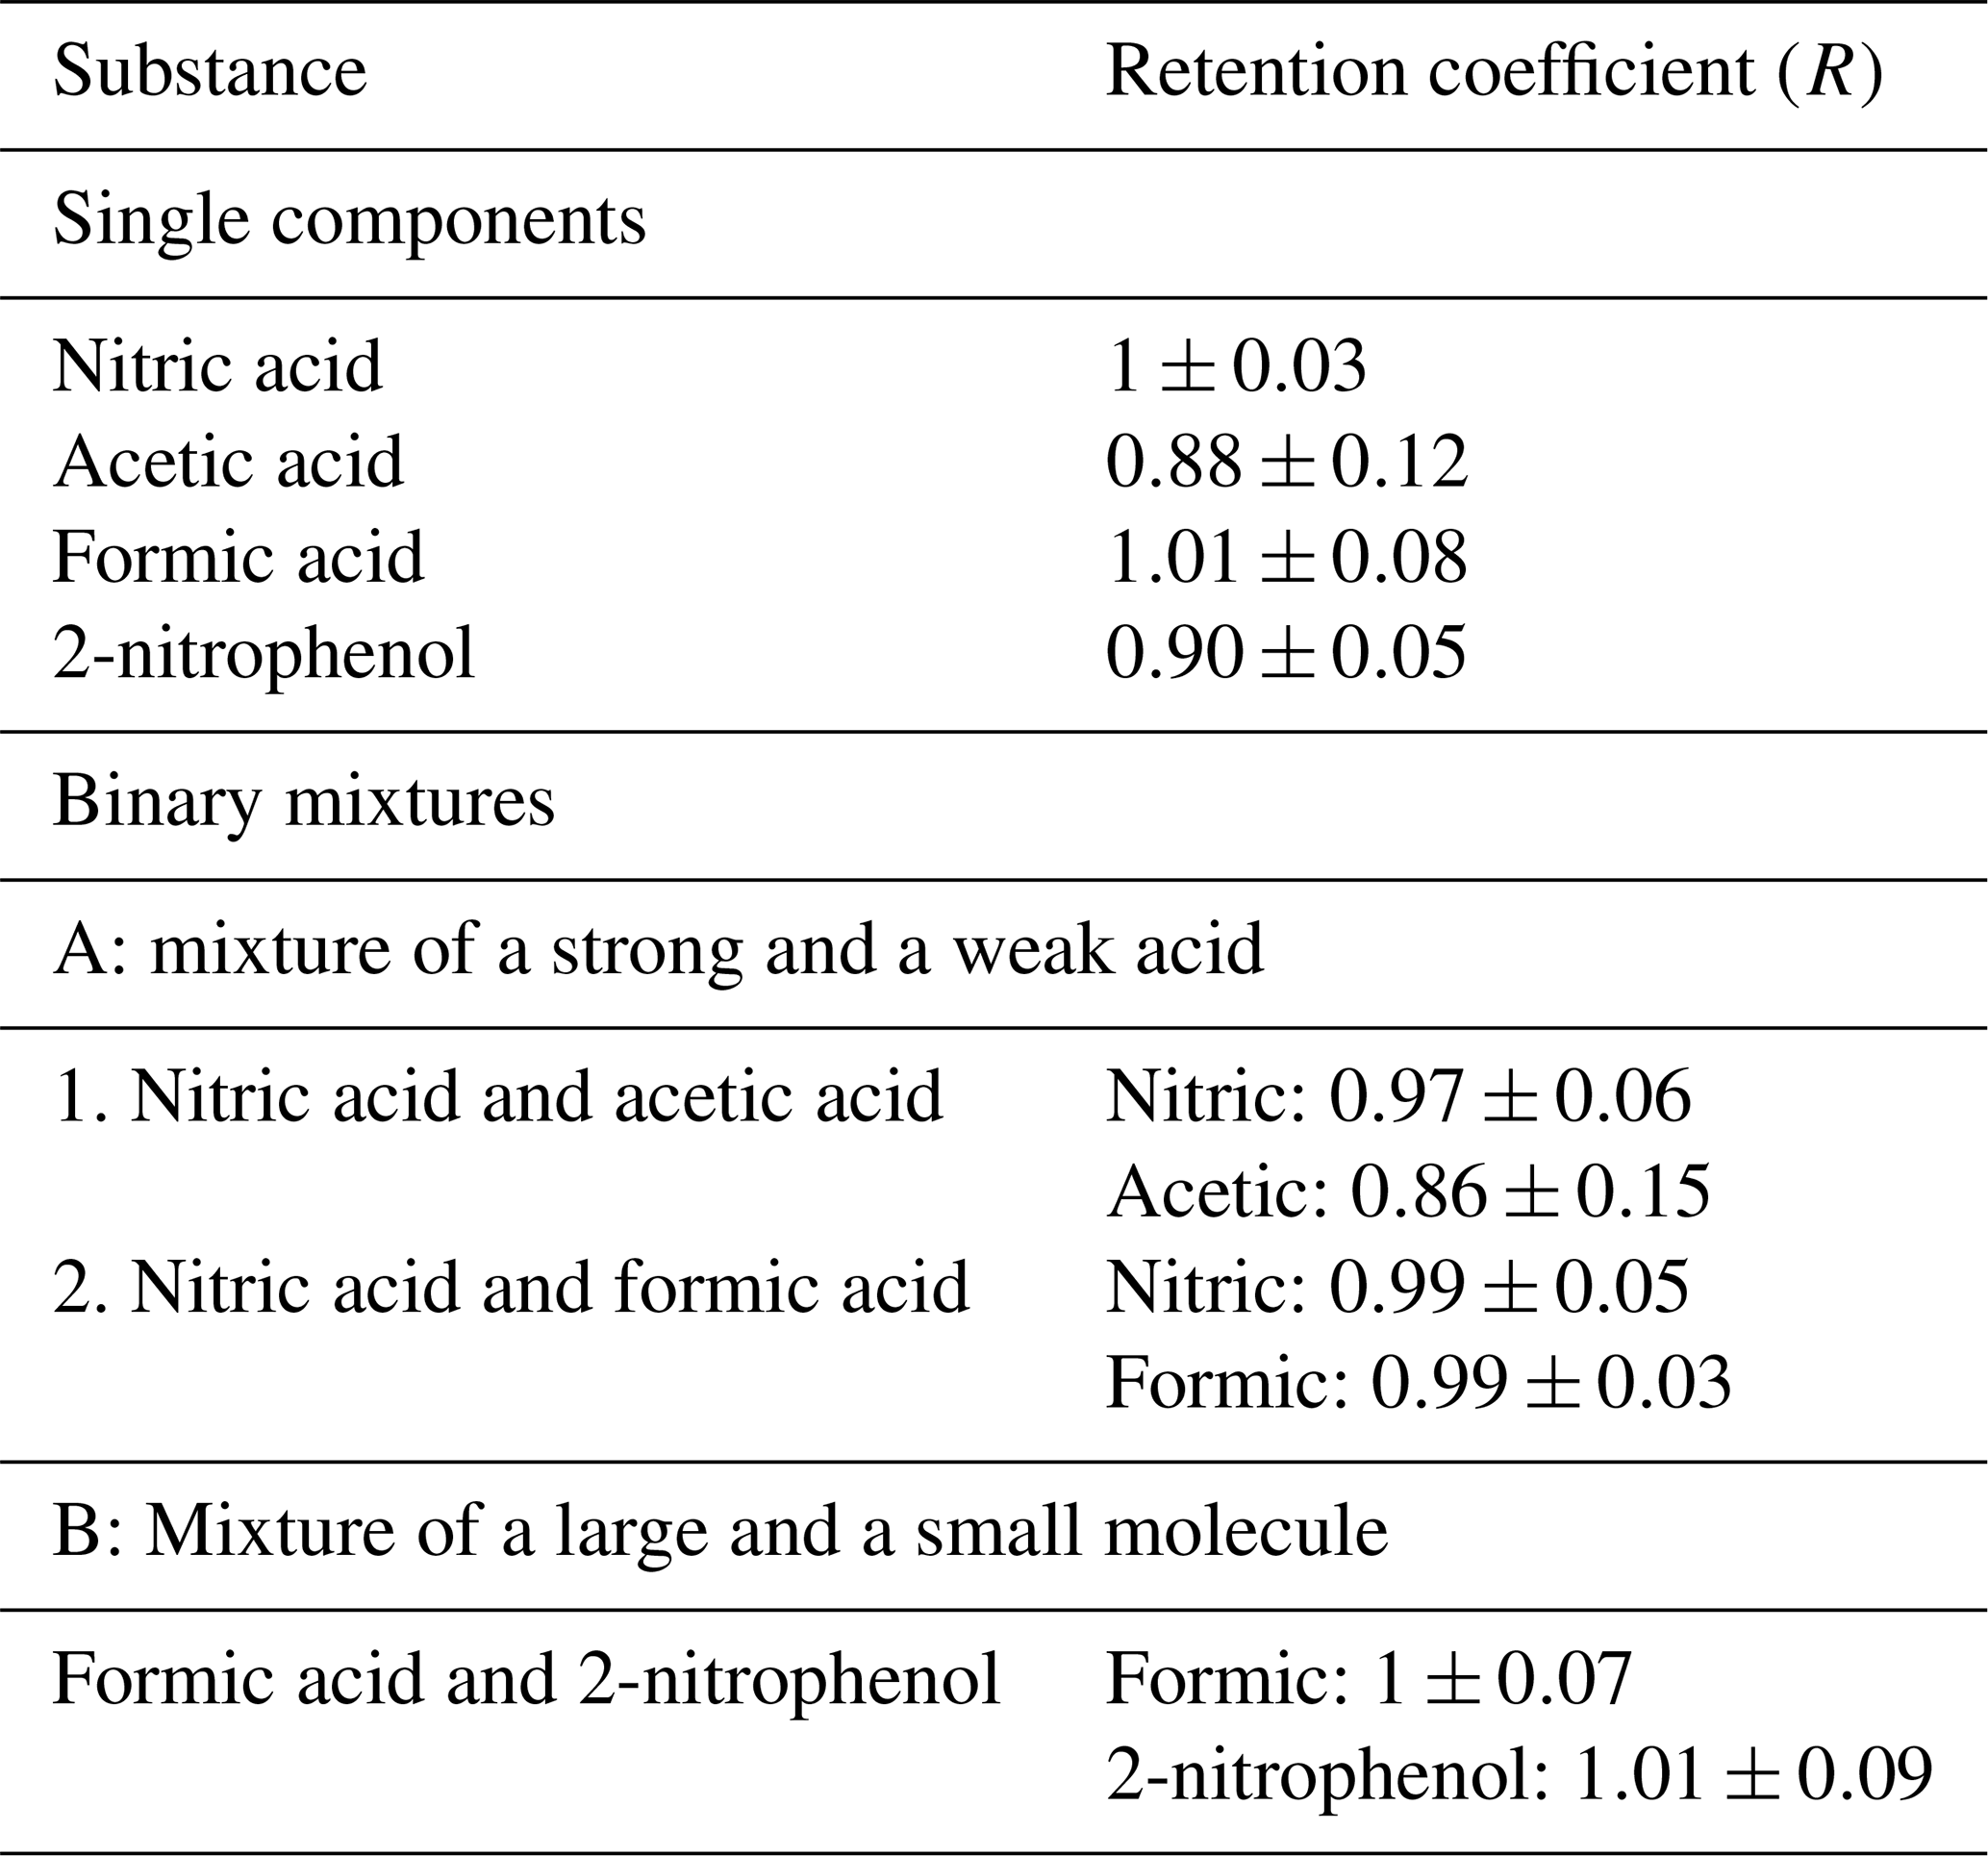
The final retention coefficients for single components and binary mixtures are shown in Table 2. It can be seen that most of the substances measured as single components were completely retained in the ice phase. The exceptions were acetic acid and 2-nitrophenol, which were found to have retention coefficients of 0.88 and 0.90, respectively. However, for acetic acid as a single component, the standard deviation was much larger (±0.12) compared to the other single-component substances. Thus, acetic acid could also be completely retained during freezing. The standard deviation of 2-nitrophenol was smaller compared to that of acetic acid, and it was the least retained substance (0.85 to 0.95) of the investigated single components.
Table 2Retention coefficients at drop-freezing temperature of °C and at pH values of about 4 for all of the investigated substances. The corresponding walk-in cold-room temperature (ambient temperature) was °C.
Brand (2014) studied the retention of formic, acetic, oxalic, and malonic acids, with large drops (2.67 and 7.25 mm spherical equivalent diameter) being frozen on a Teflon coated pallet, and also reported high retention coefficients (close to 1). For example, for drop sizes of 2.67 mm (i.e., 10 µL drop volume), formic acid showed a retention coefficient of 0.94±0.04. However, in our study, contact-free immersion freezing was employed, representing a more realistic scenario to initiate freezing as compared to Brand (2014). Nevertheless, the measured retention coefficients in the present freezing-retention study and in Brand (2014) indicate near-complete retention for the large rain-sized drops.
Comparing our present results from freezing-retention experiments with previous riming-retention studies (von Blohn et al., 2011, 2013; Jost et al., 2017; Borchers et al., 2024), one can observe a deviation from their findings. Retention coefficients measured for cloud droplets during riming-retention experiments show a sigmoidal dependency on the solubility and dissociative properties of the individual substances (i.e., their effective Henry's law constant H*). Our present experiments do not reveal these observed dependencies for the large rain-sized drops. For instance, 2-nitrophenol (as a single component in Table 2), having the lowest H* among the investigated substances, was highly retained inside a freezing raindrop, as indicated by a retention coefficient of 0.9. However, in the case of riming retention, 2-nitrophenol showed a retention coefficient of 0.12 at pH 4 and of 0.27 at pH 5.6 (Borchers et al., 2024). Further discussion comparing the results from riming retention of cloud droplets and from freezing retention of raindrops in this study is provided in Sect. 3.4.
In the binary-mixture experiments, in which we combined a strong and a weak acid (A1 and A2 in Table 2), nitric acid was the stronger acid, with a pKa value of −1.3 (Haynes, 2016). Acetic acid and formic acid, having pKa values of 4.76 and 3.77, respectively, were the weaker acids compared to nitric acid. The results shown in Table 2 indicate that binary mixtures do not seem to alter the retention coefficients of their individual species for the combination of a strong and a weak acid.
Mixture B had the combination of a small and a large compound. There, the average retention coefficient of 2-nitrophenol in a mixture with formic acid was observed to have increased slightly as compared to its retention as a single component. As a binary mixture component, both 2-nitrophenol and formic acid are completely retained during freezing.
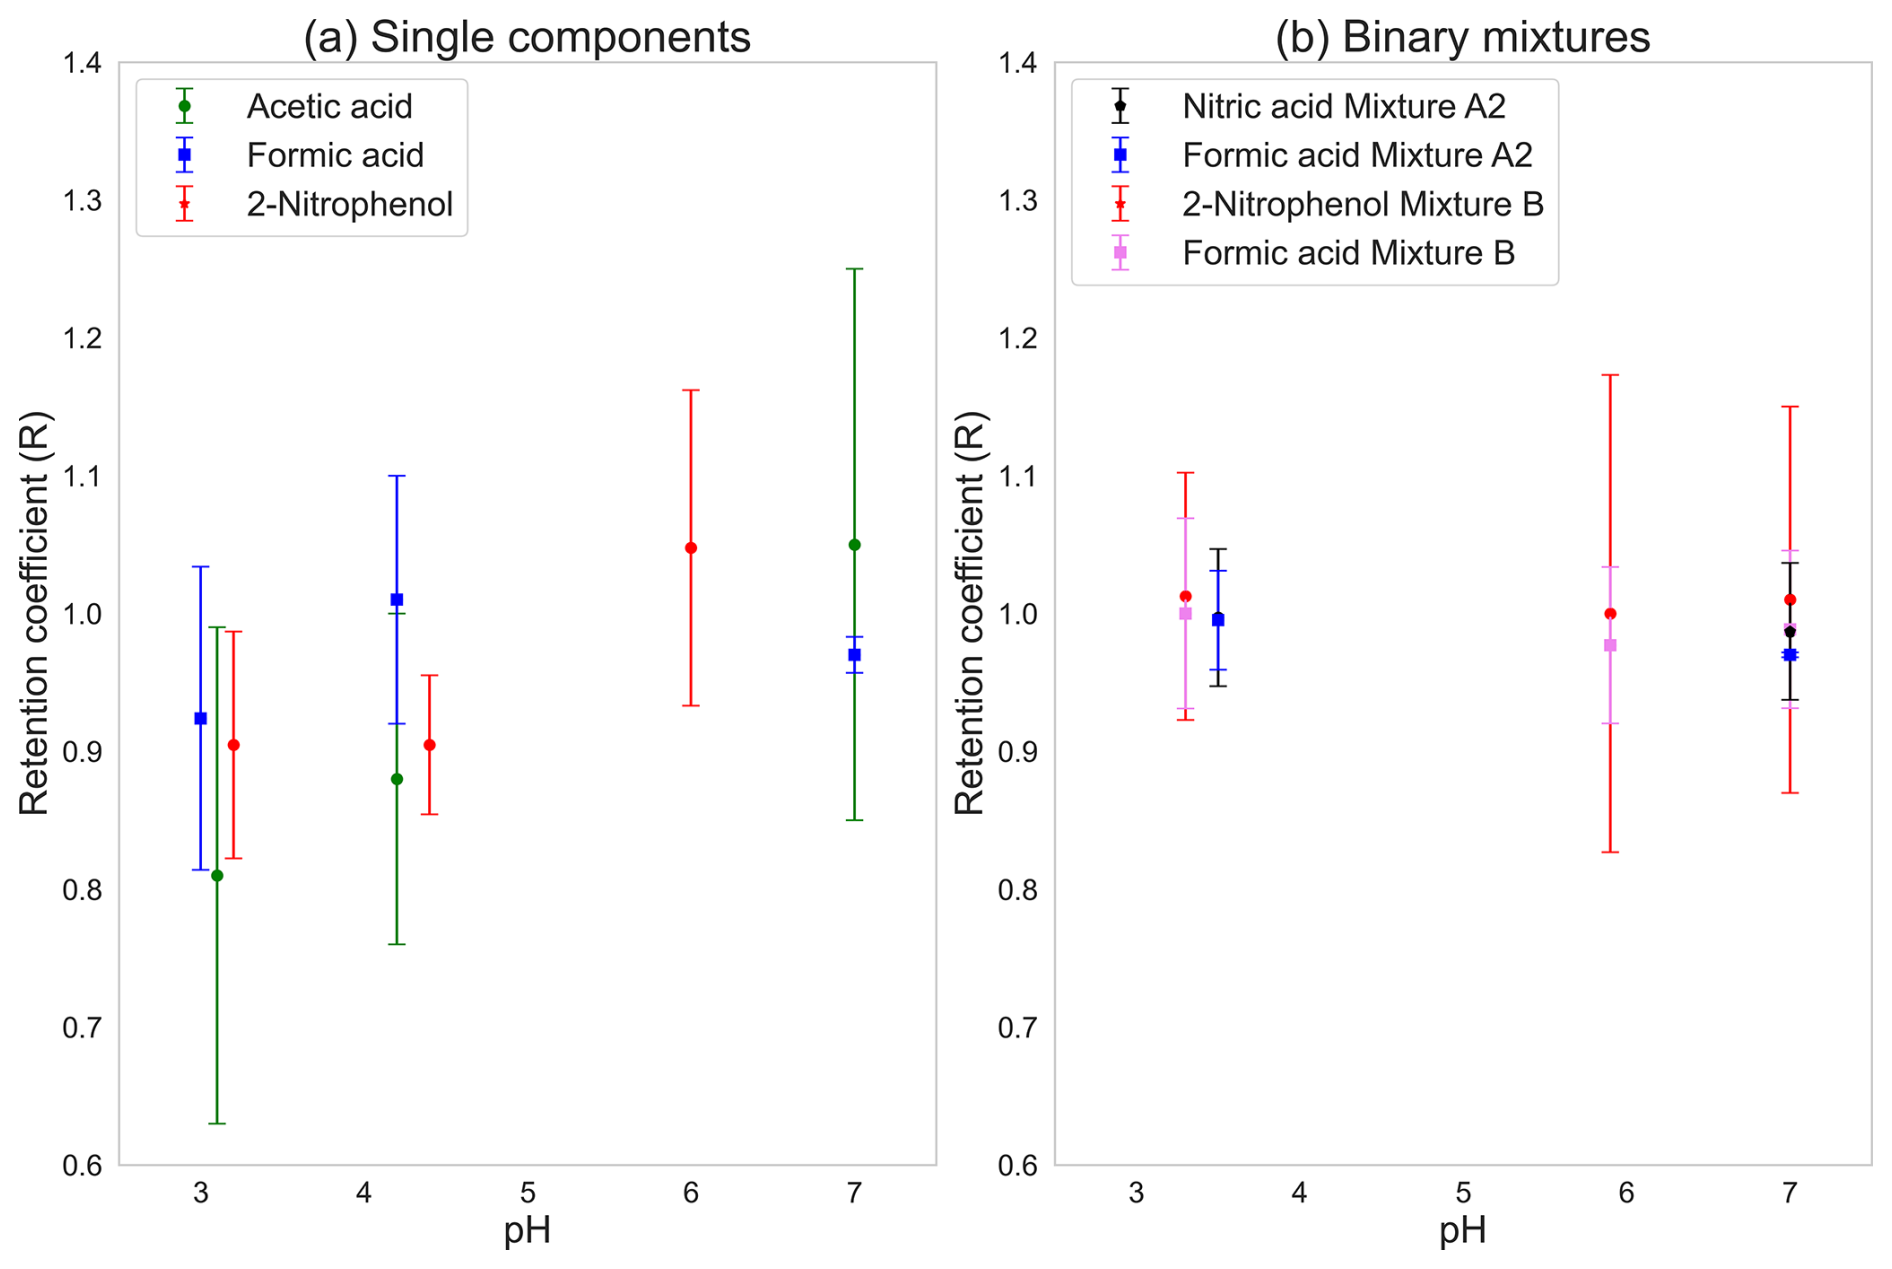
Figure 2pH sensitivity of the retention coefficient of (a) single components and (b) binary mixtures.
3.2 pH sensitivity
Retention coefficients of the single components were each measured at three different pH values. As a strong acid, nitric acid completely dissociates and is therefore assumed to be completely retained. Hence, sensitivity studies for nitric acid were not done. The pH of the solutions was altered by adding HCl and NaOH. The pH sensitivities for the three single components – acetic acid, formic acid, and 2-nitrophenol – are shown in Fig. 2a.
Linear regression (SPSS V23) reveals a significant statistical dependence of the retention of acetic acid (green marker) on pH, with p=0.047. Acetic acid was not completely retained at pH 4.2 (R=0.88), and an increase in retention was seen at a higher pH. With increasing pH, the H* also increases for acetic acid (see Fig. S1 in the Supplement). The retention coefficients for acetic acid were 0.81, 0.88, and 1.05 for pH values of 3.1, 4.2, and 7.0, respectively, while their corresponding standard deviations were 0.18, 0.12, and 0.2.
Formic acid (blue marker) did not show any dependency on pH (p=0.182). Formic acid is already completely retained at pH 4.1 (R=1.01), and, as such, any increase in pH would not lead to an enhancement of the retention, even though H* for formic acid varies in a similar fashion to that for acetic acid (Fig. S1).
2-nitrophenol (red marker) showed a statistically significant dependence of retention on pH (p=0.005) for our measured pH range. The retention coefficients of 2-nitrophenol at pH levels of 3.2, 4.4, and 6 were 0.90, 0.90, and 1.05, respectively, and their corresponding standard deviations were 0.08, 0.05, and 0.11. This result for 2-nitrophenol is contradictory to the expected form of dependence of H* on pH, as in Fig. S1. 2-nitrophenol is more dissociated at pH 6 than at pH 3.2 and 4.4. The fraction of deprotonated to protonated ions at pH 3.2, 4.4, and 6 for 2-nitrophenol was found to be , , and , respectively. This means that, at pH 6, about 7 % of 2-nitrophenol is present in deprotonated form. During the freezing process, deprotonated molecules must undergo protonation to achieve neutrality before they can be expelled from the drop. At pH 6, a higher proportion of molecules remain confined within the drop due to the requirement for proton recombination prior to volatilization and their subsequent expulsion. This pH dependence for 2-nitrophenol is also in agreement with the findings of Borchers et al. (2024) for riming retention of cloud droplets.
The pH sensitivities for the binary mixtures are shown in Fig. 2b. Mixture A1 was omitted due to the larger standard deviation for acetic acid compared to for formic acid as a single component. In mixture A2, both substances were retained completely. The same was found for mixture B. As shown in Fig. 2b, none of the mixtures show any sensitivity to changes in pH.
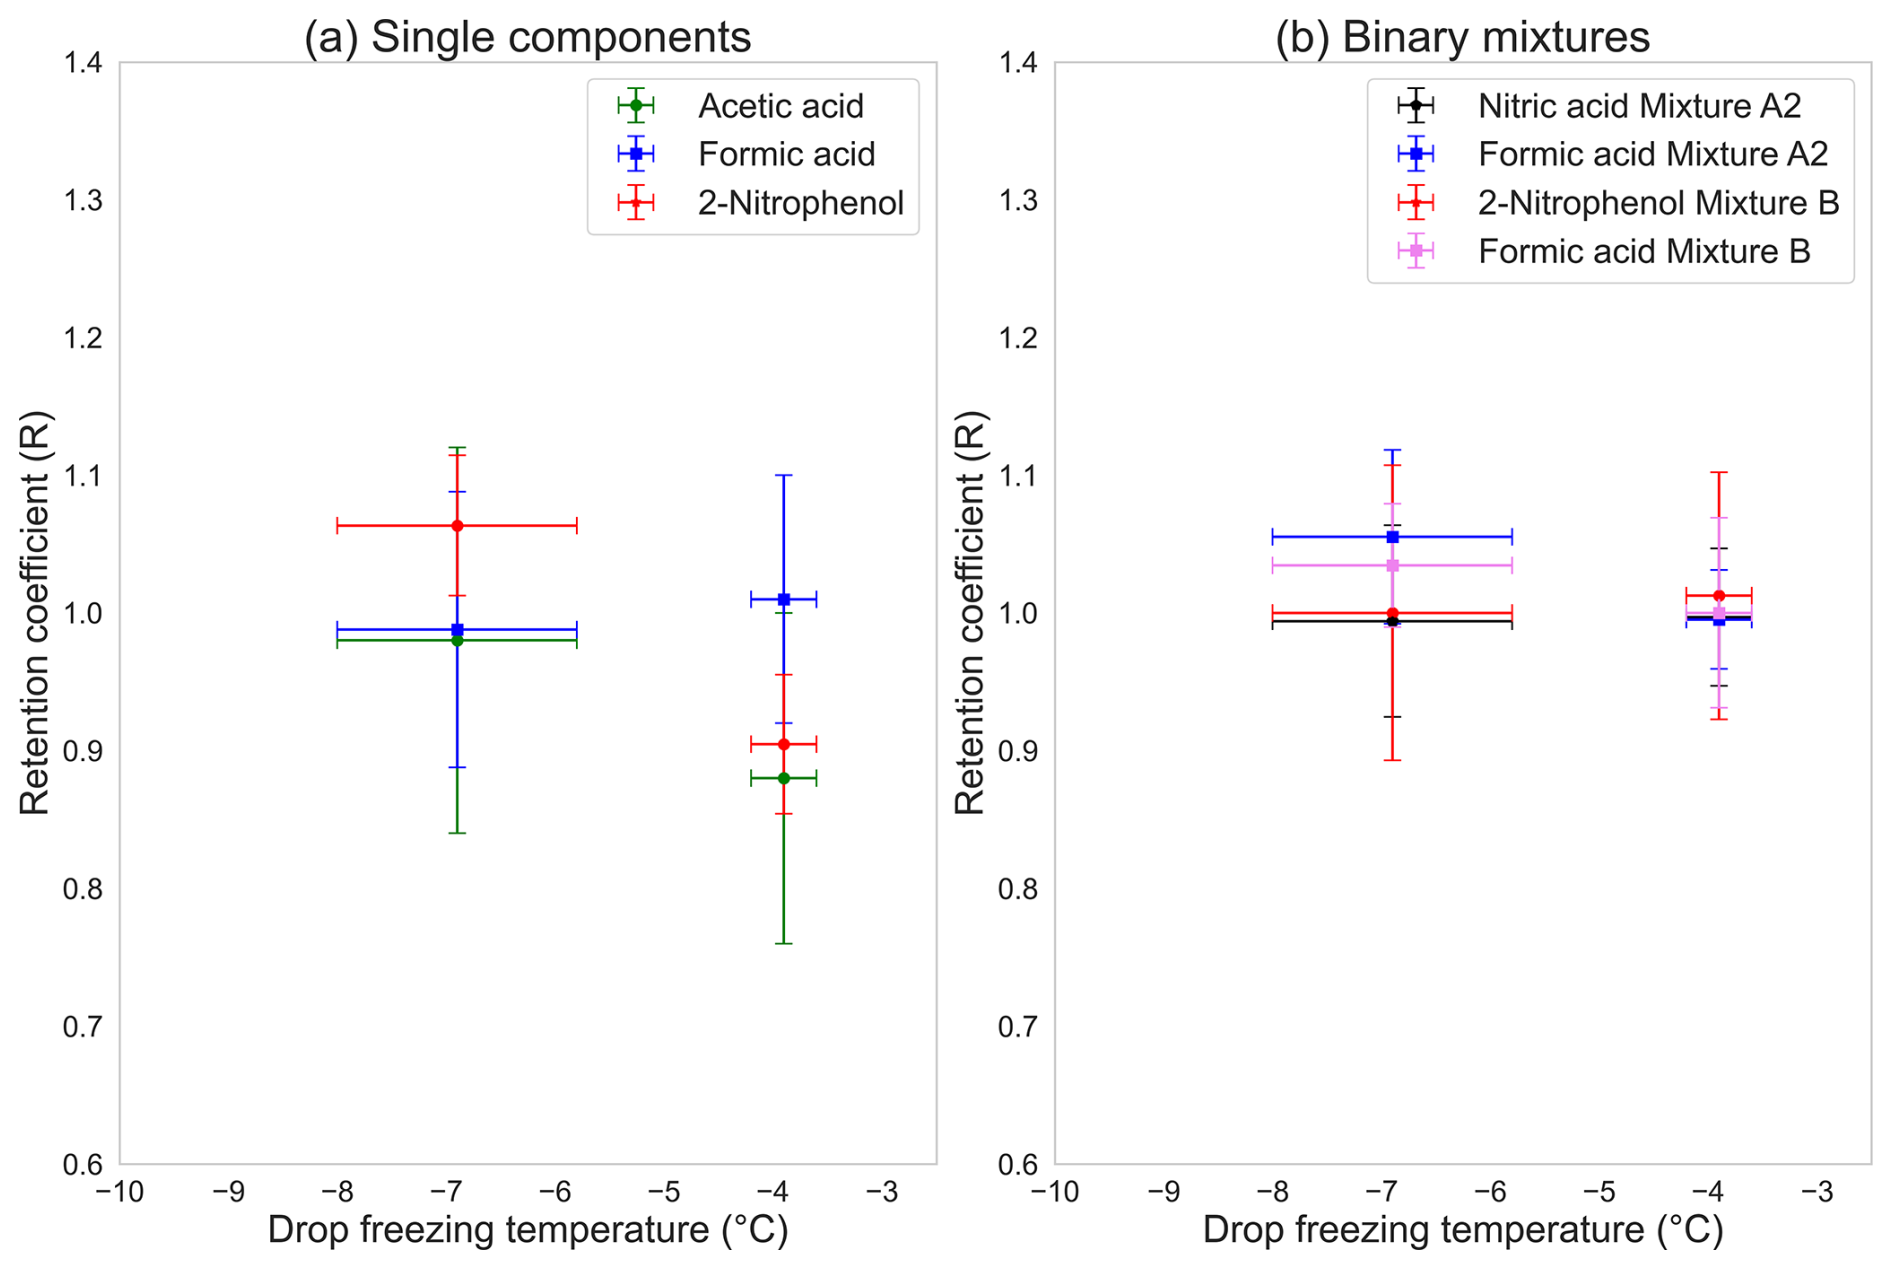
Figure 3Temperature sensitivity of the retention coefficient of (a) single components and (b) binary mixtures.
3.3 Temperature sensitivity
The temperature sensitivities for the single components are shown in Fig. 3a. Acetic acid (green marker) showed a higher retention coefficient at the lower temperature, with large standard deviations of the measurements at both temperatures. At −6.9 °C, the retention coefficient for acetic acid was 1.14±0.24, and, at −3.9 °C, it was 0.88±0.12. Formic acid (blue marker) did not show any variation in terms of retention coefficient with changes in the drop-freezing temperatures and was completely retained at both temperatures. 2-nitrophenol (red marker) also had a higher retention coefficient at the colder temperature (1.06±0.05) as compared to at the warmer temperature (0.90±0.08). The retention coefficients for both acetic acid and 2-nitrophenol appeared to have a weak dependency on temperature and were completely retained at −6.9 °C, along with formic acid, which had no dependency and was completely retained at both temperatures. In the atmosphere, freezing is initiated at lower temperatures than our experimental temperatures, indicating near-complete retention of the investigated species.
Unlike the single components, the binary mixtures did not show any temperature dependency, as seen in Fig. 3b. Both sets of binary mixtures were fully retained at °C. At the colder temperature, the retention coefficients did not change, and the mixtures were completely retained.
3.4 Relation with effective Henry's law coefficient
Retention coefficients of substances are strongly dependent on chemical properties such as aqueous diffusion, gaseous diffusion, interfacial mass transport, solubility, and dissociation. Among them, solubility and dissociative effects characterized by an effective Henry's law constant H* were reported to be the dominant ones. Stuart and Jacobson (2003) and Jost et al. (2017) showed this relationship between the retention coefficient and H*, stating that substances with H* greater than 107 are completely retained. Substances with H* lower than 104 are less likely to be retained or are more likely to be expelled from the drop during riming retention. Retention coefficients of all other substances with H* values between these ranges followed a sigmoid shape (see Borchers et al., 2024, Fig. 7).
The relation between effective Henry's law coefficient and the retention coefficient for cloud droplets, i.e., retention riming, was modeled by the following equation:
where , and . The values of a and b were taken from Borchers et al. (2024).
Figure 4 shows the relation between H* and R. The gray markers are from previous studies for riming retention (von Blohn et al., 2011; Jost et al., 2017; Borchers et al., 2024). The colored markers are from the present study utilizing freezing retention. Equation (4) was plotted in Fig. 4 against our current data for comparing the dependency of R on H* for µm-sized droplets and mm-sized drops.
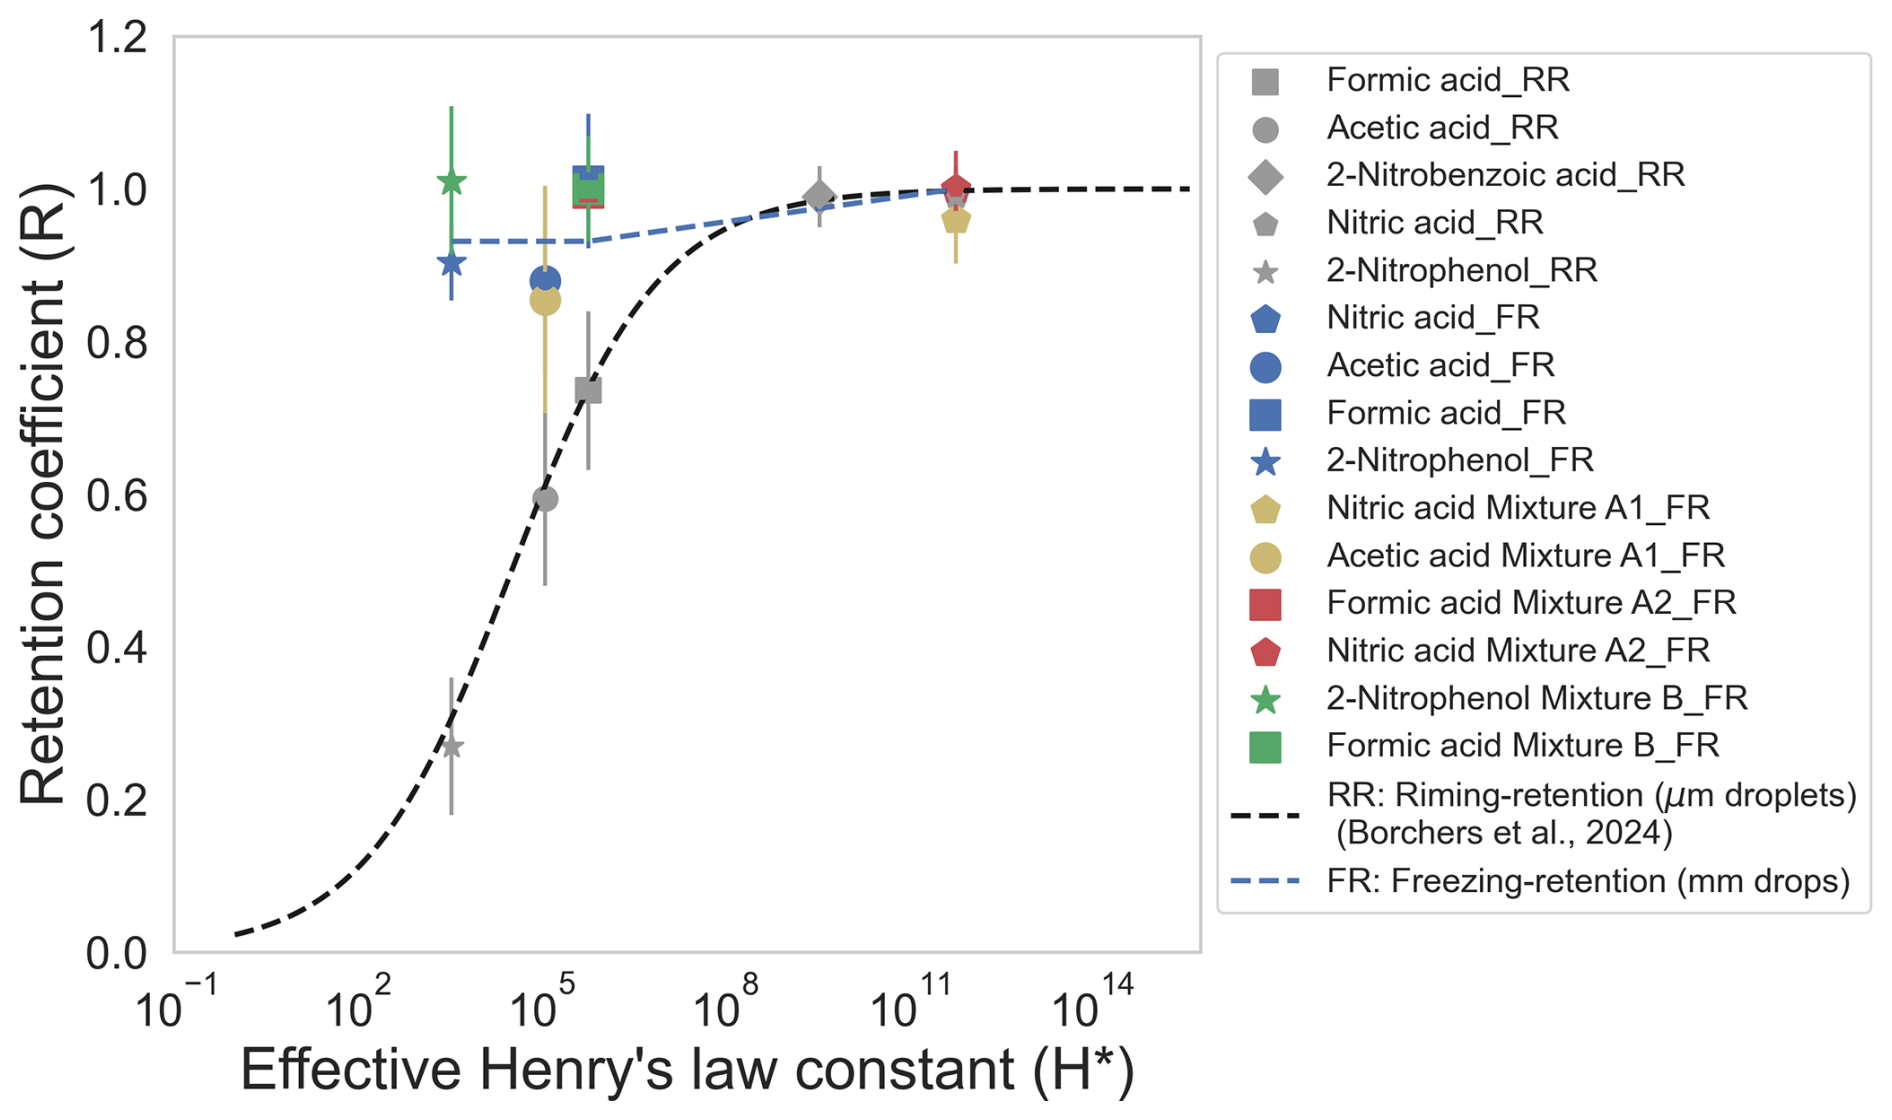
Figure 4Retention coefficient (R) as a function of effective Henry's law coefficient (H*). Gray markers: from riming retention (RR) of small droplets (von Blohn et al., 2011; Jost et al., 2017; Borchers et al., 2024). Colored markers: from freezing retention (FR, present study), with drop-freezing temperature of °C. Blue markers: single components. Yellow (mixture A1), red (mixture A2), and green (mixture B) markers: binary mixtures.
It is apparent from Fig. 4 that nitric acid with an H* of 1011 was completely retained. Formic acid was completely retained, too, which is in contrast to previous measurements from riming-retention studies in which a lower retention coefficient (0.76) was shown. No definitive conclusion regarding changes in the measured retention coefficient can be made for acetic acid (0.88 for single component) due to a large standard deviation and the overlap between the single components and the binary-mixture measurements. Conversely, the riming retention of acetic acid was much lower (0.6). 2-nitrophenol showed a much higher retention coefficient for large drops (0.9 and above) compared to its retention for small µm-sized droplets (0.27 at pH 5.6; Borchers et al., 2024). Considering its low H* (103), one could expect the retention coefficient of 2-nitrophenol as a single component to be lower than 0.9, which was not the case here. In the mixture with formic acid, 2-nitrophenol was also completely retained. Specifically, Fig. 4 demonstrates that our results from freezing retention deviate from the sigmoidal relationship between retention coefficients and H*, unlike the previous experimental studies involving riming retention. This result is also seen in the conclusions of Part 2 (Seymore et al., 2025) of this publication series, where the retentions for ambient water-soluble organic compounds of over 450 species were also investigated.
3.5 Retention indicator analysis
Another method to analyze retention is from the point of view of mass and heat transfer considerations, such as the mass expulsion and freezing timescales as suggested by Stuart and Jacobson (2003, 2004) and Jost et al. (2017). A retention indicator (RI) is introduced, which is the ratio of total mass expulsion time (Texp) to the freezing time (Tfrz), as shown in Eq. (5). Table 3 shows the calculated timescales for the retention indicator of the single components investigated in this study.
In the above, , , and .
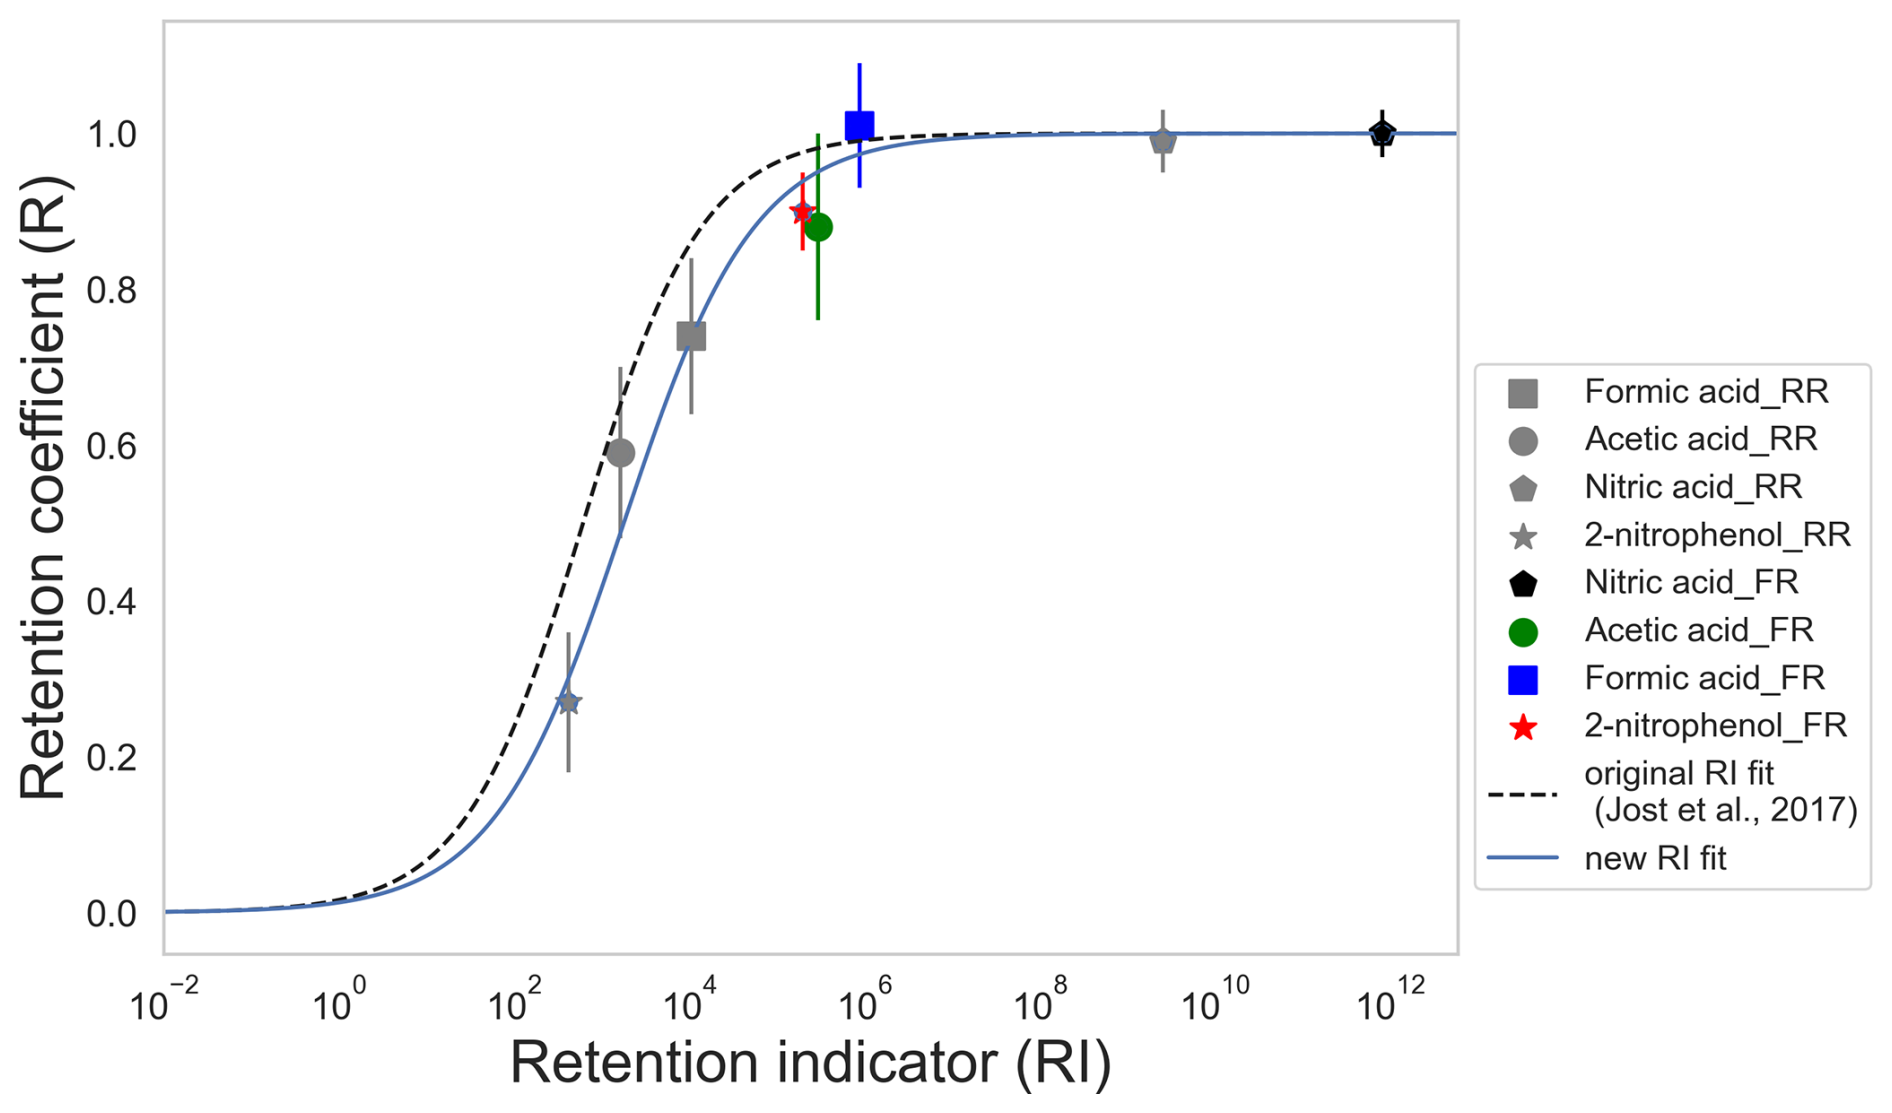
Figure 5Retention coefficient of the substances investigated as single components as a function of the empirical retention indicator. Gray markers: from riming retention (RR). Colored markers: from freezing retention (FR). Dashed line: original retention indicator fit parameters from Jost et al. (2017). Solid line: updated fit from current study.
The total solute mass expulsion time Texp is the sum of aqueous-phase mass expulsion time Taq, gaseous-phase mass expulsion time Tg, and interfacial mass transfer expulsion time Ti. In Eq. (6), Tg accounts for the gaseous diffusivity Dg, where a is the radius of the drop, H* is the effective Henry's law coefficient, and f is the ventilation coefficient (f=5.6; Szakáll et al., 2021). Taq accounts for the aqueous diffusivity Daq of the substance. Ti takes into consideration the mass accommodation coefficient α and the thermal velocity v of the chemical in the air.
A fourth timescale involving the aqueous-phase kinetics was also introduced by Jost et al. (2017). This timescale is specifically important for substances such as ammonia and formaldehyde since they react with atmospheric carbon dioxide and are affected by dehydration of methanediol (Jost et al., 2017). For substances investigated in this study, the aqueous-phase kinetics and reactions are negligible, and so this timescale was not considered. The experimental temperatures, pH values, initial concentrations, and H* values are also listed in Table 3 for reference. The freezing time Tfrz was derived experimentally via a high-speed camera (Motion Pro Y3M; pixel size: 12×12 µm; resolution: 1024×1280 pixels) at 600 frames per second, as shown in Fig. B1. The time from the initiation of freezing to the complete formation of an ice shell around the levitated drop was approximately 4.8 ms. The ice shell formation takes place very rapidly during the adiabatic-freezing stage of the drop, where drop surface temperature rises to 0 °C (see Appendix A1). After the formation of the ice shell, the dissolved solute remains inside and is retained during freezing. Hence, this ice shell formation time was considered to be the freezing time for the retention indicator calculation.
It is also clearly evident in Table 3 that Tfrz is several orders of magnitude smaller compared to Texp. Gas-phase expulsion time Tg appears to be the controlling factor contributing to the total high Texp for nitric and formic acid, and the aqueous-phase expulsion timescale Taq appears to be the controlling factor for acetic acid and 2-nitrophenol. In Jost et al. (2017), the parameterization relating RI and the retention coefficient is given as
Table 3List of parameters used for retention indicator calculation.
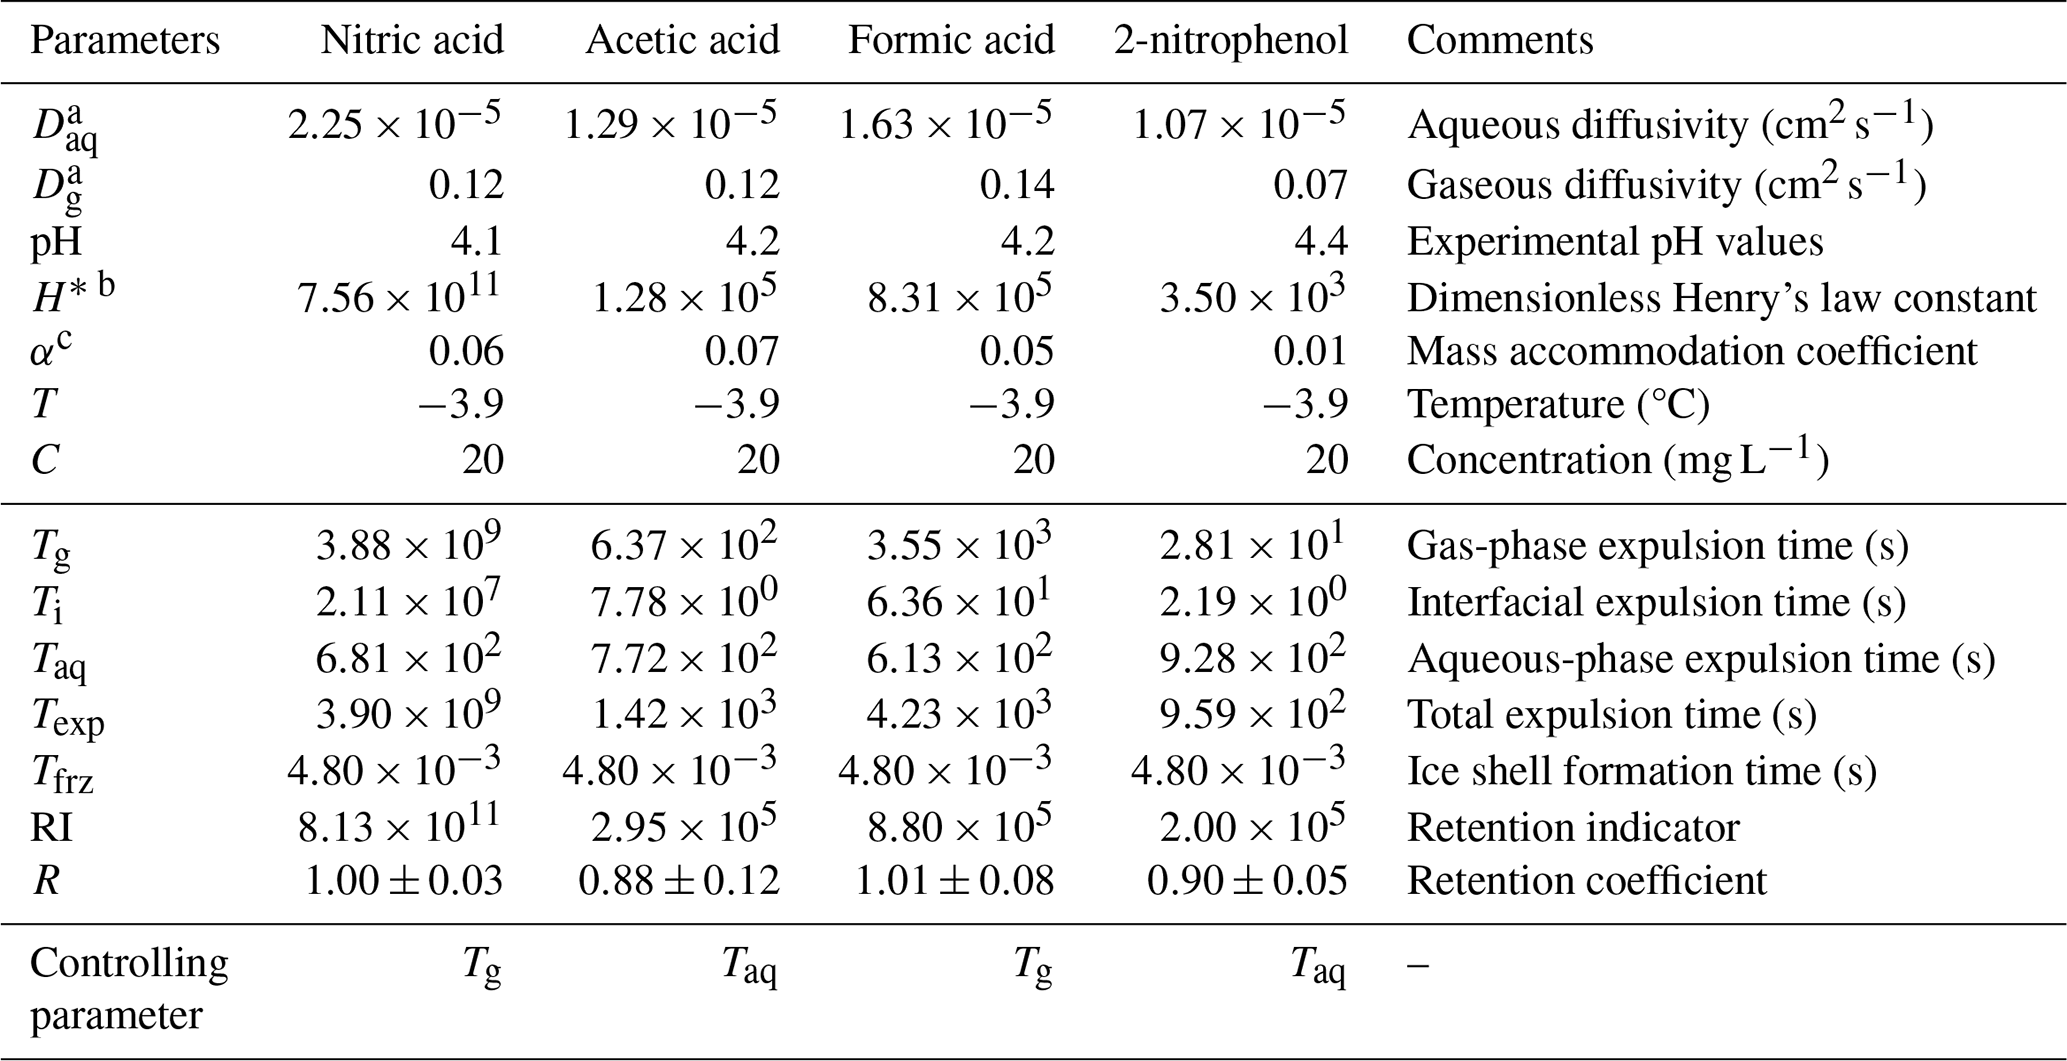
a The diffusivities in water Daq and in air Dg calculated at 273 K (Thibodeaux and Mackay, 2010). b Effective Henry's law constant calculated at 273 K and at their corresponding pH (Tremp et al., 1993; Johnson et al., 1996; Warneck and Williams, 2012). c The mass accommodation coefficient at 273 K (Ervens et al., 2003; Davidovits et al., 2006).
Equation (8) is depicted in Fig. 5, where the original parameters taken from Jost et al. (2017) are and (dashed black line, Fig. 5). From our study, an updated fit is provided with and (solid blue line, Fig. 5).
Figure 5 shows the variation of retention coefficients with RI. In contrast to Fig. 4, both the riming-retention and freezing-retention measurements fit well with the parameterization given in Eq. (8). This analysis corroborates our experimental results for mm-sized raindrops with µm-sized cloud droplets. These results can be categorized with timescale analysis and follow a similar relation compared to previous experimental (Jost et al., 2017) and theoretical (Stuart and Jacobson, 2003, 2004) studies.
3.6 Physical parameters
Our study shows that retention is dependent on the size of the droplets, which needs to be considered when modeling the mass flux of trace substances with numerical models. An aspect of the importance of the physical parameters is the ratio of surface area to volume. The rain-sized drops in this study have a ratio of surface area to volume of 3×10³ m−1. The cloud droplets in earlier retention-riming studies have a ratio of surface area to volume of about 2×10⁷ m−1. Thus, this ratio is approximately 4 orders of magnitude higher for the cloud droplets compared to the raindrops. As such, the dissolved substances in raindrops have more diffusional volume and smaller surface area. Additionally, a low ratio of surface area to volume for the case of the raindrops is an indicator of lower overall desorption as well (Jost, 2017).
Another physical parameter influencing retention is the ventilation coefficient. It describes the enhanced heat and mass transfer around hydrometers in an airflow. For the riming-retention studies, substances measured inside a wind tunnel (µm-sized droplets) had ventilation coefficients of about 30 to 32 (Jost et al., 2017, Table 4). In contrast, the ventilation coefficient in the acoustic levitator for the 2 mm diameter drops was about 5.6 (Szakáll et al., 2021). As such, a smaller ventilation coefficient would incur less transfer of mass and heat for the 2 mm raindrops as compared to the retention measurements for µm-sized droplets. This could be seen as an important physical parameter aiding higher expulsion times and, consequently, higher retention coefficients, as seen in the RI analysis. We found aqueous and gaseous diffusion to be limiting factors in our RI analysis, which limits the mass transport of the species to the environment (Table 3). In a real atmospheric scenario, 2 mm drops falling at their terminal velocity have a ventilation coefficient of about 15 (Pruppacher and Klett, 2010). A higher ventilation coefficient will increase the mass transfer and thereby decrease the expulsion timescale. However, the ventilation coefficients of heat and mass transfer are almost the same. Therefore, an increase in mass transfer would also imply a faster freezing time.
The fast freezing rates observed in our study imply that the molecules do not have much time to diffuse away from the forming ice front. This means the molecules are easily captured by the ice and form defects in the ice crystal lattice. Stuart and Jacobson (2006) reported the formation of liquid pockets that can trap solutes during freezing, informed by previous studies of dendritic crystal growth in solutions. These liquid pockets were also seen in our experiments. The ice shell formation impedes further retention because diffusion in ice is orders of magnitude lower compared to the liquid. As a result, only a small fraction of the solute is expelled. This high degree of solute incorporation into the ice is the primary factor contributing to the observed high retention in our study.
Observations of naturally frozen drops and laboratory experiments (Lauber et al., 2018) have shown frozen raindrops with deformations and protuberances. A rise in internal pressure during freezing could have the potential for cracks or splitting of the ice shell during freezing, leading to the expulsion of solute mass and perhaps being a source for secondary ice production (Field et al., 2017; Korolev and Leisner, 2020). Kleinheins et al. (2021) reported cracking of the ice shell at internal pressures above 100 bar for 300 µm sized drops. The internal pressure built up during freezing in our experiments was found to be about 81 bar. However, within our experimental conditions, these occurrences were not seen.
The temperature difference between the freezing drop and the environment may influence the freezing and retention. During the initiation of freezing, the drop temperature rises to 0 °C (Fig. A1), where the fraction of liquid freezes and where the majority of latent heat released during cooling contributes to warming the supercooling drop to 0 °C (Szakáll et al., 2021). We assume that the ice shell forms very rapidly at this stage, which can be perceived as adiabatic freezing (see Appendix A1), with no exchange of heat to the environment. Thus, we expect that this freezing stage should not be affected by the temperature difference between the drop and the ambient air.
At the onset, we successfully characterized the freezing of levitated raindrops (2.0±0.1 mm) at three different concentrations and temperatures using the acoustic levitator setup. We measured the retention coefficients of nitric acid, formic acid, acetic acid, and 2-nitrophenol as single components and their combinations as binary mixtures during the freezing of raindrops. In addition to these measurements, we also checked the sensitivity at three different pH levels (pH 3, 4, and 6–7) and at two different temperatures ( and °C).
We conclude that, for rain-sized drops (mm and above), most of the chemical species are completely retained during freezing. This can be interpreted as the physical parameters – such as drop size and ice shell formation – dominating the chemical properties concerning retention influences. After an ice shell is formed around a drop during the initiation of freezing, it is significantly more difficult for the dissolved species to be expelled from the drop, thus leading to higher mass expulsion timescales.
Substances studied as single components show sensitivity (for 2-nitrophenol and acetic acid) with changes in either pH or temperature. Formic acid as a single component is not sensitive to changes in pH or temperature. Binary mixtures also do not show any sensitivity to changes in pH and freezing temperature.
Our retention indicator analysis shows that the shorter freezing and longer expulsion timescales (a minimum of 5 orders of magnitude higher) lead to higher retention for the investigated species. This indicates that, during the freezing of mm-sized raindrops, all dissolved trace gases may be removed by precipitation in deep convective clouds or transported within the ice phase into the UT, where they can be released upon sublimation. Concurrently, factors such as ventilation, temperature differences, crack formation during freezing, and concentration of dissolved solutes need to be dealt with meticulously. Our results, combined with results from riming-retention studies, facilitate the extrapolation of the retention of the investigated trace gases from µm- to mm-sized drops in computational studies.
Our results show higher retention coefficients (close to 1) for similar substances in mm-sized raindrops as compared to previously determined retention coefficients in µm-sized cloud droplets (von Blohn et al., 2011; Jost et al., 2017; Borchers et al., 2024). It is important to note that, in addition to the differences in droplet size, the freezing pathways were also different. The previous studies utilized the riming-retention mechanism, while, in the present work, we incorporated a contact-free freezing-retention mechanism.
We derived new parameterizations for the retention indicator to include large mm-sized raindrops and, thus, updated the previously obtained ones that only considered µm-sized cloud droplets (Jost et al., 2017). This result is beneficial in terms of computational expense for the chemistry coupled atmospheric and Earth system modeling as modeling freezing raindrops would not require many additional computational resources.
Our experiments were conducted with single components and binary mixtures, but, in the real atmosphere, air is mixed with numerous complex trace gases that are in constant turbulent motion. Our current database does not have many substances with H* values lower than 103, and such substances might behave differently during freezing. Future retention experiments that sample for trace gases at the ground level and at different vertical profiles could improve our understanding of the underlying micro-physical and chemical processes within convective systems. Our experiments also indicate that it is critical to further investigate the ice shell formation process during the freezing of raindrops. Furthermore, in-depth investigation of the effect of ventilation and examination of the internal pressure build up during freezing for raindrops also provides an interesting avenues for future studies.
Future studies should investigate how these and similar organic compounds behave when they are in the real atmosphere. In Part 2, we investigate the retention of a complex mixture of organic compounds sampled from Beijing urban aerosols using the same experimental setup with high-resolution mass spectrometry analysis.
A1 Freezing of levitated drops
To characterize the INP (AgI), we levitated drops and recorded their drop surface temperature as they froze for three pairs of different concentrations and cold-room temperatures: 0.2, 0.01, and 0.0003 g L−1 and corresponding cold-room temperatures of −15, −20, and −28 °C. For both combinations of concentration and temperature, the freezing profiles of about 50 drops were recorded. The crucial information derived from these three sets of measurements was the obtainment of the freezing profiles of the levitated drops during their freezing. Figure A1 shows a typical drop-freezing profile as the temporal evolution of the drop surface temperature. The drop, when injected into the nodes of the standing wave, initially had a temperature higher than 0 °C. The warm drop underwent gradual and uniform cooling and reached a supercooled stage (0 to 20 s). The supercooled stage continued until nucleation was initiated, where the rapid crystal growth started (about 25 s) and where drop surface temperature rose sharply to about 0 °C. The rapid crystal growth can be interpreted as adiabatic freezing, and the corresponding temperature was taken as the freezing temperature of the drop. At this temperature, the supercooled drop entered an ice–water equilibrium, visible as the flattened section in Fig. A1 (30 to 80 s). During this stage, the transfer of latent heat took place, which can be interpreted as the diabatic freezing of the levitated drop. The supercooled drop then underwent a phase transition from a liquid to a solid state. Finally, the drop surface temperature cooled down to ambient temperatures, reaching a steady state (100 s) once it was completely frozen.
A2 Frozen fraction
Within the range of the sample size of 50 drops for each set of frozen fraction measurements, the precise drop-freezing temperatures varied. We grouped the recorded drop-freezing temperatures in bins with a width of 0.5 °C. Corresponding to each bin, the numbers of frozen drops at each interval were grouped. A cumulative distribution was formed with the grouped bins. As commonly used in ice nucleation studies, the frozen fraction or fice was determined, which is calculated as the fraction of total drops that were frozen at a particular temperature (more details in Szakáll et al., 2021). The temperature at which fice was 50 % was taken as the “median drop-freezing temperature” for each set of concentrations and cold-room temperatures.
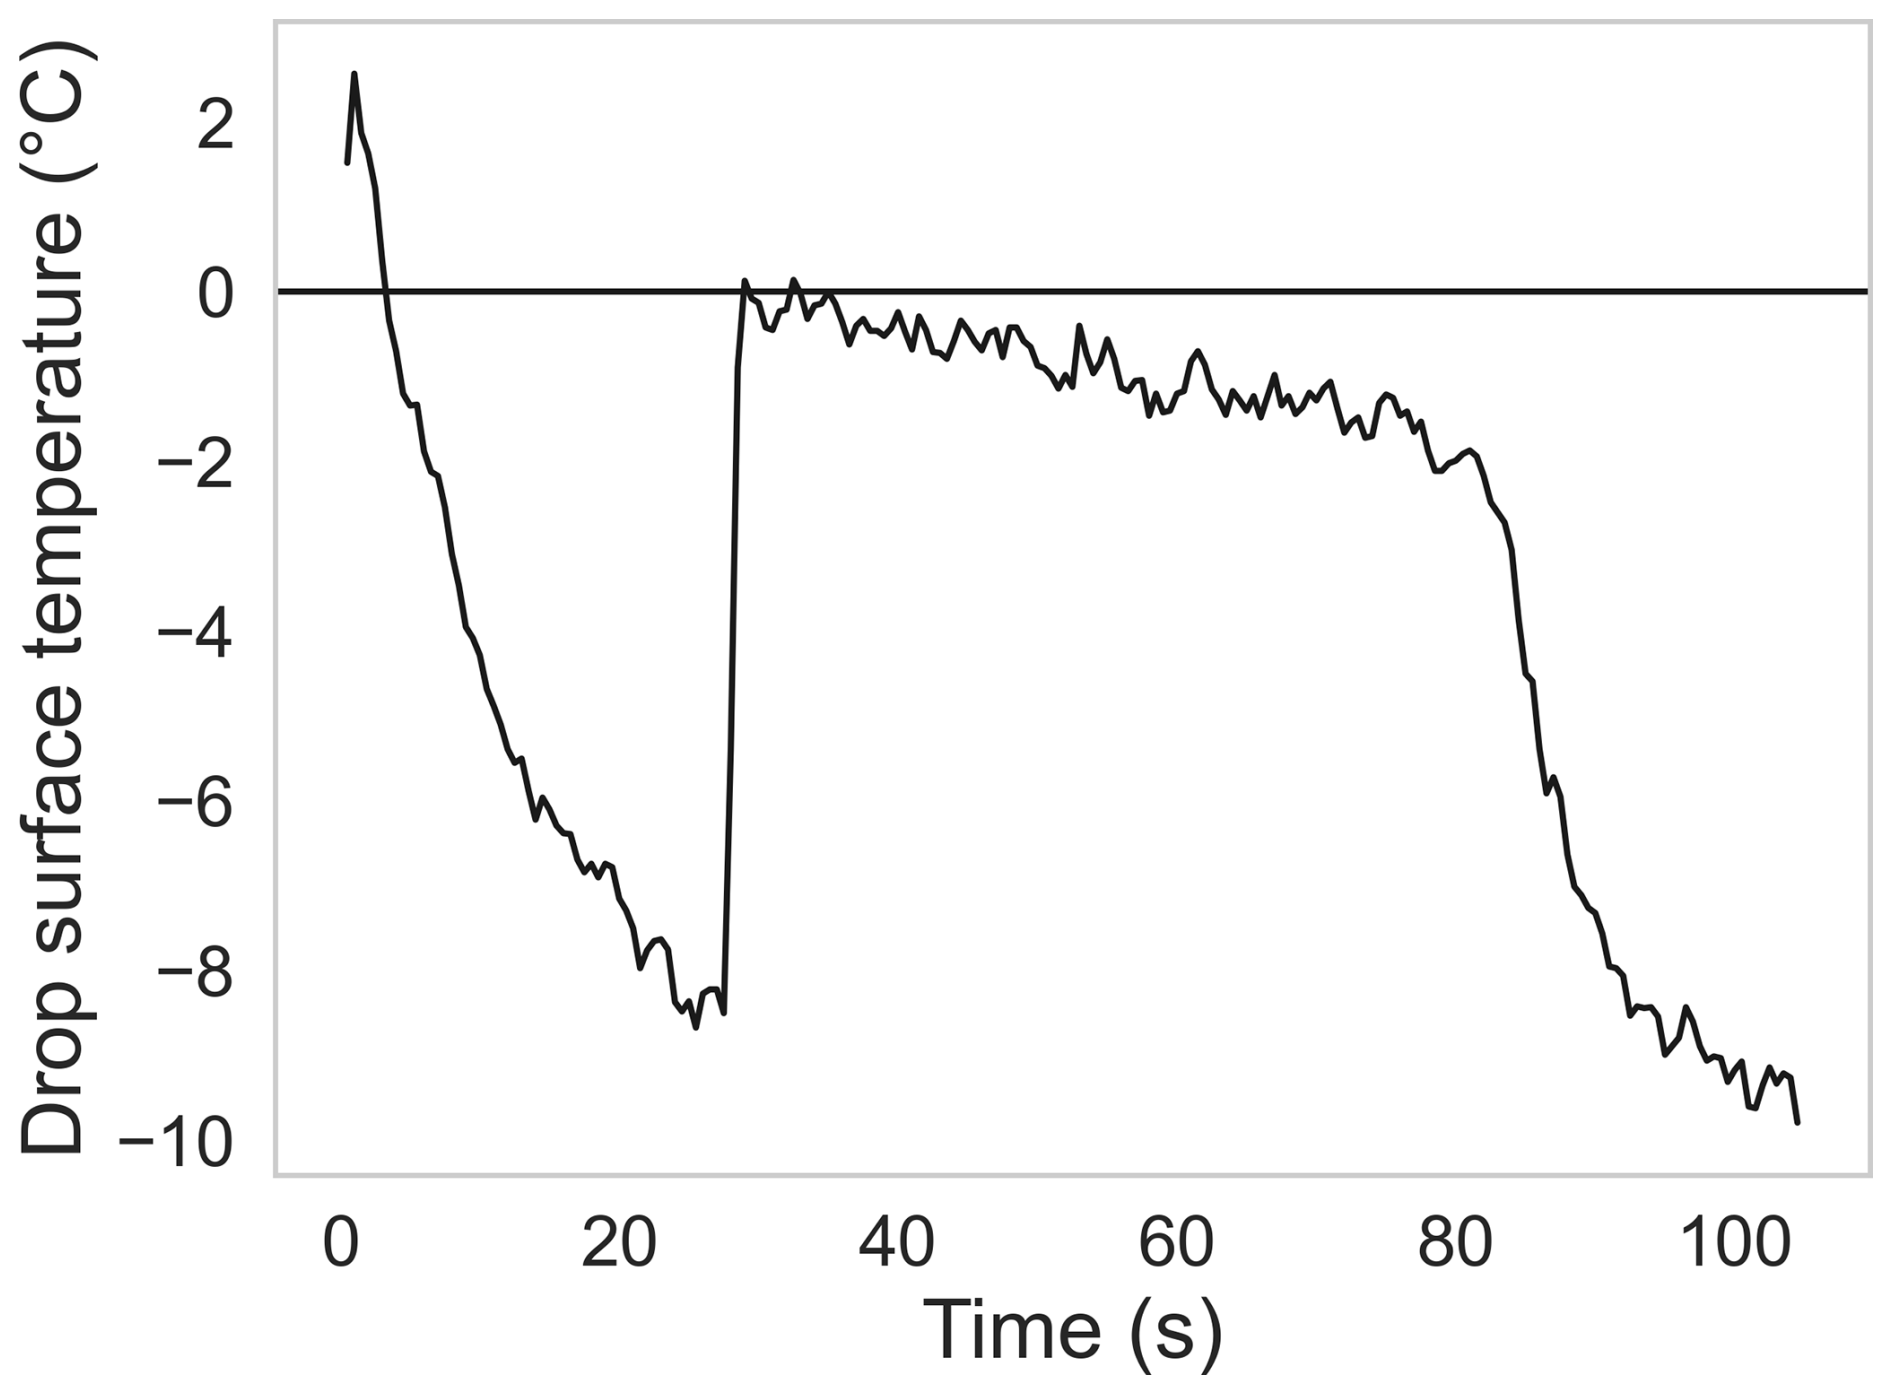
Figure A1Evolution of drop surface temperature during its freezing as measured by the infrared thermometer.
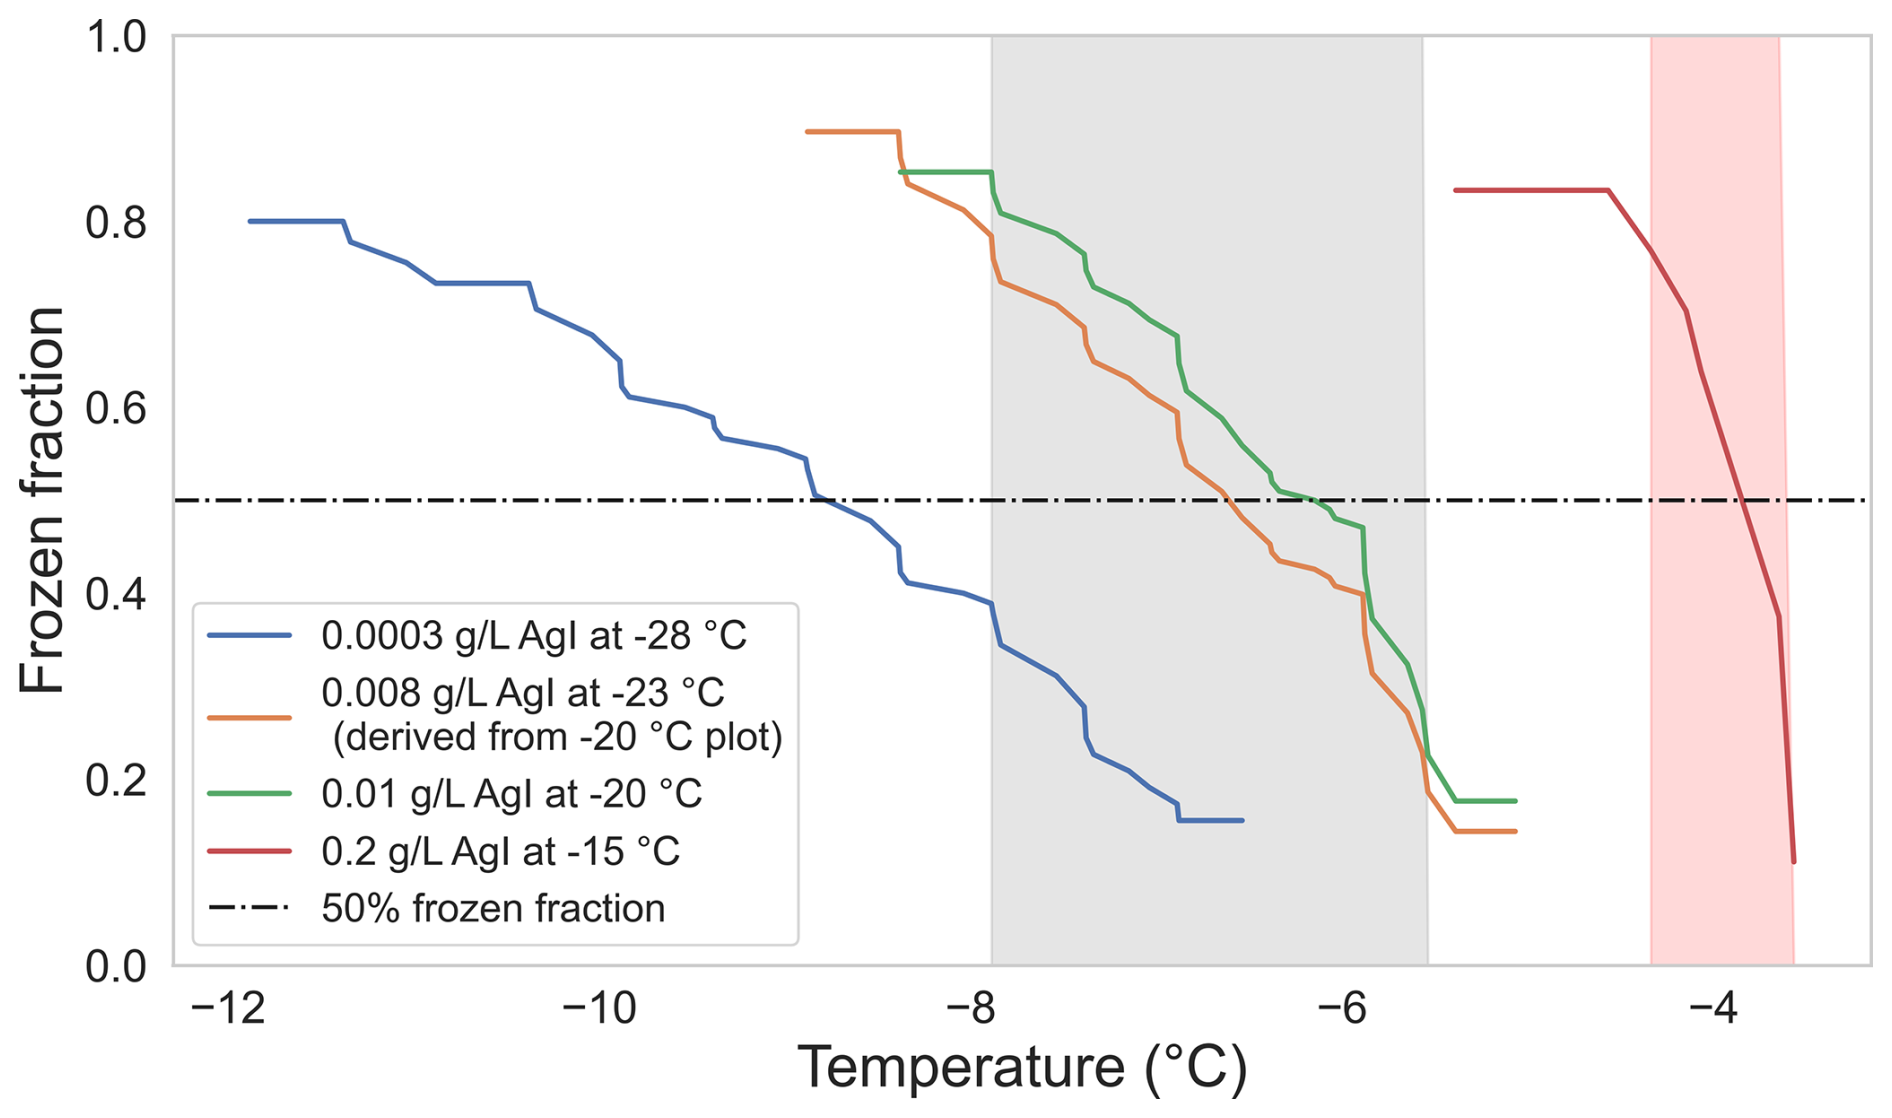
Figure A2Frozen fraction at different ambient temperatures and concentrations of AgI. Shaded regions mark the two selected temperature ranges for retention measurements. The shaded regions lie within the interval where the frozen fraction is in between 0.8 and 0.2.
The frozen fractions for each set of measurements are shown in Fig. A2. The average drop-freezing temperature was −3.9 °C for an AgI concentration of 0.2 g L−1 and cold-room temperature of -15 °C. For the combination of 0.01 g L−1 and −20 °C, the average drop-freezing temperature was −6.7 °C, whereas for the combination of 0.0003 g L−1 and −28 °C, it was −8.9 °C. We conducted our retention measurements at a cold-room temperature of −23 °C. To obtain the freezing profile at this temperature, we refitted the freezing profile obtained for −20 °C using the following equation:
where fice_23 is the desired frozen-fraction distribution at −23 °C. c20 and c23 are the INP concentrations at the two different temperatures of −20 and −23 °C, respectively. fice_20 is the experimentally derived frozen fraction at −20 °C. The cooling rate of the drop surface temperature was practically identical at these two cold-room temperatures. Equation (A1) is adopted from the relation between ice-nucleation-active sites (ns) and fice and at a particular INP concentration and temperature (see Szakáll et al., 2021, Eq. 5).
We selected the interval where the frozen fraction lies between 20 % to 80 % as the temperature deviation during our retention experiments. Shaded regions in Fig. A2 show this temperature deviation for experiments done at −15 and −23 °C cold-room temperatures. The average drop-freezing temperatures (frozen fraction at 50 %) in these two cases were (red-shaded region) and (gray-shaded region).
The investigation of the drop-freezing mechanism in the acoustic levitator led to the realization of the ice shell formation. During the rapid crystal growth stage within the first 25 s, as discussed in Appendix A1 (see Fig. A1), an ice shell formed around the supercooled drop within milliseconds (Fig. B1). After the formation of the shell, freezing inside the drop proceeded gradually until it was completely frozen. The shell formation process was recorded with a high-speed camera setup at 600 frames per second and at a cold-room temperature of −15 °C.
This observation validates the higher retention coefficients of the substances measured during our freezing-retention experiments as compared to the previously measured substances involving riming retention. The ice shell inhibited the expulsion of the dissolved chemical substances from the drop. The expulsion timescale as discussed and calculated in Sect. 3.5 was several orders of magnitude higher than the freezing timescale of 4.8 ms (Fig. B1). This led to a higher value of the retention indicator, even for more volatile substances such as 2-nitrophenol, which had the lowest effective Henry's law constant among the investigated substances (Fig. 5 and Table 3).
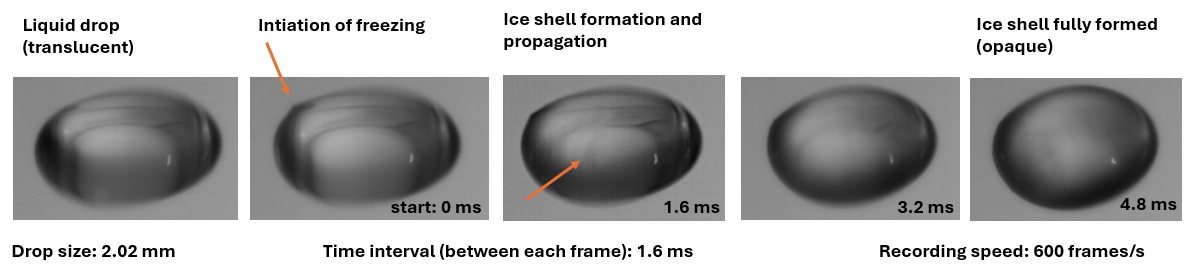
Figure B1Consecutive frames showing the formation of the ice shell, recorded with a high-speed camera at 600 frames per second and at a cold-room temperature of −15 °C. In the liquid phase (leftmost image), the drop is seen as translucent, which gradually turns opaque as the ice shell is formed (rightmost image).
The data supporting this study are available at https://doi.org/10.5281/zenodo.14319648 (Gautam, 2024). Additional data (if required) for this study are available upon request from the corresponding authors.
The supplement related to this article is available online at https://doi.org/10.5194/acp-25-11813-2025-supplement.
MG, MS, AT, JS, and SKM participated in designing the experiments. MG and MH performed the experiments. MG, MH, and JS conducted the analytical measurements. MG analyzed the data and wrote the paper draft. AT, JS, MH, SB, KD, and MS reviewed and edited the paper.
The contact author has declared that none of the authors has any competing interests.
Publisher's note: Copernicus Publications remains neutral with regard to jurisdictional claims made in the text, published maps, institutional affiliations, or any other geographical representation in this paper. While Copernicus Publications makes every effort to include appropriate place names, the final responsibility lies with the authors.
This article is part of the special issue “The tropopause region in a changing atmosphere (TPChange) (ACP/AMT/GMD/WCD inter-journal SI)”. It is not associated with a conference.
This research has been supported by the Deutsche Forschungsgemeinschaft (DFG, German Research Foundation) – SFB grant no. TRR 301 – project ID 428312742.
This open-access publication was funded by Johannes Gutenberg University Mainz.
This paper was edited by Barbara Ervens and reviewed by Gabor Vali and one anonymous referee.
Andreae, M. O.: Emission of trace gases and aerosols from biomass burning – an updated assessment, Atmos. Chem. Phys., 19, 8523–8546, https://doi.org/10.5194/acp-19-8523-2019, 2019. a
Barth, M., Stuart, A. L., and Skamarock, W.: Numerical simulations of the July 10, 1996, stratospheric-tropospheric experiment: Radiation, Aerosols, and Ozone (STERAO)-deep convection experiment storm: Redistribution of soluble tracers, J. Geophys. Res.-Atmos., 106, 12381–12400, 2001. a
Barth, M. C., Kim, S.-W., Wang, C., Pickering, K. E., Ott, L. E., Stenchikov, G., Leriche, M., Cautenet, S., Pinty, J.-P., Barthe, Ch., Mari, C., Helsdon, J. H., Farley, R. D., Fridlind, A. M., Ackerman, A. S., Spiridonov, V., and Telenta, B.: Cloud-scale model intercomparison of chemical constituent transport in deep convection, Atmos. Chem. Phys., 7, 4709–4731, https://doi.org/10.5194/acp-7-4709-2007, 2007. a
Bela, M. M., Barth, M. C., Toon, O. B., Fried, A., Homeyer, C. R., Morrison, H., Cummings, K. A., Li, Y., Pickering, K. E., Allen, D. J., Yang, Q., Wennberg, P. O., Crounse, J. D., St. Clair, J. M., Teng, A. P., O'Sullivan, D., Huey, L. G., Chen, D., Liu, X., Blake, D. R., Blake, N. J., Apel, E. C., Hornbrook, R. S., Flocke, F., Campos, T., and Diskin, G.: Wet scavenging of soluble gases in DC3 deep convective storms using WRF-Chem simulations and aircraft observations, J. Geophys. Res.-Atmos., 121, 4233–4257, 2016. a
Borchers, C., Seymore, J., Gautam, M., Dörholt, K., Müller, Y., Arndt, A., Gömmer, L., Ungeheuer, F., Szakáll, M., Borrmann, S., Theis, A., Vogel, A. L., and Hoffmann, T.: Retention of α-pinene oxidation products and nitro-aromatic compounds during riming, Atmos. Chem. Phys., 24, 13961–13974, https://doi.org/10.5194/acp-24-13961-2024, 2024. a, b, c, d, e, f, g, h, i, j, k, l
Brand, A.: Experimentelle Untersuchungen des Retentionskoeffizienten organischer Säuren in Wassertropfen, Diploma thesis, University of Mainz, Germany, 2014. a, b, c
Carlton, A. G., Wiedinmyer, C., and Kroll, J. H.: A review of Secondary Organic Aerosol (SOA) formation from isoprene, Atmos. Chem. Phys., 9, 4987–5005, https://doi.org/10.5194/acp-9-4987-2009, 2009. a
Corti, T., Luo, B. P., de Reus, M., Brunner, D., Cairo, F., Mahoney, M. J., Martucci, G., Matthey, R., Mitev, V., dos Santos, F. H., Schiller, C., Shur, G., Sitnikov, N. M., Spelten, N., Vössing, H. J., Borrmann, S., and Peter, T.: Unprecedented evidence for deep convection hydrating the tropical stratosphere, Geophys. Res. Lett., 35, L10810, https://doi.org/10.1029/2008GL033641, 2008. a
Cuchiara, G. C., Fried, A., Barth, M. C., Bela, M., Homeyer, C. R., Gaubert, B., Walega, J., Weibring, P., Richter, D., Wennberg, P., Crounse, J., Kim, M., Diskin, G., Hanisco, T. F., Wolfe, G. M., Beyersdorf, A., Peischl, J., Pollack, I. B., St. Clair, J. M., Woods, S., Tanelli, S., Bui, T. V., Dean-Day, J., Huey, L. G., and Heath, N.: Vertical transport, entrainment, and scavenging processes affecting trace gases in a modeled and observed SEAC4RS case study, J. Geophys. Res.-Atmos., 125, e2019JD031957, https://doi.org/10.1029/2019JD031957, 2020. a
Cuchiara, G. C., Fried, A., Barth, M. C., Bela, M. M., Homeyer, C. R., Walega, J., Weibring, P., Richter, D., Woods, S., Beyersdorf, A., Bui, T. V., and Dean-Day, J.: Effect of Marine and Land Convection on Wet Scavenging of Ozone Precursors Observed During a Seac4rs Case Study, J. Geophys. Res.-Atmos., 128, e2022JD037107, https://doi.org/10.1029/2022JD037107, 2023. a
Davidovits, P., Kolb, C. E., Williams, L. R., Jayne, J. T., and Worsnop, D. R.: Mass accommodation and chemical reactions at gas- liquid interfaces, Chem. Rev., 106, 1323–1354, 2006. a
Diehl, K., Debertshäuser, M., Eppers, O., Schmithüsen, H., Mitra, S. K., and Borrmann, S.: Particle surface area dependence of mineral dust in immersion freezing mode: investigations with freely suspended drops in an acoustic levitator and a vertical wind tunnel, Atmos. Chem. Phys., 14, 12343–12355, https://doi.org/10.5194/acp-14-12343-2014, 2014. a
Ervens, B.: Modeling the processing of aerosol and trace gases in clouds and fogs, Chem. Rev., 115, 4157–4198, 2015. a, b
Ervens, B., George, C., Williams, J. E., Buxton, G. V., Salmon, G. A., Bydder, M., Wilkinson, F., Dentener, F., Mirabel, P., Wolke, R., and Herrmann, H.: CAPRAM 2.4 (MODAC mechanism): An extended and condensed tropospheric aqueous phase mechanism and its application, J. Geophys. Res.-Atmos., 108, 4226–4247, 2003. a
Field, P. R., Lawson, R. P., Brown, P. R. A., Lloyd, G., Westbrook, C., Moisseev, D., Miltenberger, A., Nenes, A., Blyth, A., Choularton, T., Connolly, P., Buehl, J., Crosier, J., Cui, Z., Dearden, C., DeMott, P., Flossmann, A., Heymsfield, A., Huang, Y., Kalesse, H., Kanji, Z. A., Korolev, A., Kirchgaessner, A., Lasher-Trapp, S., Leisner, T., McFarquhar, G., Phillips, V., Stith, J., and Sullivan, S.: Secondary ice production: Current state of the science and recommendations for the future, Meteorol. Monogr., 58, 7–1, 2017. a
Gautam, M.: Retention During Freezing of Raindrops, Part I: Investigation of Single and Binary Mixtures, Zenodo [data set], https://doi.org/10.5281/zenodo.14319648, 2024. a, b
Haynes, W. M.: CRC handbook of chemistry and physics, CRC press, edited by: Haynes, W. M., https://doi.org/10.1201/9781315380476, 2016. a
Hodzic, A., Campuzano-Jost, P., Bian, H., Chin, M., Colarco, P. R., Day, D. A., Froyd, K. D., Heinold, B., Jo, D. S., Katich, J. M., Kodros, J. K., Nault, B. A., Pierce, J. R., Ray, E., Schacht, J., Schill, G. P., Schroder, J. C., Schwarz, J. P., Sueper, D. T., Tegen, I., Tilmes, S., Tsigaridis, K., Yu, P., and Jimenez, J. L.: Characterization of organic aerosol across the global remote troposphere: a comparison of ATom measurements and global chemistry models, Atmos. Chem. Phys., 20, 4607–4635, https://doi.org/10.5194/acp-20-4607-2020, 2020. a
Iribarne, J., Barrie, L., and Iribarne, A.: Effect of freezing on sulfur dioxide dissolved in supercooled droplets, Atmos. Environ., 17, 1047–1050, 1983. a
Iribarne, J., Pyshnov, T., and Naik, B.: The effect of freezing on the composition of supercooled droplets – II. Retention of S (IV), Atmos. Environ. A, 24, 389–398, 1990. a
Johnson, B. J., Betterton, E. A., and Craig, D.: Henry's law coefficients of formic and acetic acids, J. Atmos. Chem., 24, 113–119, 1996. a
Jost, A.: A Wind Tunnel Investigation on the Effects of Accretional Growth of Ice Hydrometeors: Implications on Microphysics and Organic Chemistry, Phd thesis, University of Mainz, Germany, 2017. a, b
Jost, A., Szakáll, M., Diehl, K., Mitra, S. K., and Borrmann, S.: Chemistry of riming: the retention of organic and inorganic atmospheric trace constituents, Atmos. Chem. Phys., 17, 9717–9732, https://doi.org/10.5194/acp-17-9717-2017, 2017. a, b, c, d, e, f, g, h, i, j, k, l, m, n, o, p, q, r, s, t
Kleinheins, J., Kiselev, A., Keinert, A., Kind, M., and Leisner, T.: Thermal imaging of freezing drizzle droplets: pressure release events as a source of secondary ice particles, J. Atmos. Sci., 78, 1703–1713, 2021. a
Kolb, C. E., Cox, R. A., Abbatt, J. P. D., Ammann, M., Davis, E. J., Donaldson, D. J., Garrett, B. C., George, C., Griffiths, P. T., Hanson, D. R., Kulmala, M., McFiggans, G., Pöschl, U., Riipinen, I., Rossi, M. J., Rudich, Y., Wagner, P. E., Winkler, P. M., Worsnop, D. R., and O' Dowd, C. D.: An overview of current issues in the uptake of atmospheric trace gases by aerosols and clouds, Atmos. Chem. Phys., 10, 10561–10605, https://doi.org/10.5194/acp-10-10561-2010, 2010. a
Korolev, A. and Leisner, T.: Review of experimental studies of secondary ice production, Atmos. Chem. Phys., 20, 11767–11797, https://doi.org/10.5194/acp-20-11767-2020, 2020. a
Lamb, D. and Blumenstein, R.: Measurement of the entrapment of sulfur dioxide by rime ice, Atmos. Environ., 21, 1765–1772, 1987. a
Lauber, A., Kiselev, A., Pander, T., Handmann, P., and Leisner, T.: Secondary ice formation during freezing of levitated droplets, J. Atmos. Sci., 75, 2815–2826, 2018. a
Lohmann, U. and Feichter, J.: Global indirect aerosol effects: a review, Atmos. Chem. Phys., 5, 715–737, https://doi.org/10.5194/acp-5-715-2005, 2005. a
Long, Y., Chaumerliac, N., Deguillaume, L., Leriche, M., and Champeau, F.: Effect of mixed-phase cloud on the chemical budget of trace gases: A modeling approach, Atmos. Res., 97, 540–554, 2010. a
Mari, C., Jacob, D. J., and Bechtold, P.: Transport and scavenging of soluble gases in a deep convective cloud, J. Geophys. Res.-Atmos., 105, 22255–22267, 2000. a
Martini, M., Allen, D. J., Pickering, K. E., Stenchikov, G. L., Richter, A., Hyer, E. J., and Loughner, C. P.: The impact of North American anthropogenic emissions and lightning on long-range transport of trace gases and their export from the continent during summers 2002 and 2004, J. Geophys. Res.-Atmos., 116, D07305, https://doi.org/10.1029/2010JD014305, 2011. a
Mitra, S. and Hannemann, A.: On the scavenging of SO 2 by large and small rain drops: V. A wind tunnel and theoretical study of the desorption of SO2 from water drops containing S (IV), J. Atmos. Chem., 16, 201–218, 1993. a
Pruppacher, H. R.: Some relations between the structure of the ice-solution interface and the free growth rate of ice crystals in supercooled aqueous solutions, J. Colloid Interf. Sci., 25, 285–294, 1967. a, b
Pruppacher, H. R. and Klett, J. D.: Microstructure of atmospheric clouds and precipitation, Microphysics of clouds and precipitation, Springer, Dordrecht, 10–73, https://doi.org/10.1007/978-0-306-48100-0_2, 2010. a, b
Ryu, Y.-H. and Min, S.-K.: Improving Wet and Dry Deposition of Aerosols in WRF-Chem: Updates to Below-Cloud Scavenging and Coarse-Particle Dry Deposition, J. Adv. Model. Earth Sy., 14, e2021MS002792, https://doi.org/10.1029/2021MS002792, 2022. a
Schwartz, S. E.: Mass-Transport Considerations Pertinent to Aqueous Phase Reactions of Gases in Liquid-Water Clouds, in: Chemistry of Multiphase Atmospheric Systems, edited by: Jaeschke, W., NATO ASI Series, vol 6, Springer, Berlin, Heidelberg, 415–471, https://doi.org/10.1007/978-3-642-70627-1_16, 1986. a
Scott, T. A.: Solid and liquid nitrogen, Phys. Repo., 27, 89–157, 1976. a
Seinfeld, J. H. and Pandis, S. N.: Atmospheric chemistry and physics: from air pollution to climate change, John Wiley & Sons, ISBN 9781118947401, 2016. a
Seymore, J., Gautam, M., Szakáll, M., Theis, A., Hoffmann, T., Ma, J., Zhou, L., and Vogel, A. L.: Retention during freezing of raindrops – Part 2: Investigation of ambient organics from Beijing urban aerosol samples, Atmos. Chem. Phys., 25, 11829–11845, https://doi.org/10.5194/acp-25-11829-2025, 2025. a
Shrivastava, M., Cappa, C. D., Fan, J., Goldstein, A. H., Guenther, A. B., Jimenez, J. L., Kuang, C., Laskin, A., Martin, S. T., Ng, N. L., Petäjä, T., Pierce, J. R., Rasch, P. J., Roldin, P., Seinfeld, J. H., Shilling, J., Smith, J. N., Thornton, J. A., Volkamer, R., Wang, J., Worsnop, D. R., Zaveri. R. A., Zelenyuk, A., and Zhang, Q.: Recent advances in understanding secondary organic aerosol: Implications for global climate forcing, Rev. Geophys., 55, 509–559, 2017. a
Snider, J. R. and Huang, J.: Factors influencing the retention of hydrogen peroxide and molecular oxygen in rime ice, J. Geophys. Res.-Atmos., 103, 1405–1415, 1998. a
Snider, J. R., Montague, D. C., and Vali, G.: Hydrogen peroxide retention in rime ice, J. Geophys. Res.-Atmos., 97, 7569–7578, 1992. a
Sporre, M. K., Blichner, S. M., Schrödner, R., Karset, I. H. H., Berntsen, T. K., van Noije, T., Bergman, T., O'Donnell, D., and Makkonen, R.: Large difference in aerosol radiative effects from BVOC-SOA treatment in three Earth system models, Atmos. Chem. Phys., 20, 8953–8973, https://doi.org/10.5194/acp-20-8953-2020, 2020. a
Stuart, A. L. and Jacobson, M.: A timescale investigation of volatile chemical retention during hydrometeor freezing: Nonrime freezing and dry growth riming without spreading, J. Geophys. Res.-Atmos., 108, 4178–4194, 2003. a, b, c, d
Stuart, A. L. and Jacobson, M.: Chemical retention during dry growth riming, J. Geophys. Res.-Atmos., 109, 305, https://doi.org/10.1029/2003JD004197, 2004. a, b, c
Stuart, A. L. and Jacobson, M.: A numerical model of the partitioning of trace chemical solutes during drop freezing, J. Atmos. Chem., 53, 13–42, 2006. a
Szakáll, M., Debertshäuser, M., Lackner, C. P., Mayer, A., Eppers, O., Diehl, K., Theis, A., Mitra, S. K., and Borrmann, S.: Comparative study on immersion freezing utilizing single-droplet levitation methods, Atmos. Chem. Phys., 21, 3289–3316, https://doi.org/10.5194/acp-21-3289-2021, 2021. a, b, c, d, e, f
Thibodeaux, L. J. and Mackay, D.: Handbook of chemical mass transport in the environment, CRC Press, ISBN 1420047566, 9781420047561, 2010. a
Tost, H., Lawrence, M. G., Brühl, C., Jöckel, P., The GABRIEL Team, and The SCOUT-O3-DARWIN/ACTIVE Team: Uncertainties in atmospheric chemistry modelling due to convection parameterisations and subsequent scavenging, Atmos. Chem. Phys., 10, 1931–1951, https://doi.org/10.5194/acp-10-1931-2010, 2010. a
Tremp, J., Mattrel, P., Fingler, S., and Giger, W.: Phenols and nitrophenols as tropospheric pollutants: emissions from automobile exhausts and phase transfer in the atmosphere, Water Air Soil Pollut., 68, 113–123, 1993. a
Tsigaridis, K., Daskalakis, N., Kanakidou, M., Adams, P. J., Artaxo, P., Bahadur, R., Balkanski, Y., Bauer, S. E., Bellouin, N., Benedetti, A., Bergman, T., Berntsen, T. K., Beukes, J. P., Bian, H., Carslaw, K. S., Chin, M., Curci, G., Diehl, T., Easter, R. C., Ghan, S. J., Gong, S. L., Hodzic, A., Hoyle, C. R., Iversen, T., Jathar, S., Jimenez, J. L., Kaiser, J. W., Kirkevåg, A., Koch, D., Kokkola, H., Lee, Y. H., Lin, G., Liu, X., Luo, G., Ma, X., Mann, G. W., Mihalopoulos, N., Morcrette, J.-J., Müller, J.-F., Myhre, G., Myriokefalitakis, S., Ng, N. L., O'Donnell, D., Penner, J. E., Pozzoli, L., Pringle, K. J., Russell, L. M., Schulz, M., Sciare, J., Seland, Ø., Shindell, D. T., Sillman, S., Skeie, R. B., Spracklen, D., Stavrakou, T., Steenrod, S. D., Takemura, T., Tiitta, P., Tilmes, S., Tost, H., van Noije, T., van Zyl, P. G., von Salzen, K., Yu, F., Wang, Z., Wang, Z., Zaveri, R. A., Zhang, H., Zhang, K., Zhang, Q., and Zhang, X.: The AeroCom evaluation and intercomparison of organic aerosol in global models, Atmos. Chem. Phys., 14, 10845–10895, https://doi.org/10.5194/acp-14-10845-2014, 2014. a
von Blohn, N., Diehl, K., Mitra, S. K., and Borrmann, S.: Wind tunnel experiments on the retention of trace gases during riming: nitric acid, hydrochloric acid, and hydrogen peroxide, Atmos. Chem. Phys., 11, 11569–11579, https://doi.org/10.5194/acp-11-11569-2011, 2011. a, b, c, d, e, f, g
von Blohn, N., Diehl, K., Nölscher, A., Jost, A., Mitra, S. K., and Borrmann, S.: The retention of ammonia and sulfur dioxide during riming of ice particles and dendritic snow flakes: laboratory experiments in the Mainz vertical wind tunnel, J. Atmos. Chem., 70, 131–150, 2013. a, b, c
Wang, J., Krejci, R., Giangrande, S., Kuang, C., Barbosa, H. M., Brito, J., Carbone, S., Chi, X., Comstock, J., Ditas, F., Lavric, J., Manninen, H. E., Mei, F., Zuloaga, D. M., Pöhlker, C., Pöhlker, M. L., Saturno, J., Schmid, B., Souza, R. A. F., Springston. S. R., Tomlinson, J. M., Toto, T., Walter, D., Wimmer, D., Smith, J. N., Kulmala, M., Machado, L. A. T., Artaxo, P., Andreae, M. O., Petäjä, T., and Martin, S. T.: Amazon boundary layer aerosol concentration sustained by vertical transport during rainfall, Nature, 539, 416–419, 2016. a
Warneck, P.: Chemistry of the natural atmosphere, vol. 71, Elsevier, ISBN 0080529062, 9780080529066, 1999. a
Warneck, P. and Williams, J.: The atmospheric chemist's companion: Numerical data for use in the atmospheric sciences, Springer, ISBN 9789400722743, 2012. a
Williamson, C. J., Kupc, A., Axisa, D., Bilsback, K. R., Bui, T., Campuzano-Jost, P., Dollner, M., Froyd, K. D., Hodshire, A. L., Jimenez, J. L. and Kodros, J. K., Luo, G., Murphy, D. M., Nault, B. A., Ray, E. A., Weinzierl, B., Wilson, J. C., Yu, F., Yu, P., Pierce, J. R., and Brock, C. A.: A large source of cloud condensation nuclei from new particle formation in the tropics, Nature, 574, 399–403, 2019. a