the Creative Commons Attribution 4.0 License.
the Creative Commons Attribution 4.0 License.
 | 19 Apr 2024
First evaluation of the GEMS formaldehyde product against TROPOMI and ground-based column measurements during the in-orbit test period
Gitaek T. Lee
Eunjo S. Ha
Sieun D. Lee
Seunga Shin
Myoung-Hwan Ahn
Mina Kang
Yong-Sang Choi
Gyuyeon Kim
Dong-Won Lee
Deok-Rae Kim
Hyunkee Hong
Bavo Langerock
Corinne Vigouroux
Christophe Lerot
Francois Hendrick
Gaia Pinardi
Isabelle De Smedt
Michel Van Roozendael
Pucai Wang
Heesung Chong
Yeseul Cho
Jhoon Kim
The Geostationary Environment Monitoring Spectrometer (GEMS) on board GEO-KOMPSAT-2B was launched in February 2020 and has been monitoring atmospheric chemical compositions over Asia. We present the first evaluation of the operational GEMS formaldehyde (HCHO) vertical column densities (VCDs) during and after the in-orbit test (IOT) period (August–October 2020) by comparing them with the products from the TROPOspheric Monitoring Instrument (TROPOMI) and Fourier-transform infrared (FTIR) and multi-axis differential optical absorption spectroscopy (MAX-DOAS) instruments. During the IOT, the GEMS HCHO VCDs reproduced the observed spatial pattern of TROPOMI VCDs over the entire domain (r= 0.62) with high biases (10 %–16 %). We found that the agreement between GEMS and TROPOMI was substantially higher in Northeast Asia (r= 0.90), encompassing the Korean Peninsula and east China. GEMS HCHO VCDs captured the seasonal variation in HCHO, primarily driven by biogenic emissions and photochemical activities, but showed larger variations than those of TROPOMI over coastal regions (Kuala Lumpur, Singapore, Shanghai, and Busan). In addition, GEMS HCHO VCDs showed consistent hourly variations with MAX-DOAS (r= 0.77) and FTIR (r= 0.86) but were 30–40 % lower than ground-based observations. Different vertical sensitivities of GEMS and ground-based instruments caused these biases. Utilizing the averaging kernel smoothing method reduces the low biases by approximately 10 % to 15 % (normalized mean bias (NMB): −47.4 % to −31.5 % and −38.6 % to −26.7 % for MAX-DOAS and FTIR, respectively). The remaining discrepancies are due to multiple factors, including spatial collocation and different instrumental sensitivities, requiring further investigation using inter-comparable datasets.
- Article
(4339 KB) - Full-text XML
-
Supplement
(1623 KB) - BibTeX
- EndNote


Non-methane volatile organic compounds (NMVOCs) are precursors of surface ozone (O3), a harmful pollutant that affects the human respiratory system (Shrubsole et al., 2019) and the photosynthetic activities of plants (Matyssek and Sandermann, 2003). NMVOCs also play a critical role in the formation of secondary organic aerosols (DiGangi et al., 2012). They are emitted from both anthropogenic and biogenic sources (Vrekoussis et al., 2010). The latter are more significant globally but are associated with significant uncertainty in a priori emission estimates (424–591 Tg C yr−1) (Abbot et al., 2003; Palmer et al., 2001; Sindelarova et al., 2022). Previous studies (Cao et al., 2018; Choi et al., 2022; Palmer et al., 2003) have attempted to reduce this uncertainty using observational constraints, including satellite-derived vertical column densities (VCDs) of formaldehyde (HCHO), which is produced by the oxidation of NMVOCs and used as a proxy for NMVOCs.
Since the Global Ozone Monitoring Experiment (GOME) launched in 1995 (Chance et al., 2000), HCHO has been observed globally by sun-synchronous low-earth-orbit (LEO) satellites. The SCanning Imaging Absorption spectroMeter for Atmospheric CHartographY (SCIAMACHY), launched in 2002, measured HCHO VCDs with a 60 km ×30 km spatial resolution at the nadir for 2002–2012 (Wittrock et al., 2006). Observations from these satellites have provided global and regional distributions of HCHO VCDs and have been effectively used to constrain NMVOC emissions in biogenic-source-dominant regions worldwide (Stavrakou et al., 2009). However, the spatial resolution of these satellites is too coarse to detect local pollution plumes.
Subsequent LEO satellites, including the Ozone Monitoring Instrument (OMI), TROPOspheric Monitoring Instrument (TROPOMI), Global Ozone Monitoring Experiment 2A (GOME-2A), and Ozone Mapping and Profiler Suite (OMPS) nadir mapper, have substantially finer spatial resolutions (approximately 5.5 km × 3.5 km to 80 km × 40 km), enabling the observation of local pollution plumes and the provision of observational constraints for biogenic and anthropogenic sources globally (Veefkind et al., 2012; De Smedt et al., 2015, 2021; Li et al., 2015; González Abad et al., 2016; Levelt et al., 2018; Nowlan et al., 2023; Kwon et al., 2023). Moreover, De Smedt et al. (2015) examined the diurnal characteristics of global HCHO VCDs from GOME-2 and OMI with different overpass times (GOME-2 09:30 and OMI 13:30, local time), showing that afternoon HCHO VCDs are higher than in the morning over most regions, with exceptions in the tropical rainforest. However, limited by the overpass time, these LEO satellites provide observations at most once daily, which can be significantly compromised by the presence of clouds, especially in East Asia.
In East Asia, anthropogenic NMVOC emissions are also highly uncertain, causing significant errors in chemical transport models (Park et al., 2021). Cao et al. (2018) used satellite HCHO products from GOME-2A and OMI with an inverse modeling technique to estimate “top-down” anthropogenic VOC (AVOC) emissions in China. Recently, Choi et al. (2022) showed a large underestimation of VOC emissions (29 %–115 %) in the anthropogenic emission inventory in East Asia using top-down inversion with OMI and OMPS HCHO VCDs. Kwon et al. (2021) estimated top-down AVOC emissions using aircraft HCHO vertical column observations during the Republic of Korea–USA cooperative air quality campaign; they demonstrated the efficacy of remote-sensing HCHO VCD observations in estimating AVOC emissions in polluted urban areas. However, previous studies based on LEO satellites or aircraft observation products did not consider the continuous daytime variability in HCHO VCDs in emission estimates, suggesting the necessity of deploying a geostationary satellite over East Asia.
The Geostationary Environment Monitoring Spectrometer (GEMS), launched on 19 February 2020 by the Republic of Korea Ministry of Environment, has begun hourly observations of trace gases, such as nitrogen dioxide (NO2), sulfur dioxide (SO2), O3, HCHO, and glyoxal (CHOCHO), and aerosols with 3.5 km × 8 km pixels or co-added pixels (2 × 2 or 4 × 4) over Seoul, the Republic of Korea (Kim et al., 2020). Kwon et al. (2019) developed the GEMS HCHO retrieval algorithm and evaluated its performance before launch using OMI Level-1B data. In this study, we describe several updates implemented in the operational GEMS HCHO retrieval algorithm and present its evaluation results by comparing GEMS HCHO VCDs with TROPOMI products and ground-based observations, including from multi-axis differential optical absorption spectroscopy (MAX-DOAS) and Fourier-transform infrared (FTIR) instruments, during and after the in-orbit test (IOT) period (August–October 2020). We also perform sensitivity tests of the GEMS HCHO on the input parameters to improve the precision of the retrieved column.
GEMS is located at 128.25° E and conducts hourly observations for Asia (5° S–45° N, 75–145° E). The spectral range of GEMS covers 300–500 nm, with a spectral resolution of 0.6 nm and a wavelength interval of 0.2 nm. The spatial resolution of GEMS is 3.5 km × 8 km for NO2, O3, HCHO, and aerosols at Seoul, and relatively weak absorbers, including SO2 and CHOCHO, use 2 × 2 or 4 × 4 co-added pixels (7 km × 16 km and 14 km × 32 km, respectively) to increase the signal-to-noise ratio. As a weak absorber in the UV spectral region, HCHO can be retrieved from 2 × 2 or 4 × 4 co-added pixels. However, to reduce the representation error and discern heterogeneous plumes, HCHO is retrieved from the original spatial resolution (Souri et al., 2023; Kwon et al., 2023). Detailed information about the GEMS instrument is available in Kim et al. (2020).
Kwon et al. (2019) described the GEMS HCHO retrieval algorithm (v0.3), which consists of three steps: pre-processing, spectral fitting, and post-processing. Pre-processing includes the calibration of radiances and irradiances from Level-1C data and the convolution of absorption cross-sections. Spectral fitting derives the slant column densities (SCDs) using the basic optical absorption spectroscopy algorithm (Chance, 1998), a non-linearized fitting method, to solve the Lambert–Beer equation. Finally, post-processing performs background corrections using model columns from unpolluted clear areas and converts from SCD to VCD by applying an air mass factor (AMF) (Palmer et al., 2001). In this study, we briefly describe several updates in the retrieval algorithm compared to that of Kwon et al. (2019).
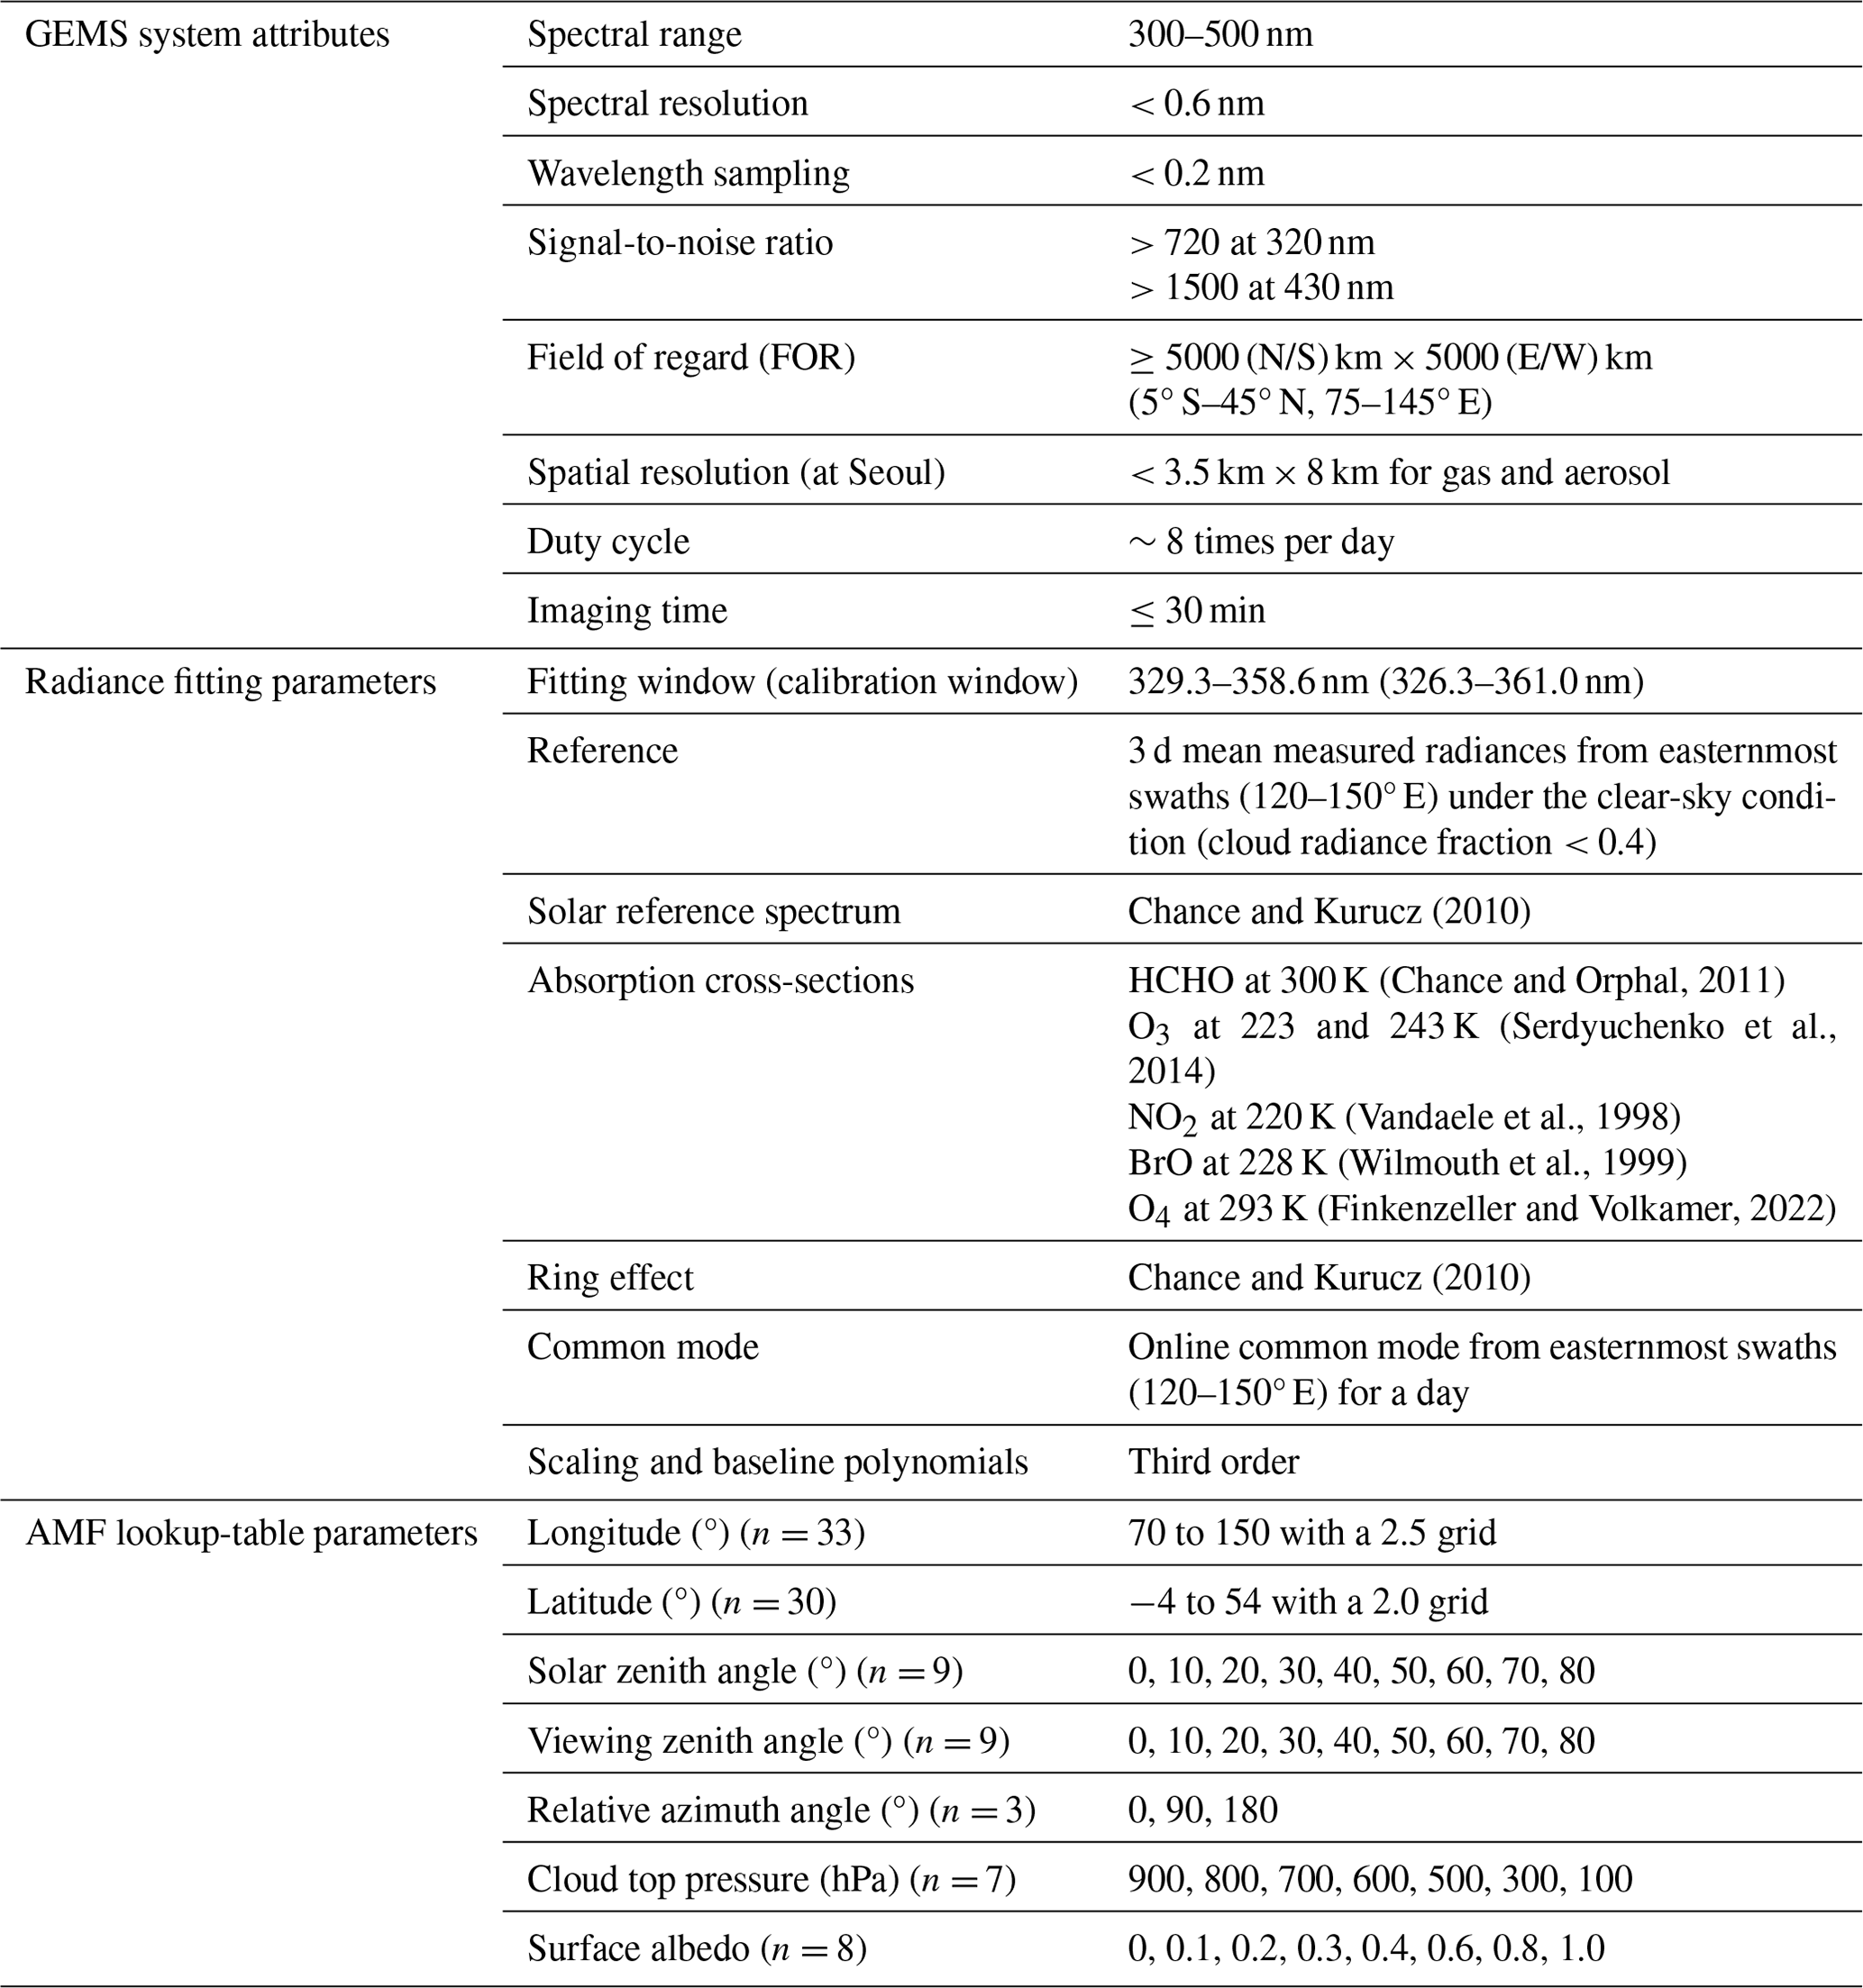
We updated the absorption cross-sections and fitting window for GEMS HCHO retrieval, as shown in Table 1, based on the sensitivity tests discussed in Sect. 3. The operational retrieval uses the fitting window of 329.3–358.6 nm, which is within the ranges of 328.5–346.0 nm (De Smedt et al., 2008, 2012, 2015) and 328.5–359.0 nm (De Smedt et al., 2018) used for GOME-2 and TROPOMI, respectively. Variables of the GEMS HCHO Level-2 product are listed in Table S1 in the Supplement.
Table 1Summary of operational GEMS algorithm attributes, parameters for radiance fitting, and parameters for the air mass factor (AMF) lookup table based on Kwon et al. (2019) except for the absorption cross-section, fitting window, and reference spectrum sector.
In spectral fitting, the measured radiances over clean background regions, referred to as radiance references, can be used instead of the solar irradiance. The use of a radiance reference minimizes ozone and bromine monoxide interference in the stratosphere (Kwon et al., 2019). Radiance references sampled from the Pacific Ocean have been used for the LEO satellites (De Smedt et al., 2008, 2021; González Abad et al., 2015, 2016). In the case of GEMS, a radiance reference is computed by averaging the measured radiances from the clean pixels, primarily consisting of ocean pixels, from the easternmost part within its domain as a function of cross tracks (north–south direction), and this is used as the default option for spectral fitting with an alternative option using irradiance references. In Sect. 3, we discuss the sensitivity of the retrieval to regions sampled for radiance references and compare the operational products with those using irradiance references.
When using radiance references, we should add the HCHO background concentrations included in the measured radiances, which is called a background correction. Background correction adds slant columns simulated by a chemical transport model to the reference sector to retrieve the slant columns as a function of latitude. Using Eq. (1), which is described in Kwon et al. (2019), background correction was conducted using the model VCDs (VCDCTM) and the satellite-derived AMFs (AMF0) at a given latitude, resulting in a corrected SCD (SCDcorr) at each cross-track i and along-track j.
For GEMS HCHO, GEOS-Chem simulations with a 0.25° × 0.3125° spatial resolution provided the zonal-mean HCHO VCDs over the radiance reference sector. Next, the model HCHO VCDs were converted to SCDs by multiplying them with the pre-calculated zonal-mean AMFs.
During the IOT, GEMS scanning plans were changed from a fixed scan area to varying scan areas from east to west to obtain additional observations in the western areas, including India. Therefore, GEMS cannot obtain sufficient clean pixels from the Pacific Ocean on an hourly basis. We widened the sampling region for the radiance reference from 143–150° E (Kwon et al., 2019) to 120–150° E (Supplement Fig. S1). The new reference sector partially includes polluted areas in east China, the Republic of Korea, and Japan, which can affect the background contributions to the VCD. The simulated background VCDs of the new reference sector exhibited 30 % higher values on average (Fig. S2). In Sect. 4, we examine the impact of the changed reference sector on the background correction.
High-reflectance conditions, such as thick clouds, can affect radiance references owing to the different magnitudes of radiances compared with typical background conditions. Clear-sky pixels with minimal clouds (cloud radiance fraction < 0.4) were selected. Figure 1 compares the radiance references with (Fig. 1a) and without (Fig. 1b) cloud masking. Radiance references sampled in the minimal-cloud condition showed fewer artifacts with exceptionally high radiances (approximately 230 W cm−2 cm−1 sr−1) along latitudes and wavelengths, implying the better quality of the reference spectra. However, despite its extended reference sector in operation, the GEMS HCHO has often failed to reserve sufficient clean radiance pixels from the reference sector under cloudy conditions, resulting in a few missing tracks. We used mean radiance references from the previous 2 d of observations to fill in the missing latitudinal points in the reference spectra. Because the observed light path varies significantly with the solar zenith angle (SZA), we used radiance references at the same observation time. As shown in Fig. 1c, running-mean radiance references efficiently recovered the missing tracks, presenting consistent spatial and spectral distributions, as shown in Fig. 1a. Consequently, the use of the updated radiance references resulted in 10 %–40 % smaller differential SCDs (dSCDs) compared to those using radiance references without cloud masking over the entire scan domain.

Figure 1Latitudinally averaged radiance references of GEMS (03:45 UTC (12:45 KST), 6 December 2020): with cloud masking (cloud radiance fraction > 0.4) (a), without cloud masking (b), and with cloud masking with 3 d mean radiances (c). The shading denotes radiance spectra. The radiance spectra in the 1233–1241 cross tracks have bad Level-1C quality flags.
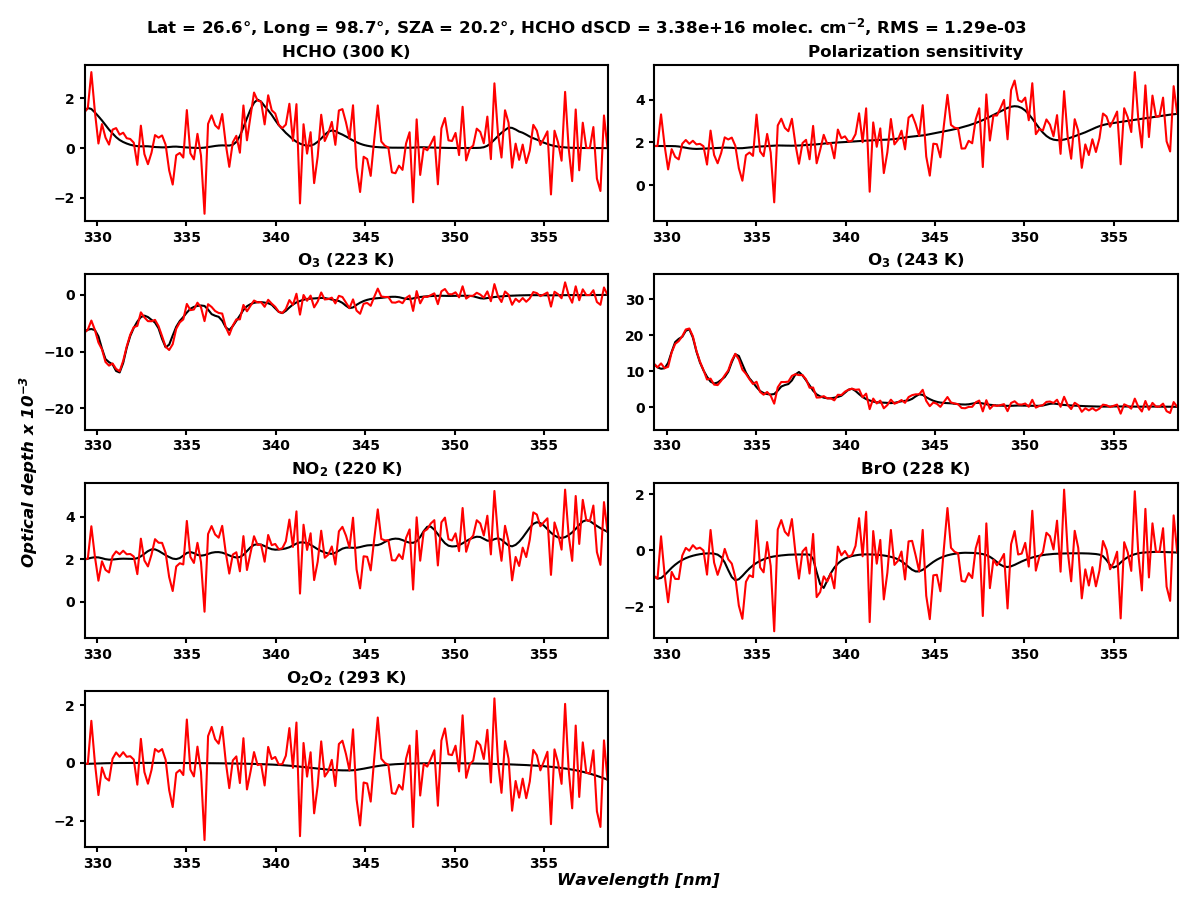
Figure 2Fitted optical depths (solid black line) and optical depths plus the fitting residuals (solid red line) of the operational GEMS HCHO retrieval algorithm in northern Myanmar at 12:45 KST (03:45 UTC), 3 August 2020.
Figure 2 shows the fitted optical depths as a function of the wavelength for a specific pixel in northern Myanmar at 12:45 Korea standard time (KST) on 3 August 2020. The solid black line represents the fitted optical depth of the chemical species, and the solid red line represents the optical depth along with the fitting residuals. In the case of the uncertainty in the fitted slant columns, we estimated the uncertainty due to random noise in the operational Level-1C radiances. The averaged random uncertainty and its fitting root mean square (rms) of GEMS radiances at 12:45 KST on 3 August 2020 were 8.9 × 10¹⁵ molecules cm−2 and 1.1 × 10⁻³, which are comparable with the synthetic radiances (random uncertainty: 9.1 × 10¹⁵ molecules cm−2; rms: 1.2 × 10⁻³) and OMI Level-1B data (random uncertainty: 1.1 × 10¹⁶ molecules cm−2; rms: 1.2 × 10⁻³) computed by Kwon et al. (2019). The random uncertainty in GEMS HCHO retrieval was also consistent with that in TROPOMI (6.0 × 10¹⁵ molecules cm−2) (De Smedt et al., 2021). GEMS also showed high residuals (approximately 1.5 × 10⁻³) and uncertainties (approximately 1.0 × 10¹⁶ molecules cm−2) under high SZAs, rendering the spectral fitting more uncertain.
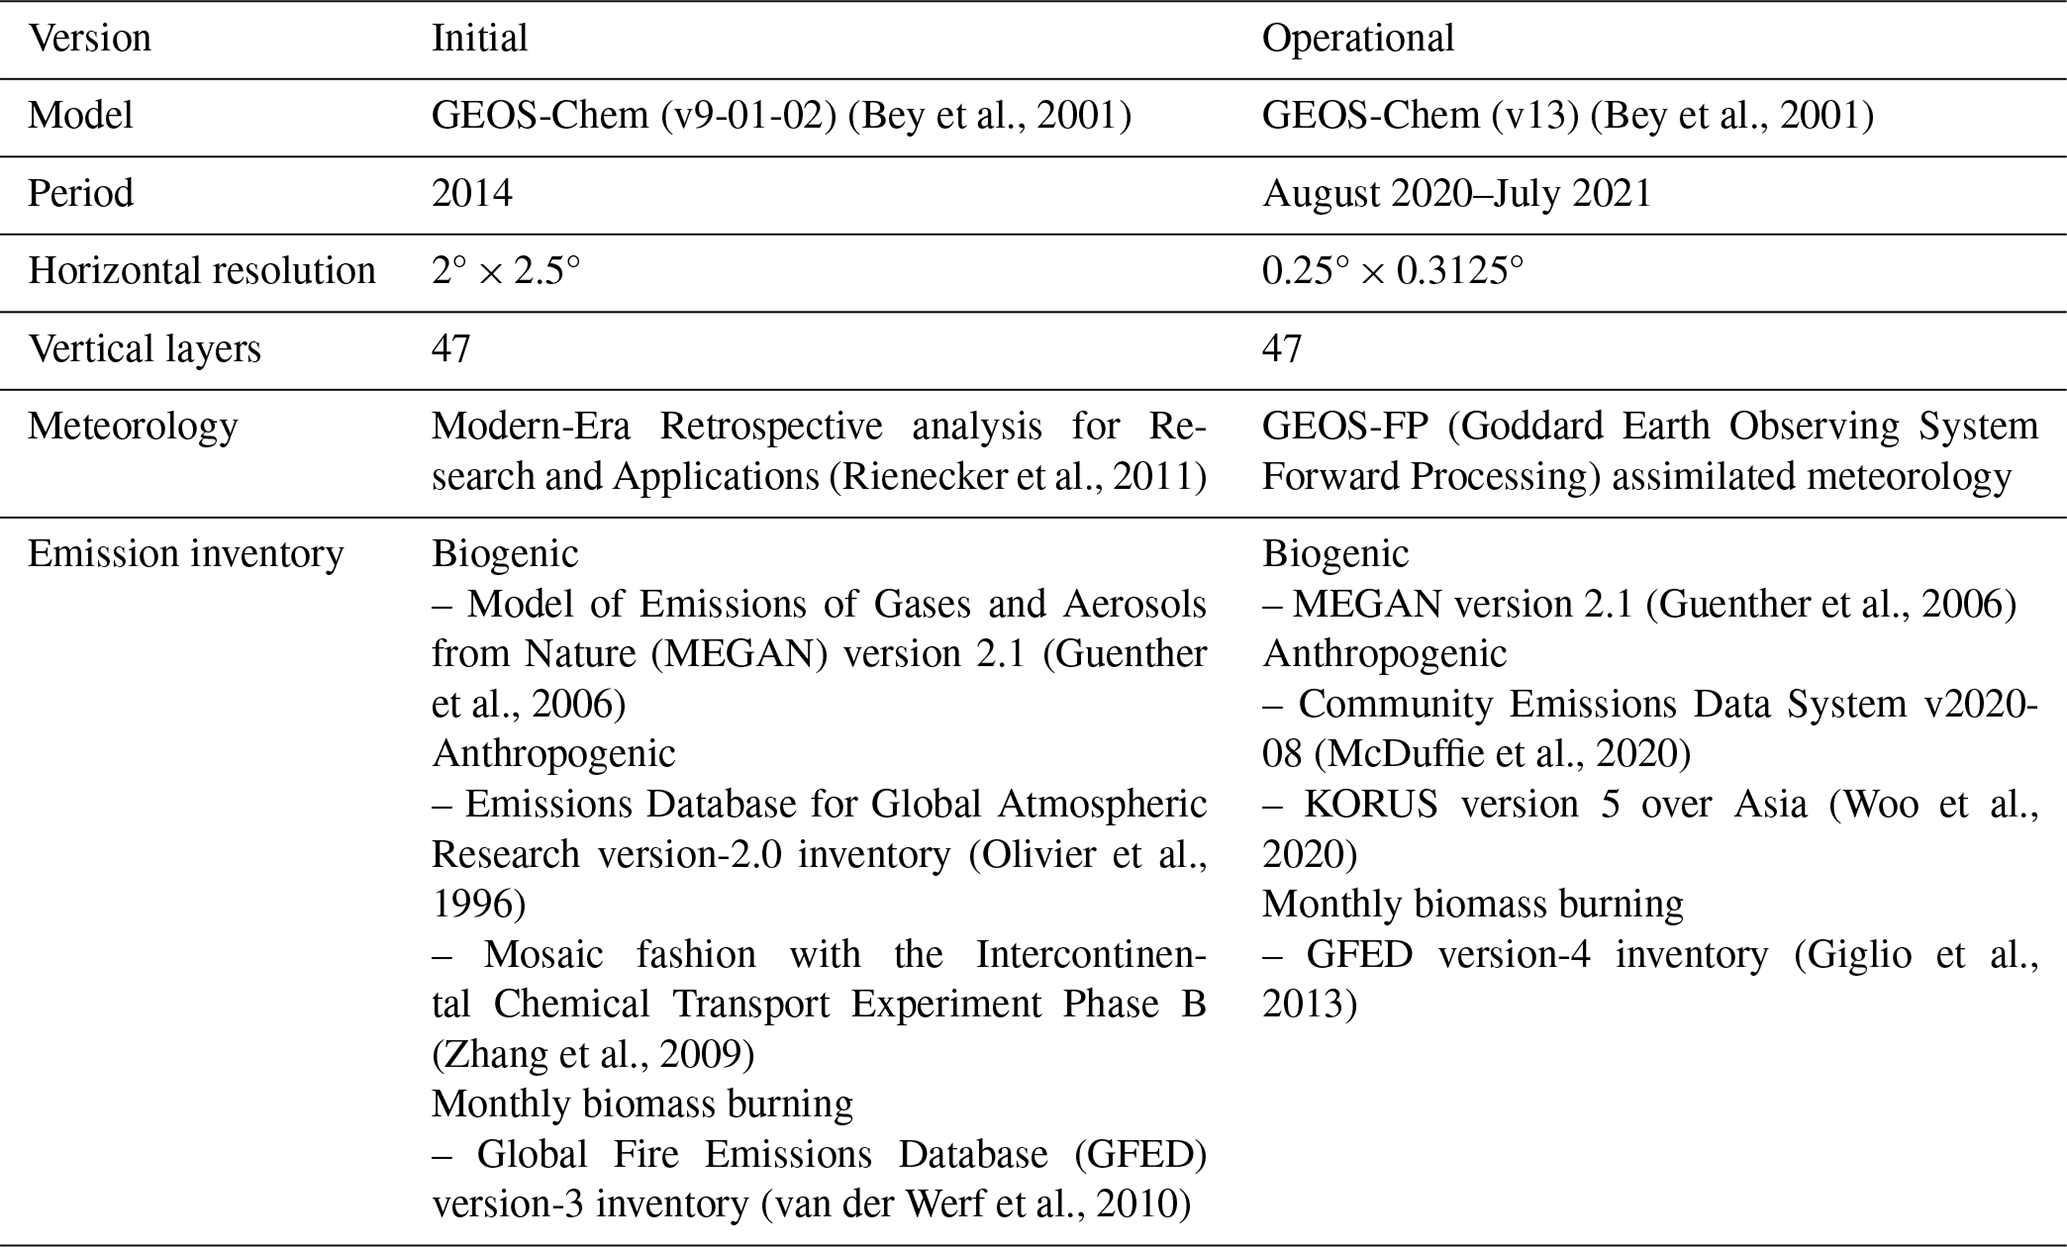
Kwon et al. (2019) employed a lookup-table approach to efficiently calculate AMFs to convert the fitted SCDs to VCDs. The AMF lookup table of Kwon et al. (2019) consists of pre-calculated scattering weights based on monthly-mean trace gas (O3, NO2, SO2, and HCHO) and temperature profiles simulated from GEOS-Chem, with a spatial resolution of 2° × 2.5°, and vertical shape factors calculated from identical a priori profiles. In this study, we only updated the vertical shape factors from the new monthly-mean hourly a priori profiles simulated by GEOS-Chem with a substantially finer spatial resolution of 0.25° × 0.3125° and up-to-date anthropogenic and biomass burning emission inventories in Asia (Table 2). We compared the two discrete AMFs derived from the initial and operational algorithms to evaluate the impact of the updated a priori profiles (Fig. 3a and b, respectively). The absolute differences in Fig. 3c present decreased AMFs over Southeast Asian megacities, which increased their VCDs, and the opposite behaviors over the ocean pixels above 5° N. Disparities between the two AMFs are primarily due to the updates of anthropogenic emission inventories pertaining to metropolitan cities and biomass burning occurrences in East Asia. In addition, the fine spatial resolution of the new a priori profile better separates ocean pixels in the AMF calculation, resulting in high AMFs and, ultimately, low VCDs over coastal areas such as Borneo and Hanoi.
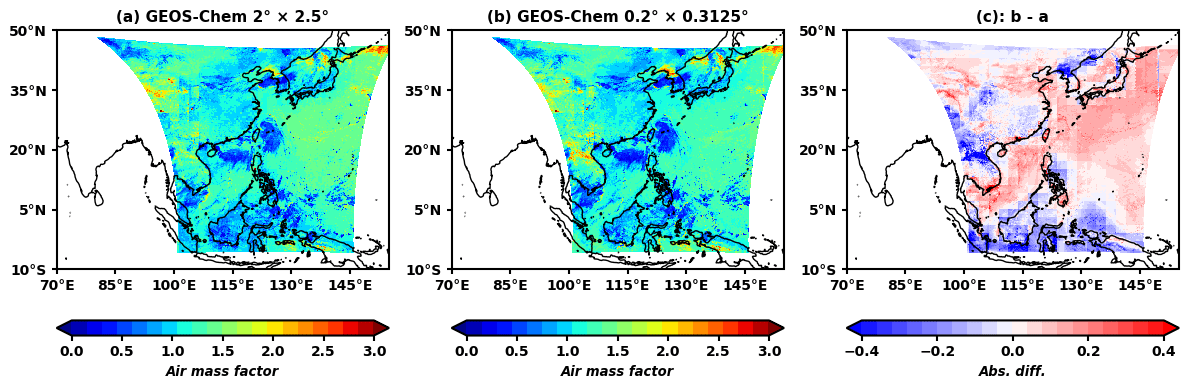
Figure 3GEMS HCHO air mass factor (3 August 2020, 12:45 KST (03:45 UTC)): (a) the GEMS algorithm with the initial a priori profile, (b) GEMS with the updated a priori profile, and (c) the absolute differences of (b) minus (a).
Table 2Summary of the input options of a priori profiles for the GEMS HCHO algorithm.
This section presents several sensitivity tests of the GEMS HCHO retrieval for key input parameters, including the polarization correction, fitting window, and irradiance reference. Unlike TROPOMI and OMI, GEMS is not equipped with a polarization scrambler. The observed radiances can be sensitive to polarization, especially at the wavelengths of HCHO absorption (Choi et al., 2021; Kotchenova et al., 2006; Choi et al., 2024). Therefore, a polarization correction should be applied to the retrieval algorithm. We considered the polarization sensitivity vectors of the instrument as an additional absorption cross-section, termed a pseudo-absorber, in the spectral fitting. The polarization sensitivity values shown in Fig. 4 were measured before the launch of the GEMS instrument and provided a single spectrum for the central part of the charge-coupled device (Choi et al., 2024).

Figure 4Polarization sensitivity vector of the GEMS instrument (shaded area: fitting window of the GEMS HCHO).

Figure 5Average time dependence of GEMS HCHO dSCDs (a) with and (b) without polarization correction and (c) their absolute differences (a minus b) during the IOT (August–October 2020).
Figure 5 shows the monthly-mean hourly GEMS HCHO dSCDs with and without polarization correction during the IOT. High dSCDs (> 1.2 × 10¹⁶ molecules cm−2) occurred west of the tropics without polarization correction, especially in the late afternoon (15:45 KST) (Fig. 5b). After applying polarization correction, these high values were eliminated, as shown in Fig. 5a, with slightly increased columns over Northeast Asia. In addition, the absolute differences (Fig. 5c) induced by polarization correction resulted in an approximately 30 % variation in HCHO dSCDs from the east to the west edge of the scan domain. These spatial patterns can occur because of the geometric dependency of the polarization vectors, as previously described by Choi et al. (2021). Polarization correction can also affect the sensitivity of the fitting window to the retrieved slant columns because it is not linearly considered in the spectral fitting. We evaluated the fitting window of the GEMS HCHO in the next step to determine the retrieval sensitivity of the algorithm under polarization correction.
To determine an optimized fitting window, we conducted a sensitivity test on the retrieved HCHO dSCDs with polarization correction by varying the lower limit of the fitting window from 327 to 329.5 nm and the upper limit from 354 to 360 nm with the wavelength interval of 0.2 nm over the reference sector (120–150° E). Theoretically, retrieved dSCDs over the reference sector should be zero. We selected the fitting window of 329.3–358.6 nm for the GEMS HCHO operational retrieval based on the dSCDs closest to zero, lowest fitting residuals, and lowest fitting uncertainty (Fig. 6). As shown in Fig. 6a, negative values of the mean dSCDs over the reference sector were observed over the entire fitting window, except for the upper limits at 358.5–359.5 nm. Based on the low rms of the fitting residuals and fitting uncertainty shown in Fig. 6b and c, we selected the fitting window of 329.3–358.6 nm for the GEMS HCHO operational retrieval. Figure 7 compares the retrieved HCHO dSCDs under the pre-launch and optimized fitting windows at 13:45 KST (04:45 UTC) on 2 September 2020. HCHO dSCDs using an optimized fitting window (Fig. 7a) presented 10 %–30 % higher values than those of the pre-launch fitting window (Fig. 7b) but showed consistent spatial correlations (r= 0.95) and good representations of local emissions over east China and the Korean Peninsula.

Figure 6HCHO dSCDs over the reference sector (120–150° E) (a), fitting rms (b), and column uncertainty (c) retrieved from GEMS for 2 September 2020. All pixels satisfy the clear-sky condition (cloud radiance fraction < 0.4) and the “good” main data quality flag. The optimum fitting window is shown in the solid black rectangle.
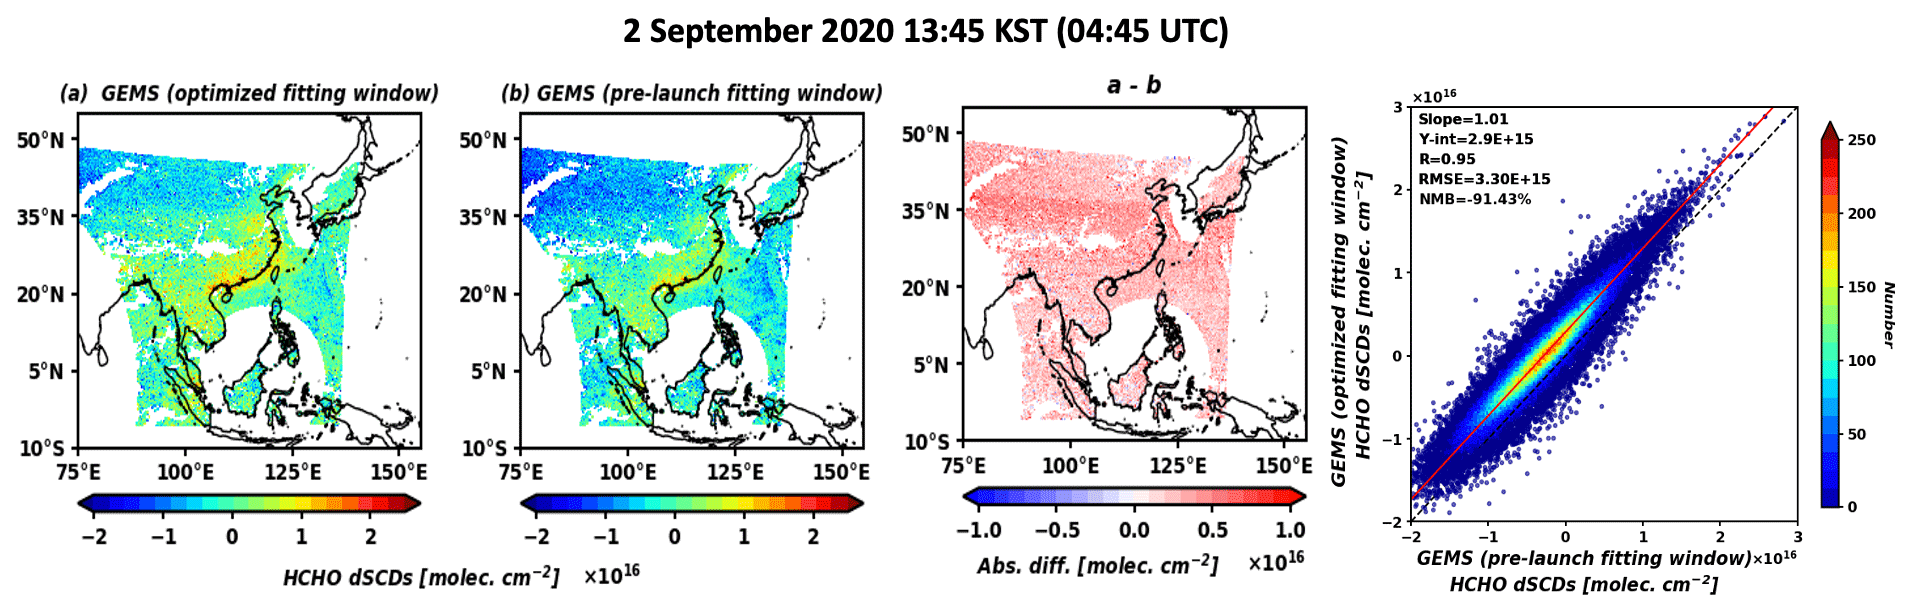
Figure 7Mean dSCDs from the GEMS HCHO algorithm with the optimized (a) and pre-launch fitting windows (b) for 13:45 KST (04:45 UTC) on 2 September 2020, with their absolute differences (a minus b) and scatterplot.
We conducted a sensitivity test for the GEMS HCHO retrieval using solar irradiance as the reference spectrum. The use of irradiance for trace gas retrieval often causes stripe patterns owing to the cross-track-dependent factors including the diffuser, dark current, and noise along the scan tracks for the satellite (Chan Miller et al., 2014). We performed a de-striping process (Lerot et al., 2021) by subtracting the median values of each cross track. Figure 8 compares the GEMS HCHO SCDs retrieved using the irradiance and dSCDs in radiance references during the IOT. HCHO SCDs using irradiance spectra were in good agreement (r= 0.97) with those using radiance references but were 20 %–50 % higher on the west side of the scan domain (< 100° E). In addition, HCHO products using the irradiance reference showed 10 %–50 % higher fitting rms (approximately 2.5 × 10⁻³) and random uncertainties (approximately 8 × 10¹⁵ molecules cm−2) than those using the radiance reference. The elevated fitting rms and uncertainties in the irradiance reference retrieval could be due to the unaccounted-for spectral signals in the spectral fitting process, which were addressed when employing the radiance reference. Based on the lower fitting rms and uncertainties, a radiance reference was used as the reference spectrum in the operational retrieval. However, as discussed in Sect. 4.1, the reference sector, including the polluted regions, can make a small contribution from the retrieved slant columns to the total column in certain regions. Future studies should investigate the possibility of using irradiance and update the reference sector to minimize the inclusion of polluted regions.
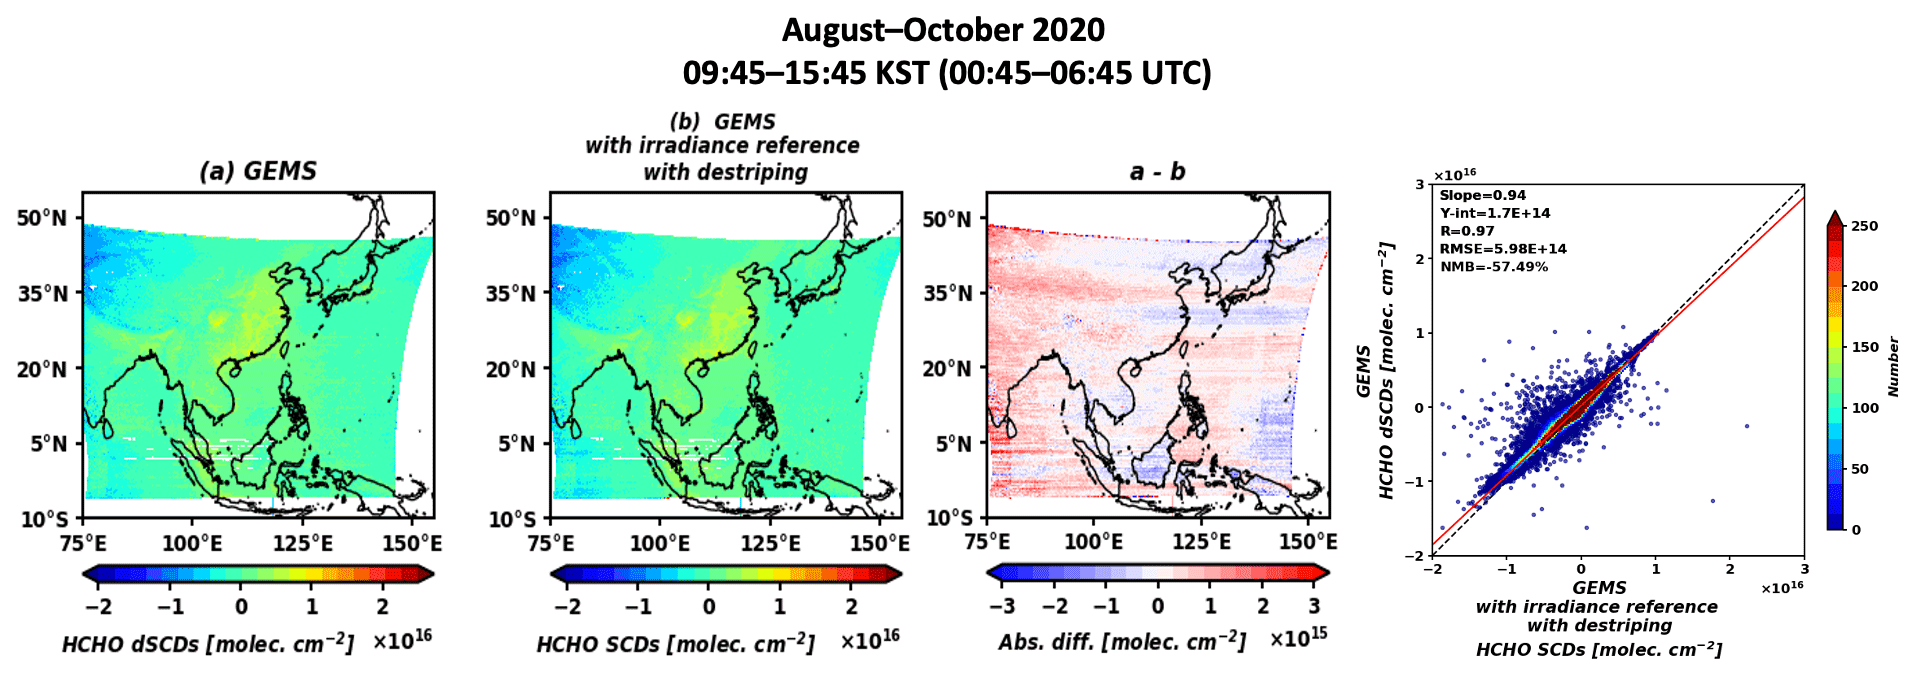
Figure 8Mean HCHO slant columns from GEMS using measured radiance references (a) and irradiance with de-striping (b) for 09:45–15:45 KST (00:45–06:45 UTC) during the IOT (August–October 2020), with their absolute differences (a minus b) and scatterplot.
4.1 Comparison with TROPOMI
In this section, we compare the GEMS HCHO VCDs with those from TROPOMI, which have a similar spatial resolution (5.5 km × 3.5 km). We filtered out unqualified values of TROPOMI HCHO VCDs using the “quality assurance” (QA) variable (QA < 0.5), which is a recommended limit determined from observation conditions and other retrieval flags. For GEMS, we used the operational Level-2 HCHO product (version 2.0) and selected pixels in a “good” quality flag (FinalAlgorithmFlags = 0), which filters out pixels with high fitting residuals using median absolute deviations (MADs) derived from the fitting rms in a scan domain (fitting rms < median (fitting rms) + 3 × MAD (fitting rms)). In addition, pixels with cloud radiance fractions less than 0.4 and low geometric angles (SZA < 70° and viewing zenith angle (VZA) < 70°) were used for the validation. GEMS pixels were temporally collocated using the TROPOMI observation time within a ±15 min time window.
Subsequently, the GEMS and TROPOMI data were re-gridded using an area-weighted mean with a spatial resolution of 0.1° × 0.1° to create a comparable dataset.
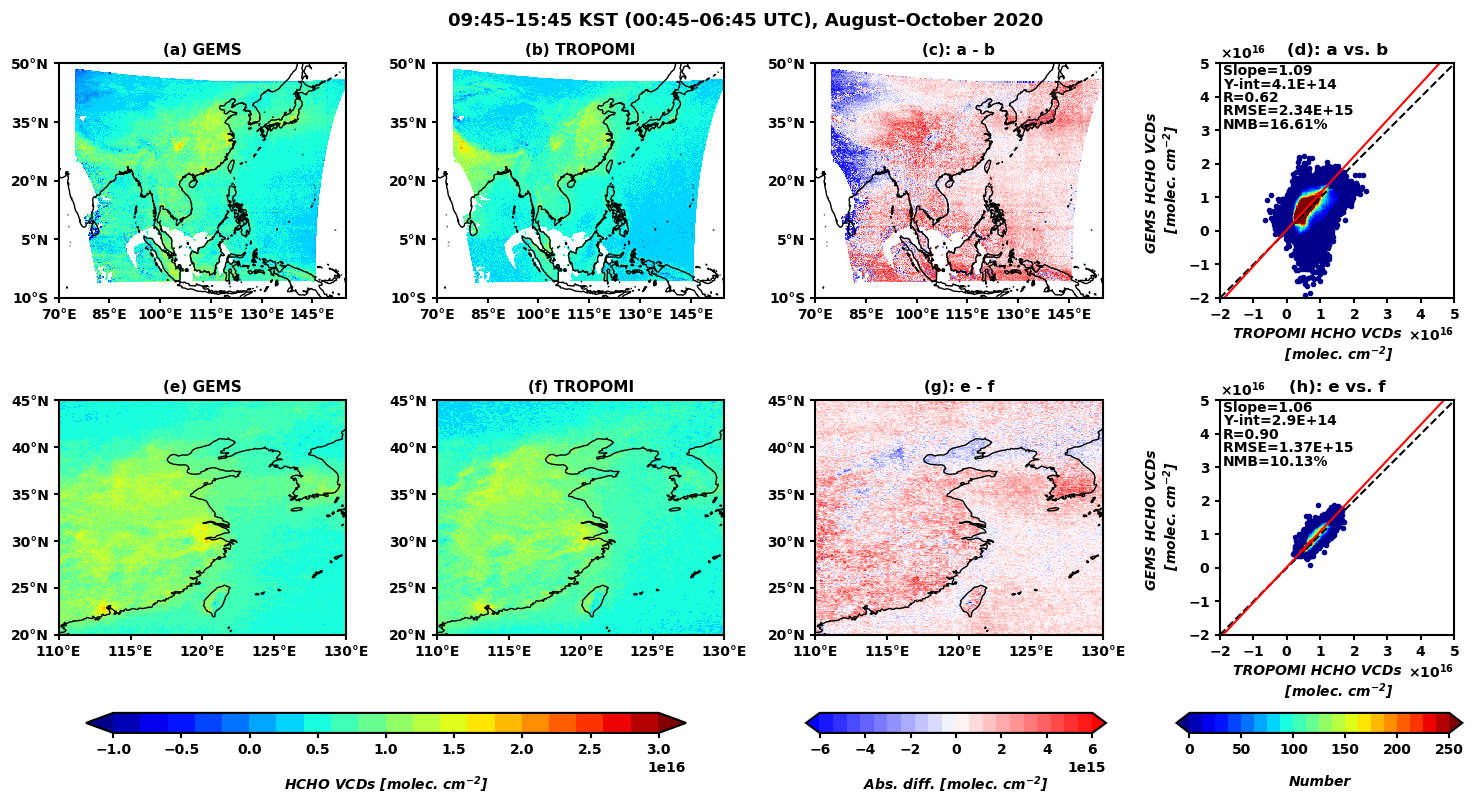
Figure 9Mean HCHO VCDs from (a) GEMS and (b) TROPOMI products for the TROPOMI overpass time (13:30, local time) during the IOT (August–October 2020). Absolute differences between GEMS and TROPOMI (a minus b) are presented in (c), and their scatterplot is shown in (d) with the statistics. Panels (e) to (h) in the second row are the same as (a) to (d) but are restricted to east China and the Korean Peninsula (20–45° N, 110–130° E).
Figure 9 shows the GEMS HCHO VCDs against those of TROPOMI during the IOT. HCHO VCDs over the continent were high during summer owing to active photochemistry and high biogenic VOC emissions. Large anthropogenic emissions also contributed to high VCDs in megacities (e.g., Shanghai, Beijing, Hong Kong SAR, and Seoul). These characteristics are accurately delineated by GEMS observations, which are consistent with TROPOMI with a correlation coefficient of 0.62 across the entire domain. Over Northeast Asia, the GEMS HCHO VCDs showed better agreement with those of TROPOMI (r= 0.90).
However, the GEMS VCDs were lower by 4 × 10¹⁵ molecules cm−2 compared to those of TROPOMI over the northwestern edge of the scan domain with high viewing zenith angles (VZA > 60°), as shown in Fig. 9c. When utilizing GEMS pixels under low viewing zenith angles (VZA < 60°), the correlation coefficient between GEMS and TROPOMI increased from 0.62 to 0.66, showing an increase in the normalized mean bias (NMB; 17 % to 22 %), attributed to the elimination of low biases from the northwestern edge. The low GEMS VCDs can be attributed to the longer light path with a high VZA, which is more susceptible to light scattering, rendering the spectral fitting more uncertain. In addition, GEMS is a geostationary satellite sensor with retrieval sensitivity with respect to the SZA. The uncertainty in the cloud fraction retrieval increases exponentially for SZA values above 40° and becomes significant above 60° (Kim et al., 2021). Multiple scattering by gases and aerosols with longer light paths could also affect the AMF calculations. Further investigations are required to consider the scattering effects on SCDs and AMFs under highly geometric conditions.
The changes in the GEMS scan domain also affect the construction of the radiance reference and, ultimately, the retrieved HCHO VCDs. In October 2020, GEMS changed its afternoon scan schedule for 12:45–13:45 KST from the nominal (100–147° E) to the full-west (FW) region (77–133° E), and the available sector for the reference spectrum narrowed. We examined the GEMS HCHO VCDs retrieved using the radiance references sampled from the FW scan to assess the impact of a narrower reference sector. GEMS HCHO VCDs retrieved using FW radiance references during the IOT showed 5 %–20 % higher values than the operational GEMS HCHO in Fig. 9 and presented increased NMBs (17 % to 29 %) compared to those of TROPOMI. This comparison implies that further investigations should be conducted to reserve sufficient radiance reference pixels to prevent potential biases in the spectral fitting results.
Several factors, including cloud properties, surface albedo, and trace gas profiles, contribute to AMF calculations. We focused on the differences in the cloud properties between GEMS and TROPOMI. GEMS and TROPOMI use the observed radiances at different wavelength bands to derive cloud properties (O4 at 477 nm for GEMS vs. the O2–A band at 760 nm for TROPOMI), retrieving the different physical interpretations of cloud fractions and cloud pressures (Kim et al., 2024; Loyola et al., 2018). This discrepancy leads to different results in the AMF calculation despite being observed simultaneously. In this study, a cloud radiance fraction of 331 nm, which was nearest to the HCHO fitting window, was utilized as the cloud fraction. To exclude cloud dependency on the HCHO AMF in the comparison between GEMS and TROPOMI, we defined cloud-free VCDs (VCDcf) by applying AMFs under a cloud-free assumption, which was introduced by Lorente et al. (2017) and De Smedt et al. (2021). Figure S3d and S3h illustrate VCDcf, displaying a similar agreement to those from the comparisons in Fig. 9 but with slight changes in statistics. In particular, the presence of clouds primarily affects Southeast Asian cities and less-polluted mid-latitude areas with 4 %–8 % lower NMBs than the original VCDs. This was likely due to the cloudy conditions related to the Asian rainy monsoon from August to October, which affected the AMF calculation.
Figure 10 compares the seasonal variations in the monthly-mean GEMS and TROPOMI HCHO VCDs in the 22 cities shown in Fig. S4, which have high population densities, petrochemical complexes, and power plants in East Asia. We used the averaged values over pixels within a 20 km × 20 km grid box centered on the center of each city. The panels in the first and second rows in Fig. 10 represent Southeast Asian cities, and those in the third and fourth rows represent Northeast Asian cities. GEMS showed good agreement with TROPOMI, with a correlation coefficient of r= 0.58–0.82.
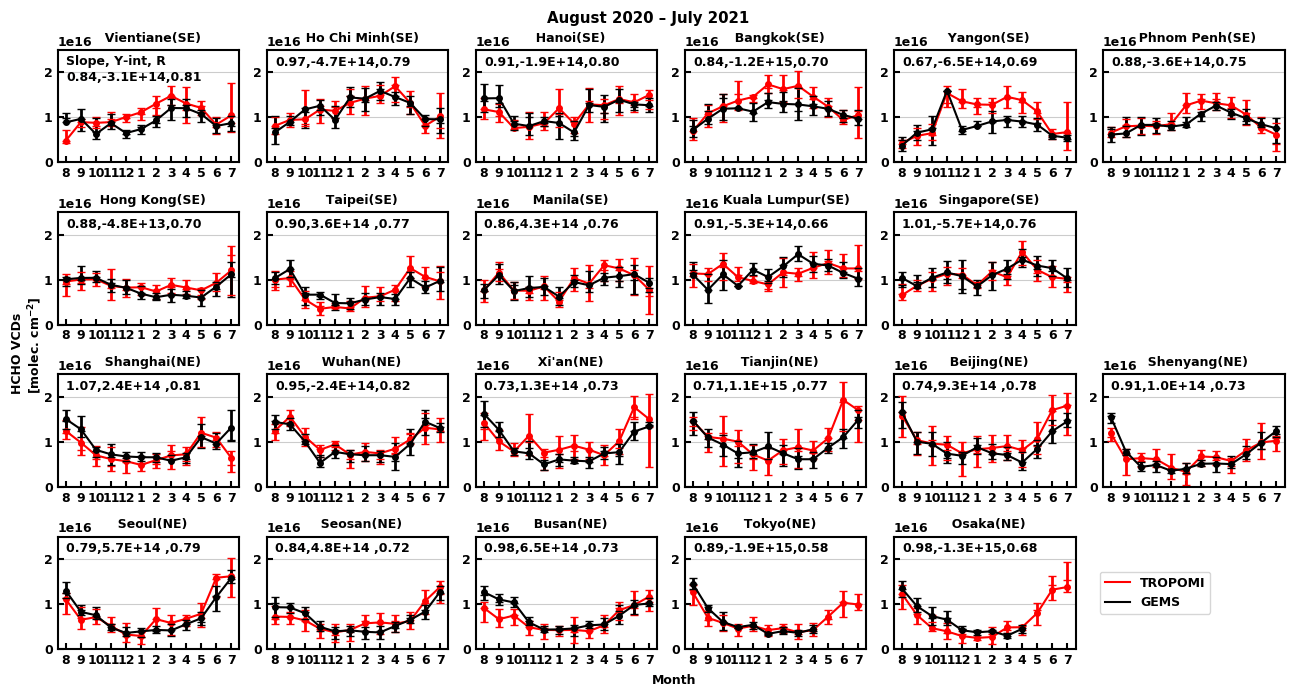
Figure 10Comparison of the monthly-mean HCHO vertical columns for GEMS and TROPOMI over 22 major cities in Southeast (SE) and Northeast (NE) Asia. The solid black and red lines represent GEMS and TROPOMI, respectively. Error bars are the first (25 %), second (50 %), and third (75 %) quantiles of the columns and markers representing the means of each monthly dataset. Because GEMS does not observe eastern Japan during the TROPOMI overpass time after May 2021, VCDs over Tokyo and Osaka in June and July 2021 are missing.
In Southeast Asian cities (Vientiane, Ho Chi Minh, Hanoi, Bangkok, Yangon, and Phnom Penh), the highest HCHO VCDs occur in spring owing to biomass burning. In other cities, the HCHO VCDs peak in summer, resulting from high photochemical reactivity and increased biogenic VOC emissions. GEMS captured this seasonal variation well. The GEMS HCHO VCDs in Tokyo showed a relatively poor correlation coefficient (r= 0.58) with TROPOMI because of insufficient GEMS pixels from the westward scan domain from May 2021. Therefore, Tokyo only showed a correlation coefficient from August 2020 to April 2021. The total number of pixels sampled (Fig. S5) over Japan (Tokyo: 60; Osaka: 76) was nearly one-third of the overall mean pixel count for all cities (mean pixel number: 200.4).
For VCDcf, shown in Fig. S6, the monthly-mean GEMS and TROPOMI HCHO columns in Southeast Asian cities, such as Ho Chi Minh, Hanoi, Taipei, and Kuala Lumpur, increased by 5 × 10¹⁵ molecules cm−2 from February to March. In contrast, VCDcf over the Northeast Asian cities did not show remarkable changes in concentration. These results are highly similar to those of De Smedt et al. (2021), who reported that the cloud-free assumption could greatly reduce existing biases when comparing satellites over South Asian regions and perform less effectively in mid-latitude polluted areas. VCDcf from GEMS and TROPOMI presented higher correlation coefficients (r= 0.6–0.85) for all cities compared to VCDs, including certain cloudy conditions, and showed more distinctive seasonal and annual variations, as the clear-sky assumption excludes the cloud dependency on the vertical columns.
Background correction also plays a crucial role in VCD computations. However, obtaining clean radiance references from uncontaminated background pixels for GEMS is challenging in Northeast Asia. This difficulty arises because the scan domain of GEMS predominantly covers continental areas at high latitudes, which results in a higher number of background columns. We evaluated the effect of background contributions from the GEMS HCHO a priori profiles using VCDs without background correction (VCD0). Figure S7 shows the same comparison between GEMS and TROPOMI except for the VCD0. In Southeast Asia, TROPOMI showed 10 %–15 % higher contributions of VCD0 to VCDs than GEMS did, showing consistent correlation coefficients of r= 0.51–0.73. However, in Northeast Asia, the difference in VCD0 contributions between TROPOMI and GEMS widened by 70 %, with lower correlation coefficients of r= 0.36–0.7. Consequently, the simulated background model values contributed significantly to the final VCD columns in the retrieval in Northeast Asia.
4.2 Direct and harmonized comparison with ground-based MAX-DOAS and FTIR observations
We evaluated GEMS HCHO VCDs by comparing them with ground-based MAX-DOAS and FTIR observations at Xianghe (39.75° N, 116.96° E), China. We set a spatial grid of 20 km × 20 km centered around the ground observatory and averaged GEMS observations within the grid. The effective size of the sampling grid was adopted from De Smedt et al. (2021), who determined a similar radius circle to the optimal value in the TROPOMI and MAX-DOAS HCHO comparisons. For temporal collocation, the MAX-DOAS and FTIR datasets were averaged to hourly data by a satellite observation time window of approximately 30 min.
First, we compared the daily- and monthly-mean HCHO VCDs of GEMS and TROPOMI with those of MAX-DOAS and FTIR during the TROPOMI overpass time (13:30, local time), as shown in Fig. S8. GEMS (r= 0.77) and TROPOMI (r= 0.78) presented good correlations but showed negative NMBs (GEMS44.8 %; TROPOMI 35.9 %) with MAX-DOAS. Similar statistics are presented in the case of the comparison with FTIR, except for the lower value of NMBs, showing correlation coefficients of r= 0.85 and 0.79 and NMBs of −37.1 % and −31.5 % for GEMS and TROPOMI, respectively. However, it should be noted that the FTIR products from October 2020 to January 2021 had insufficient data points overlapped with the TROPOMI overpass time.
The FTIR and MAX-DOAS products use different HCHO a priori profiles than GEMS does, resulting in model dependencies when comparing their VCDs (Vigouroux et al., 2020; De Smedt et al., 2021; Kwon et al., 2023). In addition, different vertical sensitivities of satellite and ground-based observations could cause inevitable discrepancies in their vertical columns. To create inter-comparable datasets among GEMS and ground observations, we replaced the a priori profiles of the ground-based observations with those of GEMS interpolated by the same vertical grid based on a smoothing method (Rodgers and Connor, 2003) and Eqs. (2) and (3) of Vigouroux et al. (2020). Figure 11a presents the daily- and monthly-mean HCHO VCDs for GEMS and MAX-DOAS during the GEMS observation period (08:45–15:45 KST). GEMS not only showed a good correlation (r= 0.77) of daily-mean VCDs with MAX-DOAS but also presented a low NMB (−47.4 %) in the direct comparison without any corrections. Averaging kernel smoothing with a priori profile correction reduced the differences between GEMS and MAX-DOAS. As shown by the orange line in Fig. 11a, the negative NMB between GEMS and MAX-DOAS decreases (NMB 47.4 % to −31.5 %), and the linear regression slope becomes close to 1 (slope = 0.51 to 0.76) with a consistently high correlation coefficient (r= 0.77 to 0.8). This is consistent with the results of De Smedt et al. (2021), indicating the different vertical sensitivities between two remotely sensed products. Therefore, the difference in the instruments' vertical sensitivity should be considered when comparing the two remotely sensed products. For example, Fig. S9 shows the daily-mean averaging kernels for GEMS, MAX-DOAS, and FTIR over Xianghe; MAX-DOAS was more sensitive near the surface compared to FTIR and GEMS.
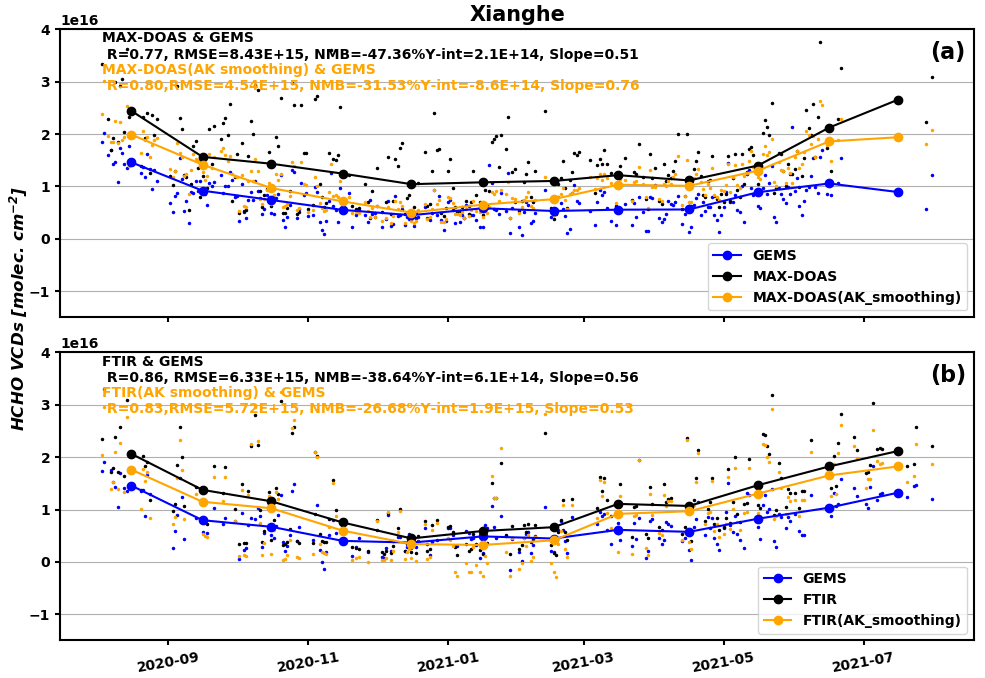
Figure 11(a) Daily (small marker) and monthly (large marker) mean HCHO VCDs of GEMS (blue), MAX-DOAS (black), and MAX-DOAS with averaging kernel smoothing (orange) from August 2020 to July 2021. (b) Same as (a) but for FTIR observation. The date format is year-month.
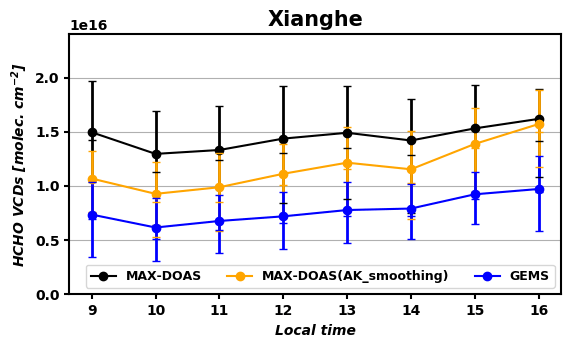
Figure 12Hourly mean HCHO VCDs of GEMS (blue), MAX-DOAS (black), and MAX-DOAS with averaging kernel smoothing (orange) from August 2020 to July 2021. Error bars are the first (25 %), second (50 %), and third (75 %) quantiles of the columns.
Figure 11b shows that the GEMS HCHO VCDs are in good agreement with those from FTIR with high correlation coefficients (r= 0.86) in the direct comparison. The NMB between GEMS and FTIR was −38.6 %, which was less negative than that between GEMS and MAX-DOAS. While the correlation coefficient between the smoothed FTIR and GEMS VCDs was slightly lower than that from the direct comparison (r= 0.86 to 0.83), NMB (−38.6 % to −26.7 %) and RMSE (6.33 × 10¹⁵ to 5.72 × 10¹⁵) are reduced. Although the vertical sensitivity of FTIR is already similar to that of the satellite observations (De Smedt et al., 2021), the above results show that the effect of averaging kernel smoothing is still not negligible.
The remaining discrepancies between GEMS and the two ground-based observations reached a maximum during summer, likely owing to the dilution of HCHO in the large GEMS area. Xianghe is a suburban area that primarily consists of agricultural areas with partial residential areas where large isoprene emissions occur (Xue et al., 2021). HCHO production from isoprene oxidation in summer can be localized, inducing a steep spatial gradient. The GEMS pixel covering the MAX-DOAS station had a large area, leading to diluted HCHO VCDs, especially when the observation area had a high HCHO concentration.
Figure 12 shows the diurnal variations in the GEMS and MAX-DOAS HCHO VCDs. De Smedt et al. (2015) showed the diurnal variation in HCHO from the MAX-DOAS at Xianghe from 2010 to 2013, with two peaks occurring in the morning (06:00–08:00 LT) and afternoon (14:00–16:00 LT) due to anthropogenic emissions during peak traffic and high insolation with increasing temperature, respectively. The diurnal variation in VCDs from GEMS is consistent with previous results from De Smedt et al. (2015), showing an increasing trend of HCHO VCDs during the day.
Figure S10 shows the same analysis from FTIR, which presents a diurnal variation consistent with that of GEMS. Smoothed FTIR VCDs were 2.5 × 10¹⁵ molecules cm−2 lower than the original VCDs throughout the day. FTIR showed decreasing HCHO VCDs from 14:00 LT while those from the MAX-DOAS continuously increased. The discrepancy between MAX-DOAS and FTIR appeared because the FTIR products have 2–10-fold fewer observations than MAX-DOAS, especially in the afternoon (14:00–16:00 LT). In Fig. S11, the MAX-DOAS HCHO VCDs sampled during the FTIR observation time showed diurnal variations consistent with those from FTIR.
When a shallow boundary layer in the early morning restricts HCHO concentrations to the surface, GEMS can cause large uncertainties in the observation of HCHO columns owing to its limited sensitivity. In this scenario, the a priori profiles can dominantly contribute to the calculation of VCDs. To examine the impact of a priori profiles in the morning, we recalculated the VCDs using the dSCDs divided by the geometric AMF (GAMF) (Palmer et al., 2001): Fig. S12 shows the diurnal variations in the HCHO dSCDs, VCDs using the GAMF, and model VCDs from the GEMS a priori profile, averaged from August 2020 to July 2021. Both dSCDs and VCDs using GAMF showed consistent diurnal variations with the a priori profiles, implying that GEMS observes the morning time variabilities well without using the a priori profiles. Further studies on the possible uncertainties in the a priori profile simulations from the model should be conducted (Yang et al., 2023).
The first geostationary satellite observation of HCHO was conducted by GEMS, which enabled the investigation of the diurnal variability in HCHO over East Asia. In this study, we improved the initial GEMS HCHO retrieval algorithm and evaluated its performance during operation. The initial algorithm caused high positive biases (10 %–40 %) in the slant columns from the spectral fitting, primarily due to radiance references constructed under cloudy conditions with high reflectance. We removed the existing artifacts from the sampled radiance references by collecting clear-sky pixels from the reference sector. In addition, GEMS showed high positive biases over the western tropics near the Bay of Bengal and Indonesia under high SZAs. These high biases are primarily caused by the interference of polarized light from aerosols and gases. We considered the polarization sensitivity vectors of the GEMS instrument, which is not equipped with a polarization scrambler, to be a pseudo-absorber in the spectral fitting and reduced the high biases of the HCHO VCDs during the afternoon. Based on these modifications, we performed a sensitivity test for the fitting window of GEMS and concluded that 329.3–358.6 nm is an optimized range to fit the slant column.
During the IOT, GEMS and TROPOMI showed good agreement (r= 0.65) for HCHO VCDs over the entire scan domain, with especially high correlation coefficients in East Asia (r= 0.9). However, we found that changes in the reference sector significantly affected the precision of the retrieved columns. We tested 3 d running-mean radiance references to reduce missing tracks in the observations, which provided an improved quality of the sampled spectra. Although the irradiance references can also be utilized as reference spectra, as mentioned in Sect. 3, they showed a substantially higher fitting rms and random uncertainty than the radiance references. To use solar irradiance as a reference spectrum, we need to study an efficient method for correcting the slant columns retrieved from the irradiance references.
We found high correlations between GEMS and TROPOMI HCHO VCDs and a good representation of seasonality with the regional characteristics of GEMS HCHO among the major cities (r= 0.58–0.82), showing active emissions from biogenic and anthropogenic sources over East Asia. Using VCDs under the cloud-free assumption, we determined that the effect of cloud products in the AMF calculations did not significantly contribute to the retrieval quality of polluted Northeast Asian cities, which is similar to the results of De Smedt et al. (2021). However, there were also large variations in the differences between GEMS and TROPOMI over coastal areas, such as Kuala Lumpur, Singapore, Shanghai, and Busan.
The GEMS HCHO VCDs were also consistent with the ground-based MAX-DOAS and FTIR observations in Xianghe. GEMS produced approximately 30 % lower VCDs than MAX-DOAS but showed high correlations (r= 0.77) and consistent seasonality with MAX-DOAS during the year. We harmonized the MAX-DOAS and FTIR products using the GEMS a priori profile and averaging kernel. The MAX-DOAS- and FTIR-recalculated VCDs with the a priori profiles of GEMS decreased, showing reduced NMBs (−47.4 % to −31.5 % and −38.6 % to −26.7 % for MAX-DOAS and FTIR, respectively) against GEMS. Using an identical a priori profile with vertical smoothing enabled precise inter-comparison, partially resolving the systematic discrepancy between the satellite and ground-based instruments.
In addition, a representation error, a mismatch between the high value of the point measurements and satellite pixels in polluted areas, could be a possible cause of the low values of the satellite-retrieved columns (Brasseur and Jacob, 2017). Ground-based observation products over background regions should be jointly compared with the GEMS HCHO to examine the sensitivity of the pixels of GEMS to point measurements based on the pollution level of the target regions. Recently, Souri et al. (2022) presented an effective method to deal with the spatial heterogeneity between satellite and ground-based observations using kriging interpolation, which statistically converts point data into gridded values. They reduced the systematic biases of NO2 VCDs between OMI and ground-based Pandora observations. However, this method requires at least three ground observation points near the satellite pixel to be applied. Therefore, additional ground-based observations must be conducted to address the underlying limitations of satellite validation.
The GEMS Level-1C data are available upon request from the National Institute of Environmental Research (NIER) – Environmental Satellite Center (ESC). The GEMS Level-2 products are available at https://nesc.nier.go.kr/en/html/datasvc/index.do (Kim et al., 2020). The TROPOMI HCHO product is available at https://doi.org/10.5270/S5P-vg1i7t0 (Copernicus Sentinel-5P, 2020). The MAX-DOAS datasets used in this study can be provided upon request by Michel Van Roozendael (michelv@oma.be). FTIR HCHO products are available at https://www-air.larc.nasa.gov/missions/ndacc/data.html?RapidDelivery=rd-list (Vigouroux et al., 2020).
The supplement related to this article is available online at: https://doi.org/10.5194/acp-24-4733-2024-supplement.
GTL, RJP, and HAK designed the study, performed the analyses, and wrote the manuscript. ESH, SDL, and SS participated in algorithm development. MHA and MK provided the GEMS Level-1B products. JK, HC, and YC provided the GEMS Level-1C products. YSC and GK provided the GEMS cloud products. DWL, DRK, and HH supported GEMS instrument management. IDS and CL provided the TROPOMI HCHO products. MVL, FH, and GP performed the MAX-DOAS measurements at Xianghe. BL, CV, and PW performed the FTIR measurements at Xianghe.
At least one of the (co-)authors is a member of the editorial board of Atmospheric Chemistry and Physics. The peer-review process was guided by an independent editor, and the authors also have no other competing interests to declare.
Publisher’s note: Copernicus Publications remains neutral with regard to jurisdictional claims made in the text, published maps, institutional affiliations, or any other geographical representation in this paper. While Copernicus Publications makes every effort to include appropriate place names, the final responsibility lies with the authors.
This article is part of the special issue “GEMS: first year in operation (AMT/ACP inter-journal SI)”. It is not associated with a conference.
We thank the GEMS science team and the Environmental Satellite Center (ESC) of the National Institute of Environmental Research (NIER) for supporting the GEMS HCHO retrieval algorithm development. We also thank the editor and anonymous referees for their invaluable comments.
This research was supported by a grant from the National Institute of Environmental Research (NIER) (grant no. NIER-2023-04-02-050) and by the Korea Environmental Industry & Technology Institute (KEITI) through the “Climate Change R&D Project for New Climate Regime” (grant no. 2022003560004), funded by the Ministry of Environment (MOE) of the Republic of Korea. Hyeong-Ahn Kwon was supported by a National Research Foundation of Korea (NRF) grant funded by the Government of the Republic of Korea (MSIT) (grant no. RS-2023-00253460) and by a research grant of the University of Suwon in 2023.
This paper was edited by Eduardo Landulfo and reviewed by four anonymous referees.
Abbot, D. S., Palmer, P. I., Martin, R. V, Chance, K. V., Jacob, D. J., and Guenther, A.: Seasonal and interannual variability of North American isoprene emissions as determined by formaldehyde column measurements from space, Geophys. Res. Lett., 30, 1886, https://doi.org/10.1029/2003GL017336, 2003.
Bey, I., Jacob, D. J., Yantosca, R. M., Logan, J. A., Field, B. D., Fiore, A. M., Li, Q., Liu, H. Y., Mickley, L. J., and Schultz, M. G.: Global modeling of tropospheric chemistry with assimilated meteorology: Model description and evaluation, J. Geophys. Res.-Atmos., 106, 23073–23095, 2001.
Brasseur, G. P. and Jacob, D. J.: Modeling of atmospheric chemistry, Cambridge University Press, ISBN 1108216358, 2017.
Cao, H., Fu, T.-M., Zhang, L., Henze, D. K., Miller, C. C., Lerot, C., Abad, G. G., De Smedt, I., Zhang, Q., van Roozendael, M., Hendrick, F., Chance, K., Li, J., Zheng, J., and Zhao, Y.: Adjoint inversion of Chinese non-methane volatile organic compound emissions using space-based observations of formaldehyde and glyoxal, Atmos. Chem. Phys., 18, 15017–15046, https://doi.org/10.5194/acp-18-15017-2018, 2018.
Chan Miller, C., Gonzalez Abad, G., Wang, H., Liu, X., Kurosu, T., Jacob, D. J., and Chance, K.: Glyoxal retrieval from the Ozone Monitoring Instrument, Atmos. Meas. Tech., 7, 3891–3907, https://doi.org/10.5194/amt-7-3891-2014, 2014.
Chance, K.: Analysis of BrO measurements from the global ozone monitoring experiment, Geophys. Res. Lett., 25, 3335–3338, 1998.
Chance, K. and Kurucz, R. L.: An improved high-resolution solar reference spectrum for earth's atmosphere measurements in the ultraviolet, visible, and near infrared, J. Quant. Spectrosc. Ra., 111, 1289–1295, 2010.
Chance, K. and Orphal, J.: Revised ultraviolet absorption cross sections of H2CO for the HITRAN database, J. Quant. Spectrosc. Ra., 112, 1509–1510, 2011.
Chance, K., Palmer, P. I., Spurr, R. J. D., Martin, R. V., Kurosu, T. P., and Jacob, D. J.: Satellite observations of formaldehyde over North America from GOME, Geophys. Res. Lett., 27, 3461–3464, 2000.
Choi, H., Lee, K.-M., Seo, J., and Bae, J.: The Influence of Atmospheric Composition on Polarization in the GEMS Spectral Region, Asia-Pac. J. Atmos. Sci., 57, 587–603, 2021.
Choi, H., Liu, X., Jeong, U., Chong, H., Kim, J., Ahn, M. H., Ko, D. H., Lee, D.-W., Moon, K.-J., and Lee, K.-M.: Geostationary Environment Monitoring Spectrometer (GEMS) polarization characteristics and correction algorithm, Atmos. Meas. Tech., 17, 145–164, https://doi.org/10.5194/amt-17-145-2024, 2024.
Choi, J., Henze, D. K., Cao, H., Nowlan, C. R., González Abad, G., Kwon, H., Lee, H., Oak, Y. J., Park, R. J., and Bates, K. H.: An Inversion Framework for Optimizing Non-Methane VOC Emissions Using Remote Sensing and Airborne Observations in Northeast Asia During the KORUS-AQ Field Campaign, J. Geophys. Res.-Atmos., 127, e2021JD035844, https://doi.org/10.1029/2021JD035844, 2022.
Copernicus Sentinel-5P (processed by ESA): TROPOMI Level 2 Formaldehyde Total Column products, Version 02, European Space Agency [data set], https://doi.org/10.5270/S5P-vg1i7t0, 2020.
De Smedt, I., Müller, J.-F., Stavrakou, T., van der A, R., Eskes, H., and Van Roozendael, M.: Twelve years of global observations of formaldehyde in the troposphere using GOME and SCIAMACHY sensors, Atmos. Chem. Phys., 8, 4947–4963, https://doi.org/10.5194/acp-8-4947-2008, 2008.
De Smedt, I., Van Roozendael, M., Stavrakou, T., Müller, J.-F., Lerot, C., Theys, N., Valks, P., Hao, N., and van der A, R.: Improved retrieval of global tropospheric formaldehyde columns from GOME-2/MetOp-A addressing noise reduction and instrumental degradation issues, Atmos. Meas. Tech., 5, 2933–2949, https://doi.org/10.5194/amt-5-2933-2012, 2012.
De Smedt, I., Stavrakou, T., Hendrick, F., Danckaert, T., Vlemmix, T., Pinardi, G., Theys, N., Lerot, C., Gielen, C., Vigouroux, C., Hermans, C., Fayt, C., Veefkind, P., Müller, J.-F., and Van Roozendael, M.: Diurnal, seasonal and long-term variations of global formaldehyde columns inferred from combined OMI and GOME-2 observations, Atmos. Chem. Phys., 15, 12519–12545, https://doi.org/10.5194/acp-15-12519-2015, 2015.
De Smedt, I., Theys, N., Yu, H., Danckaert, T., Lerot, C., Compernolle, S., Van Roozendael, M., Richter, A., Hilboll, A., Peters, E., Pedergnana, M., Loyola, D., Beirle, S., Wagner, T., Eskes, H., van Geffen, J., Boersma, K. F., and Veefkind, P.: Algorithm theoretical baseline for formaldehyde retrievals from S5P TROPOMI and from the QA4ECV project, Atmos. Meas. Tech., 11, 2395–2426, https://doi.org/10.5194/amt-11-2395-2018, 2018.
De Smedt, I., Pinardi, G., Vigouroux, C., Compernolle, S., Bais, A., Benavent, N., Boersma, F., Chan, K.-L., Donner, S., Eichmann, K.-U., Hedelt, P., Hendrick, F., Irie, H., Kumar, V., Lambert, J.-C., Langerock, B., Lerot, C., Liu, C., Loyola, D., Piters, A., Richter, A., Rivera Cárdenas, C., Romahn, F., Ryan, R. G., Sinha, V., Theys, N., Vlietinck, J., Wagner, T., Wang, T., Yu, H., and Van Roozendael, M.: Comparative assessment of TROPOMI and OMI formaldehyde observations and validation against MAX-DOAS network column measurements, Atmos. Chem. Phys., 21, 12561–12593, https://doi.org/10.5194/acp-21-12561-2021, 2021.
DiGangi, J. P., Henry, S. B., Kammrath, A., Boyle, E. S., Kaser, L., Schnitzhofer, R., Graus, M., Turnipseed, A., Park, J.-H., Weber, R. J., Hornbrook, R. S., Cantrell, C. A., Maudlin III, R. L., Kim, S., Nakashima, Y., Wolfe, G. M., Kajii, Y., Apel, E. C., Goldstein, A. H., Guenther, A., Karl, T., Hansel, A., and Keutsch, F. N.: Observations of glyoxal and formaldehyde as metrics for the anthropogenic impact on rural photochemistry, Atmos. Chem. Phys., 12, 9529–9543, https://doi.org/10.5194/acp-12-9529-2012, 2012.
Finkenzeller, H. and Volkamer, R.: O2–O2 CIA in the gas phase: Cross-section of weak bands, and continuum absorption between 297–500 nm, J. Quant. Spectrosc. Ra., 279, 108063, https://doi.org/10.1016/j.jqsrt.2021.108063, 2022.
Giglio, L., Randerson, J. T., and van der Werf, G. R.: Analysis of daily, monthly, and annual burned area using the fourth-generation global fire emissions database (GFED4), J. Geophys. Res.-Biogeo., 118, 317–328, 2013.
González Abad, G., Liu, X., Chance, K., Wang, H., Kurosu, T. P., and Suleiman, R.: Updated Smithsonian Astrophysical Observatory Ozone Monitoring Instrument (SAO OMI) formaldehyde retrieval, Atmos. Meas. Tech., 8, 19–32, https://doi.org/10.5194/amt-8-19-2015, 2015.
González Abad, G., Vasilkov, A., Seftor, C., Liu, X., and Chance, K.: Smithsonian Astrophysical Observatory Ozone Mapping and Profiler Suite (SAO OMPS) formaldehyde retrieval, Atmos. Meas. Tech., 9, 2797–2812, https://doi.org/10.5194/amt-9-2797-2016, 2016.
Guenther, A., Karl, T., Harley, P., Wiedinmyer, C., Palmer, P. I., and Geron, C.: Estimates of global terrestrial isoprene emissions using MEGAN (Model of Emissions of Gases and Aerosols from Nature), Atmos. Chem. Phys., 6, 3181–3210, https://doi.org/10.5194/acp-6-3181-2006, 2006.
McDuffie, E. E., Smith, S. J., O'Rourke, P., Tibrewal, K., Venkataraman, C., Marais, E. A., Zheng, B., Crippa, M., Brauer, M., and Martin, R. V.: A global anthropogenic emission inventory of atmospheric pollutants from sector- and fuel-specific sources (1970–2017): an application of the Community Emissions Data System (CEDS), Earth Syst. Sci. Data, 12, 3413–3442, https://doi.org/10.5194/essd-12-3413-2020, 2020.
Kim, B.-R., Kim, G., Cho, M., Choi, Y.-S., and Kim, J.: First results of cloud retrieval from the Geostationary Environmental Monitoring Spectrometer, Atmos. Meas. Tech., 17, 453–470, https://doi.org/10.5194/amt-17-453-2024, 2024.
Kim, G., Choi, Y.-S., Park, S. S., and Kim, J.: Effect of solar zenith angle on satellite cloud retrievals based on O2–O2 absorption band, Int. J. Remote Sens., 42, 4224–4240, 2021.
Kim, J., Jeong, U., Ahn, M.-H., Kim, J. H., Park, R. J., Lee, H., Song, C. H., Choi, Y.-S., Lee, K.-H., and Yoo, J.-M.: New era of air quality monitoring from space: Geostationary Environment Monitoring Spectrometer (GEMS), B. Am. Meteorol. Soc., 101, E1–E22, 2020 (data available at: https://nesc.nier.go.kr/en/html/datasvc/index.do, last access: 22 August 2023).
Kotchenova, S. Y., Vermote, E. F., Matarrese, R., and Klemm Jr, F. J.: Validation of a vector version of the 6S radiative transfer code for atmospheric correction of satellite data. Part I: Path radiance, Appl. Opt., 45, 6762–6774, 2006.
Kwon, H., Abad, G. G., Nowlan, C. R., Chong, H., Souri, A. H., Vigouroux, C., Röhling, A., Kivi, R., Makarova, M., and Notholt, J.: Validation of OMPS Suomi NPP and OMPS NOAA-20 Formaldehyde Total Columns With NDACC FTIR Observations, Earth Space Sci., 10, e2022EA002778, https://doi.org/10.1029/2022EA002778, 2023.
Kwon, H.-A., Park, R. J., González Abad, G., Chance, K., Kurosu, T. P., Kim, J., De Smedt, I., Van Roozendael, M., Peters, E., and Burrows, J.: Description of a formaldehyde retrieval algorithm for the Geostationary Environment Monitoring Spectrometer (GEMS), Atmos. Meas. Tech., 12, 3551–3571, https://doi.org/10.5194/amt-12-3551-2019, 2019.
Kwon, H.-A., Park, R. J., Oak, Y. J., Nowlan, C. R., Janz, S. J., Kowalewski, M. G., Fried, A., Walega, J., Bates, K. H., and Choi, J.: Top-down estimates of anthropogenic VOC emissions in South Korea using formaldehyde vertical column densities from aircraft during the KORUS-AQ campaign, Elem. Sci. Anth., 9, 109, https://doi.org/10.1525/elementa.2021.00109, 2021.
Lerot, C., Hendrick, F., Van Roozendael, M., Alvarado, L. M. A., Richter, A., De Smedt, I., Theys, N., Vlietinck, J., Yu, H., Van Gent, J., Stavrakou, T., Müller, J.-F., Valks, P., Loyola, D., Irie, H., Kumar, V., Wagner, T., Schreier, S. F., Sinha, V., Wang, T., Wang, P., and Retscher, C.: Glyoxal tropospheric column retrievals from TROPOMI – multi-satellite intercomparison and ground-based validation, Atmos. Meas. Tech., 14, 7775–7807, https://doi.org/10.5194/amt-14-7775-2021, 2021.
Levelt, P. F., Joiner, J., Tamminen, J., Veefkind, J. P., Bhartia, P. K., Stein Zweers, D. C., Duncan, B. N., Streets, D. G., Eskes, H., van der A, R., McLinden, C., Fioletov, V., Carn, S., de Laat, J., DeLand, M., Marchenko, S., McPeters, R., Ziemke, J., Fu, D., Liu, X., Pickering, K., Apituley, A., González Abad, G., Arola, A., Boersma, F., Chan Miller, C., Chance, K., de Graaf, M., Hakkarainen, J., Hassinen, S., Ialongo, I., Kleipool, Q., Krotkov, N., Li, C., Lamsal, L., Newman, P., Nowlan, C., Suleiman, R., Tilstra, L. G., Torres, O., Wang, H., and Wargan, K.: The Ozone Monitoring Instrument: overview of 14 years in space, Atmos. Chem. Phys., 18, 5699–5745, https://doi.org/10.5194/acp-18-5699-2018, 2018.
Li, C., Joiner, J., Krotkov, N. A., and Dunlap, L.: A new method for global retrievals of HCHO total columns from the Suomi National Polar-orbiting Partnership Ozone Mapping and Profiler Suite, Geophys. Res. Lett., 42, 2515–2522, 2015.
Lorente, A., Folkert Boersma, K., Yu, H., Dörner, S., Hilboll, A., Richter, A., Liu, M., Lamsal, L. N., Barkley, M., De Smedt, I., Van Roozendael, M., Wang, Y., Wagner, T., Beirle, S., Lin, J.-T., Krotkov, N., Stammes, P., Wang, P., Eskes, H. J., and Krol, M.: Structural uncertainty in air mass factor calculation for NO2 and HCHO satellite retrievals, Atmos. Meas. Tech., 10, 759–782, https://doi.org/10.5194/amt-10-759-2017, 2017.
Loyola, D. G., Gimeno García, S., Lutz, R., Argyrouli, A., Romahn, F., Spurr, R. J. D., Pedergnana, M., Doicu, A., Molina García, V., and Schüssler, O.: The operational cloud retrieval algorithms from TROPOMI on board Sentinel-5 Precursor, Atmos. Meas. Tech., 11, 409–427, https://doi.org/10.5194/amt-11-409-2018, 2018.
Matyssek, R. and Sandermann, H.: Impact of ozone on trees: an ecophysiological perspective, in: Progress in botany, Springer, 349–404, ISBN 978-3-642-62838-2, 2003.
Nowlan, C. R., González Abad, G., Kwon, H., Ayazpour, Z., Chan Miller, C., Chance, K., Chong, H., Liu, X., O'Sullivan, E., and Wang, H.: Global Formaldehyde Products From the Ozone Mapping and Profiler Suite (OMPS) Nadir Mappers on Suomi NPP and NOAA-20, Earth Space Sci., 10, e2022EA002643, https://doi.org/10.1029/2022EA002643, 2023.
Olivier, J. G. J., Bouwman, A. F., Van der Maas, C. W. M., Berdowski, J. J. M., Veldt, C., Bloos, J. P. J., Visschedijk, A. J. H., Zandveld, P. Y. J., and Haverslag, J. L.: Description of EDGAR Version 2.0: A set of global emission inventories of greenhouse gases and ozone depleting substances for all anthro- pogenic and most natural sources on a per country basis and on 1° × 1° grid, RIVM Techn. Report nr. 771060002, TNO-MEP report nr. R96/119, Nat. Inst. Of Public Health and the Environ- ment/Netherlands Organisation for Applied Scientific Research, Bilthoven, the Netherlands, 1996.
Palmer, P. I., Jacob, D. J., Chance, K., Martin, R. V, Spurr, R. J. D., Kurosu, T. P., Bey, I., Yantosca, R., Fiore, A., and Li, Q.: Air mass factor formulation for spectroscopic measurements from satellites: Application to formaldehyde retrievals from the Global Ozone Monitoring Experiment, J. Geophys. Res.-Atmos., 106, 14539–14550, 2001.
Palmer, P. I., Jacob, D. J., Fiore, A. M., Martin, R. V., Chance, K., and Kurosu, T. P.: Mapping isoprene emissions over North America using formaldehyde column observations from space, J. Geophys. Res.-Atmos., 108, 4180, https://doi.org/10.1029/2002JD002153, 2003.
Park, R. J., Oak, Y. J., Emmons, L. K., Kim, C.-H., Pfister, G. G., Carmichael, G. R., Saide, P. E., Cho, S.-Y., Kim, S., and Woo, J.-H.: Multi-model intercomparisons of air quality simulations for the KORUS-AQ campaign, Elem. Sci. Anth., 9, 00139, https://doi.org/10.1525/elementa.2021.00139, 2021.
Rienecker, M. M., Suarez, M. J., Gelaro, R., Todling, R., Bacmeister, J., Liu, E., Bosilovich, M. G., Schubert, S. D., Takacs, L., and Kim, G.-K.: MERRA: NASA's modern-era retrospective analysis for research and applications, J. Climate, 24, 3624–3648, 2011.
Rodgers, C. D. and Connor, B. J.: Intercomparison of remote sounding instruments, J. Geophys. Res.-Atmos., 108, 4116, https://doi.org/10.1029/2002JD002299, 2003.
Serdyuchenko, A., Gorshelev, V., Weber, M., Chehade, W., and Burrows, J. P.: High spectral resolution ozone absorption cross-sections – Part 2: Temperature dependence, Atmos. Meas. Tech., 7, 625–636, https://doi.org/10.5194/amt-7-625-2014, 2014.
Shrubsole, C., Dimitroulopoulou, S., Foxall, K., Gadeberg, B., and Doutsi, A.: IAQ guidelines for selected volatile organic compounds (VOCs) in the UK, Build. Environ., 165, 106382, https://doi.org/10.1016/j.buildenv.2019.106382, 2019.
Sindelarova, K., Markova, J., Simpson, D., Huszar, P., Karlicky, J., Darras, S., and Granier, C.: High-resolution biogenic global emission inventory for the time period 2000–2019 for air quality modelling, Earth Syst. Sci. Data, 14, 251–270, https://doi.org/10.5194/essd-14-251-2022, 2022.
Souri, A. H., Chance, K., Sun, K., Liu, X., and Johnson, M. S.: Dealing with spatial heterogeneity in pointwise-to-gridded- data comparisons, Atmos. Meas. Tech., 15, 41–59, https://doi.org/10.5194/amt-15-41-2022, 2022.
Souri, A. H., Johnson, M. S., Wolfe, G. M., Crawford, J. H., Fried, A., Wisthaler, A., Brune, W. H., Blake, D. R., Weinheimer, A. J., Verhoelst, T., Compernolle, S., Pinardi, G., Vigouroux, C., Langerock, B., Choi, S., Lamsal, L., Zhu, L., Sun, S., Cohen, R. C., Min, K.-E., Cho, C., Philip, S., Liu, X., and Chance, K.: Characterization of errors in satellite-based HCHO NO2 tropospheric column ratios with respect to chemistry, column-to-PBL translation, spatial representation, and retrieval uncertainties, Atmos. Chem. Phys., 23, 1963–1986, https://doi.org/10.5194/acp-23-1963-2023, 2023.
Stavrakou, T., Müller, J.-F., De Smedt, I., Van Roozendael, M., van der Werf, G. R., Giglio, L., and Guenther, A.: Global emissions of non-methane hydrocarbons deduced from SCIAMACHY formaldehyde columns through 2003–2006, Atmos. Chem. Phys., 9, 3663–3679, https://doi.org/10.5194/acp-9-3663-2009, 2009.
Vandaele, A. C., Hermans, C., Simon, P. C., Carleer, M., Colin, R., Fally, S., Merienne, M.-F., Jenouvrier, A., and Coquart, B.: Measurements of the NO2 absorption cross-section from 42 000 cm−1 to 10 000 cm−1 (238–1000 nm) at 220 K and 294 K, J. Quant. Spectrosc. Ra., 59, 171–184, 1998.
van der Werf, G. R., Randerson, J. T., Giglio, L., Collatz, G. J., Mu, M., Kasibhatla, P. S., Morton, D. C., DeFries, R. S., Jin, Y., and van Leeuwen, T. T.: Global fire emissions and the contribution of deforestation, savanna, forest, agricultural, and peat fires (1997–2009), Atmos. Chem. Phys., 10, 11707–11735, https://doi.org/10.5194/acp-10-11707-2010, 2010.
Veefkind, J. P., Aben, I., McMullan, K., Förster, H., De Vries, J., Otter, G., Claas, J., Eskes, H. J., De Haan, J. F., and Kleipool, Q.: TROPOMI on the ESA Sentinel-5 Precursor: A GMES mission for global observations of the atmospheric composition for climate, air quality and ozone layer applications, Remote Sens. Environ., 120, 70–83, 2012.
Vigouroux, C., Langerock, B., Bauer Aquino, C. A., Blumenstock, T., Cheng, Z., De Mazière, M., De Smedt, I., Grutter, M., Hannigan, J. W., Jones, N., Kivi, R., Loyola, D., Lutsch, E., Mahieu, E., Makarova, M., Metzger, J.-M., Morino, I., Murata, I., Nagahama, T., Notholt, J., Ortega, I., Palm, M., Pinardi, G., Röhling, A., Smale, D., Stremme, W., Strong, K., Sussmann, R., Té, Y., van Roozendael, M., Wang, P., and Winkler, H.: TROPOMI–Sentinel-5 Precursor formaldehyde validation using an extensive network of ground-based Fourier-transform infrared stations, Atmos. Meas. Tech., 13, 3751–3767, https://doi.org/10.5194/amt-13-3751-2020, 2020 (data available at: https://www-air.larc.nasa.gov/missions/ndacc/data.html?RapidDelivery=rd-list, last access: 22 August 2023).
Vrekoussis, M., Wittrock, F., Richter, A., and Burrows, J. P.: GOME-2 observations of oxygenated VOCs: what can we learn from the ratio glyoxal to formaldehyde on a global scale?, Atmos. Chem. Phys., 10, 10145–10160, https://doi.org/10.5194/acp-10-10145-2010, 2010.
Wilmouth, D. M., Hanisco, T. F., Donahue, N. M., and Anderson, J. G.: Fourier transform ultraviolet spectroscopy of the A 2 X 2 transition of BrO, J. Phys. Chem. A, 103, 8935–8945, 1999.
Wittrock, F., Richter, A., Oetjen, H., Burrows, J. P., Kanakidou, M., Myriokefalitakis, S., Volkamer, R., Beirle, S., Platt, U., and Wagner, T.: Simultaneous global observations of glyoxal and formaldehyde from space, Geophys. Res. Lett., 33, L16804, https://doi.org/10.1029/2006GL026310, 2006.
Woo, J.-H., Kim, Y., Kim, H.-K., Choi, K.-C., Eum, J.-H., Lee, J.-B., Lim, J.-H., Kim, J., and Seong, M.: Development of the CREATE inventory in support of integrated climate and air quality modeling for Asia, Sustainability, 12, 7930, https://doi.org/10.3390/su12197930, 2020.
Xue, M., Ma, J., Tang, G., Tong, S., Hu, B., Zhang, X., Li, X. and Wang, Y.: ROx Budgets and O3 Formation during Summertime at Xianghe Suburban Site in the North China Plain, Adv. Atmos. Sci., 38, 1209–1222, 2021.
Yang, L. H., Jacob, D. J., Colombi, N. K., Zhai, S., Bates, K. H., Shah, V., Beaudry, E., Yantosca, R. M., Lin, H., Brewer, J. F., Chong, H., Travis, K. R., Crawford, J. H., Lamsal, L. N., Koo, J.-H., and Kim, J.: Tropospheric NO2 vertical profiles over South Korea and their relation to oxidant chemistry: implications for geostationary satellite retrievals and the observation of NO2 diurnal variation from space, Atmos. Chem. Phys., 23, 2465–2481, https://doi.org/10.5194/acp-23-2465-2023, 2023.
Zhang, Q., Streets, D. G., Carmichael, G. R., He, K. B., Huo, H., Kannari, A., Klimont, Z., Park, I. S., Reddy, S., Fu, J. S., Chen, D., Duan, L., Lei, Y., Wang, L. T., and Yao, Z. L.: Asian emissions in 2006 for the NASA INTEX-B mission, Atmos. Chem. Phys., 9, 5131–5153, https://doi.org/10.5194/acp-9-5131-2009, 2009.