the Creative Commons Attribution 4.0 License.
the Creative Commons Attribution 4.0 License.
 | 05 Mar 2024
A remote sensing algorithm for vertically resolved cloud condensation nuclei number concentrations from airborne and spaceborne lidar observations
Piyushkumar N. Patel
Jonathan H. Jiang
Ritesh Gautam
Harish Gadhavi
Olga Kalashnikova
Michael J. Garay
Feng Xu
Ali Omar
Cloud condensation nuclei (CCN) are mediators of aerosol–cloud interactions (ACIs), contributing to the largest uncertainties in the understandings of global climate change. We present a novel remote-sensing-based algorithm that quantifies the vertically resolved CCN number concentrations (NCCN) using aerosol optical properties measured by a multiwavelength lidar. The algorithm considers five distinct aerosol subtypes with bimodal size distributions. The inversion used the lookup tables developed in this study, based on the observations from the Aerosol Robotic Network, to efficiently retrieve optimal particle size distributions from lidar measurements. The method derives dry aerosol optical properties by implementing hygroscopic enhancement factors in lidar measurements. The retrieved optically equivalent particle size distributions and aerosol-type-dependent particle composition are utilized to calculate critical diameters using κ-Köhler theory and NCCN at six supersaturations ranging from 0.07 % to 1.0 %. Sensitivity analyses indicate that uncertainties in extinction coefficients and relative humidity greatly influence the retrieval error in NCCN. The potential of this algorithm is further evaluated by retrieving NCCN using airborne lidar from the NASA ObseRvations of Aerosols above CLouds and their intEractionS (ORACLES) campaign and is validated against simultaneous measurements from the CCN counter. The independent validation with robust correlation demonstrates promising results. Furthermore, the NCCN has been retrieved for the first time using a proposed algorithm from spaceborne lidar – Cloud-Aerosol Lidar with Orthogonal Polarization (CALIOP) – measurements. The application of this new capability demonstrates the potential for constructing a 3D CCN climatology at a global scale, which helps to better quantify ACI effects and thus reduce the uncertainty in aerosol climate forcing.
- Article
(10858 KB) - Full-text XML
-
Supplement
(815 KB) - BibTeX
- EndNote


The Intergovernmental Panel on Climate Change (IPCC) report states that radiative forcing caused by aerosol–cloud interactions (ACIs) dominates the largest uncertainty and remains the least well-understood anthropogenic contribution to climate change (IPCC AR5, 2013). The uncertainty mainly stems from the complicated processes of how aerosols impact the global cloud system. Atmospheric aerosols allow for water vapor condensation under certain supersaturation (SS) conditions and subsequently evolve into cloud droplets by serving as cloud condensation nuclei (CCN). Anthropogenic emissions are a major source of CCN, facilitating the formation of cloud droplets and thereby altering cloud properties, precipitation patterns, and the climate forcing (Carslaw et al., 2010; Paasonen et al., 2013). Consequently, reducing the uncertainty associated with ACIs is crucial for increasing our confidence in predictions of global and regional climate models (IPCC, 2014). The fundamental parameter for understanding aerosol–cloud interaction is the CCN concentration (Rosenfeld et al., 2014). Determining CCN number concentration (NCCN) is the basis for analyses of ACI (Seinfeld et al., 2016). Large uncertainties in their magnitude and variability at a global scale are one of the main factors in the low level of scientific understanding of ACI effects. Therefore, knowledge of the global abundance of aerosols capable of serving as CCN is fundamental to advancing our understanding of ACI (Fan et al., 2016).
Tackling the challenges in climate change, as identified by the IPCC, requires that CCN properties be measured globally. Missing such a fundamental quantity has greatly hindered our ability to accurately quantify the effects of anthropogenic aerosols on cloud properties (Rosenfeld et al., 2014). Ground-based instruments can observe NCCN at various SSs, but they only provide sparse and localized information. Besides limited coverage, near-surface CCN properties could differ significantly from CCN properties near the cloud base due to vertical aerosol inhomogeneities, particularly under stable atmospheric boundary conditions. Airborne observations can provide very useful CCN measurements near the cloud base but are expensive to collect and are limited to a few field experiments, with limited spatiotemporal coverage (Feingold et al., 1998; Li et al., 2015b, a).
Overall, observations of CCN are spatiotemporally sparse, lack a vertical dimension, and provide insufficient constraints on their global distribution. ACI studies often use satellite retrievals to take advantage of their global coverage, but satellites have been unable to measure the CCN. Nevertheless, the aerosol optical parameters such as aerosol optical depth (AOD) and aerosol index (AI) are commonly used as proxies for CCN in previous studies (Quaas et al., 2008, 2009; Gryspeerdt and Stier, 2012; Patel and Kumar, 2016; Patel et al., 2017, 2019; Rosenfeld, 2008). However, all these proxies are crude tools and suffer from various issues such as aerosol swelling, lack of vertical information, cloud contamination, uncertainty in size distribution and solubility, and more (Rosenfeld et al., 2016). The aforementioned studies based on passive satellite remote sensing measurements, such as AOD and AI, have limitations in several areas for ACI studies.
Active remote sensing technologies such as lidar have the ability to improve the precision and range of conditions under which particle concentrations and their ability to act as CCN can be retrieved. A significant body of prior studies has assessed the relationship between aerosol optical properties and CCN based on local in situ data offered by lidar and radar. Feingold et al. (1998) developed a technique to derive CCN from the retrieved cloud droplet concentration, vertical velocity, and lidar backscatter from ground-based radar, lidar, and radiometers. Ghan et al. (2006) and Ghan and Collins (2004) evaluated the relationship between aerosol extinction from airborne lidar and NCCN from near-surface measurements and devised a technique for estimating CCN at a cloud base. However, their techniques rely on the assumption that the physiochemical characteristics of aerosols at the surface represent the vertical column. Thus, their retrievals may be subject to large uncertainties due to vertical inhomogeneity in particle characteristics. Previous work by Clarke and Kapustin (2010), Kapustin et al. (2006), Liu and Li (2014), and Shinozuka et al. (2015) demonstrated a strong correlation between extinction coefficients and NCCN instead of vertically integrated AOD or AI using airborne and in situ observations. Stier (2016) provided a global assessment of the link between aerosol radiative properties and CCN using a global aerosol–climate model (ECHAM-HAM) and suggested that vertically integrated aerosol radiative properties are of limited suitability as a proxy for global surface CCN.
Both Mamouri and Ansmann (2016) and Choudhury and Tesche (2022) examine the potential of single-wavelength lidar observations to retrieve CCN number concentrations for different aerosol types. The relationships between particle extinction coefficients and number concentrations of particles with dry radii larger than 50 nm (for non-dust) and 100 nm (for dust) were parameterized based on multiyear AErosol RObotic NETwork (AERONET) observations for different aerosol types. However, the measurements from the single-wavelength lidar also lack sufficient information to quantify particle size distribution, particle number concentration, or aerosol type, resulting in large uncertainty in NCCN retrieval (Burton et al., 2012; Tan et al., 2019). However, few recent studies (Lv et al., 2018; Tan et al., 2019) have shown efforts to retrieve NCCN based on the advanced capability of multiwavelength lidar measurements, but they have been limited to ground-based observations only. Rosenfeld et al. (2016) attempted a new approach to retrieve satellite-based NCCN using passive satellite observations. All these studies taken together provide a sound foundation for CCN-relevant aerosol properties, but most of them do not refer to CCN concentrations themselves, and the ones that do, do not give a global coverage or a vertically resolved picture. Consequently, no reliable global observational dataset of CCN exists, and the ability to routinely measure vertically resolved CCN to study ACI effectively is still lacking (Burkart et al., 2011).
This study introduces ECLiAP (Estimation of CCN using Lidar measured Aerosol optical Properties), a comprehensive remote sensing algorithm designed to estimate the concentration of cloud condensation nuclei (NCCN) using multiwavelength spaceborne lidar measurements.
This paper is structured as follows. The introductory section discusses the importance of and motivation behind NCCN estimation. Section 2 describes the lookup table (LUT)-based approach utilized for NCCN estimation, focusing specifically on satellite observations. Section 3 encompasses numerical simulations, sensitivity analysis, extensive validation efforts, and an observational case study. Finally, Sect. 4 comprehensively discusses the results and their broader implications.
2.1 NASA ObseRvations of Aerosols above CLouds and their intEractionS (ORACLES)
The NASA ORACLES campaign, conducted between 2016 and 2018 over the southeastern Atlantic (SEA) (Redemann et al., 2021), provided valuable insights into a crucial region characterized by the interaction of biomass burning emissions with marine stratocumulus clouds specifically during July to October. These clouds wield a significant influence over the global climate; however, climate models often inadequately represent them due to their abundance and brightness (Bony and Dufresne, 2005; Nam et al., 2012). Furthermore, the challenges of non-polarimetric passive remote sensing of aerosols in the presence of low stratocumulus clouds (Coddington et al., 2010; Chang et al., 2021) underscore the criticality of accurately predicting cloud condensation nuclei (CCN) concentrations and refining model parameterization for the SEA region. To address the knowledge gaps, the ORACLES campaign focused on comprehensive observations of aerosol and cloud properties, employing a combination of remote sensing and in situ instruments aboard the NASA P-3 (operational from 2016 to 2018) and ER2 (operational in 2016) aircraft. The ORACLES data include in situ measurements of NCCN from the CCN counter as well as lidar measurements obtained through the NASA Langley Research Center's high-spectral-resolution lidar (HSRL-2). We seized this opportunity to conduct a validation exercise based on the accessible data.
2.1.1 HSRL-2
The NASA Langley Research Center HSRL-2 measures aerosol backscatter and depolarization at three wavelengths (355, 532, and 1064 nm) and aerosol extinction at 355 and 532 nm using the HSRL technique (Shipley et al., 1983; Burton et al., 2018). At 1064 nm, extinction is derived from the product of aerosol backscatter at 1064 nm and an inferred lidar ratio at 1064 nm. The HSRL-2 measurement technique differentiates between aerosol and molecular returns by analyzing the spectral distribution of the return signal. Consequently, this enables the independent determination of aerosol backscatter and extinction coefficients, unlike traditional elastic backscatter lidar retrievals that rely on a lidar ratio assumption (Hair et al., 2008). The addition of the 355 nm channel in HSRL-2 enhances sensitivity to smaller particles, including CCN, which are crucial in aerosol–cloud interactions (Burton et al., 2018). The instrument achieves horizontal and vertical resolutions of approximately 2 km and 15 m, respectively, for aerosol backscatter and depolarization. For aerosol extinction coefficients, horizontal and vertical resolutions are approximately 12 km and 300 m, respectively, with interpolation to match the finer resolutions of backscatter and depolarization. In terms of temporal resolution, aerosol backscatter and extinction coefficients are available at approximately 10 and 60 s intervals, respectively. The uncertainty in lidar observables, influenced by factors like contrast ratio and aerosol loading, can be within 5 % under certain conditions (Burton et al., 2018). This paper delves into the ability of ECLiAP by leveraging the advanced capabilities of HSRL-2 to accurately derive NCCN under real-world atmospheric conditions.
2.1.2 CCN counter
We utilize the Georgia Institute of Technology (GIT) Droplet Measurement Technologies (DMT) CCN counter (CCN-100) as another primary instrument and data source. The CCN-100 facilitates in situ measurements of CCN concentrations across a range of water vapor supersaturation levels (S), specifically between 0.1 % and 0.4 % (Kacarab et al., 2020; Redemann et al., 2021). The CCN-100 is ingeniously designed as a continuous-flow streamwise thermal-gradient chamber (CFSTGC) following the framework proposed by Roberts and Nenes (2005). In this configuration, a cylindrical flow chamber generates quasi-uniform supersaturation at its centerline through continuous heat and water vapor transport from the wetted walls, subject to a temperature gradient. The difference in heat and water vapor diffusivity in the radial direction ensures the generation of supersaturation at varying levels depending on the flow rate and temperature gradient. An advantage of the continuous-flow system is its rapid sampling capabilities, achieving a frequency of approximately 1 Hz (Roberts and Nenes, 2005). Such a high frequency is crucial for effectively capturing rapidly changing environments typical of airborne sampling scenarios. Aerosols that activate into droplets with a radius greater than 0.5 µm are counted as CCN at the end of the growth chamber. The horizontal resolution of in situ observations during the ORACLES campaign is contingent upon aircraft speed. For accuracy, the uncertainty associated with CCN number concentration is approximately ±10 % at a high signal-to-noise ratio (), while the supersaturation uncertainty is around ±0.04 % (Rose et al., 2008). These precision values ensure the reliability of the CCN measurements, ensuring the robustness of the dataset used to validate the ECLiAP-derived NCCN in our investigation.
2.2 Cloud-Aerosol Lidar and Infrared Pathfinder Satellite Observations (CALIPSO)
CALIOP (Cloud-Aerosol Lidar with Orthogonal Polarization) on the CALIPSO satellite, the first spaceborne polarization lidar, was launched in April 2006 (Winker et al., 2007). CALIPSO is in 705 km sun-synchronous polar orbit, and the orbit is controlled to repeat the same ground track every 16 d with cross-track errors of less than ±10 km. CALIOP acquires high-resolution (vertical and horizontal at 30 and 333 m below 8.2 km and 60 and 1000 m between 8.2 and 20.2 km) profiles of total attenuated backscatter by aerosols and clouds at 532 and 1064 nm during both day and night. Spatial averaging over different scales is typically performed to improve the signal-to-noise ratio for reliable retrievals. For our study, we used the CALIPSO version 4.20 level-2 aerosol profile product (vertical and horizontal resolution: 60 m × 5 km; temporal resolution: 5.92 s). CALIOP first classified the aerosol and cloud layers using the Clod-Aerosol Discrimination (CAD) score algorithm (Liu et al., 2009). Further, the aerosol layers are categorized into the subsequent aerosol types (Omar et al., 2009). The hybrid extinction retrieval algorithms are used to retrieve the aerosol extinction, using the assumed lidar ratios appropriate for each aerosol type (Young and Vaughan, 2009). Click or tap here to enter the text reported in the CALIPSO level-2 5 km aerosol profile product (Vaughan et al., 2017). The determination of the lidar ratio contributes the major uncertainty in the retrieval of CALIOP aerosol extinction, and the misclassification of aerosol type is another source of uncertainty (Yu et al., 2010). We incorporate the profiles of aerosol extinction coefficient, backscatter coefficient, and particle depolarization ratio, along with aerosol subtype information from CALIOP, into ECLiAP for the NCCN retrieval. Additionally, we utilize relative humidity profiles obtained from the Global Modelling and Assimilation Office Data Assimilation System (Molod et al., 2015), which are included in the CALIPSO data product. We employed CALIOP data to assess the NCCN retrieval capability of ECLiAP and also conducted a case study.
3.1 Construction of lookup tables
The inversion solution using the combination of simultaneous measurements of backscatters at three wavelengths and extinction at two wavelengths, also called 3β+2α, using lidar has been gaining prominence for aerosol microphysical (effective radius, total number, volume concentration, refractive index) retrieval (Burton et al., 2016; Müller et al., 2005; 1999, 2016; Veselovskii et al., 2002, 2004, 2012). Several fundamental aspects of the mathematical problem must be solved during the retrieval from multiwavelength lidar. The most important aspect is that the inversion solution is not unique. The non-uniqueness of an inversion solution in the advanced 3β+2α technique is the primary source of the retrieval challenges (Chemyakin et al., 2016). Additionally, retrieving six size parameters (number concentrations, effective radius, and geometric standard deviation for fine- and coarse-mode particles) for a bimodal particle size distribution (PSD) from five known quantities (β355, β532, β1064 α355, α532) is still an ill-posed inversion problem. In addition, the existing spaceborne lidar instrument (CALIOP aboard CALIPSO) provides the measurements at only two wavelengths (532 and 1064 nm). Considering all these constraints and partially compensating for the non-uniqueness problem, we employed the LUT approach with a fine step of bimodal particle size distributions (PSDs) to derive aerosol size parameters. The parameterization of bimodal lognormal PSDs is described in Sect. 2.1.1. The fundamental design of the LUT framework for lidar measurements is built to test the aerosol optical properties that we target for precise information.
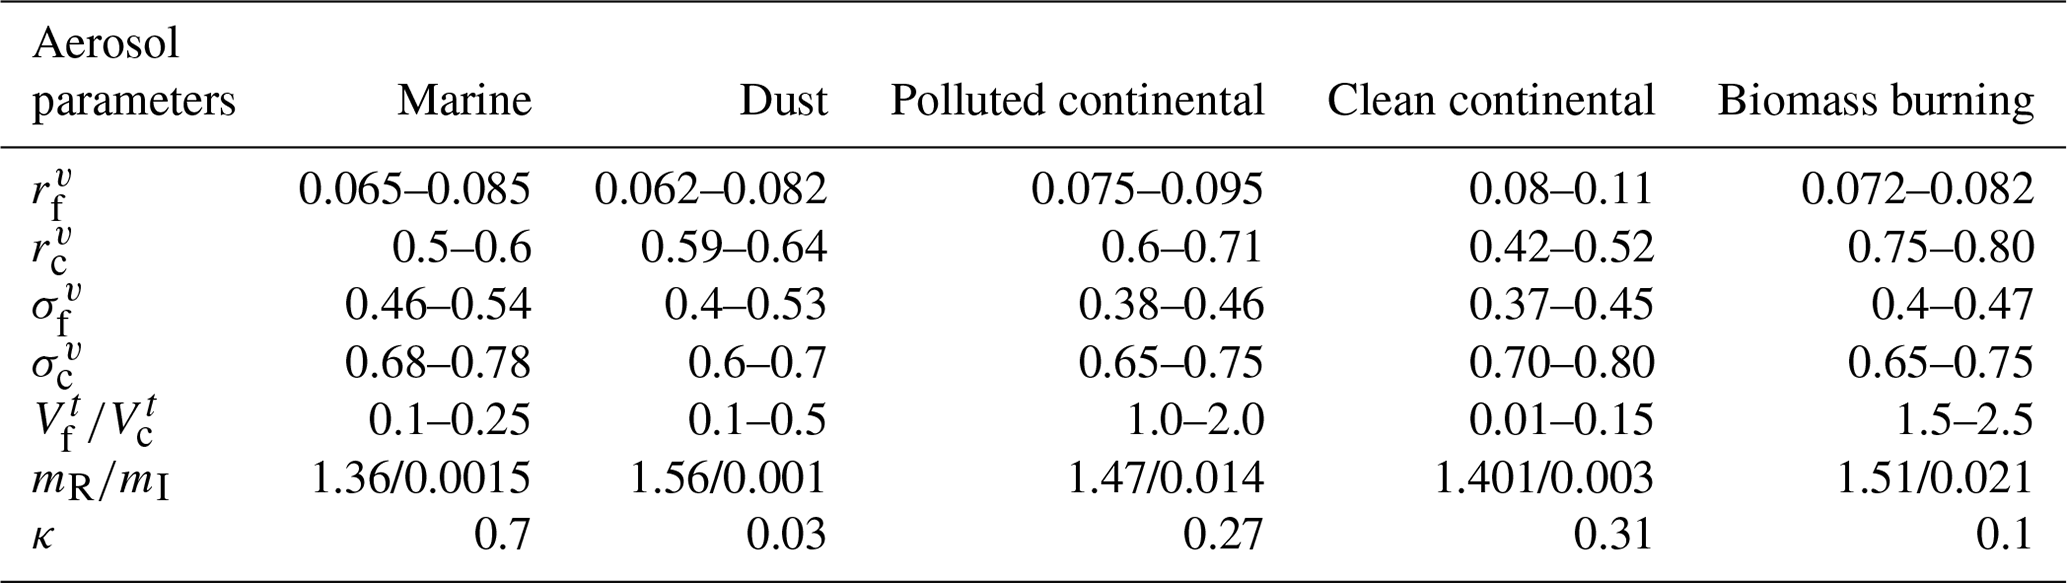
In the present study, the LUTs are designed using the 3β+3α (β355, β532, β1064, α355, α532, α1064) technique for the individual aerosol types. An additional input at a longer wavelength improves the retrieval accuracy for coarse-mode particles (Lv et al., 2018). These LUTs contain aerosol optical properties such as backscatter coefficients at 355, 532, and 1064 nm (β355, β532, β1064) and extinction coefficients at 355, 532, and 1064 nm (α355, α532, α1064), along with size parameters including number concentration, effective radius, and geometric standard deviation for fine- and coarse-mode particles (). Primarily, the LUTs are generated for the five distinct aerosol subtypes: marine, dust, polluted continental, clean continental, and smoke aerosols (as shown in Fig. 1). This study considers dust particles to be spheroid and other aerosol types to be spheres. The particle optical properties are computed using the well-known Mie scattering theory (Bohren and Huffman, 1998) for spherical particles, which is a numerically accurate approach over a wide range of particle sizes. Meanwhile, the T-matrix method (TMM) (Mishchenko and Travis, 1998) is adopted for the spheroids and is numerically precise for the limited particle sizes. Consequently, the improved geometric optics method (IGOM; Bi et al., 2009; Yang et al., 2007) is applied to the larger spheroids not covered by the TMM. The axis ratio distribution for spheroids, ranging from ∼ 0.3 (flattened spheroids) to ∼ 3.0 (elongated spheroids), is taken from Dubovik et al. (2006). The transition from the TMM to IGOM is determined by specific size parameters and is dependent on the particle shape and refractive index. However, the present study considers the mean complex refractive index, and the transition from the TMM to IGOM depends on the particle shape. PSD and mean complex refractive index were used as the input parameters for the computations of aerosol optical properties. The parameter ranges for the bimodal size distribution and mean complex refractive index of the five aerosol subtypes are presented in Table 1 and are used to construct the respective LUTs. These parameter values were adopted from Dubovik (2002), Torres et al. (2017), and Veselovskii et al. (2004), who used measurements from sun and sky radiometers at multiple AERONET sites. Click or tap here to enter text. Torres et al. (2017) validated their models against 744 AERONET observations and 165 almucantar AERONET standard inversions at eight different sites. This approach ensures the robustness and reliability of our aerosol characterization. The PSDs are given in terms of the total particle number concentration, effective radius (r), and geometric standard deviation individually for fine and coarse modes. Considering the sensitivity limitation of lidar measurements, the range of the radius for the PSD is constrained to 0.01–10 µm with a fixed bin size of 0.002 defined on a logarithmic-equidistant scale in the calculation. In the process of constructing LUTs, specific intervals for the parameters σf, σc, rf, and rc have been carefully chosen to define the range of particle size distributions for each aerosol model. These intervals are set at 0.01, 0.01, 0.002, and 0.01 µm, respectively. They are set as a compromise between accuracy and computation time, ensuring that the LUTs encompass a comprehensive range of particle size distributions for various aerosol subtypes found in the real atmosphere. Further details on the parameterization of the bimodal particle size distribution are discussed in the subsequent section.
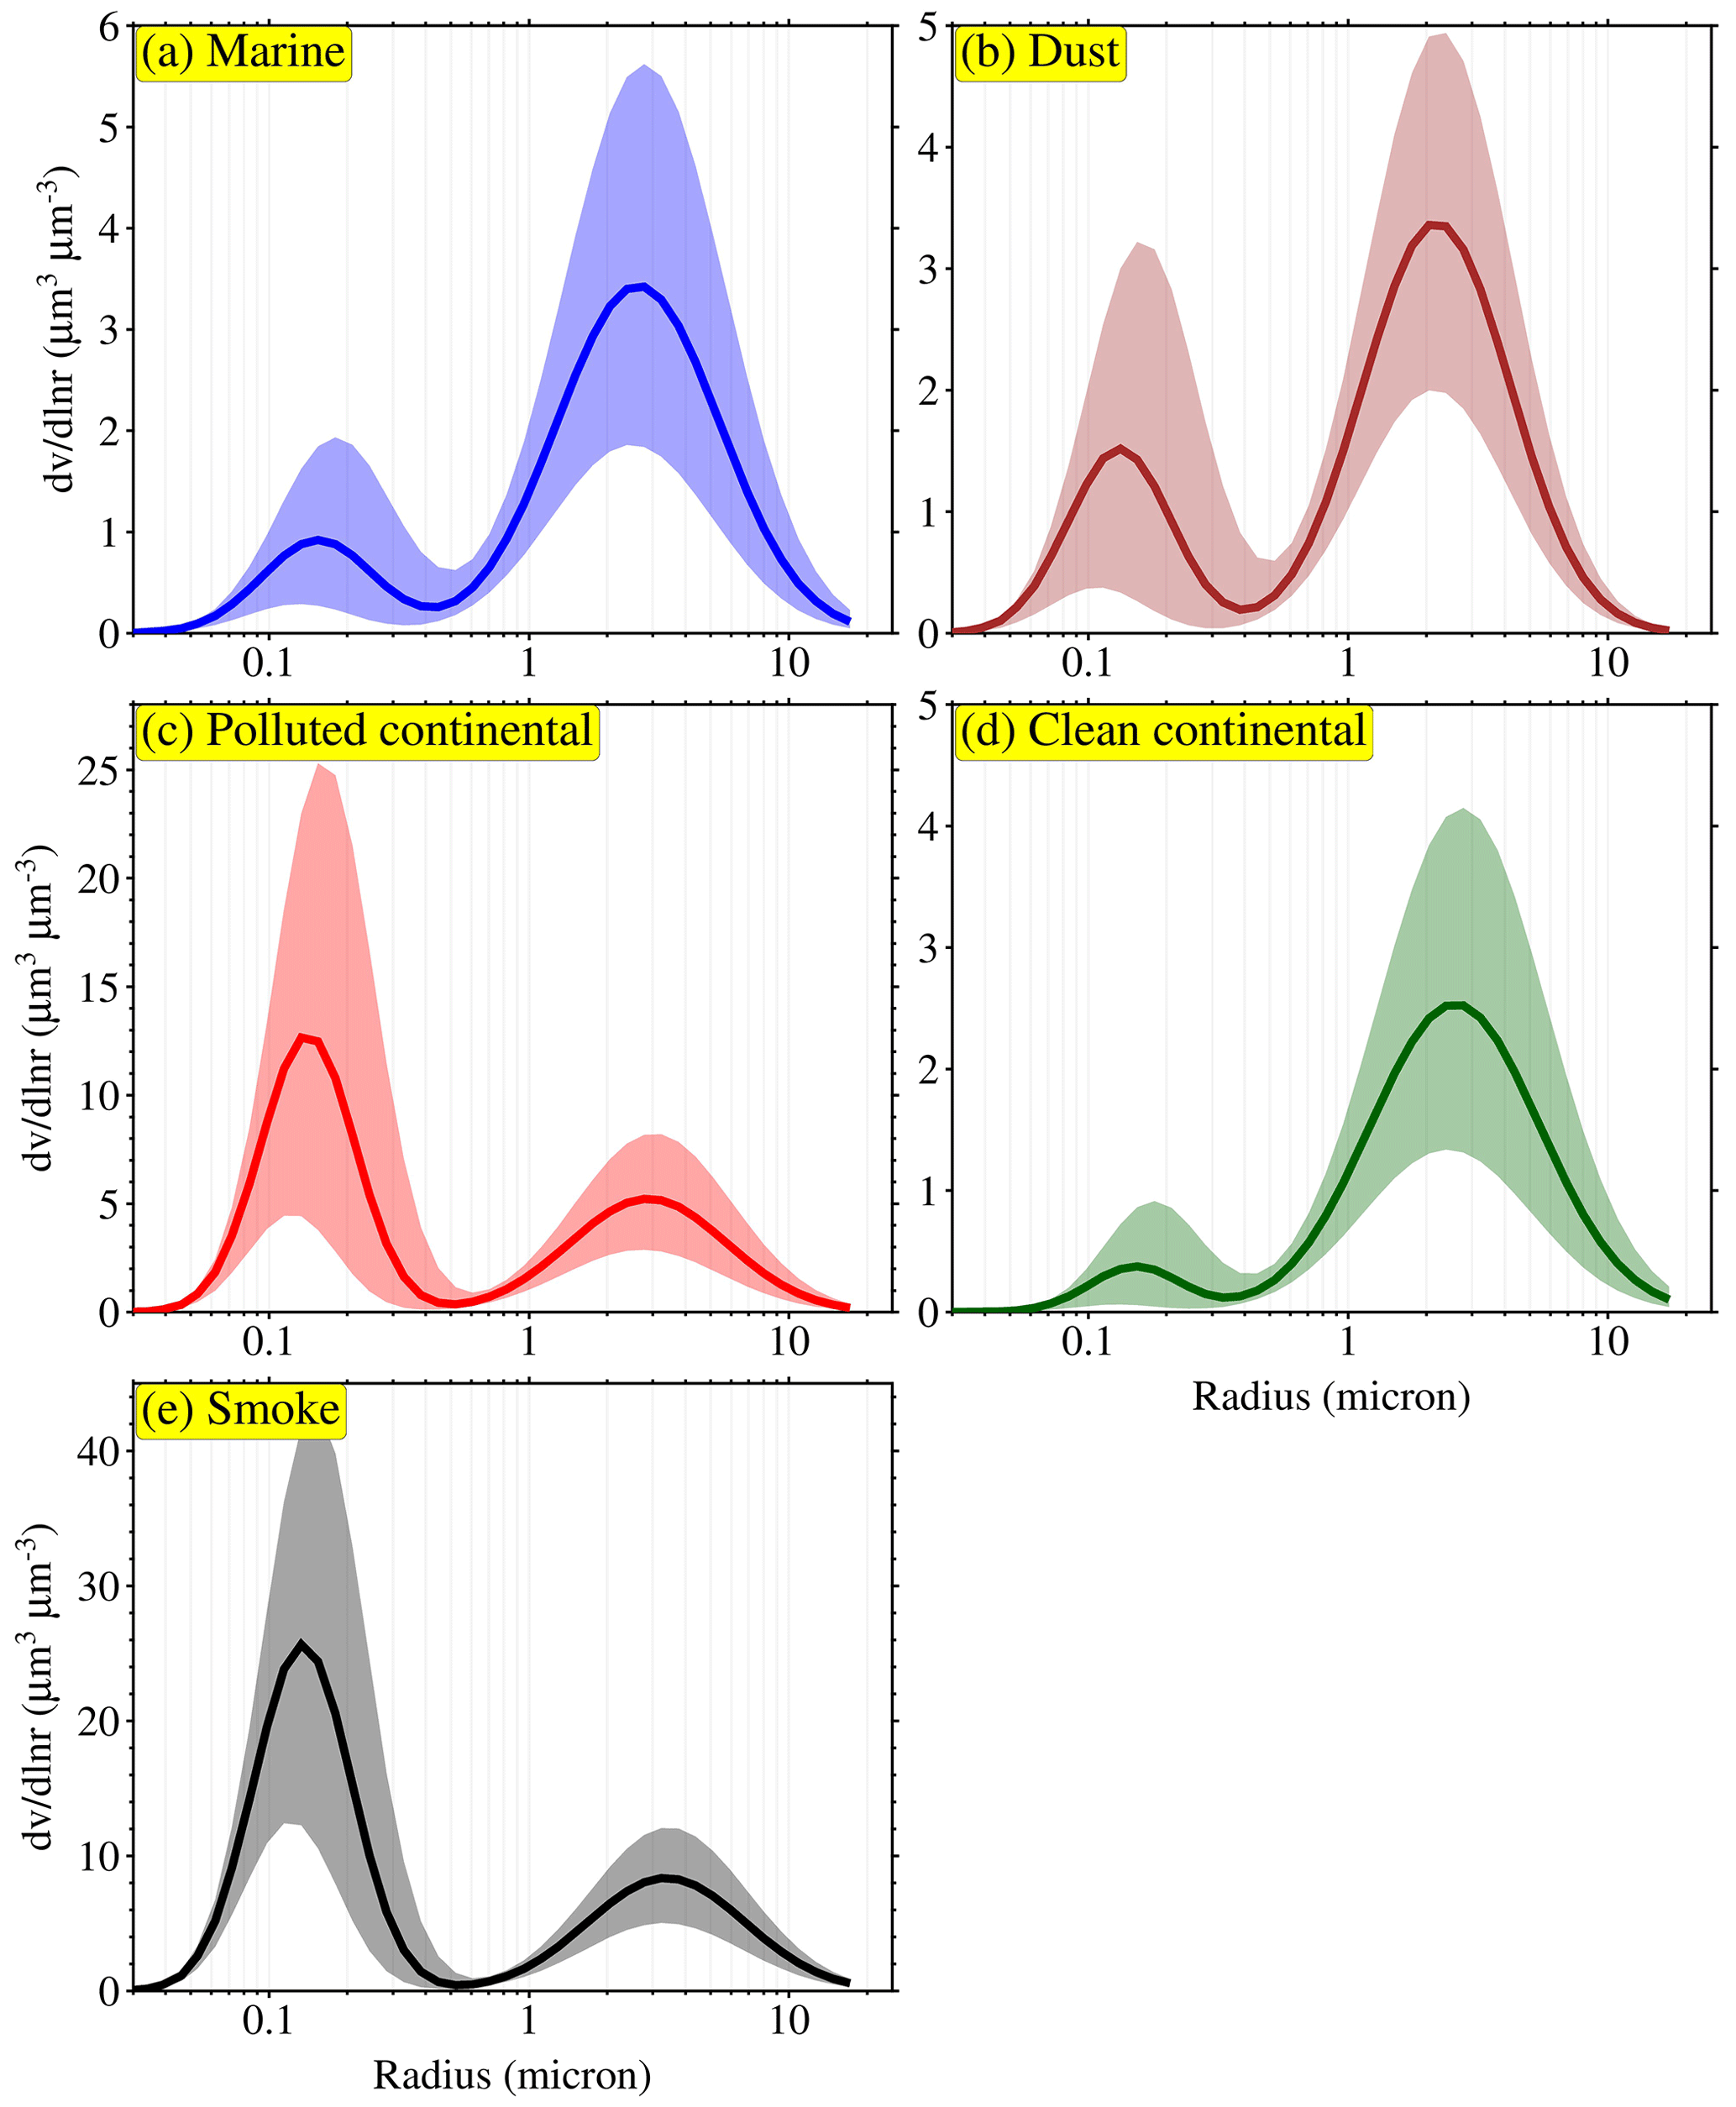
Figure 1Bimodal lognormal particle size distributions for the five aerosol types (marine, dust, polluted continental, clean continental, and smoke aerosols) considered in this study to build the lookup tables (LUTs). These particle size distributions were derived using measurements from sun and sky radiometers at multiple selected AErosol RObotic NETwork (AERONET) sites. Solid line represents the mean of the particle size distribution, whereas the shaded area shows the range of size distribution cover in the respective LUTs.
Table 1Typical parameter ranges for the aerosol bimodal distribution used in our study to construct the LUTs. is the ratio of the volume concentration of the fine mode to the coarse mode. mR and mI represent the mean values of real and imaginary parts of the complex refractive index.
3.1.1 Lognormal aerosol size distributions
An earlier study by Kolmogorov (1941) mathematically proved that the random process of sequential particle crushing leads to a lognormal distribution of particle size. In our study, PSDs have been treated as a bimodal lognormal distribution, as widely used in aerosol remote sensing studies (Dubovik et al., 2011; Remer et al., 2005; Schuster et al., 2006; Torres et al., 2014). Although particle size distributions are not always bimodal in each case, their size distributions can be considered a combination of the fine and coarse modes. This bimodal lognormal size distribution can be expressed as
where Nti is the total particle concentration of the ith mode and is the median radius for the aerosol size distribution, with n representing the number concentration distribution. The index refers to the fine and coarse modes, respectively. The term ln σi is the mode width of the ith mode. This general bimodal lognormal size distribution shape for aerosol is adopted in this study to improve the accuracy of the CCN retrieval. The sensitivity assessment regarding the response of CCN to the assumption of bimodal size distributions is presented in Sect. 3.1. For individual lognormal components, the relationships between the volume and number distribution parameters are represented by the following equations (Hatch and Choate, 1929):
where Vt is the particle volume concentration and rv is the median radius for the aerosol volume size distribution. As shown in Fig. 1 and Table 1, the main difference between the aerosol subtypes is the ratio of the volume concentration of the fine mode to the coarse mode.
3.2 Retrieval of CCN number concentrations
Building upon the methodology proposed by Lv et al. (2018), we have enhanced and generalized the approach to enable its application to airborne and spaceborne lidar measurements for CCN estimation. The core of the algorithm relies on the utilization of LUTs that incorporate aerosol size and composition information, facilitating reliable and vertically resolved CCN estimation. NCCN values are obtained at six critical supersaturations from 0.07 % to 1.0 % based on retrieved particle size distributions. Significant improvements have been implemented within the methodology. Firstly, its applicability has been expanded to accommodate lidar measurements from diverse platforms. Secondly, the LUTs now include five aerosol types, ensuring a more comprehensive representation of aerosol characteristics. Thirdly, the methodology leverages the additional signal of the extinction coefficient at 1064 nm, effectively addressing the uncertainty associated with the non-uniqueness problem during the inversion process. Fourthly, including the hygroscopic growth correction in the revised method has led to significant improvements in the accuracy of CCN estimation, further enhancing the reliability and robustness of the CCN estimation. Finally, the extensive analysis has been conducted by including the errors from relative humidity (RH).
This section discusses a detailed methodology adopted by ECLiAP to retrieve NCCN from the given lidar measurements.
3.2.1 Overview
An optically related NCCN is introduced to bridge the gap between aerosol particles and their activation capability to serve as a cloud droplet. The ability of particles to act as CCN is mainly controlled by particle size distribution followed by chemical composition (Patel and Jiang, 2021; Dusek et al., 2006). However, both factors are significant in specific regions (Mamouri and Ansmann, 2016). Therefore, NCCN could be quantified with size distribution and compositional information. The key feature of an approach adopted in ECLiAP is to seek the parameters that can provide the size and composition of particles consistent with lidar measurements under dry conditions and to use these parameters to estimate NCCN.
Figure 2 illustrates a schematic diagram of the method to retrieve NCCN from satellite observations.
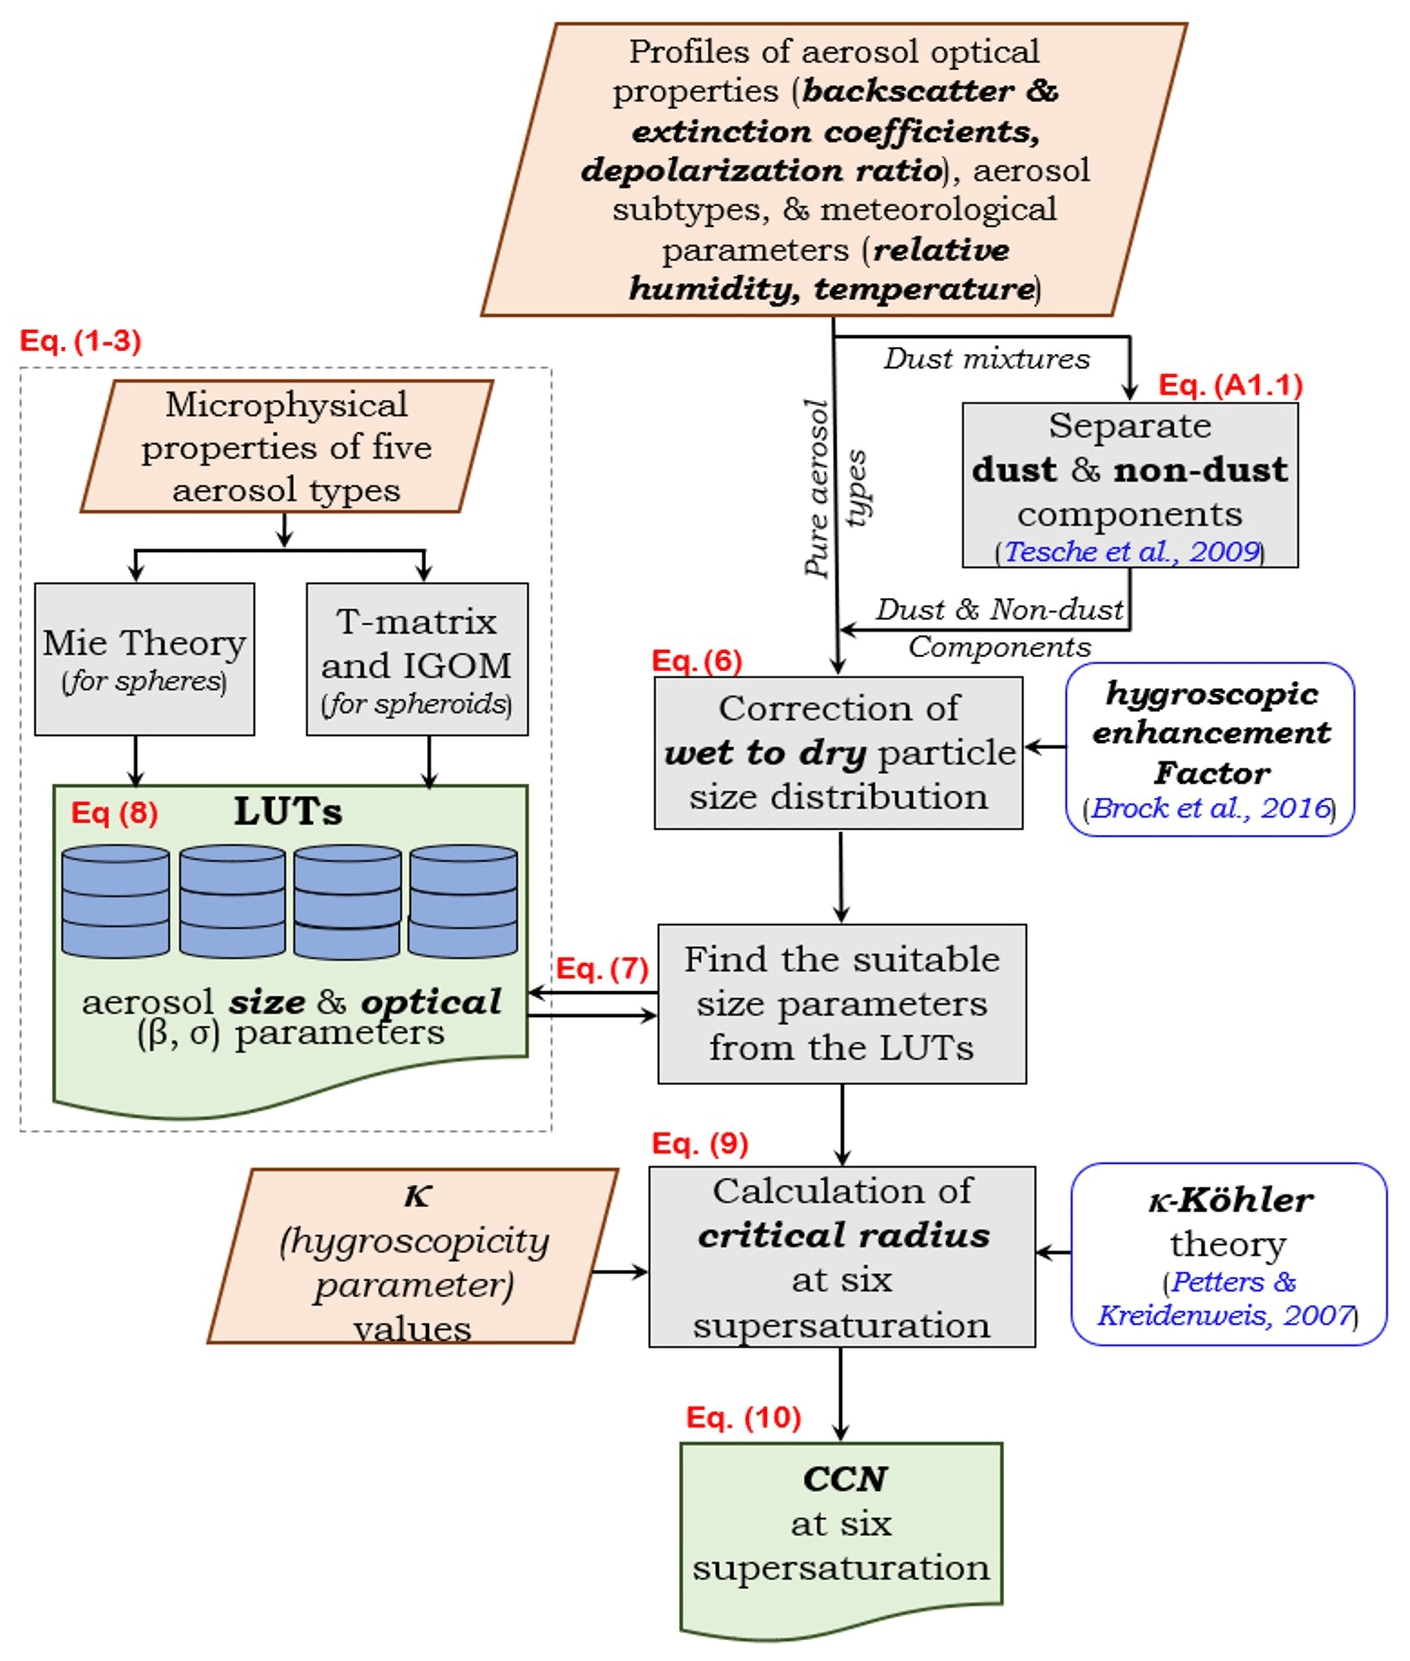
Figure 2Flowchart of the ECLiAP algorithm for the retrieval of NCCN from lidar measurements. The steps within the dotted line box describe the preprocessing which includes the calculation of aerosol optical properties using Mie scattering theory (T-matrix/IGOM for dust) to build lookup tables for five aerosol models. The steps outside the dotted line box represent the retrieval process of NCCN from the given inputs of aerosol optical properties and meteorological parameters. The chart also refers to the used equations associated with a particular retrieval process.
In the natural environment, the particle hygroscopic properties influence the particle size distributions and their optical properties, especially when they are near a cloud base or in a high-moisture environment. Therefore, the lidar-measured aerosol optical properties under ambient conditions need to be corrected to the dry aerosol optical properties using the hygroscopic enhancement factor. The hygroscopic enhancement factor can be fitted by the parameterization scheme using enhancement of backscatter and extinction coefficients with RH. Particle dry backscatter and extinction can also be inferred from the hygroscopic enhancement factor. An approach to computing hygroscopic enhancement factors and performing hygroscopic correction to obtain dry backscatter and extinction is described in Sect. 2.2.2. This step is applied to all the 3β+3α parameters before looking for aerosol size parameters from the LUT. Before applying hygroscopic correction, lidar-measured optical properties, particularly for dust mixtures (polluted dust and dusty marine), are separated into dust and non-dust components using the backscatter coefficients and particle depolarization ratios (Tesche et al., 2009). The methodology to separate the dust mixture is discussed in Appendix A1. The resulting dust and non-dust aerosol optical properties, along with aerosol subtype and relative humidity, are then utilized in the ECLiAP algorithm (as shown in Fig. 2) to estimate CCN concentrations. Note that the direct inclusion of internal mixtures in our analysis and LUTs poses complexity and challenges. As a result, our approach primarily centers on studying and analyzing external mixtures of aerosol subtypes.
Once the dry aerosol optical properties are derived, ECLiAP looks for the suitable size parameters from the LUTs for the given dry aerosol optical properties and respective aerosol subtypes (see Sect. 2.2.3). As mentioned earlier, the ability of particles to act as CCN is mainly controlled by particle size distribution, followed by chemical composition. Deriving composition information of particles from the lidar measurements is not yet well-defined. Therefore, in the absence of chemical composition data, mean chemical composition information denoted by a single value of κ, the so-called hygroscopicity parameter, is achievable for estimating NCCN, which describes the relationship between the particle dry diameter and CCN activity. The sensitivity of the estimated NCCN to κ depends strongly on the variability of the shape of the aerosol size distribution (Wang et al., 2018). Therefore, the chemical information becomes less important in estimating NCCN, especially at higher supersaturation (Patel and Jiang, 2021). Most studies reported that the uncertainty of using the mean value of κ to estimate NCCN is less than 10 % (Jurányi et al., 2010; Wang et al., 2018), which varies with atmospheric conditions. In ECLiAP, the literature values of κ are considered for each aerosol subtype for further retrieval. κ is assumed to be 0.7 for marine (Andreae and Rosenfeld, 2008), 0.03 for dust (Koehler et al., 2009), 0.27 for polluted continental (Liu et al., 2011), 0.3 for clean continental (Andreae and Rosenfeld, 2008), and 0.1 for smoke aerosols (Petters et al., 2009) for the later computations.
Finally, ECLiAP uses the retrieved optically equivalent size parameters from LUTs and κ values as composition information for the further computation of critical radii using κ-Köhler theory (Petters and Kreidenweis, 2007) and hence the NCCN for the six fixed supersaturations (see Sect. 2.2.4). For the dust mixture, NCCN values derived separately for both dust and non-dust are added last.
3.2.2 Separation of optical properties for dust mixtures
We have adopted the methodology by Tesche et al. (2009) to separate the dust and non-dust extinction coefficients in the dust mixtures (polluted dust and dusty marine) using particle backscatter coefficients and particle depolarization ratios. The optical properties are
This study incorporates wavelength-dependent depolarization ratios δ1 and δ2 to distinguish between the dust and non-dust aerosol components. The reported particle depolarization ratio from various campaigns is listed in Table S1 in the Supplement. In this study, mean values of δ1 (0.24, 0.31, and 0.06) and δ2 (0.03, 0.05, and 0.02) at 355, 532, and 1064 nm, respectively, are utilized. If the measured depolarization ratio is δp > δ1 (< δ2), then the aerosol mixture is considered pure dust (non-dust). For the remaining δp values, we first estimate βd using the above equation and then calculate βnd by subtracting βd from βp. Subsequently, the extinction coefficients are computed by multiplying the backscatter coefficients by the respective lidar ratio. Determining a spatially varying lidar ratio for dust across different regions presents challenges due to uncertainties in identifying dust source regions during transport. Therefore, we employ a simplified approach using a single lidar ratio value. Previous studies have reported little to no wavelength dependency of the lidar ratio for dust and marine aerosol based on ground-based Raman lidar and airborne HSRL lidar measurements. As a result, we consider constant lidar ratios of 44 for dust and 23 for marine to calculate the extinction coefficients at the three wavelengths. However, for polluted continental aerosols, we utilize wavelength-dependent lidar ratios of 58, 70, and 30 at 355, 532, and 1064 nm (Giannakaki et al., 2016; Hänel et al., 2012; Komppula et al., 2012; Kim et al., 2018; Müller et al., 2007).
3.2.3 Derivation of dry backscatter and dry extinction
It is difficult to measure the complex chemical composition and associated water uptake capability of a particle with increasing RH. Therefore, a widely popular and simple parameterization scheme was used to describe the changes in aerosol optical properties with atmospheric RH relative to a dry (or low-RH) state, also called the hygroscopic enhancement factor. Recent aerosol hygroscopic studies (Lv et al., 2017; Fernández et al., 2018; Bedoya-Velásquez et al., 2018) have derived backscatter and extinction enhancement factors using lidar measurements and RH profiles. The hygroscopic enhancement factor that is associated with both particle size and hygroscopicity (Kuang et al., 2017) is defined as
where fξ is the hygroscopic enhancement factor of the optical property ξ (backscatter and extinction) at a specific light wavelength λ and RH, and RHdry is the reference RH value (RH = 0). There is no generic reference RH that represents the dry conditions for lidar measurements, unlike in situ controlled RH measurements, to derive the enhancement factor. Inferring dry backscatter and extinction coefficients is also crucial in CCN retrieval. Therefore, parameterization of the hygroscopic growth of lidar-derived optical properties should combine dry aerosol optical properties and fξ(RH,λ). Previous studies have proposed several parameterization schemes for hygroscopic enhancement factors (Titos et al., 2016). The most frequently used parameterization scheme is a power-law function that is known as gamma parameterization, introduced by Kasten (1969):
where the parameter A gives the extrapolated value at RH = 0 % and the exponent γ is the fitting parameter and defines the hygroscopic behavior of the particles. Recently, a new physically based single-parameter representation approach was proposed by Brock et al. (2016) to describe the hygroscopic enhancement factor. Their results claimed that this proposed parameterization scheme better describes light-scattering hygroscopic enhancement factors than the widely used gamma power-law approximation. The formula of this new scheme is written as
where κξ is a dimensionless fitting parameter and shows a significant correlation with bulk hygroscopic parameter κ, but they are not equivalent (Brock et al., 2016; Kuang et al., 2017). ξdry denotes dry aerosol optical properties (backscatter and extinction coefficients).
For the estimation of the hygroscopic enactment factor, aerosol optical properties (backscatter and extinction coefficients) at 355, 532, and 1064 nm are calculated over a range of RH (0 %–99 %) using Mie theory (TMM and IGOM for spheroids) for the range of PSDs and each aerosol subtype. Figure S1 in the Supplement illustrates the mean curve of the hygroscopic enhancement factor (the ratio between the aerosol optical properties at a specific RH to a dry RH) at three wavelengths with an increasing RH for each aerosol subtype. With given aerosol optical properties at different RHs, κξ can be fitted by curve fitting using Eq. (6). However, Tan et al. (2019), based on a comparison of κξ and derived ξdry for various ranges of RH, showed that the fitting hygroscopic parameters are found to be sensitive to the fitting RH range when the RH range is limited and relatively high (between 60 % and 90 %). Therefore, we fixed the RH range to 60 %–90 % for the parameter fitting (highlighted curve in Fig. S1). In addition, retrieving finite dry aerosol optical properties could not be possible for the observation with RH > 99 %. Therefore, ECLiAP only applies the hygroscopic correction when RH is between 40 % and 99 %. In ECLiAP, individual κξ values for each aerosol optical property at three different wavelengths, along with the RH value, are used to obtain the dry aerosol optical properties separately for each aerosol subtype using Eq. (6).
3.2.4 Inversion techniques for size parameters
ECLiAP utilizes an inverse approach, distinct from traditional methods, to estimate the particle size distribution from LUTs using lidar inputs. This process involves inferring particle size distributions from known aerosol optical properties, determining the best-fitting solution that corresponds to the observed lidar measurements. It differs from the traditional 3α+2β technique typically used for inversion.
Once the dry aerosol optical properties are obtained, ECLiAP searches for suitable size parameters from the LUTs. For this, ECLiAP looks for the best combination of six values ( to match inputs (β355,β532, β1064, α355, α532, α1064) by minimizing the following function:
where xi represents input aerosol optical data (β355, β532, β1064, α355, α532, α1064), and xi′ is aerosol optical data (, , , , derived from LUTs, which are calculated from Mie theory (or T-matrix and IGOM for spheroids) and size distribution parameters.
Each LUT consists of two parts to reduce the dimensions and sizes of LUTs. Therefore, the particle size distribution, as shown in Eq. (1), can be rewritten as
where xf and xc refer to the database precomputed with (σf, rf, and r) and (σc, rc, and r), respectively. Furthermore, we have adopted the successive approximation method (Kantorovitch, 1939) to deal with the extensive range of Ntf and to speed up finding the closest solution. Therefore, the inversion technique is further divided into two steps. Step 1: search for an approximate solution based on the criterion in Eq. (8) and calculate the corresponding aerosol optical data (, , , , from the databases (xf and xc) and Ntf and Ntc. The step widths of Ntf and Ntc are considered to be 100 and 0.1 cm−3, respectively. Step 2: based on the approximate solution obtained in step 1, determine the smallest solution space of Ntf by repeating the procedure in step 1 using a smaller step width of 10 cm−3 for Ntf. Search for the optimal solution of six size parameters (Ntf, rf,σf, Ntc,rc, σc).
3.2.5 Estimation of NCCN
For the given aerosol optical properties, the retrieved size parameters and the associated hygroscopicity parameter (κ, as discussed in Sect. 2.2.1) were used to calculate the critical radius. The critical radius (rcrit) above which all particles are activated into droplets for a certain supersaturation ratio (Sc) can be computed from κ-Köhler theory, as suggested by Petters and Kreidenweis (2007):
where Dcrit is the critical diameter (; , Mw, and ρw are the molecular weight and water density; R and T are the ideal gas constant and the absolute temperature, respectively; and J m−2. The critical radius is determined at six critical supersaturations for activation (0.07 %, 0.1 %, 0.2 %, 0.4 %, 0.8 %, and 1.0 %). While lidar measurements are more sensitive to particles with sizes around 50 nm and larger, this method incorporates factors such as particle size distribution, chemical composition, supersaturation levels, and thermodynamic properties to estimate the critical radius, even for particles below the typical lidar sensitivity range.
Finally, ECLiAP calculates NCCN by integrating the size distribution from the critical radius to the maximum radius as
4.1 Sensitivity analysis
Evaluating the algorithm is a challenging task in the absence of standard and reliable measurements. The performance of ECLiAP is evaluated using numerically simulated observations with different error characteristics.
4.1.1 Retrieval of NCCN with error-free data
To assess the inversion performance and stability ECLiAP, we first performed a sensitivity analysis under the assumption of error-free lidar measurements. We used 2000 different sets of bimodal size distributions for each aerosol subtype and used them to simulate the lidar observations. The retrieval was repeated for each simulated lidar observation, and the retrieved size parameters were used to calculate the errors in the retrieved NCCN ( with respect to the initial inputs (. The errors were calculated as the percentage difference using Eq. (8).
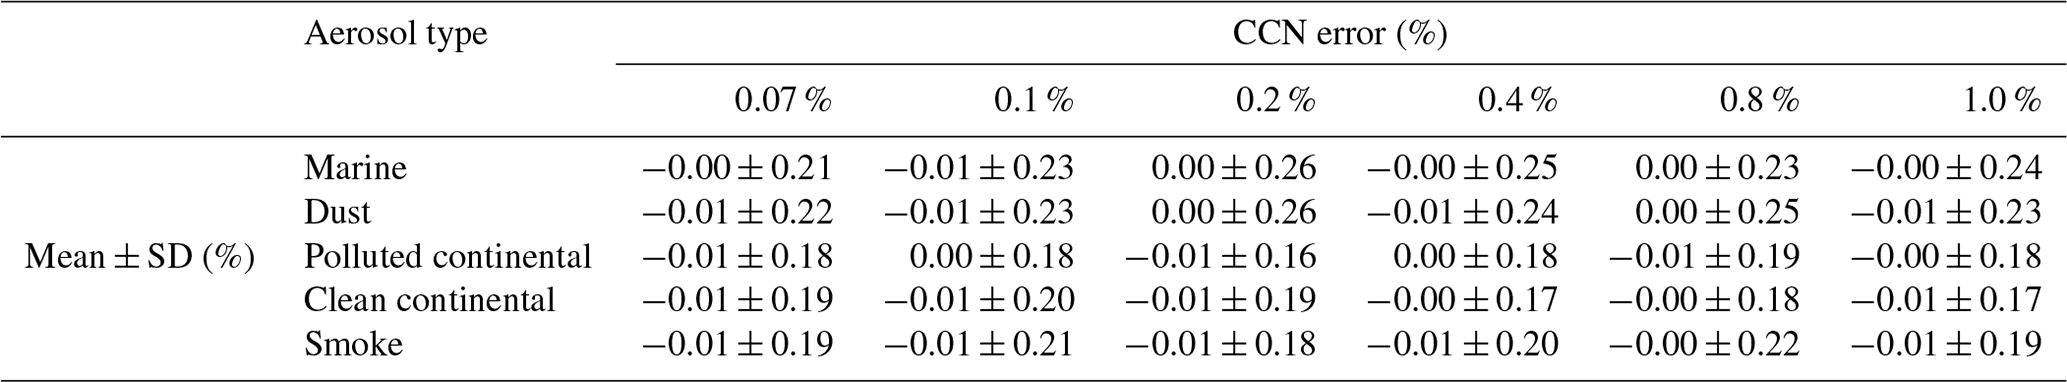
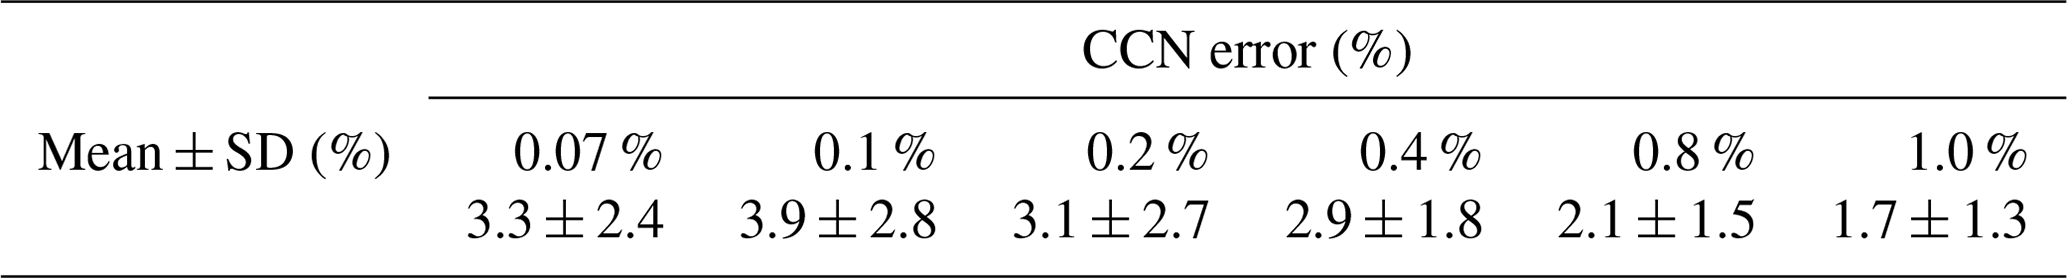
Table 2 lists the statistical results of CCN error for each aerosol type. As the number shows, the initial NCCN is reproduced well from the error-free inputs for each aerosol size distribution. The standard deviation of the retrieved CCN errors from the different sets of bimodal size distribution data is also estimated along with the mean value to determine the range of the retrieved CCN error. As mentioned above, the appropriate balance between the accuracy and processing time of the LUTs provides a mean CCN error close to zero but not equal to zero. However, the small standard deviation (< 0.25) indicates the smaller variances of errors among the aerosol size distributions. Although the high accuracy of LUTs provides a CCN error closer to zero, the calculations are more time-consuming. In general, the retrieval results shown in Table 2 exhibit good accuracy and stability of the inversion algorithm for each aerosol subtype.
Table 2CCN errors at the six supersaturations (SSs) retrieved from error-free inputs for the five aerosol types.
Additionally, the sensitivity of the NCCN retrieval to the assumption of the bimodal size distribution is tested against the aerosol size distribution measurements at the U.S. Department of Energy's Atmospheric Radiation Measurement (ARM) climate research facility at the Southern Great Plains (SGP) site. Particle size distribution was measured simultaneously by an Ultra-High Sensitivity Aerosol Spectrometer (for the 0.07 to 1 µm geometric diameter range) and an Aerodynamic Particle Sizer (TSI-3321, for the 0.7 to 5 µm aerodynamic diameter range). The size conversion factor, defined as the ratio of aerodynamic diameter to geometric diameter, was used to construct a trimodal lognormal particle size distribution. For the purpose of this study, the corresponding bimodal fits are produced that are representative of the observed size distributions. Figure S2 shows an example of the observed aerosol size distribution and the corresponding bimodal fits. The comparison suggests that bimodal lognormal size distributions can qualitatively represent the observed aerosol size distributions well. Later, we calculate NCCN based on the bimodal fits and compare it to the 100 observed size distributions to quantify the errors arising from the bimodal lognormal fits. The associated κ values are estimated based on observed PSDs and NCCN values as described in Patel and Jiang (2021). The induced CCN errors from the bimodal fitting are shown in Table 3. The absolute value of NCCN retrieval errors is 3.9 %, with a standard deviation of 2.8 % at 0.1 % supersaturation. Overall, the results suggest that bimodal lognormal aerosol size distributions are adequate for retrieving NCCN, but errors from the bimodal assumption are not negligible.
Table 3Sensitivity of CCN retrieval to the bimodal fits at different supersaturation ratios from the 100 aerosol size distributions obtained from ARM-SGP. The CCN error is calculated as an absolute value.
4.1.2 Impact of systematic and random errors on NCCN retrieval
Both systematic and random errors exist in lidar-retrieved measurements (Mattis et al., 2016). Systematic errors can be induced by experimental conditions, retrieval algorithms, data processing methods, and our understanding of physical interactions. Sensitivity analysis tests the impacts of systematic errors from backscatter and extinction coefficients on NCCN retrieval. Although the systematic errors of different parameters are correlated, the errors are considered independent for individual lidar measurements in the simulations. The error range is reasonable for most current lidar systems. The systematic errors ranging from −20 % to 20 % with an interval of 5 % are applied to one input parameter at a time (others are kept error-free) in each test to understand the impacts on individual parameters better. The inversion algorithm is performed to obtain a new set of aerosol size distributions and to retrieve NCCN data. The procedure is repeated for each input parameter and error value with 200 sets of the randomly generated size distribution for each aerosol subtype. The percentage errors in NCCN associated with systematic errors can be estimated by comparing retrieved and initial values of NCCN using Eq. (11). Note that we have also conducted additional simulations for higher ranges of the error and found that our results are unchanged. However, Pérez-Ramírez et al. (2013) demonstrated that larger errors in the input data can cause significant and unpredictable deviation in the retrieved results. The error range ±20 % is reasonable for most lidar systems.
Figure 3 illustrates the error in retrieved NCCN as a function of the systematic errors in backscatter and extinction coefficients. The slope of the curve indicates the sensitivity of CCN errors to systematic errors in individual parameters. A steeper slope infers a high sensitivity in the NCCN retrieval to the systematic error for a given input parameter. Errors in retrieved NCCN increase as errors of backscatter and extinction increase, and it is even steeper at higher supersaturations. In general, NCCN retrievals are most sensitive to errors in extinction coefficients, followed by backscatter coefficients. Interestingly, the results are less sensitive to errors in backscatter coefficients at lower supersaturations (≤ 0.2 %) but are relatively more sensitive at higher supersaturations (> 0.2 %). This indicates that reducing uncertainties in the extinction coefficients can effectively improve the accuracy of NCCN retrieval, while reducing uncertainty in backscatter coefficients can be beneficial for retrieving NCCN at higher supersaturation. Errors in α355 influence the retrieval results the most. On average, a positive relative error of 20 % in α355 overestimates the NCCN retrieval by about 20 % at lower supersaturation and by about 50 % at higher supersaturation. A negative error of 20 % in α355 underestimates the NCCN retrieval, and the degree of impact is slightly higher than the positive error. Errors in α532 and α355 have the opposite effect on the retrieval error. It is also clear that the influence of systematic errors on the retrieval of NCCN varies with the activation radius, as elucidated by the different signs of the slopes. For instance, the slopes of the extinction coefficient for dust aerosols reverse the sign when the activation radius exceeds low to high supersaturations. These differences most likely result from the reduced retrieval sensitivity to the coarse mode of the aerosol size distribution. In addition, there are substantial distinctions between the types of aerosols. Dust and marine aerosols have the largest absolute errors compared to others dominated by fine-mode particles (see Table 2). These collectively indicate that there are better constraints for fine-mode aerosols than for coarse-mode aerosols, which introduce a larger retrieval error in NCCN for aerosols with more weight in the coarse mode. It is noteworthy that incorporating an additional input signal of extinction coefficients at 1064 nm in ECLiAP reduces the error by ∼ 20 % in the coarse-mode-dominated aerosol subtypes (dust and marine) and ∼ 15 % in total compared to previous studies (Lv et al., 2018; Tan et al., 2019). Nevertheless, integrating an additional lidar signal at a wavelength longer than 1064 nm may further reduce retrieval error for the coarse-mode-dominated aerosol type.
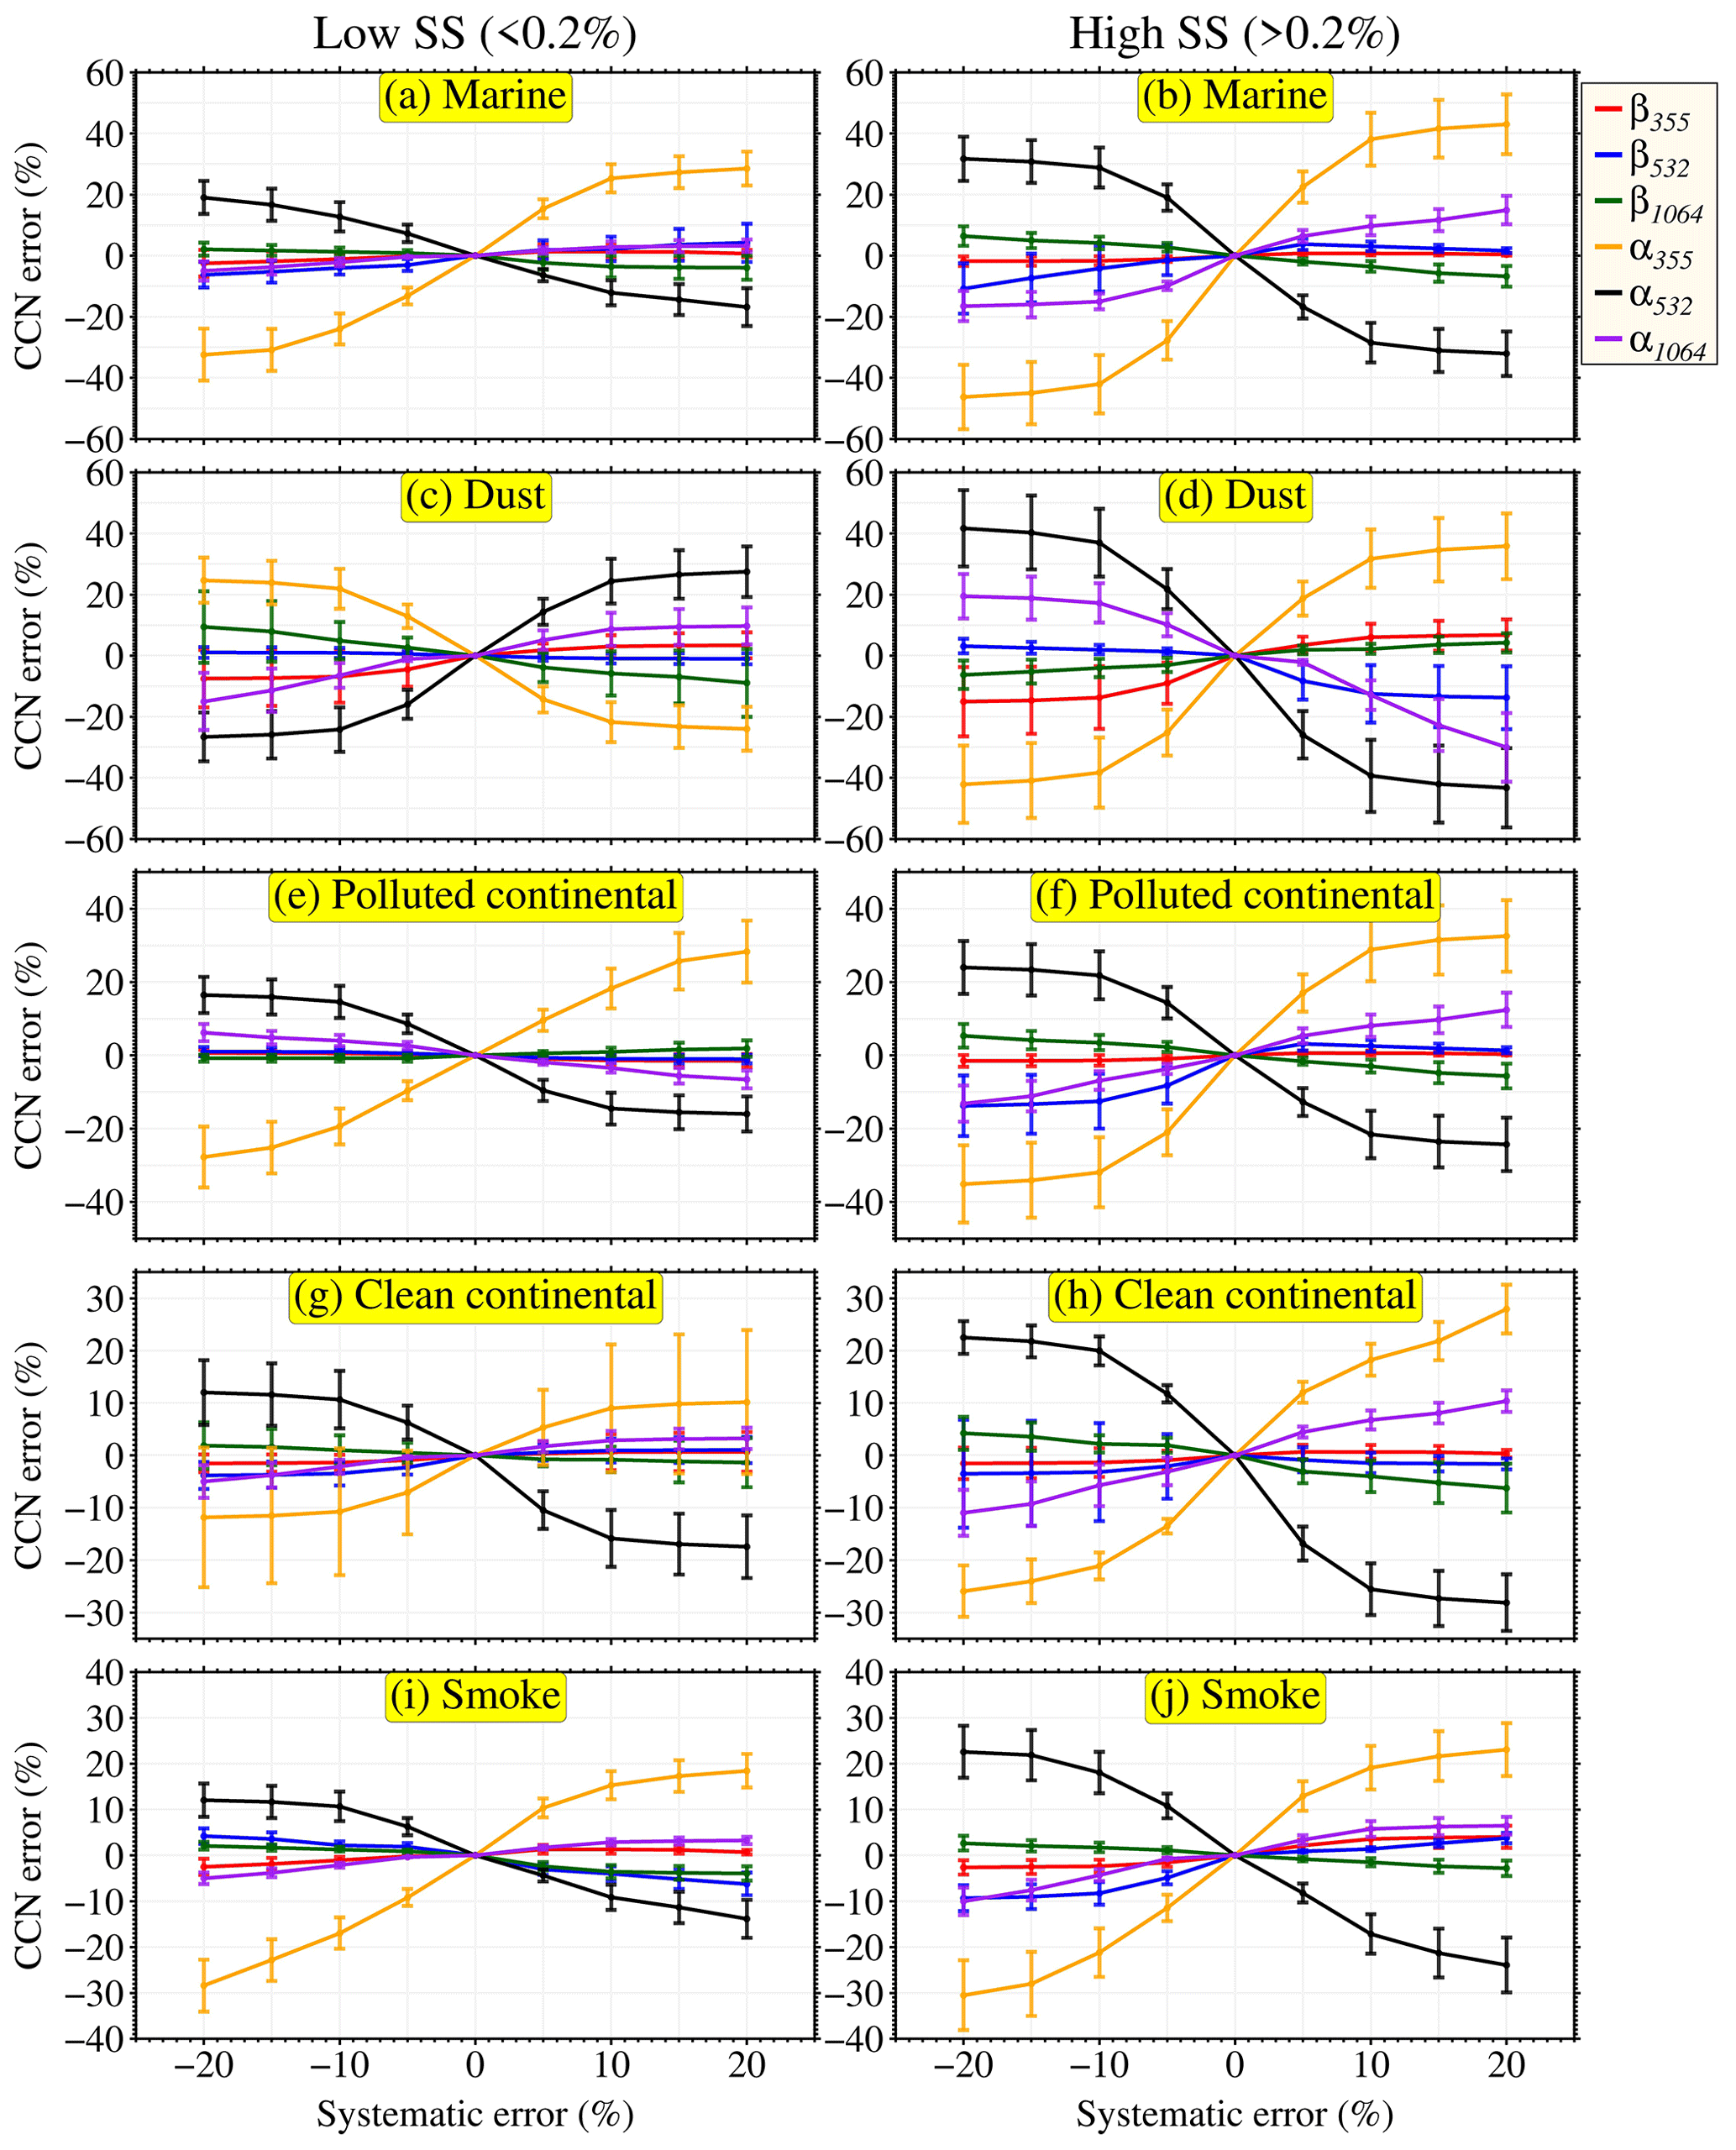
Figure 3Systematic errors in retrieved NCCN. This represents the errors in retrieved NCCN as a function of systematic errors in backscatter and extinction coefficients at all three wavelengths for low (≤ 0.2 %) and high (> 0.2 %) supersaturations and for all five aerosol subtypes. The markers denote the mean value, and the error bars represent the standard deviation.
RH is another crucial parameter in the present retrieval algorithm for NCCN. Errors in RH derived by remote sensing or reanalysis influence the values of growth factors and result in the dry aerosol optical properties, which in turn influence all the input parameters. Therefore, systematic errors ranging from −10 % to 10 % in intervals of 2 % are considered for RH. Figure 4 shows the result of systematic errors in RH. We observed that NCCN is overestimated when RH has a negative systematic error, and the extent of overestimation in NCCN increases as the error increases. A negative error of 10 % in RH overestimates NCCN at lower supersaturation by about 20 % and doubles at higher supersaturation. The effects of the positive errors in RH are relatively smaller and more complicated than negative errors. The mean retrieval error peaked at the RH error at 6 %, and the standard deviation of the retrieval error increased with the RH error. This suggests that underestimating RH causes larger errors than overestimation. Therefore, extra care should be given to RH measurements if RH-related hygroscopic enhancements of aerosol optical properties are considered.
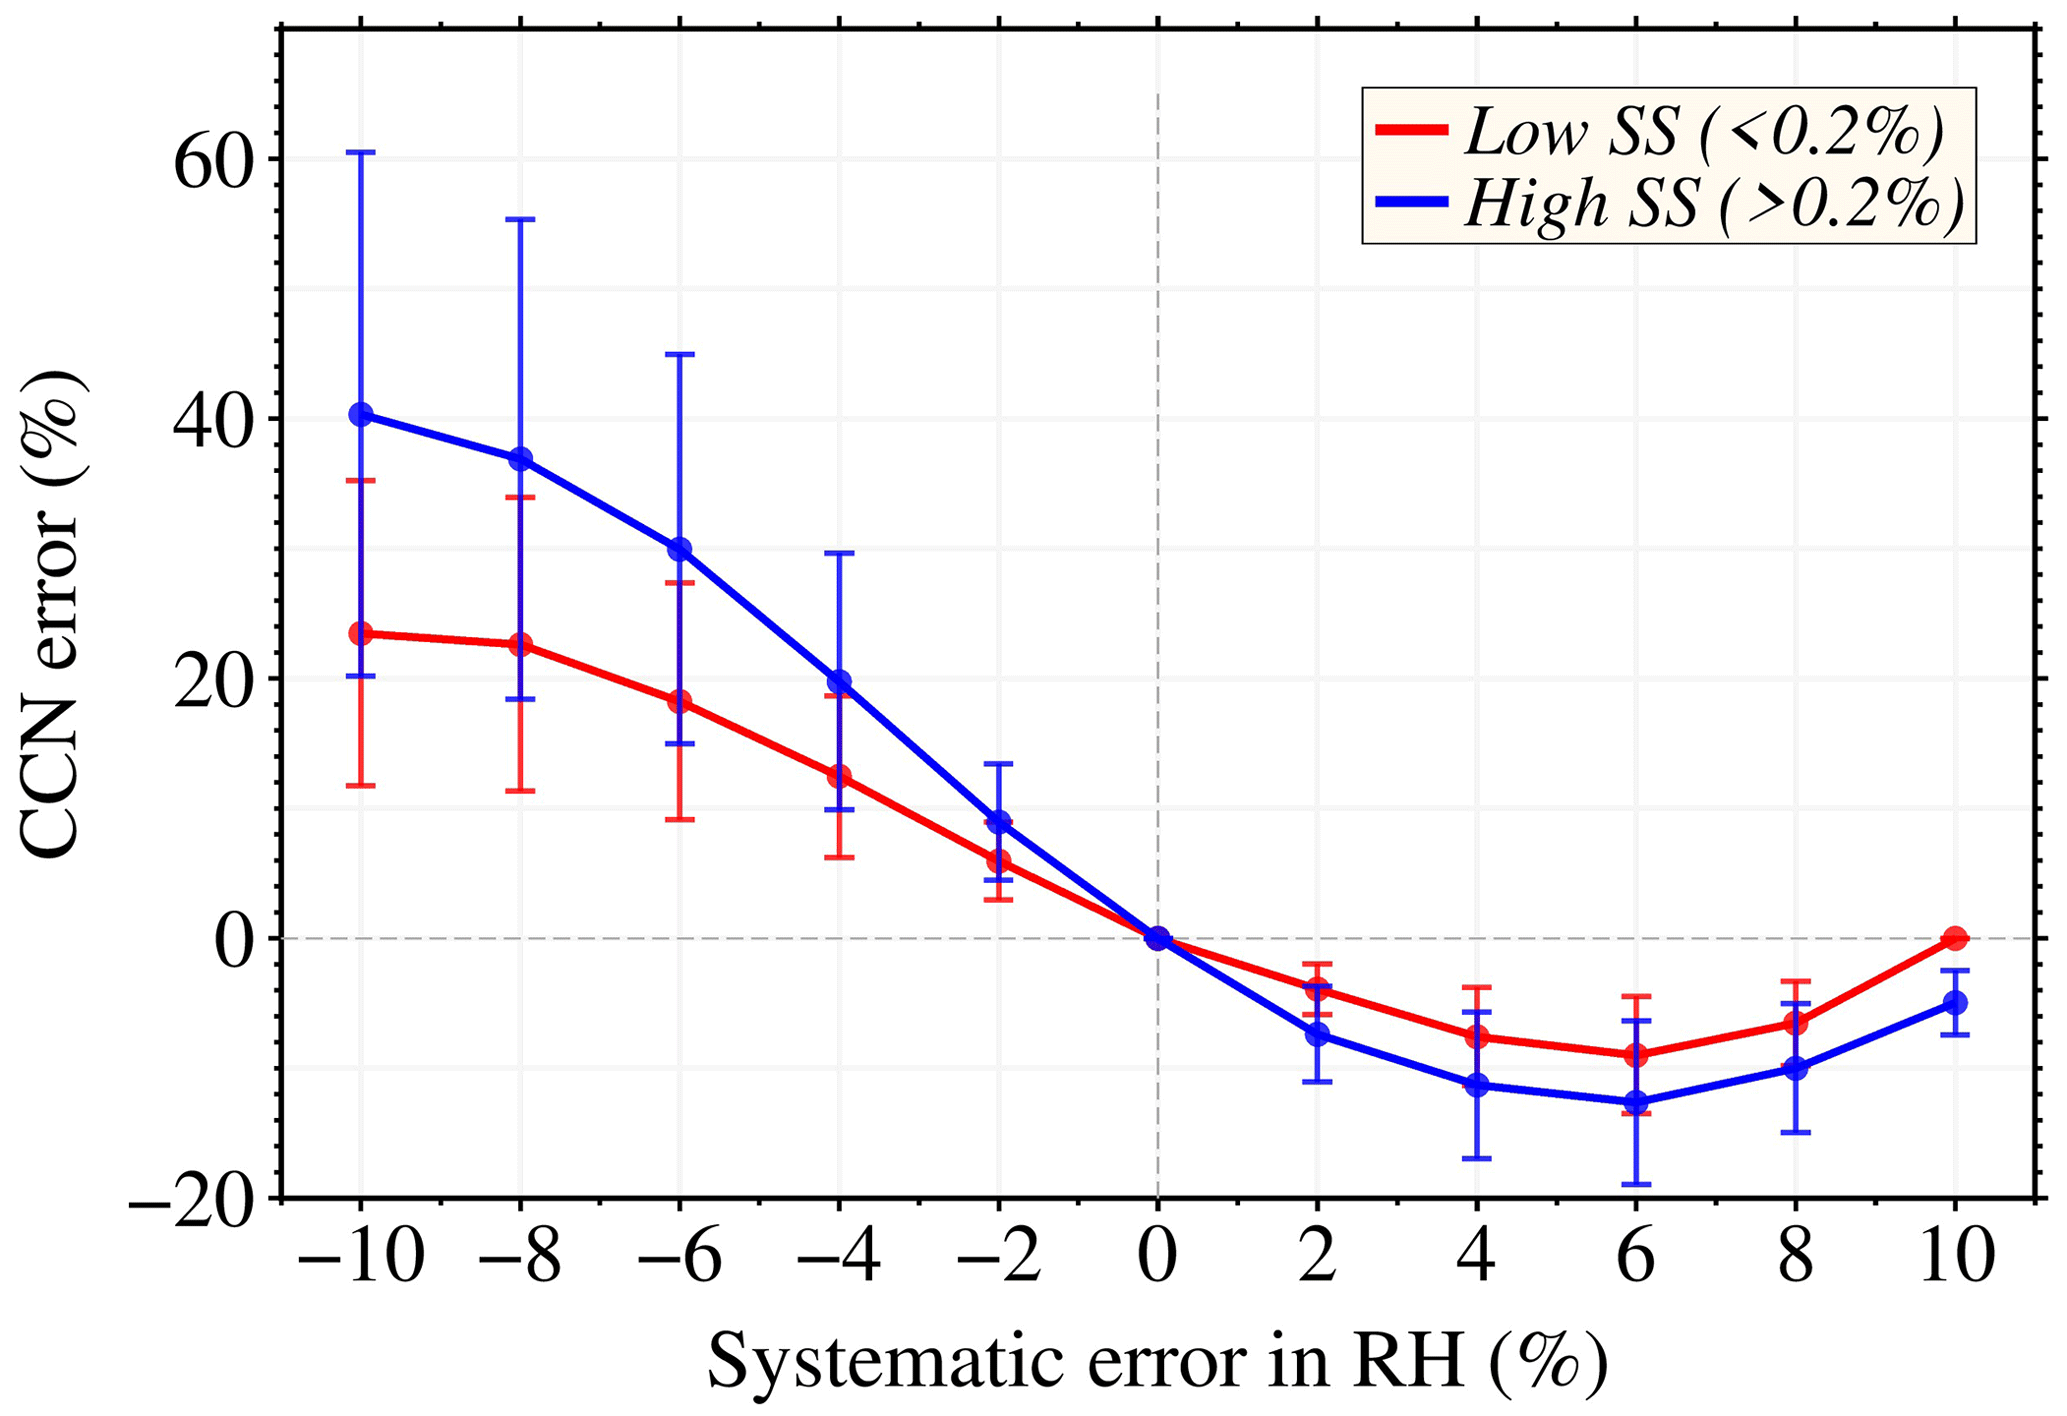
Figure 4Systematic errors in retrieved NCCN. This represents the errors in retrieved NCCN as a function of systematic error in RH, combined for all aerosol subtypes at low (≤ 0.2 %) and high (> 0.2 %) supersaturations. The markers denote the mean value, and the error bars represent the standard deviation.
Systematic errors introduce mean biases into NCCN retrievals, whereas random errors in observations produce random NCCN retrieval errors. Random errors obeying Gaussian distributions are produced arbitrarily with a mean value of zero. The standard deviations are set to 10 % for aerosol optical properties and to 5 %, 10 %, and 20 % for RH in each test. The simulation is repeated 5000 times for each aerosol subtype, and the statistical results are presented in Fig. 5. The mean values of relative error are presented by color, and the number indicates the standard deviation. The error does not change significantly as the random error of RH increases. The mean random errors are relatively small and non-zero, mainly because the sensitivities of NCCN retrievals are different for different aerosol optical data. The standard deviations are within 16 %–28 %. The results reveal that random errors in the given input parameters may also contribute to systematic errors in the NCCN retrievals. The largest mean relative errors are found for coarse-mode-dominated aerosol subtypes (dust and marine), consistent with the sensitivities to systematic errors. As discussed earlier, considering additional lidar measurements at longer wavelengths that are more sensitive to larger particles could improve the retrieval of NCCN for the coarse-mode-dominated aerosol subtypes. The mean values of relative errors increase with increasing supersaturation for all the aerosol types. Errors in the retrieved NCCN follow a Gaussian distribution for low supersaturation. However, the Gaussian shape disappears, and the high frequencies shift to the edge of the distribution when supersaturation shifts from low to high (not shown here). Furthermore, the influence of random errors on the individual input parameters is also assessed and is shown in Fig. S3. Random errors underestimate the enhancement factor (κξ) by 30 %–40 % for 5 % RH error, 45 %–60 % for 10 % RH error, and 65 %–75 % for 20 % RH error. The relative errors in β are likely to be overestimated, whereas they are underestimated in α. The absolute relative error of input parameters becomes larger as the random error of RH grows.
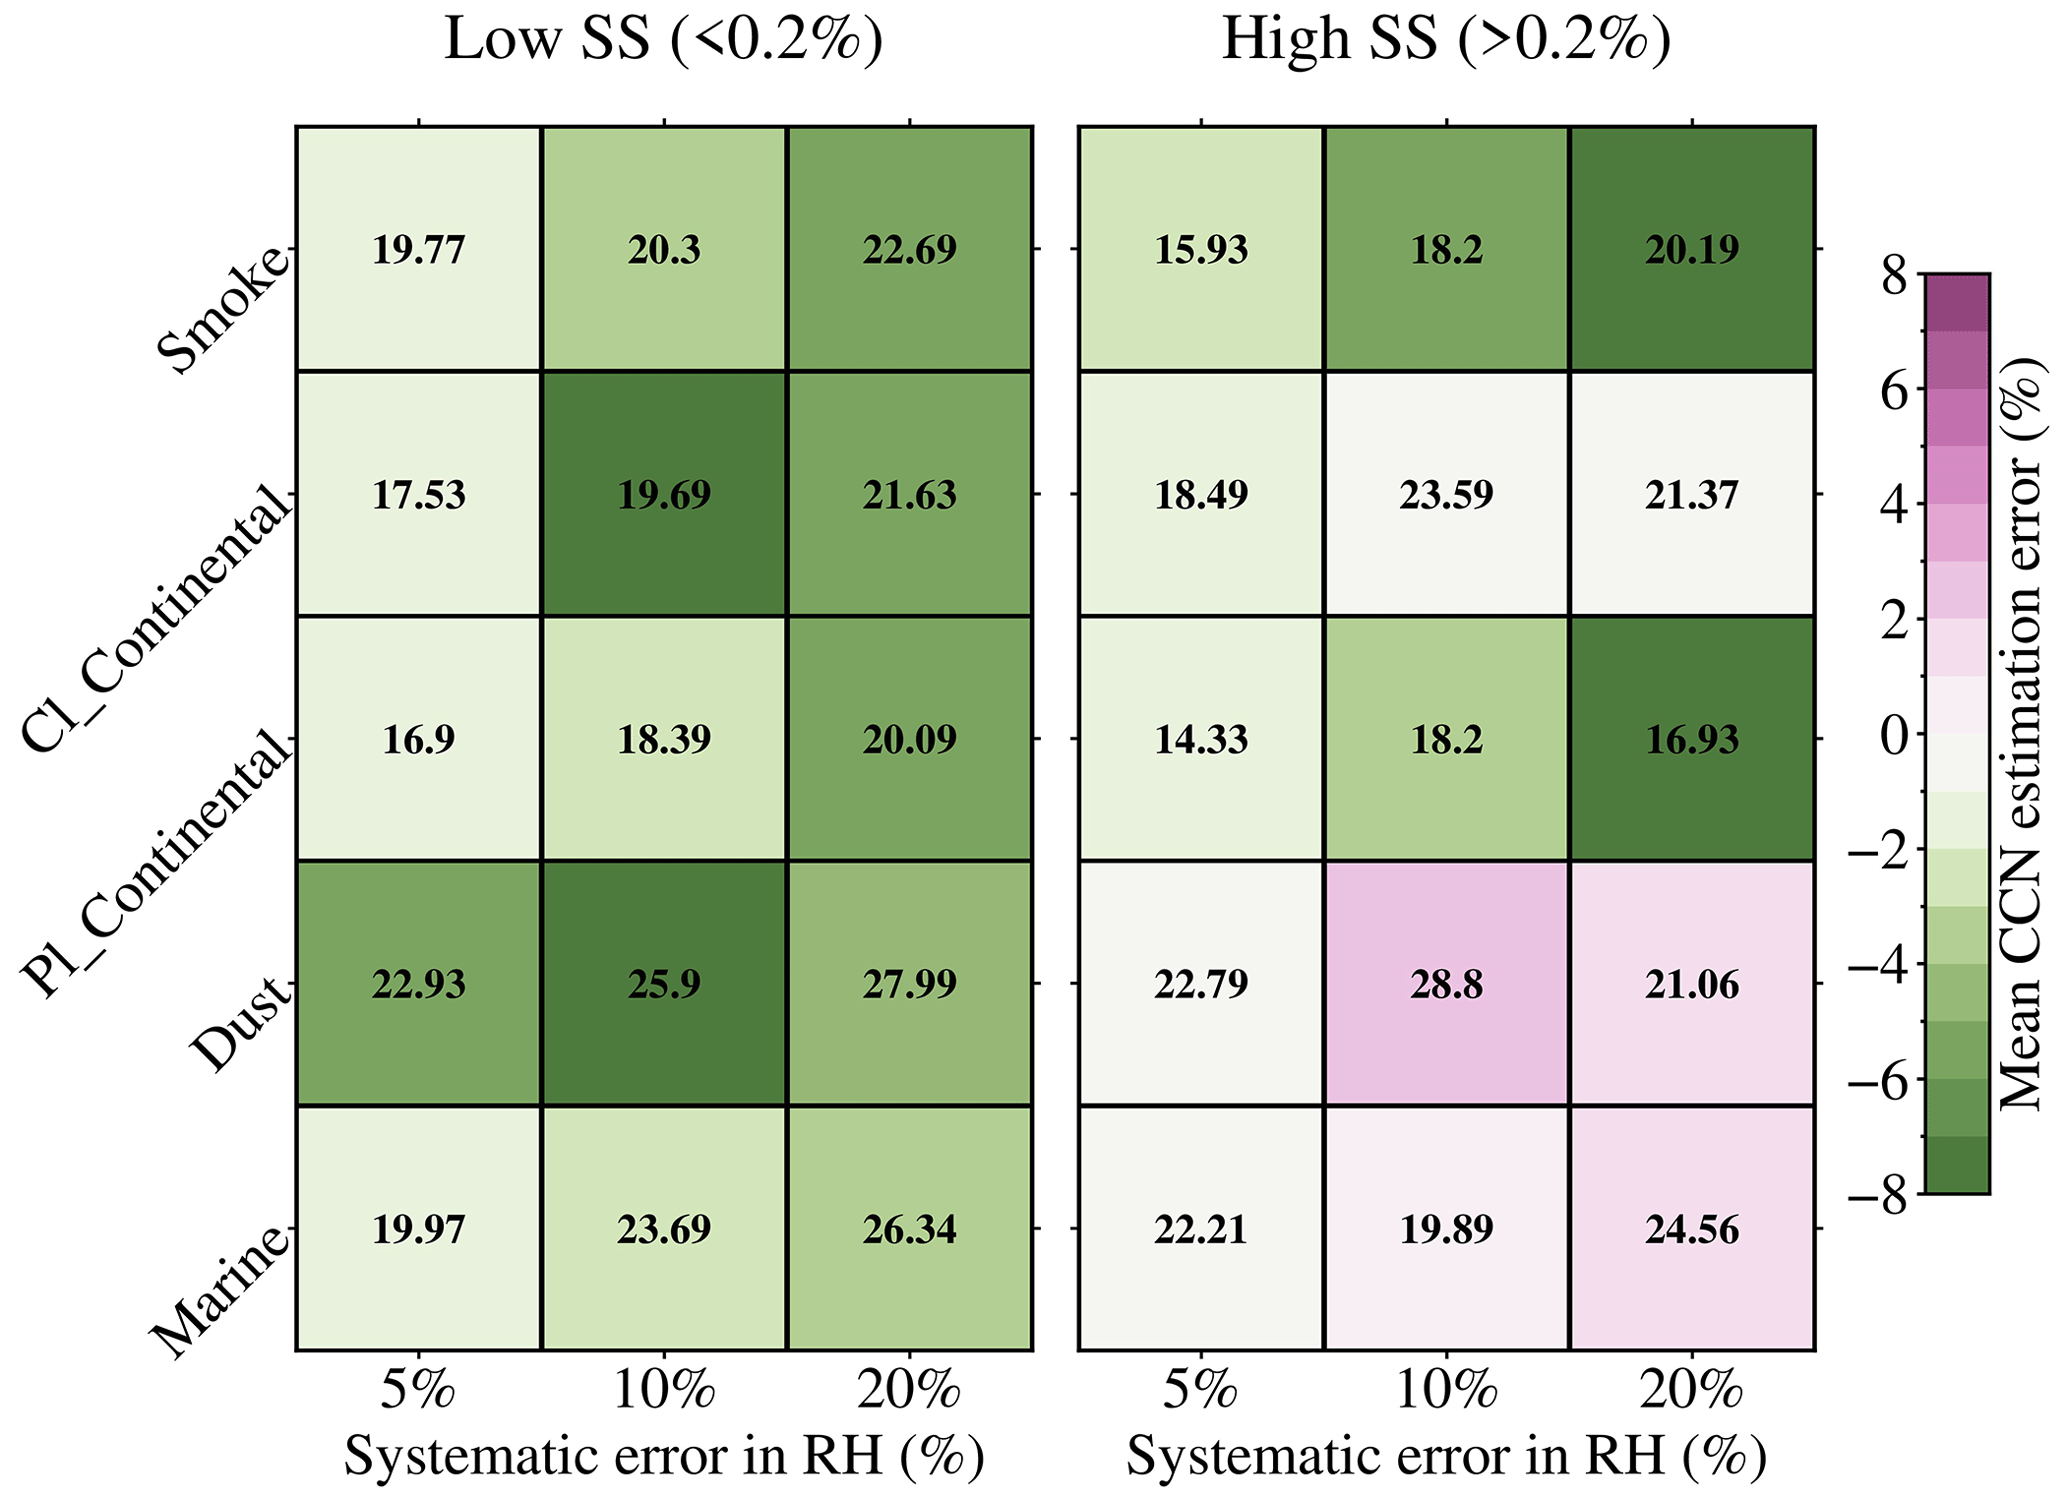
Figure 5Random errors in retrieved NCCN. This represents the random errors in retrieved NCCN at low (≤ 0.2 %) and high (> 0.2 %) supersaturations with different random error conditions individually for five aerosol subtypes. The uncertainty of backscatter and extinction coefficients of all the tests is 10 %, and the uncertainties of RH are 5 %, 10 %, and 20 %. The color shows the mean values, whereas the number shows the ±1 standard deviation of the errors.
4.2 Comparison to airborne measurements
The evaluation of NCCN retrieval depends on how well retrieved and observed values are matched, as matching errors can become overwhelming. Therefore, we have carried out a validation approach by comparing ECLiAP-retrieved NCCN from lidar measurements to the in situ measurements of NCCN by the CCN counter during the NASA ORACLES airborne campaign, which occurred from 2016 to 2018 over the SEA (Redemann et al., 2021; Zuidema et al., 2016).
HSRL-2 measures the vertical profiles of aerosol optical properties, whereas the CCN counter provides measurements for point location. Therefore, we carried out two strategically different validation exercises in this study: (1) the vertical profile-based comparison and (2) the comparison of collocated measurements. For the profile-based comparison, an ascending path of flight (area covered within the yellow dashed line in Fig. S4) on 19 October 2018 has been considered, so the measurements of the CCN counter can be available at various altitudes. Prior to comparison, the lidar measurements from HSRL-2 are averaged over a selected wide space and time (yellow dashed line box in Fig. S4). The NCCN measurements from the CCN counter were available at a supersaturation between 0.32 % and 0.34 %. Hence, the NCCN were retrieved at a supersaturation of 0.34 % by applying ECLiAP to the mean profiles of lidar measurements. It is noteworthy that the retrieval has been carried out only on those observations with valid lidar measurements for at least two wavelengths. Figure 6a demonstrates the retrieval fit to HSRL-2's vertical dry aerosol extinction coefficient measurements at 355, 532, and 1064 nm. A smoke aerosol dominates ∼ 93 % of profiles at altitudes above 800 m and marine at lower altitudes (< 800 m), with RH between 30 % and 105 %. The finite dry aerosol optical properties close to the surface could not be retrieved for the observations with RH > 99 %. The retrieved profiles of dry extinction coefficients are in better agreement with those measured by HSRL-2. This illustrates the ability of the κ parametrization to account for aerosol hygroscopicity. The vertical mean of the absolute fitting error of the extinction coefficient is found to be 3.2 %, 4.8 %, and 6.3 % for 355, 532, and 1064 nm, respectively, and the vertical mean of the absolute fitting error of the backscatter coefficients is 5.1 %, 6.7 %, and 8.9 % for 355, 532, and 1064 nm, respectively. The fit to the backscatter coefficients of 1064 nm has a relatively larger error. Certainly, one needs to know that the vertically resolved extinction coefficient at 1064 nm is derived using the backscatter coefficient at 1064 nm and the lidar ratio. Since HSRL-2 does not directly measure extinction at 1064 nm, it is computed from an assumed relationship with the measured lidar ratio at 532 nm. Though provided as a best guess, such an estimate may cause extra uncertainty at 1064 nm. Furthermore, the comparison of vertical profiles of ECLiAP-retrieved NCCN from lidar measurements and the NCCN measured by the CCN counter is shown in Fig. 6b. The retrieved values captured the pattern of altitude variations in NCCN as observed by the in situ measurements. However, the magnitude of the retrieved NCCN is slightly overestimated, by ∼ 12 % in total. The overestimation is lower (∼ 9 %) at above 2 km, whereas, at below 1 km, it is slightly higher (∼ 16 %). A plausible reason behind the relatively large overestimation at below 1 km might be the considerable variation of RH between 60 % and 105 % and/or the highly variable aerosol properties due to the mixture of multiple aerosol subtypes (smoke, marine, and dust). In addition, wind-driven advection and the age of the air parcel radically modify the characteristics of smoke aerosols and their hygroscopic behavior, which also leads to the slight overestimation of retrieved NCCN values. The discrepancy between the retrieved and observed values of NCCN should be reassessed with the robust measurements from the varieties of aerosol subtypes using the multi-campaign airborne data.
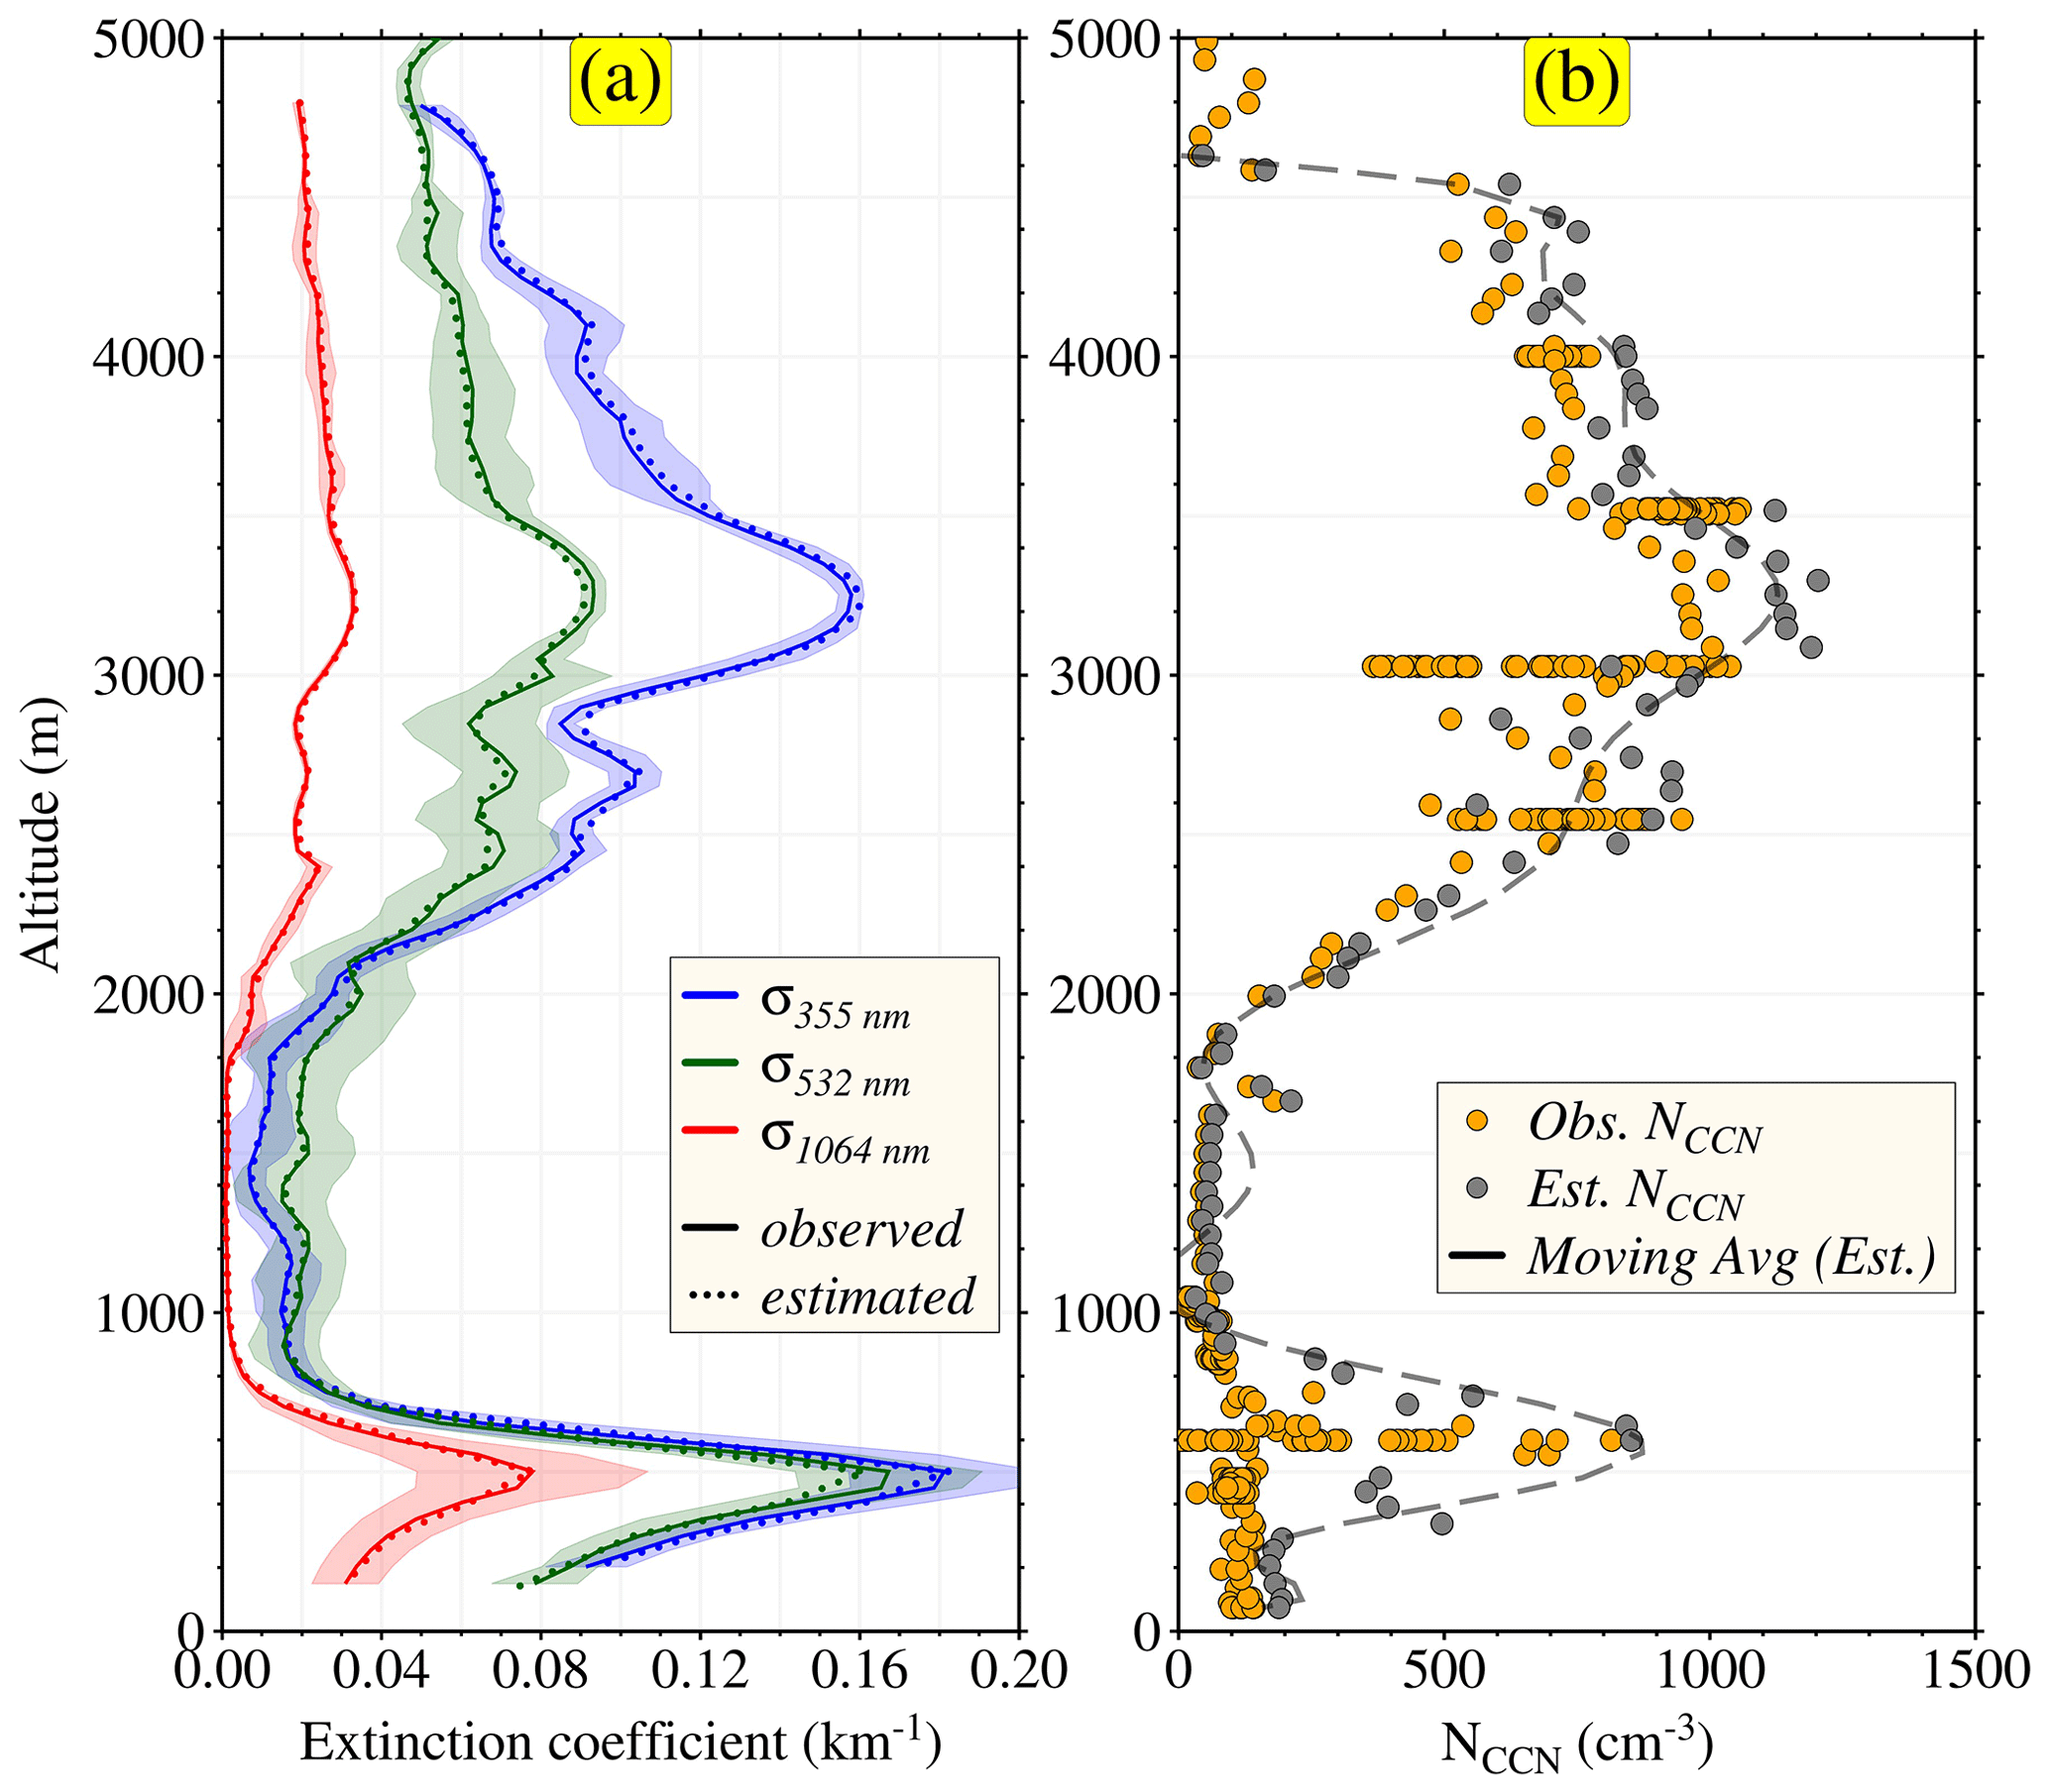
Figure 6Comparison between retrieved and observed vertical profiles of aerosol extinction coefficients and NCCN. The ECLiAP-retrieved (a) aerosol extinction coefficients at 355, 532, and 1064 nm and (b) NCCN were compared against the one observed during the NASA ORACLES airborne campaign. The lidar signals were mainly influenced by the mixture of smoke and dust or marine aerosols. The relationship between HSRL-2-measured aerosol extinction coefficients (solid lines) and retrieved ones (dotted line) with an algorithm in panel (a). Panel (b) illustrates the comparison of retrieved NCCN using lidar measurements and measured by the CCN counter. The dashed line in panel (b) shows the moving average of retrieved NCCN values. The CCN counter measured NCCN at a supersaturation ranging from 0.32 % to 0.34 % for the selected region (described in Fig. S4). Therefore, the retrieval of NCCN was carried out at a supersaturation of 0.34 %.
The second robust validation exercise is performed based on collocated measurements and using 2 years (2017–2018) of combined data from the ORACLES campaign. In 2017–2018, both HSRL-2 and the CCN counter were installed on the NASA P-3 flight. The end goal of this exercise is to find one lidar measurement from HSRL-2 to directly compare it to one NCCN measured by the CCN counter, both observed in approximately the same time and space. We defined collocation criteria for any given HSRL-2 profile as follows. The collocation method finds CCN measurement that falls within ± 1.1 km horizontal distance, ± 60 m vertical distance, and ± 10 min of the time window. Later, the meteorological parameters within the given space and time windows are extracted along with lidar measurements and measured NCCN from each flight of the 2017–2018 ORACLES campaign. ECLiAP is applied to each lidar measurement for NCCN retrieval of the same supersaturation value measured by the CCN counter (lying within the range from 0.2 % to 0.4 % SS). Figure 7 represents the result from the comparison of retrieved and measured NCCN. The NCCN inferred from the CCN counter measurement is in better agreement with the retrieved NCCN, with a correlation coefficient (R) of ∼ 0.89, a root mean square error (RMSE) value of 302.8 cm−3, and a bias of 138.8 cm−3. The systematic positive bias in the comparison indicates that the retrieved NCCN overestimates the observed values. It is noteworthy that smoke aerosols dominate in the observations from ORACLES, but it also has significant observations from marine, dust, and polluted dust. The discrepancy between measured and retrieved values could be due to the variabilities in the aerosol properties. Overall, the strong correlation in the validation results demonstrates the potential of ECLiAP to retrieve NCCN from lidar measurements. It recommends having a detailed validation study separate for aerosol subtypes using ground-based and aircraft measurements to evaluate the reliability of the ECLiAP algorithm in estimating the NCCN.
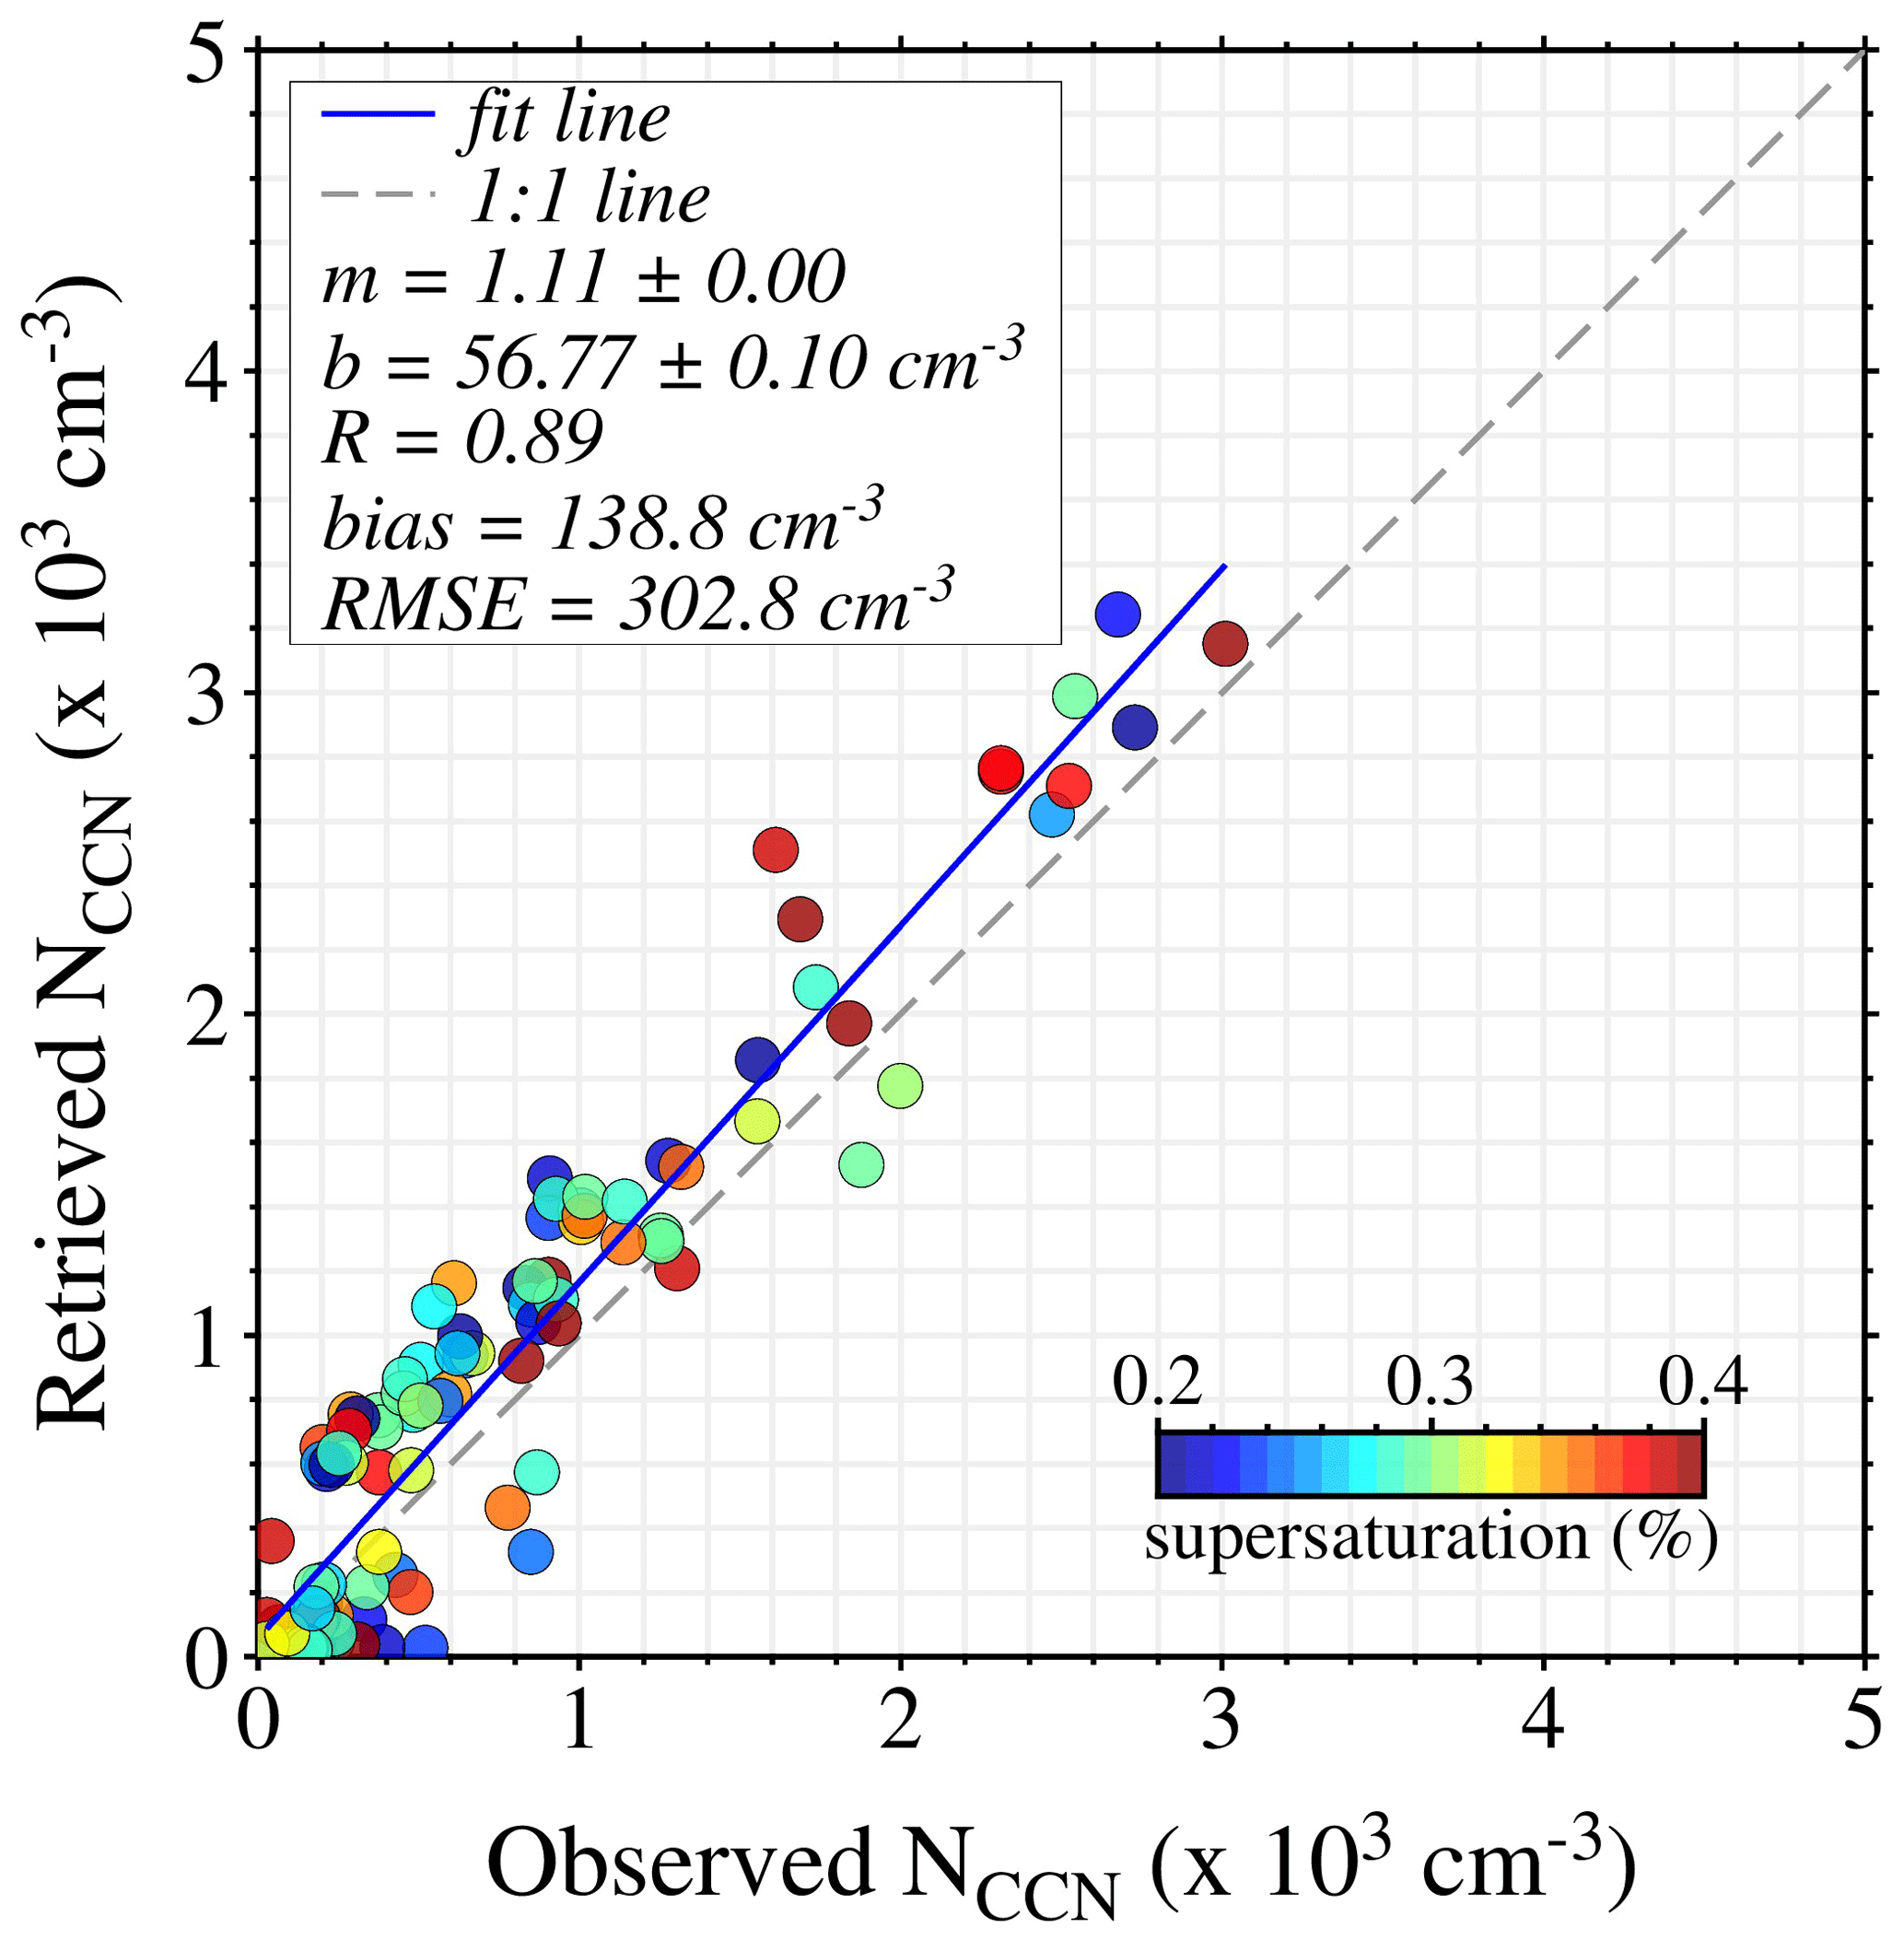
Figure 7Comparison between retrieved and observed NCCN. The comparison between ECLiAP-retrieved NCCN from HSRL-2 lidar measurements and the measured NCCN values from the CCN counter. The HSRL-2 and CCN counter data were collected from the multiple flights during NASA ORACLES airborne campaigns conducted in 2017–2018. The color bar displays the observed values of supersaturation for each measurement, and the NCCN were retrieved at the same supersaturation for direct comparison. The slope and intercept of the best-fit line are given in the key by m and b, respectively. The gray dashed line indicates the unit slope line, and the blue solid line indicates the regression line.
4.3 Retrieving NCCN from spaceborne lidar (CALIOP/CALIPSO): a case study
Extending the scope of ECLiAP, the methodology was converted into a procedure that can be applied to any level-2 aerosol profile dataset from CALIOP on CALIPSO (Winker et al., 2007). As an illustrative example, this procedure was applied to a regular CALIPSO track for 1 January 2019 starting at 20:08 UTC, which spans from 10 to 40° N, passing over the Tibetan Plateau and the Indian land mass. The CALIPSO track (solid black line) can be seen on the right-hand side in Fig. 8a. CALIOP aboard CALIPSO provides measurements of aerosol optical properties at two wavelengths only (532 and 1064 nm). Therefore, a total of six parameters (β532, β1064, α532, α1064, depolarization ratio, and aerosol subtypes) from CALIOP along with meteorological parameters (RH, temperature) are provided as the inputs to ECLiAP and retrieved total particle concentrations NCN and NCCN at six supersaturations as outputs. The NCN amount represents the total number of aerosol particles that can serve as centers for condensation, while the NCCN is the fraction of NCN that can activate as CCN.
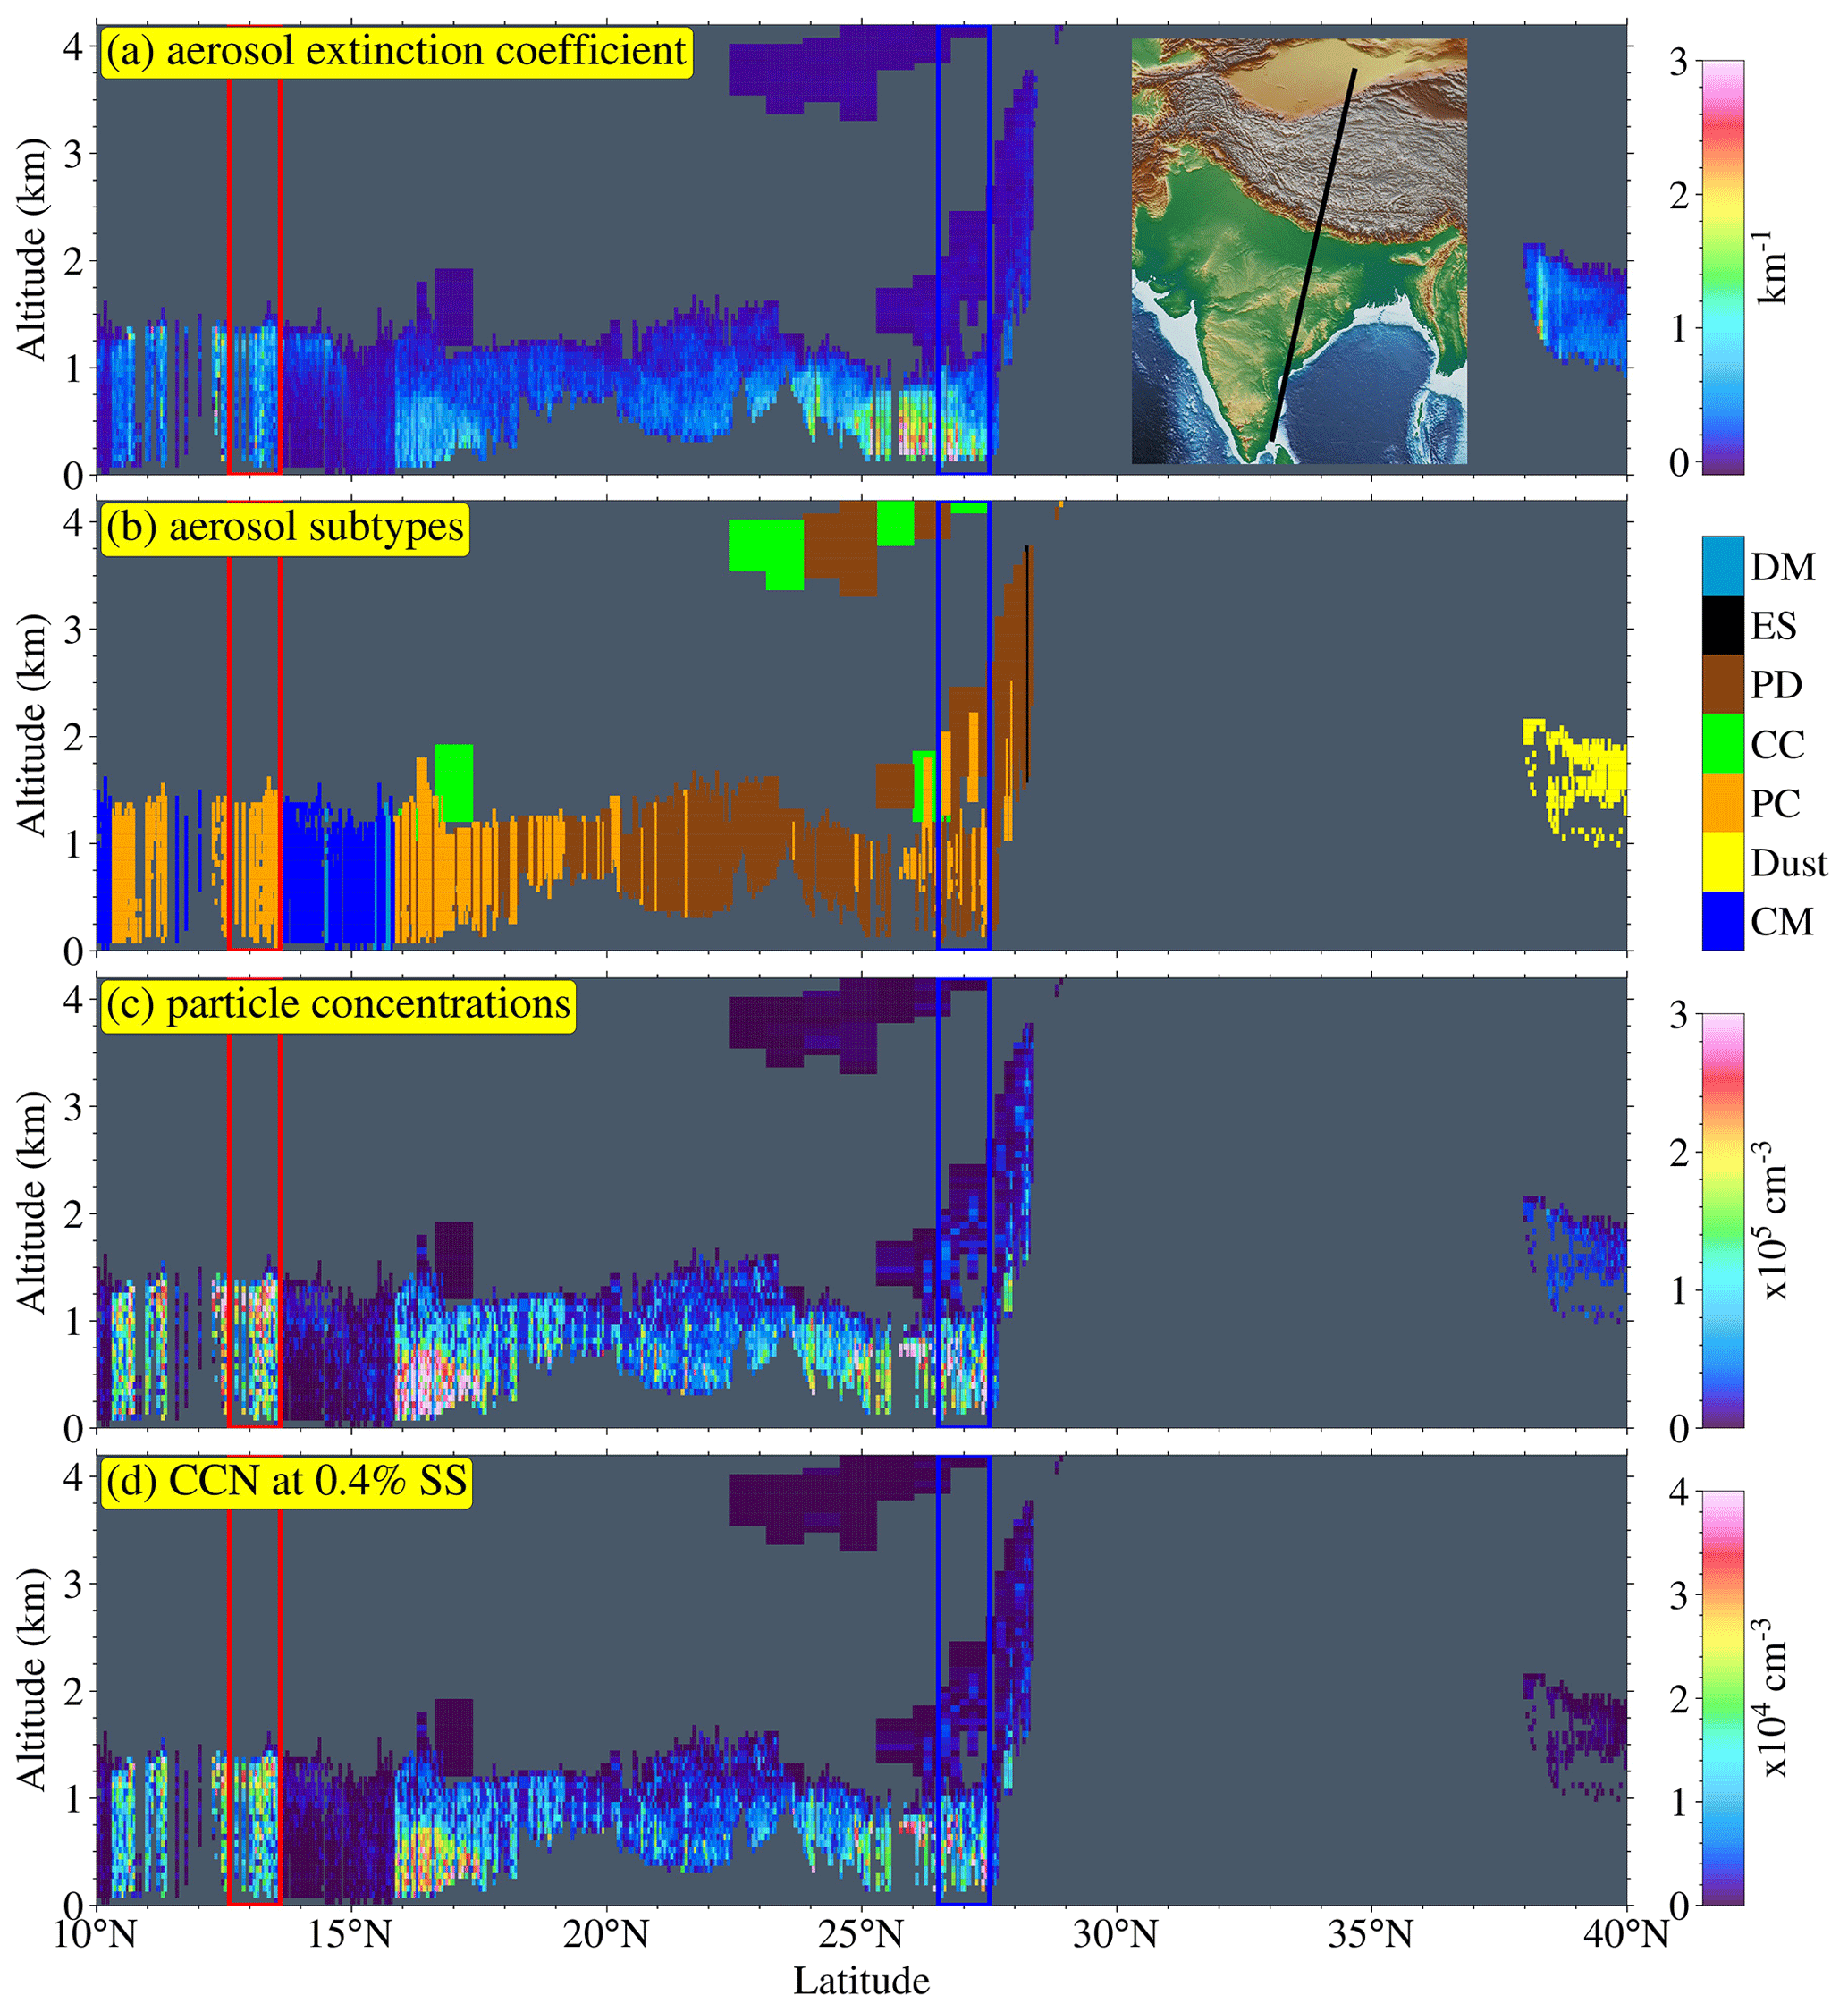
Figure 8Retrieval from spaceborne lidar measurements. Explore the capability of ECLiAP, the NCN, and NCCN retrieved from CALIOP aboard CALIPSO observations on 1 January 2019, passing over the Tibetan Plateau and the Indian land mass. CALIOP-derived (a) extinction coefficient at 532 nm; (b) aerosol subtypes were shown in the upper two panels. The lower two panels illustrate the ECLiAP-retrieved (c) total particle concentrations (NCN) and (d) NCCN at supersaturation 0.4 %. The two-color boxes in red (case I) and blue (case II) are the two different scenarios that are further studied to assess the capability of ECLiAP.
The extinction coefficient at 532 nm and aerosol subtypes, along with retrieved NCN and NCCN at a supersaturation of 0.4 %, are shown in Fig. 8. Unfortunately, due to the retrieval limitation over the elevated region along with cloudiness, there are no valid aerosol measurements over the Himalayan–Tibetan Plateau (as shown by a gap between 28 and 37° N). In contrast, a strong mixed aerosol signal is observed over the Indian land mass (α532 larger than 2.5 km−1), while an elevated (altitude > 1 km) dust aerosol layer ( km−1) is at the edge of the CALIPSO track over the Taklamakan desert (above 38° N). Over southern India (below 17° N), polluted continental aerosols prevail (α532 between 0.5 and 0.8 km−1) and mostly accumulate within the boundary layer (∼ 1.5 km a.s.l.), while over northern India (above 19° N), the aerosol situation includes a mixture of polluted continental and polluted dust ( km−1 below 1 km altitude). The corresponding vertical cross section of retrieved NCN and NCCN at a supersaturation of 0.4 % using ECLiAP can be seen in Fig. 8c and d, respectively. NCN and NCCN larger than 25 000 and 3000 cm−3 at a supersaturation of 0.4 % appear over the areas where polluted continental aerosols dominate (southern India), while NCCN greater than 2000 cm−3 appears over northern India. Dust NCCN of 100 to 200 cm−3 appears over the Taklamakan desert region.
To verify the capability of ECLiAP retrieval to capture similar variability of particle physicochemical characteristics and its influence on CCN retrievals, we have investigated two distinct cases identified based on the variation in aerosol subtypes and meteorological variables. These scenarios are as follows. (1) Case I: domination of polluted continental aerosols over southern India (red-colored box covered in Fig. 8); (2) case II: a mixture of polluted dust and polluted continental aerosols over northern India (blue-colored box covered in Fig. 8). The profiles of extinction coefficients at 532 nm and relative humidity, along with retrieved NCN and NCCN at six supersaturations, are presented in Fig. 9. Figure 9a shows the profiles of the extinction coefficient at 532 nm and relative humidity for both cases. The extinction profile in case I ranges from 0.7 to 1.2 km−1, is dominated by polluted continental aerosols under high-moisture conditions (RH between 60 % and 80 %), accumulates within the boundary layer (∼ 1.5 km), and peaks at ∼ 1.2 km. Conversely, case II represents the low-moisture condition (RH ≤ 30 %), with relatively large extinction coefficient values with a maximum of 1.6 km−1 at ∼ 0.2 km altitude influenced mainly by the mixture of polluted continental and polluted dust aerosols. These two cases are dynamically diverse and different in nature, providing a solid platform for verifying the capability of ECLiAP to retrieve NCCN. Figure 9b illustrates the retrieved NCN using ECLiAP for both cases. The retrieved mean values of NCN are observed to be almost similar (∼ 12 000 and ∼ 11 000 cm−3 for case I and case II, respectively). The profiles of NCN follow a similar vertical distribution pattern of extinction coefficients. Figure 9c and d display the retrieved NCCN at six supersaturations for cases I and II, respectively. Interestingly, NCCN values are found to be relatively lower in case II, though its extinction coefficient is larger than in case I. Note that ECLiAP considers polluted dust to be a mixture of polluted continental and dust aerosol for retrieving NCCN. The abovementioned discrepancy can only be explained by the intrusion of dust and its non-hygroscopic behavior along with dry conditions, further reducing the concentration of hygroscopic aerosols that leads to a decrease in NCCN. This has been clearly reflected in the calculated activation ratio (AR = spectra in Fig. S5. Figure S5 directly compares the AR spectra as a function of SS for both cases. The observed differences in the AR spectra reflect the ability of the particles to act as CCN. Relatively speaking, larger values of AR in case I indicate the dominance of hygroscopic aerosols activated to CCN under high moisture and increased NCCN. In contrast, the dust intrusion in case II reduces the capability of particles to activate as CCN under low moisture and further reduces AR by ∼ 20 %–60 % for the range of supersaturation from 0.07 % to 1.0 %. Given the limited sample space, the aim of the study is to demonstrate the potential of ECLiAP to retrieve reliable NCCN data from spaceborne lidar measurements. We have adapted the retrieval approach to accommodate the available data, utilizing aerosol optical properties at two wavelengths and meteorological datasets. These modifications introduce potential limitations and uncertainties due to the availability of a limited number of input parameters. While the CALIPSO case study offers valuable insights, we stress the need for further validation with independent measurements. A detailed comprehensive analysis comparing the CALIOP-retrieved NCCN to multi-campaign airborne measurements is essential for evaluating the reliability of ECLiAP in constructing the 3D CCN climatology at a global scale.
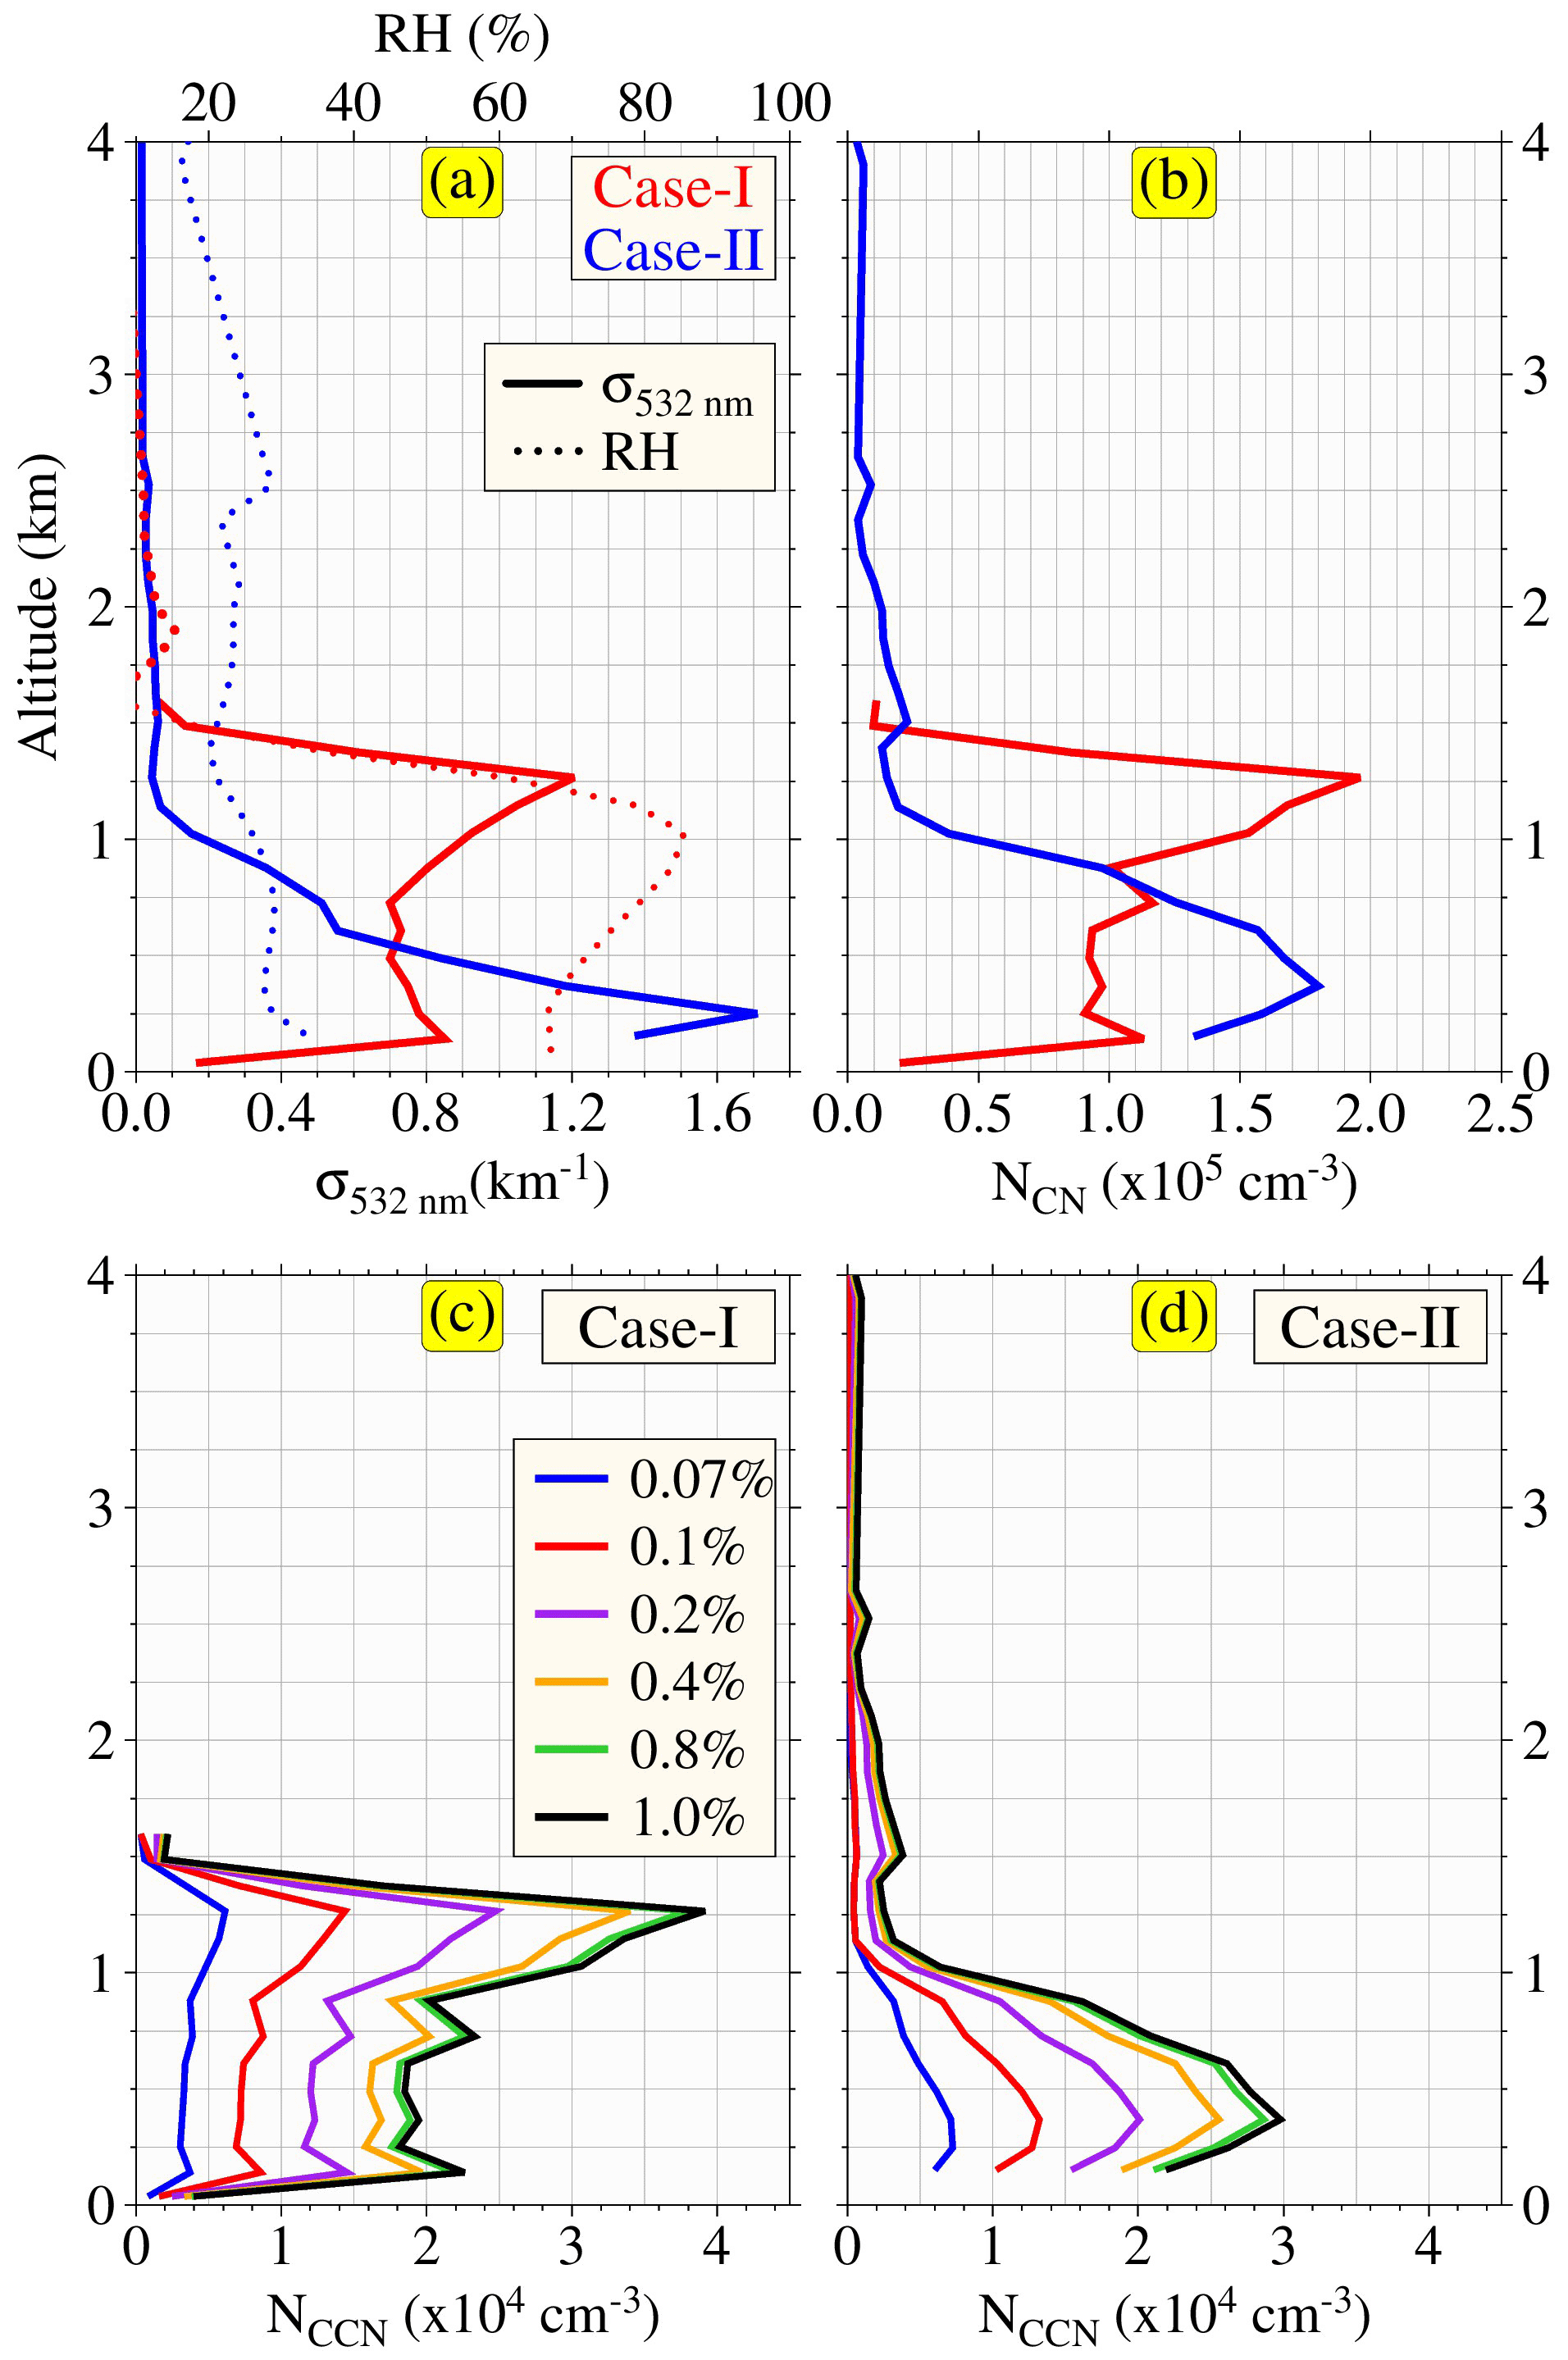
Figure 9Case studied from CALIOP observations. As mentioned above, two different scenarios (case 1 dominated by polluted continental and case II containing a mixture of polluted continental and polluted dust) were identified and studied in detail to assess the potential of ECLiAP to accurately capture the particles' physicochemical characteristics and their influence on the retrieved values along with meteorological influence.
Due to the absence of vertically resolved information in AOD, using it as a proxy for CCN in ACI studies has several shortcomings. Among other issues, a column property like AOD is not necessarily representative of NCCN at altitudes, which affects the formation and growth of the cloud. Because no reliable global estimate of NCCN exists, the fundamental assumptions of ACI cannot be robustly verified with the available sparse and localized in situ measurements. In this study, we present a novel approach based on the 3β+3 technique for retrieving vertically resolved cloud-relevant NCCN from a single spaceborne lidar sensor. With this development, we demonstrate a new application of active satellite remote sensing that can provide direct measurements of CCN to improve understanding of ACI processes.
To address the problem of the non-uniqueness of a solution in the 3β+2α inverse technique, we have adopted a more realistic LUT-based approach using the 3β+3α multiwavelength technique, reflecting the bimodal particle distribution in the atmosphere better. Previous studies (Lv et al., 2018; Tan et al., 2019) demonstrated that CCN estimation is more highly sensitive to the extinction coefficient than the backscatter coefficient, thereby leveraging the availability of derived extinction coefficients at 1064 nm as an additional input to ECLiAP to improve the retrieval accuracy of particle size distribution, particularly for the coarse mode. In order to verify the performance, the CCN estimation error, using Eq. (12), has been calculated using both 3β+2α and 3β+3α techniques for each aerosol subtype in comparison to the observed CCN values. The relative difference in the CCN estimation error between 3β+2α and 3β+3α techniques for each aerosol subtype is shown in Fig. 10. The analysis shows that insertion of the α1064 signal in the 3β+3α technique improves the CCN estimation by ∼ 15 % in total and ∼ 20 % for the coarse-mode-dominated aerosol subtypes (i.e., marine and dust aerosols) compared to 3β+2α. Based on CCN closure analysis, Patel and Jiang (2021) suggested that particle size and chemical composition are more crucial in the CCN activity at lower SS. In contrast, at higher SS, most particles become activated regardless of their size and composition. Therefore, the improvement in CCN estimation is relatively large at low SS (SS < 0.2 %) than at high SS (SS > 0.2 %). In our NCCN retrieval approach, we use multiple input parameters: aerosol optical properties (α355, α532, α1064, β355, β532, and β1064) and RH. Each parameter plays a unique role in constraining aerosol size and concentration accurately. Through sensitivity analyses, we found that using all seven parameters leads to improved retrieval accuracy compared to a reduced set. The interplay between the parameters enhances the performance of algorithms, resulting in reliable and consistent NCCN retrievals. The combination of aerosol optical properties and RH provides a comprehensive understanding of aerosol behavior, ensuring a more holistic characterization of aerosol properties in our study.
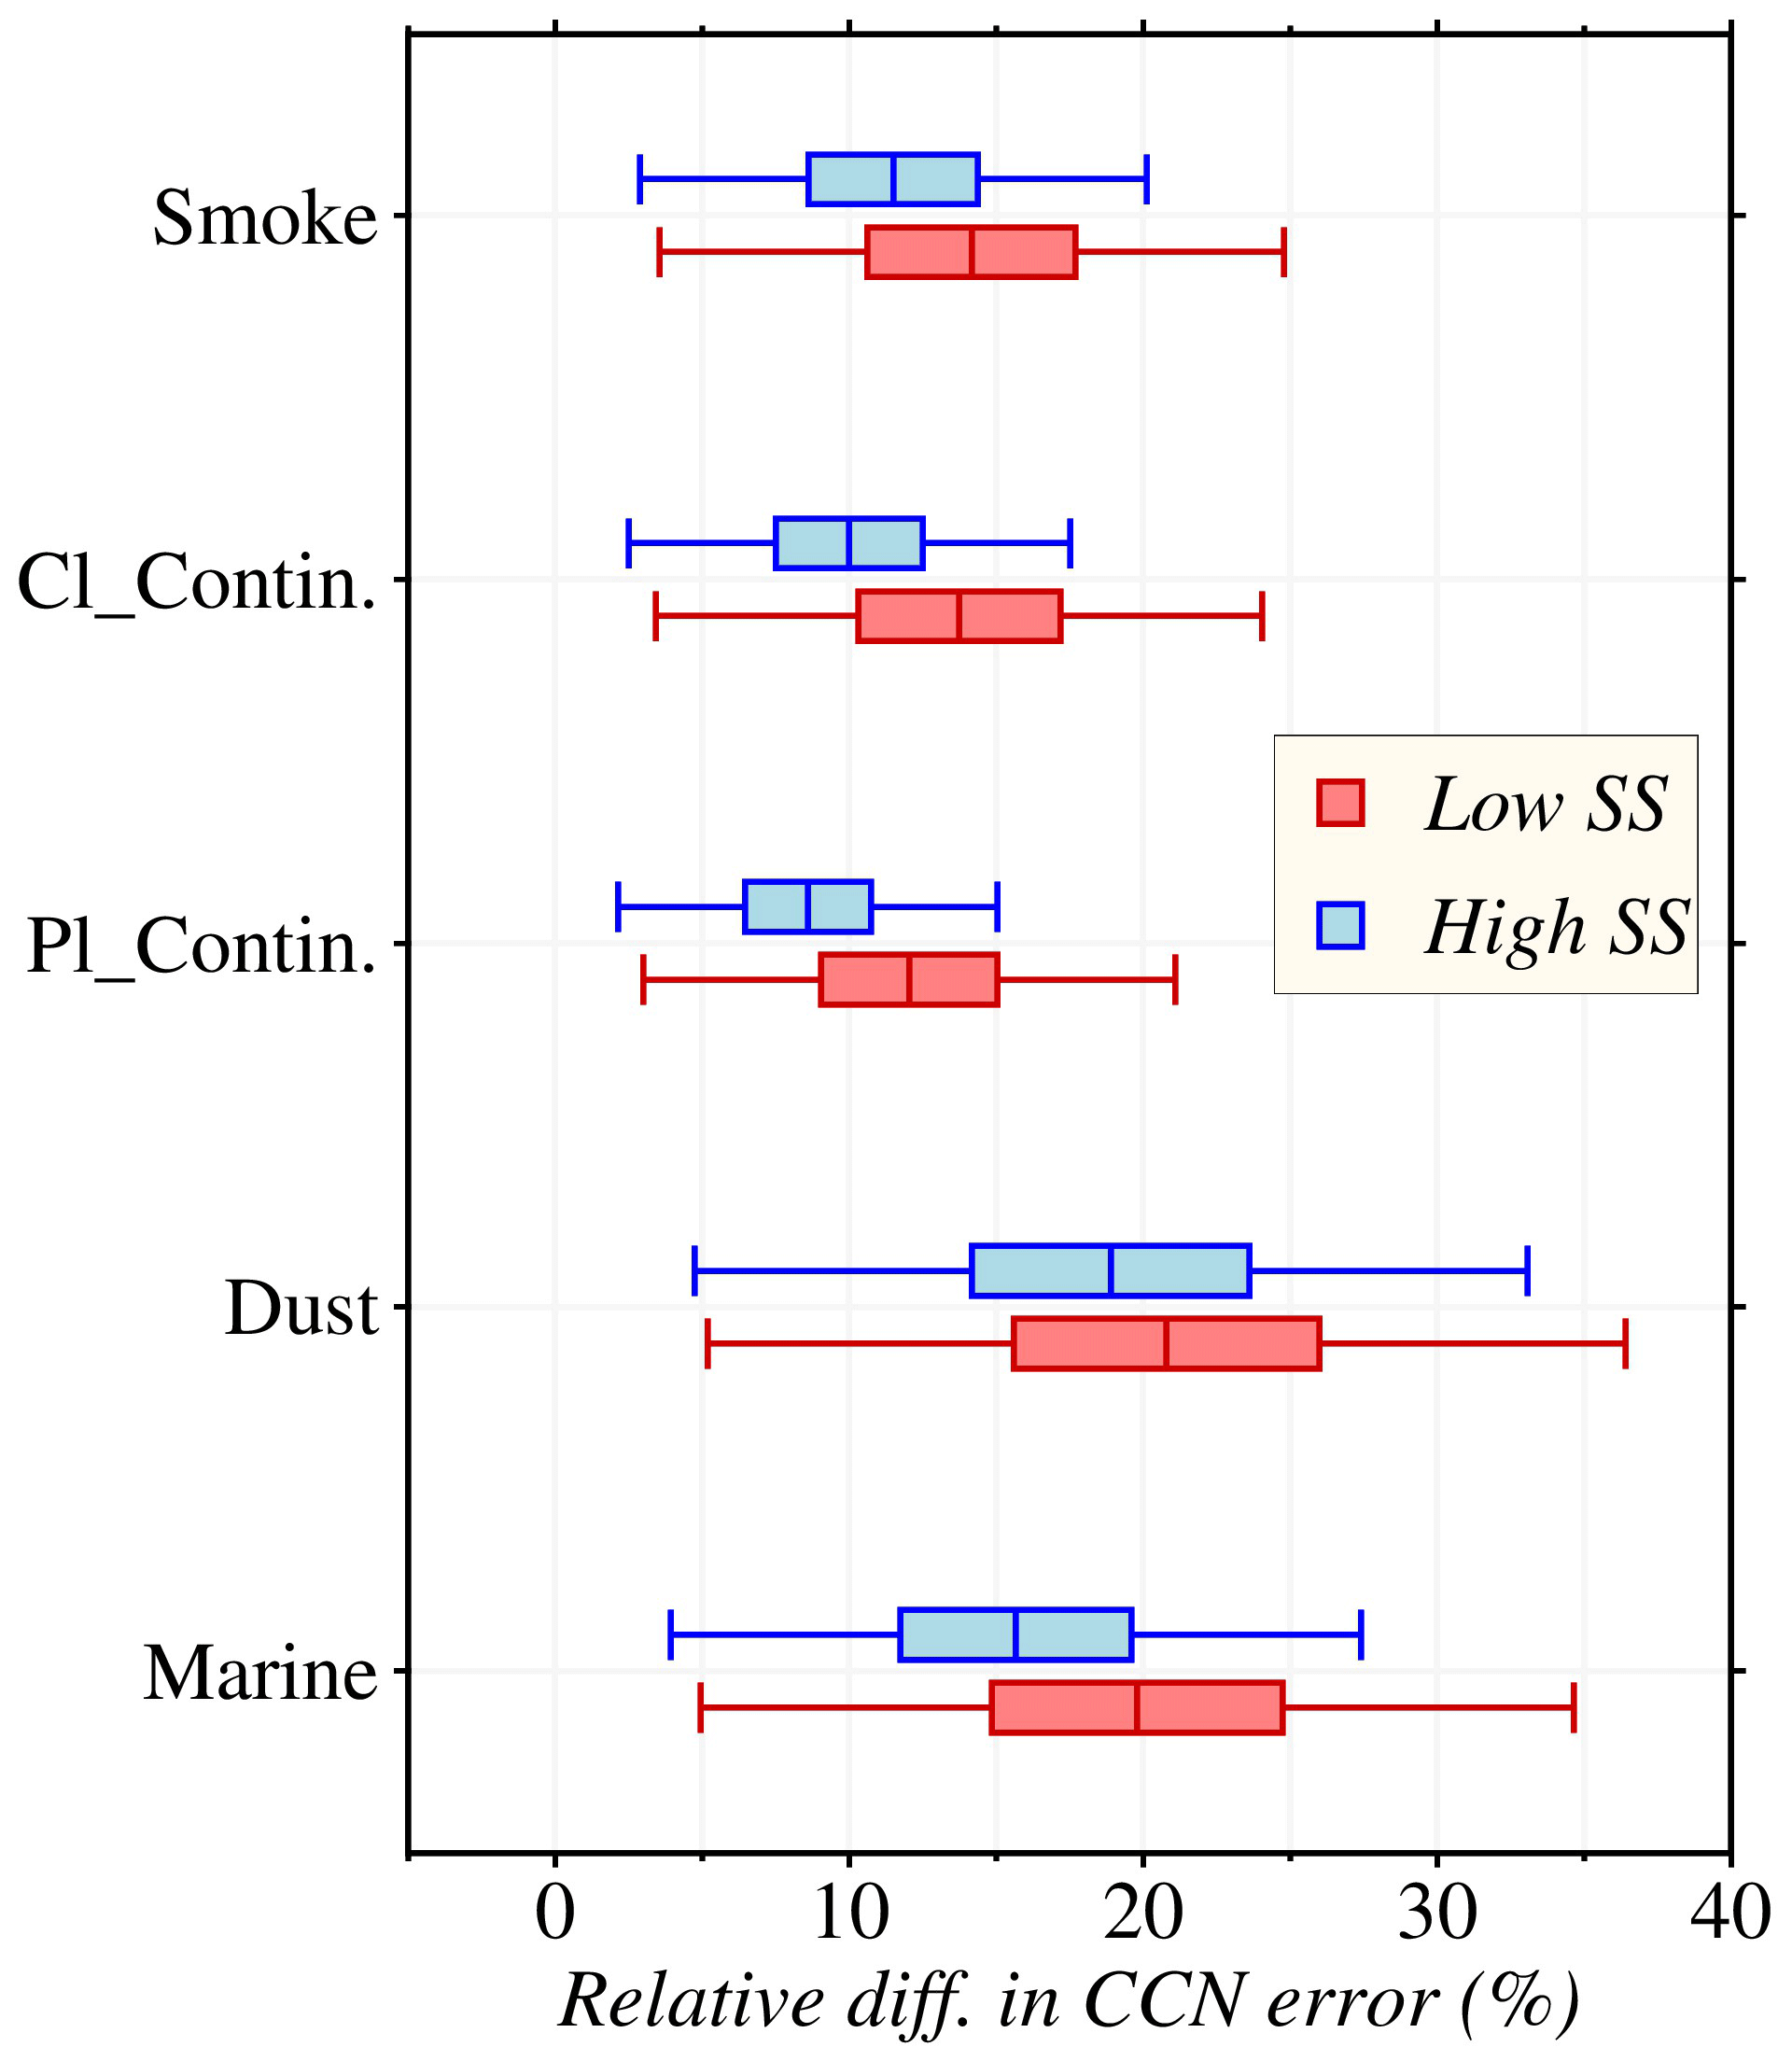
Figure 10Relative difference in CCN error between 3β+2α and 3β+3α. The CCN errors were calculated against the given inputs using Eq. (11) for both the 3β+2α and 3β+3α techniques individually. Later the relative difference of CCN error was calculated from the individual CCN errors at low and high supersaturations for each aerosol subtype.
Systematic and random errors in the lidar measurements were evaluated individually and discussed in the sensitivity analysis. Both systematic and random errors realistically coexist in optical parameters, and therefore we have evaluated their concurrent effect. The simulations were conducted with both systematic and random errors co-occurring. The results (not shown here) show that the retrieved CCN errors are much smaller than the error obtained individually and either systematically or randomly at each wavelength independently. The mean CCN error ranges between 7 % and 15 % at SS from 0.07 % to 1.0 %. This retrieved CCN error is slightly large (∼ 12 %–18 %) for the coarse-mode-dominated aerosol subtypes (dust and marine). Summing up errors from multiple optical parameters might compensate for them and improve the CCN retrievals. Furthermore, the retrieval from ECLiAP has a few constraints. (i) It strongly depends on the accuracy of lidar-measured aerosol optical properties. The retrieval is only possible if the lidar signals are available at at least two wavelengths. (ii) The non-spherical shape of dust particles: while this study considers the spheroidal shape of dust particles, a recent study by Haarig et al. (2022) suggested that the assumption of spheroidal dust particles has limitations in obtaining an accurate particle depolarization ratio. Therefore, our assumption of spheroidal shape may not fully capture the complexity of dust particles and could lead to uncertainties in our dust-related retrieval. Although complex non-spherically shaped models (Gasteiger et al., 2011; Saito et al., 2021) provide a more realistic representation of irregularly shaped dust particles, they are computationally expensive. We acknowledge this limitation and plan to explore alternative models in future studies. (iii) Retrieval from ECLiAP is only performed for RH ≤ 99 %. (iv) The use of mean refractive indices for each aerosol subtype in the creation of the lookup tables may limit the representation of refractive index variability within each subtype. This simplified approach reduces computation time but may compromise the accuracy of the LUTs in accounting for the full range of aerosol properties. (v) The CCN activity also depends on the mixing state, which is difficult to measure from space. Subsequently, an alternative solution is required to parametrize the effect of the mixing state on CCN activity. (v) It is constrained by the inherent limitations of lidar measurements, which may not effectively capture particles with sizes smaller than 50 nm. Consequently, the algorithm does not fully account for the impact of new particle formation on the estimation of CCN concentrations.
The present study demonstrates the capability of ECLiAP to construct the 3D global climatology of NCCN. The global coverage of NCCN, in conjunction with collocated retrieved cloud properties, will provide crucial input for the regional and global simulations that will provide realistic assessments of aerosol-induced cloud radiative forcing. The satellite-retrieved NCCN can precisely separate the aerosols into natural and anthropogenic components, which can be further used for constraining aerosol emissions and transport models for air-quality studies. The application of detailed NCCN will potentially mitigate the uncertainty of aerosol perturbed climate forcing (direct and indirect) and improve confidence in assessing anthropogenic contributions and climate change projections.
CCN number concentration is a critically important parameter for constraining the relationship between aerosols and clouds and is needed to improve the understanding of ACI processes. The lack of direct measurements of CCN prevents robust testing of the underlying assumptions associated with aerosol–cloud interactions robustly and evaluates climate model simulations. In order to overcome this limitation, we presented ECLiAP, an emergent remote-sensing-based analytical algorithm based on the physical law to retrieve the vertically resolved NCCN from aerosol optical properties measured by the multiwavelength lidar system. Among the several fundamental aspects of the mathematical problem that must be solved during retrievals of microphysical parameters from multiwavelength lidar, the most crucial aspect is that the inverse solution is not unique. Therefore, the retrieval is implemented based on lookup tables generated from Mie scattering (and T-matrix/IGOM for dust particles) calculations. AERONET-based five representative aerosol subtypes with bimodal size distributions were considered. The influence of relative humidity on lidar-measured aerosol optical properties is corrected using the aerosol-type-dependent hygroscopic growth factor to obtain the dry aerosol optical properties. As a tradeoff between the accuracy and computation time of the inversion, a successive approximation technique is utilized in two steps to retrieve the optically equivalent particle number size distribution. Once the aerosol size distribution parameters are obtained through the LUT, critical diameter and NCCN at six supersaturations ranging from 0.07 % to 1.0 % are estimated using κ-Köhler theory.
Sensitivity analyses were carried out to evaluate the algorithm performance and to show the influence of systematic and random errors of lidar-derived optical properties and auxiliary RH profiles on CCN retrieval. The performance of ECLiAP is evaluated with error-free data, and NCCN at all six supersaturations is reproduced well with good accuracy and stability for the five aerosol subtypes. Systematic errors in extinction coefficients and RH greatly influence CCN retrieval errors. Reducing uncertainties in extinction coefficients effectively improves retrieval accuracy, while uncertainties in backscatter coefficients benefit retrieval at higher SS. Differences in weights of fine- to coarse-mode particles within the aerosol subtypes lead to significant differences in the retrieval uncertainty. The differences can be explained by the weaker constraint of the algorithm for the coarse-mode particles than for the fine mode. However, the insertion of the additional signal at a relatively longer wavelength reduced the differences in the retrieval uncertainty compared to previous techniques. The mean random errors are relatively small and are found to be relatively large for the coarse-mode-dominated aerosol subtypes, consistent with the sensitivities to the systematic errors. In realistic cases, systematic and random errors often offset each other and improve the mean CCN retrievals. Overall, the error analysis suggests that extinction coefficients at 355 and 532 nm must be reliably derived to ensure retrieval accuracy, including measurements at longer wavelengths that further improve the CCN retrievals, particularly for the coarse-mode-dominated aerosol subtypes.
The ECLiAP algorithm was applied to observational data from the NASA ORACLES airborne campaign to illustrate the potential of the algorithm. NCCN retrieved from lidar (HSRL-2) measurements has been validated against the simultaneous measurements from the CCN counter installed on the flight. Considering the inhomogeneity in the vertical distribution of aerosols throughout the atmospheric column, NCCN from in situ measurements and lidar retrievals agrees well. Furthermore, for the first time, ECLiAP has been applied to spaceborne lidar measurements – CALIOP/CALIPSO – to retrieve NCCN. The results demonstrate that the NCCN retrieved by ECLiAP is highly influenced by the variability of aerosol particle size and composition based on aerosol subtypes and also captures the meteorological influence. The vertically resolved information of aerosols, along with CCN from spaceborne lidar, is essential for investigating the ACI in detail.
Our future goals include a comprehensive evaluation of NCCN derived from spaceborne lidar measurements, i.e., CALIOP/CALIPSO, with multi-campaign airborne measurements covering various physicochemical regimes in the troposphere. The extensive validation will enable us to test the applicability of the ECLiAP algorithm in the context of estimating the NCCN from space. Eventually, we plan to apply the ECLiAP algorithm over the period of CALIOP observations (∼ 15 years) to generate the global 3D NCCN climatology. The dataset coupled with the cloud-related data from the other satellite or state-of-the-art numerical models will help improve our understanding of the ACI. The science narrative of the NASA Aerosol and Cloud, Convection and Precipitation (ACCP) project showed that the combination of near-simultaneous and collocated lidar and polarimeter measurements can provide more detailed information regarding particle size, concentration, and composition (Braun et al., 2022). Therefore, our future work may also include combinations of the lidar measurements with passive observations in the ECLiAP algorithm to further narrow down the uncertainty of aerosol microphysics with the enhanced observational constraints (Xu et al., 2021), which will in turn improve the accuracy of CCN retrieval. Moreover, the ability of CALIOP to detect the aerosol subtypes has facilitated the retrieval of an aerosol-type-specific 3D NCCN climatology on a global scale. These datasets from spaceborne lidar measurements will be beneficial for evaluating models and other satellite products, opening a new window to investigate the region and regime-wise detailed ACI studies and to better constrain anthropogenic contributions to the climate forcing in the climate model.
All data that support the findings of this study are publicly available. The in situ measurements at the ARM-SGP are available at https://doi.org/10.5439/1409033 (ARM, 2024a), https://doi.org/10.5439/1407135 (ARM, 2024b) and https://doi.org/10.5439/1323896 (ARM, 2024c). All ORACLES data are accessible via the digital object identifiers (DOIs) provided by the ORACLES science team. The references are https://doi.org/10.5067/Suborbital/ORACLES/P3/2018_V2 (ORACLES Science Team, 2020a) and https://doi.org/10.5067/Suborbital/ORACLES/P3/2017_V2 (ORACLES Science Team, 2020b). The CALIPSO data are available at https://eosweb.larc.nasa.gov/ (NASA, 2022).
The supplement related to this article is available online at: https://doi.org/10.5194/acp-24-2861-2024-supplement.
PNP conceptualized and designed the study. PNP carried out the data analysis and interpretation with contributions from JHJ, RG, and HG. PNP wrote the manuscript. JHJ, RG, HG, OVK, MJG, LG, FX, and OA reviewed, commented on, and/or edited the manuscript.
The contact author has declared that none of the authors has any competing interests.
Publisher’s note: Copernicus Publications remains neutral with regard to jurisdictional claims made in the text, published maps, institutional affiliations, or any other geographical representation in this paper. While Copernicus Publications makes every effort to include appropriate place names, the final responsibility lies with the authors.
This work was conducted at the NASA-sponsored Jet Propulsion Laboratory (JPL), California Institute of Technology, under contract with NASA. We appreciate the facility provided by the JPL for data analysis and research. This work was supported by the NASA Postdoctoral Program administered by Oak Ridge Associated Universities under contract with NASA. We are thankful to Charles A. Brock (Chemical Sciences Laboratory, National Oceanic and Atmospheric Administration, Boulder, CO, USA) for the fruitful discussion on the present study. All the data were obtained from the Atmospheric Radiation Measurement (ARM) program sponsored by the U.S. Department of Energy, Office of Science, Office of Biological and Environmental Research, Climate and Environmental Sciences Division, and National Science Foundation. We thank the ORACLES deployment support teams and the science team for a successful and productive mission. We thank the CALIPSO science team for providing the CALIPSO data.
This research was partially supported by the NASA ROSES CloudSat/CALIPSO Science Team (CCST).
This paper was edited by Zhanqing Li and reviewed by three anonymous referees.
Andreae, M. O. and Rosenfeld, D.: Aerosol-cloud-precipitation interactions. Part 1. The nature and sources of cloud-active aerosols, Earth Sci. Rev., 89, 13–41, https://doi.org/10.1016/j.earscirev.2008.03.001, 2008.
ARM: AOS: Ultrahigh Sensitivity Aerosol Spectrometer, ARM [data set], https://doi.org/10.5439/1409033, 2022a.
ARM: Aerosol Observing System (AOS): Aerodynamic Particle Sizer, ARM [data set], https://doi.org/10.5439/1407135, 2022b.
ARM: AOS: Cloud Condensation Nuclei Counter (Dual Column), ramping mode spectra data, ARM [data set], https://doi.org/10.5439/1323896, 2022c.
Bedoya-Velásquez, A. E., Navas-Guzmán, F., Granados-Muñoz, M. J., Titos, G., Román, R., Casquero-Vera, J. A., Ortiz-Amezcua, P., Benavent-Oltra, J. A., de Arruda Moreira, G., Montilla-Rosero, E., Hoyos, C. D., Artiñano, B., Coz, E., Olmo-Reyes, F. J., Alados-Arboledas, L., and Guerrero-Rascado, J. L.: Hygroscopic growth study in the framework of EARLINET during the SLOPE I campaign: synergy of remote sensing and in situ instrumentation, Atmos. Chem. Phys., 18, 7001–7017, https://doi.org/10.5194/acp-18-7001-2018, 2018.
Bi, L., Yang, P., Kattawar, G. W., and Kahn, R.: Single-scattering properties of triaxial ellipsoidal particles for a size parameter range from the Rayleigh to geometric-optics regimes, Appl. Opt., 48, 114–126, https://doi.org/10.1364/AO.48.000114, 2009.
Bohren, C. F. and Huffman, D. R.: Absorption and Scattering of Light by Small Particles, Absorption and Scattering of Light by Small Particles, Wiley, https://doi.org/10.1002/9783527618156, 1998.
Bony, S. and Dufresne, J. L.: Marine boundary layer clouds at the heart of tropical cloud feedback uncertainties in climate models, Geophys. Res. Lett., 32, 1–4, https://doi.org/10.1029/2005GL023851, 2005.
Braun, S., Stephens, G., Berndt, E., Blanchard, Y., Blanchet, J.-P., Carmichael, G., da Silva, A., Ferrare, R., Ivanco, M., Kacenelenbogen, M., Kirschbaum, D., Libois, Q., Mace, G., Omar, A., Petersen, W., Redemann, J., Seidel, F., van den Heever, S., Waliser, D., and Winker, D.: Aerosol, Cloud, Convection, and Precipitation (ACCP) Science & Applications, 72–72 pp., 2022.
Brock, C. A., Wagner, N. L., Anderson, B. E., Attwood, A. R., Beyersdorf, A., Campuzano-Jost, P., Carlton, A. G., Day, D. A., Diskin, G. S., Gordon, T. D., Jimenez, J. L., Lack, D. A., Liao, J., Markovic, M. Z., Middlebrook, A. M., Ng, N. L., Perring, A. E., Richardson, M. S., Schwarz, J. P., Washenfelder, R. A., Welti, A., Xu, L., Ziemba, L. D., and Murphy, D. M.: Aerosol optical properties in the southeastern United States in summer – Part 1: Hygroscopic growth, Atmos. Chem. Phys., 16, 4987–5007, https://doi.org/10.5194/acp-16-4987-2016, 2016.
Burkart, J., Steiner, G., Reischl, G., and Hitzenberger, R.: Long-term study of cloud condensation nuclei (CCN) activation of the atmospheric aerosol in Vienna, Atmos. Environ., 45, 5751–5759, https://doi.org/10.1016/J.ATMOSENV.2011.07.022, 2011.
Burton, S. P., Ferrare, R. A., Hostetler, C. A., Hair, J. W., Rogers, R. R., Obland, M. D., Butler, C. F., Cook, A. L., Harper, D. B., and Froyd, K. D.: Aerosol classification using airborne High Spectral Resolution Lidar measurements – methodology and examples, Atmos. Meas. Tech., 5, 73–98, https://doi.org/10.5194/amt-5-73-2012, 2012.
Burton, S. P., Chemyakin, E., Liu, X., Knobelspiesse, K., Stamnes, S., Sawamura, P., Moore, R. H., Hostetler, C. A., and Ferrare, R. A.: Information content and sensitivity of the 3β + 2α lidar measurement system for aerosol microphysical retrievals, Atmos. Meas. Tech., 9, 5555–5574, https://doi.org/10.5194/amt-9-5555-2016, 2016.
Burton, S. P., Hostetler, C. A., Cook, A. L., Hair, J. W., Seaman, S. T., Scola, S., Harper, D. B., Smith, J. A., Fenn, M. A., Ferrare, R. A., Saide, P. E., Chemyakin, E. V., and Müller, D.: Calibration of a high spectral resolution lidar using a Michelson interferometer, with data examples from ORACLES, Appl. Opt., 57, 6061, https://doi.org/10.1364/AO.57.006061, 2018.
Carslaw, K. S., Boucher, O., Spracklen, D. V., Mann, G. W., Rae, J. G. L., Woodward, S., and Kulmala, M.: A review of natural aerosol interactions and feedbacks within the Earth system, Atmos. Chem. Phys., 10, 1701–1737, https://doi.org/10.5194/acp-10-1701-2010, 2010.
Chang, I., Gao, L., Burton, S. P., Chen, H., Diamond, M. S., Ferrare, R. A., Flynn, C. J., Kacenelenbogen, M., LeBlanc, S. E., Meyer, K. G., Pistone, K., Schmidt, S., Segal-Rozenhaimer, M., Shinozuka, Y., Wood, R., Zuidema, P., Redemann, J., and Christopher, S. A.: Spatiotemporal Heterogeneity of Aerosol and Cloud Properties Over the Southeast Atlantic: An Observational Analysis, Geophys. Res. Lett., 48, e2020GL091469, https://doi.org/10.1029/2020GL091469, 2021.
Chemyakin, E., Burton, S., Kolgotin, A., Müller, D., Hostetler, C., and Ferrare, R.: Retrieval of aerosol parameters from multiwavelength lidar: investigation of the underlying inverse mathematical problem, Appl. Opt., 55, 2188, https://doi.org/10.1364/AO.55.002188, 2016.
Choudhury, G. and Tesche, M.: Estimating cloud condensation nuclei concentrations from CALIPSO lidar measurements, Atmos. Meas. Tech., 15, 639–654, https://doi.org/10.5194/amt-15-639-2022, 2022.
Clarke, A. and Kapustin, V.: Hemispheric aerosol vertical profiles: Anthropogenic impacts on optical depth and cloud nuclei, Science (1979), 329, 1488–1492, https://doi.org/10.1126/science.1188838, 2010.
Coddington, O. M., Pilewskie, P., Redemann, J., Platnick, S., Russell, P. B., Schmidt, K. S., Gore, W. J., Livingston, J., Wind, G., and Vukicevic, T.: Examining the impact of overlying aerosols on the retrieval of cloud optical properties from passive remote sensing, J. Geophys. Res.-Atmos., 115, D10211, https://doi.org/10.1029/2009JD012829, 2010.
Dubovik, O.: Variability of absorption and optical properties of key aerosol types observed in worldwide locations, J. Atmos. Sci., 59, 590–608, https://doi.org/10.1175/1520-0469(2002)059<0590:VOAAOP>2.0.CO;2 , 2002.
Dubovik, O., Sinyuk, A., Lapyonok, T., Holben, B. N., Mishchenko, M., Yang, P., Eck, T. F., Volten, H., Muñoz, O., Veihelmann, B., van der Zande, W. J., Leon, J. F., Sorokin, M., and Slutsker, I.: Application of spheroid models to account for aerosol particle nonsphericity in remote sensing of desert dust, J. Geophys. Res.-Atmos., 111, D11208, https://doi.org/10.1029/2005JD006619, 2006.
Dubovik, O., Herman, M., Holdak, A., Lapyonok, T., Tanré, D., Deuzé, J. L., Ducos, F., Sinyuk, A., and Lopatin, A.: Statistically optimized inversion algorithm for enhanced retrieval of aerosol properties from spectral multi-angle polarimetric satellite observations, Atmos. Meas. Tech., 4, 975–1018, https://doi.org/10.5194/amt-4-975-2011, 2011.
Dusek, U., Frank, G. P., Hildebrandt, L., Curtius, J., Schneider, J., Walter, S., Chand, D., Drewnick, F., Hings, S., Jung, D., Borrmann, S., and Andreae, M. O.: Size matters more than chemistry for cloud-nucleating ability of aerosol particles, Science, 312, 1375–1378, https://doi.org/10.1126/science.1125261, 2006.
Fan, J., Wang, Y., Rosenfeld, D., and Liu, X.: Review of Aerosol–Cloud Interactions: Mechanisms, Significance, and Challenges, J. Atmos. Sci., 73, 4221–4252, https://doi.org/10.1175/JAS-D-16-0037.1, 2016.
Feingold, G., Yang, S., Hardesty, R. M., and Cotton, W. R.: Feasibility of retrieving cloud condensation nucleus properties from doppler cloud radar, microwave radiometer, and lidar, J. Atmos. Ocean. Technol., 15, 1188–1195, https://doi.org/10.1175/1520-0426(1998)015<1188:FORCCN>2.0.CO;2, 1998.
Fernández, A. J., Molero, F., Becerril-Valle, M., Coz, E., Salvador, P., Artíñano, B., and Pujadas, M.: Application of remote sensing techniques to study aerosol water vapour uptake in a real atmosphere, Atmos. Res., 202, 112–127, https://doi.org/10.1016/J.ATMOSRES.2017.11.020, 2018.
Gasteiger, J., Wiegner, M., Groß, S., Freudenthaler, V., Toledano, C., Tesche, M., and Kandler, K.: Modelling lidar-relevant optical properties of complex mineral dust aerosols, Tellus B, 63, 725–741, https://doi.org/10.1111/J.1600-0889.2011.00559.X, 2011.
Ghan, S. J. and Collins, D. R.: Use of in situ data to test a Raman lidar-based cloud condensation nuclei remote sensing method, J. Atmos. Ocean. Technol., 21, 387–394, https://doi.org/10.1175/1520-0426(2004)021<0387:UOISDT>2.0.CO;2, 2004.
Ghan, S. J., Rissman, T. A., Elleman, R., Ferrare, R. A., Turner, D., Flynn, C., Wang, J., Orgen, J., Hudson, J., Jonsson, H. H., VanReken, T., Flagan, R. C., and Seinfeld, J. H.: Use of situ cloud condensation nuclei, extinction, and aerosol size distribution measurements to test a method for retrieving cloud condensation nuclei profiles from surface measurements, J. Geophys. Res.-Atmos., 111, D05S10, https://doi.org/10.1029/2004JD005752, 2006.
Giannakaki, E., van Zyl, P. G., Müller, D., Balis, D., and Komppula, M.: Optical and microphysical characterization of aerosol layers over South Africa by means of multi-wavelength depolarization and Raman lidar measurements, Atmos. Chem. Phys., 16, 8109–8123, https://doi.org/10.5194/acp-16-8109-2016, 2016.
Gryspeerdt, E. and Stier, P.: Regime-based analysis of aerosol-cloud interactions, Geophys. Res. Lett., 39, L21802, https://doi.org/10.1029/2012GL053221, 2012.
Haarig, M., Ansmann, A., Engelmann, R., Baars, H., Toledano, C., Torres, B., Althausen, D., Radenz, M., and Wandinger, U.: First triple-wavelength lidar observations of depolarization and extinction-to-backscatter ratios of Saharan dust, Atmos. Chem. Phys., 22, 355–369, https://doi.org/10.5194/acp-22-355-2022, 2022.
Hair, J. W., Hostetler, C. A., Cook, A. L., Harper, D. B., Ferrare, R. A., Mack, T. L., Welch, W., Izquierdo, L. R., and Hovis, F. E.: Airborne High Spectral Resolution Lidar for profiling aerosol optical properties, Appl. Opt., 47, 6734–6752, 2008.
Hänel, A., Baars, H., Althausen, D., Ansmann, A., Engelmann, R., and Sun, J. Y.: One-year aerosol profiling with EUCAARI Raman lidar at Shangdianzi GAW station: Beijing plume and seasonal variations, J. Geophys. Res.-Atmos., 117, D13201, https://doi.org/10.1029/2012JD017577, 2012.
Hatch, T. and Choate, S. P.: Statistical description of the size properties of non uniform particulate substances, J. Frank. Inst., 207, 369–387, https://doi.org/10.1016/S0016-0032(29)91451-4, 1929.
IPCC: Climate Change 2013: The Physical Science Basis. Contribution of Working Group I to the Fifth Assessment Report of the Intergovernmental Panel on Climate Change, edited by: Stocker, T. F., Qin, D., Plattner, G.-K., Tignor, M., Allen, S. K., Boschung, J., Nauels, A., Xia, Y., Bex, V., and Midgley, P. M., Cambridge University Press, Cambridge, United Kingdom and New York, NY, USA, 1535 pp., 2013.
IPCC: Climate Change 2014: Synthesis Report, Contribution of Working Groups I, II and III to the Fifth Assessment Report of the Intergovernmental Panel on Climate Change, IPCC, 151 pp., https://doi.org/10.1017/CBO9781107415324.004, 2014.
Jurányi, Z., Gysel, M., Weingartner, E., DeCarlo, P. F., Kammermann, L., and Baltensperger, U.: Measured and modelled cloud condensation nuclei number concentration at the high alpine site Jungfraujoch, Atmos. Chem. Phys., 10, 7891–7906, https://doi.org/10.5194/acp-10-7891-2010, 2010.
Kacarab, M., Thornhill, K. L., Dobracki, A., Howell, S. G., O'Brien, J. R., Freitag, S., Poellot, M. R., Wood, R., Zuidema, P., Redemann, J., and Nenes, A.: Biomass burning aerosol as a modulator of the droplet number in the southeast Atlantic region, Atmos. Chem. Phys., 20, 3029–3040, https://doi.org/10.5194/acp-20-3029-2020, 2020.
Kantorovitch, L.: The method of successive approximation for functional equations, Acta Math., 71, 63–97, https://doi.org/10.1007/BF02547750, 1939.
Kapustin, V. N., Clarke, A. D., Shinozuka, Y., Howell, S., Brekhovskikh, V., Nakajima, T., and Higurashi, A.: On the determination of a cloud condensation nuclei from satellite: Challenges and possibilities, J. Geophys. Res.-Atmos., 111, D04202, https://doi.org/10.1029/2004JD005527, 2006.
Kasten, F.: Visibility forecast in the phase of pre-condensation, Tellus, 21, 631–635, https://doi.org/10.3402/TELLUSA.V21I5.10112, 1969.
Kim, M.-H., Omar, A. H., Tackett, J. L., Vaughan, M. A., Winker, D. M., Trepte, C. R., Hu, Y., Liu, Z., Poole, L. R., Pitts, M. C., Kar, J., and Magill, B. E.: The CALIPSO version 4 automated aerosol classification and lidar ratio selection algorithm, Atmos. Meas. Tech., 11, 6107–6135, https://doi.org/10.5194/amt-11-6107-2018, 2018.
Koehler, K. A., Kreidenweis, S. M., DeMott, P. J., Petters, M. D., Prenni, A. J., and Carrico, C. M.: Hygroscopicity and cloud droplet activation of mineral dust aerosol, Geophys. Res. Lett., 36, L08805, https://doi.org/10.1029/2009GL037348, 2009.
Kolmogorov, A. N.: About the Logarithmic-normal Law of Particle Size Distribution during Crushing, USSR Acad. Sci., 31, 99–101, 1941.
Komppula, M., Mielonen, T., Arola, A., Korhonen, K., Lihavainen, H., Hyvärinen, A.-P., Baars, H., Engelmann, R., Althausen, D., Ansmann, A., Müller, D., Panwar, T. S., Hooda, R. K., Sharma, V. P., Kerminen, V.-M., Lehtinen, K. E. J., and Viisanen, Y.: Technical Note: One year of Raman-lidar measurements in Gual Pahari EUCAARI site close to New Delhi in India – Seasonal characteristics of the aerosol vertical structure, Atmos. Chem. Phys., 12, 4513–4524, https://doi.org/10.5194/acp-12-4513-2012, 2012.
Kuang, Y., Zhao, C., Tao, J., Bian, Y., Ma, N., and Zhao, G.: A novel method for deriving the aerosol hygroscopicity parameter based only on measurements from a humidified nephelometer system, Atmos. Chem. Phys., 17, 6651–6662, https://doi.org/10.5194/acp-17-6651-2017, 2017.
Li, J., Yin, Y., Li, P., Li, Z., Li, R., Cribb, M., Dong, Z., Zhang, F., Li, J., Ren, G., Jin, L., and Li, Y.: Aircraft measurements of the vertical distribution and activation property of aerosol particles over the Loess Plateau in China, Atmos. Res., 155, 73–86, https://doi.org/10.1016/J.ATMOSRES.2014.12.004, 2015a.
Li, J., Liu, X., Yuan, L., Yin, Y., Li, Z., Li, P., Ren, G., Jin, L., Li, R., Dong, Z., Li, Y., and Yang, J.: Vertical distribution of aerosol optical properties based on aircraft measurements over the Loess Plateau in China, J. Environ. Sci., 34, 44–56, https://doi.org/10.1016/J.JES.2015.01.021, 2015b.
Liu, J. and Li, Z.: Estimation of cloud condensation nuclei concentration from aerosol optical quantities: influential factors and uncertainties, Atmos. Chem. Phys., 14, 471–483, https://doi.org/10.5194/acp-14-471-2014, 2014.
Liu, P. F., Zhao, C. S., Göbel, T., Hallbauer, E., Nowak, A., Ran, L., Xu, W. Y., Deng, Z. Z., Ma, N., Mildenberger, K., Henning, S., Stratmann, F., and Wiedensohler, A.: Hygroscopic properties of aerosol particles at high relative humidity and their diurnal variations in the North China Plain, Atmos. Chem. Phys., 11, 3479–3494, https://doi.org/10.5194/acp-11-3479-2011, 2011.
Liu, Z., Vaughan, M., Winker, D., Kittaka, C., Getzewich, B., Kuehn, R., Omar, A., Powell, K., Trepte, C., and Hostetler, C.: The CALIPSO lidar cloud and aerosol discrimination: Version 2 algorithm and initial assessment of performance, J. Atmos. Ocean. Technol., 26, 1198–1213, https://doi.org/10.1175/2009JTECHA1229.1, 2009.
Lv, M., Liu, D., Li, Z., Mao, J., Sun, Y., Wang, Z., Wang, Y., and Xie, C.: Hygroscopic growth of atmospheric aerosol particles based on lidar, radiosonde, and in situ measurements: Case studies from the Xinzhou field campaign, J. Quant. Spectrosc. Ra., 188, 60–70, https://doi.org/10.1016/J.JQSRT.2015.12.029, 2017.
Lv, M., Wang, Z., Li, Z., Luo, T., Ferrare, R., Liu, D., Wu, D., Mao, J., Wan, B., Zhang, F., and Wang, Y.: Retrieval of Cloud Condensation Nuclei Number Concentration Profiles From Lidar Extinction and Backscatter Data, J. Geophys. Res.-Atmos., 123, 6082–6098, https://doi.org/10.1029/2017JD028102, 2018.
Mamouri, R.-E. and Ansmann, A.: Potential of polarization lidar to provide profiles of CCN- and INP-relevant aerosol parameters, Atmos. Chem. Phys., 16, 5905–5931, https://doi.org/10.5194/acp-16-5905-2016, 2016.
Mattis, I., D'Amico, G., Baars, H., Amodeo, A., Madonna, F., and Iarlori, M.: EARLINET Single Calculus Chain – technical – Part 2: Calculation of optical products, Atmos. Meas. Tech., 9, 3009–3029, https://doi.org/10.5194/amt-9-3009-2016, 2016.
Mishchenko, M. I. and Travis, L. D.: Capabilities and limitations of a current FORTRAN implementation of the T-matrix method for randomly oriented, rotationally symmetric scatterers, J. Quant. Spectrosc. Ra., 60, 309–324, https://doi.org/10.1016/S0022-4073(98)00008-9, 1998.
Molod, A., Takacs, L., Suarez, M., and Bacmeister, J.: Development of the GEOS-5 atmospheric general circulation model: evolution from MERRA to MERRA2, Geosci. Model Dev., 8, 1339–1356, https://doi.org/10.5194/gmd-8-1339-2015, 2015.
Müller, D., Wandinger, U., and Ansmann, A.: Microphysical particle parameters from extinction and backscatter lidar data by inversion with regularization: theory, Appl. Opt., 38, 2346, https://doi.org/10.1364/AO.38.002346, 1999.
Müller, D., Mattis, I., Wandinger, U., Ansmann, A., Althausen, D., and Stohl, A.: Raman lidar observations of aged Siberian and Canadian forest fire smoke in the free troposphere over Germany in 2003: Microphysical particle characterization, J. Geophys. Res.-Atmos., 110, D17201, https://doi.org/10.1029/2004JD005756, 2005.
Müller, D., Ansmann, A., Mattis, I., Tesche, M., Wandinger, U., Althausen, D., and Pisani, G.: Aerosol-type-dependent lidar ratios observed with Raman lidar, J. Geophys. Res.-Atmos., 112, D16202, https://doi.org/10.1029/2006JD008292, 2007.
Müller, D., Böckmann, C., Kolgotin, A., Schneidenbach, L., Chemyakin, E., Rosemann, J., Znak, P., and Romanov, A.: Microphysical particle properties derived from inversion algorithms developed in the framework of EARLINET, Atmos. Meas. Tech., 9, 5007–5035, https://doi.org/10.5194/amt-9-5007-2016, 2016.
Nam, C., Bony, S., Dufresne, J. L., and Chepfer, H.: The too few, too bright tropical low-cloud problem in CMIP5 models, Geophys. Res. Lett., 39, L21801, https://doi.org/10.1029/2012GL053421, 2012.
NASA: Atmospheric Science Data Center, EarthData [data set], https://eosweb.larc.nasa.gov/ (last access: 16 January 2022), 2022.
Omar, A. H., Winker, D. M., Kittaka, C., Vaughan, M. A., Liu, Z., Hu, Y., Trepte, C. R., Rogers, R. R., Ferrare, R. A., Lee, K. P., Kuehn, R. E., and Hostetler, C. A.: The CALIPSO automated aerosol classification and lidar ratio selection algorithm, J. Atmos. Ocean. Technol., 26, 1994–2014, https://doi.org/10.1175/2009JTECHA1231.1, 2009.
ORACLES Science Team: Suite of Aerosol, Cloud, and Related Data Acquired Aboard P3 During ORACLES 2018, Version 2, NASA [data set], https://doi.org/10.5067/Suborbital/ORACLES/P3/2018_V2, 2020a.
ORACLES Science Team: Suite of Aerosol, Cloud, and Related Data Acquired Aboard P3 During ORACLES 2017, Version 2, NASA [data set], https://doi.org/10.5067/Suborbital/ORACLES/P3/2017_V2, 2020b.
Paasonen, P., Asmi, A., Petäjä, T., Kajos, M. K., Äijälä, M., Junninen, H., Holst, T., Abbatt, J. P. D., Arneth, A., Birmili, W., van der Gon, H. D., Hamed, A., Hoffer, A., Laakso, L., Laaksonen, A., Richard Leaitch, W., Plass-Dülmer, C., Pryor, S. C., Räisänen, P., Swietlicki, E., Wiedensohler, A., Worsnop, D. R., Kerminen, V. M., and Kulmala, M.: Warming-induced increase in aerosol number concentration likely to moderate climate change, Nat. Geosci., 6, 438–442, https://doi.org/10.1038/NGEO1800, 2013.
Patel, P. N. and Jiang, J. H.: Cloud condensation nuclei characteristics at the Southern Great Plains site: role of particle size distribution and aerosol hygroscopicity, Environ. Res. Commun., 3, 075002, https://doi.org/10.1088/2515-7620/AC0E0B, 2021.
Patel, P. N. and Kumar, R.: Dust Induced Changes in Ice Cloud and Cloud Radiative Forcing over a High Altitude Site, Aerosol Air Qual. Res., 16, 1820–1831, https://doi.org/10.4209/aaqr.2015.05.0325, 2016.
Patel, P. N., Quaas, J., and Kumar, R.: A new statistical approach to improve the satellite-based estimation of the radiative forcing by aerosol–cloud interactions, Atmos. Chem. Phys., 17, 3687–3698, https://doi.org/10.5194/acp-17-3687-2017, 2017.
Patel, P. N., Gautam, R., Michibata, T., and Gadhavi, H.: Strengthened Indian Summer Monsoon Precipitation Susceptibility Linked to Dust-Induced Ice Cloud Modification, Geophys. Res. Lett., 46, 8431–8441, https://doi.org/10.1029/2018GL081634, 2019.
Pérez-Ramírez, D., Whiteman, D. N., Veselovskii, I., Kolgotin, A., Korenskiy, M., and Alados-Arboledas, L.: Effects of systematic and random errors on the retrieval of particle microphysical properties from multiwavelength lidar measurements using inversion with regularization, Atmos. Meas. Tech., 6, 3039–3054, https://doi.org/10.5194/amt-6-3039-2013, 2013.
Petters, M. D. and Kreidenweis, S. M.: A single parameter representation of hygroscopic growth and cloud condensation nucleus activity, Atmos. Chem. Phys., 7, 1961–1971, https://doi.org/10.5194/acp-7-1961-2007, 2007.
Petters, M. D., Carrico, C. M., Kreidenweis, S. M., Prenni, A. J., DeMott, P. J., Collett, J. L., and Moosmüller, H.: Cloud condensation nucleation activity of biomass burning aerosol, J. Geophys. Res.-Atmos., 114, 1–16, https://doi.org/10.1029/2009JD012353, 2009.
Quaas, J., Boucher, O., Bellouin, N., and Kinne, S.: Satellite-based estimate of the direct and indirect aerosol climate forcing, J. Geophys. Res.-Atmos., 113, D05204, https://doi.org/10.1029/2007JD008962, 2008.
Quaas, J., Ming, Y., Menon, S., Takemura, T., Wang, M., Penner, J. E., Gettelman, A., Lohmann, U., Bellouin, N., Boucher, O., Sayer, A. M., Thomas, G. E., McComiskey, A., Feingold, G., Hoose, C., Kristjánsson, J. E., Liu, X., Balkanski, Y., Donner, L. J., Ginoux, P. A., Stier, P., Grandey, B., Feichter, J., Sednev, I., Bauer, S. E., Koch, D., Grainger, R. G., Kirkevåg, A., Iversen, T., Seland, Ø., Easter, R., Ghan, S. J., Rasch, P. J., Morrison, H., Lamarque, J.-F., Iacono, M. J., Kinne, S., and Schulz, M.: Aerosol indirect effects – general circulation model intercomparison and evaluation with satellite data, Atmos. Chem. Phys., 9, 8697–8717, https://doi.org/10.5194/acp-9-8697-2009, 2009.
Redemann, J., Wood, R., Zuidema, P., Doherty, S. J., Luna, B., LeBlanc, S. E., Diamond, M. S., Shinozuka, Y., Chang, I. Y., Ueyama, R., Pfister, L., Ryoo, J.-M., Dobracki, A. N., da Silva, A. M., Longo, K. M., Kacenelenbogen, M. S., Flynn, C. J., Pistone, K., Knox, N. M., Piketh, S. J., Haywood, J. M., Formenti, P., Mallet, M., Stier, P., Ackerman, A. S., Bauer, S. E., Fridlind, A. M., Carmichael, G. R., Saide, P. E., Ferrada, G. A., Howell, S. G., Freitag, S., Cairns, B., Holben, B. N., Knobelspiesse, K. D., Tanelli, S., L'Ecuyer, T. S., Dzambo, A. M., Sy, O. O., McFarquhar, G. M., Poellot, M. R., Gupta, S., O'Brien, J. R., Nenes, A., Kacarab, M., Wong, J. P. S., Small-Griswold, J. D., Thornhill, K. L., Noone, D., Podolske, J. R., Schmidt, K. S., Pilewskie, P., Chen, H., Cochrane, S. P., Sedlacek, A. J., Lang, T. J., Stith, E., Segal-Rozenhaimer, M., Ferrare, R. A., Burton, S. P., Hostetler, C. A., Diner, D. J., Seidel, F. C., Platnick, S. E., Myers, J. S., Meyer, K. G., Spangenberg, D. A., Maring, H., and Gao, L.: An overview of the ORACLES (ObseRvations of Aerosols above CLouds and their intEractionS) project: aerosol–cloud–radiation interactions in the southeast Atlantic basin, Atmos. Chem. Phys., 21, 1507–1563, https://doi.org/10.5194/acp-21-1507-2021, 2021.
Remer, L. A., Kaufman, Y. J., Tanré, D., Mattoo, S., Chu, D. A., Martins, J. V., Li, R. R., Ichoku, C., Levy, R. C., Kleidman, R. G., Eck, T. F., Vermote, E., and Holben, B. N.: The MODIS aerosol algorithm, products, and validation, J. Atmos. Sci., 62, 947–973, https://doi.org/10.1175/JAS3385.1, 2005.
Roberts, G. C. and Nenes, A.: A continuous-flow streamwise thermal-gradient CCN chamber for atmospheric measurements, Aerosol Sci. Technol., 39, 206–221, https://doi.org/10.1080/027868290913988, 2005.
Rose, D., Gunthe, S. S., Mikhailov, E., Frank, G. P., Dusek, U., Andreae, M. O., and Pöschl, U.: Calibration and measurement uncertainties of a continuous-flow cloud condensation nuclei counter (DMT-CCNC): CCN activation of ammonium sulfate and sodium chloride aerosol particles in theory and experiment, Atmos. Chem. Phys., 8, 1153–1179, https://doi.org/10.5194/acp-8-1153-2008, 2008.
Rosenfeld, D.: Flood or drought: how do aerosols affect precipitation?, Science, 321, 1309–1313, 2008.
Rosenfeld, D., Andreae, M. O., Asmi, A., Chin, M., Leeuw, G., Donovan, D. P., Kahn, R., Kinne, S., Kivekäs, N., Kulmala, M., Lau, W., Schmidt, K. S., Suni, T., Wagner, T., Wild, M., and Quaas, J.: Global observations of aerosol-cloud-precipitation- climate interactions, Rev. Geophys., 52, 750–808, https://doi.org/10.1002/2013RG000441, 2014.
Rosenfeld, D., Zheng, Y., Hashimshoni, E., Pöhlker, M. L., Jefferson, A., Pöhlker, C., Yu, X., Zhu, Y., Liu, G., Yue, Z., Fischman, B., Li, Z., Giguzin, D., Goren, T., Artaxo, P., Barbosa, H. M. J., Pöschl, U., and Andreae, M. O.: Satellite retrieval of cloud condensation nuclei concentrations by using clouds as CCN chambers, P. Natl. Acad. Sci. USA, 113, 5828–5834, https://doi.org/10.1073/pnas.1514044113, 2016.
Saito, M., Yang, P., Ding, J., and Liu, X.: A Comprehensive Database of the Optical Properties of Irregular Aerosol Particles for Radiative Transfer Simulations, J. Atmos. Sci., 78, 2089–2111, https://doi.org/10.1175/JAS-D-20-0338.1, 2021.
Seinfeld, J. H., Bretherton, C., Carslaw, K. S., Coe, H., DeMott, P. J., Dunlea, E. J., Feingold, G., Ghan, S., Guenther, A. B., Kahn, R., Kraucunas, I., Kreidenweis, S. M., Molina, M. J., Nenes, A., Penner, J. E., Prather, K. A., Ramanathan, V., Ramaswamy, V., Rasch, P. J., Ravishankara, A. R., Rosenfeld, D., Stephens, G., and Wood, R.: Improving our fundamental understanding of the role of aerosol−cloud interactions in the climate system, P. Natl. Acad. Sci. USA, 113, 5781–5790, https://doi.org/10.1073/pnas.1514043113, 2016.
Shinozuka, Y., Clarke, A. D., Nenes, A., Jefferson, A., Wood, R., McNaughton, C. S., Ström, J., Tunved, P., Redemann, J., Thornhill, K. L., Moore, R. H., Lathem, T. L., Lin, J. J., and Yoon, Y. J.: The relationship between cloud condensation nuclei (CCN) concentration and light extinction of dried particles: indications of underlying aerosol processes and implications for satellite-based CCN estimates, Atmos. Chem. Phys., 15, 7585–7604, https://doi.org/10.5194/acp-15-7585-2015, 2015.
Shipley, S. T., Tracy, D. H., Eloranta, E. W., Trauger, J. T., Sroga, J. T., Roesler, F. L., and Weinman, J. A.: HIGH SPECTRAL RESOLUTION LIDAR TO MEASURE OPTICAL SCATTERING PROPERTIES OF ATMOSPHERIC AEROSOLS. 1: THEORY AND INSTRUMENTATION., Appl. Opt., 22, 3716–3724, https://doi.org/10.1364/AO.22.003716, 1983.
Stier, P.: Limitations of passive remote sensing to constrain global cloud condensation nuclei, Atmos. Chem. Phys., 16, 6595–6607, https://doi.org/10.5194/acp-16-6595-2016, 2016.
Tan, W., Zhao, G., Yu, Y., Li, C., Li, J., Kang, L., Zhu, T., and Zhao, C.: Method to retrieve cloud condensation nuclei number concentrations using lidar measurements, Atmos. Meas. Tech., 12, 3825–3839, https://doi.org/10.5194/amt-12-3825-2019, 2019.
Tesche, M., Ansmann, A., Müller, D., Althausen, D., Engelmann, R., Freudenthaler, V., and Groß, S.: Vertically resolved separation of dust and smoke over Cape Verde using multiwavelength Raman and polarization lidars during Saharan Mineral Dust Experiment 2008, J. Geophys. Res.-Atmos., 114, D13202, https://doi.org/10.1029/2009JD011862, 2009.
Titos, G., Cazorla, A., Zieger, P., Andrews, E., Lyamani, H., Granados-Muñoz, M. J., Olmo, F. J., and Alados-Arboledas, L.: Effect of hygroscopic growth on the aerosol light-scattering coefficient: A review of measurements, techniques and error sources, Atmos. Environ., 141, 494–507, https://doi.org/10.1016/J.ATMOSENV.2016.07.021, 2016.
Torres, B., Dubovik, O., Toledano, C., Berjon, A., Cachorro, V. E., Lapyonok, T., Litvinov, P., and Goloub, P.: Sensitivity of aerosol retrieval to geometrical configuration of ground-based sun/sky radiometer observations, Atmos. Chem. Phys., 14, 847–875, https://doi.org/10.5194/acp-14-847-2014, 2014.
Torres, B., Dubovik, O., Fuertes, D., Schuster, G., Cachorro, V. E., Lapyonok, T., Goloub, P., Blarel, L., Barreto, A., Mallet, M., Toledano, C., and Tanré, D.: Advanced characterisation of aerosol size properties from measurements of spectral optical depth using the GRASP algorithm, Atmos. Meas. Tech., 10, 3743–3781, https://doi.org/10.5194/amt-10-3743-2017, 2017.
U.S. Department of Energy: Capabilities, Atmospheric Observatories, ARM [data set], https://www.arm.gov/capabilities/observatories/sgp (last access: 16 January 2022), 2022.
Vaughan, M., Pitts, M., Trepte, C., Winker, D., Detweiler, P., Garnier, A., Getzewich, B., Hunt, W., Lamberth, J., Lee, K.-P., Lucker, P., Murray, T., Rodier, S., Tremas, T., Bazureau, A., and Pelon, J.: Cloud - Aerosol LIDAR Infrared Pathfinder Satellite Observations (CALIPSO), Data Management System, Data Products Catalog, Document No: PC-SCI-503, Release 4.10, https://www-calipso.larc.nasa.gov/products/CALIPSO_DPC_Rev4x10.pdf (last access: 16 January 2022), 2017.
Veselovskii, I., Kolgotin, A., Griaznov, V., Müller, D., Wandinger, U., and Whiteman, D. N.: Inversion with regularization for the retrieval of tropospheric aerosol parameters from multiwavelength lidar sounding, Appl. Opt., 41, 3685, https://doi.org/10.1364/AO.41.003685, 2002.
Veselovskii, I., Kolgotin, A., Griaznov, V., Müller, D., Franke, K., and Whiteman, D. N.: Inversion of multiwavelength Raman lidar data for retrieval of bimodal aerosol size distribution, Appl. Opt., 43, 1180–1195, https://doi.org/10.1364/AO.43.001180, 2004.
Veselovskii, I., Dubovik, O., Kolgotin, A., Korenskiy, M., Whiteman, D. N., Allakhverdiev, K., and Huseyinoglu, F.: Linear estimation of particle bulk parameters from multi-wavelength lidar measurements, Atmos. Meas. Tech., 5, 1135–1145, https://doi.org/10.5194/amt-5-1135-2012, 2012.
Wang, Y., Li, Z., Zhang, Y., Du, W., Zhang, F., Tan, H., Xu, H., Fan, T., Jin, X., Fan, X., Dong, Z., Wang, Q., and Sun, Y.: Characterization of aerosol hygroscopicity, mixing state, and CCN activity at a suburban site in the central North China Plain, Atmos. Chem. Phys., 18, 11739–11752, https://doi.org/10.5194/acp-18-11739-2018, 2018.
Winker, D. M., Hunt, W. H., and McGill, M. J.: Initial performance assessment of CALIOP, Geophys. Res. Lett., 34, L19803, https://doi.org/10.1029/2007GL030135, 2007.
Xu, F., Gao, L., Redemann, J., Flynn, C. J., Espinosa, W. R., da Silva, A. M., Stamnes, S., Burton, S. P., Liu, X., Ferrare, R., Cairns, B., and Dubovik, O.: A Combined Lidar-Polarimeter Inversion Approach for Aerosol Remote Sensing Over Ocean, Front. Remote Sens., 2, 620871, https://doi.org/10.3389/FRSEN.2021.620871, 2021.
Yang, P., Feng, Q., Hong, G., Kattawar, G. W., Wiscombe, W. J., Mishchenko, M. I., Dubovik, O., Laszlo, I., and Sokolik, I. N.: Modeling of the scattering and radiative properties of nonspherical dust-like aerosols, J. Aerosol Sci., 38, 995–1014, https://doi.org/10.1016/J.JAEROSCI.2007.07.001, 2007.
Young, S. A. and Vaughan, M. A.: The retrieval of profiles of particulate extinction from cloud-aerosol lidar infrared pathfinder satellite observations (CALIPSO) data: Algorithm description, J. Atmos. Ocean. Technol., 26, 1105–1119, https://doi.org/10.1175/2008JTECHA1221.1, 2009.
Yu, H., Chin, M., Winker, D. M., Omar, A. H., Liu, Z., Kittaka, C., and Diehl, T.: Global view of aerosol vertical distributions from CALIPSO lidar measurements and GOCART simulations: Regional and seasonal variations, J. Geophys. Res.-Atmos., 115, 1–19, https://doi.org/10.1029/2009JD013364, 2010.
Zuidema, P., Redemann, J., Haywood, J., Wood, R., Piketh, S., Hipondoka, M., and Formenti, P.: Smoke and clouds above the southeast Atlantic: Upcoming field campaigns probe absorbing aerosol’s impact on climate, B. Am. Meteorol. Soc., 97, 1131–1135, https://doi.org/10.1175/BAMS-D-15-00082.1, 2016.