the Creative Commons Attribution 4.0 License.
the Creative Commons Attribution 4.0 License.
 | 25 Aug 2023
A rise in HFC-23 emissions from eastern Asia since 2015
Hyeri Park
Jooil Kim
Haklim Choi
Sohyeon Geum
Yeaseul Kim
Rona L. Thompson
Jens Mühle
Peter K. Salameh
Christina M. Harth
Kieran M. Stanley
Simon O'Doherty
Paul J. Fraser
Peter G. Simmonds
Paul B. Krummel
Ray F. Weiss
Ronald G. Prinn
Trifluoromethane (CHF3, HFC-23), one of the most potent greenhouse gases among hydrofluorocarbons (HFCs), is mainly emitted to the atmosphere as a by-product in the production of the ozone-depleting legacy refrigerant and chemical feedstock chlorodifluoromethane (CHClF2, HCFC-22). A recent study on atmospheric observation-based global HFC-23 emissions (top-down estimates) showed significant discrepancies over 2014–2017 between the increase in the observation-derived emissions and the 87 % emission reduction expected from capture and destruction processes of HFC-23 at HCFC-22 production facilities implemented by national phase-out plans (bottom-up emission estimates) (Stanley et al., 2020). However, the actual regions responsible for the increased emissions were not identified. Here, we estimate the regional top-down emissions of HFC-23 for eastern Asia based on in situ measurements at Gosan, South Korea, and show that the HFC-23 emissions from eastern China have increased from 5.0±0.4 Gg yr−1 in 2008 to 9.5±1.0 Gg yr−1 in 2019. The continuous rise since 2015 was contrary to the large emissions reduction reported under the Chinese hydrochlorofluorocarbons production phase-out management plan (HPPMP). The cumulative difference between top-down and bottom-up estimates for 2015–2019 in eastern China was Gg, which accounts for 47±11 % of the global mismatch. Our analysis based on HCFC-22 production information suggests the HFC-23 emissions rise in eastern China is more likely associated with known HCFC-22 production facilities rather than the existence of unreported, unknown HCFC-22 production, and thus observed discrepancies between top-down and bottom-up emissions could be attributed to unsuccessful factory-level HFC-23 abatement and inaccurate quantification of emission reductions.
- Article
(3109 KB) - Full-text XML
-
Supplement
(1902 KB) - BibTeX
- EndNote


Trifluoromethane (CHF3, HFC-23) is mainly emitted as a by-product during the production of chlorodifluoromethane (CHClF2, HCFC-22), a legacy ozone-depleting refrigerant that is increasingly used as a chemical feedstock mainly for the manufacture of fluoropolymers (UNEP, 2018). HFC-23 has the highest 100-year global warming potential (GWP100 of 12,690) among hydrofluorocarbons and a long atmospheric lifetime of ∼228 years (Montzka and Velders, 2018; Newman et al., 2013). HFC-23 is included in the group of greenhouse gases regulated under the 1997 Kyoto Protocol. Participating developed countries (Annex I countries to the United Nations Framework Convention on Climate Change – UNFCCC) are obligated to report their HFC-23 emissions to the UNFCCC. While developing countries (non-Annex I countries) are not obligated to report their HFC-23 emissions to the UNFCCC, some developing countries (e.g., China, India, South Korea, Mexico, and Argentina) participated in the UNFCCC's Clean Development Mechanism (CDM) between 2003 and 2014, a program to reduce HFC-23 emissions from HCFC-22 production facilities. Participating HCFC-22 facilities were required to report their HFC-23 reductions to the UNFCCC and could trade Certified Emissions Reduction (CER) credits with developed countries. During the CDM period, the total HFC-23 emission reductions provided by developing countries were compiled in 474 CDM monitoring reports (data available at https://cdm.unfccc.int/, last access: 2 January 2023). However, note that not all HCFC-22 production facilities participated in the CDM program, and several facilities did not install HFC-23 abatement (destruction) technology (Montreal Protocol Technology and Economic Assessment Panel 2017 Assessment: hereinafter TEAP, 2017). Later, the HFC-23 by-production and emission associated with the production of HCFC-22 also began to be controlled by the Kigali Amendment to the Montreal Protocol on Substances that Deplete the Ozone Layer (MP), adopted in 2016 (Clark and Wagner, 2016), to preserve the climate benefit achieved by the MP.
The global production of HCFC-22, and thus HFC-23 emissions, is heavily centered around eastern Asia. Notably, China, where more than 50 % of the global HCFC-22 has been produced since 2009, can be considered one of the most significant HFC-23 emitters in the world (UNEP, 2018; Simmonds et al., 2018). After the end of the CDM in 2014, the Chinese National Development and Reform Commission (NDRC) announced its plan for a complete reduction in all HFC-23 emissions from HCFC-22 production facilities by 2019 (NDRC, 2015). From 2014 to 2016, 13 HFC-23 abatement systems were installed at 15 HCFC-22 production lines that did not previously participate in the CDM program (TEAP, 2017). TEAP 2021 reported that the Chinese total of 32 HCFC-22 production lines in 2015 decreased to 18 lines in 2017 but also that the Chinese HCFC-22 production increased in 2017 compared to 2015. China has reported the annual HFC-23 emission reduction under the Chinese HCFC Production Phase-out Management Plan (HPPMP). The HFC-23 reductions reported by HCFC-22 production plants to the HPPMP were 45 %, 93 %, 98 %, and 99 % of total Chinese HFC-23 emissions in 2015, 2016, 2017, and 2018, respectively (UNEP, 2018; TEAP, 2021). According to China's HPPMP, the expected HFC-23 emissions from HCFC-22 production in the whole of China should have been 7.5, 1.0, 0.3 and 0.3 Gg yr−1 in 2015, 2016, 2017, and 2018, respectively.
Considering the activities for HFC-23 emissions reduction, we discuss (a) the 2008–2012 “CDM period”, when mitigation of HFC-23 emissions had been introduced under the UNFCCC CDM to capture and incinerate HFC-23 co-production; (b) the 2013–2014 “end of CDM period”; and (c) the 2015–2019 “post-CDM period or HPPMP period” when the Chinese HPPMP mitigation activities were underway (after CDM).
A recent top-down study based on atmospheric measurements (Stanley et al., 2020) showed that the global HFC-23 emissions had increased and in 2018 were higher than at any point in history. Stanley et al. (2020) also suggested that these results contradicted the 87 % emission reduction anticipated over 2014–2017 from HFC-23 capture and destruction activities at HCFC-22 production facilities under the national phase-out plans initiated following the end of the CDM programs in a few developing countries including China (UNEP, 2018; Say et al., 2019). The observed discrepancies between the top-down and the inventory-based “bottom-up” global HFC-23 emission estimates implied unexpectedly low abatement rates, unreported HCFC-22 production and resulting HFC-23 by-product emissions, and/or unexpected substantial end use and associated HFC-23 emissions. Therefore, these results at the global scale should be supported by investigations at the regional level where these HFC-23 emission controls have been implemented.
In this study, we present top-down HFC-23 emissions in eastern Asia for 2008–2019, including post-CDM HFC-23 emissions in this region for the first time. Our estimates combine long-term, high-frequency in situ observations of atmospheric HFC-23 concentrations made at a regional site of the Advanced Global Atmospheric Gases Experiment (AGAGE) network in eastern Asia (Gosan station, Jeju Island, Korea, 33.3∘ N, 126.2∘ E) for 2008–2019, with a Bayesian atmospheric inverse method based on a Lagrangian particle dispersion model. To investigate the link of HFC-23 emissions to HCFC-22 production, we also analyze bottom-up estimates of HFC-23 emissions derived from reported HCFC-22 productions and co-production rates of HFC-23. The comparison between the regional top-down and bottom-up emissions is further discussed in terms of their potential contribution to the unexpected trends in global HFC-23 emissions observed in 2014–2017.

Figure 1Atmospheric HFC-23 concentrations observed from 2008 to 2019 at the Gosan station (GSN, 33.3∘ N, 126.2∘ E). Pollution events denoted by red dots were identified as significant enhancements in concentrations from background levels shown in black. Some data gaps in the Gosan measurement time series occurred due to instrumental system downtime caused mostly by typhoons and heavy rains. The green and blue dots represent all observations of atmospheric HFC-23 at Mace Head (53.3∘ N, 9.9∘ W) and Cape Grim (40.7∘ S, 144.7∘ E), respectively, for comparison.
2.1 In situ observations at Gosan
High-frequency atmospheric observations were made from 2008 to 2019 at Gosan (33.3∘ N, 126.2∘ E, 72 m a.s.l.) with a custom-built “Medusa” cryogenic trap and focusing system with gas chromatography and mass spectrometry (GC-MS) detection (Miller et al., 2008; Arnold et al., 2012). Measurements of ambient air samples, drawn from an air inlet at 72 m a.s.l. every 2 h, are bracketed with measurements of a working standard to correct for instrumental drift. The working standard is calibrated weekly against a secondary calibration tank prepared at the Scripps Institution of Oceanography (SIO). Measurements are reported on SIO calibration scales (e.g., SIO-07 scale for HFC-23 and SIO-05 scale for HCFC-22 and CFC-11 in this study). The Medusa system is operated as part of the AGAGE program (Prinn et al., 2018). Precision (1σ) derived from repeated analysis (n=12) of a working standard of ambient air was better than 1 % (i.e., the precision of HFC-23 < 1 %, HCFC-22 < 0.5 %, CFC-11 < 0.4 %) of background atmospheric concentrations for all compounds. The background concentrations (i.e., regional baseline) were determined using the AGAGE statistical pollution filtering algorithm (see more details in O'Doherty et al., 2001).
Gosan station is located on a remote cliff top of the southwestern tip of Jeju Island, south of the Korea Peninsula on the boundary between the Pacific Ocean and the Asian continent. The location is ideal for monitoring long-range transport from the surrounding regions with minimal local contamination. In the winter, the station often receives clean air masses characteristic of the “background” Northern Hemisphere directly from northern Siberia. In the summer, the monsoon brings in southerly oceanic air masses characteristic of background in the Southern Hemisphere (Li et al., 2018). During other times, the station samples polluted air masses from the Asian continent, particularly from China and South Korea. Some data gaps in the measurement time series occurred in summer and early autumn due to typhoons and heavy rains. In particular, the data gap from September 2016 to mid-April 2017 was due to impact of Super Typhoon Chiba and the following reconstruction of the station (Figs. 1 and S5).
2.2 Bayesian inverse modeling of regional emissions
2.2.1 Atmospheric transport modeling
The FLEXPART model is a widely used Lagrangian particle dispersion model for simulating atmospheric transport and mixing of trace gases. The model computes trajectories of air parcels from a source to a receptor location to describe atmospheric diffusion and vertical and horizontal transport and mixing processes. This information can then be used to estimate the contribution of surface emissions from different regions to the concentrations measured at a receptor location.
In this study, we use the FLEXPART version 10.4 (Pisso et al., 2019), which models atmospheric transport with meteorological fields from the Climate Forecast System Reanalysis (CFSR) model, at spatial and 1 h temporal resolutions (Saha, 2010, 2011). A total of 50 000 particles were released from the sampling inlet height at the Gosan station during a 30 min window centered around each measurement time and tracked backwards in time for 20 d from the measurement site throughout the global domain. Footprint sensitivities, which relate the emissions at each grid to measured concentrations at Gosan, are estimated from the model outputs below 100 m in altitude. The total emission sensitivity was used to determine the variable size grids with grid cells ranging in size from to , aggregated with a larger grid size with decreasing sensitivity (for more details, refer to Kim et al., 2021). On the basis of a consideration of the sensitivity of the observations to emissions from surrounding model grid cells (Fig. S1 in the Supplement), we focus our analysis on the region that we denote as “eastern Asia (20–50∘ N and 110–160∘ E)”. This region contains eastern China, South Korea, North Korea, and western Japan. The boundaries of the nine provinces (Anhui, Beijing, Hebei, Jiangsu, Liaoning, Shandong, Shanghai, Tianjin and Zhejiang) in eastern China are denoted by thin gray lines in Fig. S1.
Bayesian inversion framework: FLEXINVERT
The FLEXINVERT+ Bayesian inverse model framework combines measured enhancement concentrations, air transport estimated from FLEXPART, and a priori emissions to derive a posteriori emissions. The model optimizes the a posteriori emissions to minimize the following cost function (Thompson and Stohl, 2014):
where p is the state vector of emissions, p0 is a priori estimate vector, y is the measured enhancements, H is the matrices derived from the FLEXPART backward simulations, B is the covariance matrix of a priori emission errors, and R is the covariance matrix of measurement errors.
In the model framework, the “enhancement” concentrations were determined by linearly extrapolating the monthly mean background concentrations and subtracting these extrapolated background concentrations from the measured concentrations corresponding to each measurement time (Kim et al., 2021), and the bi-hourly enhancement data were used for the inversion without temporal averaging.
A priori emissions of HFC-23 for the eastern Asia region and the global totals were determined as the 2008 a priori values of Stohl et al. (2010) and Stanley et al. (2020), respectively. The a priori emissions are 3.2 Gg yr−1 for eastern China (8.5 Gg yr−1 for the entirety of China), 0.27 Gg yr−1 for South Korea, 0.01 Gg yr−1 for North Korea, and 0.03 Gg yr−1 for western Japan (0.08 Gg yr−1 for the entirety of Japan) (Stohl et al., 2010). Global a priori emissions are 13.1 Gg yr−1 (Stanley et al., 2020). Their magnitudes and spatial distributions were kept constant for the study period (2008–2019), ensuring that resulting trends of a posteriori emissions are not biased by any changes in a priori inputs and are informed solely by observations. More detailed information on a priori distributions, magnitudes, and uncertainties is given in the Supplement.
The assigned total uncertainty of each enhancement (χMeasurement) was calculated as the square root of the quadratic sum of the three terms:
where χinstrument is instrumental precision of each compound, based on the repeatability of working standard measurements between sample observations (below 1 % for HFC-23); χBackground represents an uncertainty in background concentrations, which was determined by a month-to-month extrapolation between 1 standard deviation values of all the background monthly means similarly to the background concentrations derived at each measurement time over the observation period of 2008–2019 (about 0.2 ppt for the 2008–2019 HFC-23 enhancement average of 2.92 ppt); and χModeling is the model representation uncertainty that is estimated as about 6 % of our monthly mean background concentrations.
For HCFC-22 emissions estimates, we use the same inverse framework as used for HFC-23 based on high-frequency atmospheric observations from Gosan for 2008-2019. Optimal conditions of the inversion framework and its modeling performance were validated by analyzing CFC-11 emissions for eastern China based on Gosan CFC-11 data for 2008–2019 since the CFC-11 emissions were well defined in recent studies (Rigby et al., 2019; Park et al., 2021) that used multiple inversion methods. See the Supplement for details of the discussion about the inverse emissions estimates for HCFC-22 and CFC-11.
2.3 Bottom-up emissions estimates
Inventory-based bottom-up estimates of HFC-23 emissions can be derived from reports of HCFC-22 production multiplied by yearly co-production rates of HFC-23 (i.e., the total mass of co-produced and emitted HFC-23 as a fraction of total HCFC-22 production) (Stanley et al., 2020; TEAP, 2021) and from national emissions reported to the UNFCCC for Annex I countries. The former is important for non-Annex I countries that do not report emissions to the UNFCCC and refers to the potential emissions when no abatement activities would be applied. To generate unabated bottom-up HFC-23 emissions estimates in eastern China, we used yearly varying co-production rates of HFC-23 in the range of 2.32 %–2.78 % (Stanley et al., 2020; TEAP, 2017, 2021; UNEP, 2017) and the annual HCFC-22 production in eastern China.
For HCFC-22 production, the TEAP 2021 report provides the historical production data of the entirety of China for 2008–2018 including both dispersive and feedstock uses (Fig. S2) but not for our inversion domain of eastern China. Detailed information regarding factory-specific HCFC-22 production capacities and plant locations for China was given only for 2015 and 2018 in the TEAP 2017 and TEAP 2021 reports, respectively. Therefore, the production information for eastern China was available only for those 2 years. To estimate the annual HCFC-22 production for eastern China for other years, we derived yearly fractions of eastern China HCFC-22 production to the China total (dashed green line in Fig. S3) using the known 2015 and 2018 fractions in Eq. (3). Here, we assume that the eastern China production fractions were correlated exponentially with time because HCFC-22 production rates in developing countries exhibited an exponential growth over time until mid-2010 (https://ozone.unep.org/countries, last access: 2 January 2023).
Here P22(E. Ch) and P22(Ch) are HCFC-22 productions from eastern China and the entirety of China, respectively; A is the initial fraction in 2008; and k is a continuous growth rate. They were determined from the known HCFC-22 production fractions for the years of 2015 and 2018. We can then calculate fractions of HCFC-22 production for eastern China for other years.
This analysis was based on the assumptions that the 11 HCFC-22 facilities reported to UNEP are all the plants producing HCFC-22 in the entirety of China and that their production reports are correct. If unreported and/or newly built plants exist at unknown locations, actual fractions of HCFC-22 production for eastern China could be changed, but our estimation of the abated HFC-23 emissions for eastern China in Sect. 3.3 would not be affected because the emissions abatement action under both the CDM and HPPMP programs must have been taken in the reported facilities. It is also assumed that a varying rate between the 2015 and 2018 production fractions in eastern China can be applied consistently over time. The annual HCFC-22 productions in eastern China calculated from the inferred eastern China fractions (solid green line in Fig. S3) accounted for about 60 %–90 % of the annual totals for China during 2008–2018.
3.1 Atmospheric mole fractions of HFC-23
The time series of atmospheric HFC-23 concentrations for 2008–2019 at Gosan is shown in Fig. 1. The baseline values of the Gosan observations (i.e., background values representing regional clean condition without regional or local pollution events; black dots in Fig. 1) are determined using a statistical method developed in AGAGE, which uses a 121 d moving window to identify positive outliers from a Gaussian distribution that represent pollution events (O'Doherty et al., 2001). The annual averages of HFC-23 baseline concentrations at Gosan increased from 22.4±0.4 ppt in 2008 to 33.3±0.5 ppt in 2019 at a rate of 1.0±0.1 ppt yr−1. This rate is consistent with those from AGAGE stations Mace Head (53.3∘ N, 9.9∘ W) and Cape Grim (40.7∘ S, 144.7∘ E), which are representative of the global background monitoring stations in the Northern Hemisphere and Southern Hemisphere, respectively. We observed pollution events (red dots in Fig. 1) at Gosan continuously throughout the record with significant enhancements above background levels, which were influenced primarily by emissions from eastern Asia sources. Notably, the pollution signals were significant even during the CDM period (for China, 2006–early 2014) and later during the Chinese abatement activities under the HPPMP.
3.2 HFC-23 emissions from eastern Asia derived from atmospheric observations using inverse modeling
Unlike the global background monitoring stations, we observed large pollution events at Gosan continuously throughout the record, which has prompted a more detailed analysis of HFC-23 in eastern Asia to find and quantify potential sources. Using the measurement enhancements in concentration units above the monthly mean baseline, the atmospheric transport model (the Lagrangian particle dispersion model FLEXPART), and a regional inverse model framework (FLEXINVERT+), we calculate the qualitative spatial distribution of a posteriori emissions and estimate regional emissions of HFC-23 in eastern Asia including eastern China, North Korea, South Korea, and western Japan (Fig. 2 and Table 1). These regions are based on the high sensitivity of the Gosan atmospheric measurements to HFC-23 emissions from the surrounding areas (see Fig. S1). The region denoted as “eastern China” contains the nine relevant provinces (Anhui, Beijing, Hebei, Jiangsu, Liaoning, Shandong, Shanghai, Tianjin, and Zhejiang) and “western Japan” contains the four relevant regions (Chūgoku, Kansai, Kyūshū, and Okinawa and Shikoku) (Rigby et al., 2019; Park et al., 2021; Kim et al., 2021; Western et al., 2022).
Table 1Top-down emissions of HFC-23 for eastern Asia (eastern China, North Korea, South Korea, western Japan).
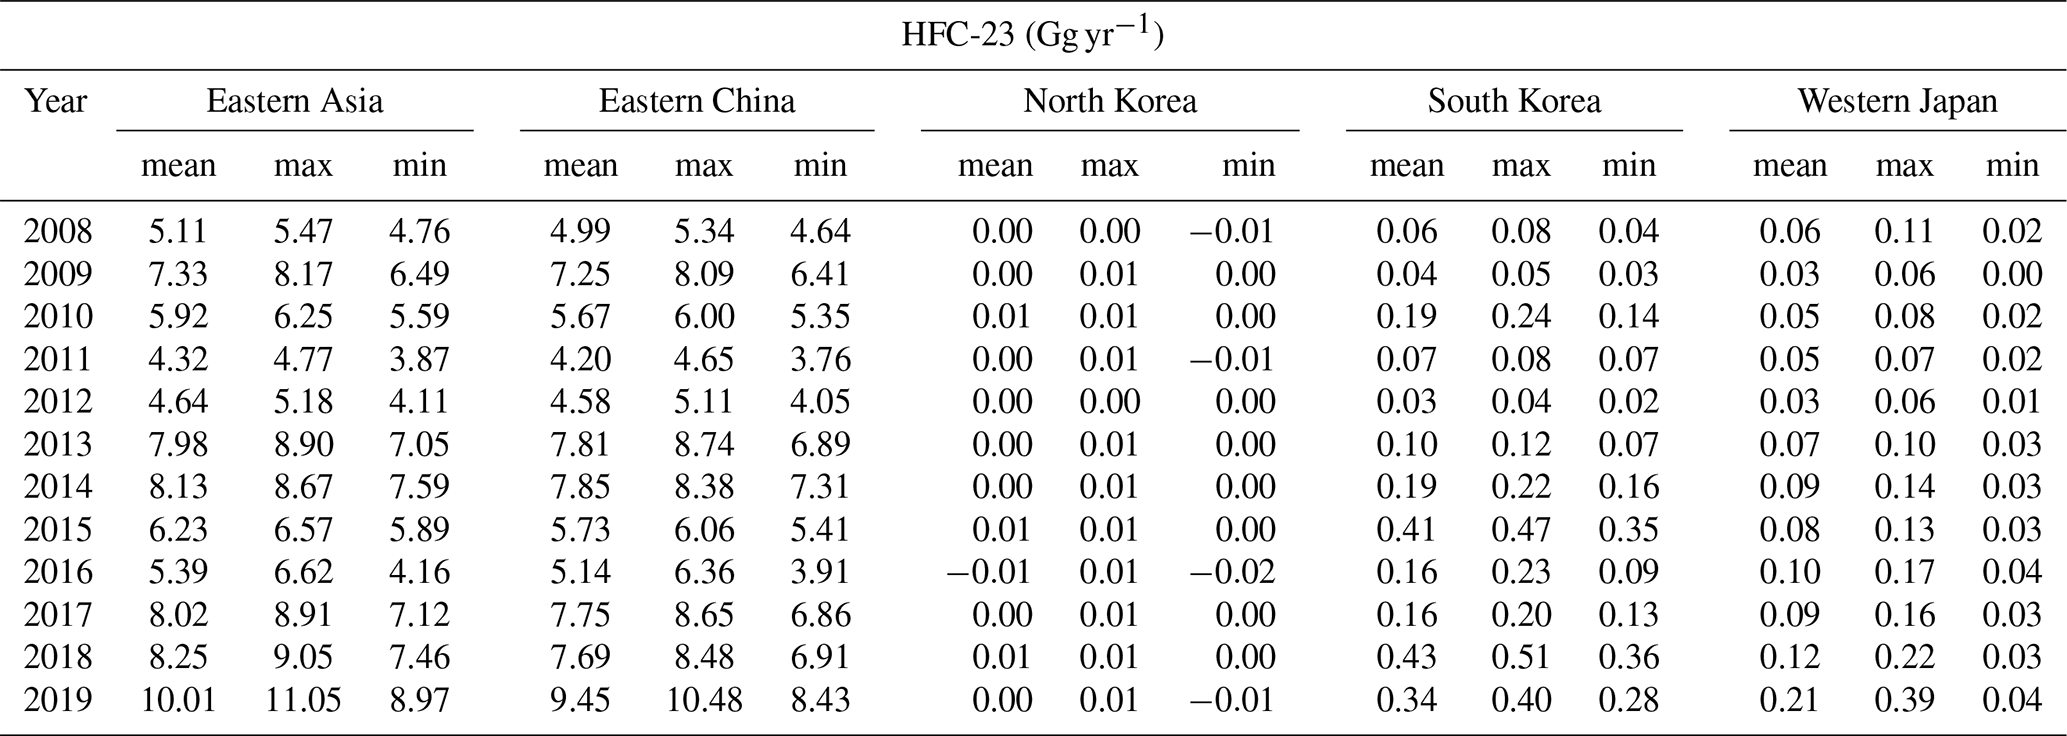
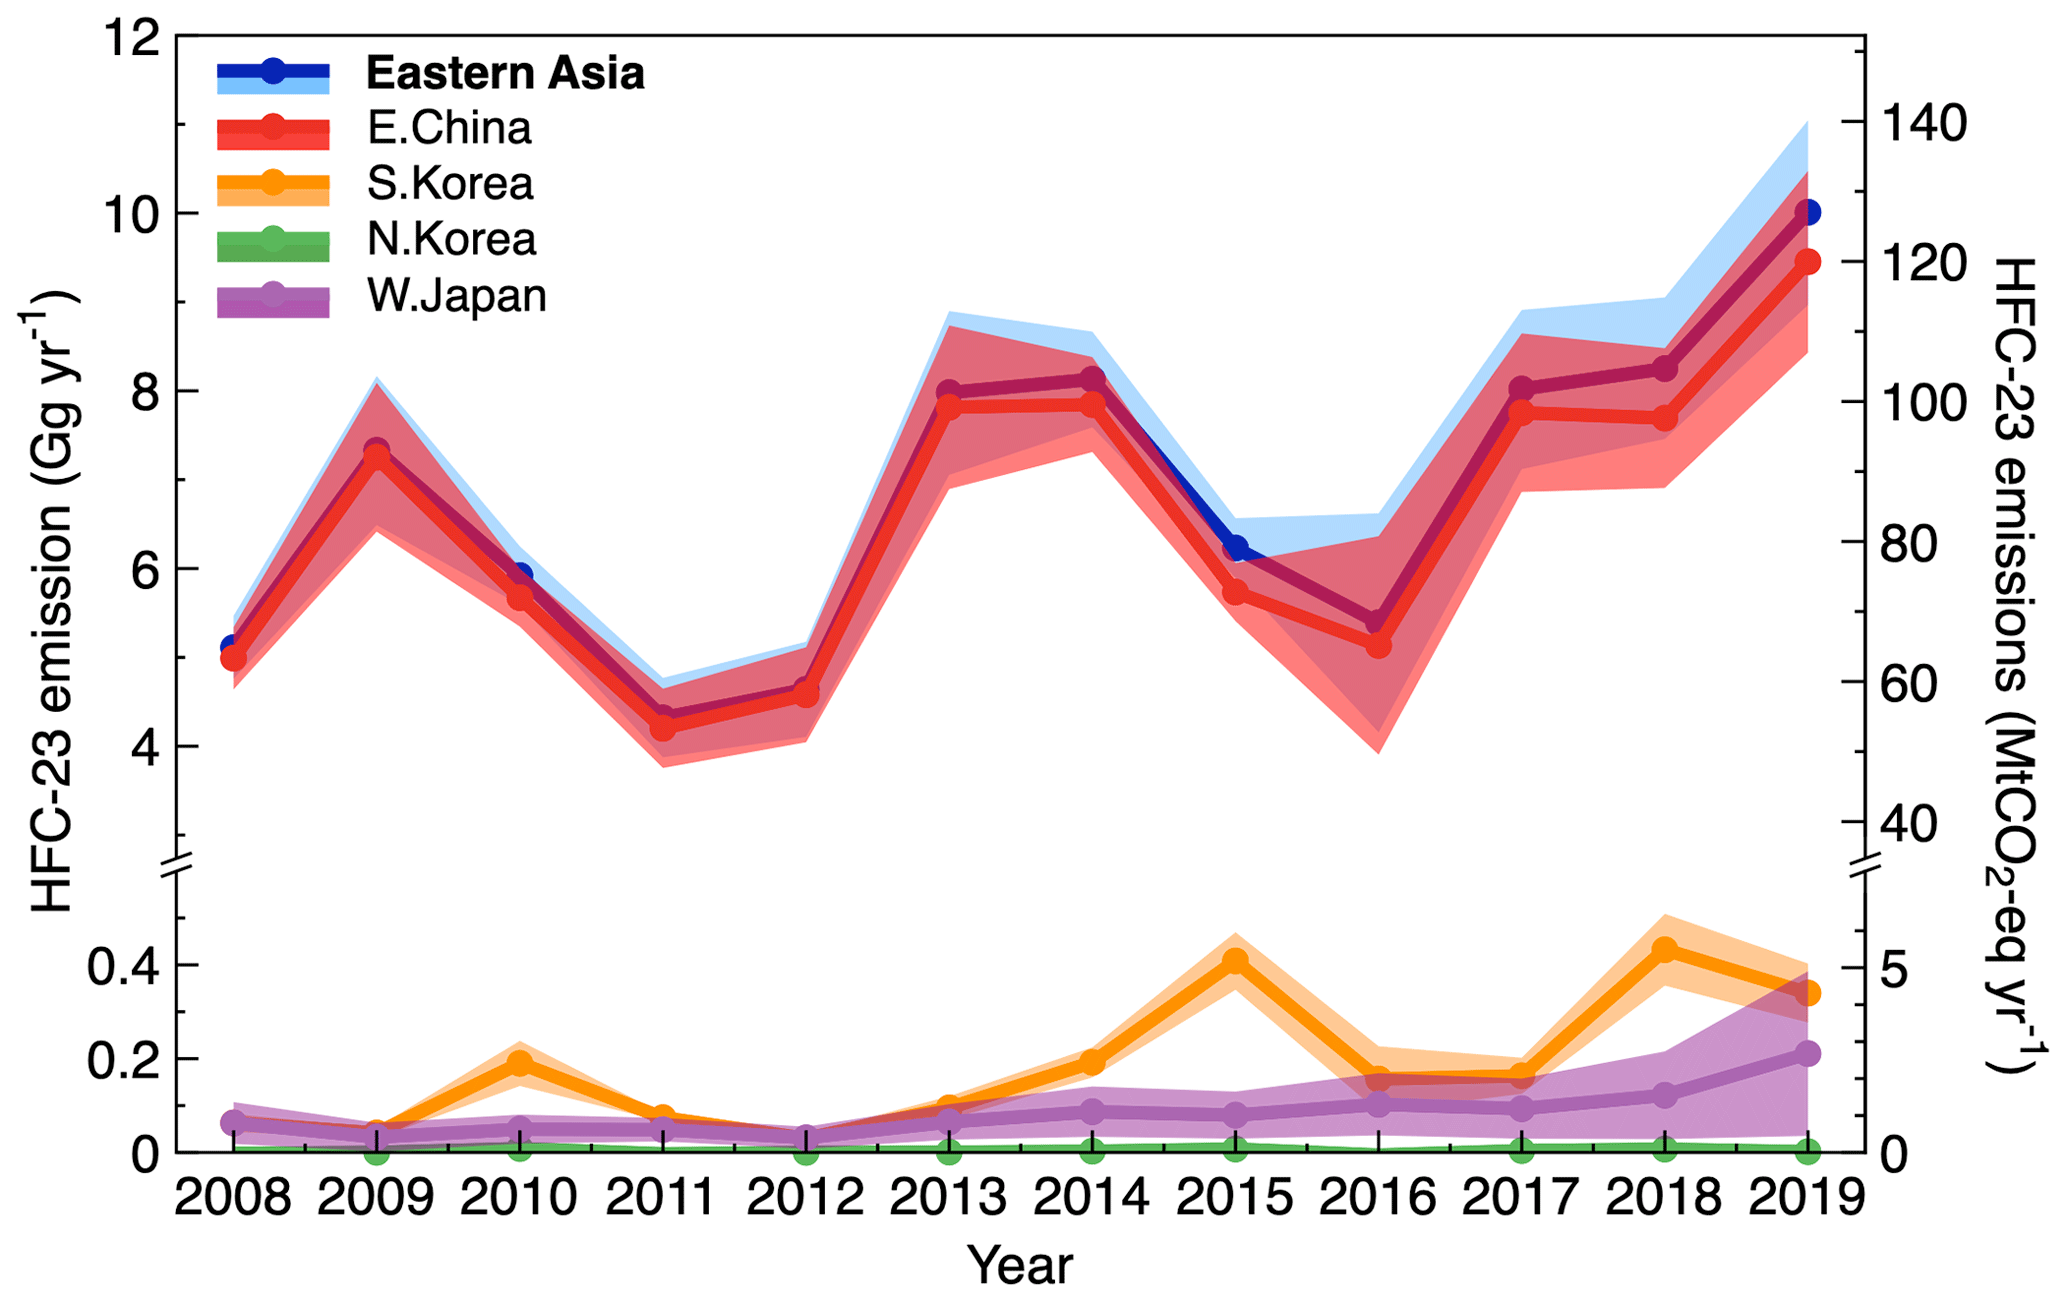
Figure 2HFC-23 emissions estimate in eastern Asia (blue) using the FLEXINVERT+ inverse method and in situ HFC-23 measurements at Gosan, Jeju Island, South Korea. Top-down emissions estimates are shown for eastern China (red), South Korea (orange), North Korea (green), and western Japan (purple) for the years 2008–2019. Each line and the shading denote the annual averages of the a posteriori emission mean of the results from 18 different a priori settings and the 2σ uncertainty, respectively. The right-hand y axis is scaled by the 100-year GWP for HFC-23 to show emission magnitudes in MtCO2-eq per year.
Our top-down results show that HFC-23 emissions in eastern Asia are increasing overall from 5.11±0.36 Gg yr−1 in 2008 to 10.01±1.04 Gg yr−1 in 2019, with emissions from eastern China accounting for 92 %–99 % of the regional total emissions (Table 1). HFC-23 emissions in eastern China showed an overall upward trend, with an appreciable decrease for 2010–2012 and an increase at the end of the CDM period (until 2014). During the HPPMP period, the eastern China HFC-23 emissions initially dropped (in 2015) but then increased continuously from 5.7±0.3 Gg yr−1 in 2015 to 9.5±1.0 Gg yr−1 in 2019. Our results do not support the significant reduction in HFC-23 emissions that could be expected from the national mitigation activities under the Chinese HPPMP starting after the end of the CDM period. The cumulative total emissions were 21.9±2.1 Gg (equivalent to 278.1±26.1 MtCO2-eq) for the CDM period of 2008–2012 versus 28.2±3.6 Gg (equivalent to 357.6±45.5 MtCO2-eq) for the post-CDM period of 2015–2019. The Chinese emissions of HFC-23 presented by previous top-down studies agree with our estimates from 2008 to 2012, considering their large variability (Fig. S4). Until this work, there was no HFC-23 emissions estimate for China and other eastern Asia countries for 2012 or later, including the post-CDM period. For South Korea, HFC-23 emissions increased from 0.0–0.2 Gg yr−1 (min–max) in the CDM period to 0.1–0.5 Gg yr−1 (min–max) in the post-CDM period. The distribution map of HFC-23 emissions (Figs. 3 and 4) also showed this temporal change in South Korea's emissions. In 2019, the emissions from western Japan also increased slightly compared to previous years. The emissions from North Korea were near zero within modeling uncertainties. These national emission trends and magnitudes suggest that the observed increase in eastern Asia emissions was predominantly driven by those from eastern China. The cumulative emissions from eastern Asia for the entire study period 2008–2019 were 73.8±9.2 Gg, which is equivalent to 999.6±117.3 MtCO2-eq.
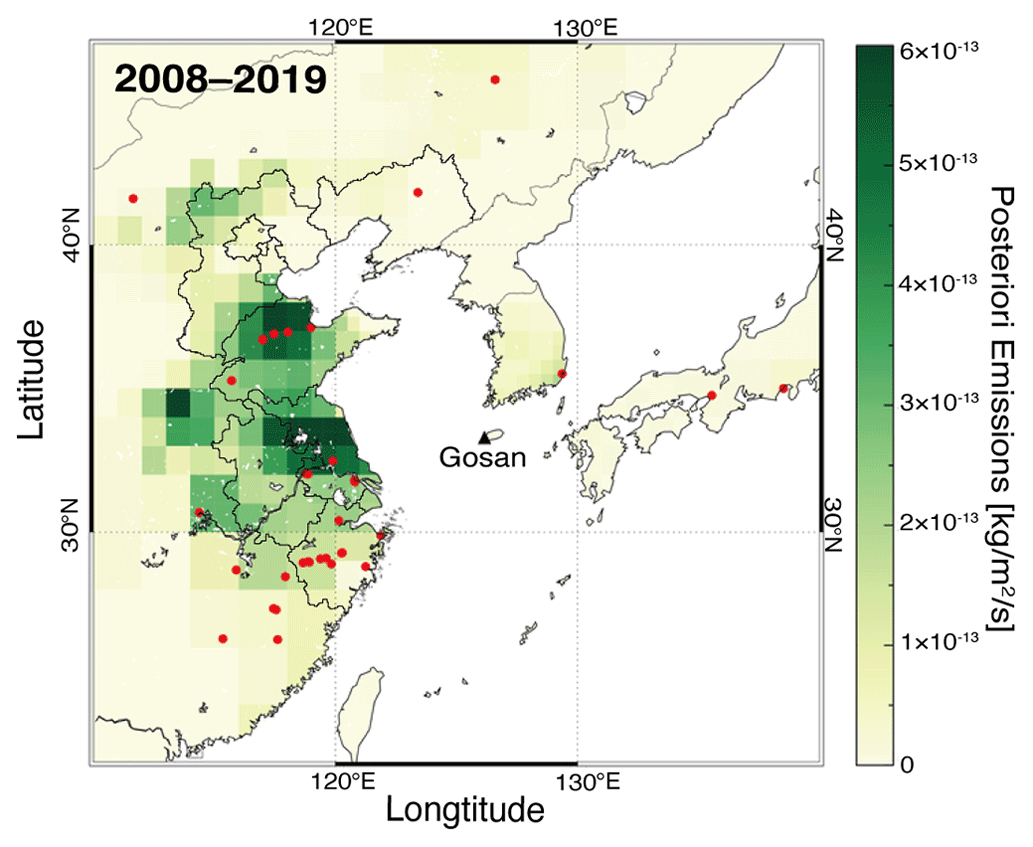
Figure 3A posteriori HFC-23 emissions distribution in eastern Asia for 2008–2019. The red circles indicate locations of known HCFC-22 production plants. The Gosan measurement station is marked with a black triangle.
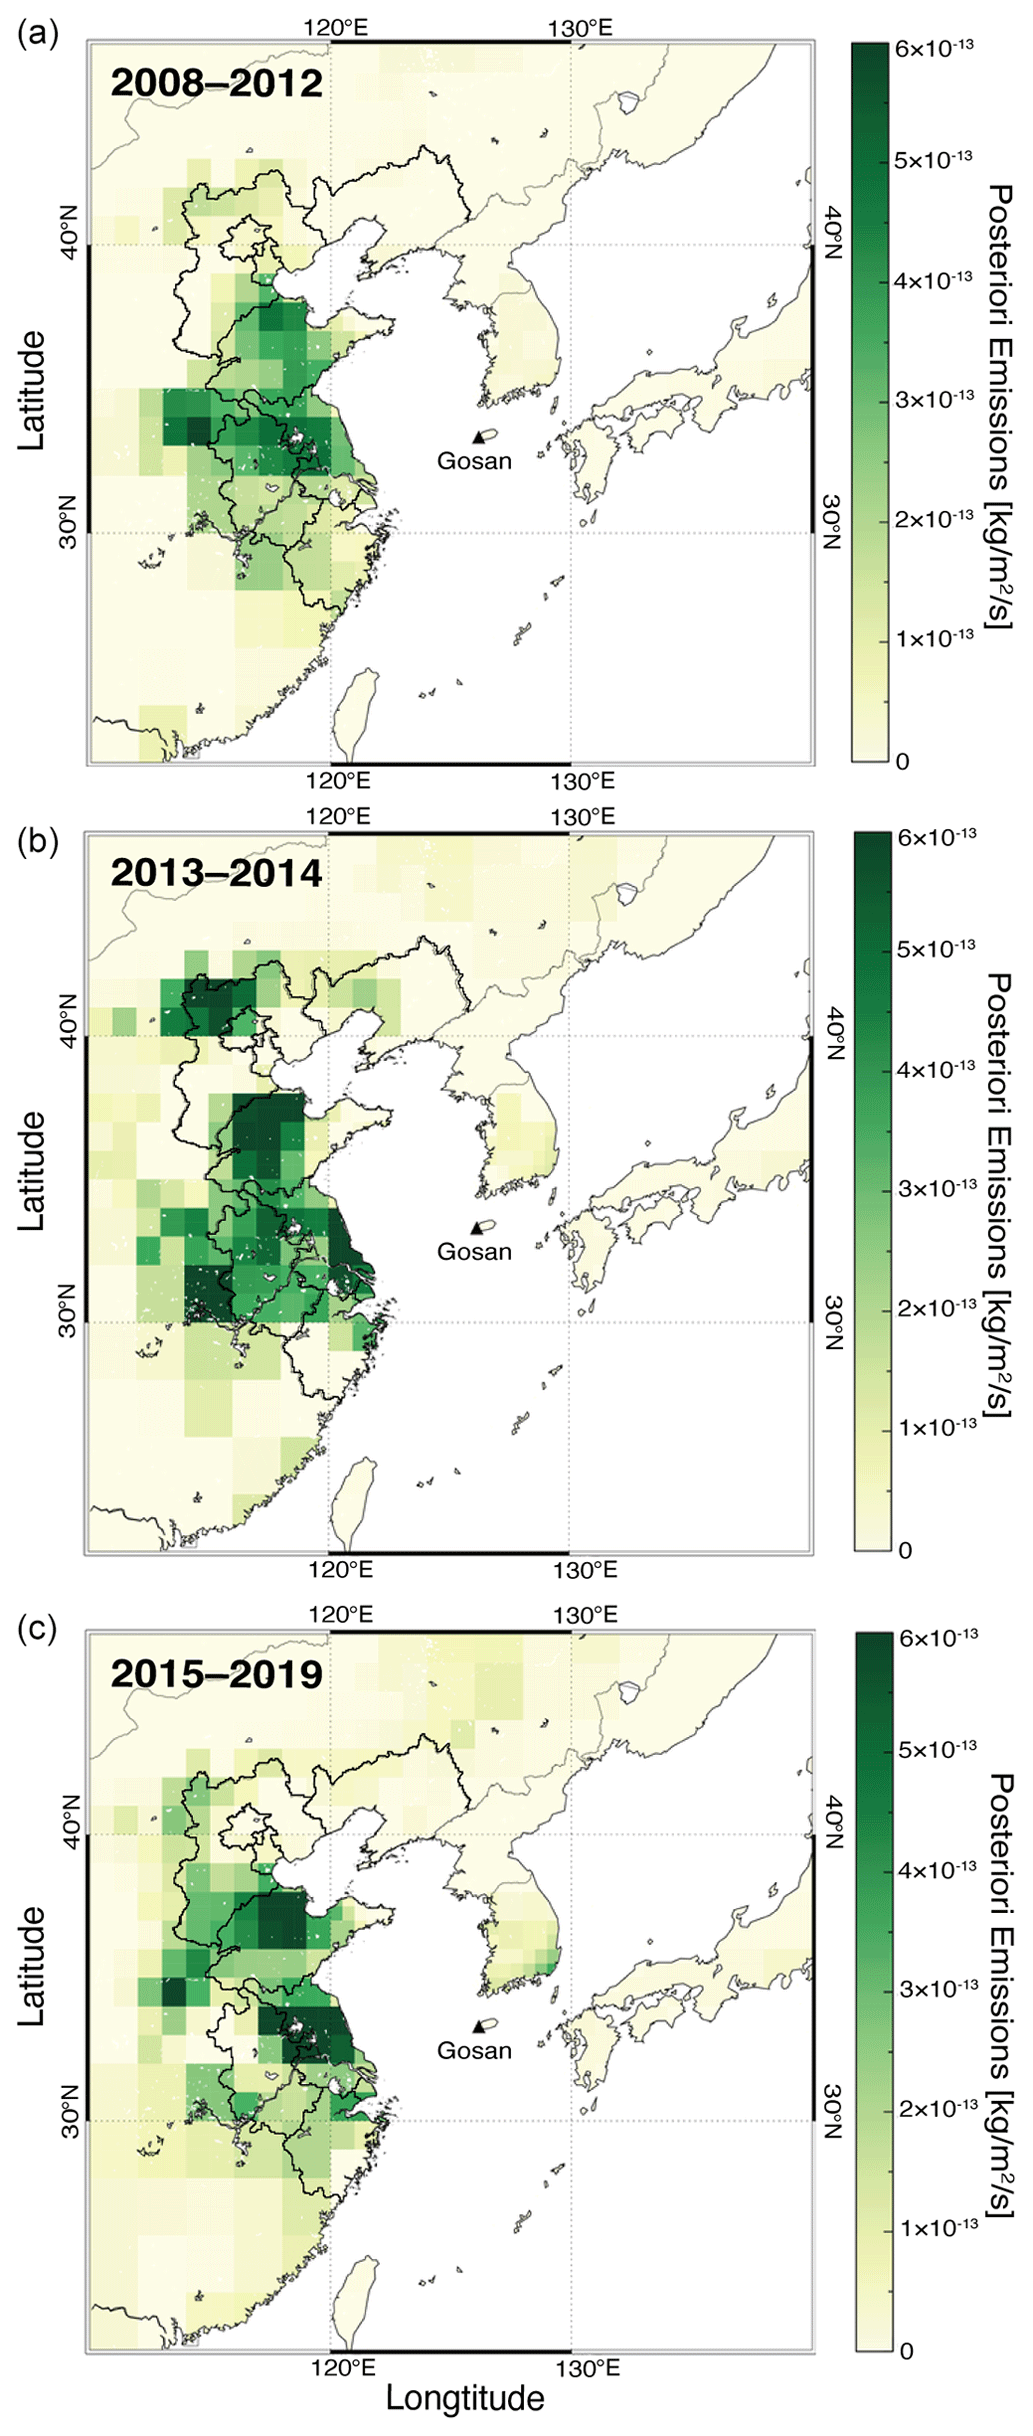
Figure 4Maps of inferred HFC-23 emissions for the CDM period (a), CDM exit period (b), and HPPMP period (c).
The spatial distribution of emissions inferred within our eastern Asia region for the 2008–2019 period is shown in Fig. 3 and compared to known HCFC-22 factory locations taken from TEAP reports, company websites, and media articles (Table S1 in the Supplement). The high emission flux densities were found predominantly in eastern China, where most of HCFC-22 factories are located. The posteriori a emission maps are used to examine how the spatial emission distribution has changed with the HFC-23 mitigation projects. We grouped a posteriori HFC-23 emission maps for the CDM period (2008–2012), the end of the CDM period (2013–2014), and the HPPMP period (2015–2019) (see Fig. 4). Over the three periods, the broad patterns in the emission hotspots did not change much, except for the end of the CDM, when we detected relatively strong emission signals from eastern China and a slight increase in the overall emissions. As revealed in the HFC-23 emission time series in Fig. 2, the emissions during the HPPMP period were similar to or even higher than those during other periods.
3.3 Discrepancy between bottom-up and top-down eastern China estimates
The unabated bottom-up HFC-23 emissions in eastern China were estimated using yearly varying co-production rates of HFC-23 in the manufacture of HCFC-22 and the annual HCFC-22 production in eastern China (see Sect. 2.3 for details) and are shown in Fig. 5 (dotted red line). HFC-23 emissions for eastern China with abatement (dashed red line in Fig. 5) were estimated by including emissions reduction expected from the CDM and the HPPMP programs reports (UNEP, 2018). The anticipated reductions for eastern China were scaled down by the fractions of HCFC-22 production capacities in eastern China determined by Eq. (3) in Sect. 2.3. The CDM abatement emission of HFC-23 in eastern China was ∼8.2 Gg in 2012 and decreased to close to zero by the end of 2014. During the HPPMP activities, we estimate that the HFC-23 emissions reductions in eastern China by the HPPMP should have been 4.9, 11.0, 13.4, and 12.8 Gg yr−1 in 2015, 2016, 2017, and 2018, respectively, based on reported abatement rates (UNEP, 2018; TEAP, 2021). Therefore, the deduced bottom-up emissions with abatement for eastern China (dashed red line in Fig. 5; note that the 2019 bottom-up emissions were assumed to be constant after 2018 because the 2019 reduction in HFC-23 was not reported yet) dramatically dropped in 2015 and have remained very low since 2016, contrary to the increasing emissions shown in our observation-based top-down emissions estimates (solid red line and shading in Fig. 5).
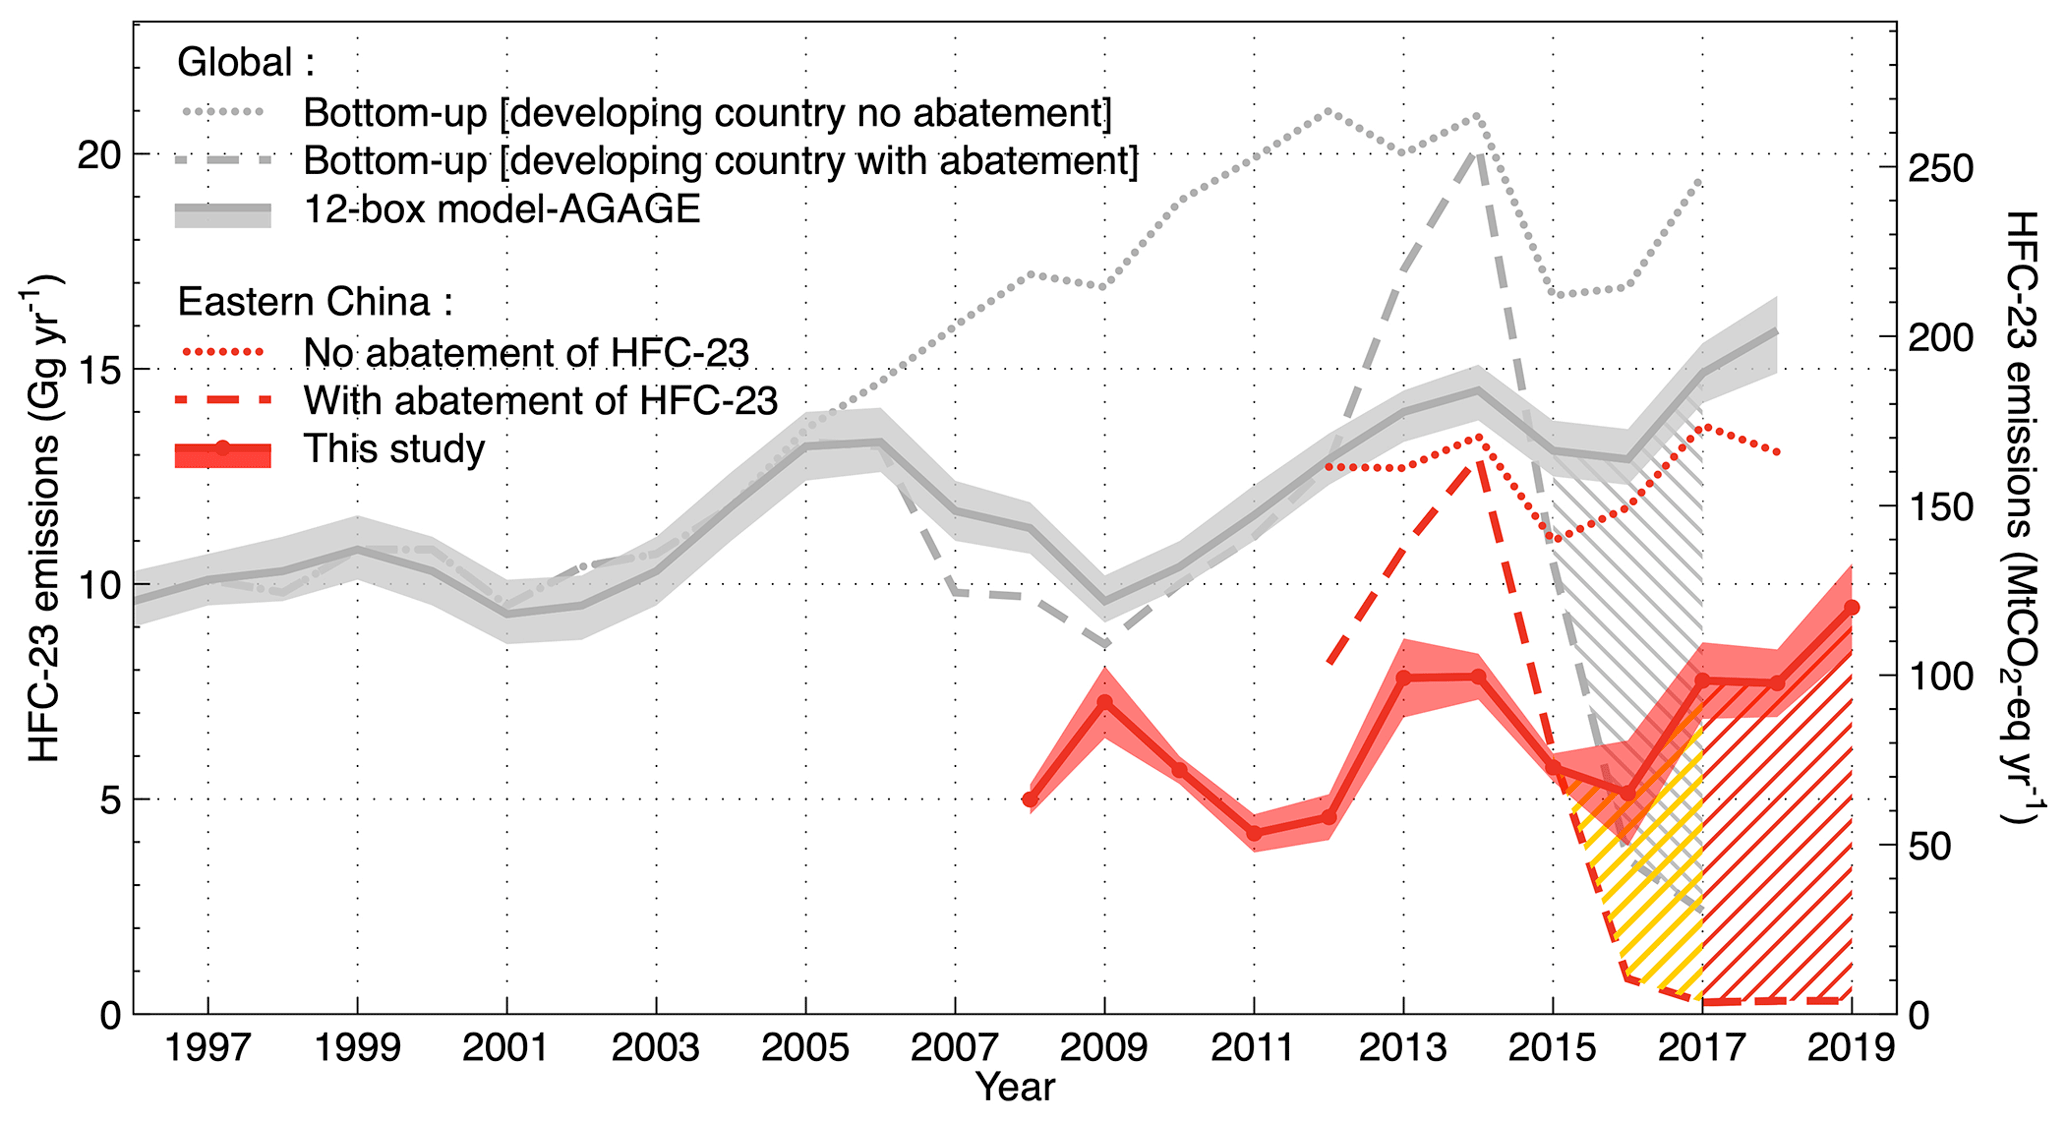
Figure 5Observation-based HFC-23 emissions from eastern China versus top-down and bottom-up global HFC-23 emissions derived from AGAGE global data (Simmonds et al., 2018; Stanley et al., 2020). No-abatement and abatement bottom-up emissions of eastern China are denoted by the dotted red line and dashed red line, respectively. No abatement emissions of HFC-23 are determined by HCFC-22 production amounts multiplied by yearly co-production rates of HFC-23 (TEAP, 2021). HFC-23 emissions estimated with abatement include emissions reductions expected from the CDM monitoring reports (https://cdm.unfccc.int/Projects/registered.html, last access: 2 January 2023) and the HPPMP (UNEP, 2018). The hatched areas represent the total cumulative excess emissions for eastern China (yellow from 2015 to 2017, red from 2017 to 2019) and globally (gray between 2015 and 2017).
It is interesting that the abated bottom-up estimates for 2012–2014 were larger than our observation-based emissions, although the global emissions in 2013–2014 also showed a very similar anomaly. Possible explanations are (a) excess reduction above the reported abatement capacity might occur and/or (b) branches of HCFC-22 manufacturing facilities might be installed and operated at other locations outside eastern China, and their production capacities were accounted for and recorded as those of main (headquarter) factories located in eastern China (Fig. 3). If the latter is the case, then our eastern China HCFC-22 production fractions could be overestimated, thereby generating overestimates of no-abatement or abatement bottom-up emissions.
Despite these open questions, our observation-based top-down emissions were much larger than those expected from abatement or reduction activities from 2015, and it is clear that abated emissions in eastern China were supposed to be near zero since 2015 under the reduction plan. The total excess emission (i.e., the integrated difference between our top-down emissions and the bottom-up abatement emissions) of eastern China for 2015–2019 is 23.7±3.6 Gg (equivalent to around 301.3±45.5 MtCO2-eq) (hatched yellow + red area in Fig. 5), which represents ∼3 % of the total greenhouse gas emissions of 9876.5 Mt-CO2 for the whole of China for 2019 (World Population Review, 2022).
3.4 Comparison of HFC-23 emissions in eastern Asia to global HFC-23 emissions
Our estimated HFC-23 emissions from eastern Asia accounted for 49±11 % of the global top-down emissions between 2008–2018 taken from Stanley et al. (2020). Since our results show HFC-23 emissions from eastern China account for most of the total emissions for eastern Asia (92 %–99 %), we focus here on how eastern China has influenced global emissions trends (as shown in Fig. 5).
The expected reduction in HFC-23 emissions from eastern China for 2015–2017 accounts for 78 %–82 % of the reported global HFC-23 emission reductions. The bottom-up emissions with abatement for eastern China demonstrate a similar temporal trend shown in the corresponding global values. The cumulative total excess emissions in eastern China of 7.9±1.8 Gg for 2015–2017 (top-down minus bottom-up; hatched yellow area in Fig. 5) account for 47 % of the global cumulative excess emissions (hatched gray area in Fig. 5). Given that the 2015–2019 excess emission in eastern China is 23.7±3.6 Gg, with an assumption that 47 % of the global excess in eastern China would be maintained for 2018–2019, the global cumulative excess emissions are expected to reach to 50.5±7.6 Gg (around 641.1±96.8 MtCO2-eq) for 2015–2019. This means that if the HFC-23 emissions reduction reported by China and other countries had actually taken place, unknown HCFC-22 production of as much as 2079±314 Gg for 2015–2019 would be required to explain the global excess HFC-23 emissions of 50.5±7.6 Gg. Approximately 400 Gg per year of HCFC-22 production with unabated HFC-23 emissions was produced during 2015–2019, which is more than two-thirds of the total HCFC-22 production per year in the entirety of China (Fig. S3). The eastern China excess HFC-23 emission of 23.7±3.6 Gg should result in unknown HCFC-22 production of 977±147 Gg, which is equivalent to 136 %–184 % of the total quantity of HCFC-22 produced in eastern China or 118 %–159 % of the total production in A5 parties reported for 2018.
On the other hand, while reconsidering the eastern China HFC-23 emissions in terms of HCFC-22 production, we estimated HCFC-22 emissions from eastern China by using the HCFC-22 measurement data obtained at Gosan for 2008–2019 (Figs. S5 and S6a) and then inferred the emissions for the entirety of China of HCFC-22 from the fraction of the population of eastern China. These observation-based China emissions of HCFC-22 were consistent not only with previous top-down studies but also with the inventory-based HCFC-22 emissions as shown in Fig. S6b, thereby suggesting that the bottom-up emissions for China were relatively well defined and thus the associated HCFC-22 production records were reasonably accurate. Therefore, using the fraction of the HCFC-22 production in eastern China against the global total production (TEAP, 2021; Fi. S3), we calculated the eastern China HFC-23 emissions by scaling down the global top-down HFC-23 emissions given in Stanley et al. (2020). The HCFC-22 production-scaled HFC-23 emissions (gray lines in Fig. 6) agree well with our observation-inferred emissions for eastern China even during the HPPMP period, suggesting that recent increases in both global and regional HFC-23 emissions are predominantly associated with known HCFC-22 production facilities.
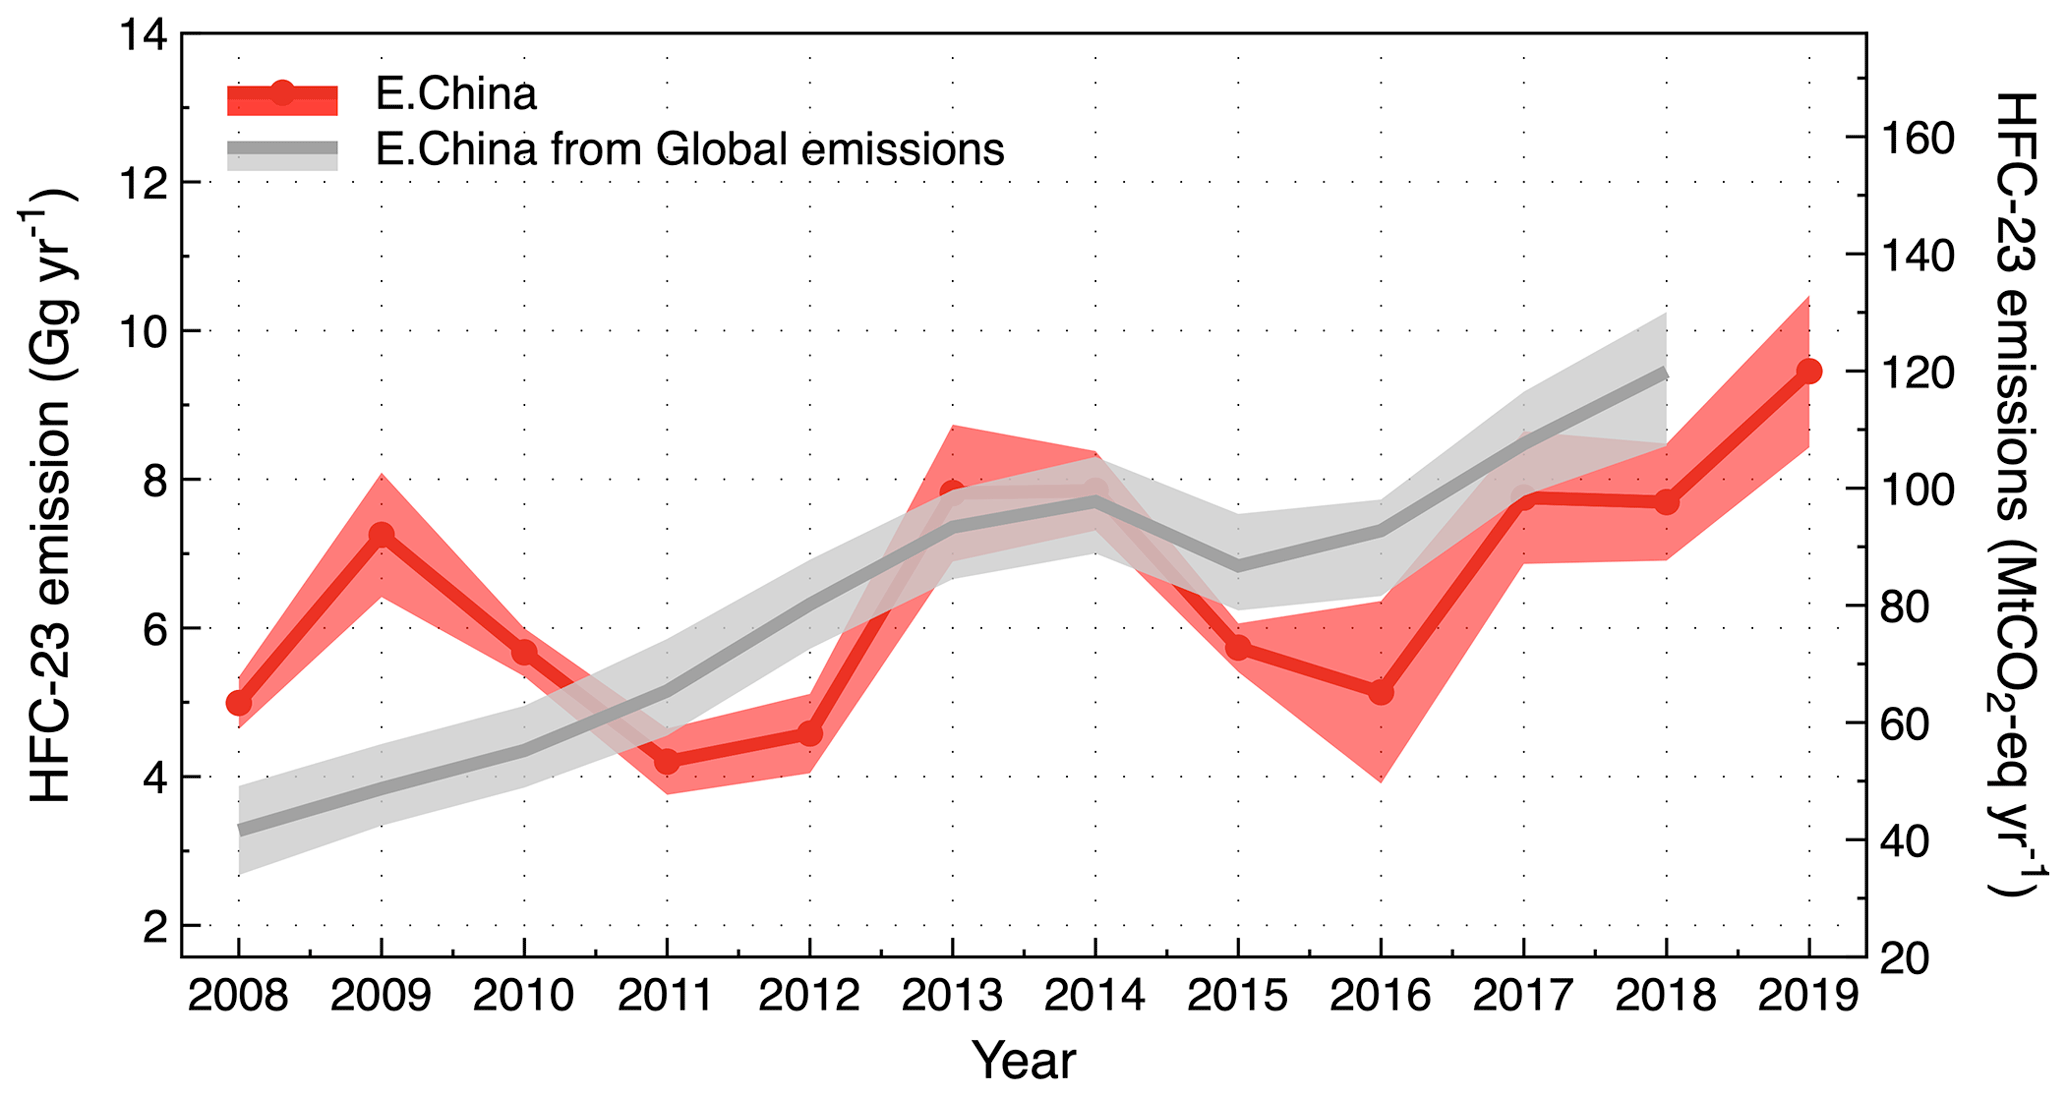
Figure 6HFC-23 emissions for eastern China inferred by downscaling the global top-down emissions estimates (Stanley et al., 2020) based on annual fractions of the eastern China HCFC-22 production to the global total production. The HCFC-22 production-scaled estimates of HFC-23 emissions (gray line) are in a good agreement with our observation-based emissions (red line).
Our top-down inversion estimates for HFC-23 emissions in eastern Asia for 2008–2019 were based on 12-year, high-frequency in situ observations of atmospheric HFC-23 concentrations made at Gosan.
The first published post-CDM HFC-23 emissions in this region show that our observation-derived emissions were much larger than the bottom-up estimates that were expected to be close to zero after 2015 due to Chinese abatement activities under the HPPMP. Several considerations suggest that observed discrepancies between the top-down and bottom-up HFC-23 emissions estimates are less likely to originate from the existence of unreported, unknown HCFC-22 production. First, the spatial distribution of our derived HFC-23 emissions is well correlated to the locations of the known HCFC-22 plants. Second, our cumulative excess emissions of 23.7±3.6 Gg from eastern China between 2015 and 2019 would require unknown HCFC-22 production of as much as 977±147 Gg, which is equivalent to 136 %–184 % of the total quantity of HCFC-22 produced for 2018 in eastern China. Such large unknown production seems highly unlikely given that our observation-based HCFC-22 emissions in China were consistent with the inventory-based HCFC-22 emissions estimates, thereby suggesting that the bottom-up emissions for China were relatively well constrained and thus that the associated HCFC-22 production records were also reasonably accurate. Third, when we inferred the eastern China HFC-23 emissions by scaling down the global top-down HFC-23 emissions given in Stanley et al. (2020) based on the fraction of the HCFC-22 production in eastern China to the global total, the HCFC-22 production-scaled HFC-23 emissions were consistent with our observation-derived emissions for eastern China even during the HPPMP period. This suggests that both global and regional HFC-23 emissions, which were independently determined, are primarily associated with known HCFC-22 production facilities. On the basis of this reasoning, the discrepancies between top-down versus bottom-up emissions of HFC-23 in eastern China are most likely due to unsuccessful reduction processes of HFC-23 at factory level and inaccurate quantification of emission reductions.
In addition, our results show that the HFC-23 emissions from eastern Asia explain a substantial fraction of the post-CDM rise in global emissions and are probably due to the unabated emissions in the manufacture of HCFC-22. Thus, they underscore actions to identify responsible industrial practices and organize more effective regulatory controls in order to address this critical issue and prevent unwanted emissions at both regional and global scales. Other regions, including the rest of China, that are not well detected by the current observations may also have contributed to the unexpected trends in HFC-23. Further investigation will be required to better understand which mechanisms are responsible for the recent increase in global HFC-23 emissions in different regions.
Data from Gosan, Mace Head and Cape Grim stations are available at http://agage.mit.edu/data/agage-data (last access: 20 December 2022) and https://doi.org/10.15485/1841748 (Prinn et al., 2022). The data are also available from Sunyoung Park, Simon O’Doherty and Paul B. Krummel upon request.
The supplement related to this article is available online at: https://doi.org/10.5194/acp-23-9401-2023-supplement.
HP, SG, YK, and SP carried out the Gosan measurements. HP analyzed the data with SP and performed inverse modeling with contributions from JK, RLT, and HC. JM, PKS, CMH, and RFW supported the calibration, precision, and data quality of the long-term observations at Gosan. SOD, PJF, PGS, and PBK provided the in situ measurement data from the global baseline stations. KMS reviewed the manuscript. RFW and RGP supported the AGAGE network. HP and SP wrote the manuscript with contributions from all co-authors.
The contact author has declared that none of the authors has any competing interests.
Publisher's note: Copernicus Publications remains neutral with regard to jurisdictional claims in published maps and institutional affiliations.
This research was supported by the National Research Foundation of Korea (NRF) grant funded by the Korean government (MSIT) (no. 2020R1A2C3003774). The NASA Upper Atmosphere Research Program supports AGAGE (including partial support of Mace Head and Cape Grim) through grant NNX16AC98G to MIT, and grants NNX16AC96G and NNX16AC97G to SIO and multiple preceding grants. Mace Head station is supported by the UK Department of Business, Energy and Industrial Strategy (BEIS contract 1537/06/2018). Cape Grim station is primarily supported by the Australian Bureau of Meteorology and CSIRO, with additional support from the Australian Department of Agriculture, Water and the Environment (DAWE) and Refrigerant Reclaim Australia (RRA).
This research has been supported by the National Research Foundation of Korea (grant no. 2020R1A2C3003774); the National Aeronautics and Space Administration (grant nos. NNX16AC98G, NNX16AC96G, and NNX16AC97G); and the Department for Business, Energy and Industrial Strategy, UK Government (grant no. 1537/06/2018).
This paper was edited by Gabriele Stiller and reviewed by two anonymous referees.
Arnold, T., Mühle, J., Salameh, P. K., Harth, C. M., Ivy, D. J., and Weiss, R. F.: Automated measurement of nitrogen trifluoride in ambient air, Anal. Chem., 84, 4798–4804, 2012.
Clark, E. and Wagner, S.: The Kigali Amendment to the Montreal Protocol: HFC Phase-Down, UNEP, 1–7, https://wedocs.unep.org/bitstream/handle/20.500.11822/26589/HFC_Phasedown_EN.pdf (last access: 20 August 2023), 2016.
Kim, J., Thompson, R., Park, H., Bogle, S., Mühle, J., Park, M. K., Kim, Y., Harth, C. M., Salameh, P. K., and Schmidt, R.: Emissions of tetrafluoromethane (CF4) and hexafluoroethane (C2F6) from East Asia: 2008 to 2019, J. Geophys. Res.-Atmos., 126, e2021JD034888, https://doi.org/10.1029/2021JD034888, 2021.
Li, S., Park, S., Lee, J.-Y., Ha, K.-J., Park, M.-K., Jo, C., Oh, H., Mühle, J., Kim, K.-R., and Montzka, S.: Chemical evidence of inter-hemispheric air mass intrusion into the Northern Hemisphere mid-latitudes, Sci. Rep., 8, 1–7, 2018.
Miller, B. R., Weiss, R. F., Salameh, P. K., Tanhua, T., Greally, B. R., Mühle, J., and Simmonds, P. G.: Medusa: A sample preconcentration and GC/MS detector system for in situ measurements of atmospheric trace halocarbons, hydrocarbons, and sulfur compounds, Anal. Chem., 80, 1536–1545, 2008.
Montzka, S. A., Velders G. J. M., Krummel, P. B., Muhle, J., Orkin, V. L., Park, S., Shah, N., Walter-Terrinoni, H., Bernath, P., Boone, C., Hu, L., Kurylo, M. J., Elvidge, E. L., Maione, M., Miller, B. R., O'Doherty, S., Rigby, M., Simpson, I. J., Vollmer, M. K., Weiss, R. F., Kuijpers, L. J. M., and Sturges, W. T.: Hydrofluorocarbons (HFCs), in: Chap. 2 in Scientific Assessment of Ozone Depletion: 2018, Global Ozone Research and Monitoring Project-Report No. 58, World Meteorological Organization, Geneva, Switzerland, https://public.wmo.int/en/resources/library/scientific-assessment-of-ozone-depletion-2018 (last access: 20 August 2023), 2018.
NDRC: China’s Intended Nationally Determined Contribution, United Nations Framework Convention on Climate Change (UNFCCC), Bonn, https://www4.unfccc.int/sites/submissions/INDC/Published%20Documents/China/1/China's%20INDC%20-%20on%2030%20June%202015.pdf (last access: 2 January 2023), 2015.
Newman, P., Ko, M., Reimann, S., Strahan, S., Atlas, E., Burkholder, J., Chipperfield, M., Engel, A., Liang, Q., and Plumb, R.: Lifetimes of stratospheric ozone-depleting substances, their replacements, and related species, in: AGU Fall Meeting 2013 Abstracts, American Geophysical Union, San Francisco, December 2013, Abstract ID A23F-0354, 2013.
O'Doherty, S., Simmonds, P., Cunnold, D., Wang, H., Sturrock, G., Fraser, P., Ryall, D., Derwent, R., Weiss, R., and Salameh, P.: In situ chloroform measurements at Advanced Global Atmospheric Gases Experiment atmospheric research stations from 1994 to 1998, J. Geophys. Res.-Atmos., 106, 20429–20444, 2001.
Park, S., Western, L. M., Saito, T., Redington, A. L., Henne, S., Fang, X., Prinn, R. G., Manning, A. J., Montzka, S. A., and Fraser, P. J.: A decline in emissions of CFC-11 and related chemicals from eastern China, Nature, 590, 433–437, 2021.
Pisso, I., Sollum, E., Grythe, H., Kristiansen, N. I., Cassiani, M., Eckhardt, S., Arnold, D., Morton, D., Thompson, R. L., Groot Zwaaftink, C. D., Evangeliou, N., Sodemann, H., Haimberger, L., Henne, S., Brunner, D., Burkhart, J. F., Fouilloux, A., Brioude, J., Philipp, A., Seibert, P., and Stohl, A.: The Lagrangian particle dispersion model FLEXPART version 10.4, Geosci. Model Dev., 12, 4955–4997, https://doi.org/10.5194/gmd-12-4955-2019, 2019.
Prinn, R. G., Weiss, R. F., Arduini, J., Arnold, T., DeWitt, H. L., Fraser, P. J., Ganesan, A. L., Gasore, J., Harth, C. M., Hermansen, O., Kim, J., Krummel, P. B., Li, S., Loh, Z. M., Lunder, C. R., Maione, M., Manning, A. J., Miller, B. R., Mitrevski, B., Mühle, J., O'Doherty, S., Park, S., Reimann, S., Rigby, M., Saito, T., Salameh, P. K., Schmidt, R., Simmonds, P. G., Steele, L. P., Vollmer, M. K., Wang, R. H., Yao, B., Yokouchi, Y., Young, D., and Zhou, L.: History of chemically and radiatively important atmospheric gases from the Advanced Global Atmospheric Gases Experiment (AGAGE), Earth Syst. Sci. Data, 10, 985–1018, https://doi.org/10.5194/essd-10-985-2018, 2018.
Prinn, R., Weiss, R., Arduini, J., Arnold, T., DeWitt, H. L., Fraser, P., Ganesan, A., Gasore, J., Harth, C., Hermansen, O., Kim, J., Krummel, P., Loh, Z., Lunder, C., Maione, M., Manning, A., Miller, B., Mitrevski, B., Mühle, J., O’Doherty, S., Park, S., Reimann, S., Rigby, M., Saito, T., Salameh, P., Schmidt, R., Simmonds, P., Steele, P., Vollmer, M., Hsiang-Jui, W., Yao, B., Young, D., and Zhou, L.: The Advanced Global Atmospheric Gases Experiment (AGAGE) Data, ESS-DIVE repository [data set], https://doi.org/10.15485/1841748, 2022.
Rigby, M., Park, S., Saito, T., Western, L., Redington, A., Fang, X., Henne, S., Manning, A., Prinn, R., and Dutton, G.: Increase in CFC-11 emissions from eastern China based on atmospheric observations, Nature, 569, 546–550, 2019.
Saha, S.: Research data archive at the national center for atmospheric research, Computational and Information Systems Laboratory https://climatedataguide.ucar.edu/climate-data/climate-forecast-system-reanalysis-cfsr (last access: 2 January 2023), 2010.
Saha, S.: NCEP Climate Forecast System Version 2 (CFSv2) 6-hourly Products, Updated daily, Research Data Archive at the National Center for Atmospheric Research, Computational and Information Systems Laboratory, Boulder, Coloorado, https://developers.google.com/earth-engine/datasets/catalog/NOAA_CFSV2_FOR6H (last access: 2 January 2023), 2011.
Say, D., Ganesan, A. L., Lunt, M. F., Rigby, M., O'Doherty, S., Harth, C., Manning, A. J., Krummel, P. B., and Bauguitte, S.: Emissions of halocarbons from India inferred through atmospheric measurements, Atmos. Chem. Phys., 19, 9865–9885, https://doi.org/10.5194/acp-19-9865-2019, 2019.
Simmonds, P. G., Rigby, M., McCulloch, A., Vollmer, M. K., Henne, S., Mühle, J., O'Doherty, S., Manning, A. J., Krummel, P. B., Fraser, P. J., Young, D., Weiss, R. F., Salameh, P. K., Harth, C. M., Reimann, S., Trudinger, C. M., Steele, L. P., Wang, R. H. J., Ivy, D. J., Prinn, R. G., Mitrevski, B., and Etheridge, D. M.: Recent increases in the atmospheric growth rate and emissions of HFC-23 (CHF3) and the link to HCFC-22 (CHClF2) production, Atmos. Chem. Phys., 18, 4153–4169, https://doi.org/10.5194/acp-18-4153-2018, 2018.
Stanley, K. M., Say, D., Mühle, J., Harth, C. M., Krummel, P. B., Young, D., O'Doherty, S. J., Salameh, P. K., Simmonds, P. G., and Weiss, R. F.: Increase in global emissions of HFC-23 despite near-total expected reductions, Nat. Commun., 11, 1–6, 2020.
Stohl, A., Kim, J., Li, S., O'Doherty, S., Mühle, J., Salameh, P. K., Saito, T., Vollmer, M. K., Wan, D., Weiss, R. F., Yao, B., Yokouchi, Y., and Zhou, L. X.: Hydrochlorofluorocarbon and hydrofluorocarbon emissions in East Asia determined by inverse modeling, Atmos. Chem. Phys., 10, 3545–3560, https://doi.org/10.5194/acp-10-3545-2010, 2010.
TEAP: Technology and Economic Assessment Panel of the Montreal Protocol: Assessment Report, United Nations Environment Programme, Nairobi, Kenya, https://ozone.unep.org/sites/default/files/2019-05/TEAP-Progress-Report-May2017.pdf (last access: 2 January 2023), 2017.
TEAP: Technology and Economic Assessment Panel of the Montreal Protocol: Assessment Report, United Nations Environment Programme, Nairobi, Kenya, https://ozone.unep.org/system/files/documents/TEAP-2021-Progress-report.pdf (last access: 2 January 2023), 2021.
Thompson, R. L. and Stohl, A.: FLEXINVERT: an atmospheric Bayesian inversion framework for determining surface fluxes of trace species using an optimized grid, Geosci. Model Dev., 7, 2223–2242, https://doi.org/10.5194/gmd-7-2223-2014, 2014.
UNEP – United Nations Environment Programme: Key Aspects Related to HFC-23 By-product Control Technologies, United Nations Environment Programme, Montreal, http://www.multilateralfund.org/79/English/1/7948.pdf (last access: 2 January 2023), 2017.
UNEP – United Nations Environment Programme: Cost-effective Options for Controlling HFC-23 By-product Emissions, Tech. Rep., United Nations Environment Programme, Montreal, http://multilateralfund.org/82/English/1/8268.pdf (last access: 2 January 2023), 2018.
Western, L. M., Redington, A. L., Manning, A. J., Trudinger, C. M., Hu, L., Henne, S., Fang, X., Kuijpers, L. J. M., Theodoridi, C., Godwin, D. S., Arduini, J., Dunse, B., Engel, A., Fraser, P. J., Harth, C. M., Krummel, P. B., Maione, M., Mühle, J., O'Doherty, S., Park, H., Park, S., Reimann, S., Salameh, P. K., Say, D., Schmidt, R., Schuck, T., Siso, C., Stanley, K. M., Vimont, I., Vollmer, M. K., Young, D., Prinn, R. G., Weiss, R. F., Montzka, S. A., and Rigby, M.: A renewed rise in global HCFC-141b emissions between 2017–2021, Atmos. Chem. Phys., 22, 9601–9616, https://doi.org/10.5194/acp-22-9601-2022, 2022.
World Population Review: Greenhouse Gas Emissions by Country, https://worldpopulationreview.com/country-rankings/greenhouse-gas-emissions-by-country (last access: 20 December 2022), 2022.