the Creative Commons Attribution 4.0 License.
the Creative Commons Attribution 4.0 License.
 | 09 Aug 2023
Predicting photooxidant concentrations in aerosol liquid water based on laboratory extracts of ambient particles
Lan Ma
Reed Worland
Wenqing Jiang
Christopher Niedek
Chrystal Guzman
Keith J. Bein
Aerosol liquid water (ALW) is a unique reaction medium, but its chemistry is poorly understood. For example, little is known of photooxidant concentrations – including hydroxyl radicals (•OH), singlet molecular oxygen (1O), and oxidizing triplet excited states of organic matter (3C*) – even though they likely drive much of ALW chemistry. Due to the very limited water content of particles, it is difficult to quantify oxidant concentrations in ALW directly. To predict these values, we measured photooxidant concentrations in illuminated aqueous particle extracts as a function of dilution and used the resulting oxidant kinetics to extrapolate to ALW conditions. We prepared dilution series from two sets of particles collected in Davis, California: one from winter (WIN) and one from summer (SUM). Both periods are influenced by biomass burning, with dissolved organic carbon (DOC) in the extracts ranging from 10 to 495 mg C L−1. In the winter sample, the •OH concentration is independent of particle mass concentration, with an average value of 5.0 (± 2.2) × 10−15 M, while in summer •OH increases with DOC in the range (0.4–7.7) × 10−15 M. In both winter and summer samples, 3C* concentrations increase rapidly with particle mass concentrations in the extracts and then plateau under more concentrated conditions, with a range of (0.2–7) × 10−13 M. WIN and SUM have the same range of 1O concentrations, (0.2–8.5) × 10−12 M, but in WIN the 1O concentration increases linearly with DOC, while in SUM 1O approaches a plateau.
We next extrapolated the relationships of oxidant formation rates and sinks as a function of particle mass concentration from our dilute extracts to the much more concentrated condition of aerosol liquid water. Predicted •OH concentrations in ALW (including mass transport of •OH from the gas phase) are (5–8) × 10−15 M, similar to those in fog/cloud waters. In contrast, predicted concentrations of 3C* and 1O in ALW are approximately 10 to 100 times higher than in cloud/fogs, with values of (4–9) × 10−13 M and (1–5) × 10−12 M, respectively. Although •OH is often considered the main sink for organic compounds in the atmospheric aqueous phase, the much higher concentrations of 3C* and 1O in aerosol liquid water suggest these photooxidants will be more important sinks for many organics in particle water.
- Article
(2939 KB) - Full-text XML
-
Supplement
(1462 KB) - BibTeX
- EndNote


The chemical processing of organic compounds in cloud/fog water and aerosol liquid water comprises an important source and sink of secondary organic aerosol (SOA) (Carlton et al., 2020; Ervens et al., 2011; Gilardoni et al., 2016; Lim et al., 2010; McNeill, 2015). Aerosol liquid water (ALW), i.e., the liquid-phase water on airborne particles, is much less abundant (in terms of liquid water content) and contains much higher concentrations of solutes compared to clouds and fogs. ALW appears to be an efficient and important medium for the production of aqueous SOA (aqSOA) (Ervens and Volkamer, 2010; Faust et al., 2017; Volkamer et al., 2007; Wu et al., 2018; Zhang et al., 2011), and ALW chemistry is often different from that in more dilute cloud and fog drops (Ervens, 2018; Mekic et al., 2018; Zhou et al., 2019). For example, reactions in ALW can more efficiently produce high-molecular-weight compounds like oligomers and brown carbon (De Haan et al., 2020; Lim et al., 2010; Renard et al., 2014; Tan et al., 2012; Xia et al., 2018). Modeled rates of aqSOA formation in ALW vary enormously, likely because reactant concentrations and chemical processes in particle water are poorly understood (Ervens and Volkamer, 2010; Ervens, 2018; Lin et al., 2014; Washenfelder et al., 2011).
A key driver of ALW reactivity is likely the concentrations of photochemically generated oxidants (Herrmann et al., 2015; Lim et al., 2010). Important aqueous photooxidants include hydroxyl radicals (•OH), oxidizing triplet excited states of organic compounds (3C*), and singlet molecular oxygen (1O) (Kaur et al., 2019). •OH is the most widely studied oxidant due to its ubiquity and high reactivity: it reacts with most organics with near-diffusion-controlled rate constants (Herrmann et al., 2015). The main sources of aqueous •OH include mass transfer from the gas phase; the photo-Fenton reaction; and photolysis of nitrate, nitrite, and other species (Anastasio and McGregor, 2001; Arakaki and Faust, 1998; Badali et al., 2015; Herrmann et al., 2010; Tilgner and Herrmann, 2018), while the main sinks of •OH are dissolved organic compounds (Anastasio and Newberg, 2007; Arakaki et al., 2013). Based on lab studies of rainwater, clouds/fogs, and aqueous particle extracts, concentrations of •OH in atmospheric waters (including calculated rates of gas-to-particle partitioning of •OH) are typically 10−16–10−15 M (Albinet et al., 2010; Anastasio and McGregor, 2001; Anastasio and Newberg, 2007; Arakaki et al., 2013; Faust and Allen, 1993; Kaur et al., 2019; Leresche et al., 2021; Zhou et al., 2008). In contrast, modeled •OH concentrations in aqueous aerosol are generally 10−13 to 10−12 M (Ervens et al., 2014; Tilgner and Herrmann, 2018; Tilgner et al., 2013), but these are likely overestimates, in part because of missing •OH sinks (Arakaki et al., 2013; Arciva et al., 2022).
When organic chromophores (i.e., brown carbon) absorb sunlight, the molecules are promoted to their more reactive triplet excited states, some of which are oxidants (Kaur et al., 2019; McNeill and Canonica, 2016). These oxidizing triplets can transform numerous atmospheric species, including converting phenols and biogenic volatile compounds to aqSOA and oxidizing sulfite to sulfate (González Palacios et al., 2016; Monge et al., 2012; Rossignol et al., 2014; Smith et al., 2014; Wang et al., 2020). Triplets can be important oxidants in atmospheric and surface waters, with concentrations of 10−15–10−13 M (Kaur and Anastasio, 2018; Kaur et al., 2019; McNeill and Canonica, 2016). In comparison, triplet concentrations in ALW are expected to be higher because the production rate of 3C* increases with dissolved organic carbon (Canonica and Freiburghaus, 2001; McCabe and Arnold, 2017), although organic compounds can also be important sinks for 3C*, suppressing its steady-state concentration (Gemayel et al., 2021; Wenk et al., 2013). This dual effect of organic compounds makes it difficult to predict 3C* concentrations in ALW. Kaur et al. (2019) estimated a concentration of oxidizing 3C* in ALW of 10−13–10−11 M based on measurements in dilute particle extracts, while Tilgner et al. (2021) estimated the ALW concentration of triplets as 10−11 M.
Most or all of atmospheric triplets (i.e., both oxidizing and non-oxidizing triplets) also transfer energy to dissolved oxygen to form another important photooxidant, singlet molecular oxygen. Concentrations of 1O in fog/cloud drops and dilute extracts of ambient particles and lab SOA are higher than concentrations of •OH and 3C*, typically 10−14 to 10−12 M (Anastasio and McGregor, 2001; Bogler et al., 2022; Faust and Allen, 1992; Kaur and Anastasio, 2017; Kaur et al., 2019; Li et al., 2019; Manfrin et al., 2019). Though 1O is generally less reactive than •OH and 3C*, it can react quickly with certain alkenes, furans, nitrogen heterocycles, polycyclic aromatic hydrocarbons, and other organics (Barrios et al., 2021; Wilkinson et al., 1995) and can be a competitive oxidant because of its high concentration (Bogler et al., 2022; Kaur et al., 2019; Manfrin et al., 2019). Kaur et al. (2019) estimated 1O might be as high as 10−10 M under ALW conditions due to increased 3C* concentrations, which would make it an important oxidant in particle water (Ma et al., 2021).
Due to its limited water content, it is difficult to study chemistry in ALW directly. To get around this problem, Kaur et al. (2019) measured •OH, 3C*, and 1O kinetics as a function of dilution in extracts of a single particulate matter (PM) sample and extrapolated the results to aqueous aerosol conditions. However, there are large uncertainties with this extrapolation, since the PM extracts were approximately 1000 times more dilute than ALW conditions. In addition, these authors only examined a single sample collected during winter and were unaware that triplet measurements can be impacted by probe inhibition from organic compounds. To build on this past work, here we apply the same method but with higher dissolved organic matter concentrations in particle extracts and with correction for triplet probe inhibition. Moreover, in this work we study both a winter PM sample and summer wildfire particles to explore differences in oxidant kinetics.
2.1 Chemicals
Furfuryl alcohol (FFA, 98 %), benzoic acid (BA, ≥ 99.5 %), p-hydroxybenzoic acid (p-HBA, 99 %), (phenylthio)acetic acid (PTA, 96 %), syringol (SYR, 99 %), 3,4-dimethoxybenzaldehyde (DMB, 99 %), and deuterium oxide (99.9 % D atom) were received from MilliporeSigma. All chemical solutions and particulate matter extracts were prepared using air-saturated ultrapure water (Milli-Q water) from a Milli-Q Advantage A10 system (Millipore; ≥ 18.2 MΩ cm) with an upstream cartridge to remove organics.
2.2 Particle collection and extraction
Fine particles (PM2.5) were collected on the roof of Ghausi Hall on the campus of the University of California, Davis, in February and August 2020. Davis air quality in winter is often impacted by residential wood combustion, while the August 2020 samples were impacted by northern California wildfires. PM2.5 was collected using a high-volume sampler equipped with a PM10 inlet (Graseby Andersen) to remove PM larger than 10 µm followed by two offset, slotted impactor plates (Tisch Environmental, Inc., 230 series) to remove PM above 2.5 µm. The resulting fine particles were collected onto Teflon-coated borosilicate glass microfiber filters (Pall Corporation, Emfab™ filters, 8 in. × 10 in.) that were pre-cleaned by gently shaking in Milli-Q water for 8 h and then drying at 100 ∘C. During sampling, the airflow rate was maintained at 68 (± 2) m3 h−1. Particles were collected for either 24 h or up to a week; see Table S1 for details. Upon collection, each sample was wrapped in aluminum foil (baked previously at 500 ∘C for 8 h), sealed in a Ziploc bag, and frozen at −20 ∘C. Field blanks were obtained in an identical manner to samples, including loading the clean filters into the sampler and turning on the pump for 2 min.
To prepare particulate matter extracts (PMEs), filters were cut into 2 cm × 2 cm squares on the day of extraction. Each square was placed in an individual, sealed, 20 mL amber glass vial and extracted with Milli-Q water by shaking for 4 h in the dark. The extracts from the same filter sample were combined, filtered (0.22 µm PTFE; Pall), and adjusted to pH 4.2 with sulfuric acid or sodium hydroxide to mimic the acidity of winter particle water in the Central Valley of California (Parworth et al., 2017). The pH of each extract was measured by a pH microelectrode (MI-414 series, protected tip; Microelectrodes, Inc.). The UV–Vis spectrum of each PME was measured in a 1 cm cuvette immediately after pH adjustment with a Shimadzu UV-2501PC spectrophotometer. Rates of sunlight absorption between 300 and 450 nm were calculated for midday winter-solstice sunlight in Davis, as described by Kaur et al. (2019). PMEs were divided into 4 mL HDPE bottles and flash-frozen in liquid nitrogen immediately after preparation and were later thawed on the day of experiments. Filter squares were weighed by a microbalance (Sartorius M2P) before and after extraction to determine the PM mass extracted; the resulting PM mass water mass ratios in the filtered extracts might be overestimated because of removal of insoluble material during filtration. Dissolved organic carbon (DOC) and major ion concentrations (Table S2) in PMEs were measured by a Shimadzu TOC-VCPH analyzer and Metrohm ion chromatographs (881 Compact IC Pro) equipped with conductivity detectors, respectively.
To investigate the relationship between particle dilution and oxidant concentration, filter squares from the same sample were extracted with five different volumes of Milli-Q water: 10, 2, 0.7, 0.4, and 0.3 mL. To obtain enough filter squares for this dilution series, for both the winter (WIN) and the summer (SUM) samples we combined extracts from 180 filter squares cut from three sheets of filter that were collected on consecutive days. The same number of squares was cut from each of the three filters in a given sample. We use “PME name-water volume” (e.g., WIN-0.7) to denote the sample and extraction volume. Because it is difficult to extract squares with only 0.4 or 0.3 mL of Milli-Q, for these dilutions we extracted each filter square with 1 mL of Milli-Q and then used a rotary evaporator (Buchi Rotavapor R-110; temperature set no higher than 65 ∘C) to remove water until we obtained the equivalent of a 0.4 or 0.3 mL extract. We define the concentration factor (CF) of an extract as the inverse of the volume used for extraction. For example, WIN-10 has a concentration factor of 0.1.
2.3 Sample illumination and chemical analysis
We illuminated samples with light from a 1000 W xenon arc lamp passed through a water filter, an AM1.0 air mass filter (AM1D-3L, Sciencetech), and a 295 nm long-pass filter (20CGA-295, Thorlabs) to simulate tropospheric sunlight (Kaur and Anastasio, 2017). We first transferred the extract into a silicone-plugged GE 021 quartz tube (5 mm inner diameter, 1.0 mL volume) and then spiked it with the photooxidant probe and mixed it. The entire tube was illuminated at 20 ∘C and was not stirred. Dark control samples were wrapped in aluminum foil and kept in the same photoreactor chamber. During illumination, aliquots of approximately 150 µL were removed from the illuminated and dark tubes at specific time intervals to measure concentrations of probes with high-performance liquid chromatography (HPLC, Shimadzu LC-20AB pump, Thermo Scientific Accucore XL C18 column (50 × 3 mm, 4 µm bead), and Shimadzu-M20A UV–Vis detector). The photon flux on each experiment day was determined by measuring the photolysis rate constant of a 10 µM 2-nitrobenzaldehyde (2NB) solution in the same type of container as samples (Galbavy et al., 2010).
2.4 Photooxidant measurements
Details about determining photooxidant concentrations are provided in past papers (Anastasio and McGregor, 2001; Kaur and Anastasio, 2017; Kaur et al., 2019) and are only discussed briefly here.
2.4.1 Hydroxyl radical (•OH)
The production rate, rate constant for loss, and steady-state concentration of •OH were quantified using benzoic acid (BA) and a competition kinetics technique. A 0.020 M stock solution of benzoic acid benzoate was prepared and adjusted to pH 4.2. For each sample, four 1.0 mL aliquots of PME were spiked with different final concentrations (100–1200 µM) of BA, keeping PME dilution by the addition of probe solution to less than 10 %. We then illuminated each PME and used HPLC to monitor the formation of p-hydroxybenzoic acid (p-HBA), which is formed from BA oxidation by •OH. The initial rate of p-HBA formation was determined from a regression between concentration and illumination time, using either a linear regression or, for plots with curvature, a three-parameter exponential fit:
where [p-HBA]t and [p-HBA]0 are the concentrations at illumination times t and zero, respectively, and a and b are regression fit parameters. For exponential kinetics data, the initial formation rate of p-HBA, RP,EXP, was calculated with
Rates of p-HBA formation were normalized to sunlight conditions at midday local time on the winter solstice at Davis (solar zenith angle = 62∘; s−1; Anastasio and McGregor, 2001), and were corrected for internal light screening due to sample absorption, using
where Sλ is the internal light screening factor in an individual sample (Table S1) and j2NB,EXP is the photolysis rate constant of 2NB measured on the experiment day.
We then fitted versus 1 [BA] with a linear regression and used the slope and y intercept to calculate the initial production rate of •OH (POH), the pseudo-first-order rate constant of •OH loss by natural sinks (), and the steady-state •OH concentration:
Here Yp-HBA (0.18) is the yield of p-HBA from the reaction of BA with •OH (Anastasio and McGregor, 2001) and is the second-order rate constant of BA reacting with •OH at pH 4.2 (5.1 × 10⁹ M−1 s−1) (Ashton et al., 1995; Wander et al., 1968). •OH measurements are in Table S3.
2.4.2 Oxidizing triplet excited states of organic matter (3C*)
Oxidizing triplets were measured employing syringol (SYR) and (phenylthio)acetic acid (PTA) as probes (Kaur and Anastasio, 2018; Ma et al., 2023b). These probes only quantify the subset of triplets that can oxidize organic molecules. SYR captures both weakly and strongly oxidizing triplets, but its decay can be inhibited by dissolved organic matter (DOM) in PME (Canonica and Laubscher, 2008; Ma et al., 2023b; Wenk and Canonica, 2012; Wenk et al., 2015). In contrast, PTA is less sensitive to inhibition by DOM, but it only reacts appreciably with strongly oxidizing triplets (Ma et al., 2023b). Two 1.0 mL aliquots of PME were spiked with 10 µM of SYR or PTA and then illuminated to determine the pseudo-first-order rate constants for the loss of each probe (). Next, values were normalized to Davis winter sunlight conditions and corrected for light screening using an equation that is analogous to Eq. (3) to obtain rate constant . The contributions of direct photodegradation, •OH, and 1O to probe decay were then subtracted to determine the rate constant for loss of the probe due to triplets, :
Here jP is the probe direct photodegradation rate constant under Davis winter sunlight, and kP+OH and are the bimolecular rate constants of triplet probes reacting with •OH and 1O, respectively (Table S4). •OH accounts for 2 %–35 % and 3 %–17 % of the decay of SYR and PTA, respectively, while 1O accounts for 3 %–45 % and 2 %–10 % for SYR and PTA (Tables S5 and S6). Since triplets in PMEs represent the excited states of a complex mixture of brown carbon, there is no single value for the second-order rate constant of 3C* reacting with probes (). To estimate triplet concentrations, we assume that triplets (3C*) in PME have the same average reactivity as the triplet state of 3,4-dimethoxybenzaldehyde, 3DMB* (Fleming et al., 2020; Kaur and Anastasio, 2018; Kaur et al., 2019). Unlike in our past work (Kaur et al., 2019), we corrected for DOM inhibiting the decays of SYR and PTA, which can cause an underestimate of 3C* concentrations. To do this, we measured the inhibition factor (IF) in samples (Canonica and Laubscher, 2008; Ma et al., 2023b; Wenk et al., 2011) and used it to correct the 3C* concentration. Details about inhibition factor measurements and [3C*] corrections are in Sect. S1 in the Supplement. The 3C* concentration after inhibition correction is
where is the second-order rate constant of the probe with 3DMB* (Table S4) and IFP,corr is the inhibition factor of the probe in that extract (Table S7). Concentrations of 3C* in the main text are values after IF correction. While our past work indicates that 3DMB* is a good surrogate for the average oxidizing triplet in Davis drops and particles (Kaur and Anastasio, 2018; Kaur et al., 2019), it is possible that is higher than the rate constant for the probe with natural triplets. This is the case for surface waters, where the 2,4,6-trimethylphenol (TMP) +3DMB* rate constant (Ma et al., 2023b) is 3 times higher than the TMP +3CDOM* rate constant (Erickson et al., 2018). If this were also the case for our PM extracts, we would be underestimating oxidizing triplet concentrations by roughly a factor of 3.
2.4.3 Singlet molecular oxygen (1O)
We used furfuryl alcohol (FFA) as a probe to determine 1O concentrations (Anastasio and McGregor, 2001; Haag et al., 1984). A total of 1.0 mL of PME sample was divided into two 0.5 mL aliquots, and then one was diluted with 0.5 mL H2O while the other was diluted with 0.5 mL deuterium oxide (D2O). A final concentration of 10 µM FFA was spiked into each solution, and then both were illuminated. The pseudo-first-order rate constant of FFA loss in H2O- and D2O-diluted PME ( and ) during illumination was determined as the negative slope of a linear regression between ln([FFA]t [FFA]0) and illumination time (t). The 1O concentration in the undiluted PME was determined from the difference in FFA loss rates in H2O and D2O using (Anastasio and McGregor, 2001)
where D is the sample dilution factor (i.e., 0.5 for our experiments); is the second-order rate constant of FFA reacting with 1O at 20 ∘C, 0.96 (± 0.04) × 108 M−1 s−1 (Appiani et al., 2017); and are the first-order rate constants for loss of 1O in 100 % H2O (2.2 × 10⁵ s−1) and D2O (1.6 × 10⁴ s−1), respectively (Bilski et al., 1997); and and are the mole fractions of H2O and D2O in the D2O-diluted solution. Analogously to Eq. (3), we normalized the experimentally determined 1O concentrations using the light screening factor of each PME and adjustment to Davis winter sunlight conditions. Measurements of 1O are in Table S8.
3.1 Testing extraction and rotary evaporation
Our winter particle filters were collected in February 2020, when Davis was influenced by residential wood combustion; the average PM2.5 concentration during our sampling was 9.2 µg m−3. The summer particles were collected in August 2020, when severe wildfires were occurring approximately 30 km from Davis, resulting in an average PM2.5 concentration of 54 µg m−3. While we label our filter composites as “summer” and “winter” as a shorthand, since we have only one sample for each season, our results say little about the seasonality of photooxidants in PM. We explore the issue of oxidant seasonal variations in two other papers (Jiang et al., 2023; Ma et al., 2023a). Figure 1 shows the dissolved organic carbon (DOC) concentrations and rates of light absorption (Rabs) as a function of dilution in the winter (WIN) and summer (SUM) particle extracts. We express dilution as the ratio of dry particle mass to liquid water mass in our extracts, since we can experimentally measure these quantities for our PMEs and can estimate values for both clouds/fogs and airborne particles. Both DOC and Rabs are directly proportional to the particle mass water mass ratio, indicating that the extractions of filter squares with varying volumes of water achieved the same extraction efficiency. The DOC values of the most concentrated extracts (−0.4 and −0.3) also follow a linear relationship, showing that the rotary evaporation process used for these dilutions did not lead to significant loss of brown carbon or other organic compounds. As shown in Fig. S1, UV–Vis spectra of the −0.4 and −0.3 extracts before and after rotovapping are essentially the same, indicating that evaporation did not change the brown carbon (BrC) composition significantly. We also checked inorganic concentrations as a function of the concentration factor (Fig. S2): most of the ions exhibit good linearity, indicating consistency in extraction efficiency.
We also examined if rotovapping affects photooxidant concentrations. First, we extracted one filter with either 0.7 mL water per square (sample PME-NR) or 2 mL water per square followed by rotovapping to the equivalent of 0.7 mL water per square (sample PME-R). In a second test, we diluted a rotovapped sample (WIN-0.3) by a factor of 6.7 with water to obtain an extract equivalent to 2 mL Milli-Q per square (WIN-0.3D); this diluted, rotovapped sample should be equivalent to WIN-2, a non-rotovapped sample with the same overall dilution. Figure S3 presents photooxidant concentrations in the two tests. In each test, the concentrations are essentially the same in the rotovapped and non-rotovapped samples, indicating a negligible effect of rotary evaporation on photooxidant kinetics.
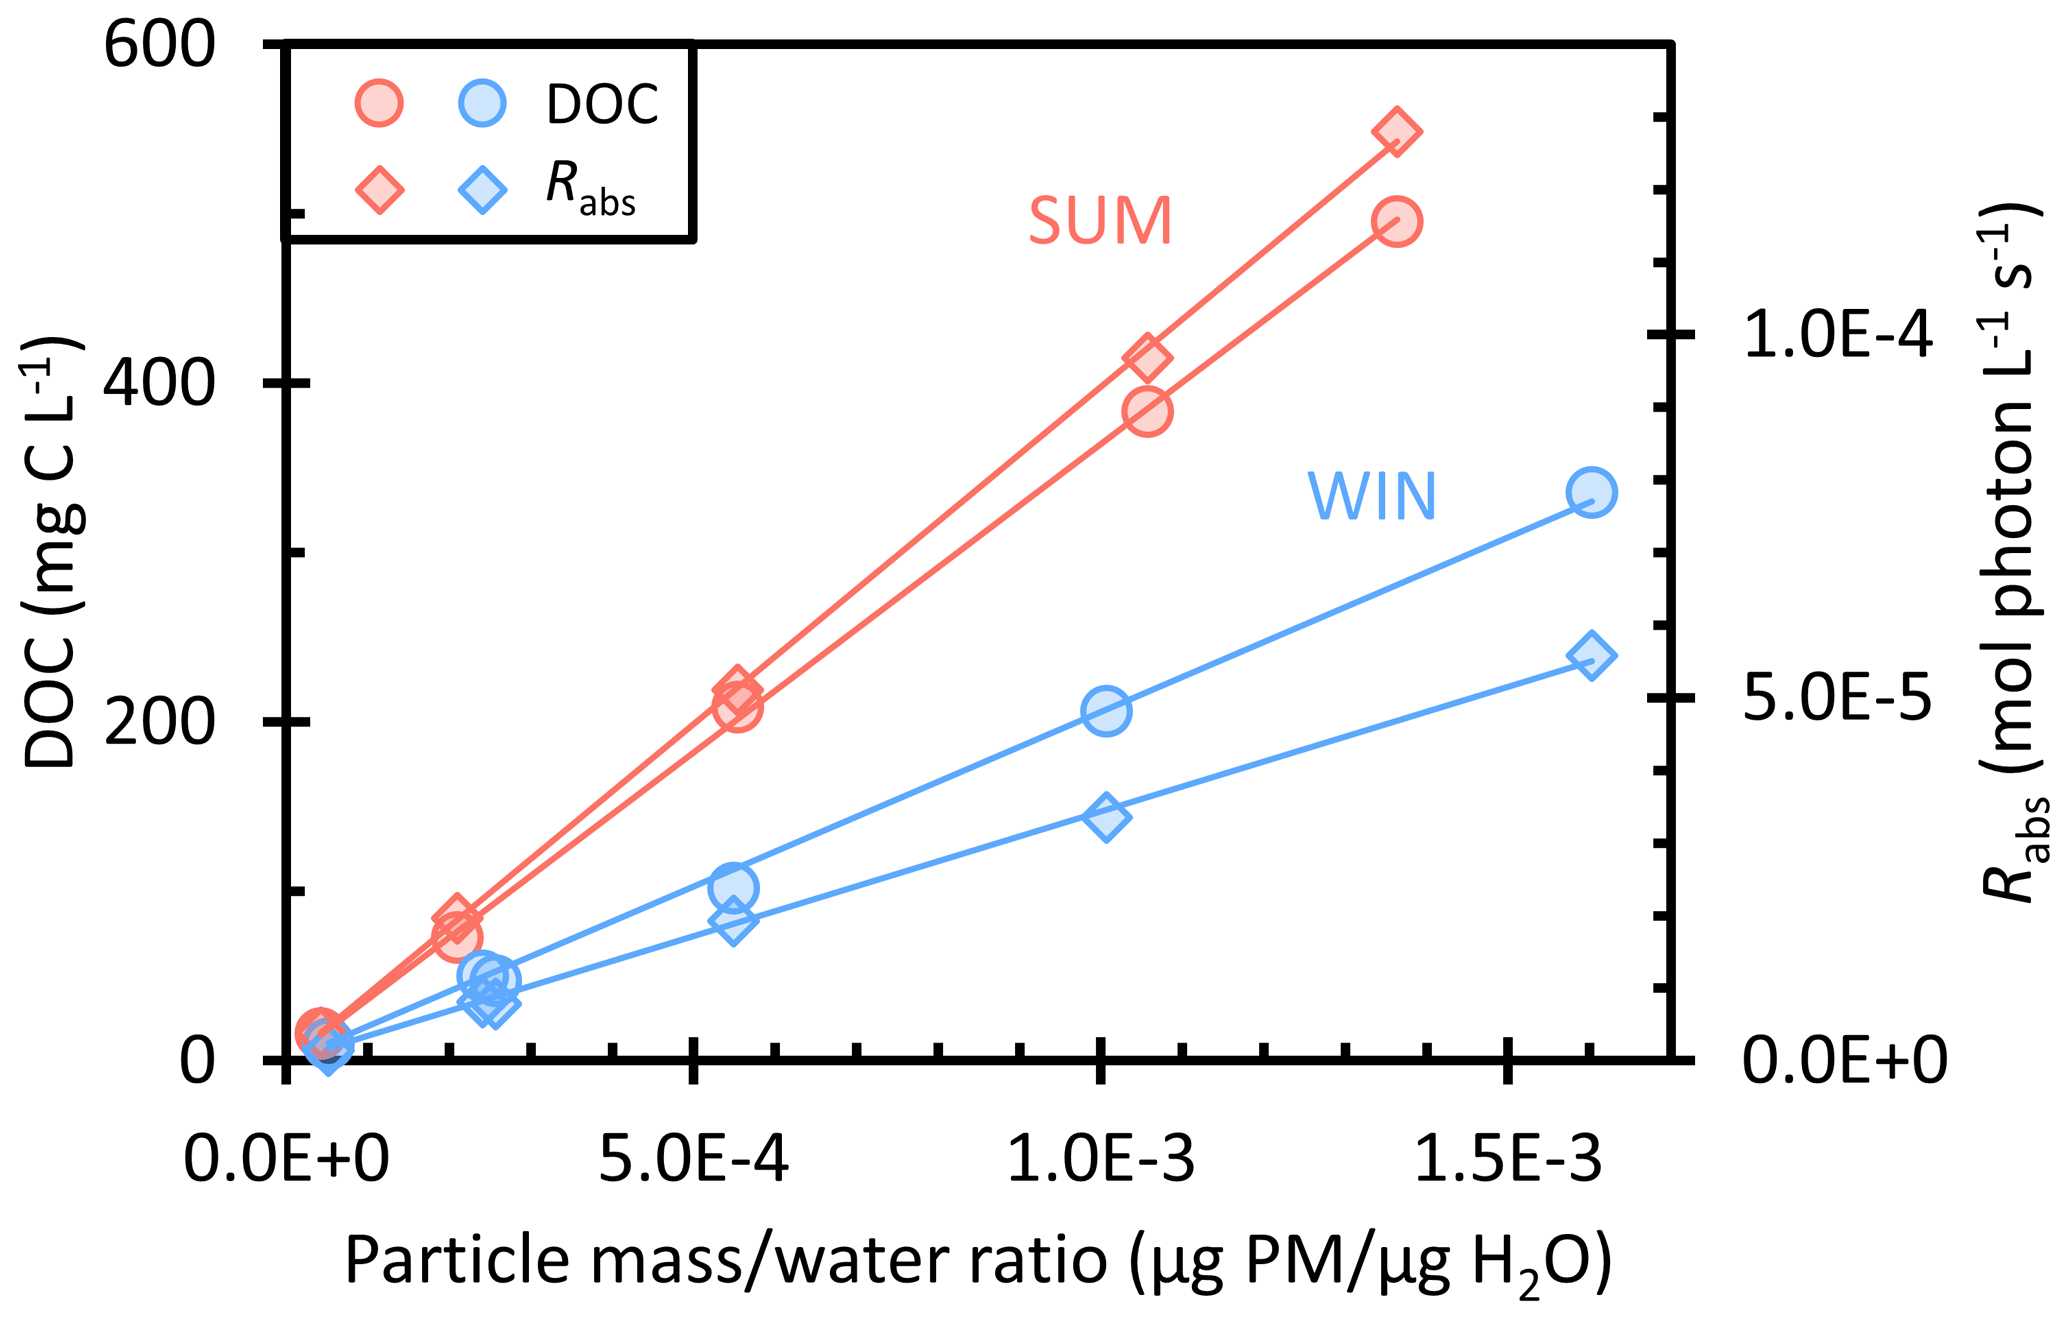
Figure 1Dependence of dissolved organic carbon (DOC, circles) and the rate of sunlight absorption between 300–450 nm (Rabs, diamonds) on the particle mass water mass ratio (i.e., aqueous particle concentration) in summer (red) and winter (blue) particle extracts.
3.2 Ions and light absorption
Figure 1 shows that summer and winter PMEs have DOC concentrations in the range of 16–495 and 10–336 mg C L−1, respectively, but WIN has slightly higher particle mass water mass ratios of (0.05–1.6) × 10−3 µg PM µg H2O compared to (0.04–1.4) × 10−3 µg PM µg H2O for SUM. The particle mass water mass ratios indicate that our extracts have particle concentrations that are equivalent to dilute to concentrated cloud/fog waters. The summer sample of relatively fresh wildfire emissions shows a higher average fraction of organic carbon (OC) to PM mass, 0.37 (± 0.02), compared to winter (0.20 ± 0.01). But both are lower than the typical OC PM ratio near 0.5 for biomass burning particles (Reid et al., 2005; Schauer et al., 2001), probably because our water extracts do not capture non-polar organic compounds. The winter sample has lower organic carbon but higher concentrations of ions, including nitrate (NO), sulfate (SO), and ammonium (NH) (Table S2). For example, nitrate concentrations in WIN range from 0.18 to 5.2 mM and contribute on average (± 1σ) 20 (± 2) % of the total extracted PM mass. In contrast, NO concentrations in SUM are about 5 times lower (0.03–1.0 mM) at the same concentration factor and only contribute an average of 4.4 (± 0.4) % of the SUM PM mass. The sulfate in WIN accounts for 11 (± 4) % of extracted PM mass, with concentrations (0.03–2.3 mM) that are around 4 times higher than in SUM (0.02–0.6 mM, accounting for an average of 4.2 (± 0.6) % of extracted PM mass). NH is also higher in WIN (0.20–3.6 mM) compared to SUM (0.10–1.3 mM). Concentrations of potassium, a tracer of biomass burning (Andreae, 1983), are 0.03–0.7 mM in both WIN and SUM, with a K PM mass ratio of 0.02 (± 0.004), which is in the range reported for biomass burning aerosols of 0.02 to 0.05 (Reid et al., 2005; Urban et al., 2012).
For all PMEs, absorbance declines exponentially with wavelength (e.g., Fig. S1), and WIN and SUM samples have the same average absorption Ångström exponent (AAE, 300–450 nm) of 7.2 (Table S1), comparable to AAE values (6–8) previously reported in water extracts of biomass burning particles (Hecobian et al., 2010; Hoffer et al., 2006; Kaur et al., 2019). The pathlength-normalized absorption coefficient at 300 nm (α300) for the summer samples (0.2–6.7 cm−1) is about 2 times higher than winter samples at the same concentration factor (0.1–3.0 cm−1) (Table S1). Thus, summer extracts absorb sunlight at approximately twice the rate as winter extracts (Fig. 1). We also calculated the dissolved-organic-carbon-normalized mass absorption coefficient (MACDOC) of each extract by dividing the absorbance at 300 or 365 nm by the DOC concentration (Kaur et al., 2019). SUM average MACDOC values across all dilutions are 3.1 (± 0.1) and 1.0 (± 0.1) m2 (g C)−1 at 300 and 365 nm, respectively, which are approximately 1.5 times higher than the WIN values (Table S1). This difference is likely because the SUM sample is dominated by fresh wildfire organic aerosols that are composed of organic compounds with a higher degree of unsaturation, increasing light absorption (Fleming et al., 2020). Meanwhile, the WIN sample may contain a lower fraction of fresh biomass burning aerosols due to oxidation and photobleaching of the brown carbon (Forrister et al., 2015; Wong et al., 2019). Our MAC value for WIN is similar to the average MAC value in the previous Davis winter samples (Kaur et al., 2019).
3.3 Photooxidants in PM extracts
In this section we first present our measured oxidant concentrations as a function of particle dilution in the WIN and SUM extracts. We use DOC as the independent variable in our plots because BrC likely dominates the production of 3C* and 1O and DOC is proportional to the concentration factor in each extract series. We then examine how the production rate (POX) and pseudo-first-order rate constant for loss () for each oxidant vary as a function of dilution. These parameters are related to the oxidant steady-state concentration, [OX], by
In Sect. 3.4, we extrapolate these kinetic parameters to aerosol liquid water conditions to predict photooxidant concentrations in ALW.
3.3.1 Hydroxyl radicals in PM extracts
As shown in Fig. 2a, the most dilute sample in the WIN dilution series, WIN-10, has the lowest •OH concentration, while in the other dilutions [•OH] is noisy but appears to be independent of DOC. This result, i.e., that •OH concentration is essentially independent of particle mass concentration, is similar to what Kaur et al. (2019) observed for winter samples (green points in Fig. 2), although our •OH concentrations are approximately 10 times higher.
Kaur et al. (2019) found that the •OH photoproduction rate (POH) and sink () both linearly increase with the concentration factor, leading to a roughly constant •OH concentration, since the concentration is equal to the ratio (Eq. 10). To explore this in our samples, we determined POH and in all of the WIN and SUM extracts; we start by considering the WIN results. As shown in Fig. 3a, POH and both increase linearly with DOC, which is consistent with the winter PM extract observations of Kaur et al. (2019), though our samples have a higher slope for POH and a lower one for . This higher •OH production rate, coupled with a lower rate constant for •OH loss, is responsible for the roughly 10 times higher [•OH] in this work, but we do not know why these parameters are so different between the previous and current winter particle samples. POH in WIN ranges from 0.02 × 10⁻⁸ to 4.8 × 10⁻⁸ M s−1, significantly higher than typical values (approximately 10−10 M s−1) in rainwater, cloud, and fog waters (Albinet et al., 2010; Arakaki et al., 2013; Hong et al., 2018; Kaur and Anastasio, 2018; Tilgner and Herrmann, 2018). In Davis fog samples, the major source of •OH is photolysis of nitrate and nitrite (Anastasio and McGregor, 2001; Kaur and Anastasio, 2017). However, in our winter PM extracts, nitrate accounts for 10 % or less of POH (Table S3), while the nitrite contribution is negligible. Instead, we hypothesize that our samples might contain higher concentrations of transition metals, contributing to •OH production (Li et al., 2022; Vidrio et al., 2009). While DOC photoreactions can also be a source of •OH (Badali et al., 2015), it seems likely that POH is correlated with DOC primarily because DOC is a proxy for the concentration factor in the extracts. As for •OH sinks in our WIN extracts, is in the range (0.2–9.9) × 106 s−1, which is higher than previous Davis fog values ((0.4–1.3) × 106 s−1; Kaur and Anastasio, 2017). The lowest (in WIN-10, the most dilute extract) is comparable to the field blank values (Table S3), suggesting that [•OH] in WIN-10 may be artificially low because of background contamination. We also calculated the rate constant of organics reacting with •OH (kDOC+OH) for the winter samples; our average WIN value, 2.4 (± 0.7) × 108 L (mol C)−1 s−1, is similar to the one determined by Arakaki et al. (2013) for general atmospheric waters, 3.8 (± 1.9) × 108 L (mol C)−1 s−1. In contrast, the average winter kDOC+OH in Kaur et al. (2019) is approximately 3 times higher than our current winter sample; i.e., the past organics were more reactive with •OH.
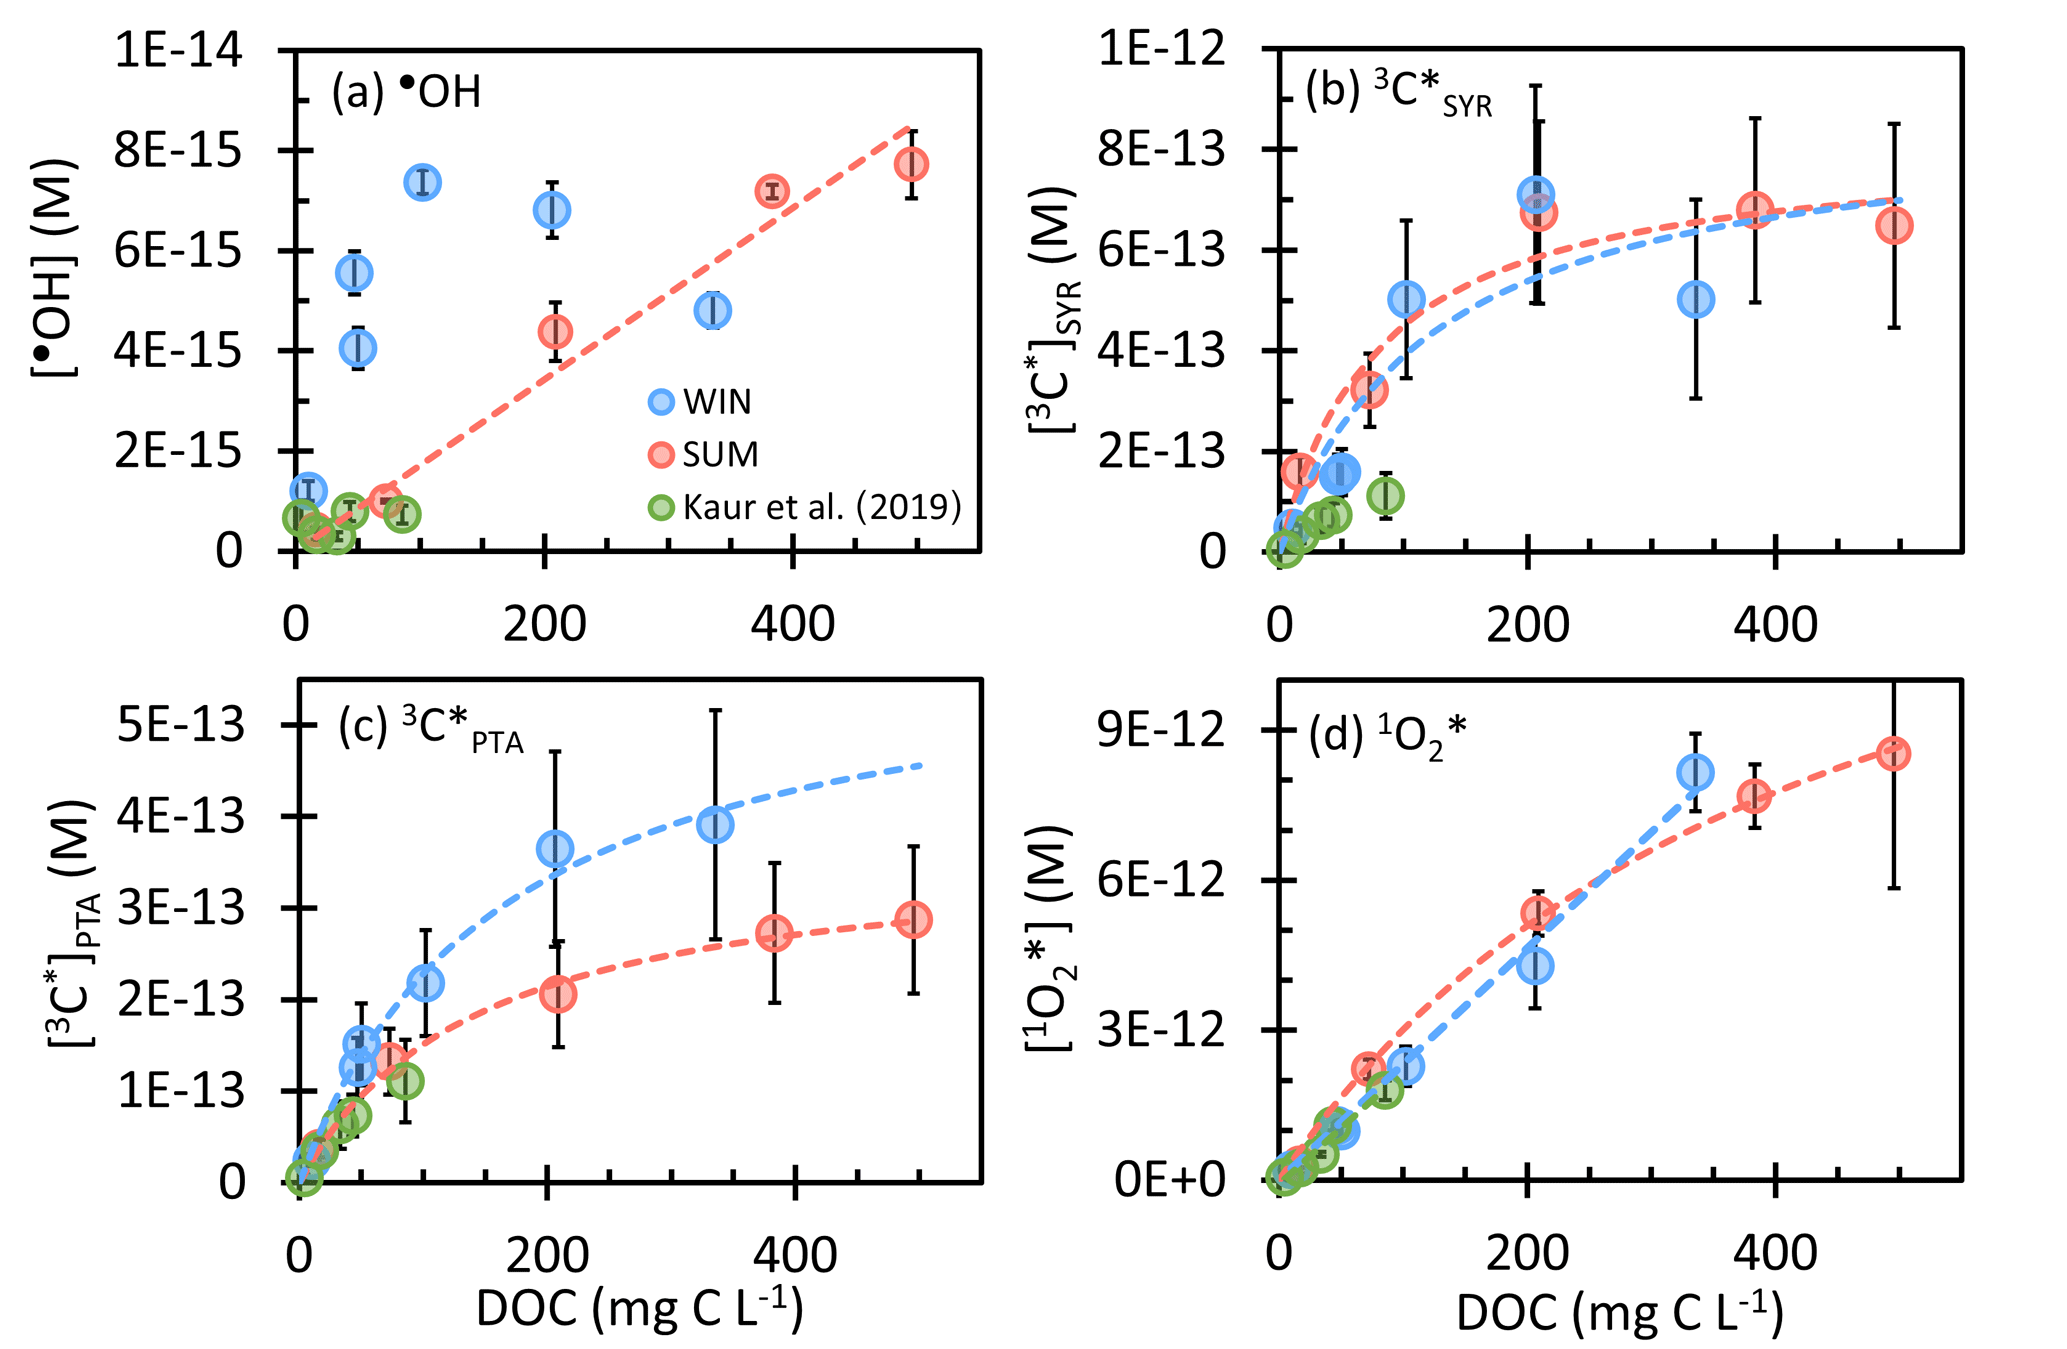
Figure 2Steady-state concentrations of (a) hydroxyl radicals, (b, c) oxidizing triplet excited states of brown carbon determined by (b) syringol (SYR) and (c) (phenylthio)acetic acid (PTA), and (d) singlet molecular oxygen in WIN (blue) and SUM (red) samples as a function of dissolved organic carbon. WIN-0.3D results are also included. Previous measurements in Davis winter particle extracts are shown in green (Kaur et al., 2019). Error bars represent ± 1 standard error propagated from linear regression and uncertainties in rate constants. Dashed lines represent linear or hyperbolic regression fits for WIN and SUM samples.
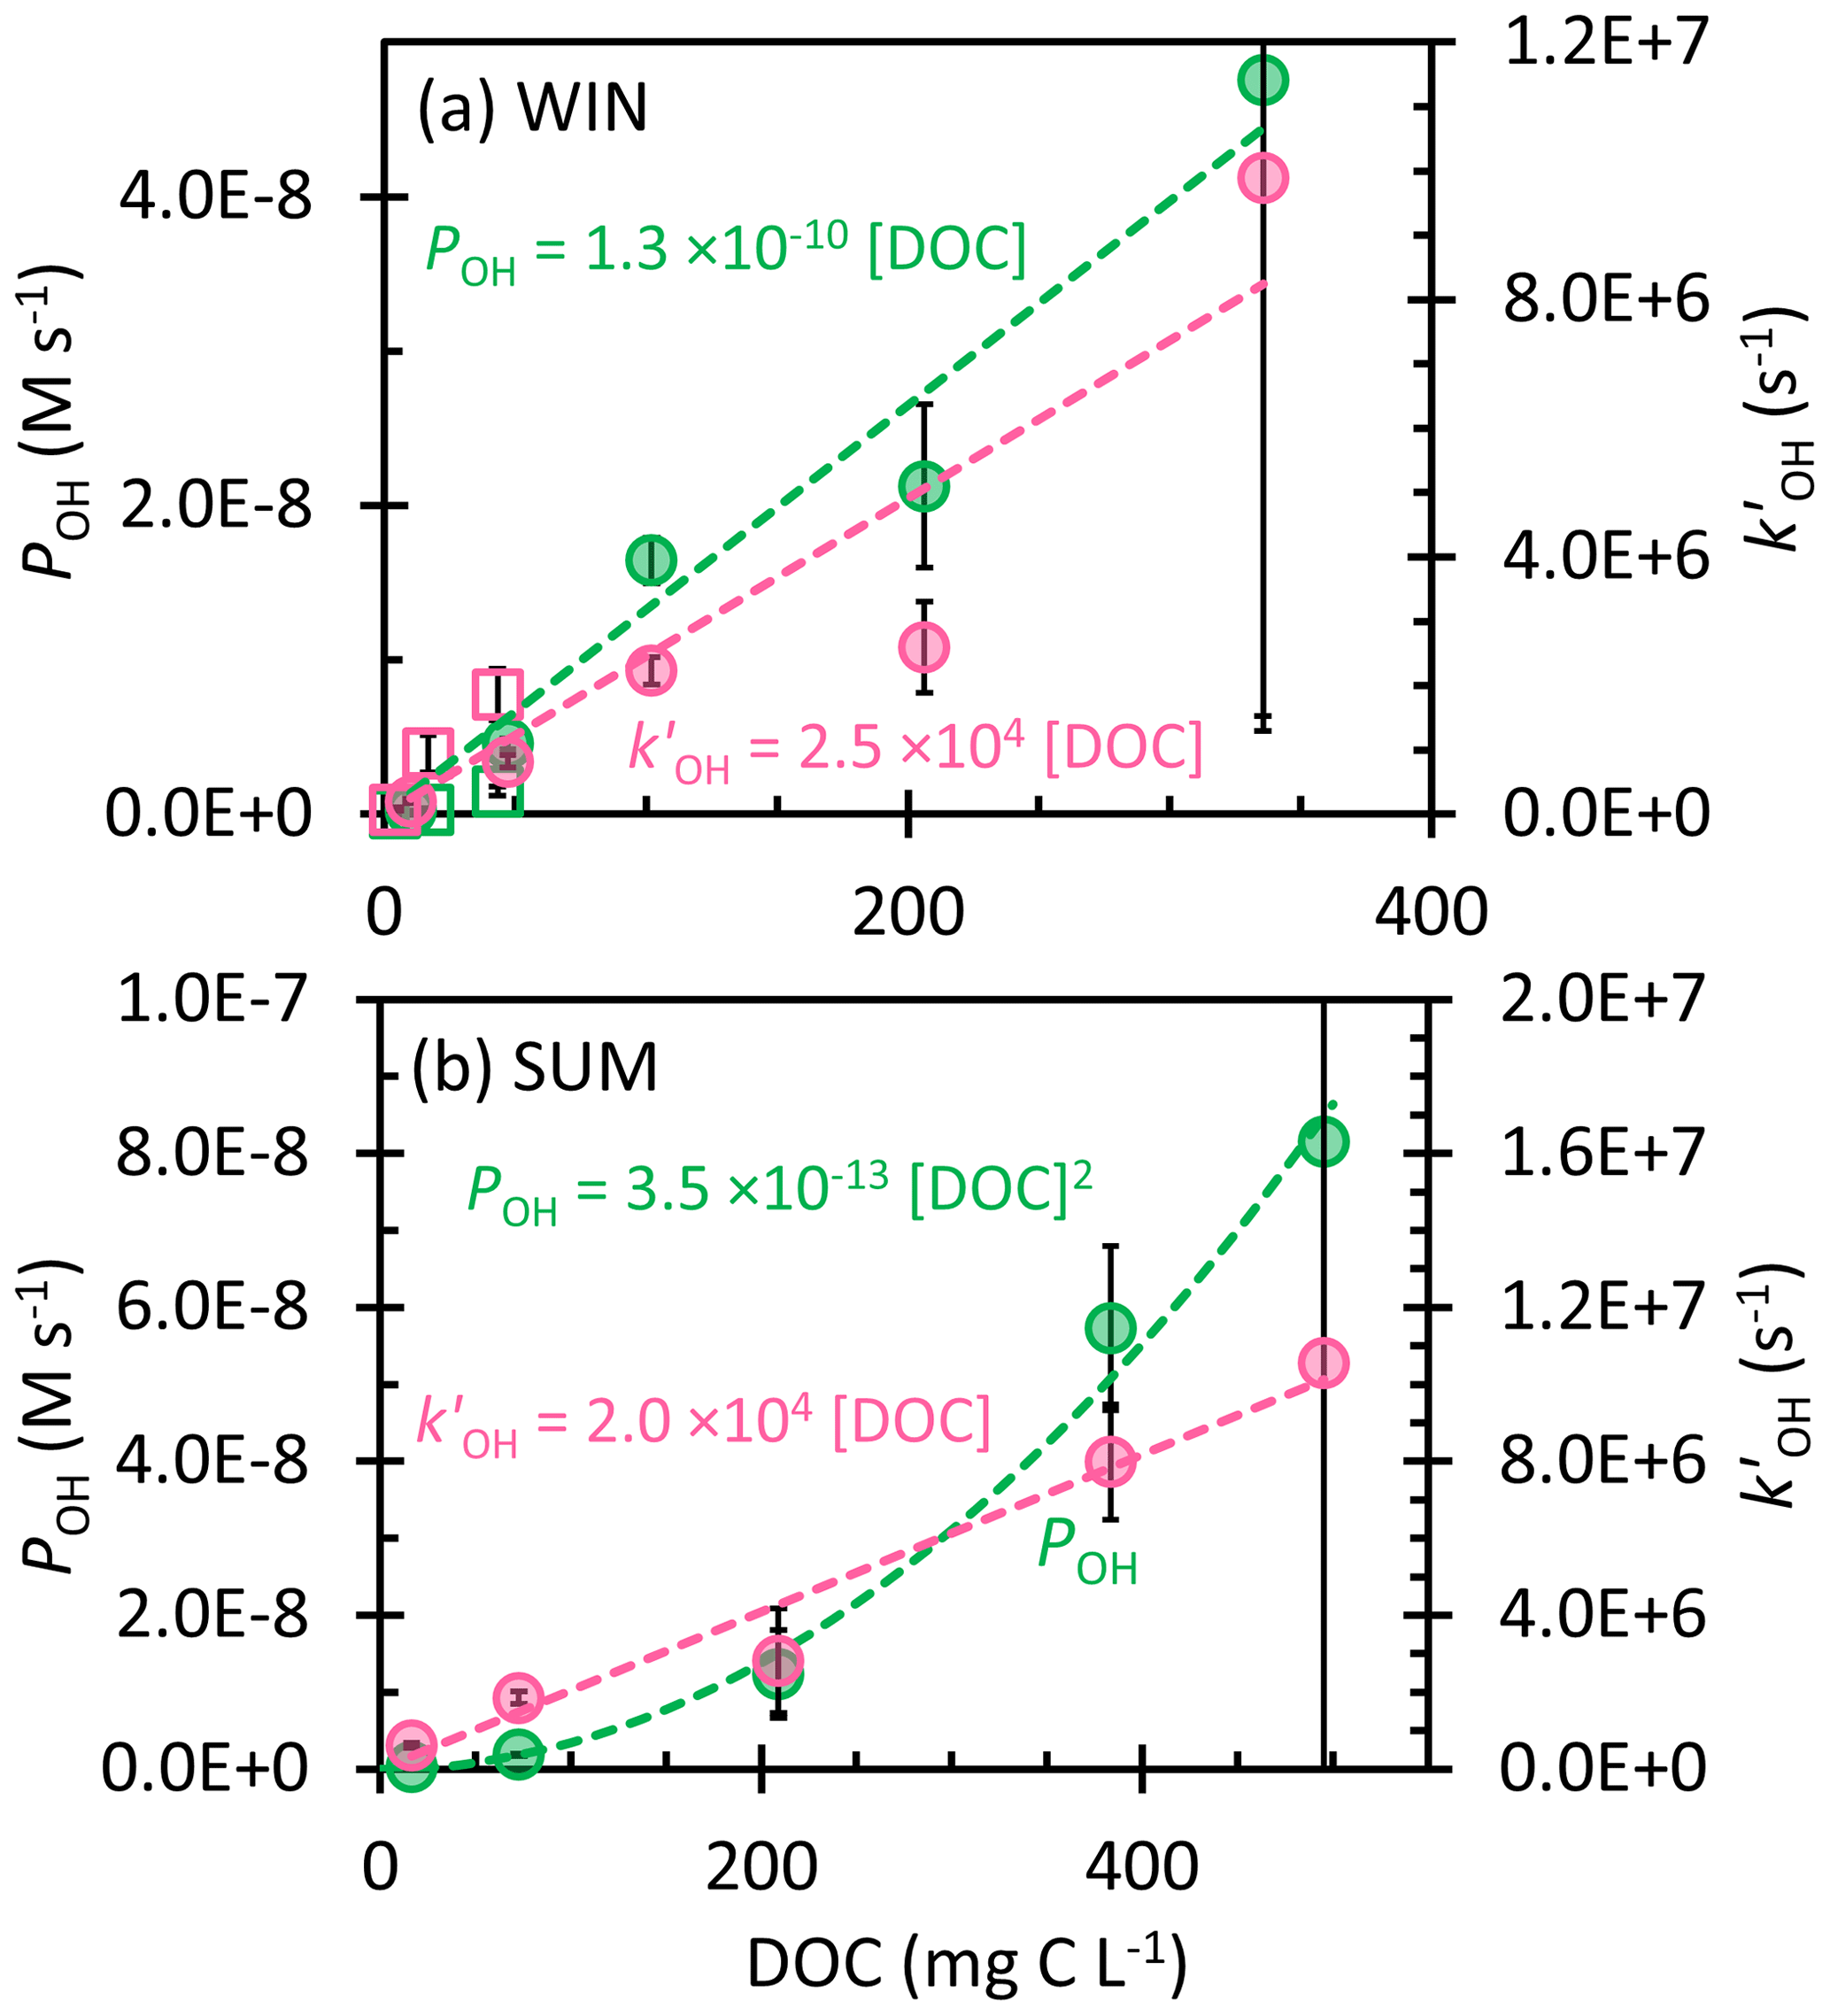
Figure 3Dependence of the rate of •OH photoproduction (POH; green, left y axis) and rate constant for loss of •OH due to natural sinks (; pink, right y axis) on dissolved organic carbon in the (a) winter and (b) summer samples. Error bars represent ± 1 standard error propagated from the error in regressions and rate constants; error bars for the 0.3 mL extracts (highest DOC) extend past the plot borders. Dashed lines represent linear regression fits, except the dashed green line in (b) SUM, which is derived from the linear regression of POH with [DOC]2. Previous measurements in Davis winter particle extracts are shown as open squares in panel (a) (Kaur et al., 2019).
Unlike in WIN, •OH in the summer samples linearly increases with the concentration factor or DOC, with an •OH concentration range of (0.4–7.7) × 10−15 M (Fig. 2a). This indicates that either POH or does not increase linearly with DOC. As shown in Fig. 3b, is linear with DOC, but POH is proportional to the DOC concentration squared. Our interpretation is that •OH production in SUM is a bimolecular reaction rather than a first-order photolysis reaction. The most likely candidate is the photo-Fenton reaction involving soluble reduced iron and hydrogen peroxide (or organic peroxides) (Paulson et al., 2019; Zepp et al., 1992), where the concentrations of both reactants increase with the concentration factor, as does [DOC]. Therefore, although WIN and SUM have roughly similar •OH concentrations, they apparently have different mechanisms governing •OH formation. POH in SUM is in the range (0.03–8.2) × 10−8 M s−1, with the value in SUM-0.3 nearly double that of WIN-0.3. In contrast, •OH sinks for the summer and winter samples are similar (Fig. 3) and the average kDOC+OH value in SUM is 2.9 (± 1.1) × 108 L (mol C)−1 s−1, not significantly different from the WIN value.
3.3.2 Oxidizing triplet excited states of organic matter in PM extracts
We determined oxidizing triplet concentrations using two probes. Syringol (SYR) is highly reactive towards both strongly and weakly oxidizing triplets, but its decay by 3C* can be inhibited by antioxidant moieties in DOM, leading to an underestimate of 3C* concentrations (Canonica and Laubscher, 2008; Ma et al., 2023b; Maizel and Remucal, 2017; Wenk et al., 2011). (Phenylthio)acetic acid (PTA) has a higher oxidation potential (1.47 V vs. SHE (standard hydrogen electrode), estimated using the Marcus equation) than SYR (∼ 1.17 V vs. SHE) (Canonica et al., 2000; Chellamani and Sengu, 2008), is less reactive than SYR with weakly oxidizing triplets, and thus does not capture the whole oxidizing triplet pool. But the advantage of PTA is that it is more resistant to inhibition by DOM (Klein et al., 2006; Ma et al., 2023b). For both probes, we correct for probe inhibition by measuring the inhibition factor (IF) and using it to correct 3C* concentrations (Sect. S1 and Table S7). Inhibition factors of SYR are as low as 0.13 (± 0.03) in the most concentrated sample (WIN-0.3), indicating that approximately 87 (± 20) % of SYR decay is inhibited by DOM in this sample, which would lead to a 3C* concentration that is 7.5 (± 1.7) times lower than the actual value if there were no correction for inhibition. This significant inhibition of syringol oxidation is likely due to the high phenolic content of biomass burning particles, whether from residential wood burning (WIN) or wildfires (SUM) (Huo et al., 2021; Schauer et al., 2001; Wenk and Canonica, 2012), As for PTA, IF values are all greater than 0.9, indicating little inhibition. For simplicity, we only show 3C* concentrations after inhibition factor correction; uncorrected values are given in Tables S5 and S6.
Concentrations of 3C* as a function of DOC are in Fig. 2. With SYR as the triplet probe (Fig. 2b), the [3C*]SYR range is (0.5–7.1) × 10−13 M in WIN and (1.6–6.8) × 10−13 M in SUM. At the same DOC, [3C*]SYR values in summer and winter are similar, despite the differences in sample composition (Table S5). Oxidizing triplet concentrations in our samples are generally higher than those from Kaur et al. (2019) (Fig. 2c, green points), which can be attributed to higher DOC in our samples and our correction for SYR inhibition. From PTA, the [3C*]PTA range is (0.2–3.9) × 10−13 M in WIN and (0.4–2.9) × 10−13 M in SUM, with WIN having higher values than SUM at the same concentration factor (Fig. 2c). The [3C*]PTA value is lower than [3C*]SYR in every dilution, with an average [3C*] [3C*]SYR ratio of 0.67 (± 0.22) in WIN and 0.36 (± 0.09) in SUM. Since PTA appears to only capture highly oxidizing triplets (Ma et al., 2022), the ratio of [3C*] [3C*]SYR should represent the highly oxidizing fraction of the total oxidizing triplet pool (i.e., 67 % in WIN and 36 % in SUM). Highly oxidizing triplets are typically formed from aromatic ketone or carbonyl precursors, such as 3,4-dimethoxybenzaldehyde, while precursors for weakly oxidizing 3C* include polycyclic aromatic structures (e.g., 2-acetonaphthone) (McNeill and Canonica, 2016). Our oxidizing triplet concentrations are approximately 100 times higher than [•OH] (Fig. 2), indicating the likely importance of 3C* as an oxidant in atmospheric drops and particles.
For both probes, the 3C* concentration initially increases with DOC but then approaches or reaches a plateau under more concentrated conditions. Kaur et al. (2019) observed the same trend. Their interpretation was that in dilute solutions O2 is the dominant sink for triplets, while under more concentrated conditions DOM becomes the major sink. Therefore, 3C* production and loss are both functions of DOC, as described by
The dashed lines in Fig. 2b and c show the regression fitting results of Eq. (11) to the experimental data. From the fitted parameter b (Table S9), we can determine (Eq. S6), the total rate constant of physical quenching and chemical reaction of oxidizing triplets with DOC. Values from our Fig. 2 fittings are 7.6 (± 6.8) × 107 L (mol C)−1 s−1 for WIN and 1.2 (± 0.5) × 108 L (mol C)−1 s−1 for SUM (Table S10). Kaur et al. (2019) obtained 9.3 (± 1.3) × 107 L (mol C)−1 s−1 for Davis winter particle extracts, but they did not correct for SYR inhibition, which should be more significant at higher DOC, leading to an earlier plateau and higher apparent rate constant. Despite this, the three values are not significantly different, possibly because the Kaur et al. (2019) samples had much lower DOC and thus were less affected by SYR inhibition. Wenk et al. (2013) obtained a range of values of (1.3–3.9) × 107 L (mol C)−1 s−1 for surface water DOM quenching and reacting with 2-acetonaphthone and 3-methoxyacetophenone triplets; their lower values imply that atmospheric DOM, at least in our samples, more efficiently quenches triplets than does DOM in surface waters.
The DOC quenching and reaction rate constants from our PTA-derived triplet concentrations are 5.7 (± 1.2) × 107 and 6.6 (± 1.0) × 107 L (mol C)−1 s−1 for WIN and SUM, respectively. These values are lower than those obtained using SYR, as reflected by the weaker curvature of the PTA dashed lines (Fig. 2c) compared to SYR (Fig. 2b). The similar values of from PTA in WIN and SUM suggest that this rate constant is insensitive to particle type. Therefore, the higher [3C*]PTA in WIN compared to SUM at the same DOC level can be attributed to differences in 3C* production. This is consistent with the differences in apparent quantum yields: the WIN yield of triplets is 1.8 (± 0.3) %, more than double the SUM value of 0.8 (± 0.1) % (Table S6).
3.3.3 Singlet molecular oxygen in PM extracts
The final photooxidant we measured was singlet molecular oxygen. As shown in Fig. 2d, winter and summer samples have similar 1O concentrations, in the range of (0.2–8.5) × 10−12 M, with values increasing with DOC. The lowest values, in the most dilute extracts, are comparable to fog water concentrations, while our highest concentrations are approximately 4 times higher than those in previous Davis winter particle extracts (Anastasio and McGregor, 2001; Kaur and Anastasio, 2017; Kaur et al., 2019). Singlet oxygen is the most abundant oxidant in our PMEs, with concentrations roughly 10 times higher than 3C* and 1000 times higher than •OH. In both series of samples, the 1O concentration increases with DOC, as seen in Kaur et al. (2019). Since brown carbon is the source of 1O, the 1O production rate increases with DOC. In contrast, the dominant sink for 1O is water, whose concentration is independent of the sample concentration factor. All three sets of samples in Fig. 2d exhibit very similar relationships between 1O and DOC, suggesting DOC concentration might be a good predictor of 1O concentrations in atmospheric waters.
Apparent quantum yields of 1O are 3.0 (± 0.2) % for WIN and 2.0 (± 0.4) % for SUM (Table S8), which are in the range of typical values for atmospheric waters (Bogler et al., 2022; Kaur and Anastasio, 2017; Kaur et al., 2019; Leresche et al., 2021; Manfrin et al., 2019) and surface waters (Ossola et al., 2021). As described by Ossola et al. (2021), the most accurate determination of quantum yields with simulated sunlight uses a rate of light absorption that accounts for all of the sunlight wavelengths, i.e., out to roughly 700–800 nm. Consistently with our past work (Kaur et al., 2019), we determined our quantum yields based on sample light absorption from 300–450 nm; as shown in Table S1, rates of light absorption over this range represent 78 (± 3) % of Rabs calculated based on the total sunlight absorption. Thus, our 1O and 3C* quantum yields would be roughly 29 (± 1) % smaller if calculated using the entire range of solar light absorption.
For WIN, 1O is linearly related to DOC throughout the dilution series, but in SUM the singlet oxygen concentration exhibits a linear relationship at low DOC and then starts to level off in the more concentrated extracts (Fig. 2d). This curvature has at least two possible explanations. One, as proposed by Kaur et al. (2019), is that [1O] stops rising under concentrated solution conditions because organics become the dominant 1O sink. The second possibility is that under more concentrated conditions, the concentration of 3C* plateaus, a result of DOC becoming the dominant sink for triplets (e.g., Fig. 2b). Thus, as the solution becomes more concentrated, the production rate of 1O rises more slowly, causing [1O] to start to bend over. In the summer sample of Fig. 2d, the curvature of 1O is more likely due to this second explanation (i.e., [3C*] plateauing) rather than DOC becoming an important 1O sink because 1O generally has lower reactivity than triplets with most organics (Arnold, 2014; Canonica et al., 2000; Wilkinson et al., 1995). Based on rough estimates of the composition and reactivity of particulate organics from biomass burning (Kaur et al., 2019), we estimate that DOC accounts for less than 2 % of the 1O sink in our extracts.
Assuming the leveling-off of [3C*] is responsible for the 1O curvature in the SUM sample, we can derive a kinetic equation for [1O] as a function of DOC (Eq. S8), which is analogous to Eq. (11) and is derived in Sect. S2. This equation gives a good fit to the SUM data, as shown by the dashed red line in Fig. 2d. From the parameter b, we calculate that the rate constant for DOC reacting and physically quenching 1O-producing triplet states () is 2.1 (± 0.3) × 107 L (mol C)−1 s−1. This is lower than the values acquired from [3C*]SYR and [3C*]PTA, which is reasonable since the 1O-derived value represents the whole triplet pool (i.e., all triplets that can undergo energy transfer with dissolved oxygen), which is a larger pool than oxidizing triplets. Our results suggest that the non-oxidizing triplets are less reactive with organics than are oxidizing triplets, leading to a lower rate constant for reaction and quenching by DOC, as seen previously by Canonica et al. (2000).
3.4 Extrapolating photooxidant concentrations to ALW conditions
In the dilution experiments above, we investigated oxidant kinetics and concentrations as a function of the concentration factor, i.e., particle mass water mass ratio. In this section we extrapolate these relationships from our dilute extract conditions (with PM mass water mass ratios of (0.04–1.6) × 10−3 µg PM µg H2O) to the much more concentrated conditions of aerosol liquid water (up to ∼ 1 µg PM µg H2O).
3.4.1 Hydroxyl radicals in ALW
To estimate [•OH] in particle water for WIN, we apply the linear relationships of POH and with DOC that we determined in our extracts (Fig. 3a), along with the relationship of [DOC] to the particle mass water mass ratio, to predict kinetics under more concentrated particle water conditions. Parameters used in the extrapolation are provided in Table S11. Extrapolating to an ALW of 1 µg PM µg H2O yields an estimated POH of 2.7 × 10⁻⁵ M s−1 and of 5.0 × 10⁹ s−1. However, since our aqueous experiments do not include •OH transferred from the gas phase (POH,gas), we added POH,gas estimated by Kaur et al. (2019) to our extrapolated POH to calculate POH,tot. We then estimate [•OH] as POH,tot divided by (Eq. 10). Estimating [•OH] for the SUM sample is more complicated, since POH initially increases with DOC squared. We simulate the •OH production rate as a function of DOC by using photo-Fenton reaction rate constants and setting soluble iron and hydrogen peroxide concentrations to fit measured values (Sect. S3). We then apply this simple model to predict POH for SUM from fog/cloud to ALW conditions. For in SUM, we use the measured linear dependence on DOC (Fig. 3b).
Figure 4a shows the predicted hydroxyl radical steady-state concentrations for SUM and WIN across a wide range of liquid water content, from dilute cloud/fog drops to concentrated aqueous particle conditions. We also include the winter PM •OH predictions from Kaur et al. (2019) for comparison. For WIN, [•OH] slowly decreases from 1 × 10⁻¹⁴ M in cloud/fog waters (at 3 × 10⁻⁵ µg PM µg H2O) to 6 × 10⁻¹⁵ M in ALW (at 1 µg PM µg H2O). Calculated [•OH] values are higher than measured values, especially under the most dilute conditions, because •OH from gas-phase mass transfer is included in our extrapolation. The •OH trend for WIN is consistent with the result of Kaur et al. (2019), but our concentrations are 6–12 times higher. This is because WIN has a slope of POH vs. DOC around 4 times higher than that in Kaur et al. (2019), while the slope for in WIN is slightly lower (Fig. 3a). For our winter sample under dilute conditions, aqueous processes are as important an •OH source as gas-phase transfer (Fig. 4b). However, the aqueous production rate rises more rapidly with PM mass concentration than does gas-phase mass transfer, making aqueous reactions the dominant source of •OH under ALW conditions, where they account for more than 90 % of •OH production. This slower increase in POH,gas is also responsible for the decreasing [•OH] with increasing PM mass concentration.
For SUM, predicted [•OH] is approximately constant at 4 × 10⁻¹⁵ M under dilute conditions (Fig. 4a), with gas-phase mass transport being the major source of •OH (Fig. 4c). [•OH] then increases to 1 × 10⁻¹⁴ M at 1 × 10⁻³ µg PM µg H2O as the aqueous production rate (POH,aq) increases rapidly and aqueous reactions dominate •OH production. When moving to more concentrated conditions, [•OH] plateaus because we assume the aqueous H2O2 concentration reaches a maximum of 100 µM due to equilibrium with the gas phase (Sect. S3). Thereafter, POH,aq increases linearly, but more slowly, with the PM mass water mass ratio; since also increases linearly with the concentration factor, [•OH] remains nearly constant at 9 × 10⁻¹⁵ M for PM water ratios of roughly 10−3 to 1 µg PM µg H2O. For both WIN and SUM, our measured •OH concentrations in the most concentrated extracts are approximately an order of magnitude higher than in Kaur et al. (2019), and this difference is maintained throughout the predicted [•OH] to ambient particle water conditions.
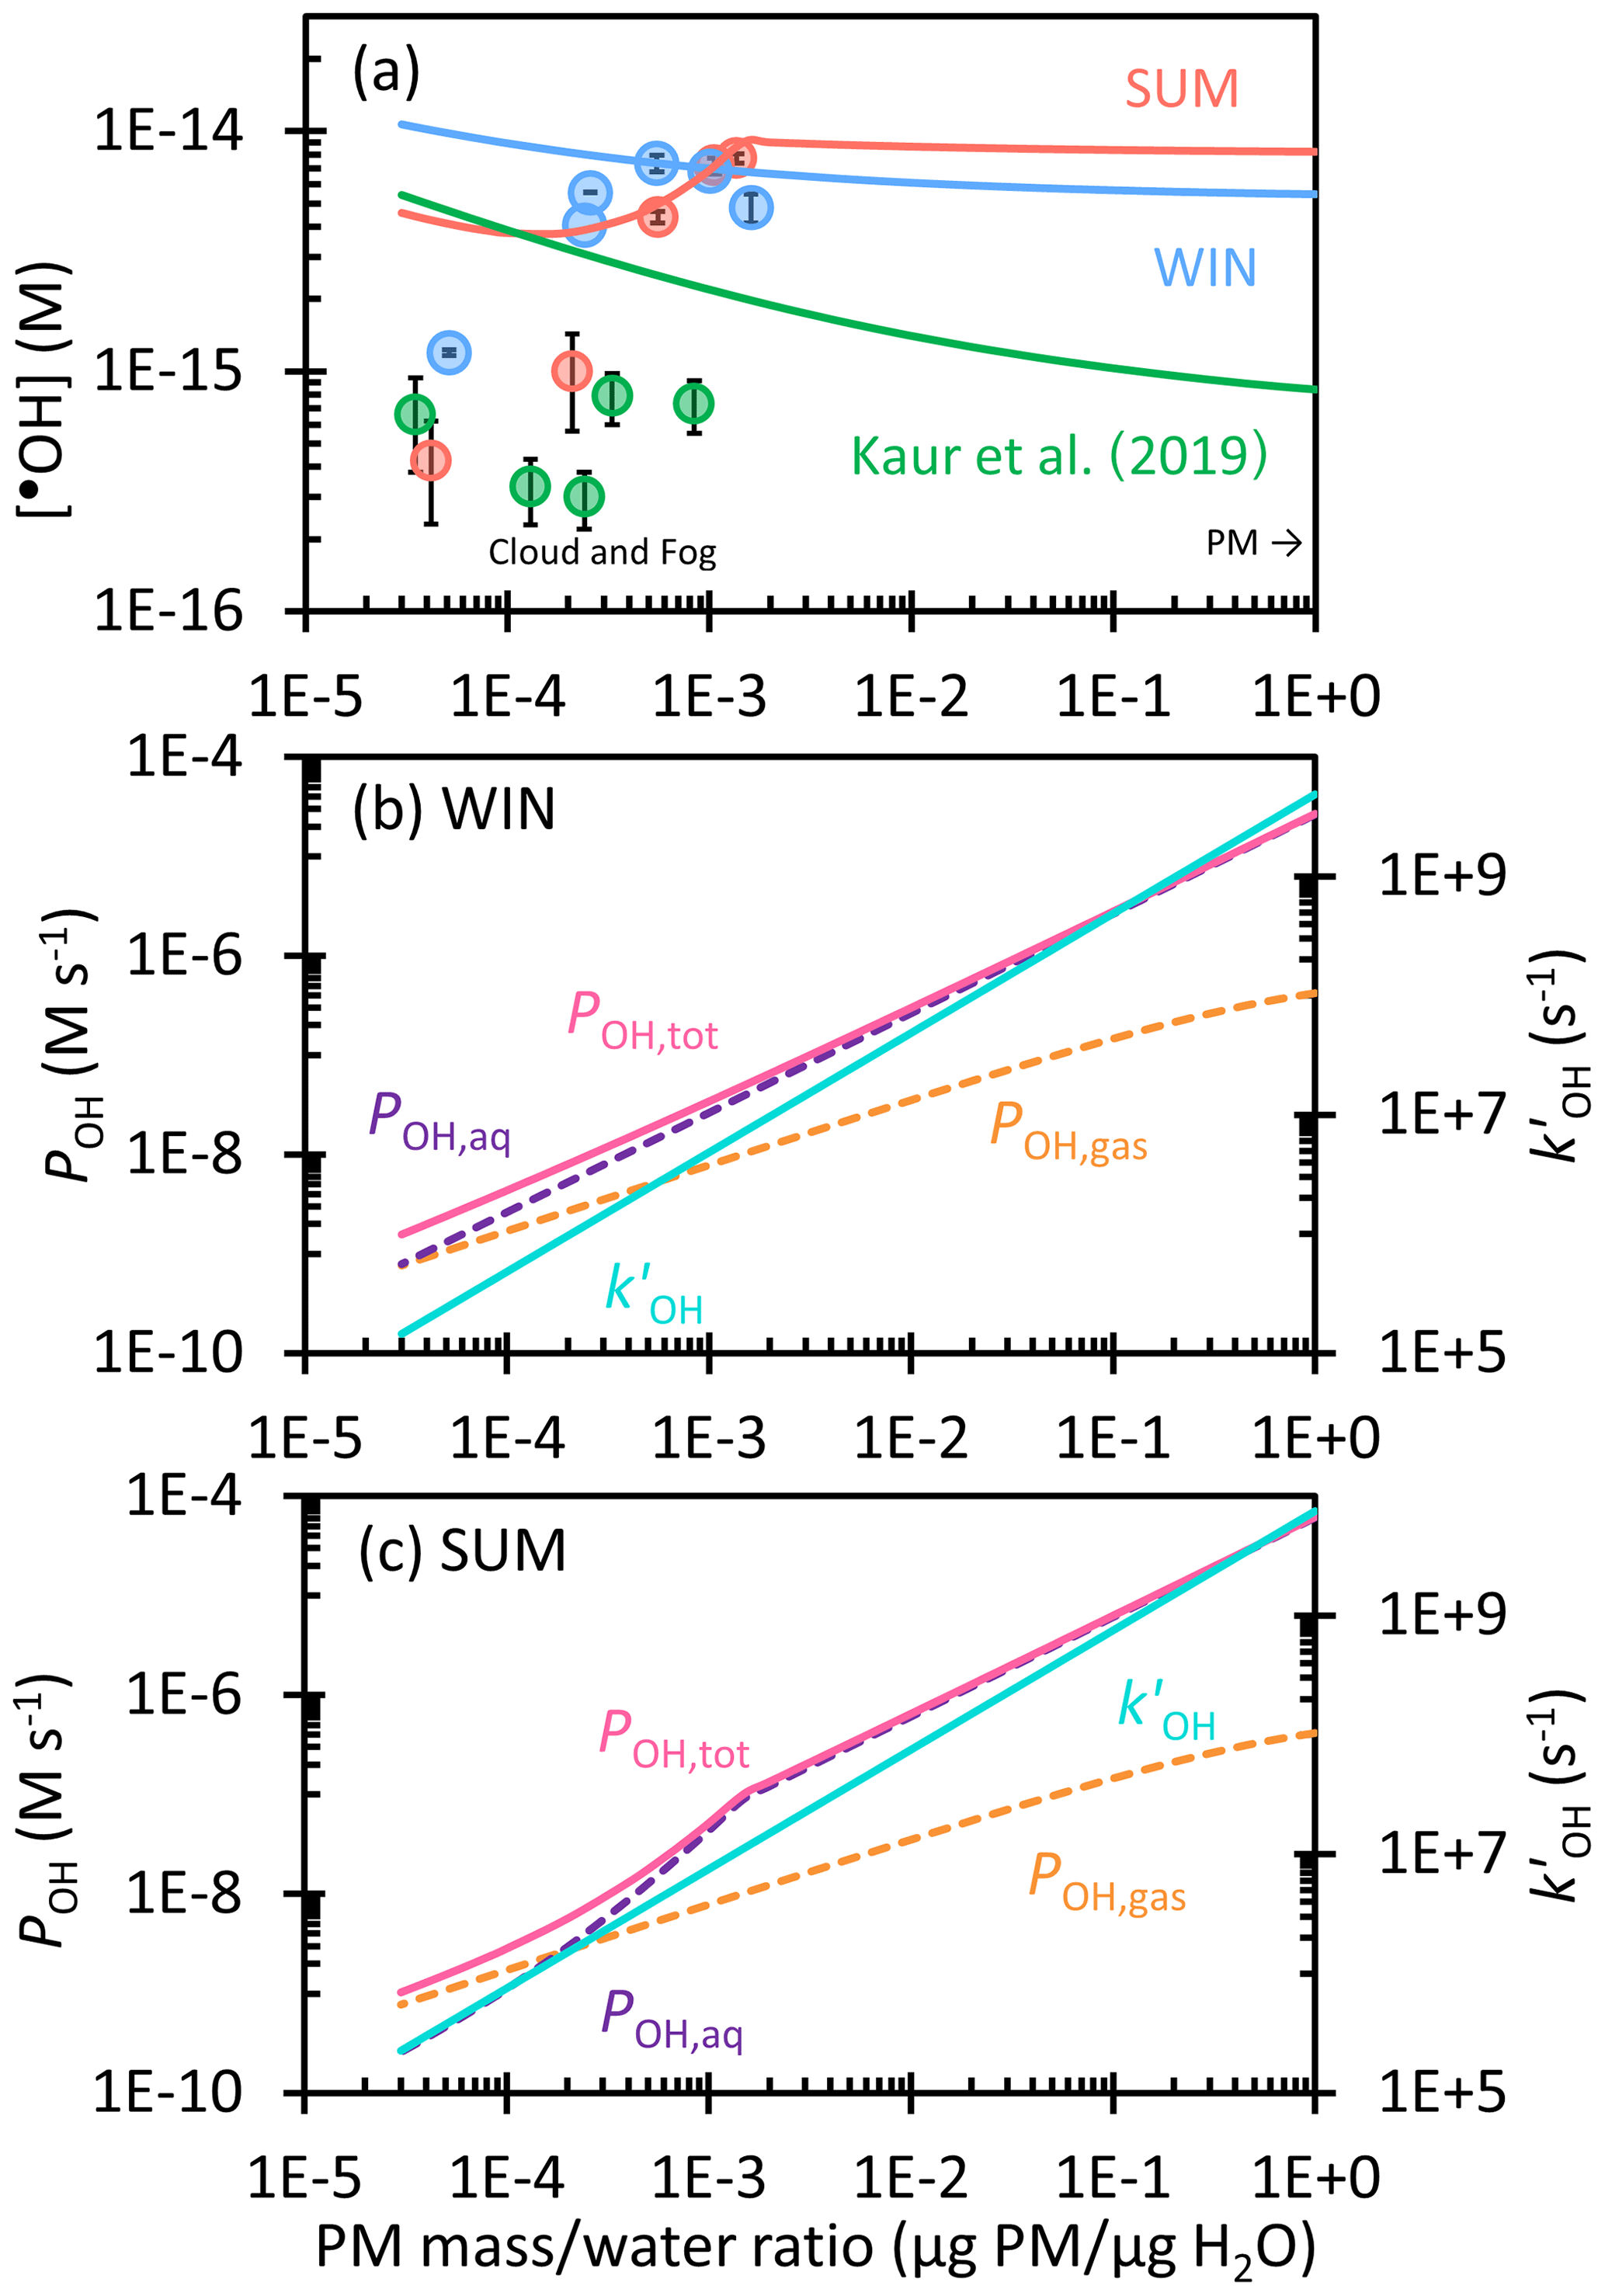
Figure 4(a) Dependence of hydroxyl radical concentration on the particle mass water mass ratio in winter (blue) and summer (red) extracts. Solid circles are measured values, while lines are extrapolations to the ambient aqueous aerosol conditions, including contributions from aqueous •OH formation and •OH mass transport from the gas phase. Previous measurements and extrapolation with Davis winter particle extracts are shown in green (Kaur et al., 2019). (b, c) Dependence of the hydroxyl radical production rate, including the rate of transport from the gas phase (POH,gas, orange), aqueous reaction (POH,aq, purple), and the total rate (, pink), and the rate constant of •OH loss by natural sinks (, blue) on the particle mass water mass ratio for (b) WIN and (c) SUM.
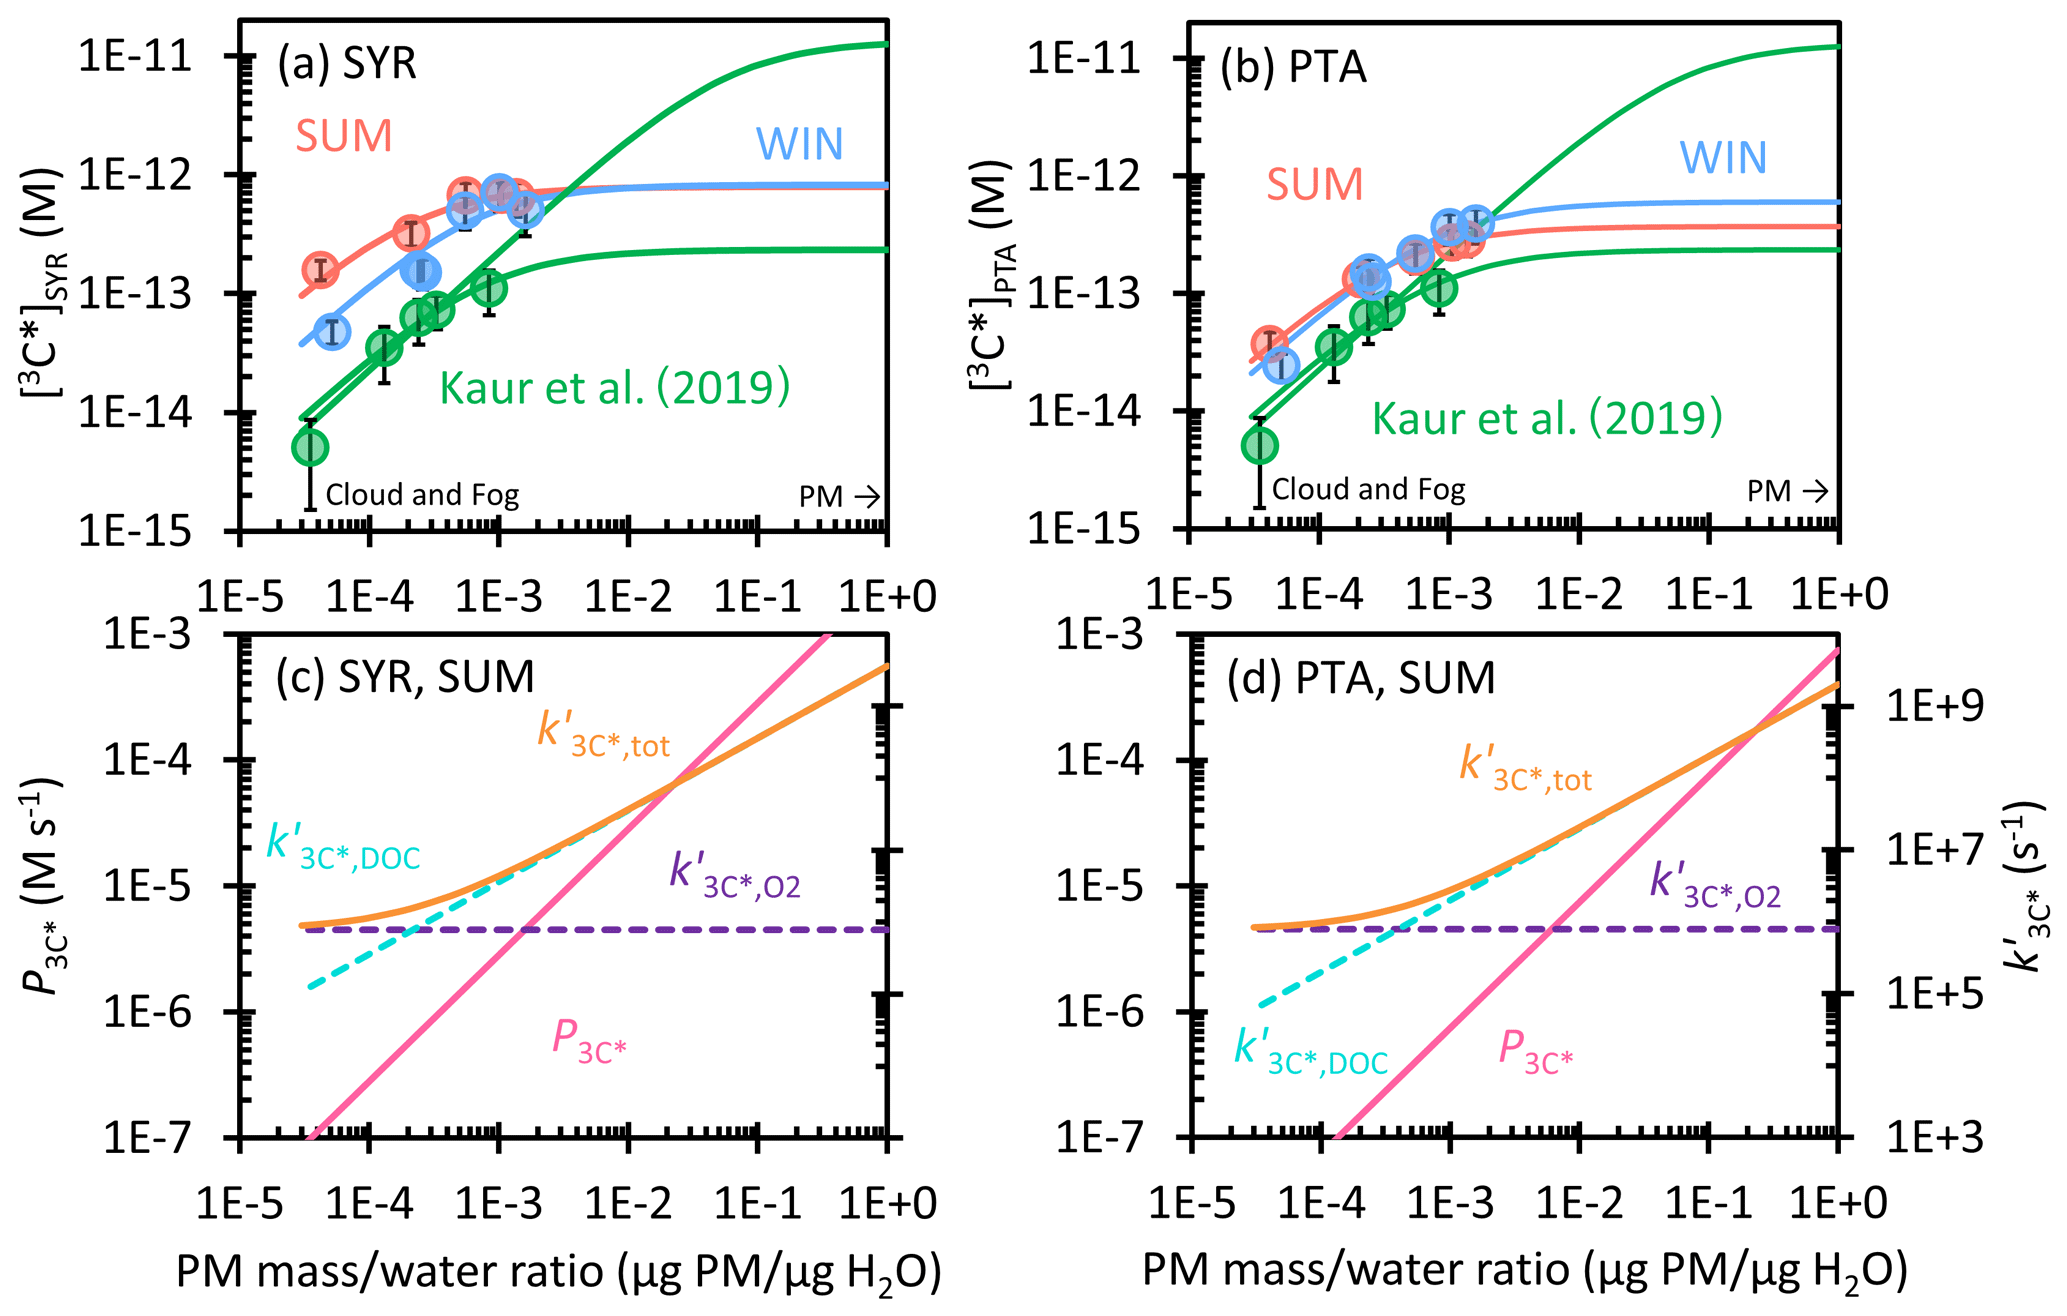
Figure 5(a, b) Dependence of triplet excited state concentration determined by (a) SYR and (b) PTA on the particle mass water mass ratio in WIN (blue) and SUM (red). Solid circles are measured values in dilution experiments, while lines are extrapolations to ALW conditions. Previous measurements and extrapolations (best fit and high estimate) for Davis winter particle extracts are in green (Kaur et al., 2019). (c, d) The triplet production rate (, pink line) and first-order rate constants for 3C* loss, including quenching by oxygen (, dashed purple), dissolved organic carbon (, dashed blue), and total (, orange) determined by (c) SYR and (d) PTA for SUM. Figure S5 shows and for WIN.
3.4.2 Oxidizing triplet concentrations in ALW
To predict 3C* concentrations in aerosol liquid water, we used the data in Table S11 to extrapolate 3C* production rates () and sinks () to concentrated conditions and calculated 3C* concentrations for syringol (SYR) and (phenylthio)acetic acid (PTA) with Eq. (10). As shown in Fig. 5a and b, measured [3C*] values in SUM and WIN are higher than the results in Kaur et al. (2019) at the same particle mass water mass ratio. This is likely due to higher ratios of OC PM in our samples. In all three sets of samples, [3C*] rises rapidly with the PM mass water mass ratio at low DOC and then reaches or approaches a plateau under aqueous aerosol conditions, as the dominant triplet sink transitions from dissolved O2 to DOC. We believe the production rate of 3C* linearly increases with particle mass water mass ratio ( in Fig. 5c and d), but the sinks for triplets change, as proposed by Kaur et al. (2019). Under dilute conditions, O2 is a dominant and constant sink (), causing [3C*] to increase with an increasing concentration factor. But for our more concentrated extracts (and continuing at higher PM mass water mass ratios), organic compounds become the major sink for 3C* (Fig. 5c and d). Thus the ratio of the production rate and sink rate constant becomes constant at higher DOC, causing [3C*] to plateau. For SYR, we predict WIN and SUM both reach a maximum value of 8 × 10⁻¹³ M at 1 µg PM µg H2O. This value is 22 times higher than the concentration under the most dilute conditions in WIN and around 8 times higher than the dilute result in SUM. While SUM starts with a higher [3C*]SYR under dilute conditions, it experiences greater curvature than WIN, apparently because its organic compounds react with and/or physically quench oxidizing triplets more rapidly (i.e., is larger for SUM than WIN). For both samples, the ALW prediction for [3C*]SYR is near the geometric mean of the two bounding fits of Kaur et al. (2019). For the lower 3C* concentrations determined by PTA, SUM and WIN start with essentially the same [3C*]PTA value, 3 × 10⁻¹⁴ and 2 × 10⁻¹⁴ M, respectively, at 3 × 10⁻⁵ µg PM µg H2O. SUM exhibits more curvature, as seen for [3C*]SYR, leading to a lower predicted [3C*]PTA at 1 µg PM µg H2O: 4 × 10⁻¹³ M for SUM vs. 6 × 10⁻¹³ M for WIN. For SUM and WIN, [3C*]PTA increases by factors of 14 and 29, respectively, from the most dilute condition to the ALW condition, which is similar to [3C*]SYR.
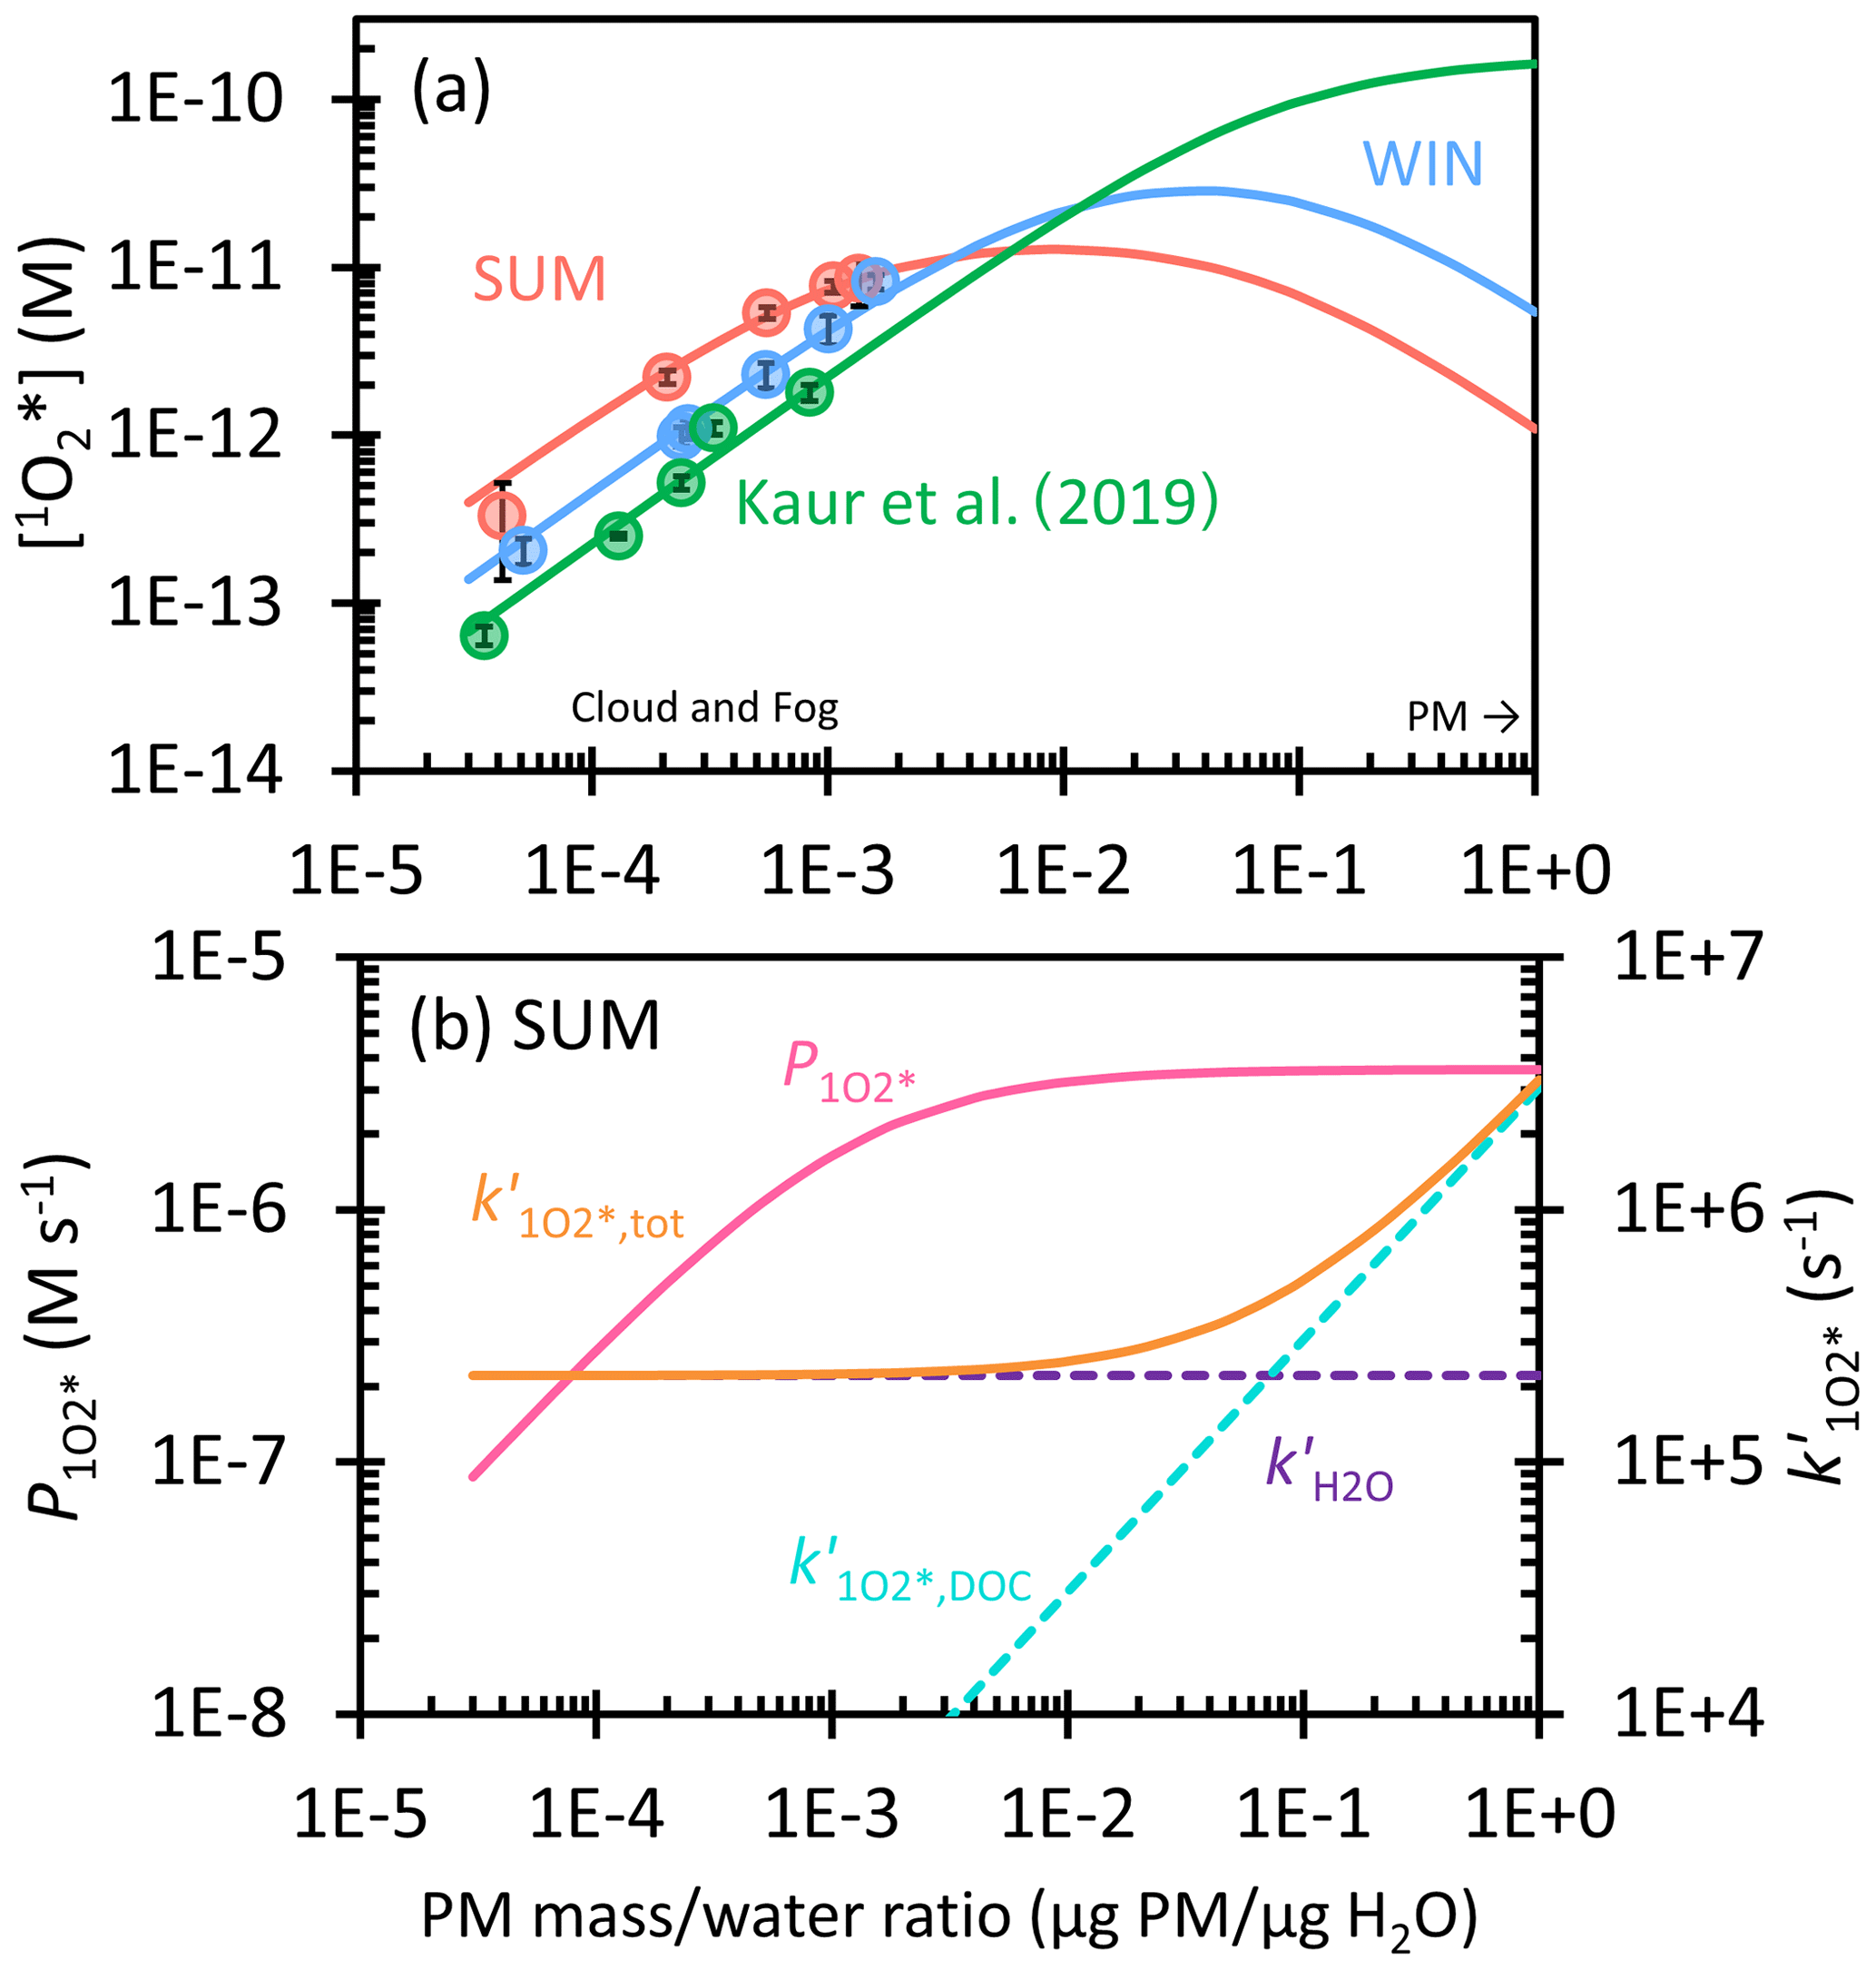
Figure 6(a) Dependence of singlet molecular oxygen concentration on the particle mass water mass ratio in winter (blue) and summer (red) samples. Solid circles are measured values in dilution experiments, while lines are extrapolations to ALW conditions. Previous measurements and extrapolation with Davis winter particle extracts are in green (Kaur et al., 2019). (b) Dependence of singlet oxygen production rate (, pink line) and the rate constant for 1O loss, including deactivation by water (, dashed purple), quenching by dissolved organic carbon (, dashed blue), and the total sink (, orange) on the particle mass water mass ratio for SUM. Figure S7 shows and for the winter sample.
3.4.3 Singlet molecular oxygen in ALW
Lastly, we consider the extrapolation of 1O concentrations from our dilute experimental solutions to ALW conditions. To do this, we consider the production of 1O by 3C* as well as H2O and DOM as sinks for singlet oxygen. In terms of 1O sources, we first assume the O2 concentration is constant at all conditions, i.e., not considering a solute effect on O2 solubility. Next, we assume the plateauing of [3C*] at high concentration factors results in a plateauing of the 1O production rate, as evidenced in the curvature of [1O] in SUM (Fig. 2d). To account for this effect, we fit [1O] versus DOC using an equation analogous to Eq. (11) and calculate the 1O production rate () with the fitted parameters (Eq. S11). This process does not work for WIN, however, since it shows no curvature of [1O]. So to predict the 3C* effect for this sample, we adjusted the regression parameters so that the fitted line passed through just the first four data points (Fig. S6). In terms of modeling DOM as a sink for 1O, this effect does not appear in our lab extracts (due to their relatively low DOC content), but we expect it would happen under more concentrated conditions. To incorporate this effect, we estimated the second-order rate constant for loss of 1O by DOC () using the same approach as in Kaur et al. (2019) but determined a lower value (1 × 10⁵ L (mol C)−1 s−1) based on our 1O concentration data versus DOC. We then calculate the first-order sink for 1O due to DOC as the product of this second-order rate constant and the DOC concentration.
The resulting predictions for 1O concentrations, along with the production rate and sink rate constants for the summer sample, are in Fig. 6. Figure 6a shows that our predictions of 1O under ALW conditions are roughly 10 to 100 times lower than those in Kaur et al. (2019); this is because we include the effect of plateauing 3C* concentration on the 1O production rate, which decreases 1O concentrations under ALW conditions. In Fig. 6a, [1O] for SUM starts at 4 × 10⁻¹³ M in dilute drops, peaks at 1 × 10⁻¹¹ M at 1.0 × 10⁻² µg PM µg H2O (where first plateaus; Fig. 6b), and then starts to decrease. This decrease is because the production rate for 1O () is constant while the 1O sink from DOC () increases with particle mass concentration and becomes the dominant 1O sink; the result is a singlet oxygen concentration of 1 × 10⁻¹² M at 1 µg PM µg H2O. This concentration is only 1.4 times higher than [3C*]SYR under the same conditions (Fig. S8). For WIN, [1O] starts at 1 × 10⁻¹³ M in dilute drops, reaches a maximum of 3 × 10⁻¹¹ M at 4.0 × 10⁻² µg PM µg H2O, and then decreases to 5 × 10⁻¹² M at 1 µg PM µg H2O (Fig. S7). Under ALW conditions, WIN has a maximum [1O] that is 3 times higher than SUM because measured [1O] in WIN presents much less curvature than SUM; i.e., the organics in WIN appear to be less reactive with 1O-producing triplet states compared to those in the SUM sample. Therefore, the plateau of in WIN shows up only under more concentrated conditions compared to SUM (Fig. S7).
We measured concentrations of three photooxidants – hydroxyl radicals, oxidizing triplet excited states of organic matter, and singlet molecular oxygen – as a function of particle dilution in aqueous extracts of winter particles (influenced by residential wood combustion) and summer particles (strongly influenced by wildfires). The extracts contain high amounts of organic matter, with dissolved organic carbon concentrations ranging from 10 to 495 mg C L−1. DOC-normalized mass absorption coefficients at 300 nm are 2.1 (± 0.2) m2 (g C)−1 in winter and 3.1 (± 0.1) m2 (g C)−1 in summer, with absorption Ångström exponents of 7.2 for both, indicating significant amounts of brown carbon.
In the winter sample, the measured •OH concentration appears to be independent of extract concentration, while in the summer sample •OH increases with the concentration factor. In both WIN and SUM, measured 3C* concentrations determined by our two probes initially increase rapidly with the concentration factor and then approach or reach a plateau under more concentrated conditions. Measured 1O concentrations in WIN are linear with DOC, while in SUM singlet oxygen levels show curvature (like 3C*) in more concentrated extracts. By extrapolating the oxidant kinetics in our dilute extracts to the much more concentrated conditions of ambient particle water (1 µg PM µg H2O), we obtain photooxidant concentrations of [•OH] = (6–9) × 10−15 M, [3C*] = (4–8) × 10−13 M, and [1O] = (1–5) × 10−12 M. The •OH particle water concentrations are not significantly different from those in fog/cloud waters, while [3C*] and [1O] are 10–30 and 3–40 times higher, respectively, than fog/cloud values (at 3 × 10⁻⁵ µg PM µg H2O). The ratio of concentrations of 1OCOH in aerosol liquid water is 103–10, which is lower than the 105:104–102:1 ALW ratio predicted by Kaur et al. (2019). This is because our predicted ALW concentration of •OH is approximately 10 times higher than in this past work, while 3C* is around 5 times higher than their best fit, and 1O is 30–150 times lower than their prediction (Fig. S8). Kaur et al. (2019) discussed the large uncertainties in predicting 1O and 3C* for ALW conditions, in part because of the difficulty in experimentally observing the interactions between DOC and 3C* or 1O. However, in this current work, we are able to clearly see triplet quenching by DOC, since organic carbon concentrations in our particle water extracts were up to 5 times higher than in the past work. When extrapolating to more concentrated conditions, we predict 3C* concentrations are heavily suppressed due to quenching by DOC, resulting in triplet concentrations that are between the two estimates from Kaur et al. (2019). For the first time, we also see curvature in [1O] versus DOC in our most concentrated summer extracts, which appears to result from suppression of triplets by organics. With this experimental finding, we are able to include this effect in the prediction of 1O concentrations under particle water conditions.
While our samples have higher DOC than the dilution sample in Kaur et al. (2019), our extrapolations from dilute extracts to ALW still span a huge range (approximately a factor of 600 in the PM mass water mass ratio), bringing significant uncertainties. For example, it is unclear whether an appreciable portion of the organic compounds will precipitate under the much more concentrated conditions of ALW. In terms of experimental uncertainties, we could not observe how efficiently organic matter quenches 1O and thus were only able to estimate an upper bound of the rate constant, which is poorly constrained. In addition, highly concentrated particle extracts make it difficult to measure 3C* by SYR because of strong inhibition by dissolved organic matter, with inhibition corrections of up to a factor of 7.5 in our samples. Additionally, the difficulty in inhibition factor measurements (and resulting high uncertainties) in concentrated extracts can bring large uncertainties. High DOC concentrations also result in significant light screening, which carries additional uncertainty in the corresponding correction. While future work could use more concentrated particle extracts to reduce the extrapolation uncertainty, this approach would likely increase other uncertainties, including light screening and probe inhibition. Also, it is unlikely that the bulk solution approach that we have used can ever approach the concentration conditions in particle water. Because of this, other approaches, such as flow tubes or reaction chambers, will be required to more closely simulate oxidant generation and their subsequent reactions in ambient aerosols.
All data are available upon request.
The supplement related to this article is available online at: https://doi.org/10.5194/acp-23-8805-2023-supplement.
CA and LM developed the research goals and designed the experiments. KJB lent and set up the PM sampler, while LM and CG collected samples. LM and RL performed the photochemistry experiments, while WJ and CN analyzed OC and ions, respectively. LM analyzed the data and prepared the manuscript with contributions from all co-authors. CA reviewed, wrote portions of, and edited the manuscript. CA and QZ provided supervision and oversight during the experiments and writing.
The contact author has declared that none of the authors has any competing interests.
Publisher’s note: Copernicus Publications remains neutral with regard to jurisdictional claims in published maps and institutional affiliations.
This research has been supported by the National Science Foundation (grant nos. 1649212 and 2220307); the California Agricultural Experiment Station (projects CA-D-LAW-6403-RR and CA-D-ETX-2102-H); and the University of California, Davis (Donald G. Crosby Graduate Fellowships in Environmental Chemistry and Jastro–Shields Research Awards).
This paper was edited by Theodora Nah and reviewed by three anonymous referees.
Albinet, A., Minero, C., and Vione, D.: Photochemical generation of reactive species upon irradiation of rainwater: negligible photoactivity of dissolved organic matter, Sci. Total Environ., 408, 3367–3373, https://doi.org/10.1016/j.scitotenv.2010.04.011, 2010.
Anastasio, C. and McGregor, K. G.: Chemistry of fog waters in California's Central Valley: 1. In situ photoformation of hydroxyl radical and singlet molecular oxygen, Atmos. Environ., 35, 1079–1089, https://doi.org/10.1016/S1352-2310(00)00281-8, 2001.
Anastasio, C. and Newberg, J. T.: Sources and sinks of hydroxyl radical in sea-salt particles, J. Geophys. Res., 112, D10306, https://doi.org/10.1029/2006JD008061, 2007.
Andreae, M. O.: Soot carbon and excess fine potassium: long-range transport of combustion-derived aerosols, Science, 220, 1148–1151, https://doi.org/10.1126/science.220.4602.1148, 1983.
Appiani, E., Ossola, R., Latch, D. E., Erickson, P. R., and McNeill, K.: Aqueous singlet oxygen reaction kinetics of furfuryl alcohol: effect of temperature, pH, and salt content, Environ. Sci. Process. Impacts, 19, 507–516, https://doi.org/10.1039/C6EM00646A, 2017.
Arakaki, T., Anastasio, C., Kuroki, Y., Nakajima, H., Okada, K., Kotani, Y., Handa, D., Azechi, S., Kimura, T., Tsuhako, A., and Miyagi, Y.: A general scavenging rate constant for reaction of hydroxyl radical with organic carbon in atmospheric waters, Environ. Sci. Technol., 47, 8196–8203, https://doi.org/10.1021/es401927b, 2013.
Arakaki, T. and Faust, B. C.: Sources, sinks, and mechanisms of hydroxyl radical (OH) photoproduction and consumption in authentic acidic continental cloud waters from Whiteface Mountain, New York, The role of the Fe(r) (r = II, III) photochemical cycle, J. Geophys. Res., 103, 3487–3504, https://doi.org/10.1029/97JD02795, 1998.
Arciva, S., Niedek, C., Mavis, C., Yoon, M., Sanchez, M. E., Zhang, Q., and Anastasio, C.: Aqueous •OH oxidation of highly substituted phenols as a source of secondary organic aerosol, Environ. Sci. Technol., 56, 9959–9967, https://doi.org/10.1021/acs.est.2c02225, 2022.
Arnold, W. A.: One electron oxidation potential as a predictor of rate constants of N-containing compounds with carbonate radical and triplet excited state organic matter, Environ. Sci. Process. Impacts, 16, 832–838, https://doi.org/10.1039/c3em00479a, 2014.
Ashton, L., Buxton, G. V., and Stuart, C. R.: Temperature dependence of the rate of reaction of OH with some aromatic compounds in aqueous solution. Evidence for the formation of a ð-complex intermediate?, J. Chem. Soc., 91, 1631–1633, https://doi.org/10.1039/FT9959101631, 1995.
Badali, K. M., Zhou, S., Aljawhary, D., Antiñolo, M., Chen, W. J., Lok, A., Mungall, E., Wong, J. P. S., Zhao, R., and Abbatt, J. P. D.: Formation of hydroxyl radicals from photolysis of secondary organic aerosol material, Atmos. Chem. Phys., 15, 7831–7840, https://doi.org/10.5194/acp-15-7831-2015, 2015.
Barrios, B., Mohrhardt, B., Doskey, P. V., and Minakata, D.: Mechanistic Insight into the Reactivities of Aqueous-Phase Singlet Oxygen with Organic Compounds, Environ. Sci. Technol., 55, 8054–8067, https://doi.org/10.1021/acs.est.1c01712, 2021.
Bilski, P., Holt, R. N., and Chignell, C. F.: Properties of singlet molecular oxygen in binary solvent mixtures of different polarity and proticity, J. Photochem. Photobiol. A, 109, 243–249, https://doi.org/10.1016/S1010-6030(97)00147-0, 1997.
Bogler, S., Daellenbach, K. R., Bell, D. M., Prévôt, A. S. H., El Haddad, I., and Borduas-Dedekind, N.: Singlet oxygen seasonality in aqueous PM10 is driven by biomass burning and anthropogenic secondary organic aerosol, Environ. Sci. Technol., 56, 15389–15397, https://doi.org/10.1021/acs.est.2c04554, 2022.
Canonica, S. and Freiburghaus, M.: Electron-rich phenols for probing the photochemical reactivity of freshwaters, Environ. Sci. Technol., 35, 690–695, https://doi.org/10.1021/es0011360, 2001.
Canonica, S., Hellrung, B., and Wirz, J.: Oxidation of phenols by triplet aromatic ketones in aqueous solution, J. Phys. Chem. A, 104, 1226–1232, 2000.
Canonica, S. and Laubscher, H.-U.: Inhibitory effect of dissolved organic matter on triplet-induced oxidation of aquatic contaminants, Photochem. Photobiol. Sci., 7, 547–551, https://doi.org/10.1039/b719982a, 2008.
Carlton, A. G., Christiansen, A. E., Flesch, M. M., Hennigan, C. J., and Sareen, N.: Mulitphase atmospheric chemistry in liquid water: impacts and controllability of organic aerosol, Acc. Chem. Res., 53, 1715–1723, https://doi.org/10.1021/acs.accounts.0c00301, 2020.
Chellamani, A. and Sengu, P.: Mechanistic study on the oxidation of (phenylthio)acetic acids by oxo(salen)manganese(V) complexes and the reactivity–selectivity principle, J. Mol. Catal. A, 283, 83–92, https://doi.org/10.1016/j.molcata.2007.12.004, 2008.
De Haan, D. O., Jansen, K., Rynaski, A. D., Sueme, W. R. P., Torkelson, A. K., Czer, E. T., Kim, A. K., Rafla, M. A., De Haan, A. C., and Tolbert, M. A.: Brown carbon production by aqueous-phase interactions of glyoxal and SO2, Environ. Sci. Technol., 54, 4781–4789, https://doi.org/10.1021/acs.est.9b07852, 2020.
Erickson, P. R., Moor, K. J., Werner, J. J., Latch, D. E., Arnold, W. A., and McNeill, K.: Singlet Oxygen Phosphorescence as a Probe for Triplet-State Dissolved Organic Matter Reactivity, Environ. Sci. Technol., 52, 9170–9178, https://doi.org/10.1021/acs.est.8b02379, 2018.
Ervens, B.: Progress and problems in modeling chemical processing in cloud droplets and wet aerosol particles, in: Multiphase environmental chemistry in the atmosphere, Vol. 1299, edited by: Hunt, S. W., Laskin, A., and Nizkorodov, S. A., ACS Symposium Series, Vol. 1299, 327–345, American Chemical Society, Washington, DC, ISBN 0841233632, 2018.
Ervens, B. and Volkamer, R.: Glyoxal processing by aerosol multiphase chemistry: towards a kinetic modeling framework of secondary organic aerosol formation in aqueous particles, Atmos. Chem. Phys., 10, 8219–8244, https://doi.org/10.5194/acp-10-8219-2010, 2010.
Ervens, B., Turpin, B. J., and Weber, R. J.: Secondary organic aerosol formation in cloud droplets and aqueous particles (aqSOA): a review of laboratory, field and model studies, Atmos. Chem. Phys., 11, 11069–11102, https://doi.org/10.5194/acp-11-11069-2011, 2011.
Ervens, B., Sorooshian, A., Lim, Y. B., and Turpin, B. J.: Key parameters controlling OH-initiated formation of secondary organic aerosol in the aqueous phase (aqSOA), J. Geophys. Res.-Atmos., 119, 3997–4016, https://doi.org/10.1002/2013JD021021, 2014.
Faust, B. C. and Allen, J. M.: Aqueous-phase photochemical sources of peroxyl radicals and singlet molecular oxygen in clouds and fog, J. Geophys. Res., 97, 12913, https://doi.org/10.1029/92JD00843, 1992.
Faust, B. C. and Allen, J. M.: Aqueous-phase photochemical formation of hydroxyl radical in authentic cloudwaters and fogwaters, Environ. Sci. Technol., 27, 1221–1224, https://doi.org/10.1021/es00043a024, 1993.
Faust, J. A., Wong, J. P. S., Lee, A. K. Y., and Abbatt, J. P. D.: Role of aerosol liquid water in secondary organic aerosol formation from volatile organic compounds, Environ. Sci. Technol., 51, 1405–1413, https://doi.org/10.1021/acs.est.6b04700, 2017.
Fleming, L. T., Lin, P., Roberts, J. M., Selimovic, V., Yokelson, R., Laskin, J., Laskin, A., and Nizkorodov, S. A.: Molecular composition and photochemical lifetimes of brown carbon chromophores in biomass burning organic aerosol, Atmos. Chem. Phys., 20, 1105–1129, https://doi.org/10.5194/acp-20-1105-2020, 2020.
Forrister, H., Liu, J., Scheuer, E., Dibb, J., Ziemba, L., Thornhill, K. L., Anderson, B., Diskin, G., Perring, A. E., Schwarz, J. P., Campuzano-Jost, P., Day, D. A., Palm, B. B., Jimenez, J. L., Nenes, A., and Weber, R. J.: Evolution of brown carbon in wildfire plumes, Geophys. Res. Lett., 42, 4623–4630, https://doi.org/10.1002/2015GL063897, 2015.
Galbavy, E. S., Ram, K., and Anastasio, C.: 2-Nitrobenzaldehyde as a chemical actinometer for solution and ice photochemistry, J. Photochem. Photobiol. A, 209, 186–192, https://doi.org/10.1016/j.jphotochem.2009.11.013, 2010.
Gemayel, R., Emmelin, C., Perrier, S., Tomaz, S., Baboomian, V. J., Fishman, D. A., Nizkorodov, S. A., Dumas, S., and George, C.: Quenching of ketone triplet excited states by atmospheric halides, Environ. Sci.-Atmos., 1, 31–44, https://doi.org/10.1039/D0EA00011F, 2021.
Gilardoni, S., Massoli, P., Paglione, M., Giulianelli, L., Carbone, C., Rinaldi, M., Decesari, S., Sandrini, S., Costabile, F., Gobbi, G. P., Pietrogrande, M. C., Visentin, M., Scotto, F., Fuzzi, S., and Facchini, M. C.: Direct observation of aqueous secondary organic aerosol from biomass-burning emissions, P. Natl. Acad. Sci. USA, 113, 10013–10018, https://doi.org/10.1073/pnas.1602212113, 2016.
González Palacios, L., Corral Arroyo, P., Aregahegn, K. Z., Steimer, S. S., Bartels-Rausch, T., Nozière, B., George, C., Ammann, M., and Volkamer, R.: Heterogeneous photochemistry of imidazole-2-carboxaldehyde: HO2 radical formation and aerosol growth, Atmos. Chem. Phys., 16, 11823–11836, https://doi.org/10.5194/acp-16-11823-2016, 2016.
Haag, W. R., Hoigné, J., Gassman, E., and Braun, A.: Singlet oxygen in surface waters – Part I: Furfuryl alcohol as a trapping agent, Chemosphere, 13, 631–640, https://doi.org/10.1016/0045-6535(84)90199-1, 1984.
Hecobian, A., Zhang, X., Zheng, M., Frank, N., Edgerton, E. S., and Weber, R. J.: Water-Soluble Organic Aerosol material and the light-absorption characteristics of aqueous extracts measured over the Southeastern United States, Atmos. Chem. Phys., 10, 5965–5977, https://doi.org/10.5194/acp-10-5965-2010, 2010.
Herrmann, H., Hoffmann, D., Schaefer, T., Bräuer, P., and Tilgner, A.: Tropospheric aqueous-phase free-radical chemistry: radical sources, spectra, reaction kinetics and prediction tools, ChemPhysChem, 11, 3796–3822, https://doi.org/10.1002/cphc.201000533, 2010.
Herrmann, H., Schaefer, T., Tilgner, A., Styler, S. A., Weller, C., Teich, M., and Otto, T.: Tropospheric aqueous-phase chemistry: kinetics, mechanisms, and its coupling to a changing gas phase, Chem. Rev., 115, 4259–4334, https://doi.org/10.1021/cr500447k, 2015.
Hoffer, A., Gelencsér, A., Guyon, P., Kiss, G., Schmid, O., Frank, G. P., Artaxo, P., and Andreae, M. O.: Optical properties of humic-like substances (HULIS) in biomass-burning aerosols, Atmos. Chem. Phys., 6 3563–3570, https://doi.org/10.5194/acp-6-3563-2006, 2006.
Hong, J., Liu, J., Wang, L., Kong, S., Tong, C., Qin, J., Chen, L., Sui, Y., and Li, B.: Characterization of reactive photoinduced species in rainwater, Environ. Sci. Pollut. Res. Int., 25, 36368–36380, https://doi.org/10.1007/s11356-018-3499-4, 2018.
Huo, Y., Guo, Z., Li, Q., Wu, D., Ding, X., Liu, A., Huang, D., Qiu, G., Wu, M., Zhao, Z., Sun, H., Song, W., Li, X., Chen, Y., Wu, T., and Chen, J.: Chemical fingerprinting of HULIS in particulate matters emitted from residential coal and biomass combustion, Environ. Sci. Technol., 55, 3593–3603, https://doi.org/10.1021/acs.est.0c08518, 2021.
Jiang, W., Ma, L., Niedek, C., Anastasio, C., and Zhang, Q.: Chemical and Light-Absorption Properties of Water-Soluble Organic Aerosols in Northern California and Photooxidant Production by Brown Carbon Components, ACS Earth Space Chem., 7, 1107–1119, https://doi.org/10.1021/acsearthspacechem.3c00022, 2023.
Kaur, R. and Anastasio, C.: Light absorption and the photoformation of hydroxyl radical and singlet oxygen in fog waters, Atmos. Environ., 164, 387–397, https://doi.org/10.1016/j.atmosenv.2017.06.006, 2017.
Kaur, R. and Anastasio, C.: First measurements of organic triplet excited states in atmospheric waters, Environ. Sci. Technol., 52, 5218–5226, https://doi.org/10.1021/acs.est.7b06699, 2018.
Kaur, R., Labins, J. R., Helbock, S. S., Jiang, W., Bein, K. J., Zhang, Q., and Anastasio, C.: Photooxidants from brown carbon and other chromophores in illuminated particle extracts, Atmos. Chem. Phys., 19, 6579–6594, https://doi.org/10.5194/acp-19-6579-2019, 2019.
Klein, E., Lukeš, V., Cibulková, Z., and Polovková, J.: Study of N–H, O–H, and S–H bond dissociation enthalpies and ionization potentials of substituted anilines, phenols, and thiophenols, J. Mol. Struct.-Theochem., 758, 149–159, https://doi.org/10.1016/j.theochem.2005.10.015, 2006.
Leresche, F., Salazar, J. R., Pfotenhauer, D. J., Hannigan, M. P., Majestic, B. J., and Rosario-Ortiz, F. L.: Photochemical aging of atmospheric particulate matter in the aqueous phase, Environ. Sci. Technol., 55, 13152–13163, https://doi.org/10.1021/acs.est.1c00978, 2021.
Li, J., Chen, Q., Sha, T., and Liu, Y.: Significant promotion of light absorption ability and formation of triplet organics and reactive oxygen species in atmospheric HULIS by fe(iii) ions, Environ. Sci. Technol., 56, 16652–16664, https://doi.org/10.1021/acs.est.2c05137, 2022.
Li, M., Bao, F., Zhang, Y., Sheng, H., Chen, C., and Zhao, J.: Photochemical aging of soot in the aqueous phase: release of dissolved black carbon and the formation of 1O2, Environ. Sci. Technol., 53, 12311–12319, https://doi.org/10.1021/acs.est.9b02773, 2019.
Lim, Y. B., Tan, Y., Perri, M. J., Seitzinger, S. P., and Turpin, B. J.: Aqueous chemistry and its role in secondary organic aerosol (SOA) formation, Atmos. Chem. Phys., 10, 10521–10539, https://doi.org/10.5194/acp-10-10521-2010, 2010.
Lin, G., Sillman, S., Penner, J. E., and Ito, A.: Global modeling of SOA: the use of different mechanisms for aqueous-phase formation, Atmos. Chem. Phys., 14, 5451–5475, https://doi.org/10.5194/acp-14-5451-2014, 2014.
Ma, L., Guzman, C., Niedek, C., Tran, T., Zhang, Q., and Anastasio, C.: Kinetics and mass yields of aqueous secondary organic aerosol from highly substituted phenols reacting with a triplet excited state, Environ. Sci. Technol., 55, 5772–5781, https://doi.org/10.1021/acs.est.1c00575, 2021.
Ma, L., Worland, R., Heinlein, L., Guzman, C., Jiang, W., Niedek, C., Bein, K. J., Zhang, Q., and Anastasio, C.: Seasonal variations in photooxidant formation and light absorption in aqueous extracts of ambient particles, EGUsphere [preprint], https://doi.org/10.5194/egusphere-2023-861, 2023a.
Ma, L., Worland, R., Tran, T., and Anastasio, C.: Evaluation of probes to measure oxidizing organic triplet excited states in aerosol liquid water, Environ. Sci. Technol., 57, 6052–6062, https://doi.org/10.1021/acs.est.2c09672, 2023b.
Maizel, A. C. and Remucal, C. K.: The effect of probe choice and solution conditions on the apparent photoreactivity of dissolved organic matter, Environ. Sci. Process. Impacts, 19, 1040–1050, https://doi.org/10.1039/c7em00235a, 2017.
Manfrin, A., Nizkorodov, S. A., Malecha, K. T., Getzinger, G. J., McNeill, K., and Borduas-Dedekind, N.: Reactive oxygen species production from secondary organic aerosols: the importance of singlet oxygen, Environ. Sci. Technol., 53, 8553–8562, https://doi.org/10.1021/acs.est.9b01609, 2019.
McCabe, A. J. and Arnold, W. A.: Reactivity of triplet excited states of dissolved natural organic matter in stormflow from mixed-use watersheds, Environ. Sci. Technol., 51, 9718–9728, https://doi.org/10.1021/acs.est.7b01914, 2017.
McNeill, K. and Canonica, S.: Triplet state dissolved organic matter in aquatic photochemistry: reaction mechanisms, substrate scope, and photophysical properties, Environ. Sci. Process. Impacts, 18, 1381–1399, https://doi.org/10.1039/c6em00408c, 2016.
McNeill, V. F.: Aqueous organic chemistry in the atmosphere: sources and chemical processing of organic aerosols, Environ. Sci. Technol., 49, 1237–1244, https://doi.org/10.1021/es5043707, 2015.
Mekic, M., Brigante, M., Vione, D., and Gligorovski, S.: Exploring the ionic strength effects on the photochemical degradation of pyruvic acid in atmospheric deliquescent aerosol particles, Atmos. Environ., 185, 237–242, https://doi.org/10.1016/j.atmosenv.2018.05.016, 2018.
Monge, M. E., Rosenørn, T., Favez, O., Müller, M., Adler, G., Abo Riziq, A., Rudich, Y., Herrmann, H., George, C., and D'Anna, B.: Alternative pathway for atmospheric particles growth, P. Natl. Acad. Sci. USA, 109, 6840–6844, https://doi.org/10.1073/pnas.1120593109, 2012.
Ossola, R., Jönsson, O. M., Moor, K., and McNeill, K.: Singlet oxygen quantum yields in environmental waters, Chem. Rev., 121, 4100–4146, https://doi.org/10.1021/acs.chemrev.0c00781, 2021.
Parworth, C. L., Young, D. E., Kim, H., Zhang, X., Cappa, C. D., Collier, S., and Zhang, Q.: Wintertime water-soluble aerosol composition and particle water content in Fresno, California, J. Geophys. Res.-Atmos., 122, 3155–3170, https://doi.org/10.1002/2016JD026173, 2017.
Paulson, S. E., Gallimore, P. J., Kuang, X. M., Chen, J. R., Kalberer, M., and Gonzalez, D. H.: A light-driven burst of hydroxyl radicals dominates oxidation chemistry in newly activated cloud droplets, Sci. Adv., 5, eaav7689, https://doi.org/10.1126/sciadv.aav7689, 2019.
Reid, J. S., Koppmann, R., Eck, T. F., and Eleuterio, D. P.: A review of biomass burning emissions part II: intensive physical properties of biomass burning particles, Atmos. Chem. Phys., 5, 799–825, https://doi.org/10.5194/acp-5-799-2005, 2005.
Renard, P., Reed Harris, A. E., Rapf, R. J., Ravier, S., Demelas, C., Coulomb, B., Quivet, E., Vaida, V., and Monod, A.: Aqueous phase oligomerization of methyl vinyl ketone by atmospheric radical reactions, J. Phys. Chem. C, 118, 29421–29430, https://doi.org/10.1021/jp5065598, 2014.
Rossignol, S., Aregahegn, K. Z., Tinel, L., Fine, L., Nozière, B., and George, C.: Glyoxal induced atmospheric photosensitized chemistry leading to organic aerosol growth, Environ. Sci. Technol., 48, 3218–3227, https://doi.org/10.1021/es405581g, 2014.
Schauer, J. J., Kleeman, M. J., Cass, G. R., and Simoneit, B. R.: Measurement of emissions from air pollution sources. 3. C1–C29 organic compounds from fireplace combustion of wood, Environ. Sci. Technol., 35, 1716–1728, https://doi.org/10.1021/es001331e, 2001.
Smith, J. D., Sio, V., Yu, L., Zhang, Q., and Anastasio, C.: Secondary organic aerosol production from aqueous reactions of atmospheric phenols with an organic triplet excited state, Environ. Sci. Technol., 48, 1049–1057, https://doi.org/10.1021/es4045715, 2014.
Tan, Y., Lim, Y. B., Altieri, K. E., Seitzinger, S. P., and Turpin, B. J.: Mechanisms leading to oligomers and SOA through aqueous photooxidation: insights from OH radical oxidation of acetic acid and methylglyoxal, Atmos. Chem. Phys., 12, 801–813, https://doi.org/10.5194/acp-12-801-2012, 2012.
Tilgner, A., Bräuer, P., Wolke, R., and Herrmann, H.: Modelling multiphase chemistry in deliquescent aerosols and clouds using CAPRAM3.0i, J. Atmos. Chem., 70, 221–256, https://doi.org/10.1007/s10874-013-9267-4, 2013.
Tilgner, A. and Herrmann, H.: Tropospheric aqueous-phase OH oxidation chemistry: current understanding, uptake of highly oxidized organics and its effects, in: Multiphase environmental chemistry in the atmosphere, Vol. 1299, edited by: Hunt, S. W., Laskin, A., and Nizkorodov, S. A., ACS Symposium Series, Vol. 1299, American Chemical Society, Washington, DC, 49–85, ISBN 0841233632, 2018.
Tilgner, A., Schaefer, T., Alexander, B., Barth, M., Collett Jr., J. L., Fahey, K. M., Nenes, A., Pye, H. O. T., Herrmann, H., and McNeill, V. F.: Acidity and the multiphase chemistry of atmospheric aqueous particles and clouds, Atmos. Chem. Phys., 21, 13483–13536, https://doi.org/10.5194/acp-21-13483-2021, 2021.
Urban, R. C., Lima-Souza, M., Caetano-Silva, L., Queiroz, M. E. C., Nogueira, R. F. P., Allen, A. G., Cardoso, A. A., Held, G., and Campos, M. L. A. M.: Use of levoglucosan, potassium, and water-soluble organic carbon to characterize the origins of biomass-burning aerosols, Atmos. Environ., 61, 562–569, https://doi.org/10.1016/j.atmosenv.2012.07.082, 2012.
Vidrio, E., Phuah, C. H., Dillner, A. M., and Anastasio, C.: Generation of Hydroxyl Radicals from Ambient Fine Particles in a Surrogate Lung Fluid Solution, Environ. Sci. Technol., 43, 922–927, https://doi.org/10.1021/es801653u, 2009.
Volkamer, R., San Martini, F., Molina, L. T., Salcedo, D., Jimenez, J. L., and Molina, M. J.: A missing sink for gas-phase glyoxal in Mexico City: Formation of secondary organic aerosol, Geophys. Res. Lett., 34, L19807, https://doi.org/10.1029/2007GL030752, 2007.
Wander, R., Neta, P., and Dorfman, L. M.: Pulse radiolysis studies, XII. Kinetics and spectra of the cyclohexadienyl radicals in aqueous benzoic acid solution, J. Phys. Chem., 72, 2946–2949, https://doi.org/10.1021/j100854a044, 1968.
Wang, X., Gemayel, R., Hayeck, N., Perrier, S., Charbonnel, N., Xu, C., Chen, H., Zhu, C., Zhang, L., Wang, L., Nizkorodov, S. A., Wang, X., Wang, Z., Wang, T., Mellouki, A., Riva, M., Chen, J., and George, C.: Atmospheric photosensitization: A new pathway for sulfate formation, Environ. Sci. Technol., 54, 3114–3120, https://doi.org/10.1021/acs.est.9b06347, 2020.
Washenfelder, R. A., Young, C. J., Brown, S. S., Angevine, W. M., Atlas, E. L., Blake, D. R., Bon, D. M., Cubison, M. J., de Gouw, J. A., Dusanter, S., Flynn, J., Gilman, J. B., Graus, M., Griffith, S., Grossberg, N., Hayes, P. L., Jimenez, J. L., Kuster, W. C., Lefer, B. L., Pollack, I. B., Ryerson, T. B., Stark, H., Stevens, P. S., and Trainer, M. K.: The glyoxal budget and its contribution to organic aerosol for Los Angeles, California, during CalNex 2010, J. Geophys. Res., 116, D00V02, https://doi.org/10.1029/2011JD016314, 2011.
Wenk, J., Aeschbacher, M., Sander, M., von Gunten, U., and Canonica, S.: Photosensitizing and inhibitory effects of ozonated dissolved organic matter on triplet-induced contaminant transformation, Environ. Sci. Technol., 49, 8541–8549, https://doi.org/10.1021/acs.est.5b02221, 2015.
Wenk, J. and Canonica, S.: Phenolic antioxidants inhibit the triplet-induced transformation of anilines and sulfonamide antibiotics in aqueous solution, Environ. Sci. Technol., 46, 5455–5462, https://doi.org/10.1021/es300485u, 2012.
Wenk, J., von Gunten, U., and Canonica, S.: Effect of dissolved organic matter on the transformation of contaminants induced by excited triplet states and the hydroxyl radical, Environ. Sci. Technol., 45, 1334–1340, https://doi.org/10.1021/es102212t, 2011.
Wenk, J., Eustis, S. N., McNeill, K., and Canonica, S.: Quenching of excited triplet states by dissolved natural organic matter, Environ. Sci. Technol., 47, 12802–12810, https://doi.org/10.1021/es402668h, 2013.
Wilkinson, F., Helman, W. P., and Ross, A. B.: Rate constants for the decay and reactions of the lowest electronically excited singlet state of molecular oxygen in solution – an expanded and revised compilation, J. Phys. Chem. Ref. Data, 24, 663–677, https://doi.org/10.1063/1.555965, 1995.
Wong, J. P. S., Tsagkaraki, M., Tsiodra, I., Mihalopoulos, N., Violaki, K., Kanakidou, M., Sciare, J., Nenes, A., and Weber, R. J.: Atmospheric evolution of molecular-weight-separated brown carbon from biomass burning, Atmos. Chem. Phys., 19, 7319–7334, https://doi.org/10.5194/acp-19-7319-2019, 2019.
Wu, Z., Wang, Y., Tan, T., Zhu, Y., Li, M., Shang, D., Wang, H., Lu, K., Guo, S., Zeng, L., and Zhang, Y.: Aerosol liquid water driven by anthropogenic inorganic salts: implying its key role in haze formation over the North China Plain, Environ. Sci. Technol. Lett., 5, 160–166, https://doi.org/10.1021/acs.estlett.8b00021, 2018.
Xia, S.-S., Eugene, A. J., and Guzman, M. I.: Cross photoreaction of glyoxylic and pyruvic acids in model aqueous aerosol, J. Phys. Chem. A, 122, 6457–6466, https://doi.org/10.1021/acs.jpca.8b05724, 2018.
Zepp, R. G., Faust, B. C., and Hoigne, J.: Hydroxyl radical formation in aqueous reactions (pH 3–8) of iron(II) with hydrogen peroxide: the photo-Fenton reaction, Environ. Sci. Technol., 26, 313–319, https://doi.org/10.1021/es00026a011, 1992.
Zhang, H., Surratt, J. D., Lin, Y. H., Bapat, J., and Kamens, R. M.: Effect of relative humidity on SOA formation from isoprene/NO photooxidation: enhancement of 2-methylglyceric acid and its corresponding oligoesters under dry conditions, Atmos. Chem. Phys., 11, 6411–6424, https://doi.org/10.5194/acp-11-6411-2011, 2011.
Zhou, W., Mekic, M., Liu, J., Loisel, G., Jin, B., Vione, D., and Gligorovski, S.: Ionic strength effects on the photochemical degradation of acetosyringone in atmospheric deliquescent aerosol particles, Atmos. Environ., 198, 83–88, https://doi.org/10.1016/j.atmosenv.2018.10.047, 2019.
Zhou, X., Davis, A. J., Kieber, D. J., Keene, W. C., Maben, J. R., Maring, H., Dahl, E. E., Izaguirre, M. A., Sander, R., and Smoydzyn, L.: Photochemical production of hydroxyl radical and hydroperoxides in water extracts of nascent marine aerosols produced by bursting bubbles from Sargasso seawater, Geophys. Res. Lett., 35, L20803, https://doi.org/10.1029/2008GL035418, 2008.