the Creative Commons Attribution 4.0 License.
the Creative Commons Attribution 4.0 License.
 | 02 Aug 2023
Estimating nitrogen and sulfur deposition across China during 2005 to 2020 based on multiple statistical models
Kaiyue Zhou
Lin Zhang
Mingrui Ma
Xuejun Liu
Yu Zhao
Due to the rapid development of industrialization and a substantial economy, China has become one of the global hotspots of nitrogen (N) and sulfur (S) deposition following Europe and the USA. Here, we developed a dataset with full coverage of N and S deposition from 2005 to 2020, with multiple statistical models that combine ground-level observations, chemistry transport simulations, satellite-derived vertical columns, and meteorological and geographic variables. Based on the newly developed random forest method, the multi-year averages of dry deposition of oxidized nitrogen (OXN), reduced nitrogen (RDN), and S in China were estimated at 10.4, 14.4, and 16.7 kg ha−1 yr−1, and the analogous numbers for total deposition were respectively 15.2, 20.2, and 25.9 kg ha−1 yr−1 when wet deposition estimated previously with a generalized additive model (GAM) was included. The dry to wet deposition ratio () of N stabilized in earlier years and then gradually increased especially for RDN, while that of S declined for over 10 years and then slightly increased. The RDN to OXN deposition ratio () was estimated to be larger than 1 for the whole research period and clearly larger than that of the USA and Europe, with a continuous decline from 2005 to 2011 and a more prominent rebound afterwards. Compared with the USA and Europe, a more prominent lagging response of OXN and S deposition to precursor emission abatement was found in China. The OXN dry deposition presented a descending gradient from east to west, while the S dry deposition a descending gradient from north to south. After 2012, the OXN and S deposition in eastern China declined faster than the west, attributable to stricter emission controls. Positive correlation was found between regional deposition and emissions, while smaller deposition to emission ratios () existed in developed eastern China, attributed to more intensive human activities and thereby anthropogenic emissions.
- Article
(9014 KB) - Full-text XML
-
Supplement
(2112 KB) - BibTeX
- EndNote


Atmospheric deposition of nitrogen (N) and sulfur (S) is considered a serious environmental problem, leading to widespread ecosystem acidification and eutrophication, as well as damage to human health (Baker et al., 1991; Burns et al., 2016; Payne et al., 2011; Reuss et al., 1987; Zhang et al., 2018a). In order to understand the spatial distribution and temporal variability of deposition, long-term observation networks have been established globally, particularly in developed countries or regions, such as the Clean Air Status and Trends Network/the National Atmospheric Deposition Program (CASTNET/NADP) in the USA (Beachley et al., 2016), the Canadian Air and Precipitation Monitoring Network (CAPMoN) in Canada (Cheng et al., 2022), the European Monitoring and Evaluation Program (EMEP) in Europe (Simpson et al., 2012), and the Acid Deposition Monitoring Network in East Asia (EANET; Tørseth et al., 2012; Totsuka et al., 2005; Yamaga et al., 2021). Reductions of anthropogenic NOX and SO2 emissions in North America have been very effective in reducing the oxidized nitrogen (OXN) and wet S deposition (Cheng and Zhang, 2017; Feng et al., 2021; Likens et al., 2021). In the USA, for example, OXN decreased significantly in most areas, while reduced nitrogen (RDN) increased gradually in agricultural areas (Holland et al., 2005; Li et al., 2016). Similarly, the long-term observation in Europe shows a downward trend for N and S deposition over the last 2 decades (Keresztesi et al., 2019; Theobald et al., 2019).
China has become one of the global hotspots of atmospheric deposition due mainly to the large anthropogenic emissions from an increased industrial economy and energy consumption for the past 2 decades (Vet et al., 2014). To reduce acid rain and later improve air quality, the Chinese government has enacted a series of policies since 2005 to cut the emissions of atmospheric deposition precursors (Li et al., 2017; Liu et al., 2015; Zheng et al., 2018a), including the policy of limiting national total emission levels of SO2 and NOX within the 11th Five-year Plan (FYP, 2006–2010) and 12th FYP period (2011–2015) respectively, the National Action Plan on the Prevention and Control of Air Pollution (NAPPCAP, 2013–2017), and the Three-Year Action Plan to fight air pollution (TYAPFAP, 2018–2020). Estimated by the Multiple-resolution Emission Inventory for China (MEIC, http://www.meicmodel.org, last access: 29 July 2023), those policies reduced annual SO2 and NOX emissions from 2007 and 2012 respectively (Li, 2020; Wang et al., 2022; Zhang et al., 2019), while the change in NH3 was relatively small. The SO2 and NOX vertical column densities (VCDs) measured from satellite remote sensing have also declined to varying degrees across the country (Krotkov et al., 2016; Xia et al., 2016). Besides emissions and ambient columns, accurate estimation on the changing N and S deposition is crucial for evaluating the effectiveness of national policies on decreasing the ecological risk. Limited by data and methods (explained below), however, few studies have been conducted to link the long-term trend of deposition to the regulations of air pollution prevention.
Similar to developed countries, the direct knowledge of deposition in China came first from ground observation. Since the 1990s, atmospheric deposition monitoring networks in China have been gradually established and improved, such as the Chinese Nationwide Nitrogen Deposition Monitoring Network (NNDMN; Xu et al., 2019) and the Chinese Ecosystem Research Network (CERN; Fu et al., 2010). They provide essential information for quantifying dry and wet deposition and revealing its long-term variability at site level. For example, Liu et al. (2013) found a significant growth in bulk nitrogen deposition in China between 1980 and 2010 based on meta-analyses of historical observation data. Due to insufficient spatial and temporal coverage, however, data obtained at individual sites could not fully support the analysis of widespread and long-term evolution of deposition and might miss diverse patterns of changing deposition by region (Hou et al., 2019; Lye and Tian, 2007). Statistical methods, which incorporated meteorological and environmental variables with higher temporal and horizontal resolutions and wide coverage in time and space (e.g., satellite-derived VCDs), have been increasingly applied to fill the observation gap. Linear or nonlinear relationships between those variables and observed deposition have been developed and applied for periods and regions without observation (Jia et al., 2016; Xu et al., 2018; Yu et al., 2019). For example, Liu et al. (2017a) and Zhang et al. (2018b) obtained the removal rate of SO2 and NOX by precipitation in the whole atmospheric boundary layer through the linear regression method and estimated the wet S deposition in 2005–2016 and nitrogen in 2010–2012 in China. Relatively high uncertainty existed in the simple linear assumption, given the complicated effects of multiple variables (e.g., meteorological conditions and underlying surface types) on deposition. Although advanced statistical methods such as k-nearest neighbor (KNN), gradient boosting machine (GBM), and neural networks have been developed to predict the air pollutant concentrations, they are much more rarely used in the estimation of deposition (Li et al., 2019, 2020b; Qin et al., 2020; Wu et al., 2021). Out of the limited studies, Li et al. (2020a) developed machine learning prediction methods based on multi-site observation data and integrated meteorological and land-use type information, which improved the prediction accuracy of the temporal and spatial distribution of ammonium (NH) wet deposition.
Besides spatiotemporal coverage, integrated estimation for multiple species is another great challenge, particularly for dry deposition. Compared with wet or bulk deposition, there are very few data available for direct observation of dry deposition and an “inferential method” that incorporates numerical-simulated dry deposition velocity (Vd) and surface concentration has been commonly applied (Cheng et al., 2012; Luo et al., 2016; Wesely, 1989; Xu et al., 2015; Wen et al., 2020). Notably, there are even fewer studies on the dry deposition of secondary-formation species with neither surface nor satellite observation data available at the regional scale (e.g., nitrate (NO), NH, and sulfate (SO)). Chemistry transport modeling (CTM), which takes mechanisms of secondary formation of atmospheric species into account, is able to provide the temporal and spatial distribution of the ambient concentration of those species and, thus, can potentially be incorporated into the machine learning framework to improve the deposition estimation and complete the information for individual species. Such application (combination of CTM and machine learning in deposition estimation) has seldom been reported to our knowledge.
In response to the above limitations, this study aims to develop a machine learning framework for estimating the historical long-term deposition of multiple N and S species at relatively high horizontal () and temporal resolution (monthly) for China and to explore the comprehensive impact of the national air pollution controls on the deposition. We select the period of 2005 to 2020, which covers three national FYP periods (11th–13th), NAPPCAP and TYAPFAP. We applied a random forest (RF) method and a generalized additive model (GAM) combining different datasets, including ground-level deposition observation, satellite-derived VCDs, meteorological and geographic variables, and CTM simulation, and explored the spatiotemporal variability of dry and wet deposition for the country. The ratios of deposition to emissions () were then calculated by region and species to illustrate the source–sink relationships of atmospheric pollutants. The outcomes provide a scientific basis for further formulating emission control strategies, combining potential ecological risks of deposition.
2.1 Study domain
We selected the Chinese mainland as the research area including 31 provincial-level administrative regions (excluding Hong Kong, Macao, and Taiwan). As shown in Fig. 1, the 31 provinces are geographically classified into 6 parts, i.e., North Central (NC), North East (NE), North West (NW), South East (SE), South West (SW), and the Tibetan Plateau (TP), representing the diverse social-economical and geo-climatic conditions. The details of climate, population, and GDP are provided by region in Table S1 in the Supplement. Basically, NC (with Inner Mongolia excluded) and SE belong to the relatively developed regions in eastern China; NW, SW, and NE belong to less developed regions; while TP represents the background region. Bounded by the Qinling Mountain–Huaihe River Line (Fig. 1), the climate in the south (SE and SW) is humid, with more precipitation than the north (e.g., NC).
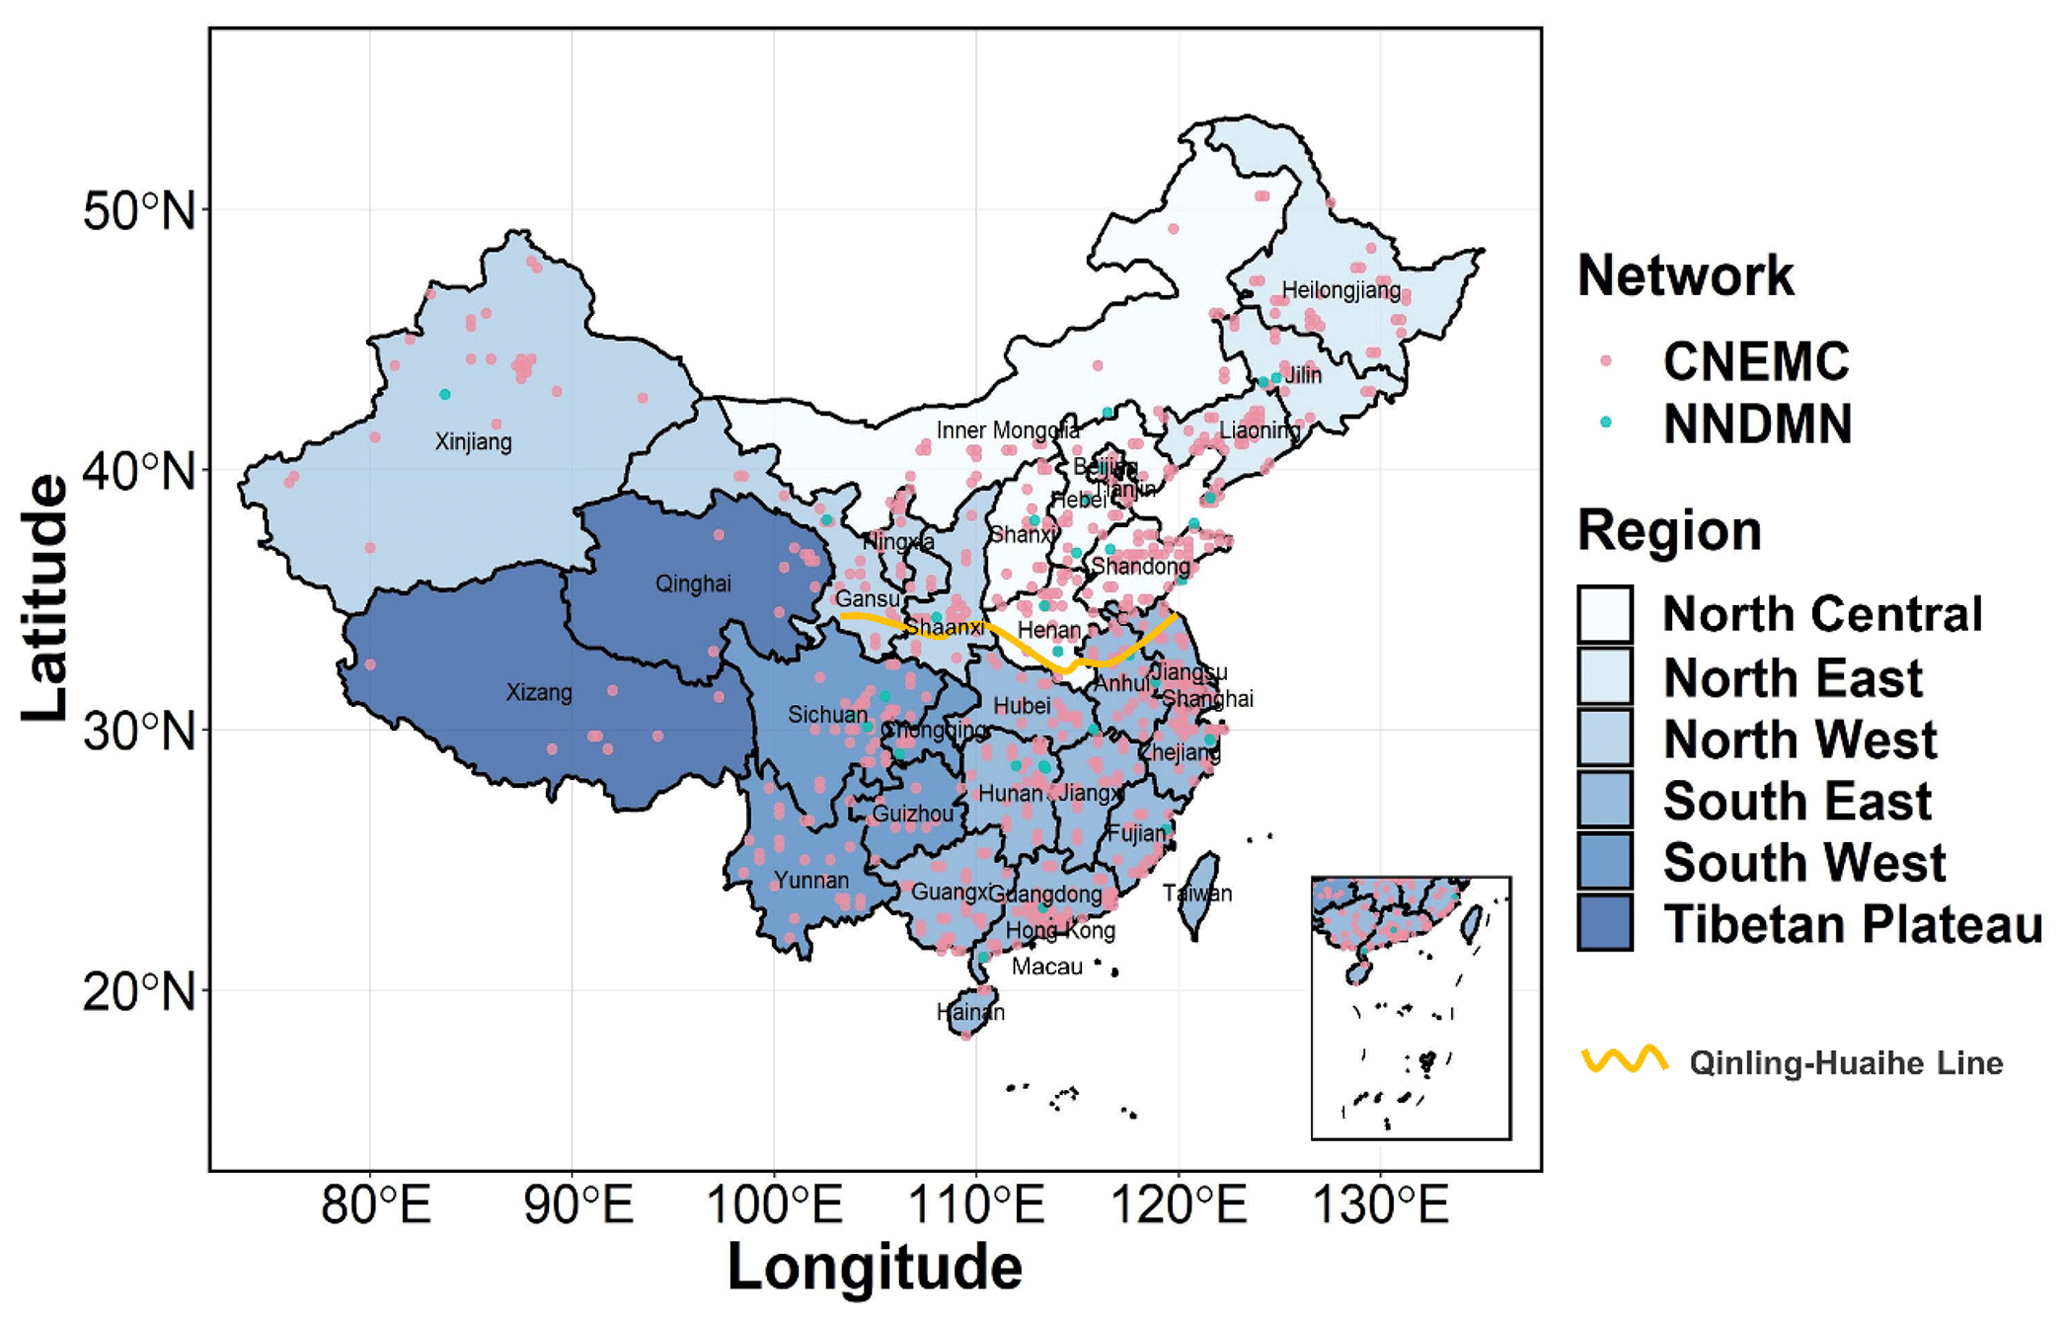
Figure 1The research domain of this study. The pink points represent China National Environmental Monitoring Centre (CNEMC) and the green points represent Nationwide Nitrogen Deposition Monitoring Network (NNDMN). The Qinling–Huaihe Line is the boundary between the north and the south of the country. The map data provided by Resource and Environment Data Cloud Platform are freely available for academic use (http://www.resdc.cn/data.aspx?DATAID=201, last access: 29 July 2023), © Institute of Geographic Sciences and Natural Resources Research, Chinese Academy of Sciences.
2.2 Dry deposition flux estimation
2.2.1 Random forest (RF) model description
Figure 2 shows the methodology framework of a dry and wet deposition simulation. We applied a multisource-fusion RF model to estimate the spatiotemporal pattern of dry deposition for individual N and S species including NO, HNO3, NO2, NH, NH3, SO2, and SO (H2SO4 is not included due to its tiny amount and unavailability of relevant data), at horizontal resolution and monthly level for 2005 to 2020. RF model is a state-of-the-art statistical method to deal with the complicated nonlinear relationship between response variables and interpretation variables. Briefly, with the ensemble learning, the RF regression predictions are determined as the average of the multiple regression trees based on the bootstrap sampling method (Breiman, 2001). The model performance strongly depends on two crucial parameters, ntree (number of the regression trees) and mtry (number of interpretation variables sampled for splitting at each node), and they were respectively determined at 1000 and 3 to train our model. Not all interpretation variables participate in the process of node splitting (Li et al., 2020b); thus, significant correlations of regression trees can be avoided. Besides, the backward variable selection was performed on the RF model to achieve the better performance. Please refer to the Supplement text section for the detailed algorithm of the model.
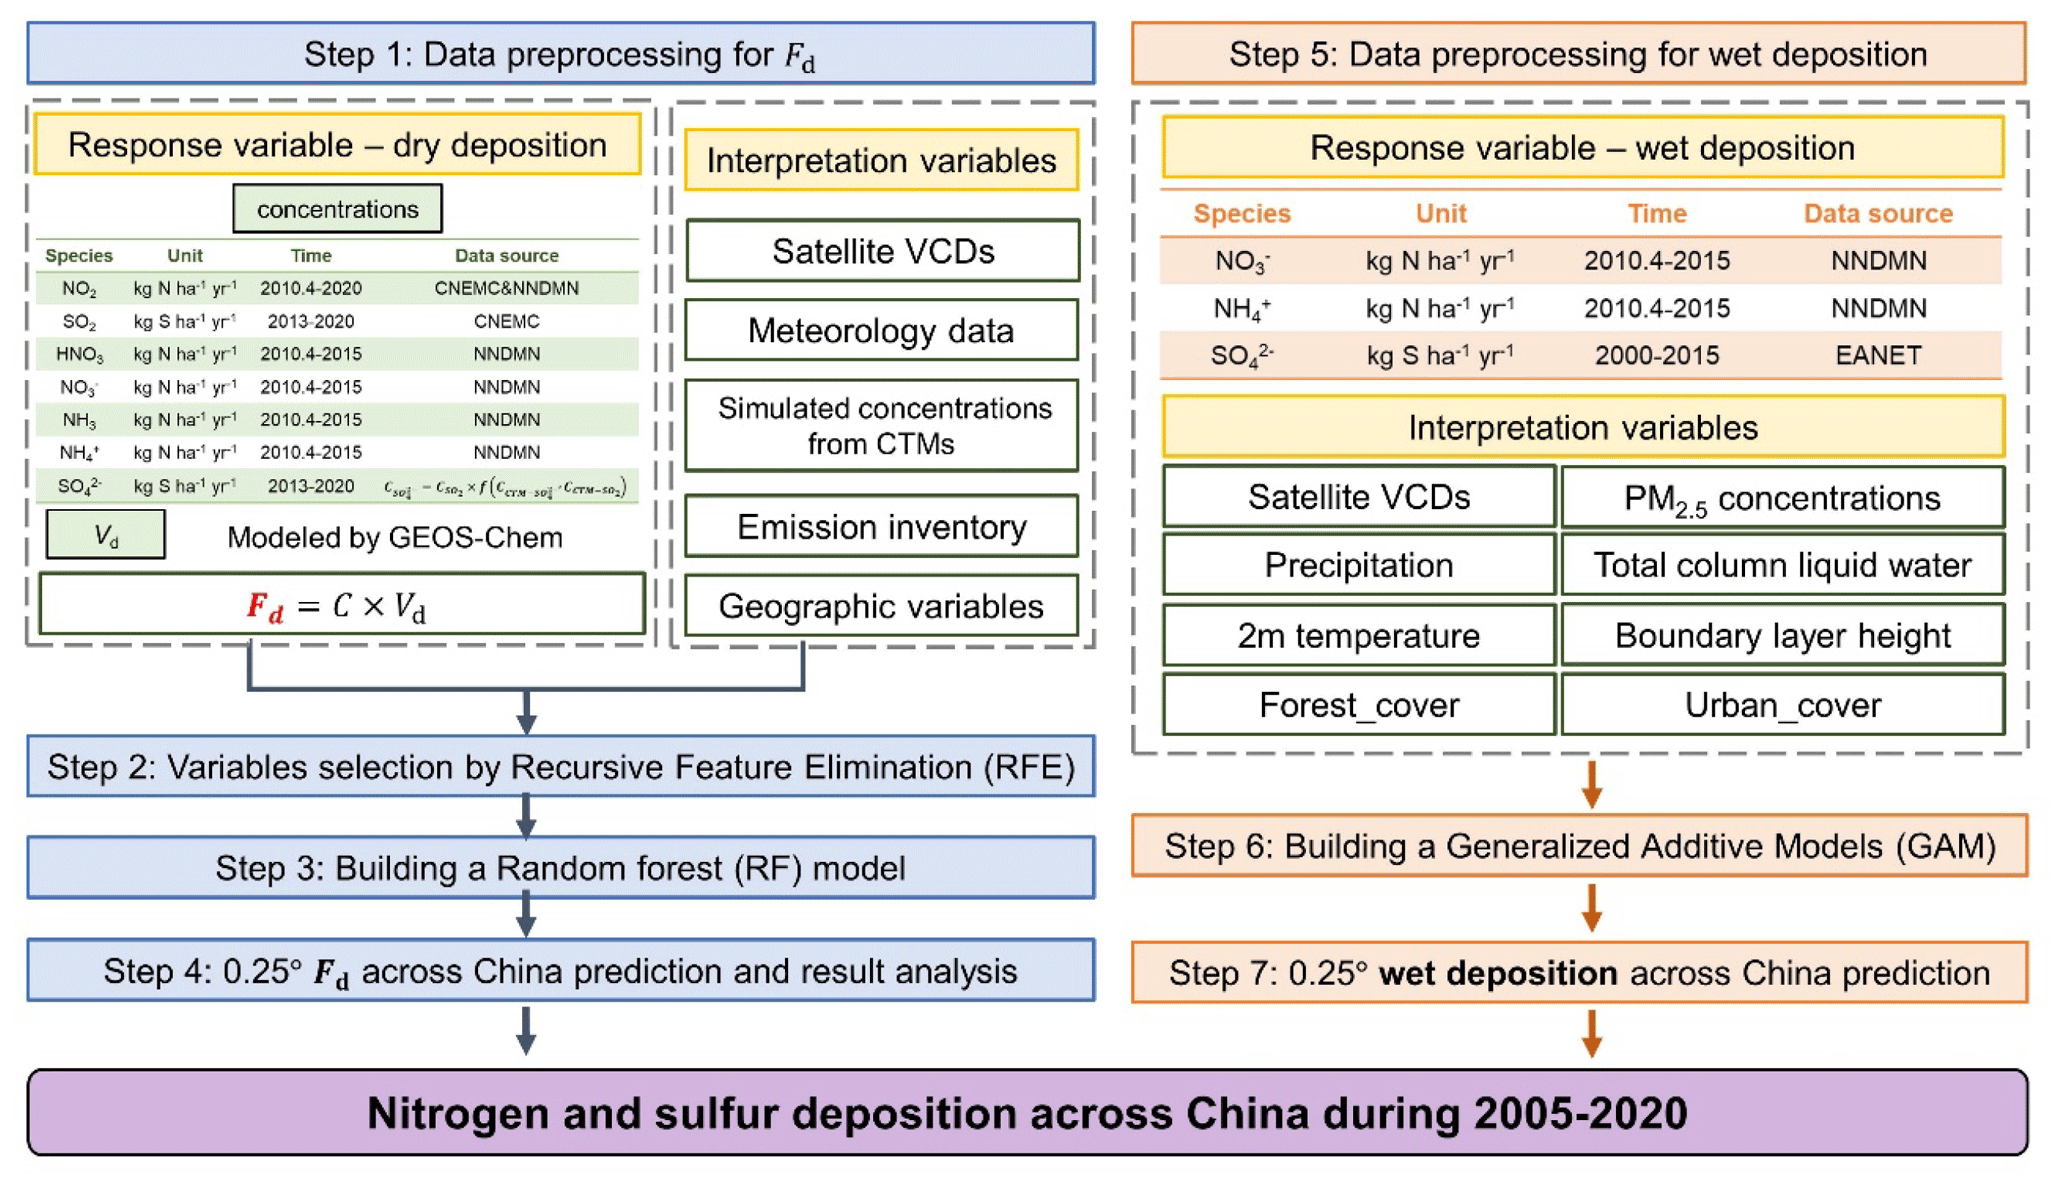
Figure 2Methodology framework to estimate dry and wet deposition of this study. The blue process shows the four steps to establish the RF model. The orange process shows the three steps in establishing a GAM model. See Sect. 2.2 to 2.3 of the method section in the text for the acquisition of the preliminary dataset.
We ran the RF modeling program by using the “caret” package in R software (version 4.1.2; Kuhn, 2021). As shown in Fig. 2, we firstly applied the inferential method to calculate the dry deposition flux (Fd) at ground observation sites as a response variable:
where C is the estimated (for SO) or observed concentration (for other species) described in Sect. 2.2.2, and Vd is the modeled dry deposition velocity (Vd) with the Goddard Earth Observing System-Chemistry (GEOS-Chem) 3-D global transport model described in Sect. 2.2.4.
Secondly, we selected satellite-derived tropospheric VCDs of SO2, NO2, and NH3; surface concentrations of NO, HNO3, NH, and SO simulated from CTM; meteorological factors; geographic covariates; and emission data as interpretation variables. We used the “nearZeroVar” function in caret package to eliminate the zero variance variables, to delete highly correlated variables, and to prevent the multicollinearity. Based on the Recursive Feature Elimination (RFE), we then input the final variables to the model as summarized in Table S2 in the Supplement. The RFE algorithm is a backward selection of variables based on the relative importance of interpretation variables (RIV). In order to eliminate the different distributions and/or ranges caused by the magnitudes of various variables, we mapped them to the same interval through standardization and normalization. Before modeling, the interpretation variables were sorted, and the less important factors were eliminated in turn. The RF model captured the nonlinear relationship between the dry deposition (Fd) and interpretation variables:
where N is the number of samples; θ is the random vector; and Mete, Emi, Geo, and CTM represent the meteorology factors, emission data, geography, and surface concentrations simulated from CTM respectively.
Finally, we split the entire model fitting dataset into 10 groups to test the robustness of RF model (10-fold cross validation). In each round of cross validation, the samples in nine groups were used as the training data, and the remaining group was applied for prediction. This process repeated 10 times, and every group was tested. The consistency between the calculated Fd (as an observation) and predictions was evaluated using statistical indicators, including coefficient of determination (R2), root mean squared prediction error (RMSE), mean prediction error (MPE), and relative prediction error (RPE).
2.2.2 Ground-level concentration observations and prediction
The daily ground-level concentrations of NO2 and SO2 during 2013–2020 were obtained from the real-time data publishing system of the China National Environmental Monitoring Center (CNEMC, http://datacenter.mee.gov.cn/websjzx/queryIndex.vm, last access: 29 July 2023), with the abnormal values eliminated. The total number of observation sites reached 1532 in 2020, mainly located in eastern China with dense industrial economic and population (e.g., 600 and 408 sites in SE and NC respectively), as shown in Fig. 1. Monthly level concentrations were then calculated for RF model prediction. The Nationwide Nitrogen Deposition Monitoring Network (NNDMN) established by China Agricultural University contains 43 monitoring sites in China (as shown in Fig. 1) and measured monthly concentrations gaseous NH3, NO2, and HNO3 and particulate NH and NO in air from 2010 to 2014. The NH3, HNO3, NH, and NO concentrations were measured using the DELTA active sampling systems (DEnuder for Long-Term Atmospheric sampling), while NO2 samples were collected with Gradko passive diffusion tubes deployed in duplicate or triplicate. The empirically determined effective size cut-off for aerosol sampling was of the order of 4.5 µm (Flechard et al., 2011). The complete datasets of NNDMN were published in previous work (Xu et al., 2019).
Due to the lack of large-scale ground observation data, SO concentrations were obtained with an indirect method, according to the strong association between SO2 and SO (Luo et al., 2016). We simulated SO2 and SO concentrations for 2013–2020 with CTM and developed the relationships between the two with GAM for each year. The SO concentrations were then calculated based on the observed SO2 concentrations from CNEMC and the relationships between SO2 and SO:
where is the monthly ground-level concentration at CNEMC for each year of 2013–2020, and are the SO and SO2 concentrations simulated by CTM for each year of 2013–2020 (see Sect. 2.2.4 for CTM description) respectively, and f is the relationship between SO and SO2 obtained from GAM. As shown in Fig. S1 in the Supplement, significant positive correlations were found for SO and SO2 concentrations, with the total correlation coefficient (R) estimated at 0.86 (p<0.001) for 2013–2020.
2.2.3 Satellite-derived VCDs
The tropospheric VCDs of NO2 from 2005 to 2020 were taken from Peking University Ozone Monitoring Instrument (OMI) NO2 tropospheric product version 2 (POMINO v2; Liu et al., 2019), based on the observation of OMI. The VCDs with cloud coverage over 25 % were eliminated, as high cloudiness would distort satellite detection and increase inversion error. The daily SO2 VCDs were obtained from Level-3e OMSO2 Data Products from 2005 to 2020 (https://disc.gsfc.nasa.gov/datasets/OMSO2e_003/summary, last access: 29 July 2023). All the OMI SO2 data were generated by an algorithm based on principal component analysis (PCA), which was considerably sensitive to anthropogenic emissions (Krotkov et al., 2016). The total VCDs of NH3 were derived from the Infrared Atmospheric Sounding Interferometer (IASI) board on the Metop-A platform. The standard daily IASI/Metop-A ULB-LATMOS total column Level-2 product v2.2.0 is available from 2008 to 2020 (https://iasi.aeris-data.fr/nh3_iasi_a_arch/, last access: 29 July 2023). The daily total column was excluded when the cloud coverage was > 25 %, the relative error was > 100 %, or the absolute error was > 5×10¹⁵ molec. cm−2 (Whitburn et al., 2016). The NH3 VCDs from 2005 to 2008 were estimated based on the linear correlations between NH3 emission and VCDs during 2008 to 2020.
We used the Kriging interpolation method to fill the missing values and obtained the spatial pattern of VCDs at the horizontal resolution of . Monthly level VCDs were calculated based on the daily products from 2005 to 2020.
2.2.4 CTM model description
We used GEOS-Chem v12.1.1 (http://geos-ch em.org, last access: 29 July 2023) to simulate the Vd and the ground-level concentrations of individual species. The GEOS-Chem model is a global 3-D model of atmospheric composition driven by assimilated meteorological observations from the GEOS of the NASA Global Modeling and Assimilation Office. It is a state-of-the-art, comprehensive, easily accessible global atmospheric composition model that has been widely applied around the world to advance the understanding of human and natural impacts on the atmospheric environment (Bey et al., 2001; Park, 2004; Eastham et al., 2018). A nested version was applied with the native horizontal resolution of 0.5∘ × 0.625∘ over East Asia (70–150∘ E, 11∘ S–55∘ N) and 4∘ × 5∘ for rest of the world, and the simulated Vd and concentrations within China were spatially interpolated at the resolution of 0.25∘ × 0.25∘. The Vd for 2013–2020 was calculated based on a standard big-leaf resistance-in-series parameterization as described by Wesely (1989) for gases and Zhang et al. (2001) for total particles and applied in estimation of the response variable dry deposition flux. The detailed calculation process is described in the text section in the Supplement, and the annual averages of Vd for different species are presented by land-use type in Table S3 in the Supplement. The simulated concentrations of individual species (NO, HNO3, NH, and SO) during 2005 to 2020 were used as the interpretation variable in RF. The simulated concentrations were in good agreement with the ground measurements, with the correlation coefficients ranging between 0.51 and 0.82, and the normalized mean biases within 30 % (Chen et al., 2021).
The model was driven by the MERRA-2 assimilated meteorological data provided by the Global Modeling and Assimilation Office (GMAO) at the National Aeronautics and Space Administration (NASA). Meteorology fields such as vertical pressure velocity, temperature, surface pressure, relative humidity, and specific humidity had a temporal resolution of 3 h, and surface variables (such as sea level pressure, tropopause pressure) and mixing depths were at 1 h resolution. The model had 47 vertical layers from surface to 0.01 hPa, and the lowest layer is centered at 58 m above sea level.
Emissions in GEOS-Chem were processed through the Harvard–NASA Emission Component (HEMCO; Keller et al., 2014). We used the Community Emissions Data System for global anthropogenic emissions, overwritten by the regional emissions inventories in the USA, Europe, Canada, and Asia, involving the National Emissions Inventory from EPA (NEI; https://www.epa.gov/air-emissions-inventories/national-emissions-inventory-nei, last access: 29 July 2023), the European Monitoring and Evaluation Programme emissions (EMEP; European Monitoring and Evaluation Programme; https://www.emep.int/index.html, last access: 29 July 2023), and the MIX inventory that included MEIC over China (http://meicmodel.org.cn/?page_id=89, last access: 29 July 2023). Natural NOX sources from soil and lightning were also included (Lu et al., 2021).
2.2.5 Other data
The meteorological parameters for 2005 to 2020, including precipitation, boundary layer height, temperature at two meters, wind speed, wind direction, surface pressure, total column, total column ozone, were downloaded from the European Centre for Medium-Range Weather Forecasts (ECMWF, https://www.ecmwf.int/en/forecasts/datasets/open-data, last access: 29 July 2023) at the resolution of 0.25∘ × 0.25∘.
Land-use and land-cover change (LUCC), digital elevation model (DEM), population density data (POP), and gross domestic product (GDP) were obtained from Chinese Resource and Environment Data Cloud Platform (http://www.resdc.cn/, last access: 29 July 2023). Except for the DEM, other data were compiled at a 5-year interval (2005, 2010, and 2015 for this study). LUCC was generated by manual visual interpretation of Landsat TM/ETM remote sensing image. We calculated the area fractions of different land use in the buffer zone (60 km in diameter around each site). The elevation spatial distribution data (DEM) were extracted from the Shuttle Radar Topography Mission at 1 km resolution, assuming no variability during the study period. For GDP and POP, datasets with 1 km resolution were developed through spatial interpolation, taking their spatial interactions with land-use type and night light brightness into account (Xu, 2017). Linear interpolation was applied to complete the information for all the years within the research period, and all the above-mentioned interpretation variables were resampled to a uniform horizontal resolution of 0.25∘ × 0.25∘.
2.3 Wet deposition flux estimation
As shown in Fig. 2, we applied a nonlinear generalized additive model (GAM) developed in our previous work (Zhao et al., 2022) to estimate the monthly wet deposition of SO, NO, and NH in China at a horizontal resolution of 0.25∘ × 0.25∘. This model considered the linear and nonlinear correlations between the response variable (referred to as wet deposition in this study) and the selected interpretation variables (satellite-derived VCDs, meteorological factors, and geographic covariates, etc.). If there is no strict linear assumption, the likelihood estimate of the wet deposition was the sum of the smooth function of the interpretation variables:
where g is the “link” function, which specifies the relationship between the response variable μ and the linear formulation on the right side of equation; fi(xi) is the nonlinear smooth function that explores the single effect of individual interpretation variable xi; m indicates the month; n represents the total number of interpretation variables for which single effect was considered in the model; fpq(xp, xq) is nonlinear smooth function that explores the interaction effect of interpretation variable xp and xq; Xθ represents an ordinary linear model component for interpretation variables (elements of the vector X) not subject to nonlinear transformations; and ε represents the residuals of models. The smooth functions fi(xi) and fpq(xp, xq) are fitted by thin-plate regression splines and tensor product smoothing respectively. With an assumption of normal distribution, Gaussian distribution and the log link function are applied for the model residuals.
For SO, the observation data of monthly wet deposition were collected from the East Asia Acid Deposition Monitoring Network (EANET) as response variables. For NO and NH, the observed monthly bulk deposition collected by the rain gauges at NNDMN served as the response variables. For all the three species, the interpretation variables contained the precipitation, satellite-derived VCDs, PM2.5 concentrations, total column liquid water, temperature, boundary layer height, forest cover, and urban cover. The data sources and model performance evaluations were described in Zhao et al. (2022). Overall, the 10-fold cross validation R2 for NO, NH, and SO reached 0.51, 0.60, and 0.71 respectively, implying the model well captured the spatiotemporal patterns of wet deposition. Although bulk deposition includes a small amount of dry deposition, the deposition in precipitation obtained through GAM was uniformly defined as wet deposition in this work.
3.1 RF model prediction performance
The RF model performances for dry deposition estimation evaluated with 10-fold cross validation are shown in Figs. S2 and S3 in the Supplement based on CNEMC and NNDMN respectively. The multi-year average R2 of N and S species over China were all above 0.7, and the RMSE of all models was less than 1 kg ha−1 yr−1 except for NO2 (1.09 kg N ha−1 yr−1) and SO2 (6.46 kg S ha−1 yr−1), indicating the satisfying consistency between observation and prediction. However, the model tended to underestimate the high deposition and overestimate the low one, possibly because the model algorithm based on the average of all regression trees resulted in relatively weak estimation of the extreme values. The modeling prediction performance of OXN (NO, HNO3, and NO2) was better than that of RDN (NH and NH3) and S (SO2 and SO). For example, the R2 of NO2, NO, and HNO3 were 0.87, 0.73, and 0.78, while those of NH3 and NH were 0.71 and 0.65. POMINO, which reduced the bias of the default product by the OMI Nitrogen Dioxide Algorithm Team (Krotkov et al., 2019; Liu et al., 2019), was demonstrated to be satisfyingly applicable in OXN deposition prediction for China. In addition, the prediction performances of CNEMC were better than those of NNDMN (except for SO2), attributed partly to much more monitoring stations for the former. As indicated in our previous work, improved model performance could be expected along with the increased abundance of observation data (Zhou et al., 2021).
To evaluate the long-term average deposition from RF modeling, we collected 34 studies that quantified the deposition of different species and forms (dry or wet) for China using observational, geostatistical, or modal methods (Table S4 in the Supplement). As shown in Fig. 3, gaseous NH3 and SO2 were identified as the species with the largest dry deposition, while SO was identified as the species with the largest wet deposition. The multi-year averages (2005 to 2020) of dry deposition for different species estimated in this study were within the range between the 25th quantile (Q1) and 75th quantile (Q3) of selected studies except for NH3 (Fig. 3a), but that of SO wet deposition closing to Q1 was basically lower compared to existing studies (Fig. 3b). Most of the existing studies reported SO wet deposition in China for 2001–2005 when the national control of SO2 emissions and acid rain was still in its initial stage, while limited data were available for more recent years when sharp declines were found for SO2 emissions. Therefore, the average of existing studies might potentially overestimate the actual average level of S deposition across the country. Overall, the total deposition of N and S from RF modeling was satisfyingly close to the median level of the existing studies (Fig. 3c), indicating the robustness of deposition estimation.
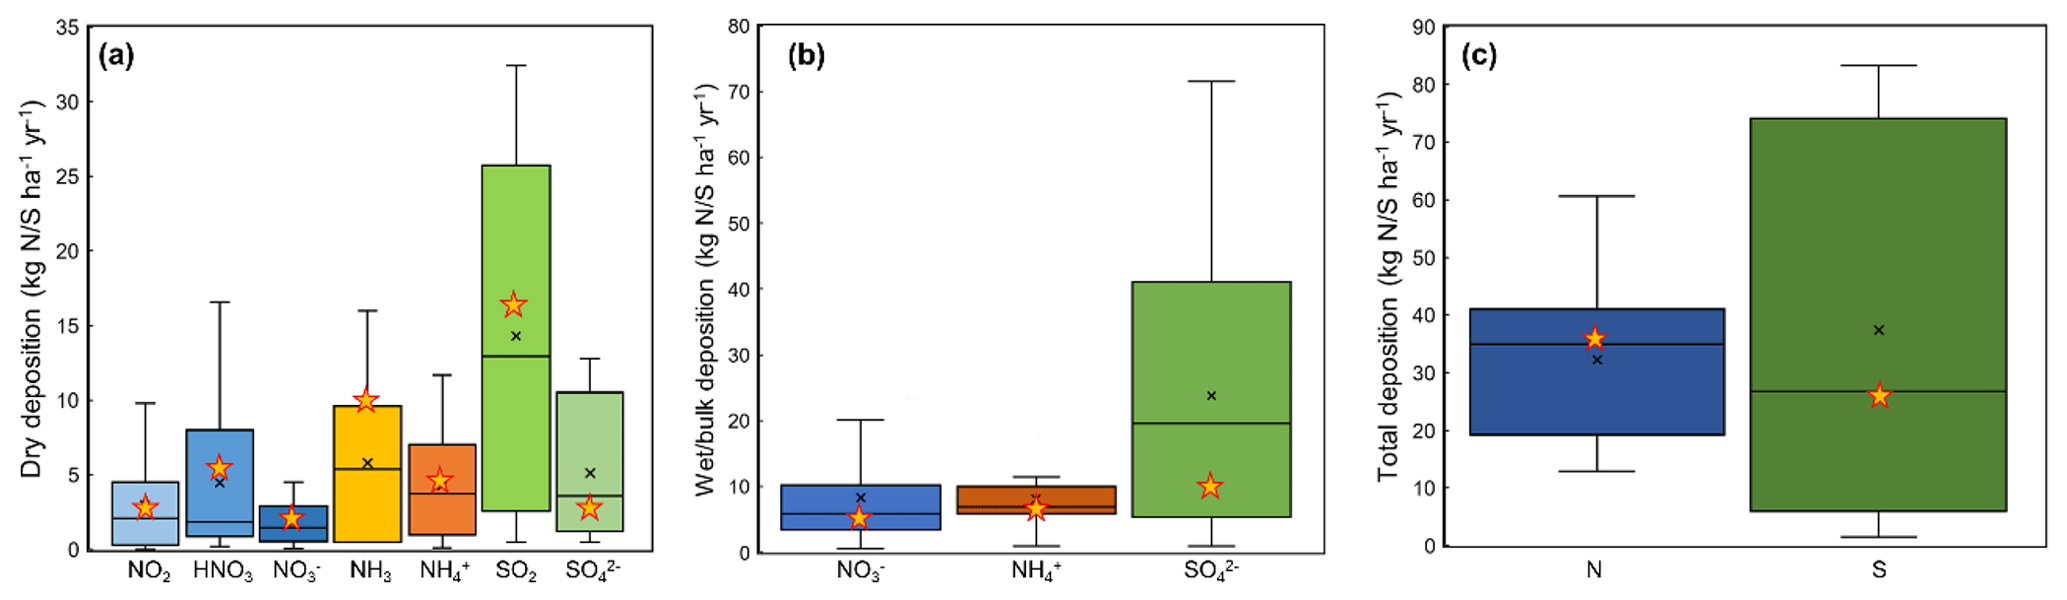
Figure 3Comparison of deposition between this study and other literature for dry (a), wet (b), and total deposition (c). The black cross and the pentagram are the average of literature-reported results and the multi-year average of this study respectively. The boxplots represent the dispersion of deposition collected from the literature. The central horizontal line, the upper side line, and the lower side line of the box represent the median value, the upper quartile (75th Quantile, Q3), and the lower quartile (25th Quantile, Q1). The vertical line extending out of the box represents 1.5 times the interquartile interval (IQR, i.e., Q3–Q1), and the horizontal lines represent the upper limit (Q3 + 1.5 IQR) and the lower limit (Q1–1.5 IQR).
We calculated the shares of different forms and species to the average of national total deposition in 2005 to 2020 (Fig. 4). The dry deposition of N followed an order of NH3 > HNO3 > NO2 > NH > NO, while the wet NH deposition was larger than NO. As a whole, RDN (58 %) was found to contribute more than OXN (42 %) to the total N deposition. Those proportions to total N deposition are close to those of emissions, i.e., 54 % and 46 % for NH3 and NOX respectively (the national emissions of NOX and NH3 were estimated at 7.2 and 8.3 Tg N yr−1 in MEIC for 2005 to 2020 respectively). For S species, the dry deposition of SO2 was over 10 times of SO, while the latter was the only species of wet deposition. Dry deposition was estimated to be higher than wet for both N and S, with its fraction in total deposition reaching 70 % and 65 % within the research period respectively. The more specific interannual variability and spatial distribution for different forms will be described in Sect. 3.2 and 3.3.
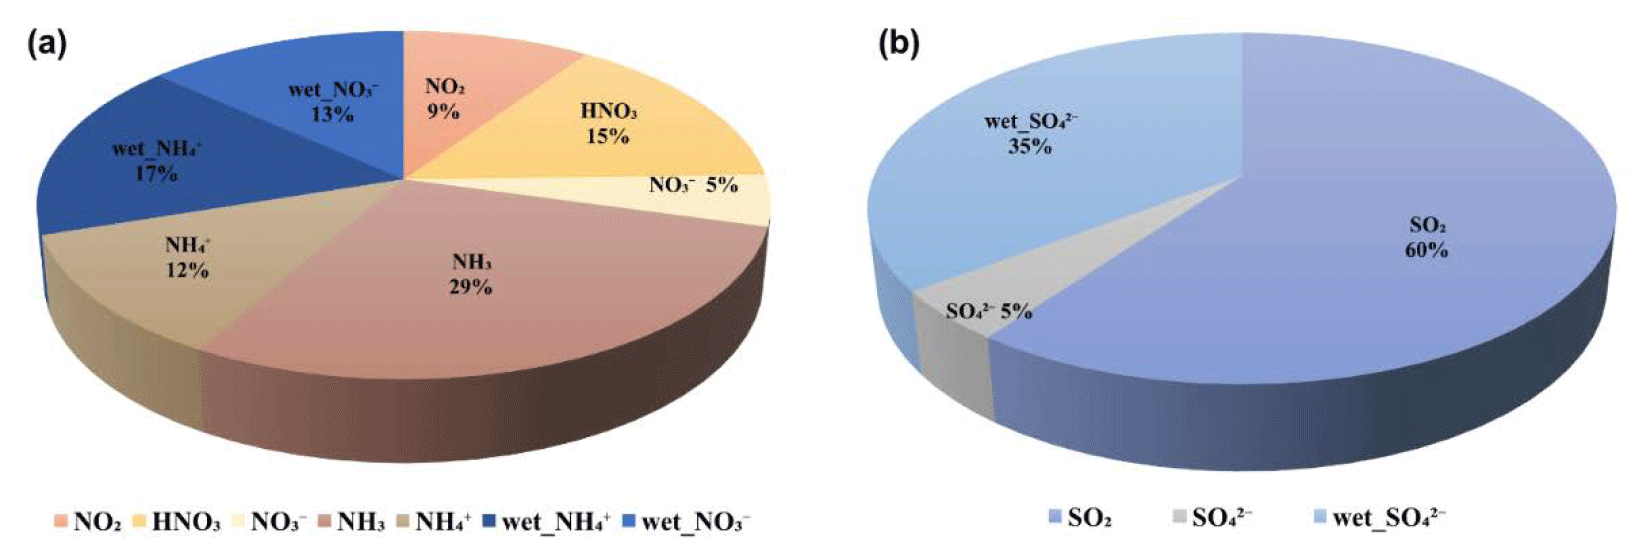
Figure 4Contribution of different forms and species to the estimated total N and S deposition in China.
3.2 Temporal variability in N and S deposition
Based on the newly developed RF method, the average dry deposition of OXN, RDN, total N, and S in China were estimated at 10.4, 14.4, 24.9, and 16.7 kg ha−1 yr−1 from 2005 to 2020 respectively. The total deposition reached 15.2, 20.2, 35.4, and 25.9 kg ha−1 yr−1 respectively when the average wet deposition estimated with GAM (Zhao et al., 2022) was included. Figure 5a–d illustrate the long-term interannual variability of dry and wet deposition for OXN, RDN, total N, and S respectively. Different temporal trends are found for N and S, due partly to the diverse of their precursor emissions. As indicated by MEIC, China's NOX emission control was limited until 2010, allowing annual national emissions to grow 49 % from 2005 to 2012 (Fig. 5f). The country required installation of selective catalyst reduction (SCR) systems from 2011, and NAPPCAP drove a fast-growing penetration of SCR in the power and cement production sectors, resulting in a 28.6 % reduction in the annual total emissions of NOX from 2013 to 2020 (Karplus et al., 2018; Li et al., 2018). Similar temporal variability was found for OXN deposition: it increased slightly from 14.7 in 2005 to 15.7 kg N ha−1 yr−1 in 2012, and then declined to 14.5 kg N ha−1 yr−1 in 2020 (Fig. 5a). The interannual variation in NH3 emissions has been much smaller than NOX, with a slight reduction by 9 % from 2005 to 2020 (Fig. 5f), attributed to the changes in Chinese agricultural practices, e.g., improved waste management in livestock farming and replacement of highly volatile ammonium bicarbonate with urea in fertilizer types (Liu et al., 2017b; Zheng et al., 2018b). However, the big emission abatement of acidic gases like SO2 after 2013 was recognized to reduce the sink of NH3 in the atmosphere and to increase of gas-phase NH3 concentrations (Liu et al., 2018), resulting in more dry NH3 deposition (Fig. 5b). After 2015, China's RDN deposition became relatively stable, which could be partly explained by the implementation of the Zero Increase Action Plan for N fertilizer after 2015 (Liu et al., 2022). As a combined effect of changing emissions and atmospheric conditions, the RDN deposition was estimated to grow from 19.5 in 2005 to 20.6 kg N ha−1 yr−1 in 2020. China has widely applied flue gas sulfurization (FGD) in the power sector since 2005 and has expanded its application to other industries (such as sintering furnaces and non-electric coal-fired boilers) since 2013 as a part of NAPPCAP (Zheng et al., 2018a). As a result, the annual national SO2 emissions were estimated to decline by 76 % from 2005 to 2020 (Fig. 5f) and the dry deposition of S by 31 % (Fig. 5d). The wet deposition was less responsive to emissions than the dry deposition, and the growth in precipitation was likely offsetting part of the benefit of emission control on wet deposition (Zhao et al., 2022). The total S deposition was calculated to decline by 26 %, from 28.8 in 2005 to 21.3 kg S ha−1 yr−1 in 2020.
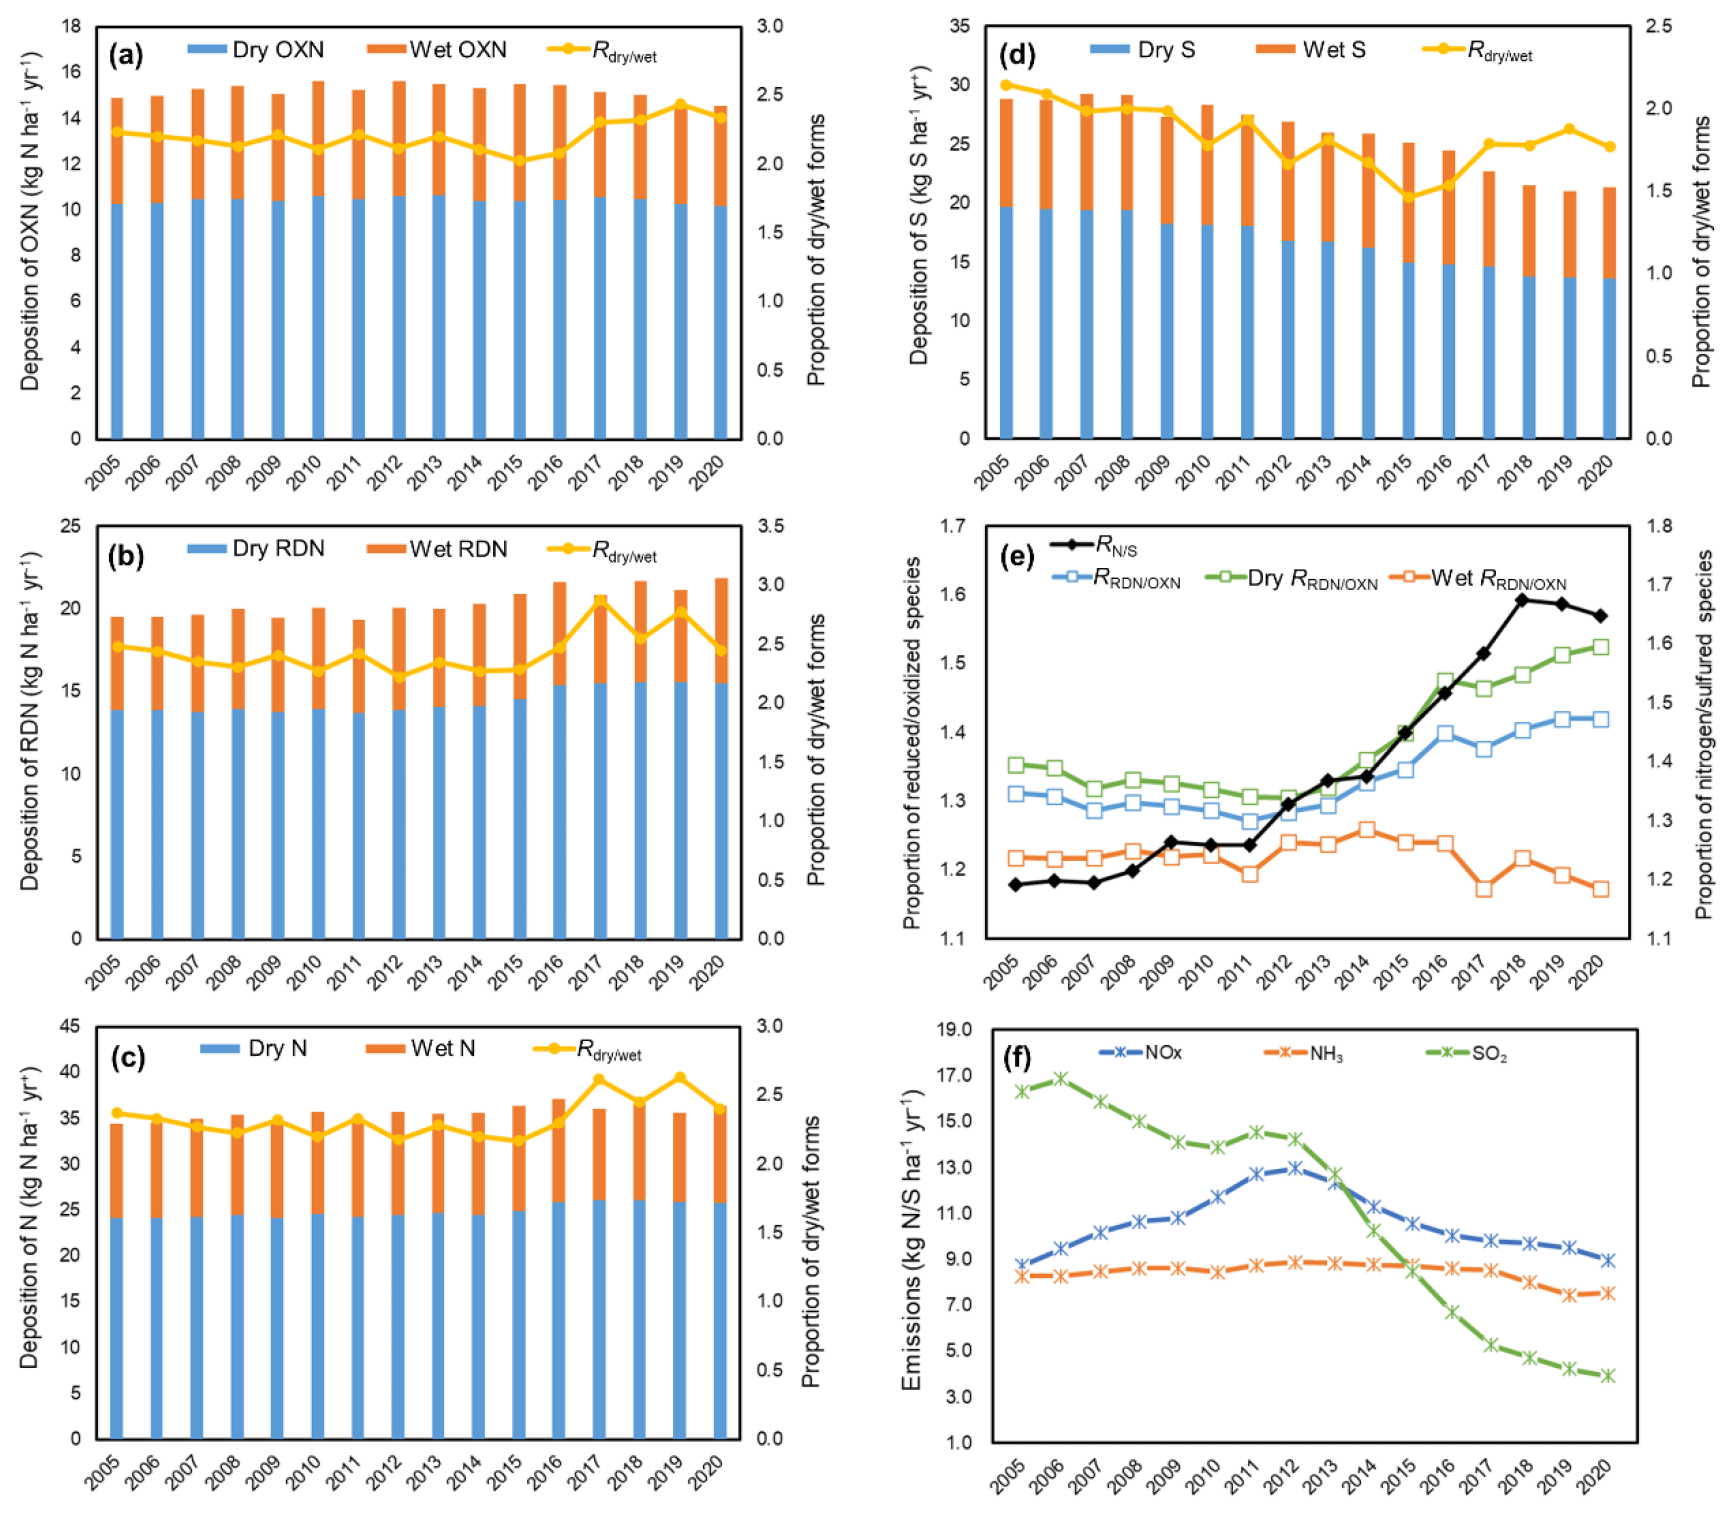
Figure 5The interannual variability of N and S deposition, emissions, and component proportion in China from 2005 to 2020. The emission data over China were taken from MEIC.
Shown in Fig. 5a–d as well is the long-term interannual variability of the dry to wet deposition ratio () during 2005 to 2020. The Mann–Kendall test (Ahmad et al., 2015; Comero et al., 2014) was applied to evaluate the significance of trends for N and S, as shown in Table S5 in the Supplement. The of N species kept relatively stable for earlier years and then slightly increased from 2015, with the multi-year average ratios estimated at 2.2, 2.5, and 2.4 for OXN, RDN, and total N respectively. The of S declined significantly before 2015 and then slightly increased afterwards, with the average ratio estimated at 1.8 for 2005 to 2020. The growth of of RDN could be partly attributed to the improved control of acid precursor emissions for recent years. Since 2013, as mentioned above, the implementation of NAPPCAP and abatement of SO2 emissions has reduced the sink of NH3 in the atmosphere, elevating the free ammonia in the air and thereby the of RDN. A significant negative correlation coefficient between precipitation and was found for both OXN (−0.63) and S (−0.64), indicating the influence of precipitation. Notably, precipitation increased at a rate of 6.3 mm yr−1 in China during 2005 to 2015 (Fig. S4 in the Supplement), motivating the formation of wet deposition of SO2 that is easily soluble in water. Besides, the general growth of air pollutant emissions (excluding SO2) elevated the atmospheric oxidizing capacity, thereby promoting SO formation for wet deposition. The declining precipitation after 2015 resulted in the reduced wet deposition and thereby enhanced for OXN and S.
Figure 5e shows the long-term interannual variability of the ratio of N to S deposition () and the ratio of RDN to OXN deposition () for different forms during 2005 to 2020. Growing was found for the most time within the research period, as China started SO2 emission control earlier than NOX and NH3. indicates the relative contributions of industrial and agricultural activities to N deposition, as the major anthropogenic sources of RDN are animal excrement and fertilizer use in agriculture, while those of OXN are fossil fuel combustion in power, industrial, and transportation sectors (Pan et al., 2012; Zhan et al., 2015; Zhu et al., 2015). is estimated to be larger than 1 for the whole research period, with a continuous decline from 2005 to 2011 and more prominent rebound afterwards, and it reached 1.5 for total N in 2020. The ratio for dry deposition was larger than the wet one. The declining before 2011 resulted mainly from the growth of NOX emissions and thereby OXN deposition, driven by the fast development of industrial economy and increasing fossil fuel combustion. The growing since 2012 was expected to be largely driven by the continuous efforts of NOX emission controls and highlighted the benefit of those efforts on limiting OXN pollution. Regulation on NH3 emission controls, mainly in agricultural activities, became increasingly important for further alleviating the N pollution.
As summarized in Table S6 in the Supplement, the annual average deposition of N and S in China was much larger than that for the USA estimated by the Clean Air Status and Trends Network (CASTNET, https://www.epa.gov/castnet, last access: 29 July 2023) and the National Atmospheric Deposition Programme (NADP, https://nadp.slh.wisc.edu/networks/national-trends-network/, last access: 29 July 2023) and Europe by the European Monitoring and Evaluation Programme (EMEP, https://projects.nilu.no/ccc/index.html, last access: 29 July 2023). According to Vet et al. (2014), the ensemble-mean results of 21 global CTMs indicated that eastern China was the region with the highest nitrogen deposition in the world, with a value of 38.6 kg N ha−1 yr−1. Compared with the USA and Europe, China has not only experienced high deposition of N and S but also featured the greatest increase over the past decade (Du and Liu, 2014; Fu et al., 2022; Jia et al., 2016). Figure 6 illustrates the interannual variations of emissions, deposition, and for China as well as the more developed USA and Europe (28 countries). The emission data for the three regions were respectively taken from MEIC, the US Environmental Protection Agency (EPA, https://www.epa.gov/air-emissions-inventories/air-pollutant-emissionstrends-data), and the European Environment Agency (EEA, https://www.eea.europa.eu/themes/air, last access: 29 July 2023). As shown in Fig. 6a and c, the interannual trends in estimated deposition were basically consistent with those in emissions, with observed reduction for both OXN and S deposition over the USA and Europe. With the slowdown in economic growth and the implementation of air pollution control actions for decades (e.g., the Clean Air Act (CAA) in the USA and the Convention on Long-Range Transboundary Air Pollution (CLRTAP) in Europe), the emissions of NOX and SO2 have been reduced by more than 60 % and 90 % between 1980 and 2020 respectively (Constantin et al., 2020; Fowler et al., 2013; Skyllakou et al., 2021; Zhao and Qiao, 2022). However, as a result of the rapidly growing demand for economic development and energy, the fossil fuel consumption and fertilizer utilization increased by 3.2 and 2.0 times during 1980–2010 for China, which ultimately led to an increase in the OXN and RDN deposition from 2005 to 2010 (An et al., 2019; Li, 2020; Liu et al., 2020). Following developed countries, gradually tightened measures of reducing SO2 and NOX have been launched since 2005 and 2011 respectively, and the deposition began to decline afterwards.

Figure 6The interannual variations of emissions, deposition, and for China, 28 European countries (EU), and the USA. All the data are relative to the 2005 levels. The grey dotted lines are a visual guidance for 1.0 on each of the y axes. (a) NOX emissions and OXN deposition; (b) NH3 emissions and RDN deposition; (c) SO2 emissions and sulfur deposition; and (d) . The emissions data were respectively taken from MEIC, the European Environment Agency (EEA, https://www.eea.europa.eu/themes/air), and the US Environmental Protection Agency (EPA, https://www.epa.gov/air-emissions-inventories/air-pollutant-emissionstrends-data), while deposition data were taken from the European Monitoring and Evaluation Programme (EMEP, https://projects.nilu.no/ccc/index.html) for Europe and Clean Air Status and Trends Network (CASTNET, https://www.epa.gov/castnet) and the National Atmospheric Deposition Program (NADP, https://nadp.slh.wisc.edu/networks/national-trends-network/) for the USA.
We selected the periods with fast declines in deposition of OXN and S for the three regions and compared them in Table 1. The relative changes in deposition were smaller than those of emissions for all the regions, and greater declines were found for S for both emissions and deposition than for OXN. Compared with Europe and the USA, China had the smallest benefit of precursor emission abatement on deposition. For example, the SO2 emissions in the USA, Europe, and China had been cut by 78.4 % (2003 to 2016), 57.6 % (2000 to 2013), and 75.5 % (2007 to 2020) respectively, while S deposition had declined by 72.5 %, 49.9 %, and 27.0 %. This may be caused by a lagging response of deposition to emission abatement, which is more prominent in China. Europe and the USA started emission controls earlier than the selected periods, resulting in a smaller gap between the changes in emissions and deposition afterwards. The comparison implies that the effect of short-term emission reduction in China would not immediately be fully reflected in the deposition. As reported by Yamaga et al. (2021), the trend of the NO to non-sea-salt SO concentration ratio in precipitation in Japan clearly corresponded to that of the NOX to SO2 emission ratio in China. Therefore, the short-term emission reduction in China was likely to reduce the transboundary deposition to downwind areas (such as Japan) sooner. Under this condition, continuous efforts on emission abatement should be made to achieve substantial reduction in domestic deposition and to further mitigate ecological risks. Along with continuous controls of anthropogenic emissions, moreover, the variation of natural sources (e.g., NOX from soils) may play a more important role on the changing deposition and deserves more attention in the future.
Table 1Comparison of relative change rates of emissions and deposition in the process of pollution control in China, Europe, and the USA. The starting and ending time was selected according to the period of the fastest decline of deposition in China, and the time period of emission decline was selected according to the reference deposition. The emission data were respectively taken from MEIC, the European Environment Agency (EEA, https://www.eea.europa.eu/themes/air), and the US Environmental Protection Agency (EPA, https://www.epa.gov/air-emissions-inventories/air-pollutant-emissionstrends-data), while deposition data were from the European Monitoring and Evaluation Programme (EMEP, https://projects.nilu.no/ccc/index.html) for Europe and Clean Air Status and Trends Network (CASTNET, https://www.epa.gov/castnet) and National Atmospheric Deposition Program (NADP, https://nadp.slh.wisc.edu/networks/national-trends-network/) for the USA.
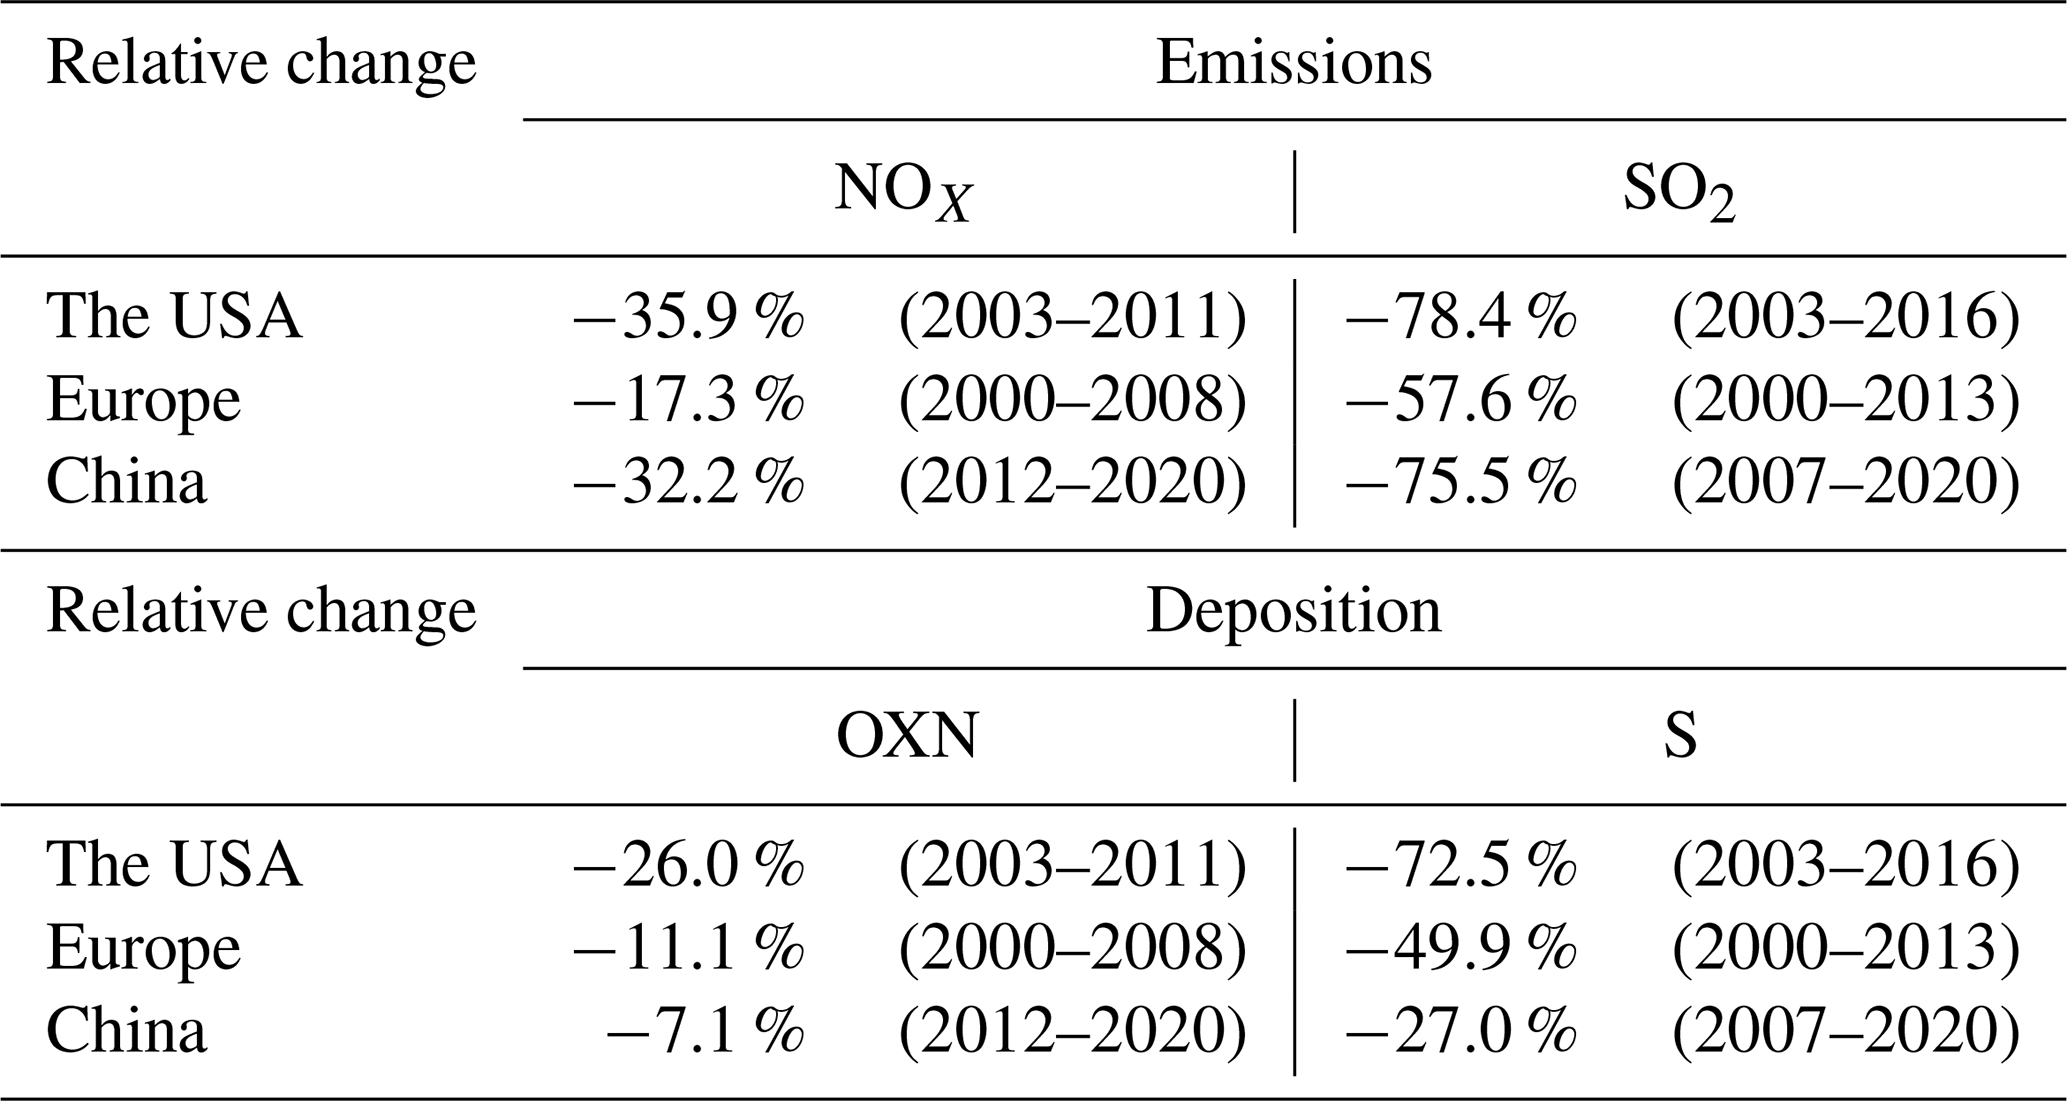
Figure 6d presents the interannual changes of for China, the USA, and Europe (28 countries). The in China was higher than those in the other two, with an average of 1.3 in 2005 to 2020 (0.9 and 1.0 for the USA and Europe during the same period). As a developing country, China is an important food producing country in the world, with a long history of agricultural production and planting. Large agricultural production and relatively weak policy management made China the largest NH3 emission producer in the world, leading to a high proportion of RDN deposition to the total N deposition (Kang et al., 2016; Liu et al., 2022). In contrast, in developed USA and Europe with high levels of agricultural mechanization and abundant industry and transportation, the relatively high NOX emissions compared to NH3 resulted in smaller than China.
Similar temporal changes in can be found for the USA and China, i.e., decline in earlier years and growth afterwards. For the USA, the turning point of occurred in 1999, 13 years earlier than that of China in 2012. The turning points were closely associated with the introduction and implementation of NOX emission controls for the two countries (CAA Amendments since 1990 for the USA and NAPPCAP since 2013 for China). While RDN in China has been the major species since 2005, the OXN in the USA was larger than RDN for over 20 years. The has kept growing since 2000 and exceeded 1 in 2014, indicating a transition of major N species in the deposition. Different from China and the USA, in Europe has kept declining since 2000 and was smaller than 1 after 2013. In many European countries with abundant agricultural activities (such as the Netherlands, Germany, Switzerland, and France), chemical fertilizer and livestock breeding release a large amount of NH3. Europe attached great importance to the source control of agricultural pollution (though not as strong as for NOX), it adopted the economic guidance method for agricultural environmental subsidies, and member states actively assumed the responsibility for governance for decades (i.e., Common Agriculture Policy, CAP; Zhang et al., 2020). Therefore, the control of NH3 in Europe was ahead of China, resulting in continuous reduction in NH3 emissions and thereby .
3.3 Spatial variability in N and S deposition
Figure 7 shows the spatial distributions of N and S deposition fluxes during 2005 to 2020. In general, relatively large deposition was found in eastern China with more population and developed industrial economy (e.g., SE and part of NC in Fig. 1). Hotspots of dry deposition were commonly located in the north, while wet were located in the south. As a joint effect of concentrations and Vd, a high level of OXN dry deposition was estimated in areas with high vegetation cover, such as the Yunnan and Fujian provinces. For S dry deposition, coal-fired boilers for power and heating were intensively distributed in the north, leading to abundant SO2 emissions and thereby dry deposition. Furthermore, the relatively stable weather conditions with less convection in the north were unfavorable to the dispersion and dilution of pollutants. The emissions were thus liable to be deposited locally. For RDN, the agricultural production, animal husbandry, and biomass burning in NC and the northern part of SE led to relatively high NH3 emissions and thereby high dry deposition. The more acidic and humid soils in the south made NH3 more difficult to release, resulting in lower dry deposition compared to the north. Large wet deposition was mainly found in the south of China, associated with the uneven distribution of precipitation. In summer, the air masses in the western Pacific Ocean and the South China Sea were affected by the southeast and southwest monsoon, significantly increasing the rainfall in southeast China. For the total deposition (wet plus dry), the high deposition of OXN and S were located in SE, while RDN and total N were mainly concentrated in NC and the north of SE.
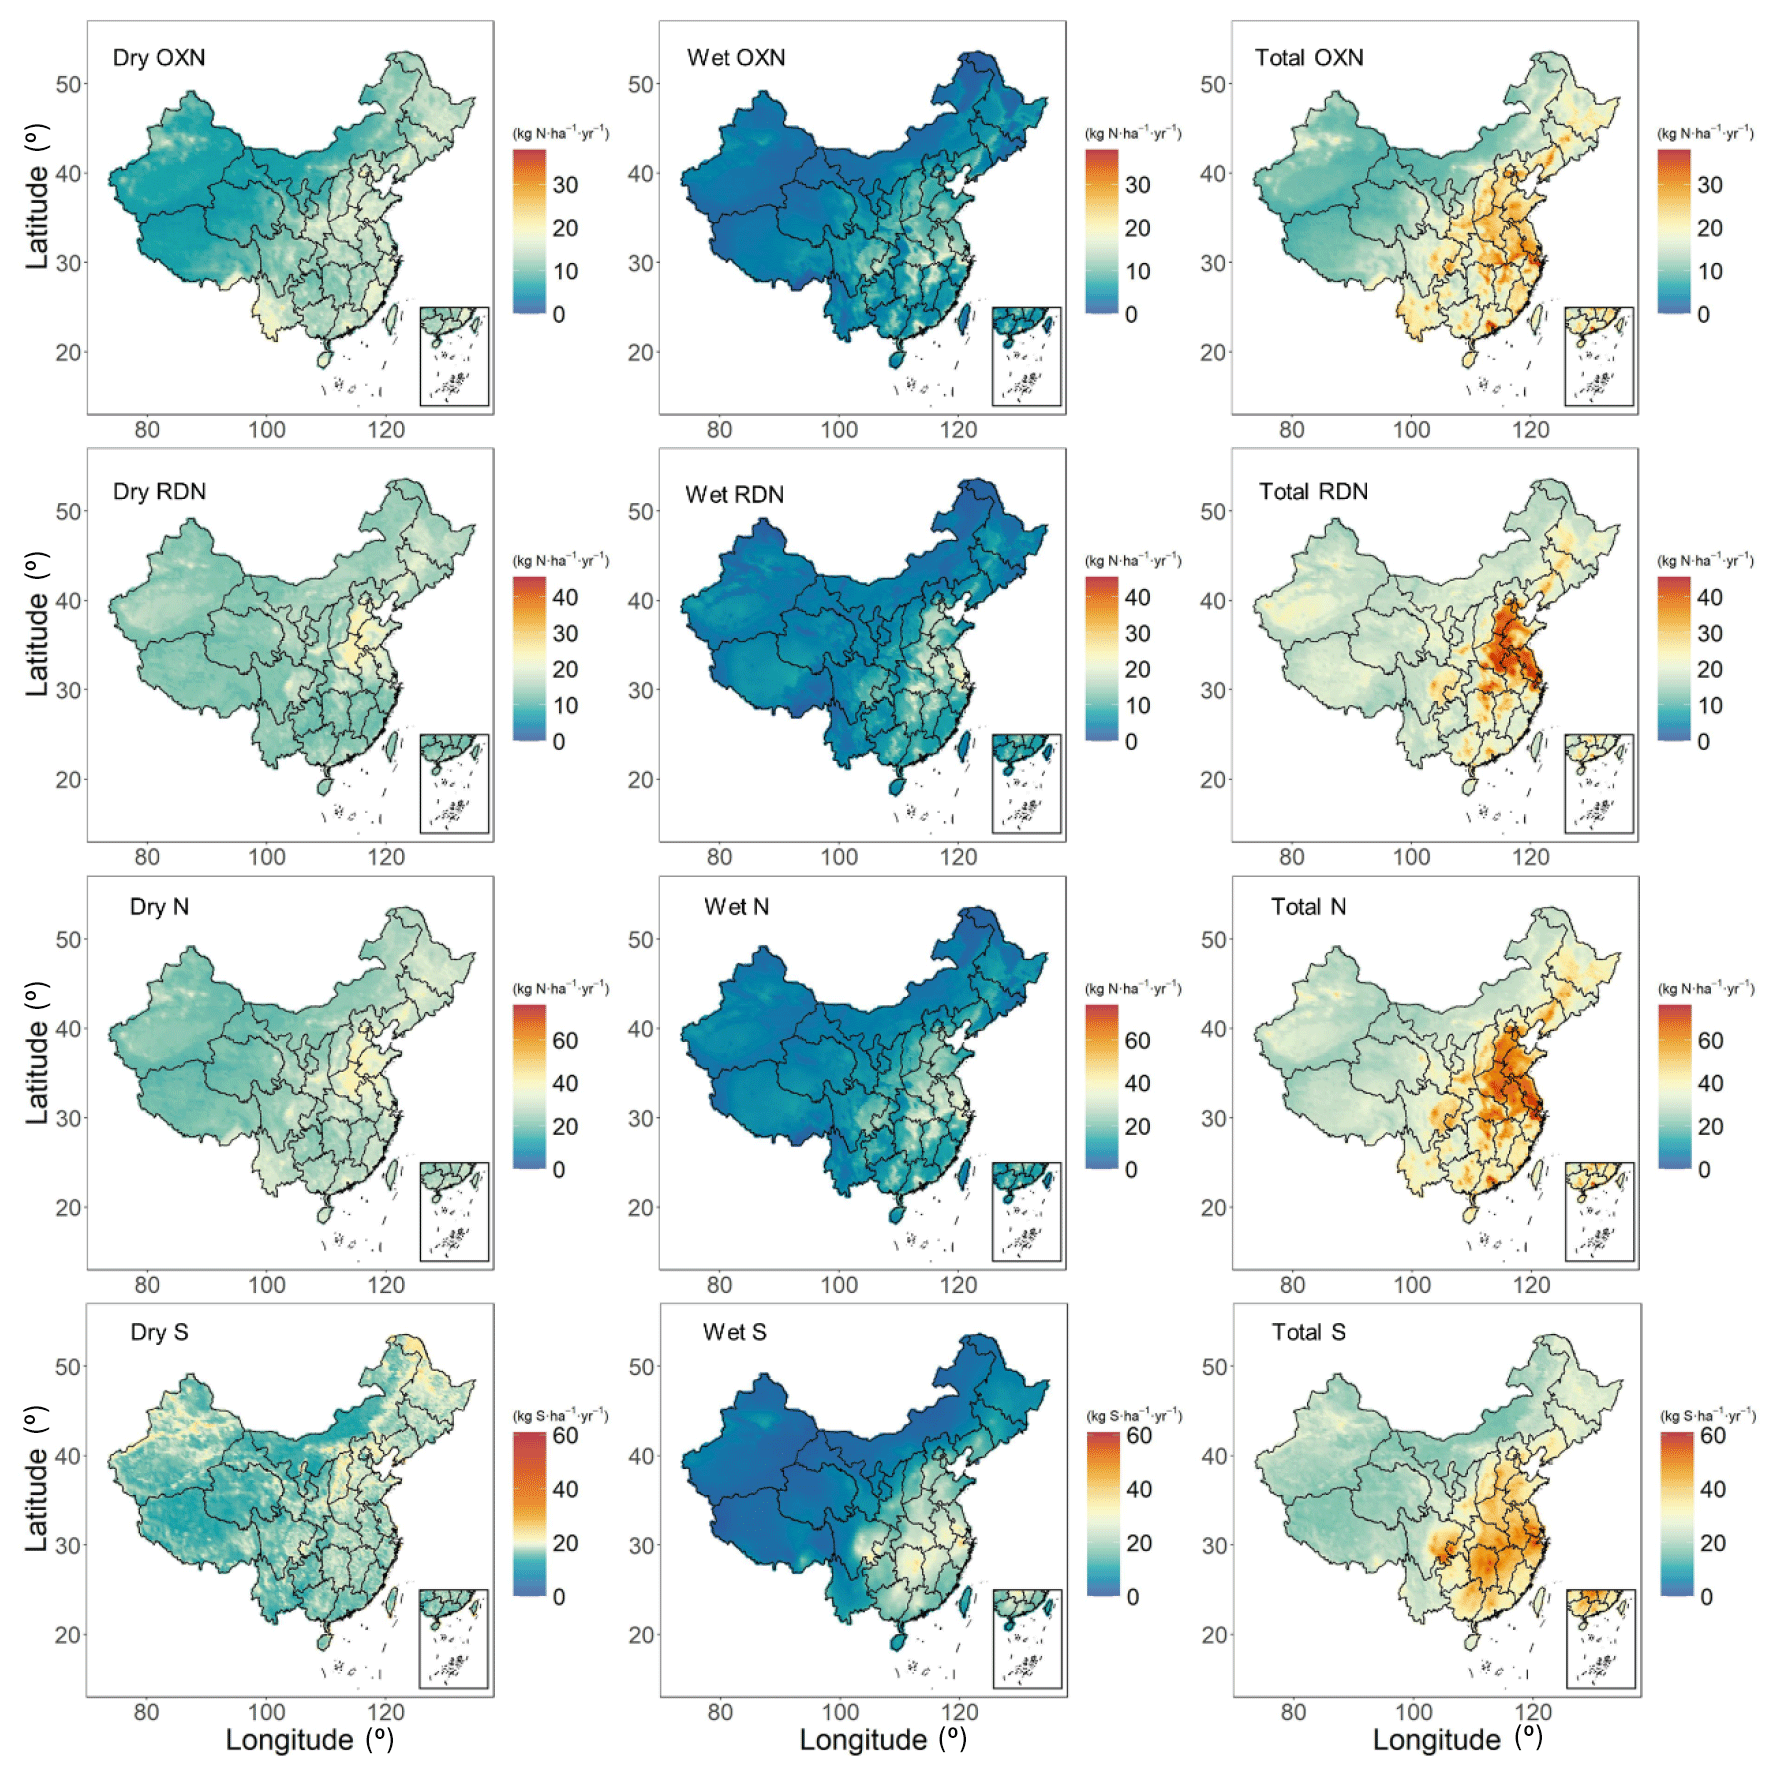
Figure 7The spatial distributions of N and S deposition flux from 2005 to 2020.
As shown in Table S7 in the Supplement, the of N and S in eastern China (SE + NC with Inner Mongolia excluded) was smaller than that in western China (NW + TP), attributed mainly to the large precipitation in the former. Given the dry climate and less anthropogenic activities, the pollution was mainly removed from the atmosphere by dry deposition in western regions. The of TP was the highest out of the six regions, with 2.6 and 3.7 for total N and S respectively. The in NE, NW, and NC was generally higher than that in the south (SE and SW), resulting also from the abundant precipitation in the south. Higher was found in the west (e.g., NW and TP) and lower in the east (Table S7), as more developed industry in the east resulted in relatively large NOX emissions and thereby OXN deposition, while farming and animal husbandry shared more in the economy in the west, leading to substantial NH3 emissions.
Figure 8 and Table 2 compare the relative changes of total deposition (wet plus dry) of different species for eastern, western, and whole country. The interannual changes of deposition for all species were smaller than that of emissions (Table 2), reconfirming the lagging response of deposition to changing emissions as mentioned in Sect. 3.2. During the period when emissions declined rapidly, the change of deposition has not yet occurred. It should be noted that the emission reduction might be overestimated by MEIC, particularly for SO2 for recent years. Through a “top-down” methodology based on satellite observation, China's SO2 emissions were estimated to decline by 26 % from 2011 to 2015 (Qu et al., 2019), slower than the estimation by MEIC at 42 %. The relative changes for N and S deposition in eastern China were generally larger than the whole country, indicating the effectiveness of extremely stringent emission controls on those regions with abundant emissions from industrial and traffic sources. The OXN deposition for all the concerned regions shows an invert “V” pattern over time, consistent with the progress of NOX emissions control (Fig. 8a). The relative annual changes in eastern China (9 % in 2005 to 2012 and −12 % in 2012 to 2020) were generally greater than in western China (4 % in 2005 to 2012 and −5 % in 2012 to 2020). More specifically, the turning point for western China was later than the east, likely resulting from later implementation of emission control policies. Most measures were first implemented in the highly developed key regions in the east and then applied more widely afterwards. As shown in Fig. 8b and Table 2, RDN deposition was relatively stable before 2012, and the temporal changes in eastern and western China were generally consistent with each other. The lack of comparable control policies for NH3 and the strict policy of acid precursors likely explained the increasing trend in RDN afterwards, with 9 % in eastern and 10 % in western China between 2012 and 2020. The biggest reduction was achieved for S deposition, and the decline in eastern China was faster than that in western China (Fig. 8c). Attributable to the earlier and broader use of FGD at coal combustion sources, greater abatement of SO2 emissions was achieved than NOX or NH3 over the past decade, leading to the faster reduction in S deposition than in OXN or RDN (Table 2). In addition, the reduction during 2012 to 2020 (28 %, 18 %m and 21 % for the eastern, western, and whole country respectively) was clearly larger than that during 2005 to 2012 (3 %, 9 %, and 7 % respectively), indicating the greatly improved SO2 controls compared to earlier years.
Table 2The interannual changes in deposition and emissions of N and S by region for 2005 to 2020. Eastern China includes NC (Inner Mongolia excluded) and SE, and western China includes TP and NW (see Fig. 1 for the region definitions). P1 and P2 indicate 2005 to 2012 and 2012 to 2020 respectively.
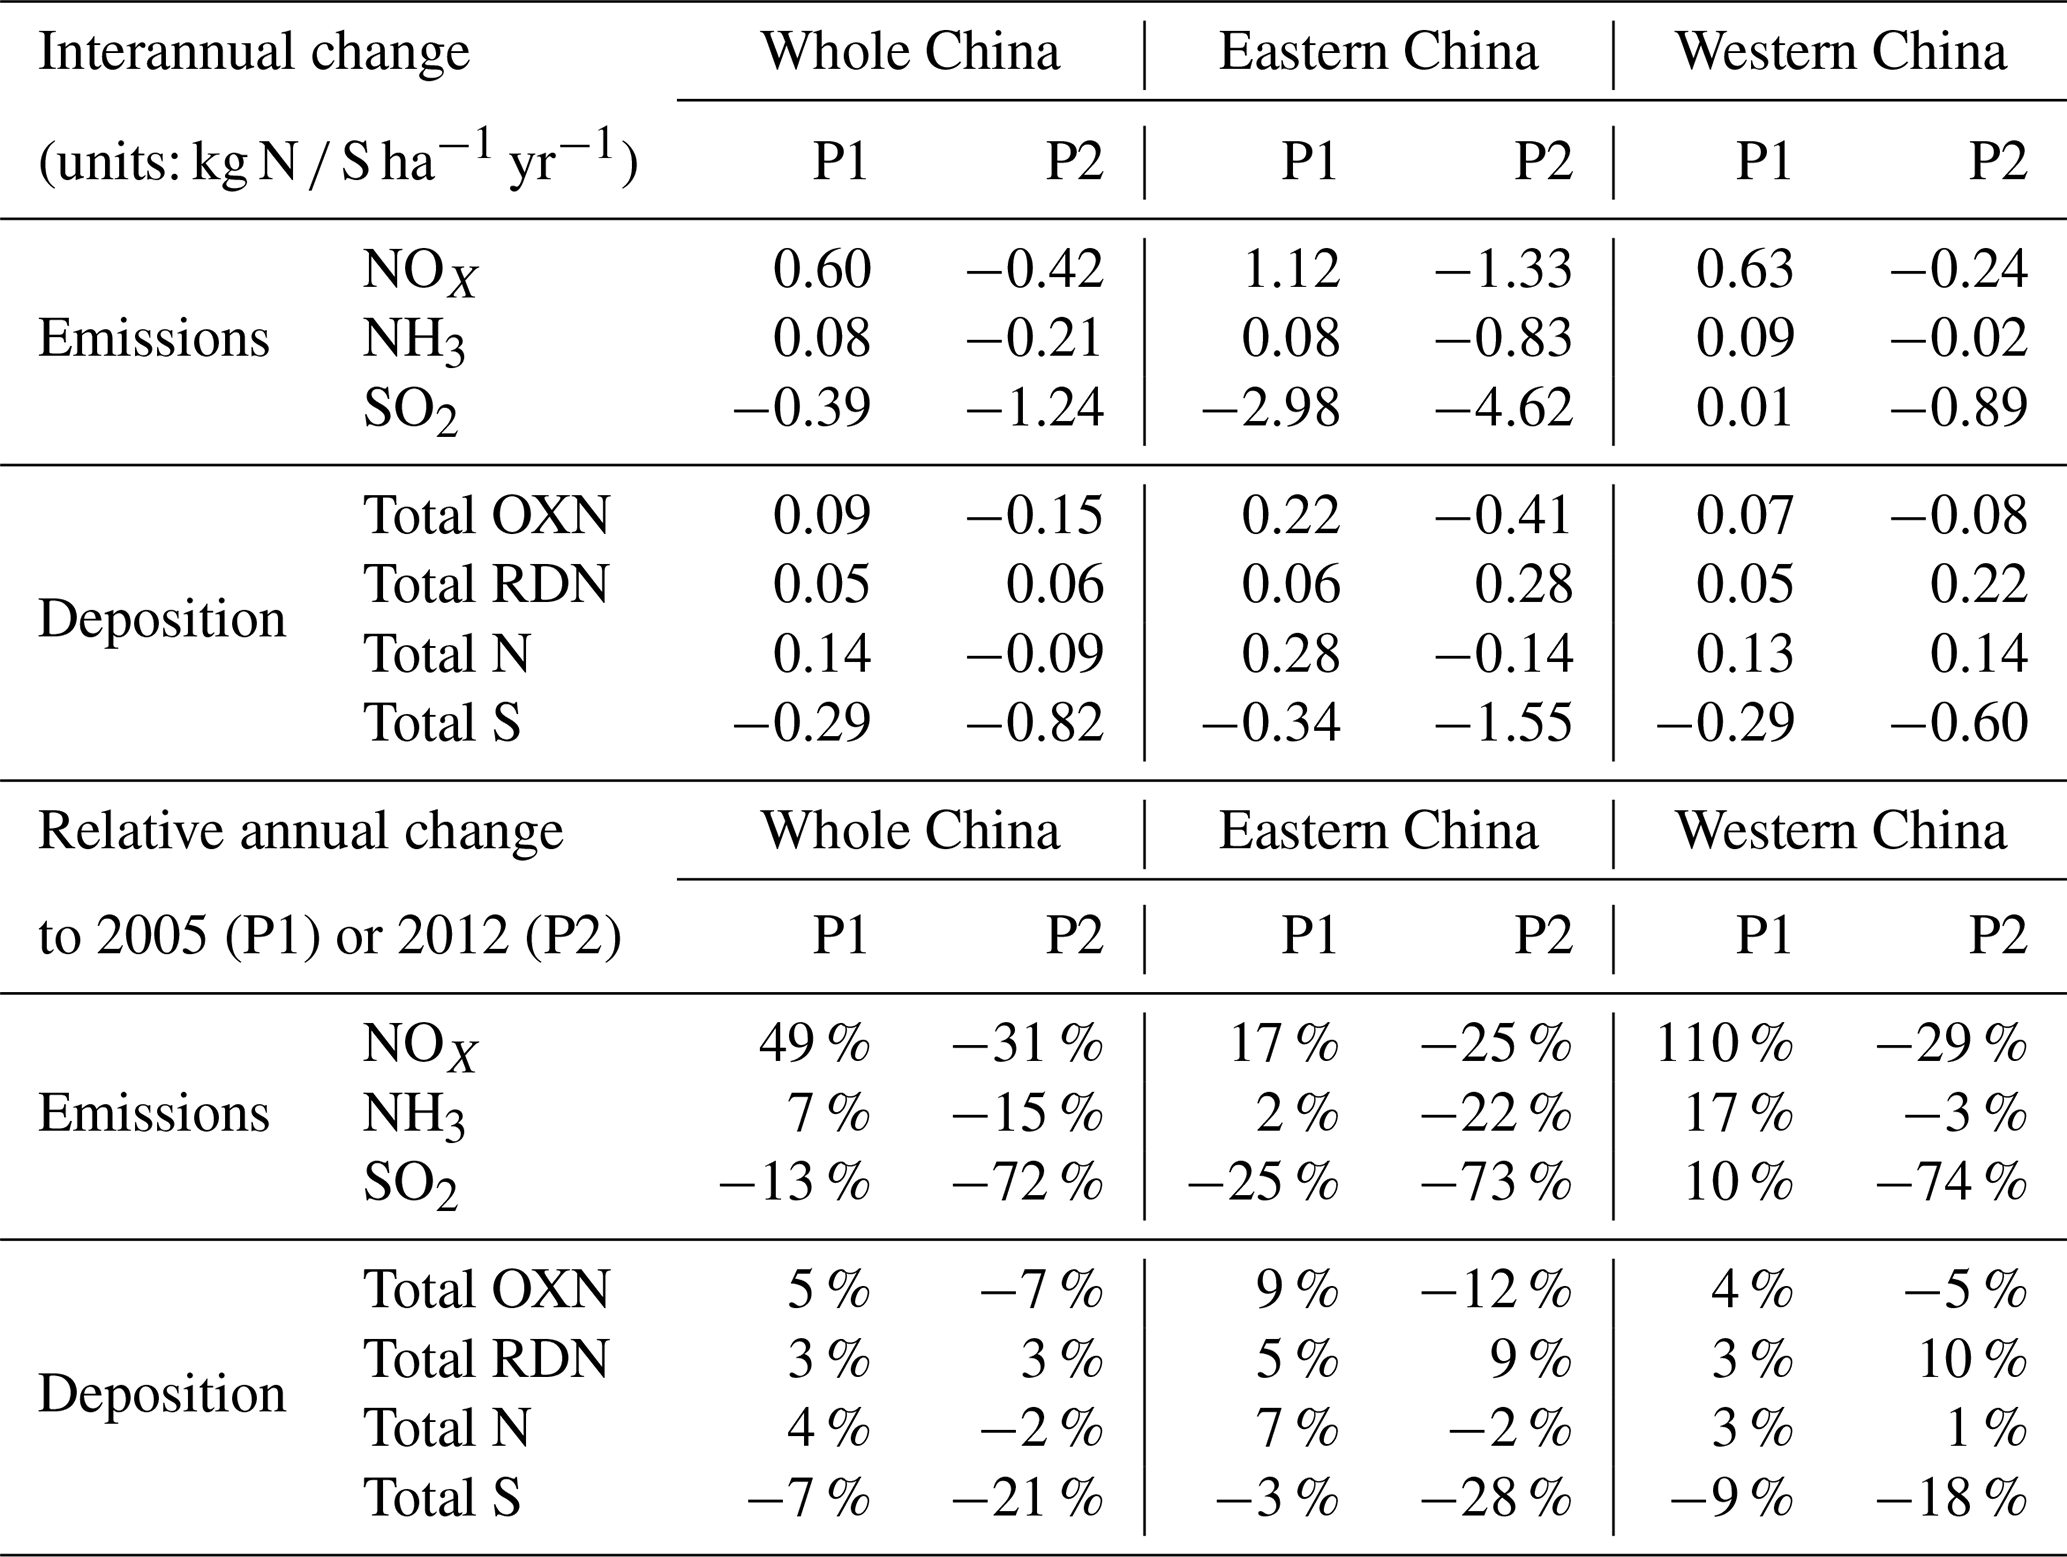
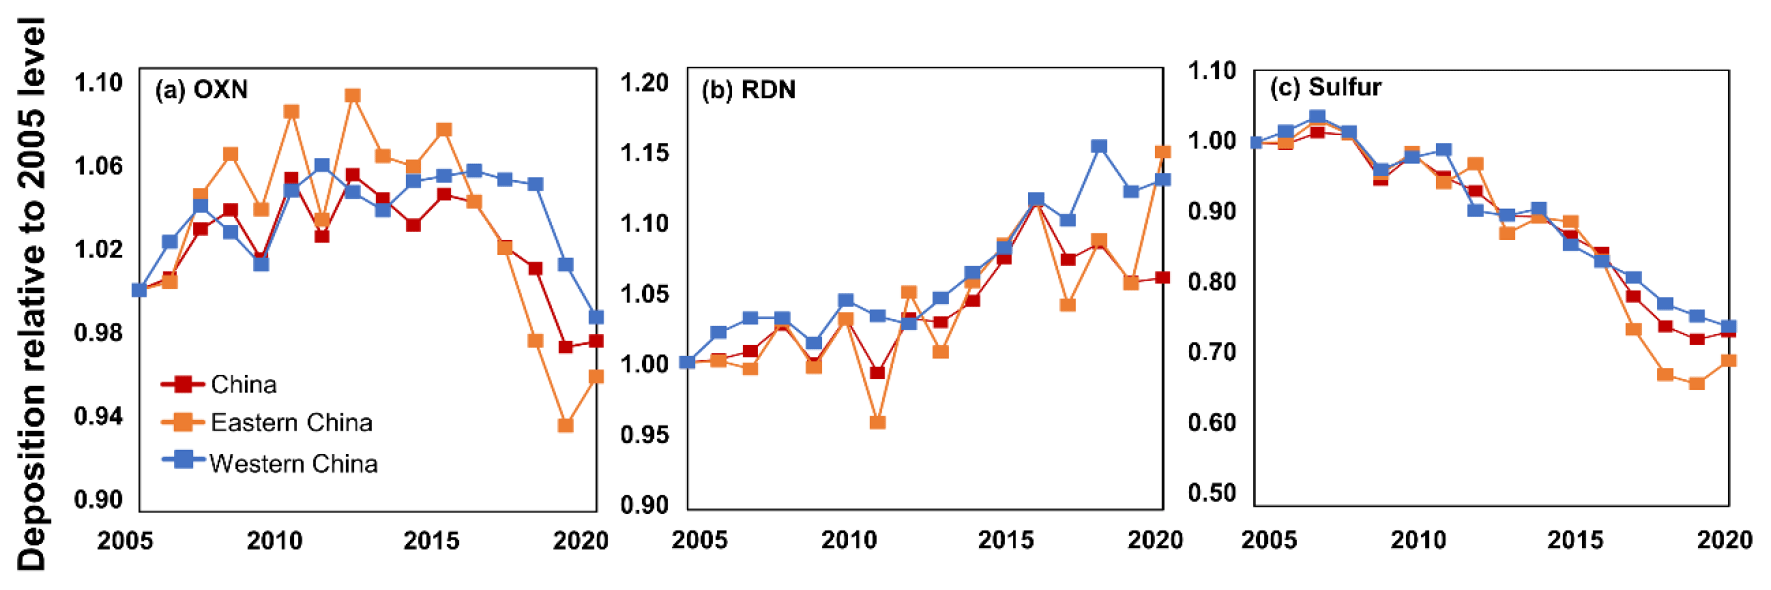
Figure 8The interannual variations and relative changes of deposition of OXN (a), RDN (b), and sulfur (c) by region. All the data are relative to the 2005 levels. The orange line represents eastern China (SE and NC with Inner Mongolia excluded, see Fig. 1 for the region definitions), the blue line represents western China (NW and TP), and the red line represents the average level of the whole of China.
The ratio of deposition to emissions () is used to analyze the interactions between the pollutant sources and sinks. Figure 9a shows the annual mean ratios during 2005 to 2020 by species and region. The nationwide of OXN, RDN, and S were 1.4, 2.4, and 2.3 respectively. The in eastern China (e.g., NC and SE) was generally smaller than in western China (NW, SW, and TP). The low identified those regions as the major sources of air pollutants due mainly to their intensive emissions, likely influencing air pollution levels in surrounding regions. With less industry, energy consumption, and population, by contrast, western China received relatively high deposition compared to local emissions, resulting in large . The very high ratio of indicated that TP was strongly influenced by regional pollution transport. The of RDN in the six regions were higher than that of OXN and S (except for TP). Due to its relatively short life time, most of the NH3 deposits near the source area, while stronger transport and chemical reaction may occur for NOX and SO2 given their longer life time. Significantly positive correlations were found between regional deposition and emissions for all the species concerned, with R2 estimated at 0.81, 0.92, and 0.78 for OXN (Fig. 9b), RDN (Fig. 9c), and S (Fig. 9d) respectively. The result implies that the N and S depositions to the six regions were strongly dependent on the spatial pattern of anthropogenic emissions.
The annual emissions, deposition, and by land-use type were displayed in Table S8 in the Supplement. High deposition was commonly found in areas with high energy consumption and large emissions, such as urban and construction sites. Associated with different human activities, moreover, the for S and OXN were smaller in urban regions than those in rural ones, whereas that for RDN was slightly larger in urban areas. Transportation and industry resulted in larger NOX and SO2 emissions in urban locales, and agricultural activities enhanced NH3 in rural ones.
Figure 10 shows the spatial distribution of multi-year average deposition by season, which was influenced jointly by varying meteorology and emissions. Basically, larger deposition was found in summer than that in winter, and the seasonal difference was particularly bigger for N. The deposition in summer was estimated to be 1.9 and 1.6 times in winter for OXN and RDN respectively, while the ratio was much smaller at 1.1 for S. As shown Fig. S5 in the Supplement, the Vd of HNO3 in summer was 4.4 times in winter, leading to larger OXN deposition in summer. Moreover, warm weather elevated the volatility of NH3 in croplands, resulting in greater emissions and thereby deposition in summer. The hotspot of deposition was commonly found in NC and northern SE in summer, while it moved to central SE in winter, attributed partly to the prevailing northwesterly wind.
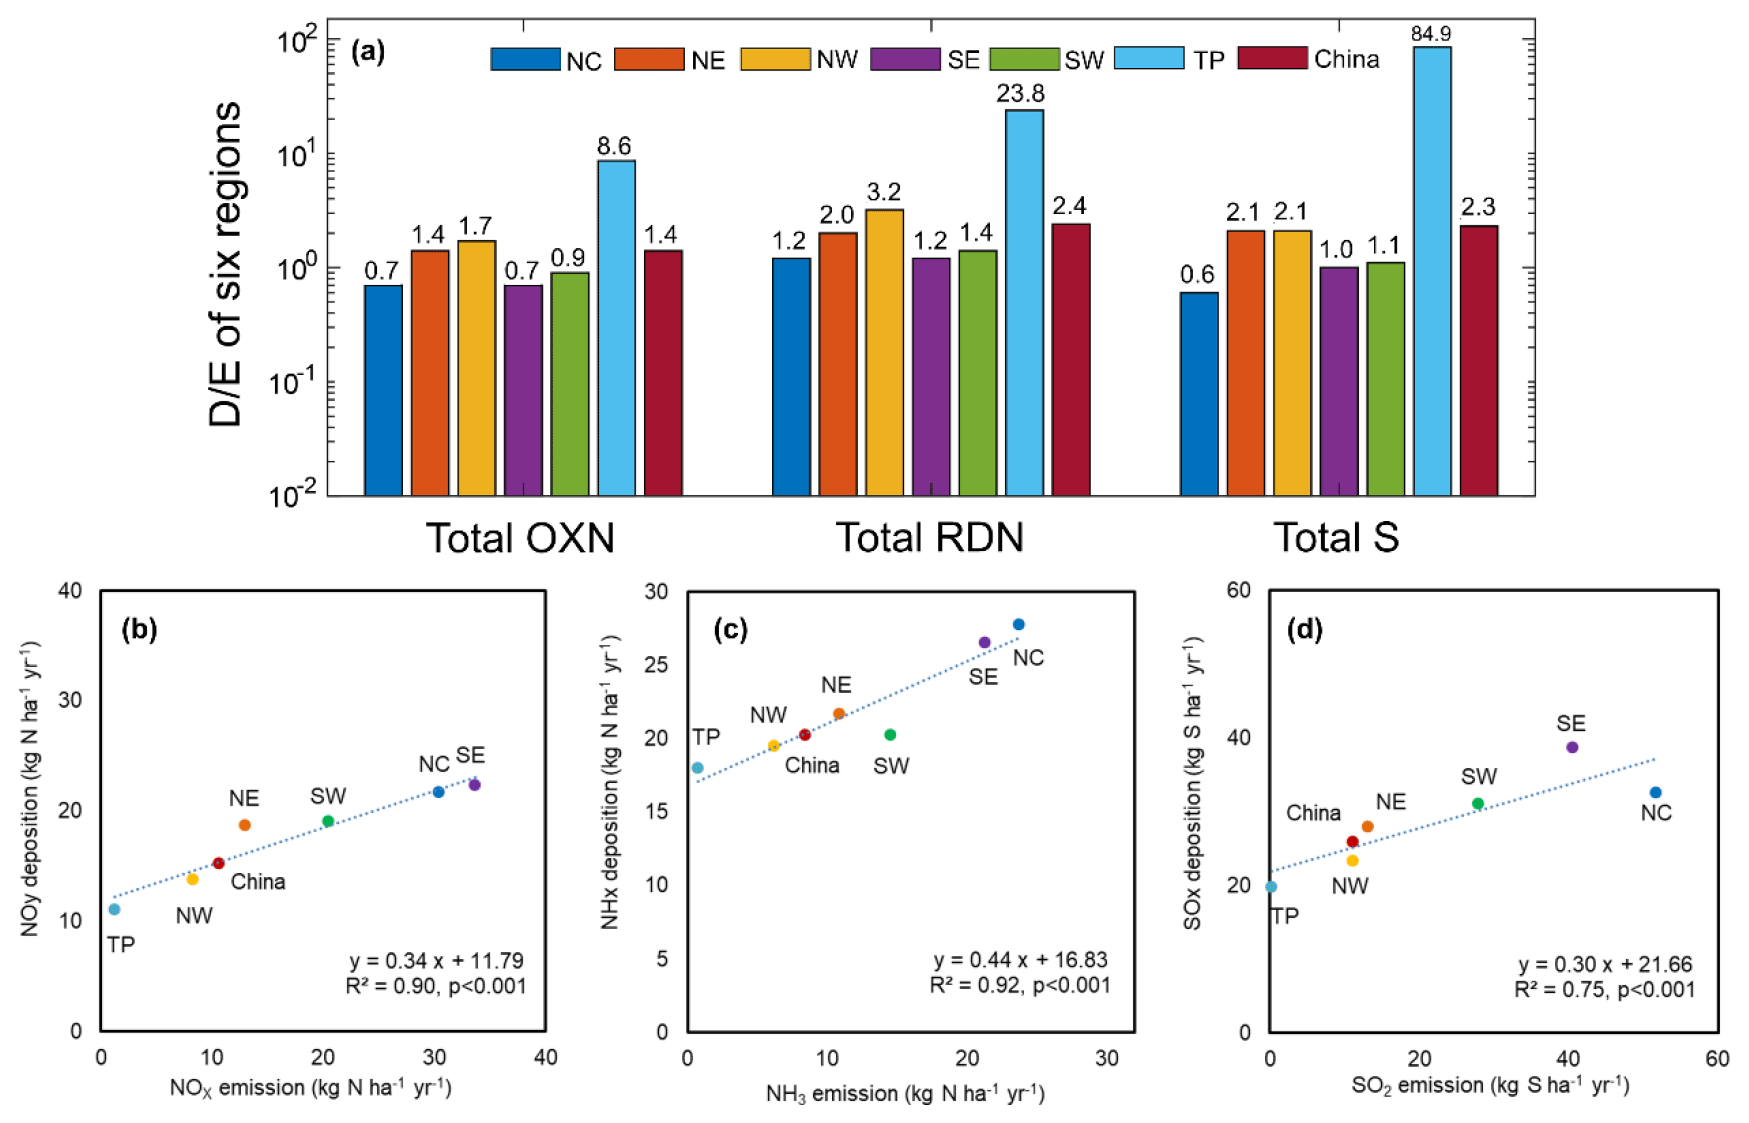
Figure 9Annual mean ratio of OXN, RDN, and sulfur from 2005 to 2020 in different regions (a) and the linear relationship between regional deposition and emissions (b–d).
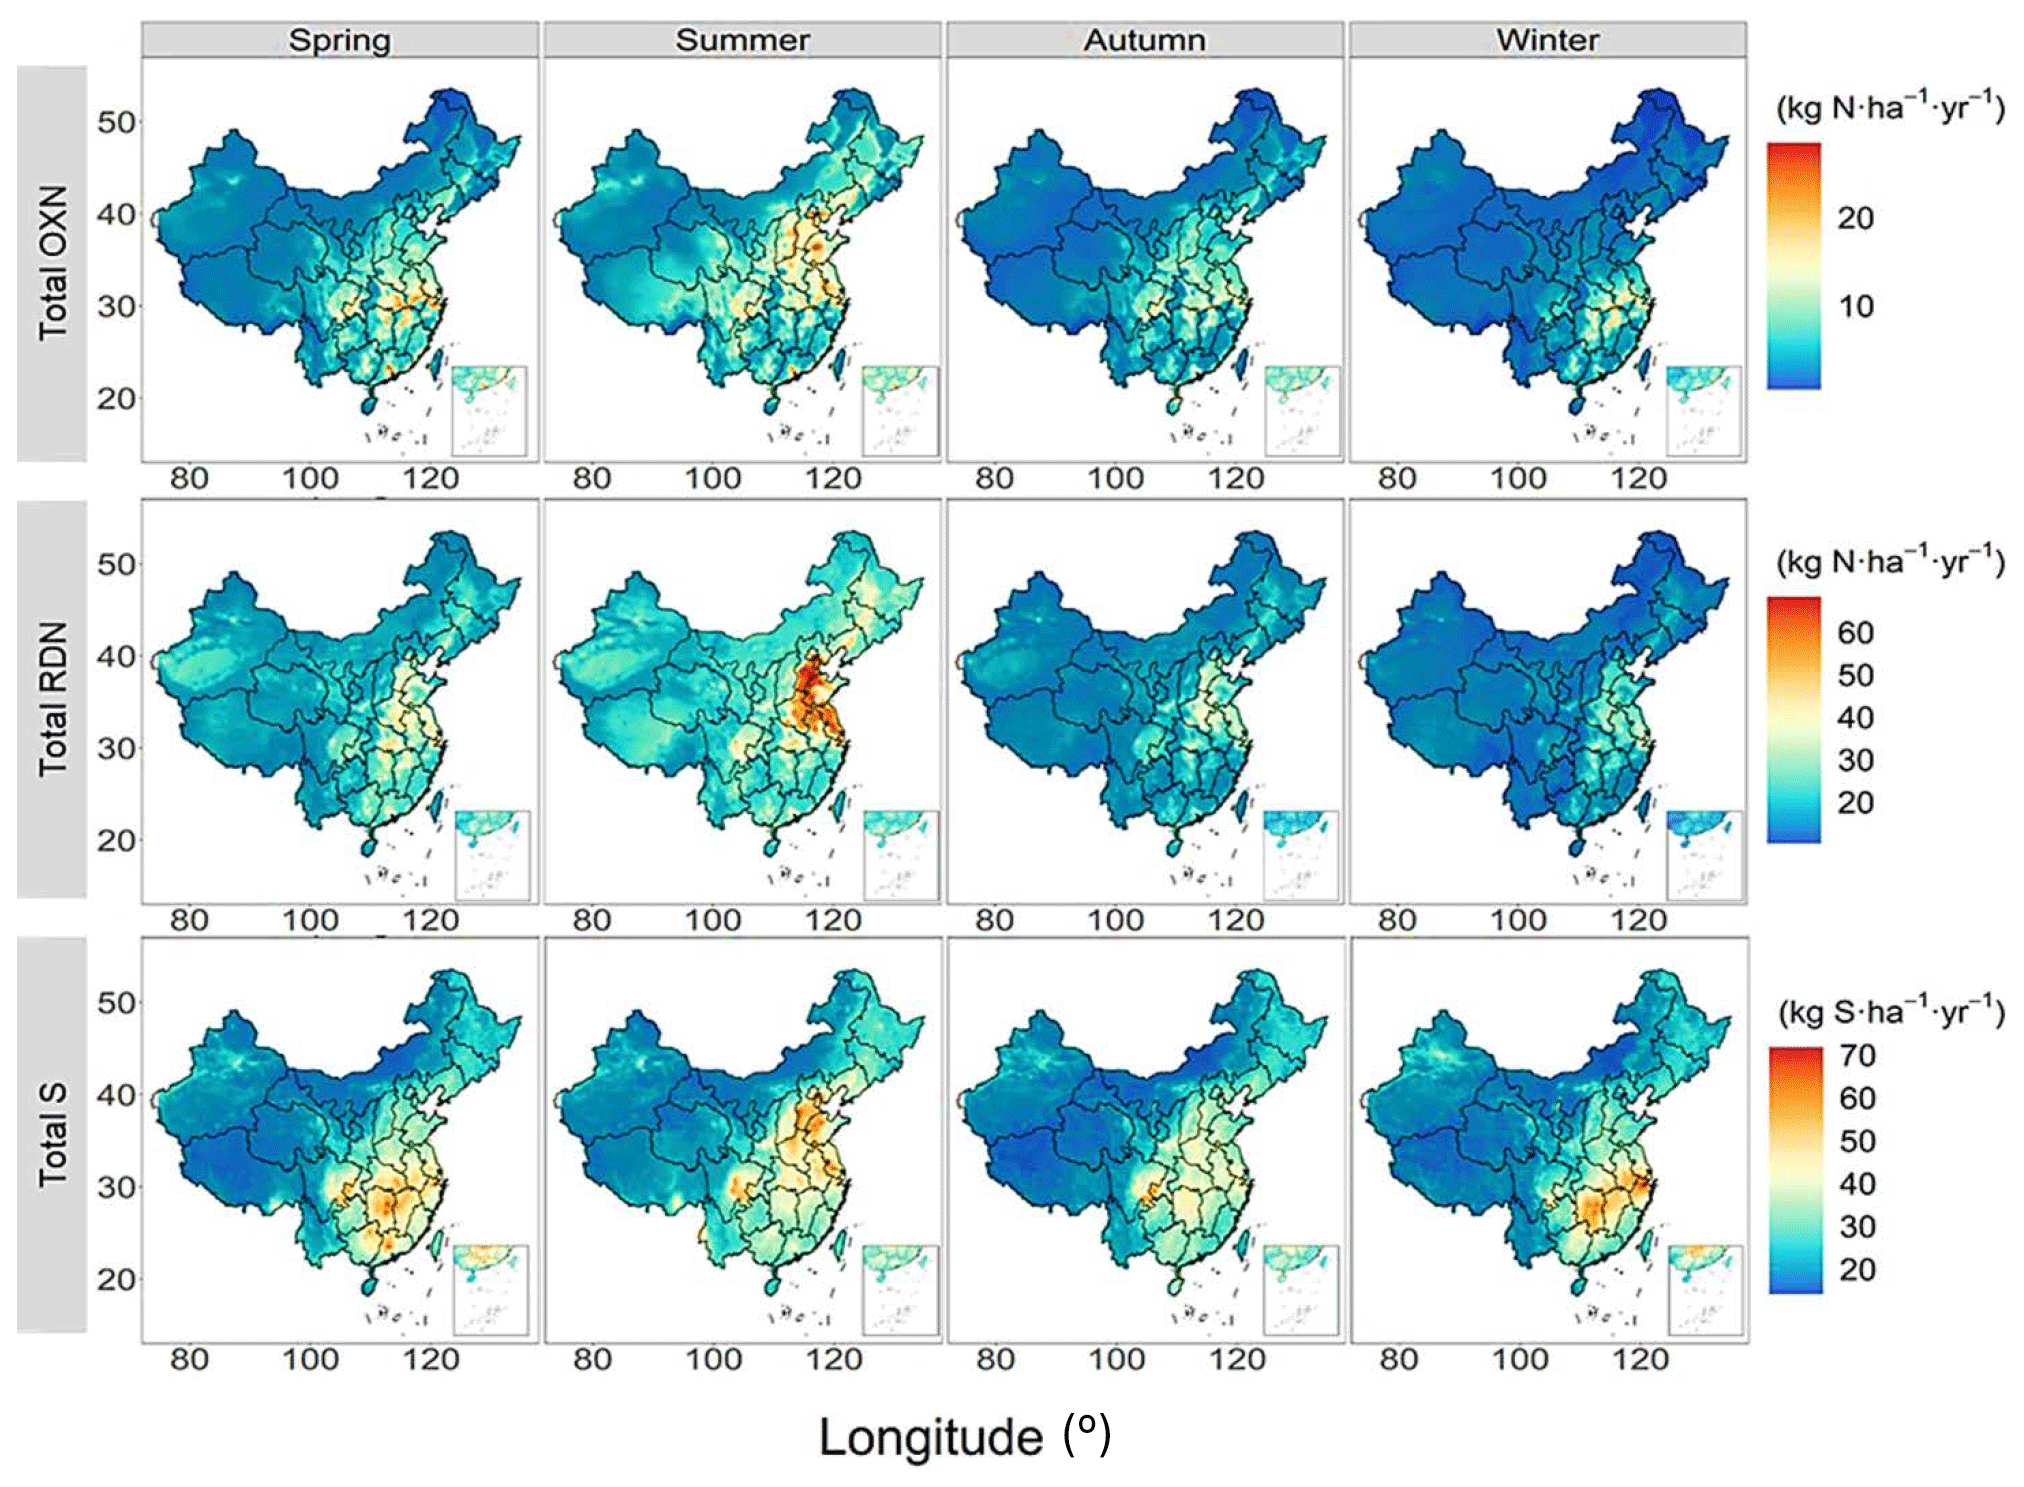
Figure 10The spatial distribution of the multi-year seasonal variation of the total deposition across 2005 to 2020.
3.4 Uncertainties
Uncertainties existed in current analysis. First, the estimated dry deposition or Vd could not be fully examined with sufficient data from direct observation, attributed mainly to the lack of field measurements. Micrometeorological methods can be used for direct observation of dry deposition, including the eddy correlation method, gradient method, and relaxation vortex accumulation method. Due to the need for extremely fast response instruments and uniform underlying surfaces, those methods have not yet been widely applied in a long-term and extensive manner. We compared the simulated Vd in this work with other simulation studies in Table S9 in the Supplement. The values from various CTMs are commonly of the same orders for most cases, while big differences exist in some species/land-use types, e.g., NO2 for coastal regions. The bias could be better quantified when more direct observations of Vd get available.
Second, error may come from ground-level monitoring data. We collected available data from different monitoring networks and ignored the difference in observed deposition from diverse methods of sample collection and measurement. Moreover, current RF models relied on the data from observation sites, most of which are located in eastern China, with dense populations and a developed economy. The model accuracy for remote areas (such as NW and TP) should be further evaluated when more observation data become available for those areas.
Third, there was additional uncertainty in the estimation of SO dry deposition, as there were limited observed ambient concentrations of SO available for estimation of dry deposition, and CTM had to be applied. The conversion of SO2 to SO is influenced by the atmospheric oxidizing capacity and thereby the NOX concentration (He et al., 2014; Ye et al., 2023). Along with economic development and implementation of air pollution controls, the changing emissions of NOX as well as some other species (e.g., volatile organic compounds) have altered the atmospheric oxidizing capacity within the research period. Using the relationship between 2013 and 2020 to extrapolate the SO deposition for 2005 to 2020 would potentially bring some uncertainty.
Furthermore, bulk deposition obtained from the open precipitation gauge contain part of the dry deposition and therefore likely overestimate actual wet deposition. The bias varied by region and was hard to quantify at the national level. For example, dry deposition was observed to account for around 20 % of the bulk at three rural stations in the North China Plain, and the contribution could reach 39 % in some urban areas (Zhang et al., 2015; Zhang et al., 2008). In contrast, the difference between bulk and wet deposition of dissolved inorganic nitrogen (DIN) was equal to 12 % of the bulk in a rural site in SW (Kuang et al., 2016; Song et al., 2017). Basically, the uncertainty was greater in areas with a higher proportion of dry to total deposition (such as NW and NE areas with less precipitation) and smaller in areas with a lower proportion (such as SE with more precipitation). As SE is the most developed region in China, with relatively high emissions and deposition across the country, the uncertainty from bulk deposition measurement and application is likely of limited impact on the national level or the overall spatial pattern of deposition. Along with continuous development of monitoring networks and increasing availability of deposition data for diverse species, those uncertainties can be further reduced, and more accurate deposition estimation can be expected.
We developed a full N and S deposition dataset for mainland China at the horizontal resolution of 0.25∘ for 2005 to 2020, combining the ground-level observations, satellite-derived VCDs, meteorological and geographic information, and CTM. Based on the newly developed RF method, the annual average dry deposition of OXN, RDN, and S in China was estimated at 10.4, 14.4, and 16.7 kg ha−1 yr−1, while the total deposition reached 15.2, 20.2, and 25.9 kg ha−1 yr−1 respectively, with the wet deposition estimated with a GAM model included. The of N kept relatively stable at the beginning and then gradually increased, especially for RDN, while that of S declined for over 10 years and then slightly increased. Within the whole study period, was estimated to be greater than 1 and clearly larger than that of the USA and Europe, with a continuous decline from 2005 to 2011 and a growth afterwards. The frequent agricultural activities and relatively weak management of manure have resulted in abundant NH3 emissions and thereby a high proportion of RDN deposition. Improved NOX emission control was the main reason for the elevated for recent years. Compared with Europe and the USA, China had the smallest benefit of precursor emission reduction on deposition. The prominent lagging response of deposition to emission abatement requires continuous long-term emission control efforts to substantially reduce atmospheric deposition. As a joint effect of emissions and individual meteorological factors, a downward gradient from east to west was found for dry deposition of OXN while from north to south for S. The wet deposition frequently occurred in the south of China, associated with the spatial distribution of rainfall. The deposition of OXN and S declined faster in eastern China than that in the west after 2012, indicating the effectiveness of extremely strict emission control in developed areas with abundant emissions from industry and transportation. The in eastern China was generally smaller than that in the west, as the former was the major sources of air pollutants, and the latter received relatively high deposition through regional transport. At the national scale, the deposition strongly depended on the spatial pattern of anthropogenic emissions within the regions. The current study broadens the scientific understanding of China's long-term changes in deposition of typical atmospheric species, as well as the influences of human activities and emission controls. More observation and modeling work is recommended for in-depth analyses on the complicated and changing relationship between emissions and deposition for specific species, as well as the consequent varying effects on ecosystems.
The multiyear deposition data by species at the horizontal resolution of 0.25∘ are available at http://www.airqualitynju.com/En/Data/List/Datadownload (Zhao, 2023).
The supplement related to this article is available online at: https://doi.org/10.5194/acp-23-8531-2023-supplement.
KZ developed the methodology, conducted the research, performed the analyses, and wrote the draft. YZ developed the strategy, designed the research, and revised the paper. LZ and MM provided the support of air quality modeling. WX and XL provided the support of the NNDMN data.
The contact author has declared that none of the authors has any competing interests.
Publisher’s note: Copernicus Publications remains neutral with regard to jurisdictional claims in published maps and institutional affiliations.
This work was sponsored by the Natural Science Foundation of China (42177080) and the Key Research and Development Programme of Jiangsu Province (BE2022838). We acknowledge Qiang Zhang from Tsinghua University for the emission data (MEIC), Jintai Lin from Peking University for the satellite data (POMINO v2), and Zhang Wen from China Agricultural University for deposition the data.
This research has been supported by the National Natural Science Foundation of China (grant no. 42177080) and the Jiangsu Provincial Key Research and Development Program (grant no. BE2022838).
This paper was edited by Leiming Zhang and reviewed by three anonymous referees.
Ahmad, I., Tang, D., Wang, T., Wang, M., and Wagan, B.: Precipitation trends over time using Mann-Kendall and Spearman's rho tests in Swat River Basin, Pak. Adv. Meteorol., 2015, 431860, https://doi.org/10.1155/2015/431860, 2015.
An, Z., Huang, R. J., Zhang, R., Tie, X., Li, G., Cao, J., Zhou, W., Shi, Z., Han, Y., Gu, Z., and Ji, Y.: Severe haze in northern China: A synergy of anthropogenic emissions and atmospheric processes, P. Natl. Acad. Sci. USA, 116, 8657–8666, https://doi.org/10.1073/pnas.1900125116, 2019.
Baker, L. A., Herlihy, A. T., Kaufmann, P. R., and Eilers, J. M.: Acidic Lakes and Streams in the United States: The Role of Acidic Deposition, Science, 252, 1151–1154, https://doi.org/10.1126/science.252.5009.1151, 1991.
Beachley, G., Puchalski, M., Rogers, C., and Lear, G.: A summary of long-term trends in sulfur and nitrogen deposition in the United States: 1990–2013, JSM Environ. Sci. Ecol., 4, 1030–1034, 2016.
Bey, I., Jacob, D. J., Yantosca, R. M., Logan, J. A., Field, B. D., Fiore, A. M., Li, Q. B., Liu, H. G. Y., Mickley, L. J., and Schultz, M. G.: Global modeling of tropospheric chemistry with assimilated meteorology: Model description and evaluation, J. Geophys. Res.-Atmos., 106, 23073–23095, https://doi.org/10.1029/2001jd000807, 2001.
Breiman, L.: Random forests, Mach. Learn., 45, 5–32, https://doi.org/10.1023/a:1010933404324, 2001.
Burns, D. A., Aherne, J., Gay, D. A., and Lehmann, C. M. B.: Acid rain and its environmental effects: Recent scientific advances, Atmos. Environ., 146, 1–4, https://doi.org/10.1016/j.atmosenv.2016.10.019, 2016.
Comero, S., Vaccaro, S., Locoro, G., De Capitani, L., and Gawlik, B. M.: Characterization of the Danube River sediments using the PMF multivariate approach, Chemosphere, 95, 329–335, https://doi.org/10.1016/j.chemosphere.2013.09.028, 2014.
Chen, Y., Zhang, L., Henze, D. K., Zhao, Y., Lu, X., Winiwarter, W., Guo, Y., Liu, X., Wen, Z., Pan, Y., and Song, Y.: Interannual variation of reactive nitrogen emissions and their impacts on PM2.5 air pollution in China during 2005 to 2015, Environ. Res. Lett., 16, 125004, https://doi.org/10.1088/1748-9326/ac3695, 2021.
Cheng, M., Jiang, H., Guo, Z., Zhang, X., and Lu, X.: Estimating NO2 dry deposition using satellite data in eastern China, Int. J. Remote Sens., 34, 2548–2565, https://doi.org/10.1080/01431161.2012.747019, 2012.
Cheng, I. and Zhang, L.: Long-term air concentrations, wet deposition, and scavenging ratios of inorganic ions, HNO3 and SO2 and assessment of aerosol and precipitation acidity at Canadian rural locations, Atmos. Chem. Phys., 17, 4711–4730, https://doi.org/10.5194/acp-17-4711-2017, 2017.
Cheng, I., Zhang, L., He, Z., Cathcart, H., Houle, D., Cole, A., Feng, J., O'Brien, J., Macdonald, A. M., Aherne, J., and Brook, J.: Long-term declines in atmospheric nitrogen and sulfur deposition reduce critical loads exceedances at multiple Canadian rural sites, 2000–2018, Atmos. Chem. Phys., 22, 14631–14656, https://doi.org/10.5194/acp-22-14631-2022, 2022.
Constantin, D. E., Bocaneala, C., Voiculescu, M., Rosu, A., Merlaud, A., Roozendael, M. V., and Georgescu, P. L.: Evolution of SO2 and NOX emissions from several large combustion plants in Europe during 2005 to 2015, Int. J. Environ. Res. Publ. Hlth., 17, 3630, https://doi.org/10.3390/ijerph17103630, 2020.
Du, E. and Liu, X.: High rates of wet nitrogen deposition in China: A synthesis, in: Nitrogen deposition, critical loads and biodiversity, edited by: Sutton, M. A., Mason, K. E., Sheppard, L. J., Sverdrup, H., Haeuber, R., and Hicks, W. K., Springer, the Netherlands, 49–56, https://doi.org/10.1007/978-94-007-7939-6_6, 2014.
Eastham, S. D., Long, M. S., Keller, C. A., Lundgren, E., Yantosca, R. M., Zhuang, J., Li, C., Lee, C. J., Yannetti, M., Auer, B. M., Clune, T. L., Kouatchou, J., Putman, W. M., Thompson, M. A., Trayanov, A. L., Molod, A. M., Martin, R. V., and Jacob, D. J.: GEOS-Chem High Performance (GCHP v11-02c): a next-generation implementation of the GEOS-Chem chemical transport model for massively parallel applications, Geosci. Model Dev., 11, 2941–2953, https://doi.org/10.5194/gmd-11-2941-2018, 2018.
Feng, J., Vet, R., Cole, A., Zhang, L., Cheng, I., O'Brien, J., and Macdonald, A.-M.: Inorganic chemical components in precipitation in the eastern U.S. and Eastern Canada during 1989–2016: Temporal and regional trends of wet concentration and wet deposition from the NADP and CAPMoN measurements, Atmos. Environ., 254, 118367, https://doi.org/10.1016/j.atmosenv.2021.118367, 2021.
Flechard, C. R., Nemitz, E., Smith, R. I., Fowler, D., Vermeulen, A. T., Bleeker, A., Erisman, J. W., Simpson, D., Zhang, L., Tang, Y. S., and Sutton, M. A.: Dry deposition of reactive nitrogen to European ecosystems: a comparison of inferential models across the NitroEurope network, Atmos. Chem. Phys., 11, 2703–2728, https://doi.org/10.5194/acp-11-2703-2011, 2011.
Fowler, D., Pyle, J. A., Raven, J. A., and Sutton, M. A.: The global nitrogen cycle in the twenty-first century: introduction, Philos. T. R. Soc., 368, 20130165, https://doi.org/10.1098/rstb.2013.0165, 2013.
Fu, B., Li, S., Yu, X., Yang, P., Yu, G., Feng, R., and Zhuang, X.: Chinese ecosystem research network: Progress and perspectives, Ecol. Complex., 7, 225–233, https://doi.org/10.1016/j.ecocom.2010.02.007, 2010.
Fu, J. S., Carmichael, G. R., Dentener, F., Aas, W., Andersson, C., Barrie, L. A., Cole, A., Galy-Lacaux, C., Geddes, J., Itahashi, S., Kanakidou, M., Labrador, L., Paulot, F., Schwede, D., Tan, J., and Vet, R.: Improving Estimates of Sulfur, Nitrogen, and Ozone Total Deposition through Multi-Model and Measurement-Model Fusion Approaches, Environ. Sci. Technol., 56, 2134–2142, https://doi.org/10.1021/acs.est.1c05929, 2022.
He, H., Wang, Y., Ma, Q., Ma, J., Chu, B., Ji, D., Tang, G., Liu, C., Zhang, H., and Hao, J.: Mineral dust and NOX promote the conversion of SO2 to sulfate in heavy pollution days, Sci. Rep., 4, 4172, https://doi.org/10.1038/srep04172, 2014.
Holland, E. A., Braswell, B. H., Sulzman, J., and Lamarque, J. F.: Nitrogen deposition onto the United States and Western Europe: synthesis of observations and models, Ecol. Appl., 15, 38–57, 2005.
Hou, Y., Wang, L., Zhou, Y., Wang, S., Liu, W., and Zhu, J.: Analysis of the tropospheric column nitrogen dioxide over China based on satellite observations during 2008–2017, Atmos. Pollut. Res., 10, 651–655, https://doi.org/10.1016/j.apr.2018.11.003, 2019.
Jia, Y., Yu, G., Gao, Y., He, N., Wang, Q., Jiao, C., and Zuo, Y.: Global inorganic nitrogen dry deposition inferred from ground- and space-based measurements, Sci. Rep., 6, 19810, https://doi.org/10.1038/srep19810, 2016.
Kang, Y., Liu, M., Song, Y., Huang, X., Yao, H., Cai, X., Zhang, H., Kang, L., Liu, X., Yan, X., He, H., Zhang, Q., Shao, M., and Zhu, T.: High-resolution ammonia emissions inventories in China from 1980 to 2012, Atmos. Chem. Phys., 16, 2043–2058, https://doi.org/10.5194/acp-16-2043-2016, 2016.
Karplus, V. J., Zhang, S., and Almond, D.: Quantifying coal power plant responses to tighter SO2 emissions standards in China, P. Natl. Acad. Sci. USA, 115, 7004–7009, https://doi.org/10.1073/pnas.1800605115, 2018.
Keller, C. A., Long, M. S., Yantosca, R. M., Da Silva, A. M., Pawson, S., and Jacob, D. J.: HEMCO v1.0: a versatile, ESMF-compliant component for calculating emissions in atmospheric models, Geosci. Model Dev., 7, 1409–1417, https://doi.org/10.5194/gmd-7-1409-2014, 2014.
Keresztesi, Á., Birsan, M.-V., Nita, I.-A., Bodor, Z., and Szép, R.: Assessing the neutralisation, wet deposition and source contributions of the precipitation chemistry over Europe during 2000–2017, Environ. Sci. Eur., 31, 50, https://doi.org/10.1186/s12302-019-0234-9, 2019.
Krotkov, N. A., McLinden, C. A., Li, C., Lamsal, L. N., Celarier, E. A., Marchenko, S. V., Swartz, W. H., Bucsela, E. J., Joiner, J., Duncan, B. N., Boersma, K. F., Veefkind, J. P., Levelt, P. F., Fioletov, V. E., Dickerson, R. R., He, H., Lu, Z., and Streets, D. G.: Aura OMI observations of regional SO2 and NO2 pollution changes from 2005 to 2015, Atmos. Chem. Phys., 16, 4605–4629, https://doi.org/10.5194/acp-16-4605-2016, 2016.
Krotkov, N. A., Lamsal, L. N., Marchenko, S. V., Celarier, E. A., Bucsela, E. J., Swartz, W. H., Joiner, J., and Team TOC: OMI/Aura NO2 Cloud-Screened Total and Tropospheric Column L3 Global Gridded 0.25∘ × 0.25∘ V3. NASA Goddard Space Flight Center, Goddard Earth Sciences Data and Information Services Center (GES DISC), https://doi.org/10.5067/Aura/OMI/DATA/DATA3007, 2019.
Kuang, F., Liu, X., Zhu, B., Shen, J., Pan, Y., Su, M., and Goulding, K.: Wet and dry nitrogen deposition in the central Sichuan Basin of China, Atmos. Environ., 143, 39–50, https://doi.org/10.1016/j.atmosenv.2016.08.032, 2016.
Kuhn, M.: caret: Classification and Regression Training, R package version 6.0-90, https://CRAN.R-project.org/package=caret (last access: 29 July 2023), 2021.
Li, J.: Pollution trends in China from 2000 to 2017: A multi-sensor view from space, Remote Sens., 12, 208, https://doi.org/10.3390/rs12020208, 2020.
Li, M., Liu, H., Geng, G., Hong, C., Liu, F., Song, Y., Tong, D., Zheng, B., Cui, H., Man, H., Zhang, Q., and He, K.: Anthropogenic emission inventories in China: a review, Natl. Sci. Rev., 4, 834–866, https://doi.org/10.1093/nsr/nwx150, 2017.
Li, M., Klimont, Z., Zhang, Q., Martin, R. V., Zheng, B., Heyes, C., Cofala, J., Zhang, Y., and He, K.: Comparison and evaluation of anthropogenic emissions of SO2 and NOX over China, Atmos. Chem. Phys., 18, 3433–3456, https://doi.org/10.5194/acp-18-3433-2018, 2018.
Li, R., Cui, L., Meng, Y., Zhao, Y., and Fu, H.: Satellite-based prediction of daily SO2 exposure across China using a high-quality random forest-spatiotemporal Kriging (RF-STK) model for health risk assessment, Atmos. Environ., 208, 10–19, https://doi.org/10.1016/j.atmosenv.2019.03.029, 2019.
Li, R., Cui, L., Fu, H., Zhao, Y., Zhou, W., and Chen, J.: Satellite-Based Estimates of Wet Ammonium (NH4-N) Deposition Fluxes Across China during 2011–2016 Using a Space-Time Ensemble Model, Environ. Sci. Technol., 54, 13419–13428, https://doi.org/10.1021/acs.est.0c03547, 2020a.
Li, R., Cui, L., Liang, J., Zhao, Y., Zhang, Z., and Fu, H.: Estimating historical SO2 level across the whole China during 1973–2014 using random forest model, Chemosphere, 247, 125839, https://doi.org/10.1016/j.chemosphere.2020.125839, 2020b.
Li, Y., Schichtel, B. A., Walker, J. T., Schwede, D. B., Chen, X., Lehmann, C. M. B., Puchalski, M. A., Gay, D. A., and Collett Jr., J. L.: Increasing importance of deposition of reduced nitrogen in the United States, P. Natl. Acad. Sci. USA, 113, 5874–5879, https://doi.org/10.1073/pnas.1525736113, 2016.
Likens, G. E., Butler, T. J., Claybrooke, R., Vermeylen, F., and Larson, R.: Long-term monitoring of precipitation chemistry in the U.S.: Insights into changes and condition, Atmos. Environ., 245, 118031, https://doi.org/10.1016/j.atmosenv.2020.118031, 2021.
Liu, F., Zhang, Q., Tong, D., Zheng, B., Li, M., Huo, H., and He, K. B.: High-resolution inventory of technologies, activities, and emissions of coal-fired power plants in China from 1990 to 2010, Atmos. Chem. Phys., 15, 13299–13317, https://doi.org/10.5194/acp-15-13299-2015, 2015.
Liu, L., Zhang, X., Xu, W., Liu, X., Lu, X., Wang, S., Zhang, W., and Zhao, L.: Ground Ammonia Concentrations over China Derived from Satellite and Atmospheric Transport Modeling, Remote Sens., 9, 467, https://doi.org/10.3390/rs9050467, 2017a.
Liu, L., Zhang, X., Xu, W., Liu, X., Lu, X., Chen, D., Zhang, X., Wang, S., and Zhang, W.: Estimation of monthly bulk nitrate deposition in China based on satellite NO2 measurement by the Ozone Monitoring Instrument, Remote Sens. Environ., 199, 93–106, https://doi.org/10.1016/j.rse.2017.07.005, 2017b.
Liu, L., Xu, W., Lu, X., Zhong, B., Guo, Y., Lu, X., Zhao, Y., He, W., Wang, S., Zhang, X., Liu, X., and Vitousek, P.: Exploring global changes in agricultural ammonia emissions and their contribution to nitrogen deposition since 1980, P. Natl. Acad. Sci. USA, 119, e2121998119, https://doi.org/10.1073/pnas.2121998119, 2022.
Liu, M., Huang, X., Song, Y., Xu, T., Wang, S., Wu, Z., Hu, M., Zhang, L., Zhang, Q., Pan, Y., Liu, X., and Zhu, T.: Rapid SO2 emission reductions significantly increase tropospheric ammonia concentrations over the North China Plain, Atmos. Chem. Phys., 18, 17933–17943, https://doi.org/10.5194/acp-18-17933-2018, 2018.
Liu, M., Lin, J., Boersma, K. F., Pinardi, G., Wang, Y., Chimot, J., Wagner, T., Xie, P., Eskes, H., Van Roozendael, M., Hendrick, F., Wang, P., Wang, T., Yan, Y., Chen, L., and Ni, R.: Improved aerosol correction for OMI tropospheric NO2 retrieval over East Asia: constraint from CALIOP aerosol vertical profile, Atmos. Meas. Tech., 12, 1–21, https://doi.org/10.5194/amt-12-1-2019, 2019.
Liu, X. J., Zhang, Y., Han, W. X., Tang, A. H., Shen, J. L., Cui, Z. L., Vitousek, P., Erisman, J. W., Goulding, K., Christie, P., Fangmeier, A., and Zhang, F. S.: Enhanced nitrogen deposition over China, Nature, 494, 459–462, https://doi.org/10.1038/nature11917, 2013.
Liu, X. J., Xu, W., Du, E. Z., Tang, A. H., Zhang, Y., Wen, Z., Hao, T. X., Pan, Y. P., Zhang, L., Zhao, Y., Shen, J. L., Zhou, F., Gao, Z. L., Chang, Y. H., Goulding, K., Collett Jr., J. L., Vitousek, P. M., Zhang, F. S., Zhang, Y. Y., Gu, B. J., and Feng, Z. Z.: Environmental impacts of nitrogen emissions in China and the role of policies in emission reduction, Philos. T. R. Soc., 378, 20190324, https://doi.org/10.1098/rsta.2019.0324, 2020.
Lu, X., Ye, X., Zhou, M., Zhao, Y., Weng, H., Kong, H., Li, K., Gao, M., Zheng, B., Lin, J., Zhou, F., Zhang, Q., Wu, D., Zhang, L., and Zhang, Y.: The underappreciated role of agricultural soil nitrogen oxide emissions in ozone pollution regulation in North China, Nat. Commun., 12, 5021, https://doi.org/10.1038/s41467-021-25147-9, 2021.
Luo, X., Pan, Y., Goulding, K., Zhang, L., Liu, X., and Zhang, F.: Spatial and seasonal variations of atmospheric sulfur concentrations and dry deposition at 16 rural and suburban sites in China, Atmos. Environ., 146, 79–89, https://doi.org/10.1016/j.atmosenv.2016.07.038, 2016.
Lye, C. and Tian, H.: Spatial and temporal patterns of nitrogen deposition in China: Synthesis of observational data, J. Geophys. Res., 112, D22S05, https://doi.org/10.1029/2006jd007990, 2007.
Pan, Y. P., Wang, Y. S., Tang, G. Q., and Wu, D.: Wet and dry deposition of atmospheric nitrogen at ten sites in Northern China, Atmos. Chem. Phys., 12, 6515–6535, https://doi.org/10.5194/acp-12-6515-2012, 2012.
Park, R. J.: Natural and transboundary pollution influences on sulfate-nitrate-ammonium aerosols in the United States: Implications for policy, J. Geophys. Res., 109, D15204, https://doi.org/10.1029/2003jd004473, 2004.
Payne, R. J., Stevens, C. J., Dise, N. B., Gowing, D. J., Pilkington, M. G., Phoenix, G. K., Emmett, B. A., and Ashmore, M. R.: Impacts of atmospheric pollution on the plant communities of British acid grasslands, Environ. Pollut., 159, 2602–2608, https://doi.org/10.1016/j.envpol.2011.06.009, 2011.
Qin, K., Han, X., Li, D., Xu, J., Loyola, D., Xue, Y., Zhou, X., Li, D., Zhang, K., and Yuan, L.: Satellite-based estimation of surface NO2 concentrations over east-central China: A comparison of POMINO and OMNO2d data, Atmos. Environ., 224, 117322, https://doi.org/10.1016/j.atmosenv.2020.117322, 2020.
Qu, Z., Henze, D. K., Li, C., Theys, N., Wang, Y., Wang, J., Wang, W., Han, J., Shim, C., Dickerson, R. R., and Ren, X.: SO2 Emission Estimates Using OMI SO2 Retrievals for 2005–2017, J. Geophys. Res.-Atmos., 124, 8336–8359, https://doi.org/10.1029/2019jd030243, 2019.
Reuss, J. O., Cosby, B. J., and Wright, R. F.: Chemical processes governing soil and water acidification, Nature, 329, 27–32,1987.
Simpson, D., Benedictow, A., Berge, H., Bergström, R., Emberson, L. D., Fagerli, H., Flechard, C. R., Hayman, G. D., Gauss, M., Jonson, J. E., Jenkin, M. E., Nyíri, A., Richter, C., Semeena, V. S., Tsyro, S., Tuovinen, J. P., Valdebenito, Á., and Wind, P.: The EMEP MSC-W chemical transport model – technical description, Atmos. Chem. Phys., 12, 7825–7865, https://doi.org/10.5194/acp-12-7825-2012, 2012.
Skyllakou, K., Rivera, P. G., Dinkelacker, B., Karnezi, E., Kioutsioukis, I., Hernandez, C., Adams, P. J., and Pandis, S. N.: Changes in PM2.5; concentrations and their sources in the US from 1990 to 2010, Atmos. Chem. Phys., 21, 17115–17132, https://doi.org/10.5194/acp-21-17115-2021, 2021.
Song, L., Kuang, F., Skiba, U., Zhu, B., Liu, X., Levy, P., Dore, A., and Fowler, D.: Bulk deposition of organic and inorganic nitrogen in southwest China from 2008 to 2013, Environ. Pollut., 227, 157–166, https://doi.org/10.1016/j.envpol.2017.04.031, 2017.
Theobald, M. R., Vivanco, M. G., Aas, W., Andersson, C., Ciarelli, G., Couvidat, F., Cuvelier, K., Manders, A., Mircea, M., Pay, M.-T., Tsyro, S., Adani, M., Bergström, R., Bessagnet, B., Briganti, G., Cappelletti, A., amp, apos, Isidoro, M., Fagerli, H., Mar, K., Otero, N., Raffort, V., Roustan, Y., Schaap, M., Wind, P., and Colette, A.: An evaluation of European nitrogen and sulfur wet deposition and their trends estimated by six chemistry transport models for the period 1990–2010, Atmos. Chem. Phys., 19, 379–405, https://doi.org/10.5194/acp-19-379-2019, 2019.
Tørseth, K., Aas, W., Breivik, K., Fjæraa, A. M., Fiebig, M., Hjellbrekke, A. G., Lund Myhre, C., Solberg, S., and Yttri, K. E.: Introduction to the European Monitoring and Evaluation Programme (EMEP) and observed atmospheric composition change during 1972–2009, Atmos. Chem. Phys., 12, 5447–5481, https://doi.org/10.5194/acp-12-5447-2012, 2012.
Totsuka, T., Sase, H., and Shimizu, H.: Major activities of acid deposition monitoring network in East Asia (EANET) and related studies, in: Plant responses to air pollution and global change, Springer, 251–259, https://doi.org/10.1007/4-431-31014-2_28, 2005.
Vet, R., Artz, R. S., Carou, S., Shaw, M., Ro, C.-U., Aas, W., Baker, A., Bowersox, V. C., Dentener, F., Galy-Lacaux, C., Hou, A., Pienaar, J. J., Gillett, R., Forti, M. C., Gromov, S., Hara, H., Khodzher, T., Mahowald, N. M., Nickovic, S., Rao, P. S. P., and Reid, N. W.: A global assessment of precipitation chemistry and deposition of sulfur, nitrogen, sea salt, base cations, organic acids, acidity and pH, and phosphorus, Atmos. Environ., 93, 3–100, https://doi.org/10.1016/j.atmosenv.2013.10.060, 2014.
Wang, J., Sha, Z., Zhang, J., Kang, J., Xu, W., Goulding, K., and Liu, X.: Reactive N emissions from cropland and their mitigation in the North China Plain, Environ. Res., 214, 114015, https://doi.org/10.1016/j.envres.2022.114015, 2022.
Wen, Z., Xu, W., Li, Q. Q., Han, M. J., Tang, A. H., Zhang, Y., Luo, X. S., Shen, J. L., Wang, W., Li, K. H., Pan, Y. P., Zhang, L., Li, W. Q., Collett Jr., J. L., Zhong, B. Q., Wang, X. M., Goulding, K., Zhang, F. S., and Liu, X. J.: Changes of nitrogen deposition in China from 1980 to 2018, Environ. Int., 144, 106022, https://doi.org/10.1016/j.envint.2020.106022, 2020.
Wesely, M. L.: Parameterization of surface resistances to gaseous dry deposition in regional-scale numerical models, Atmos. Environ., 23, 1293–1304, https://doi.org/10.1016/0004-6981(89)90153-4, 1989.
Whitburn, S., Van Damme, M., Clarisse, L., Bauduin, S., Heald, C. L., Hadji-Lazaro, J., Hurtmans, D., Zondlo, M. A., Clerbaux, C., and Coheur, P. F.: A flexible and robust neural network IASI-NH3 retrieval algorithm, J. Geophys. Res.-Atmos., 121, 6581–6599, https://doi.org/10.1002/2016jd024828, 2016.
Wu, Y., Di, B., Luo, Y., Grieneisen, M. L., Zeng, W., Zhang, S., Deng, X., Tang, Y., Shi, G., Yang, F., and Zhan, Y.: A robust approach to deriving long-term daily surface NO2 levels across China: Correction to substantial estimation bias in back-extrapolation, Environ. Int., 154, 106576, https://doi.org/10.1016/j.envint.2021.106576, 2021.
Xia, Y., Zhao, Y., and Nielsen, C. P.: Benefits of China's efforts in gaseous pollutant control indicated by the bottom-up emissions and satellite observations 2000–2014, Atmos. Environ., 136, 43–53, https://doi.org/10.1016/j.atmosenv.2016.04.013, 2016.
Xu, W., Luo, X. S., Pan, Y. P., Zhang, L., Tang, A. H., Shen, J. L., Zhang, Y., Li, K. H., Wu, Q. H., Yang, D. W., Zhang, Y. Y., Xue, J., Li, W. Q., Li, Q. Q., Tang, L., Lu, S. H., Liang, T., Tong, Y. A., Liu, P., Zhang, Q., Xiong, Z. Q., Shi, X. J., Wu, L. H., Shi, W. Q., Tian, K., Zhong, X. H., Shi, K., Tang, Q. Y., Zhang, L. J., Huang, J. L., He, C. E., Kuang, F. H., Zhu, B., Liu, H., Jin, X., Xin, Y. J., Shi, X. K., Du, E. Z., Dore, A. J., Tang, S., Collett, J. L., Goulding, K., Sun, Y. X., Ren, J., Zhang, F. S., and Liu, X. J.: Quantifying atmospheric nitrogen deposition through a nationwide monitoring network across China, Atmos. Chem. Phys., 15, 12345–12360, https://doi.org/10.5194/acp-15-12345-2015, 2015.
Xu, W., Liu, L., Cheng, M., Zhao, Y., Zhang, L., Pan, Y., Zhang, X., Gu, B., Li, Y., Zhang, X., Shen, J., Lu, L., Luo, X., Zhao, Y., Feng, Z., Collett Jr., J. L., Zhang, F., and Liu, X.: Spatial–temporal patterns of inorganic nitrogen air concentrations and deposition in eastern China, Atmos. Chem. Phys., 18, 10931–10954, https://doi.org/10.5194/acp-18-10931-2018, 2018.
Xu, W., Zhang, L., and Liu, X.: A database of atmospheric nitrogen concentration and deposition from the nationwide monitoring network in China, Sci. Data, 6, D15204, https://doi.org/10.1038/s41597-019-0061-2, 2019.
Xu, X.: China's GDP and POP spatial distribution kilometer grid dataset, Resources and environment science data registration and publication system, http://www.resdc.cn/DOI (last access: 29 July 2023), 2017.
Yamaga, S., Ban, S., Xu, M., Sakurai, T., Itahashi, S., and Matsuda, K.: Trends of sulfur and nitrogen deposition from 2003 to 2017 in Japanese remote areas, Environ. Pollut., 289, 117842, https://doi.org/10.1016/j.envpol.2021.117842, 2021.
Ye, C., Lu, K., Song, H., Mu, Y., Chen, J., and Zhang, Y.: A critical review of sulfate aerosol formation mechanisms during winter polluted periods, J. Environ. Sci., 123, 387–399, https://doi.org/10.1016/j.jes.2022.07.011, 2023.
Yu, G., Jia, Y., He, N., Zhu, J., Chen, Z., Wang, Q., Piao, S., Liu, X., He, H., Guo, X., Wen, Z., Li, P., Ding, G., and Goulding, K.: Stabilization of atmospheric nitrogen deposition in China over the past decade, Nat. Geosci., 12, 424–431, https://doi.org/10.1038/s41561-019-0352-4, 2019.
Zhan, X., Yu, G., He, N., Jia, B., Zhou, M., Wang, C., Zhang, J., Zhao, G., Wang, S., Liu, Y., and Yan, J.: Inorganic nitrogen wet deposition: Evidence from the North-South Transect of Eastern China, Environ. Pollut., 204, 1–8, https://doi.org/10.1016/j.envpol.2015.03.016, 2015.
Zhang, G., Pan, Y., Tian, S., Cheng, M., Xie, Y., Wang, H., and Wang, Y.: Limitations of passive sampling technique of rainfall chemistry and wet deposition flux characterization, Res. Environ., 28, 684–690, https://doi.org/10.13198/j.issn.1001-6929.2015.05.03, 2015.
Zhang, L., Gong, S., Padro, J., and Barrie, L.: A size-segregated particle dry deposition scheme for an atmospheric aerosol module, Atmos. Environ., 35, 549–560, https://doi.org/10.1016/S1352-2310(00)00326-5, 2001.
Zhang, Q., Zheng, Y., Tong, D., Shao, M., Wang, S., Zhang, Y., Xu, X., Wang, J., He, H., Liu, W., Ding, Y., Lei, Y., Li, J., Wang, Z., Zhang, X., Wang, Y., Cheng, J., Liu, Y., Shi, Q., Yan, L., Geng, G., Hong, C., Li, M., Liu, F., Zheng, B., Cao, J., Ding, A., Gao, J., Fu, Q., Huo, J., Liu, B., Liu, Z., Yang, F., He, K., and Hao, J.: Drivers of improved PM2.5 air quality in China from 2013 to 2017, P. Natl. Acad. Sci. USA, 116, 24463–24469, https://doi.org/10.1073/pnas.1907956116, 2019.
Zhang, T., Chen, H. Y. H., and Ruan, H.: Global negative effects of nitrogen deposition on soil microbes, ISME J., 12, 1817–1825, https://doi.org/10.1038/s41396-018-0096-y, 2018a.
Zhang, X. Y., Chuai, X. W., Liu, L., Zhang, W. T., Lu, X. H., Zhao, L. M., and Chen, D. M.: Decadal trends in wet sulfur deposition in China estimated from OMI SO2 columns, J. Geophys. Res.-Atmos., 123, 10796–10811, https://doi.org/10.1029/2018jd028770, 2018b.
Zhang, Y., Liu, X. J., Fangmeier, A., Goulding, K. T. W., and Zhang, F. S.: Nitrogen inputs and isotopes in precipitation in the North China Plain, Atmos. Environ., 42, 1436–1448, https://doi.org/10.1016/j.atmosenv.2007.11.002, 2008.
Zhang, Y., Zhao, J., and Yin, H.: European Union agricultural policy transformation trend and enlightenment, World Agriculture, 5, https://doi.org/10.13856/j.cn11-1097/s.2020.05.001, 2020 (in Chinese).
Zhao, S. and Qiao, G.: The shadow prices of CO2, SO2 and NOX for U.S. coal power industry 2010–2017: a convex quantile regression method, J. Prod. Anal., 57, 243–253, https://doi.org/10.1007/s11123-022-00629-0, 2022.
Zhao, Y.: Gridded deposition of N and S for China 2005–2020, Air Quality Nju [data set], http://www.airqualitynju.com/En/Data/List/Datadownload, last access: 29 July 2023.
Zhao, Y., Xi, M., Zhang, Q., Dong, Z., Ma, M., Zhou, K., Xu, W., Xing, J., Zheng, B., Wen, Z., Liu, X., Nielsen, C. P., Liu, Y., Pan, Y., and Zhang, L.: Decline in bulk deposition of air pollutants in China lags behind reductions in emissions, Nat. Geosci., 15, 190–195, https://doi.org/10.1038/s41561-022-00899-1, 2022.
Zheng, B., Tong, D., Li, M., Liu, F., Hong, C., Geng, G., Li, H., Li, X., Peng, L., Qi, J., Yan, L., Zhang, Y., Zhao, H., Zheng, Y., He, K., and Zhang, Q.: Trends in China's anthropogenic emissions since 2010 as the consequence of clean air actions, Atmos. Chem. Phys., 18, 14095–14111, https://doi.org/10.5194/acp-18-14095-2018, 2018a.
Zheng, X. D., Liu, X. Y., Song, W., Sun, X. C., and Liu, C. Q.: Nitrogen isotope variations of ammonium across rain events: Implications for different scavenging between ammonia and particulate ammonium, Environ. Pollut., 239, 392–398, https://doi.org/10.1016/j.envpol.2018.04.015, 2018b.
Zhou, K., Zhao, Y., Zhang, L., and Xi, M.: Declining dry deposition of NO2 and SO2 with diverse spatiotemporal patterns in China from 2013 to 2018, Atmos. Environ., 262, 118655, https://doi.org/10.1016/j.atmosenv.2021.118655, 2021.
Zhu, J., He, N., Wang, Q., Yuan, G., Wen, D., Yu, G., and Jia, Y.: The composition, spatial patterns, and influencing factors of atmospheric wet nitrogen deposition in Chinese terrestrial ecosystems, Sci. Total Environ., 511, 777–785, https://doi.org/10.1016/j.scitotenv.2014.12.038, 2015.