the Creative Commons Attribution 4.0 License.
the Creative Commons Attribution 4.0 License.
 | 19 Jul 2023
Assessment of the impacts of cloud chemistry on surface SO2 and sulfate levels in typical regions of China
Jianyan Lu
Sunling Gong
Jian Zhang
Jianmin Chen
Lei Zhang
Chunhong Zhou
A regional online chemical weather model, Weather Research and Forecasting (WRF)/China Meteorological Administration Unified Atmospheric Chemistry Environment (CUACE), is used to assess the contributions of cloud chemistry to the SO2 and sulfate levels in typical regions of China. Upon comparison with several time series of in situ cloud chemical observations on Mountain Tai in Shandong Province of China, the CUACE cloud chemistry scheme is found to reasonably reproduce the observed cloud consumption of H2O2, O3, and SO2 and the production of sulfate, and it is consequently used in the regional assessment of a heavy pollution episode and monthly average of December 2016. During the cloudy period in the heavy pollution episode, sulfate production increased by 60 %–95 % and SO2 production reduced by over 80 %. The cloud chemistry mainly affects the middle and lower troposphere below 5 km as well as within the boundary layer, and it contributes significantly to the SO2 reduction and sulfate production in central-east China. Among these four typical regions in China, the Sichuan Basin (SCB) is the most affected by the cloud chemistry, with an average SO2 abatement of about 1.0–10.0 ppb and sulfate increase of about 10.0–70.0 µg m−3, followed by the Yangtze River Delta (YRD) and the southeast of the North China Plain (NCP), where SO2 abatement is about 1.0–5.0 ppb and sulfate increase is about 10.0–30.0 µg m−3. However, the cloud chemistry contributions to the Pearl River Delta (PRD) and the northwest of the NCP are not significant due to lighter pollution and less water vapor than the other regions.
- Article
(9714 KB) - Full-text XML
- BibTeX
- EndNote


Aerosols interact with radiation and clouds, directly or indirectly affecting the atmospheric radiation balance and precipitation, which in turn affects weather and climate (Twomey et al., 1984; Twomey, 1991; Charlson et al., 1992; Ramanathan et al., 2001; Pye et al., 2020). Moreover, large amounts of aerosols dispersed in the atmosphere can reduce visibility and deteriorate air quality (Molina, 2002), which is harmful to human health and ecosystems (Xie et al., 2019; Sielski et al., 2021).
In addition to direct emissions, aerosols are mostly produced secondarily through the oxidation of precursor gases, and one of the important processes is the transformation in clouds. Global cloud coverage of about 21 % to 95 % provides an adequate environment for cloud chemistry processes (Kotarba, 2020; Ravishankara, 1997). As about 90 % of the clouds formed in the atmosphere evaporate without deposition or forming precipitation, large fractions of aerosols formed within clouds can then re-enter the atmosphere (Caffrey et al., 2001; Harris et al., 2013; Lelieveld and Heintzenberg, 1992). Globally, sulfate production from SO2 oxidation accounts for about 80 % of total sulfate, and more than half of it is produced in clouds (Hung et al., 2018; Faloona et al., 2010; Guo et al., 2012). Ge et al. (2021) found that cloud chemistry processes reduced SO2 concentrations by 0 %–50 % in most of central-east China in all seasons. Li (2011) found that the average sulfate concentration in cloud water accounted for 53.8 % of the total aerosol concentration at a mountain site. Li (2020) also found that cloud processes effectively reduced atmospheric O3 and SO2 concentrations by an average of 19.7 % and 71.2 %, respectively, at Mount Tai.
Multiphase oxidation of SO2 in aerosol particles in high-humidity environments is one of the main causes of the explosive growth of particulate matter in East Asia haze (Guo et al., 2014; Cheng et al., 2016; Song et al., 2019). From observations and laboratory works, four main pathways were identified for this kind of oxidation of SO2, i.e., by H2O2, O3, NO2, and transition metal ions (TMIs; Iibusuki and Takeuchi, 1987; Martin and Good, 1991; Alexander et al., 2009; Harris et al., 2013; Cheng et al., 2016; Wang et al., 2016; Wang et al., 2021). Additional pathways of organic peroxides (ROOH; Yao et al., 2019; Wang et al., 2019; Ye et al., 2018; Dovrou et al., 2019), photolysis products of nitrate (pNO (Gen et al., 2019b, a), and excited triplet states of photosensitizer molecules (T*; Wang et al., 2020) have also been found recently to be important for multiphase oxidation of SO2 during very heavy hazy days. Unfortunately, there are still many uncertainties and gaps to put all those pathways into model applications from observational and laboratory studies (Pye et al., 2020; Ravishankara, 1997; Liu et al., 2021). Several regional and global models have tried to include only O3 and H2O2 in-cloud oxidants in cloud chemistry mechanisms (Park and Jacob, 2003; Tie, 2005; Von Salzen et al., 2000; Chapman et al., 2009; Leighton and Ivanova, 2008; Ivanova and Leighton, 2008), but only a few models can simulate the pathway of NO2 or the TMIs of Fe or Mn ions (Chang et al., 1987; Binkowski and Roselle, 2003; Menut et al., 2013; Terrenoire et al., 2015; Ge et al., 2021).
There has been very serious air pollution in central-east China where the four heavy pollution regions of the North China Plain (NCP), Yangtze River Delta (YRD), Sichuan Basin (SCB), and Pearl River Delta (PRD) are located (Yao et al., 2021; Zhang et al., 2012). Although many global and regional models have contained sulfate formation mechanisms by cloud chemistry, few models have assessed its contribution. Especially lacking is a detailed assessment of regional cloud chemistry of sulfate and SO2 in China. Some models have failed to reproduce SO2 and sulfate observations, particularly underestimating sulfate and overestimating SO2 over China (Buchard et al., 2014; Cheng et al., 2016; Hong et al., 2017a; Wei et al., 2019); this is mainly caused by the uncertainties in meteorological conditions (Sun et al., 2016) and emission inventories (Hong et al., 2017b; Sha et al., 2019b), as well as unclear and/or inaccurate physical and chemical mechanisms associated with air pollutants (He and Zhang, 2014; He et al., 2015; Georgiou et al., 2018; Sha et al., 2019a). The inadequate inclusion or lack of cloud chemistry of SO2 is one of the main causes (Ge et al., 2021). Therefore, it is very important and necessary to quantify the contribution of cloud chemistry in these regions and get a better understand of multi-dimensional pollution interactions, especially between the upper layer and the surface.
This study is intended to use an online coupled chemical weather platform of Weather Research and Forecasting (WRF)/China Meteorological Administration Unified Atmospheric Chemistry Environment (CUACE) in order to analyze and evaluate the SO2 in-cloud oxidation process in four polluted regions in China, with two objectives: (1) evaluating the cloud chemistry scheme in WRF/CUACE using in situ cloud chemistry observations at Mount Tai in the summers of 2015 and 2018 and (2) quantifying the contributions of cloud chemistry to the SO2 and sulfate changes in a typical winter pollution month of December 2016 with a very long-lasting heavy pollution episode. It is aimed to establish a system to assess the relative contribution of cloud chemistry to SO2 oxidation and sulfate productions vs. other clear-sky processes.
2.1 Cloud chemistry in WRF/CUACE
WRF/CUACE is an online coupled chemical weather model under the WRF framework with a comprehensive chemical module – CUACE, which is developed at CMA (China Meteorological Administration) with sectional aerosol physics, gas chemistry, aerosol–cloud interactions, and thermodynamic equilibrium (Zhou et al., 2012, 2016; Gong et al., 2003; Gong and Zhang, 2008; Zhang et al., 2021). It treats seven types of aerosols, i.e., black carbon (BC), organic carbon (OC), sulfate, nitrate, ammonium, soil dust, and sea salt, as well as more than 60 gaseous species. The system can simulate the concentrations of PM10, PM2.5, and O3 as well as visibility. A complete heterogeneous chemistry module has been built in CUACE for nine gas-to-particle heterogeneous reactions including SO2 to sulfate (C. Zhou et al., 2021; Zhang et al., 2021). The cloud chemistry mechanism in CUACE considers the pathways of multiphase oxidation of SO2 by H2O2 and O3 in both stratocumulus and convective clouds (Gong et al., 2003; Von Salzen et al., 2000). The transport and chemical effects of sulfur in convective clouds are calculated based on a convective cloud model by WRF. Within the cloudy part of a grid box, the first-order rate constant (in s−1) of S(IV) (= SO2, HSO, SO) oxidation is given by the following expression:
where CS(IV) is the total concentration of S(IV) (gas phase plus dissolved), is the total concentration of O3, and is the total concentration of hydrogen peroxide.
The effective rate constants F1 and F2 are given by the following expressions:
The reaction rate constants of and refer to Maahs (1983) and Martin et al. (1984):
In Eqs. (2) and (3), the factors of f1 and f2 represent the partitioning of the substance between the aqueous and gas phases and are determined by the Henry's law coefficients.
where γ is the dimensionless volume fraction of liquid water in the cloud. The parameters of , , and are the proportions of individual substances in the gas phase, which are calculated from the dimensionless Henry's law constant and γ.
with
The Henry's law constants used in Eqs. (6) to (8) are listed in Table 1.
Table 1Equilibrium constants for the parameterization of the cloud chemistry in CUACE.
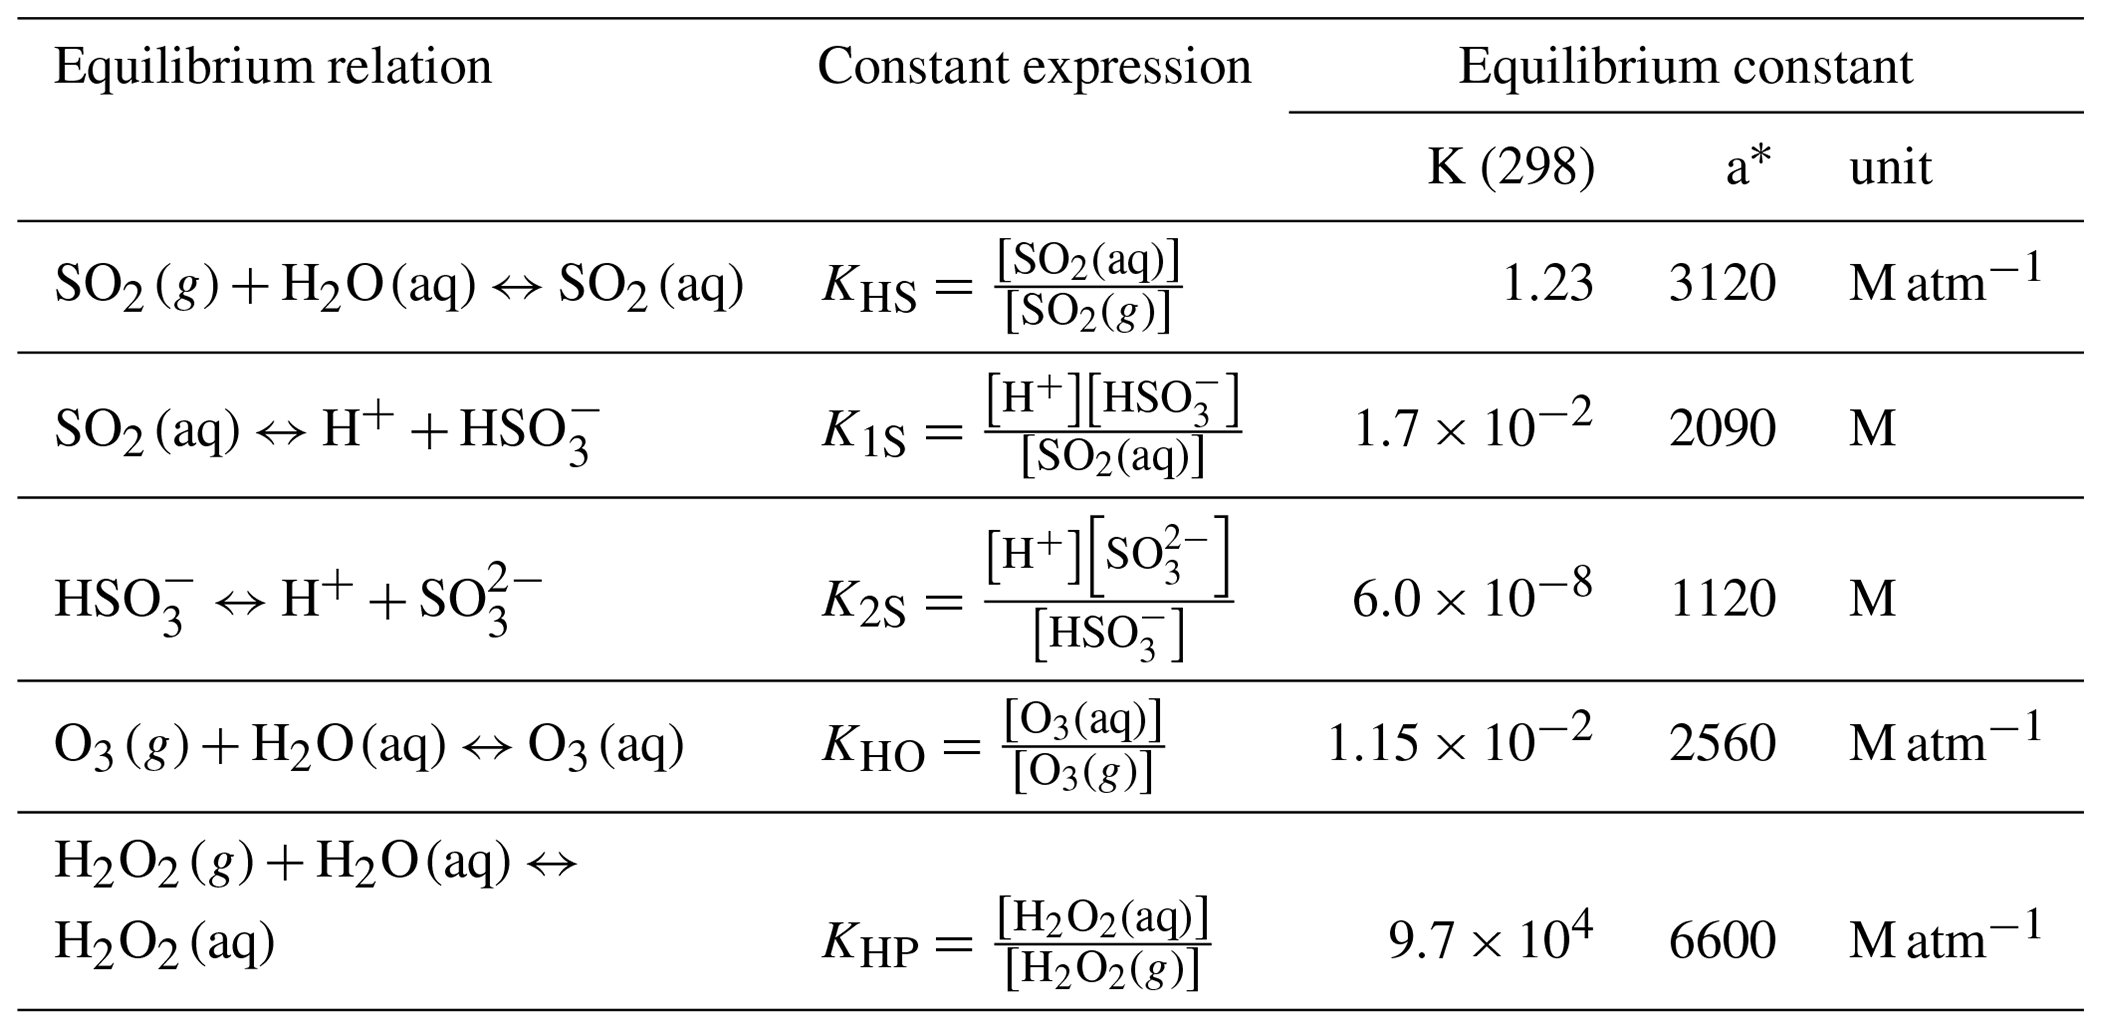
∗ “K (298)” and “a” are constants in K = k(298)[a(1/T−1/298)].
In order to consider the dependence of the oxidation rates on pH, the H+ concentration is calculated from the ion balance.
From Eqs. (1)–(12), CUACE can simulate the oxidation rates of SO2 by H2O2 and O3 mainly in the liquid and gaseous environment in both stratocumulus and convective clouds in a three-dimensional way.
2.2 Assessment criteria
Three variables, RTCLD, DT, and RT, are defined to assess the impact of cloud chemistry on SO2 and sulfate. RTCLD refers to the concentration change ratio of substance i before and after the cloud chemical processes in a model run.
where BECLD and AFCLD denote the concentrations of component i before and after the cloud chemical processes, respectively, and i denotes the chemical component of SO2, O3, H2O2, and sulfate.
DT indicates the difference in concentration of substance i with (CLD) and without (nCLD) the cloud chemistry module activated:
and RT represents the concentration ratio change of the substance i with and without cloud chemistry in separate model runs:
2.3 Methodology
2.3.1 Model evaluation – Case 1
Mount Tai, located in central Shandong Province with an altitude of 1483 m, is the highest point of the NCP. It is an ideal observation site for cloud chemistry observation (J. Li et al., 2017, 2020a, b). The observed concentrations of SO2, O3, H2O2, and sulfate in cloudy conditions from 19 June to 30 July 2015 and from 20 June to 30 July 2018 with a time interval of 1 h are obtained to evaluate the cloud chemistry scheme in WRF/CUACE (J. Li et al., 2017; Li et al., 2020a, b).
The WRF/CUACE is set up with two-level nesting domains for the evaluation with the Riguan Peak as the central point (Fig. 1a). The horizontal resolution of the outer domain (O) is 9 km with a grid of 100×104, and the horizontal resolution of the inner domain (I) is 3 km with a grid of 88×94 (Fig. 1a). There are 32 vertical layers with a top pressure of 100 hPa.
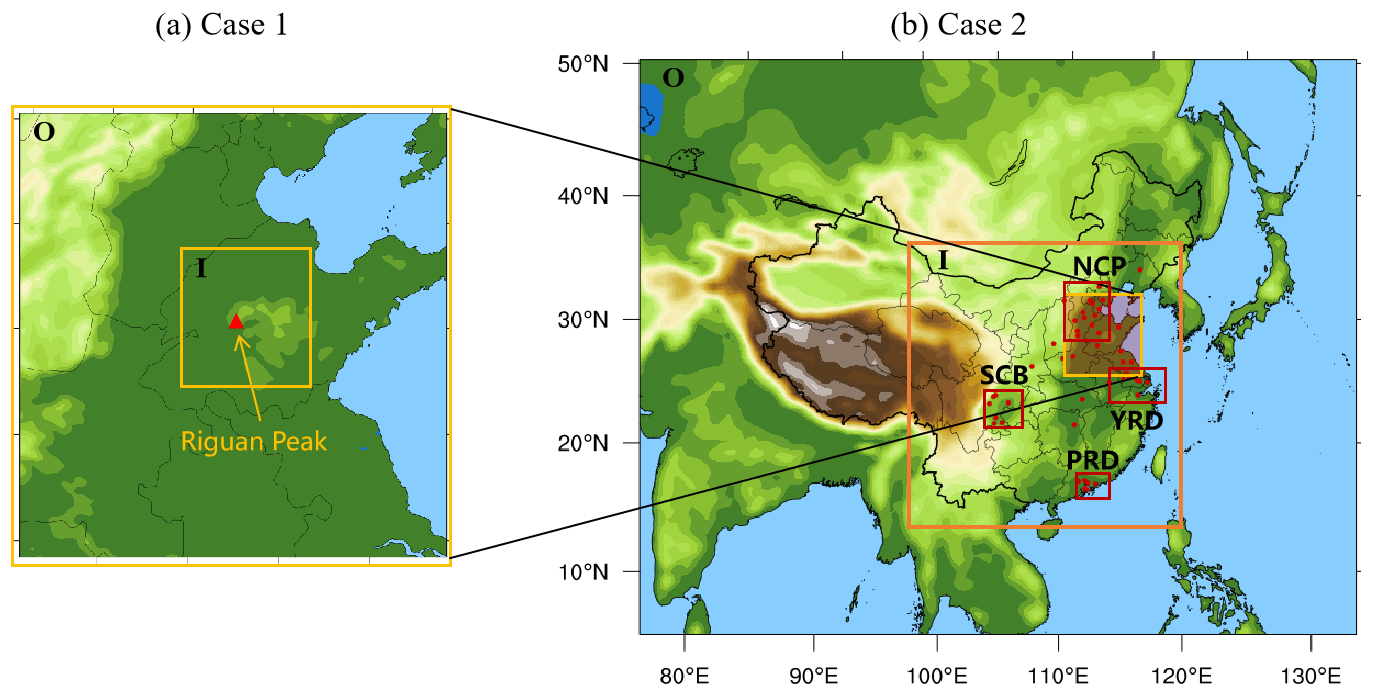
Figure 1Model nesting domains and target regions. Case 1 (a): the red triangle is the Mount Tai observation site. Case 2 (b): red dots are cities where the surface observations of air pollutants are used for model evaluation. The target four regions are the NCP, YRD, PRD, and SCB.
2.3.2 Simulations of regional characteristics – Case 2
December 2016 was selected to assess the regional contribution of cloud chemistry to SO2 and sulfate in CUACE as a typical heavy pollution episode occurred from 16 to 22 December, covering most of east China, with the highest hourly PM2.5 concentration exceeding 1100 µg m−3. The simulation region is set up as shown in Fig. 1b with two-level nesting domains. The outer domain covers Central and East Asia with a horizontal resolution of 54 km and a grid of 139×112. The inner domain covers most of China on the eastern side of the Qinghai–Tibet Plateau including NCP, YRD, PRD, and SCB, with a horizontal resolution of 18 km and a grid of 157×166. The vertical layer number of the model is the same as that in Case 1.
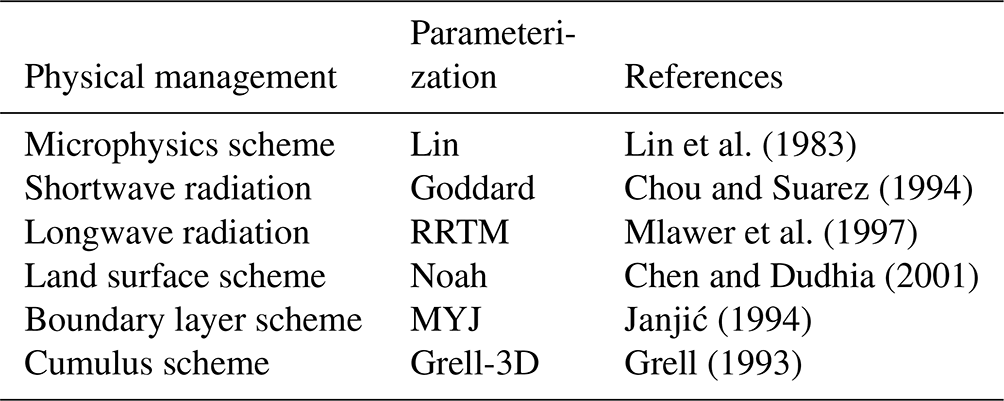
Since the cloud water is the reaction pool of cloud chemistry, whether the simulation of cloud water is reasonable or not is directly related to the effectiveness of cloud chemistry. Both the cloud water and rainwater from WRF are online coupled to the cloud chemistry module, and the main physics configurations are listed in Table 2.
2.4 Meteorological, pollution, and satellite data
For both cases, the meteorological initial and boundary conditions for WRF/CUACE are from the National Centers for Environmental Prediction (NCEP) FNL (Final) global reanalysis at a resolution of 1∘ × 1∘ with 6 h interval. The chemical lateral boundary conditions are from the National Oceanic and Atmospheric Administration (NOAA) Meteorological Laboratory Regional Oxidant Model (NALROM; Liu et al., 1996). The model is run in a restart way with a 5 d spin-up.
FY-2G cloud image data from CMA with a 1 h interval are used to evaluate the cloud in both cases. Routine meteorological observations at a 3 h interval from 23 meteorological stations of CMA for 2 m temperature, 2 m relative humidity, and 10 m wind speed as well as hourly pollutant data for 55 city sites from the China National Environmental Monitoring Centre are used to evaluate the meteorological fields and pollutants for December 2016. For a city with several observation sites, an averaged value is used.
MEIC (Multi-resolution Emission Inventory for China), at a resolution of 0.25∘, is used as the anthropogenic emissions with species of SO2, nitrogen oxides (NOx), carbon monoxide (CO), ammonia (NH3), BC, OC, non-methane volatile organic compounds (NMVOCs), PM2.5, and PM10 from industry, transportation, residential areas, and agriculture (M. Li et al., 2017; Zheng et al., 2018). The emission base years of 2015 and 2017 are used for Case 1 and Case 2, respectively.
3.1 Evaluation of the cloud chemistry mechanism
In order to evaluate the cloud chemistry mechanism in WRF/CUACE, the simulation results are compared with the observations at Mount Tai. By analyzing the satellite cloud images in and around Mount Tai and matching with the available observed data, two time periods with clouds, from 19 June to 30 July 2015 and from 20 June to 30 July 2018, were selected for the comparisons, defined as “cloud process-1” (CP-1) and “cloud process-2” (CP-2), respectively. The simulated results for chemical species are illustrated in scatterplots (Fig. 2), which reveals that the simulated concentrations of SO2, sulfate, O3, and H2O2 are all within a factor of 2 of the observations when cloud chemistry occurs, indicating reasonable agreement between simulations and observations for both CP-1 and CP-2 cases. The sulfate underestimates are clear in both CP-1 and CP-2 cases, which was reported by other modeling results as well (Tuccella et al., 2012; Huang et al., 2019; Ge et al., 2022).
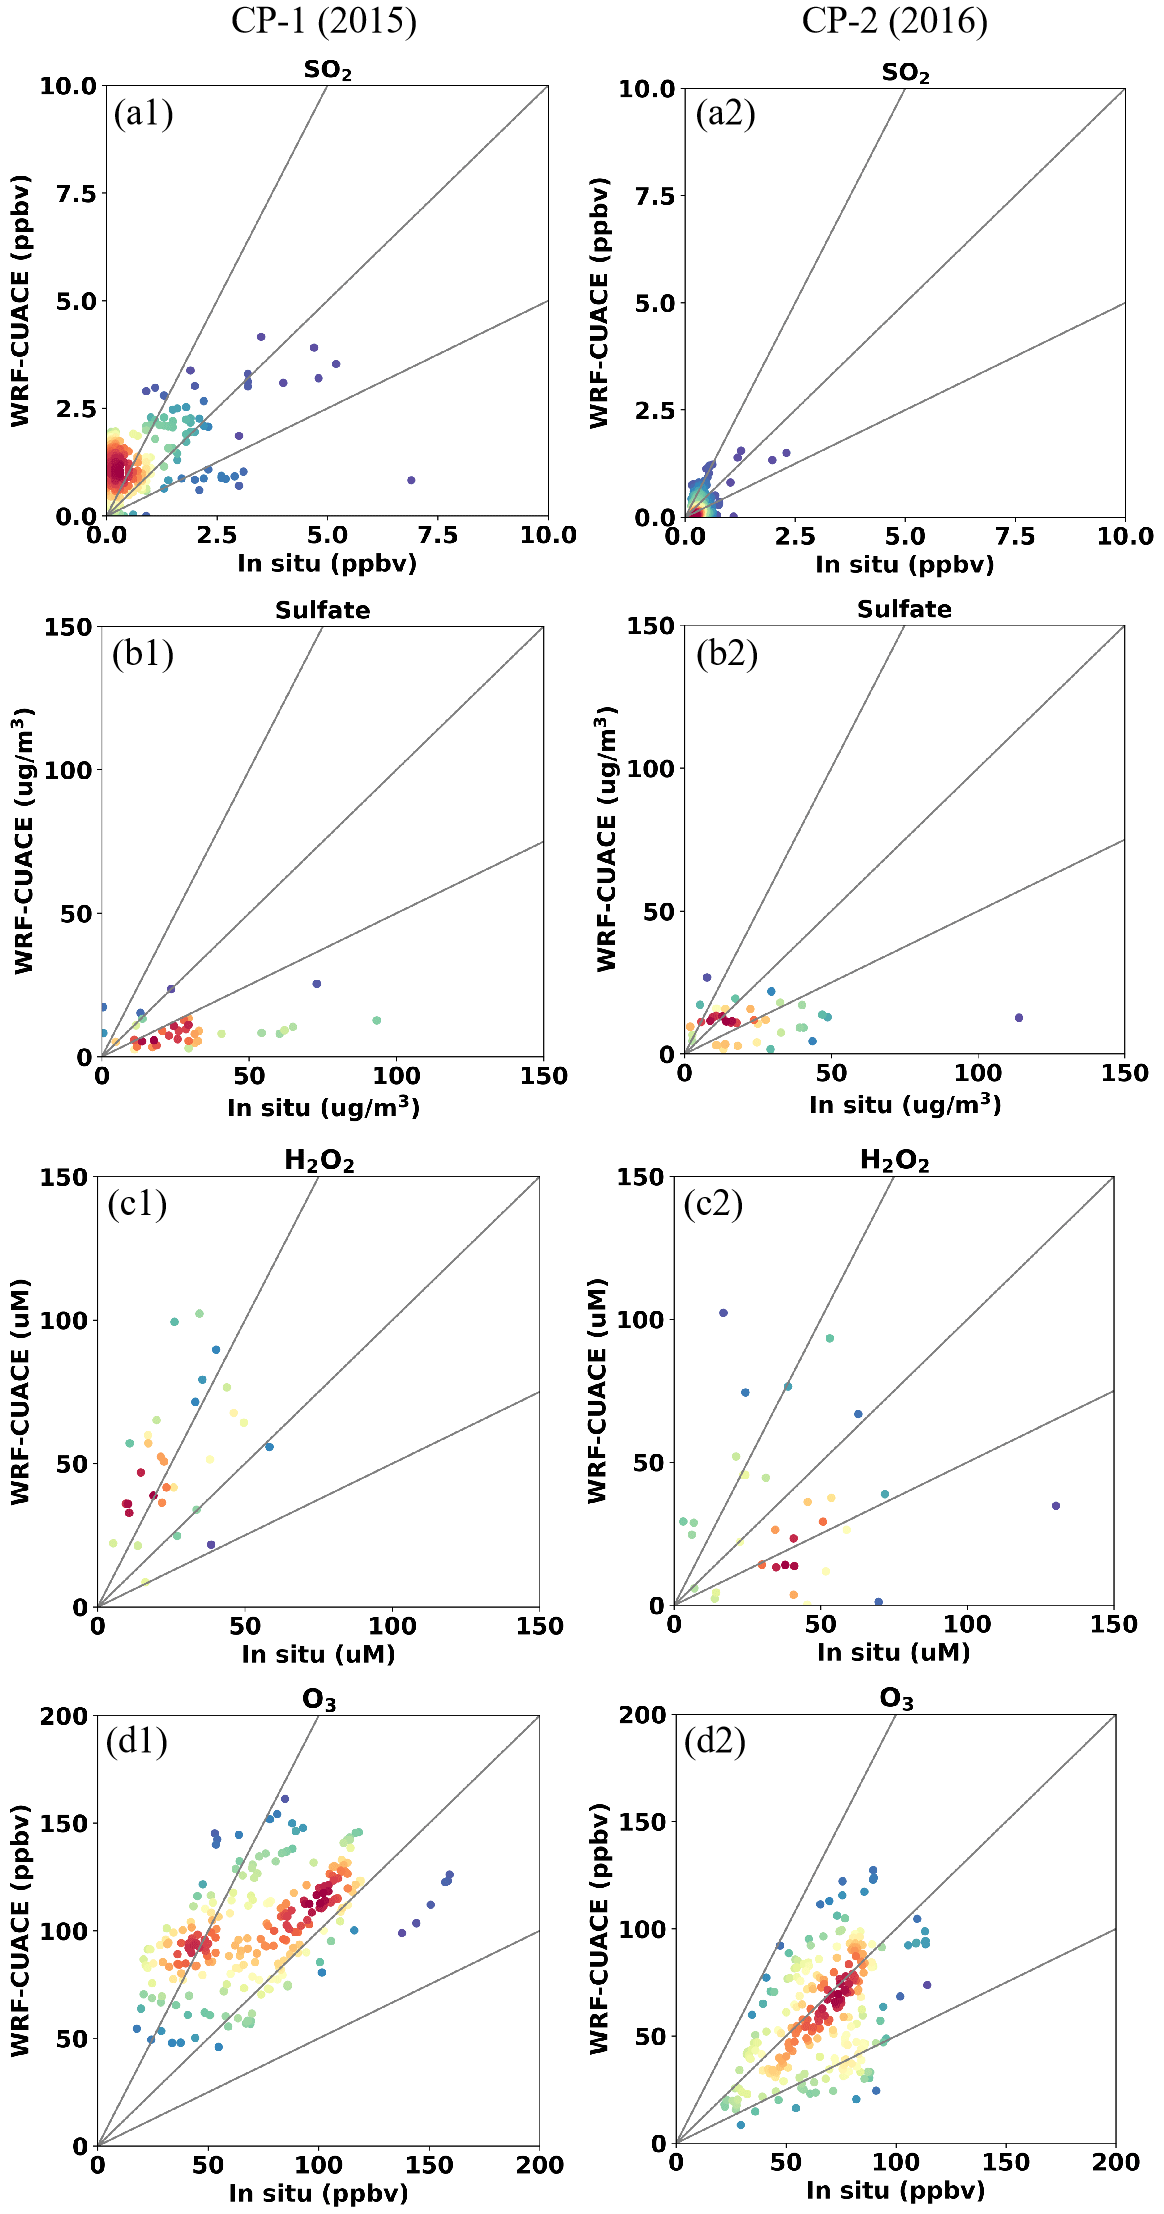
Figure 2Scatterplots of hourly SO2 (a1, a2), sulfate (b1, b2), H2O2 (c1, c2), and O3 (d1, d2) concentrations between WRF/CUACE and in situ observations at Mount Tai in CP-1 and CP-2. Units: SO2 and O3 (ppbv), H2O2 (µM), and sulfate (µg m−3). The color of the dots represents the point density, and the red means larger sample size.
The statistics of correlation coefficients (R), relative average deviation (RAD), and normalized mean deviation (NMB) between hourly simulated and observed SO2, O3, H2O2, and sulfate are shown in Table 3. Among them, the simulated and observed averages of SO2 are very close in both CP-1 and CP-2, with a RAD about −3.4 % and −6.1 %. For other species, the RAD is in the range of 8.7 %–55.0 %. The R values for the four species are 0.34, 0.33, 0.78, and 0.32 for CP-1 and 0.47, 0.40, 0.06, and 0.54 for CP-2, respectively. Although the R, RAD, and NMB of H2O2 in CP-2 are only 0.06, 18.0 %, and −19.6 %, the simulated mean value of H2O2 is closer to the observed mean value than that of CP-1 (RAD = 22.4 %, NMB = −36.6 %). For sulfate, the simulated R values are 0.32 and 0.54 in CP-1 and CP-2, respectively, but the model underestimates sulfate concentrations with NMB of −71.0 % and −59.4 % in CP-1 and CP-2. Some reasons might contribute to the underestimations. Firstly, the latitude of the observed site at Mount Tai is 1483 m, which can be in the boundary layer during the daytime and in the free atmosphere during the nighttime in summer (Zhu et al., 2018). Therefore, the diurnal variation of the boundary layer affects the three-dimensional concentration distribution of oxidants and aerosols (Peng et al., 2021) and influences the development of cloud formation. Secondly, there are biases from the model due to the difficulties of representing the complex topography of Mount Tai and cloud physics. Thirdly, the cloud chemistry in CUACE lacks a pathway for TMI- and NO2-catalyzed oxidation, as well as some other newly discovered oxidation mechanisms, which could lead to the bias in SO2 and sulfate. Fourthly, typical measurement systems for ambient aerosols easily misinterpret organosulfur (mainly in the presence of hydroxy-methane sulfonate, HMS) as inorganic sulfate, thus leading to a positive observational bias, e.g., 20 % mean bias during winter haze in Beijing (Moch et al., 2018; Song et al., 2019).
Table 3Statistics for SO2, O3, H2O2, and sulfate in cloud chemistry at the Mount Tai site.
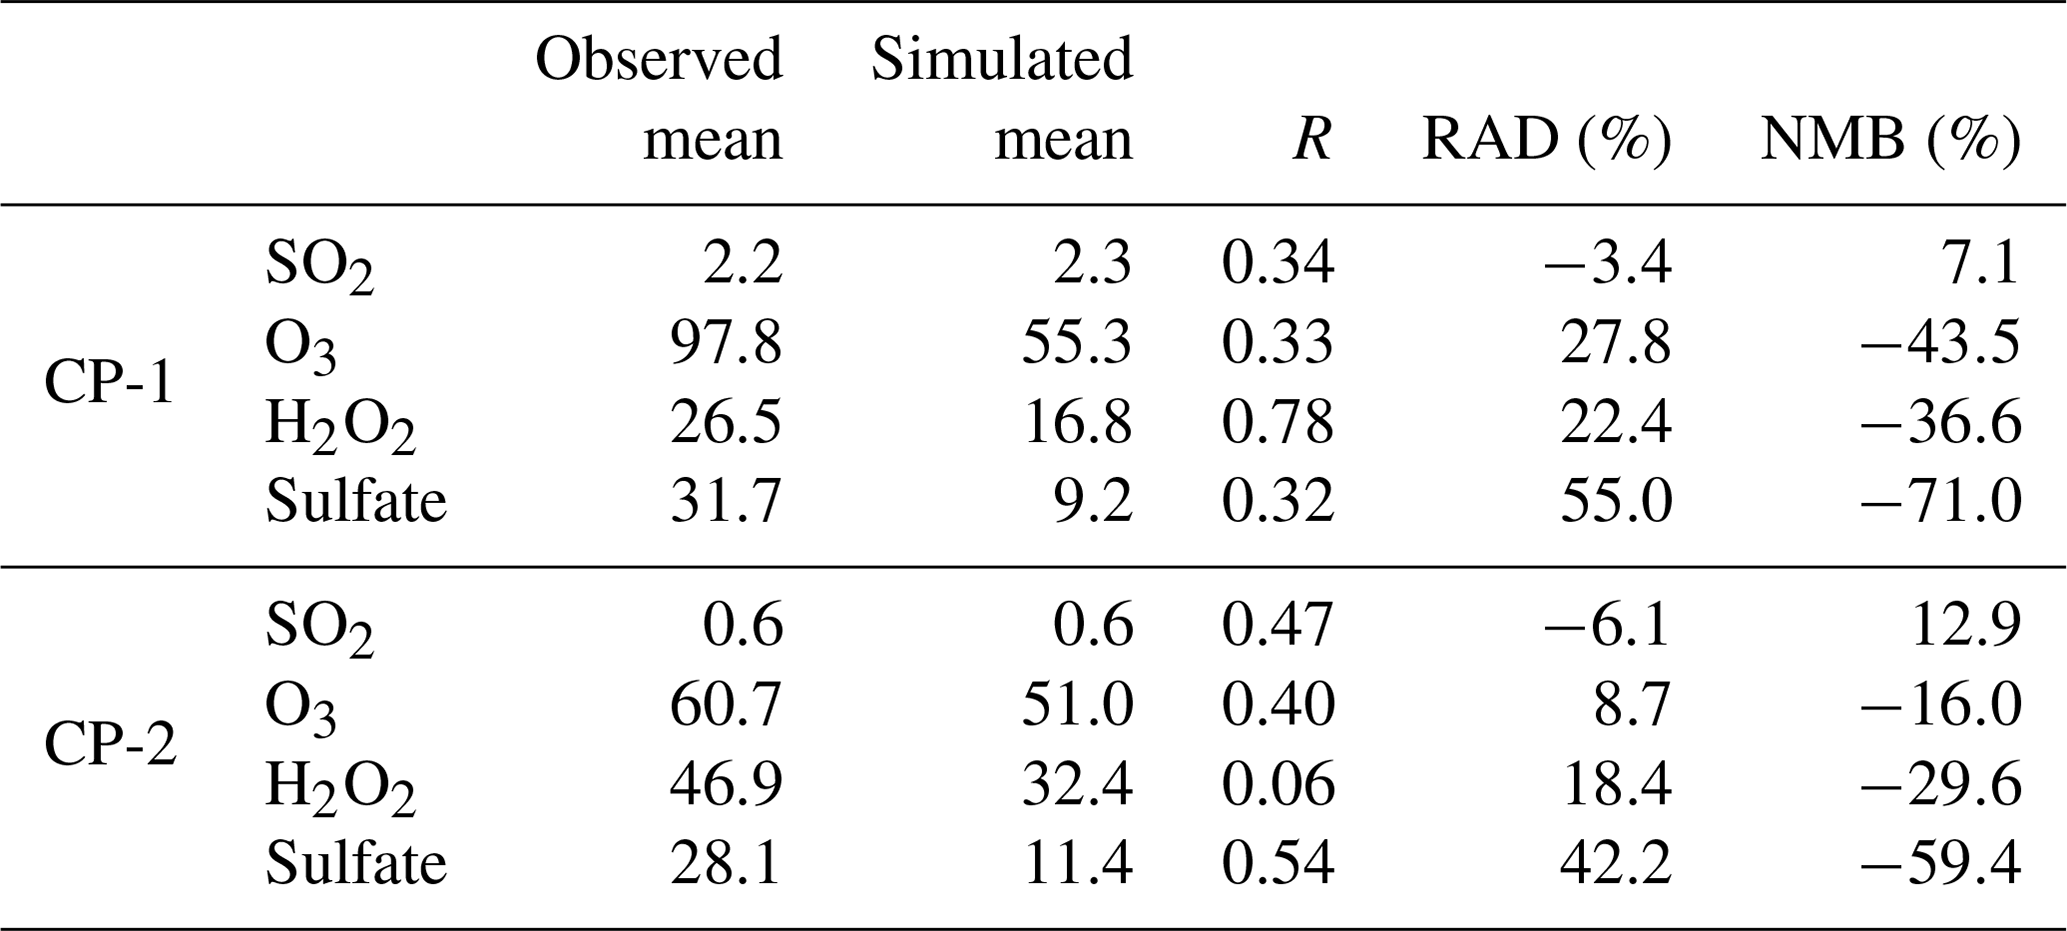
Units: SO2 and O3 (ppbv), H2O2 (µM), and sulfate (µg m−3).
Another interesting point simulated correctly by the model was the increasing trend of H2O2 and the decreasing trend of SO2 from 2015 to 2018. The observed and simulated mean values of H2O2 were changed from 26.5 and 16.8 µM in CP-1 in 2015 to 46.9 and 32.4 µM in CP-2 in 2018, respectively. For SO2, the observed and simulated mean values were reduced from 2.2 and 2.3 µg m−3 in CP-1 in 2015 to 0.6 and 0.6 µg m−3 in CP-2 in 2018, respectively (Table 3). Both the observations and simulations clearly showed the increasing trend of H2O2 and the decreasing trend of SO2 from 2015 to 2018. This conclusion is consistent with the trends of other observational studies (Ren et al., 2009; Shen et al., 2012; Li et al., 2020a; Ye et al., 2021). The decreasing SO2 and increasing H2O2 and O3 have been attributed to the national SO2 and particulate emission control measures since 2013 (Fan et al., 2010; Lu et al., 2020).
Figure 4 shows the RTCLD of SO2 and simulated liquid water content at 02:00 and 08:00 LST on both 24 and 25 June in CP-1 at Mount Tai. The column cloud and the liquid water content, which are consistent with the cloud images, indicate that there are clouds with sufficient water vapor in and around the vicinity of Mount Tai (Fig. 3). The SO2 consumption rate (RTCLD(SO2)) distribution is consistent with the liquid water distribution at all four times (Fig. 4). The SO2 depletion rate is above 80 % at Mount Tai, which is compatible with observations (Li, 2020). All of these indicate that the model can capture the SO2 consumption in the cloudy environment.
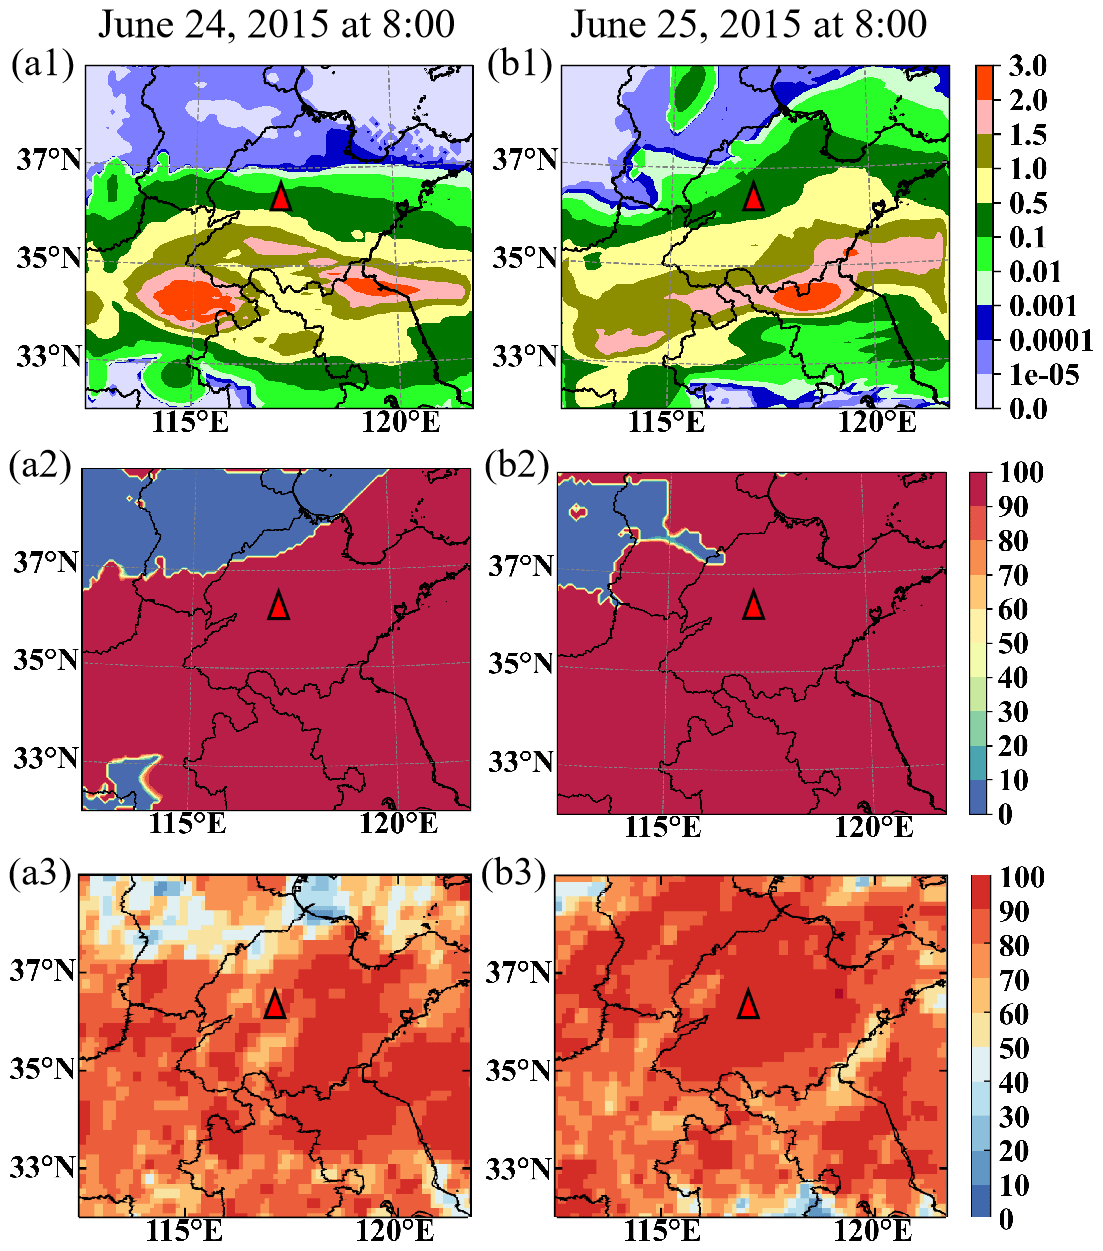
Figure 3Cloud water simulation and satellite comparison. The column liquid water content by WRF/CUACE (a1, b1, unit: kg m−2), the cloud fraction by WRF/CUACE (a2, b2, unit: %), and the cloud total amount of FY2G, (a3, b3, unit: %). Panel (a) is for 08:00 LST on 24 June 2015, and (b) is for 08:00 LST on 25 June 2015. The red triangle is the Mount Tai observation site.
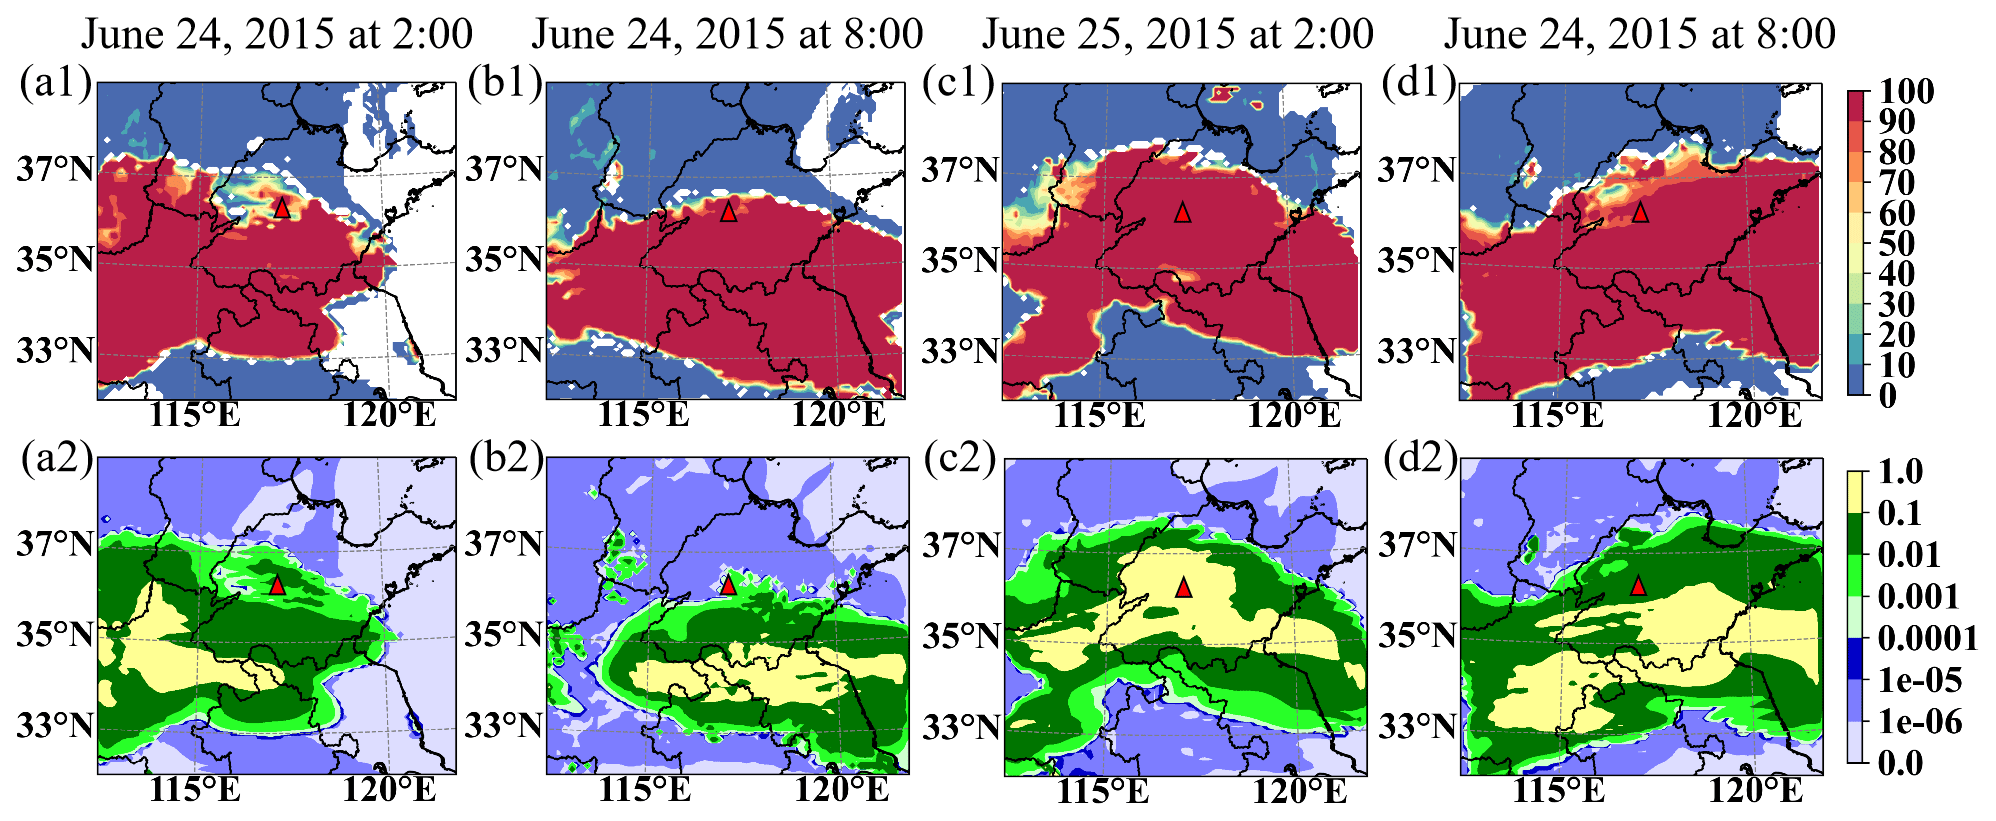
Figure 4Regional comparison of in-cloud SO2 oxidation with cloud water at the top of Mount Tai. Distributions of SO2 oxidation rate (a1, b1, c1, and d1, unit: %) and liquid water content (a2, b2, c2, and d2, unit: g kg−1) by WRF/CUACE, where (a) is for 02:00 LST on 24 June 2015, (b) is for 08:00 LST on 24 June 2015, (c) is for 02:00 LST on 25 June 2015, and (d) is for 08:00 LST on 25 June 2015. The red triangle is the Mount Tai observation site.
In summary, the simulated SO2, H2O2, O3, and sulfate concentrations are comparable to the observations. WRF/CUACE is also able to simulate the decreasing trend of SO2 and the increasing trends of O3 and H2O2 over the year. Therefore, the cloud chemistry mechanism in WRF/CUACE is relatively reasonable for reproducing the cloud chemistry for SO2, sulfate, and the important oxidants of H2O2 and O3.
3.2 Assessment of the impacts of cloud chemistry on regional SO2 and sulfate
This section will further assess the contribution of cloud chemistry for the four main pollution regions of NCP, YRD, PRD, and SCB (Fig. 1b) in China for all of December of 2016 (hereinafter referred to as DEC) and a heavy pollution episode (hereinafter referred to as HPE) occurring during the month (16–22 December), as selected for Case 2. The regional impacts of cloud chemical processes on surface SO2 and sulfate are analyzed for DEC and for HPE. The heavy pollution episode (HPE) is investigated with respect to the developing stage HPE-1 (16–18 December 2016), the maturity stage HPE-2 (19–21 December 2016), and the dissipation stage HPE-3 (22 December 2016) for the four pollution regions.
3.2.1 Meteorological evaluation
As the driving force for air pollution and cloud chemistry, the meteorology elements of 2 m temperature (T2), 2 m relative humidity (RH2), and 10 m wind speed (WS10) in DEC and HPE are compared between simulated and observed results in Table 4. The temperature correlation is the best in DEC, followed by humidity and then wind speed, which is consistent with previous findings (Zhou et al., 2012; Wang et al., 2015; Gao et al., 2016). The RMSEs of wind speeds all range from 1.03 to 1.50 m s−1, falling within the criteria (less than 2 m s−1) defining “good” model performance in stagnant weather (Emery et al., 2001). The RMSE of wind speed and the wind speed for HPE is smaller than that of DEC, which indicates that the model can relatively reasonably capture the static condition.
Table 4Statistical metrics for meteorology in four regions for HPE and DEC.
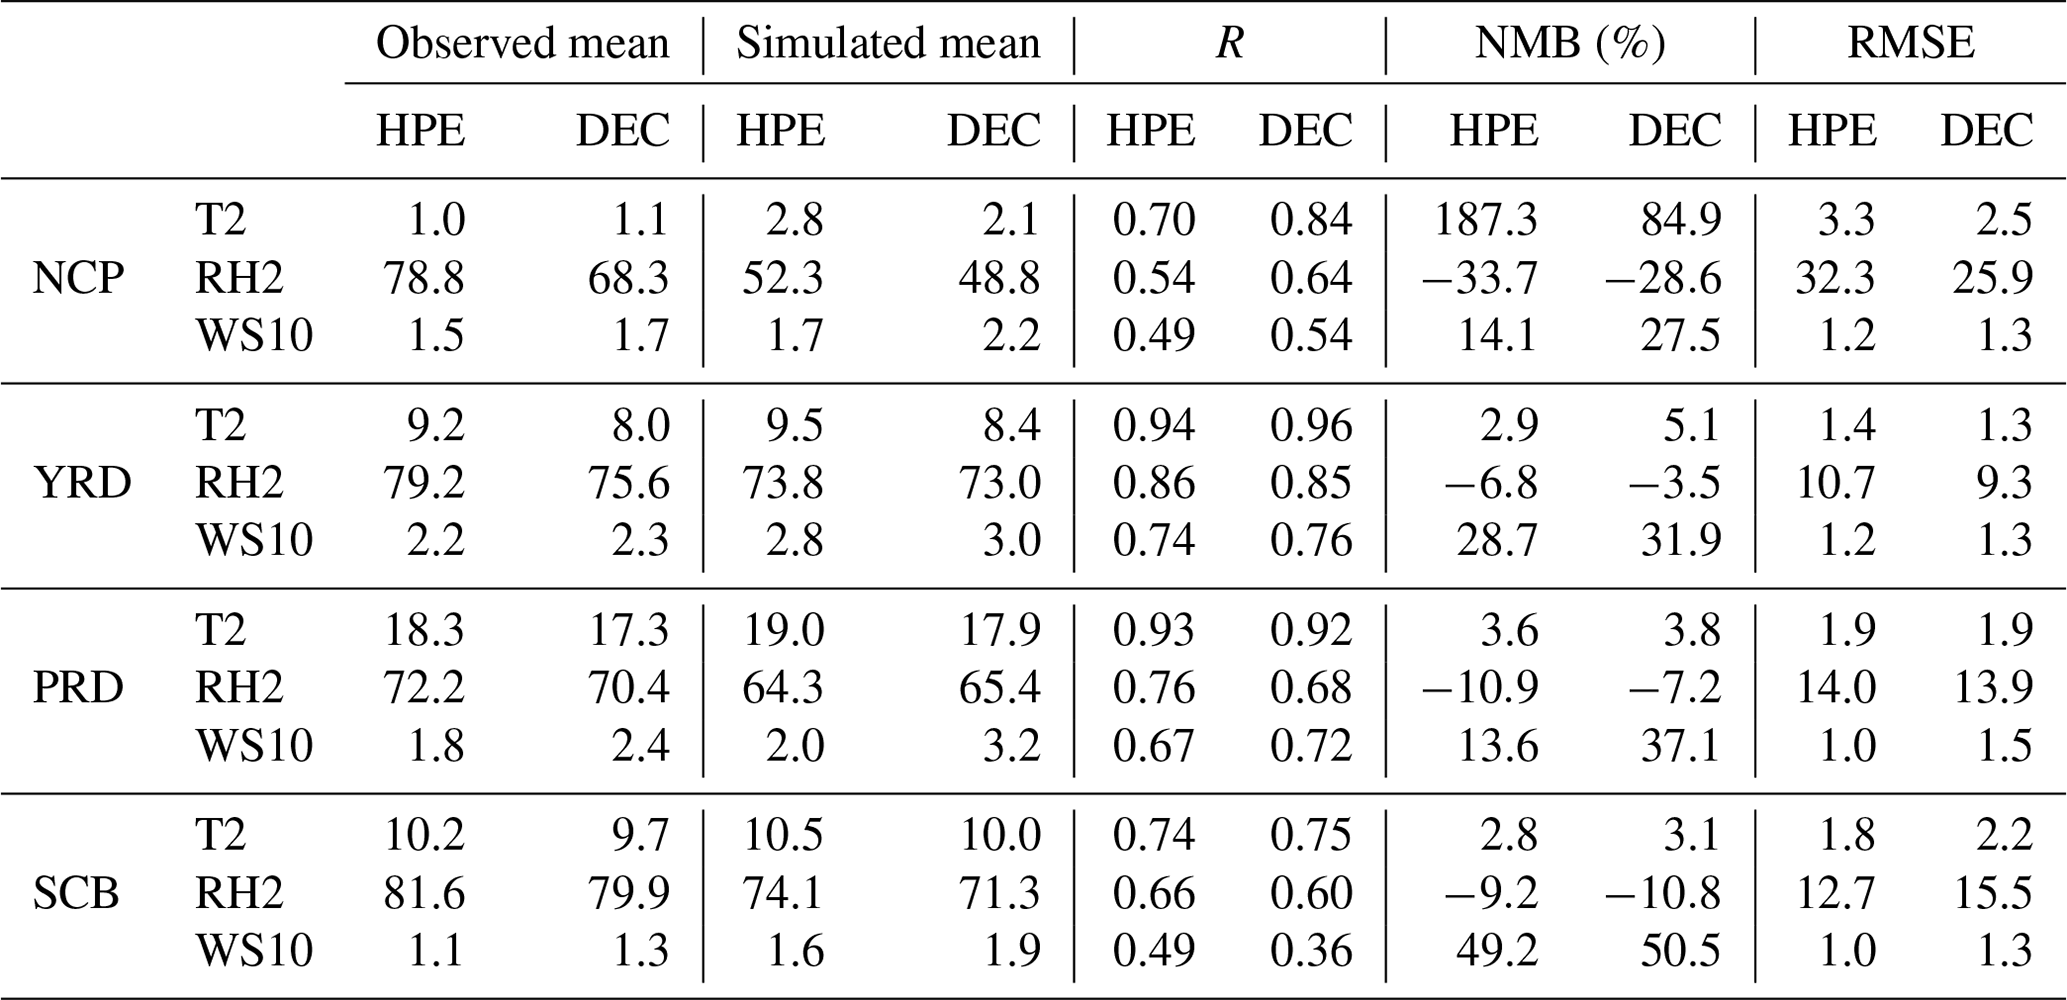
Units: T2 (∘), RH2 (%), and WS10 (m s−1).
Figure 5 shows the satellite cloud images, the column cloud, and the liquid water content simulated for the maturity and dissipation stages (19–22 December) of the HPE. The satellite image shows that the cloud coverage region is mainly in the southwest of China, besides SCB on 19 December, covering most of eastern China including NCP, YRD, PRD, and SCB on December 20 and 21, and then moving eastward outside of China on December 22 (Fig. 5a1–d1). The cloud distribution fits well with the satellite images (Fig. 5a2–d2). The column liquid water distribution also moves from west to east as the episode developed (Fig. 5a3–d3), which is located farther south in eastern China than that of the clouds. In SCB and YRD, the liquid water content is more abundant, reaching over 100.0 g m−2, than that in PRD, only up to 10.0 g m−2. NCP has the least liquid water content among the four regions, especially in Beijing and the northwestern part of Hebei Province ranging over 0.001–0.01 g m−2, mostly due to the dry environment and partly due to the overestimated temperature and underestimated humidity in the model. Above all, CUACE not only effectively simulates pollution but also provides a relatively reasonable meteorological background basis for cloud chemistry in the heavy pollution period.
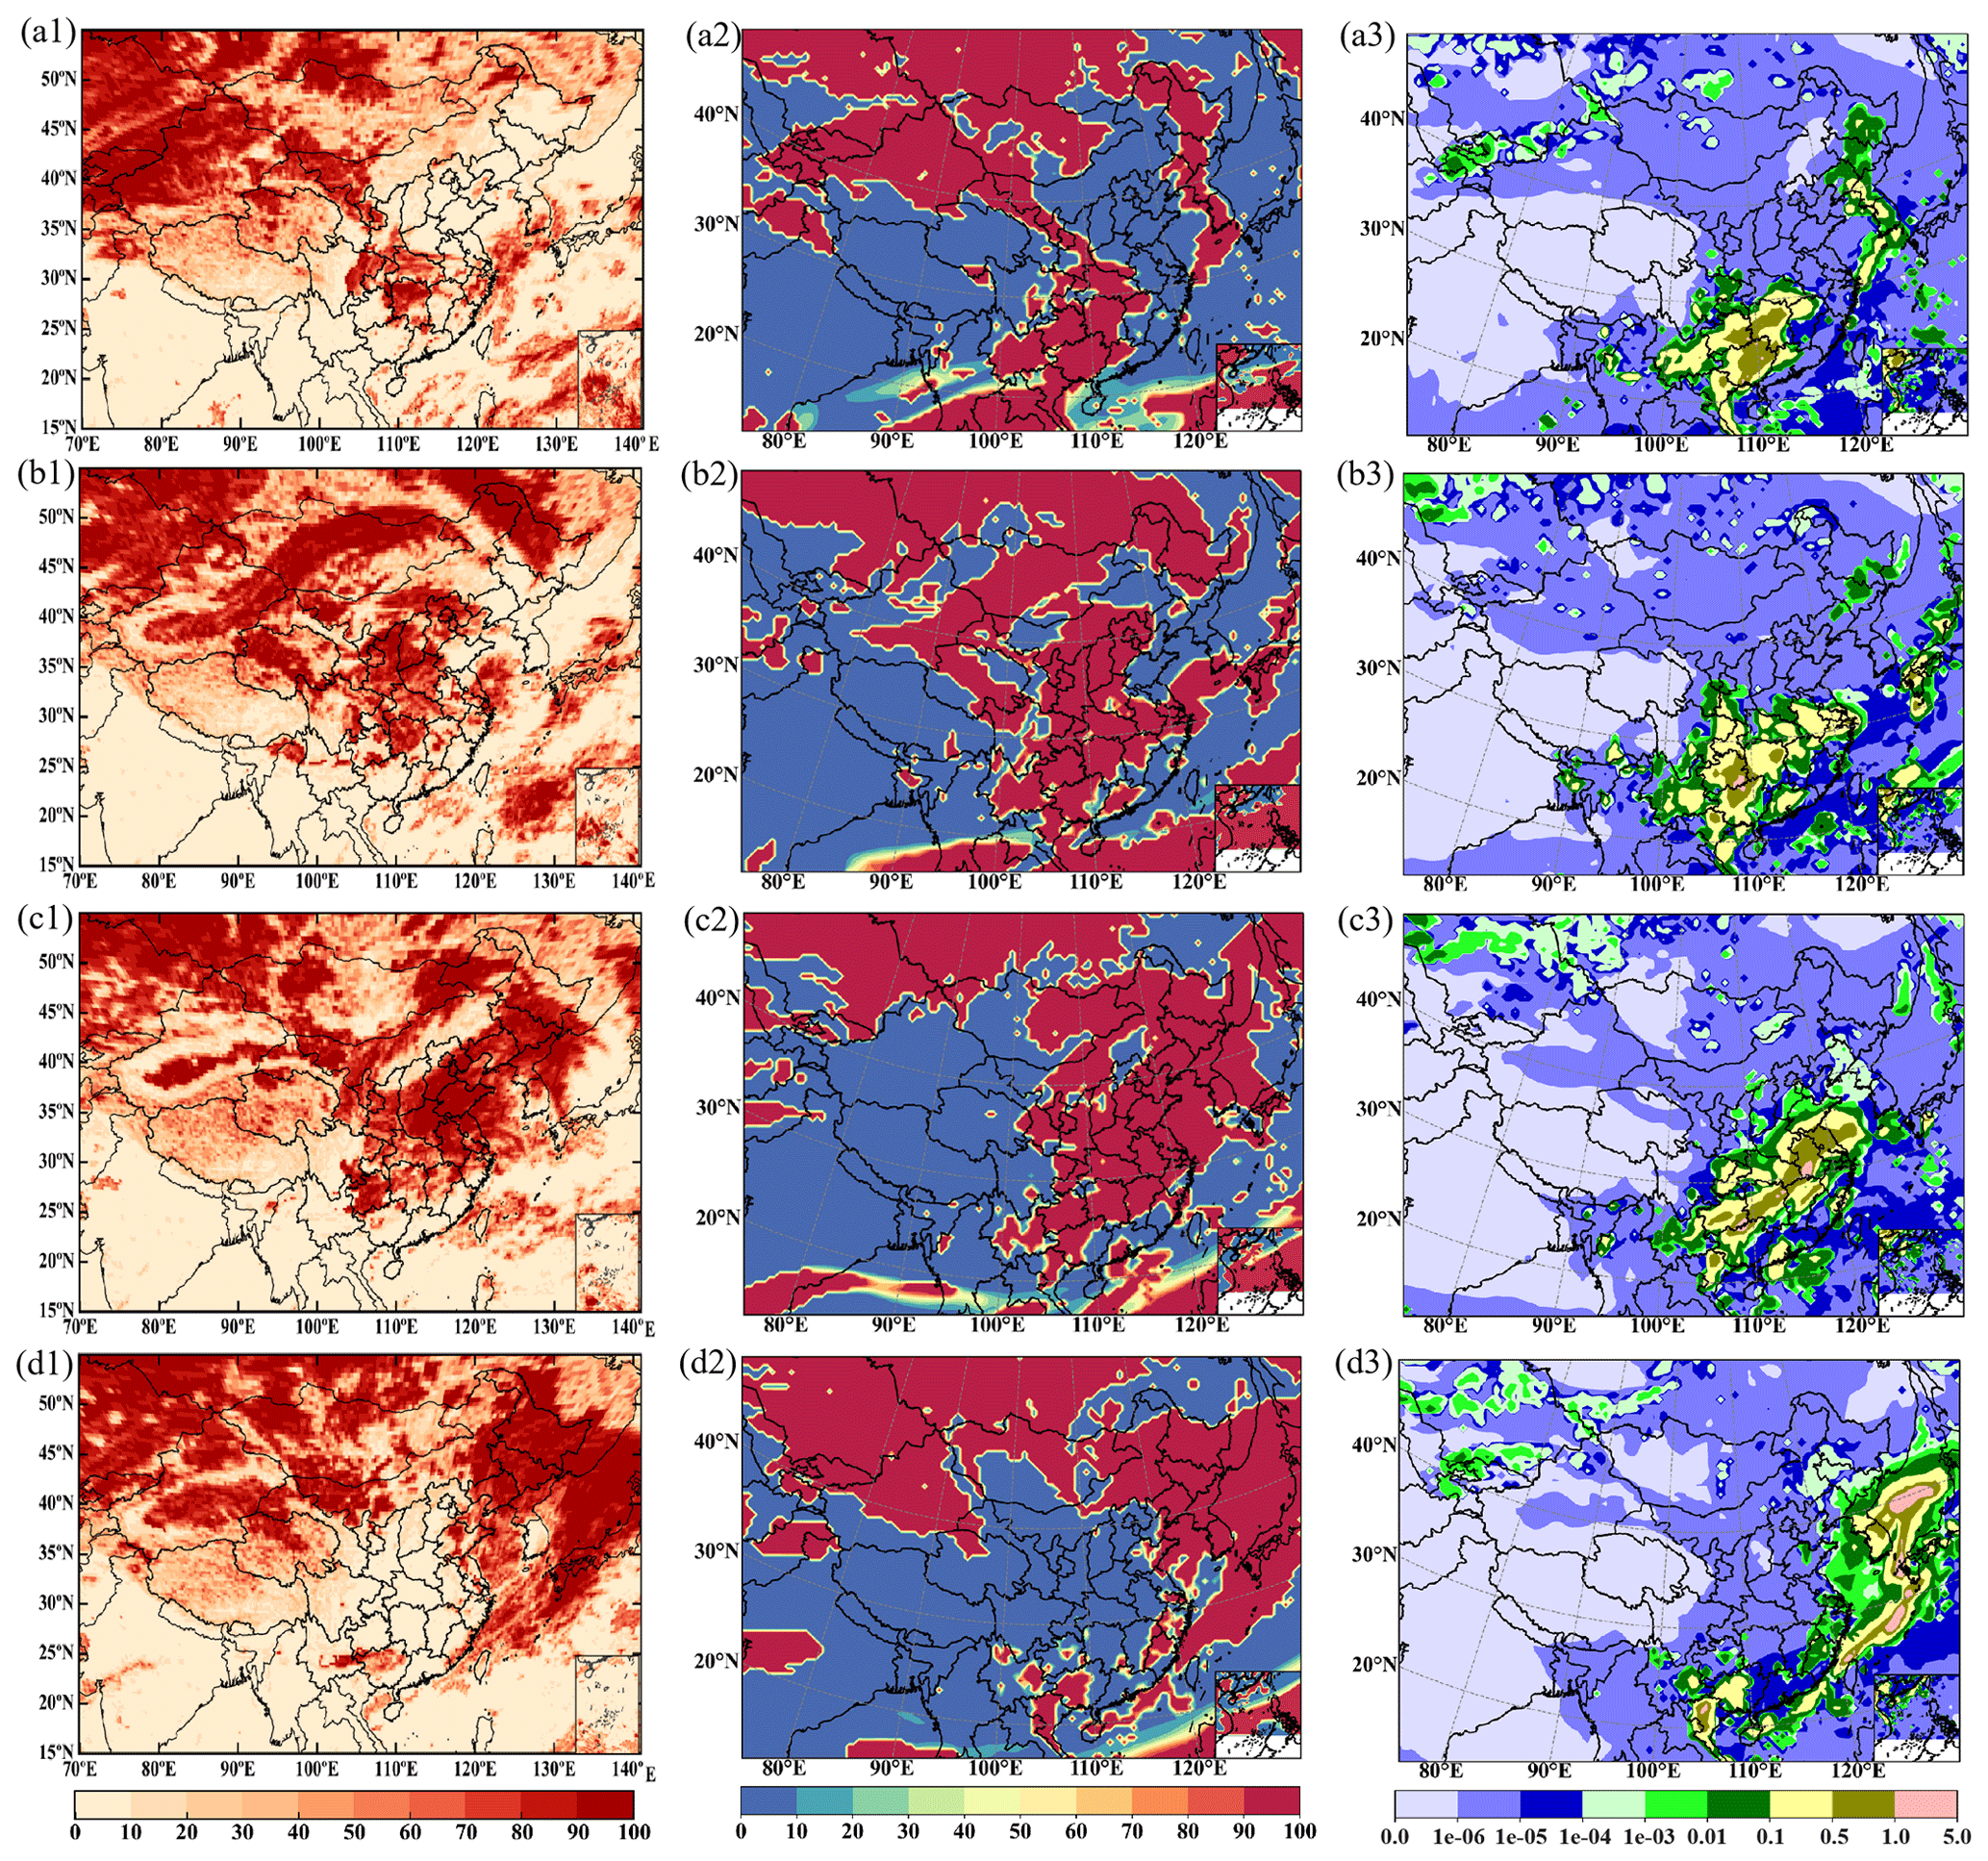
Figure 5Cloud water simulation and satellite comparison in a heavy pollution episode. The cloud total amount of FY-2G (a1, b1, c1, d1, unit: %), the column cloud of WRF/CUACE (a2, b2, c2, d2, unit: %), and the column liquid water content of WRF/CUACE (a3, b3, c3, d3, unit: kg m−2). Panel (a) is for 08:00 LST on 19 December, (b) is for 08:00 LST on 20 December, (c) is for 08:00 LST on 21 December, and (d) is for 08:00 LST on 22 December.
3.2.2 Chemical evaluation
Figure 6 shows the mean SO2 and sulfate concentrations simulated for DEC and HPE-2. The high and low centers of monthly mean SO2 and sulfate concentrations by CUACE in December 2016 coincided with the annual observed average by Cao et al. (2021) in the SCB and NCP. The sulfate concentrations are low on a monthly basis and high at the pollution maturity stage compared to the averaged observations of several pollution episodes studied by Wang et al. (2022) in December 2016 for NCP. The simulated mean sulfate concentration distribution in Fig. 6b is comparable to that by Wang et al. (2021, 2022) in December 2016, both displaying an increase from northwest to southeast almost of the same magnitude as in NCP. For SCB, sulfate concentrations are compatible to that observed in winter in 2015 by Kong et al. (2020).
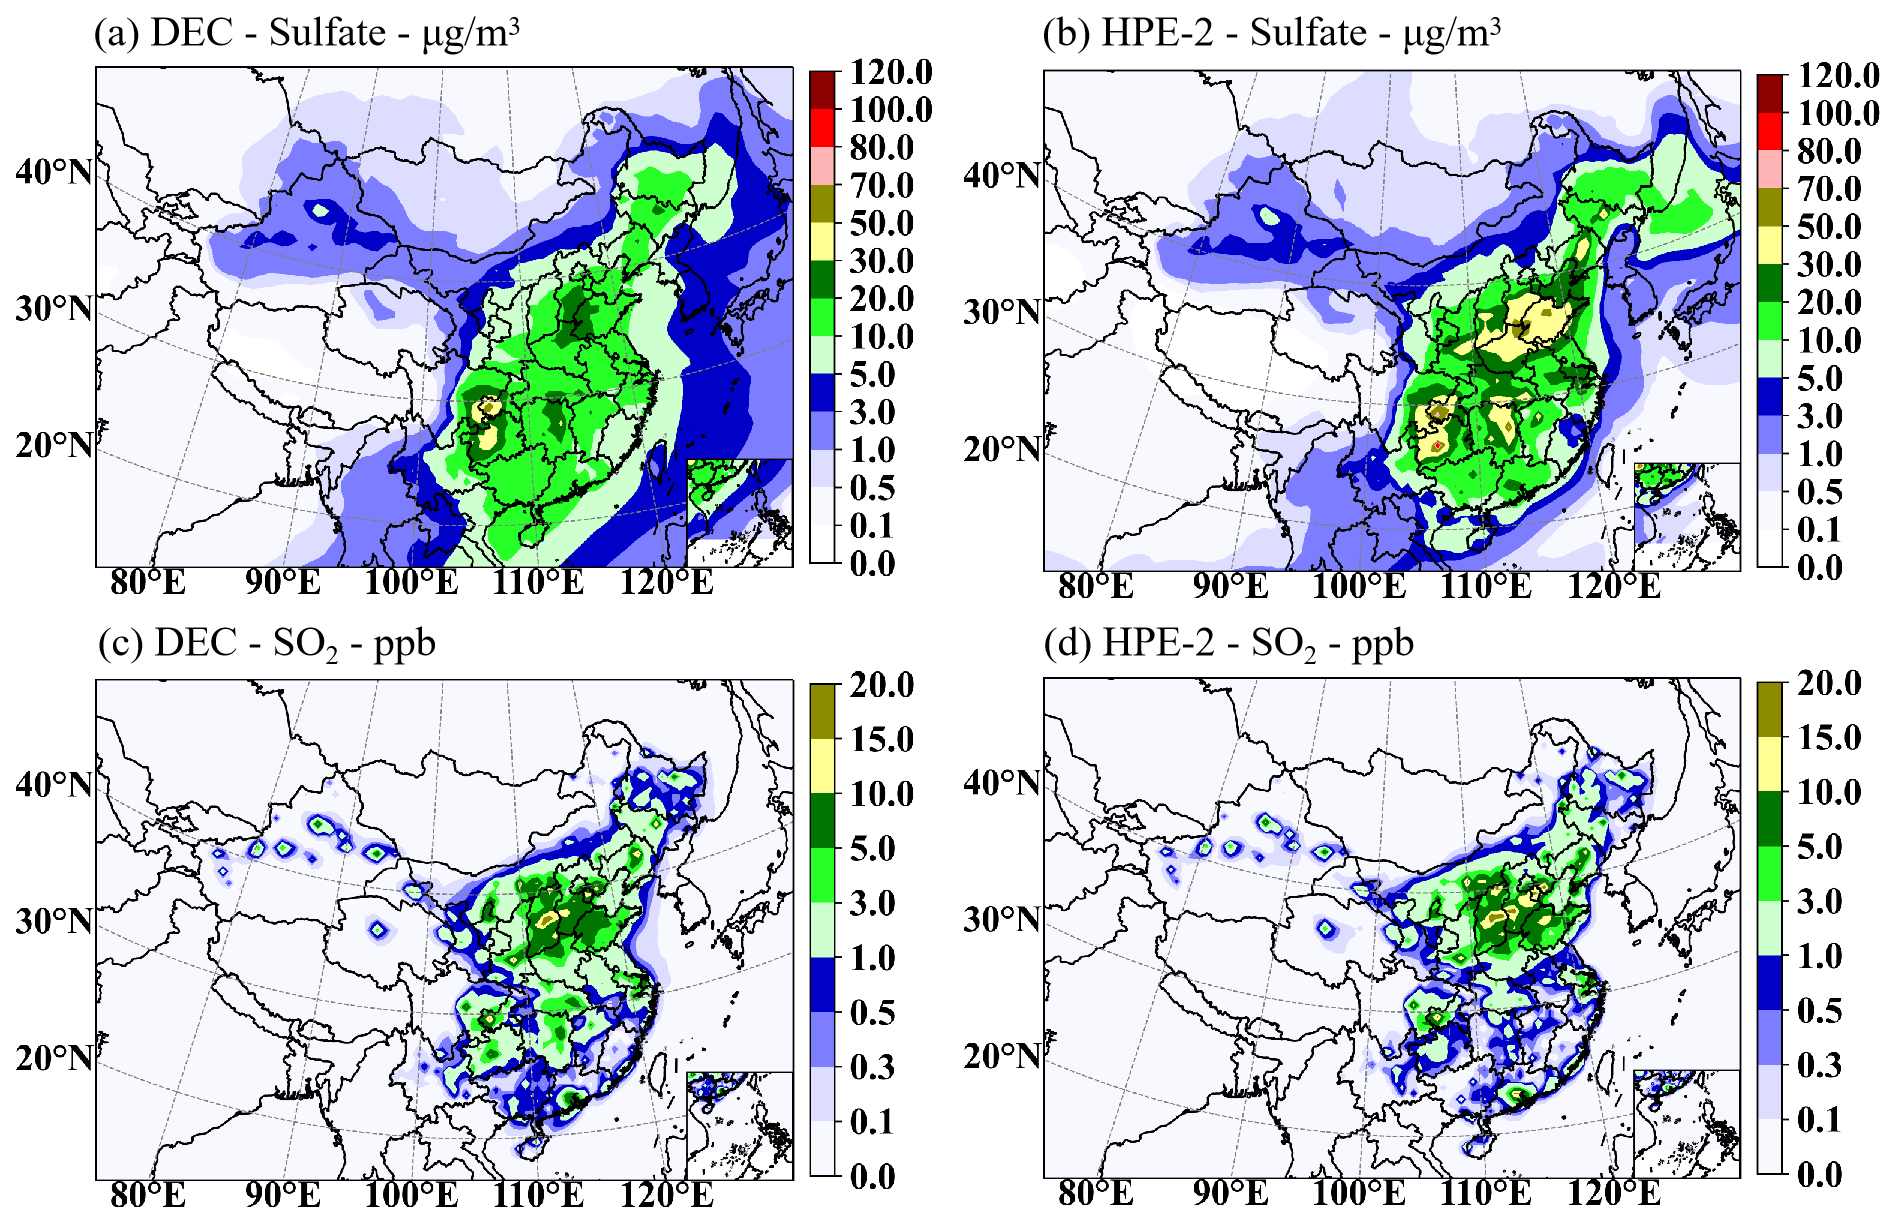
Figure 6The mean sulfate concentration for DEC (a, c) and HPE-2 (b, d) for SO2 (c, d) and sulfate (a, b).
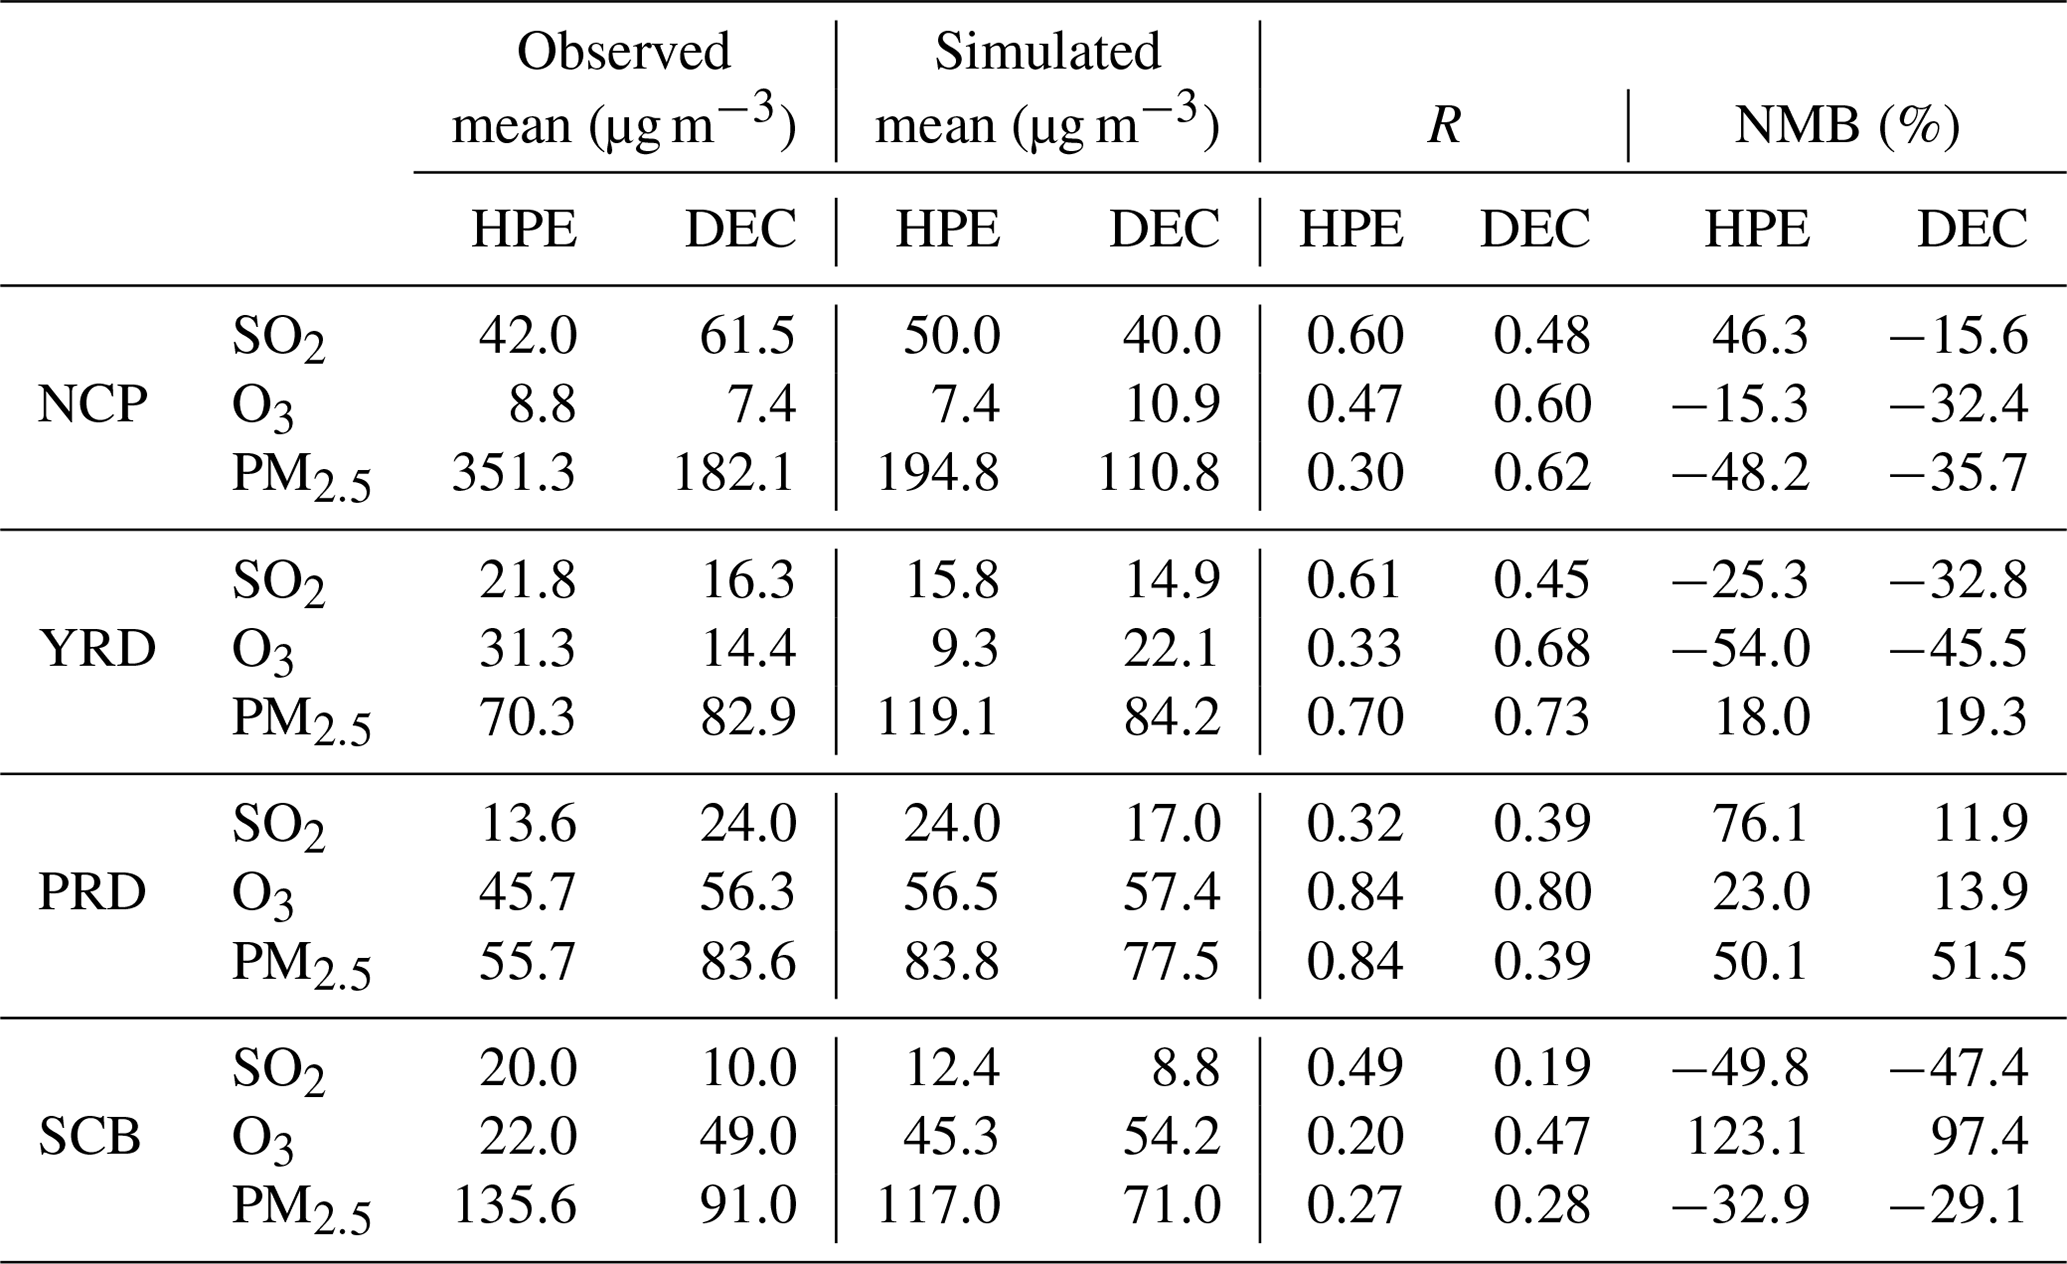
The simulated hourly PM2.5, O3, and SO2 concentrations in four regions are also compared with the observations (Table 5). Most of the simulations are within a factor of 2 of the observations (figure omitted), and the mean values of the three pollutants in the four regions are close to the observations for DEC and HPE, indicating that the model captures the variability of PM2.5, O3, and SO2 concentrations for both DEC and HPE. During HPE, the differences of mean values ranged from −7.6 to 10.4 µg m−3 for SO2, from −22 to 23.3 µg m−3 for O3, and from −156.5 to 48.8 µg m−3 for PM2.5. During DEC, the differences of mean values were from −21.5 to −1.2 µg m−3 for SO2, from 1.1 to 7.7 µg m−3 for O3, and from −71.3 to 1.3 µg m−3 for PM2.5. During HPE, the R values are from 0.32 to 0.61 for SO2, from 0.20 to 0.84 for O3, and from 0.27 to 0.84 for PM2.5. During DEC, the R values are from 0.19 to 0.48 for SO2, from 0.47 to 0.80 for O3, and from 0.28 to 0.73 for PM2.5. During HPE, the NMBs are from −49.8 to 46.3 for SO2, from −54.0 to 123.1 for O3, and from −48.2 to 51.0 for PM2.5. During DEC, the NMBs are from −47.4 to 11.9 for SO2, from −45.5 to 97.4 for O3, and from −35.7 to 51.5 for PM2.5. The simulation in PRD, YRD, and NCP is relatively better than that in the SCB, where the complex terrain poses great challenges to meteorological field simulations.
Table 5Statistical metrics for hourly SO2, O3, and PM2.5 in four regions for HPE and DEC.
The ability of CUACE to simulate SO2, O3, and sulfate concentrations has also been evaluated in many previous research applications (Ke et al., 2020; Y. Zhou et al., 2021; Zhang et al., 2021). Ke et al. (2020) reported that the correlation between CUACE modeled and observed PM2.5 was 0.41–0.85 in NCP and 0.64–0.74 in YRD. Other atmospheric models in China have shown the same performance: for example, NACRMS has a correlation of about 0.68 for PM2.5 in NCP during a haze period (Wang et al., 2014).
3.2.3 Assessment of regional contributions
In order to assess the regional contributions, the average monthly impact of cloud chemistry on surface SO2 and sulfate denoted by DT (SO2) and DT (sulfate) for DEC is investigated (Fig. 7). It is found that the SO2 reduction for DEC is concentrated mostly in the central-east part of China, by an average of 0.1–1.0 ppb in most regions by cloud chemistry. SO2 concentrations are reduced by 0.5–3.0 ppb in most of the NCP, YRD, PRD, and SCB regions. Among them, there is a relatively strong center decreasing by 3.0–10.0 ppb in SCB. Ge et al. (2021) have evaluated the effects of in-cloud aqueous-phase chemistry on SO2 oxidation in the Community Earth System Model version 2 (CESM2). They found that the results incorporating detailed cloud aqueous-phase chemistry greatly reduced the SO2 overestimation, i.e., by 0.1–10.0 ppb in China and more than 10.0 ppb in some regions in winter, which is consistent with the results demonstrated in Fig. 7, where SO2 concentrations are depleted by 0.1–10 ppb in China. Correspondingly, sulfate growth is mainly centered in SCB, with the increased maximum up to 20.0–50.0 µg m−3. Sulfate concentrations are increased by 10.0–20.0 µg m−3 in most parts of NCP, YRD, and PRD and by 5–10.0 µg m−3 in others.
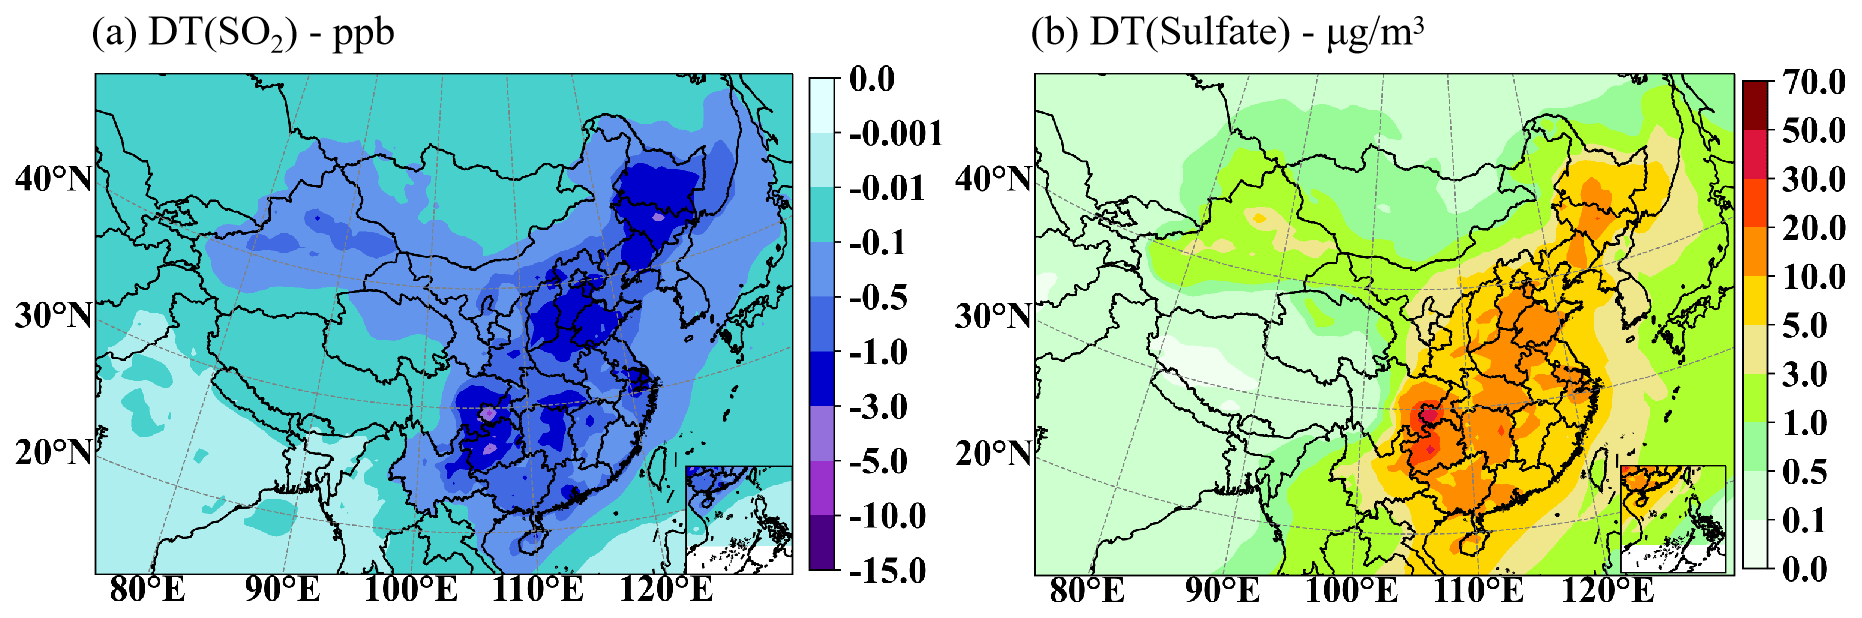
Figure 7The mean SO2 concentration decreased (a) and sulfate concentration increased (b) by cloud chemistry for DEC.
In addition to the average monthly impact of cloud chemistry, Fig. 8 shows DT(SO2) and DT(sulfate) for HPE-2. It is found that the SO2 concentration decreases most significantly in SCB: by 1.0–3.0 ppb in most regions and up to 3.0–10.0 ppb in the central region. In YRD, PRD, and NCP, the reduction reaches 1.0–3.0 ppb in most parts, while the smallest decrease is below 1.0 ppb in the northern part of NCP. Meanwhile, in terms of regional distribution, the regions of increasing sulfate and decreasing SO2 concentrations are correlated, but not identical. Sulfate production is mainly focused in SCB, with the increasing maximum up to 20.0–50.0 µg m−3, while production is 10.0–20.0 µg m−3 in most parts of NCP, YRD, and PRD and 5.0–10.0 µg m−3 in other regions. In Figs. 7b and 8b, the increasing rates for monthly mean sulfate concentrations are about 60 % to 70 % in NCP. The heaviest and longest duration pollution episode that had many clouds and high liquid water content (Fig. 5) on 19–21 December 2016 was very favorable for the occurrence of in-cloud oxidation processes. Sulfate formation rates by H2O2 oxidation under winter haze conditions range from 10 to 1000 µg m−3 s−1, which is close to the range of 10 to 100 µg m−3 s−1 obtained by Wang et al. (2022) in several pollution episodes in December 2016, indicating that the in-cloud oxidation in this study is relatively reasonable.
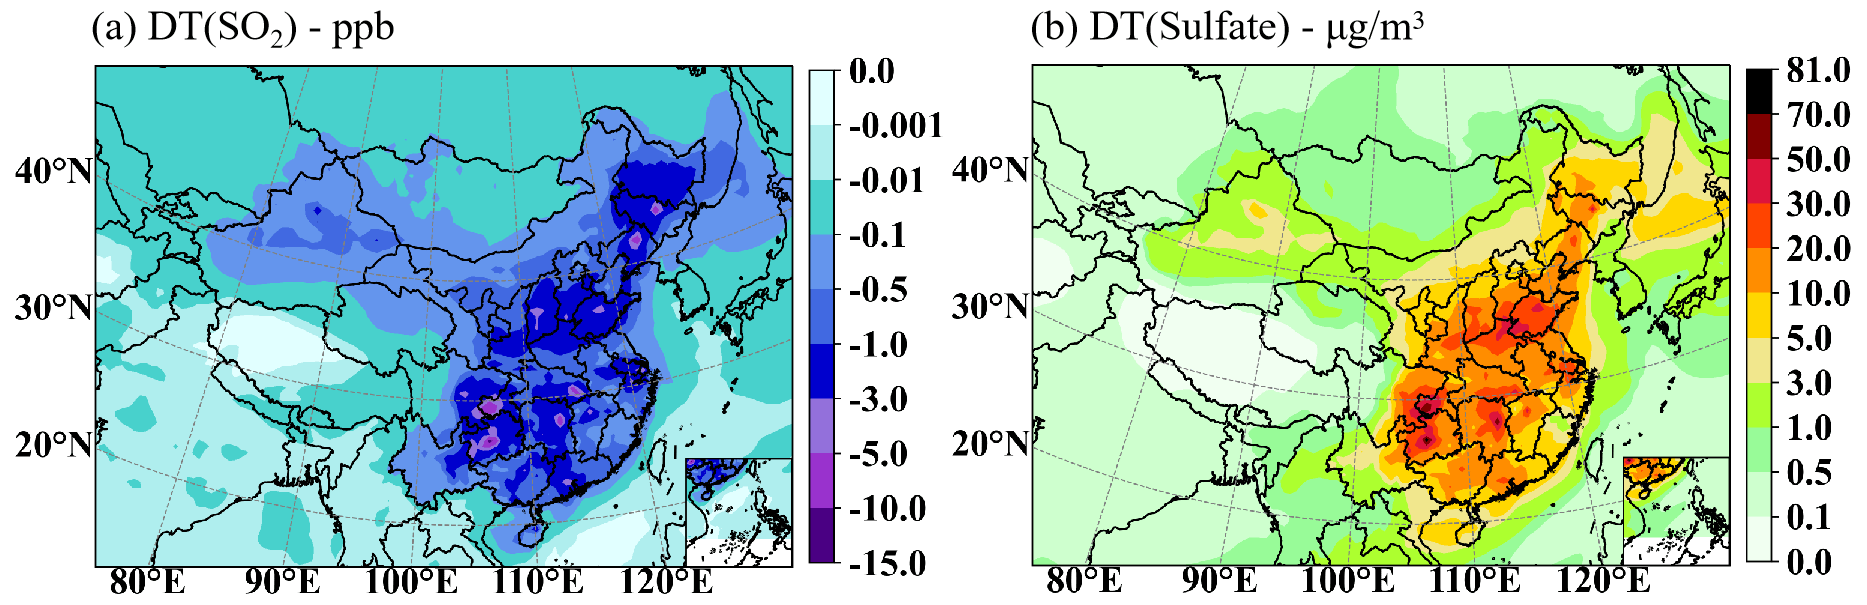
Figure 8The mean SO2 concentration decreased (a) and sulfate concentration increased (b) by cloud chemistry for HPE-2.
Exploring details of the HPE, four time periods, 14:00 and 21:00 on December 20, 17:00 on December 21 of the HPE-2, and 12:00 on December 22 of the HPE-3, are used to specifically analyze the contribution of cloud chemistry. It is found that the cloud chemistry influence is mainly on SCB and YRD at 14:00 and 21:00 LST on 20 December for HPE-2. The observed PM2.5 concentrations are very high, up to 350 µg m−3 at 14:00 and 236 µg m−3 at 21:00 on December 20 in Chengdu of SCB, and up to 76 µg m−3 at 14:00 and 77 µg m−3 at 21:00 on December 20 in Hangzhou of YRD, partially supporting the cloud production of sulfate at these specific times. Correspondingly, Fig. 9 shows that sulfate increases by cloud chemistry during these time periods are 10–20 µg m−3 and 20–30 µg m−3 14:00 and 21:00 on December 20 at Chengdu, and 20–60 µg m−3 and 30–60 µg m−3 at Hangzhou.
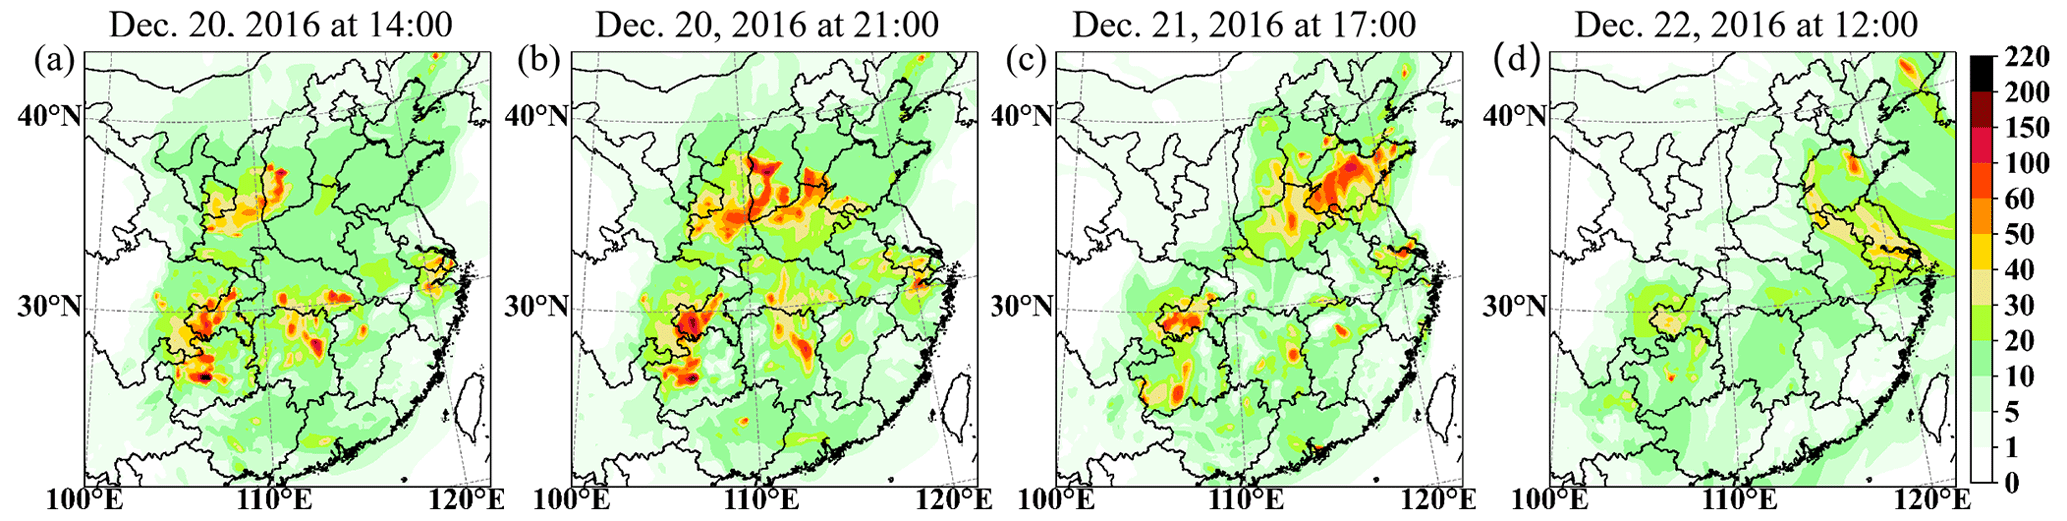
Figure 9The differences in surface sulfate concentrations between with and without cloud chemistry at 14:00 (a) and 21:00 (b) LST on 20 December, at 17:00 LST on 21 December (c), and at 12:00 LST on 22 December (d, units: µg m−3).
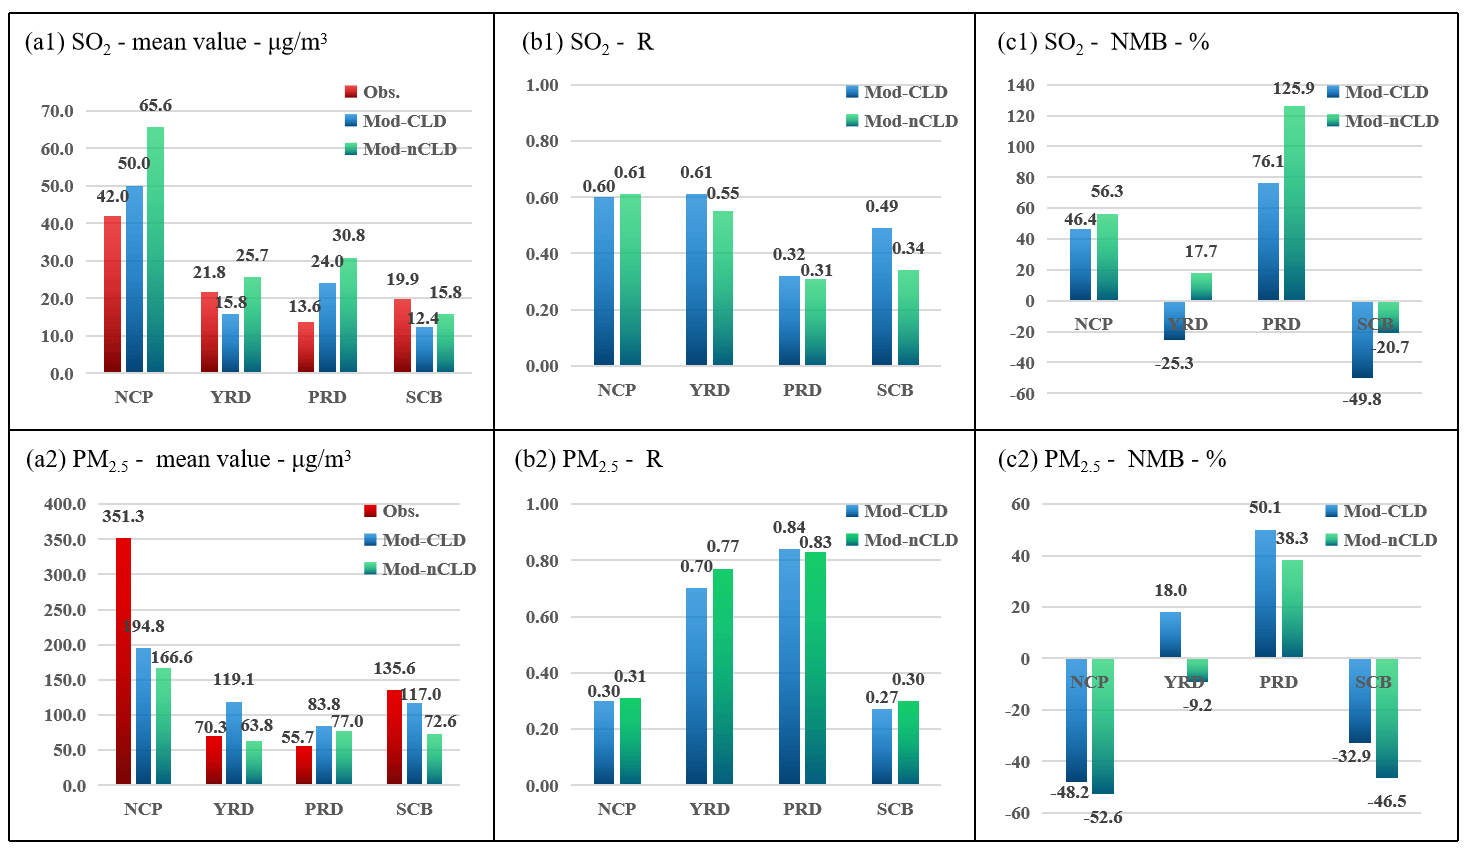
Figure 10Statistical metrics for hourly SO2 and PM2.5 for four regions for HPE-2 with (Mod-CLD) and without (Mod-nCLD) cloud chemistry. The mean value (a1, unit: µg m−3), R (b1), and NMB (c1, unit: %) of SO2, as well as the mean value (a2, unit: µg m−3), R (b2), and NMB (c2, unit: %) of PM2.5. Obs. denotes the observations.
Above all, the contribution of cloud chemistry to surface sulfate during the HPE is the highest in the SCB, followed by the NCP, YRD, and PRD, with most concentration increases ranging over 20.0–100.0 µg m−3, 10.0–60.0 µg m−3, 10.0–40.0 µg m−3, and 10.0–40.0 µg m−3, respectively, and less than 10.0 µg m−3 in Beijing, Tianjin, and the northwestern part of Hebei Province (Fig. 9). Of particular note is the NCP region, where the contribution of cloud chemistry is not significant on a monthly average but is very significant and exceeds that for the YRD region at certain moments during HPE. This also provides an explanation for the explosive increase in particulate matter concentrations during HPE in this region.
Further analysis of the simulation characteristics with and without cloud chemistry on all the regions during the HPE-2 stage (Fig. 10) and the DEC (Fig. 11) is carried out. Compared with nCLD, R of SO2 in CLD increases by 0.06, 0.15, and 0.01 in YRD, SCB, and NCP, respectively, and the overestimation in NCP and PRD has been corrected during HPE-2. R also increases by 0.10, 0.03, and 0.05 in YRD, SCB, and NCP for the DEC, respectively. It is obvious that the model simulates SO2 concentrations better at NCP during HPE-2 than for DEC with cloud chemistry.
For PM2.5, the statistical results of the simulated mean, R, and NMB in CLD and nCLD in the four polluted regions do not differ significantly between HPE-2 and DEC, but there is a significant improvement in the underestimate of sulfate in NCP and SCB. Under cloud chemistry, the deviation in the NCP is reduced from −45.7 % to −35.7 % for DEC and from −52.6 % to −48.2 % for HPE-2. The deviation in SCB is also improved from −44.2 % to −29.1 % for DEC and from −46.5 % to −32.9 % for HPE-2. A significant reduction in the model's PM2.5 concentration simulation bias after considering cloud chemistry and an improvement in the underestimation at NCP and SCB have been achieved.
Moreover, the statistical results of all stations (SUM in Fig. 12) show that after considering cloud chemical simulation (CLD), the NMB of SO2 is decreased from 39.3 % to 13.8 % and the NMB of PM2.5 from −40.8 % to −31.6 % during the HPE-2 after the addition of cloud chemistry simulation, reducing the simulation bias of both SO2 and PM2.5. This indicates that the addition of cloud chemistry to the model improves the model for SO2 and sulfate simulations. The improvement of sulfate simulation in the presence of clouds also contributes to the improvement of the simulation accuracy of PM2.5 mentioned above.
In summary, comparing the contribution of cloud chemistry in DEC with HPE-2, it is found that the cloud chemistry in heavy pollution weather for SO2 depletion and sulfate increase is mainly concentrated in central-east China and obviously in the four major pollution regions. However, SO2 consumption and sulfate increase are not consistent, which is influenced not only by the local SO2 concentration, but also by the cloud amount. Therefore, for SCB, which is less polluted and has many more clouds than NCP, the impact of cloud chemistry on sulfate and its precursor SO2 is always the most significant for both HPE and DEC.
3.3 Site evaluation of cloud chemistry
The statistical metrics of SO2 and PM2.5 hourly concentrations in 55 representative cities with and without cloud chemistry in the model were analyzed. The results indicate that most of the sites are improved with cloud chemistry in the SO2 concentration simulation and 42 of the 55 cities are with the increasing R. In the PM2.5 simulation, the correlations also are improved in some cities after the presence of cloud chemistry.
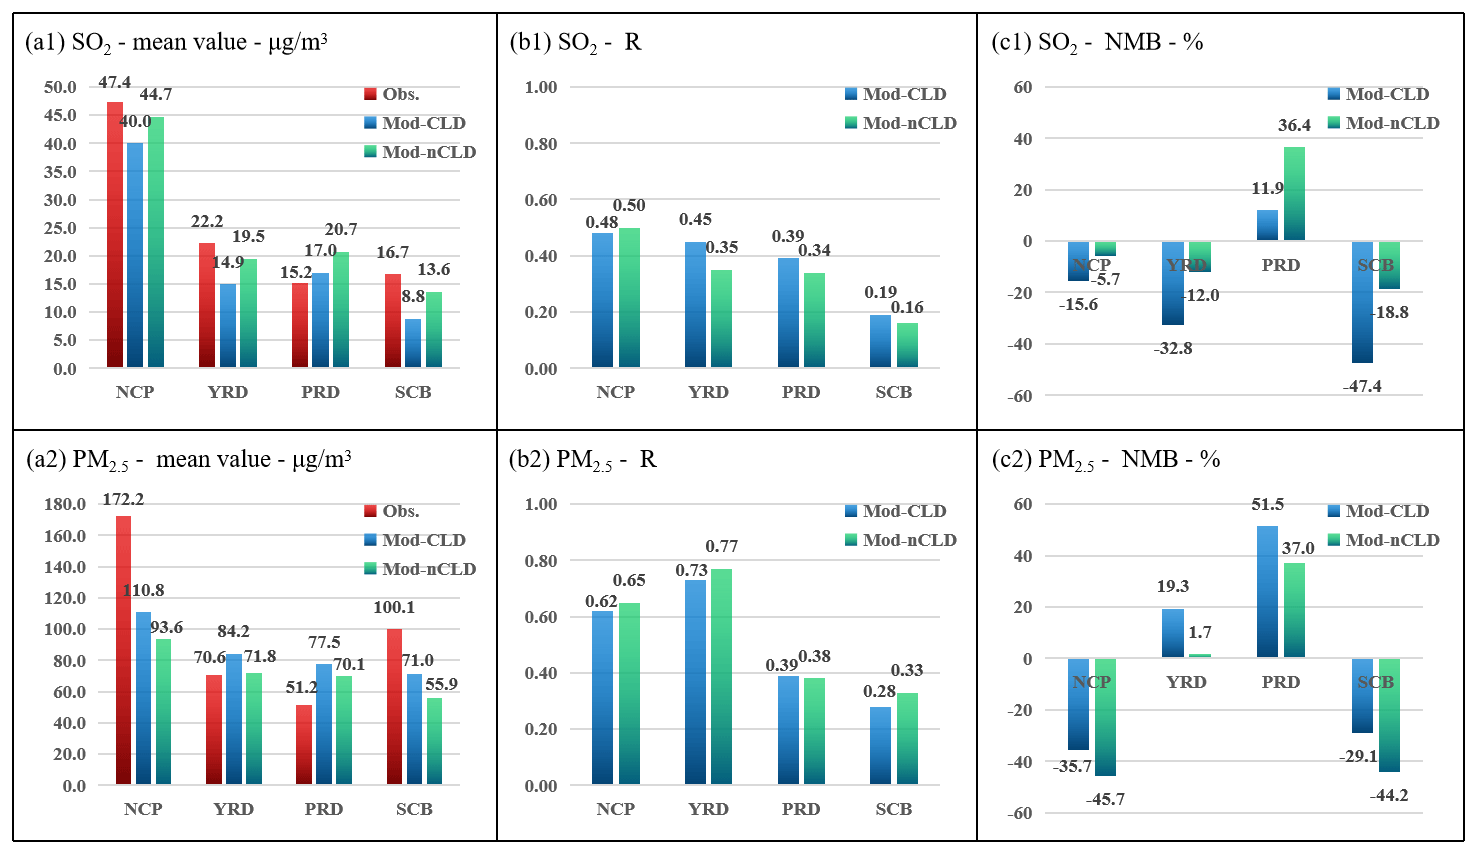
Figure 11Statistical metrics for hourly SO2 and PM2.5 for four regions for DEC with (Mod-CLD) and without (Mod-nCLD) cloud chemistry. The mean value (a1, unit: µg m−3), R (b1), and NMB (c1, unit: %) of SO2, as well as the mean value (a2, unit: µg m−3), R (b2), and NMB (c2, unit: %) of PM2.5. Obs. denotes the observations.
Representative sites of Beijing, Nanjing, Guangzhou, and Chengdu in NCP, YRD, PRD, and SCB are selected to quantify the impact of cloud chemistry during the HPE. The net depletion ratio of SO2 column concentration (RT(SO2)) during cloud chemistry is shown in Fig. 13. It is found that SO2 column concentration reduction maintained mostly a high value of over 60 %, even 80 % sometimes, in Chengdu during HPE-2. In Nanjing, the SO2 level was reduced by about 20 %–50 % from December 17 to 19 and by up to 80 % from December 20 to 21, when the episode matured there. The changes of SO2 in these two cities are consistent with the changes in cloud and liquid cloud water content distributions during the HPE-2 in Fig. 3. The SO2 reduction in Beijing and Guangzhou was consistently maintained at around 40 % during the period from December 17 to 21. The lower oxidative transformation was related to the lower liquid water content in Beijing, while in Guangzhou it was attributed to the combination of low pollution levels and low cloud water content. Figure 3 shows that Chengdu maintained abundant water vapor conditions from December 17 to 21, as did Nanjing from December 20 to 21. However, the ambient water vapor content was quite low in Guangzhou and Beijing throughout the process and the SO2 oxidation was much lower than that of Chengdu and Nanjing. In conclusion, the cloud chemistry process can lead to a SO2 column concentration consumption share of more than 60 % when cloud water content is abundant, which is also consistent with the observations of Mount Tai by Li (2020).
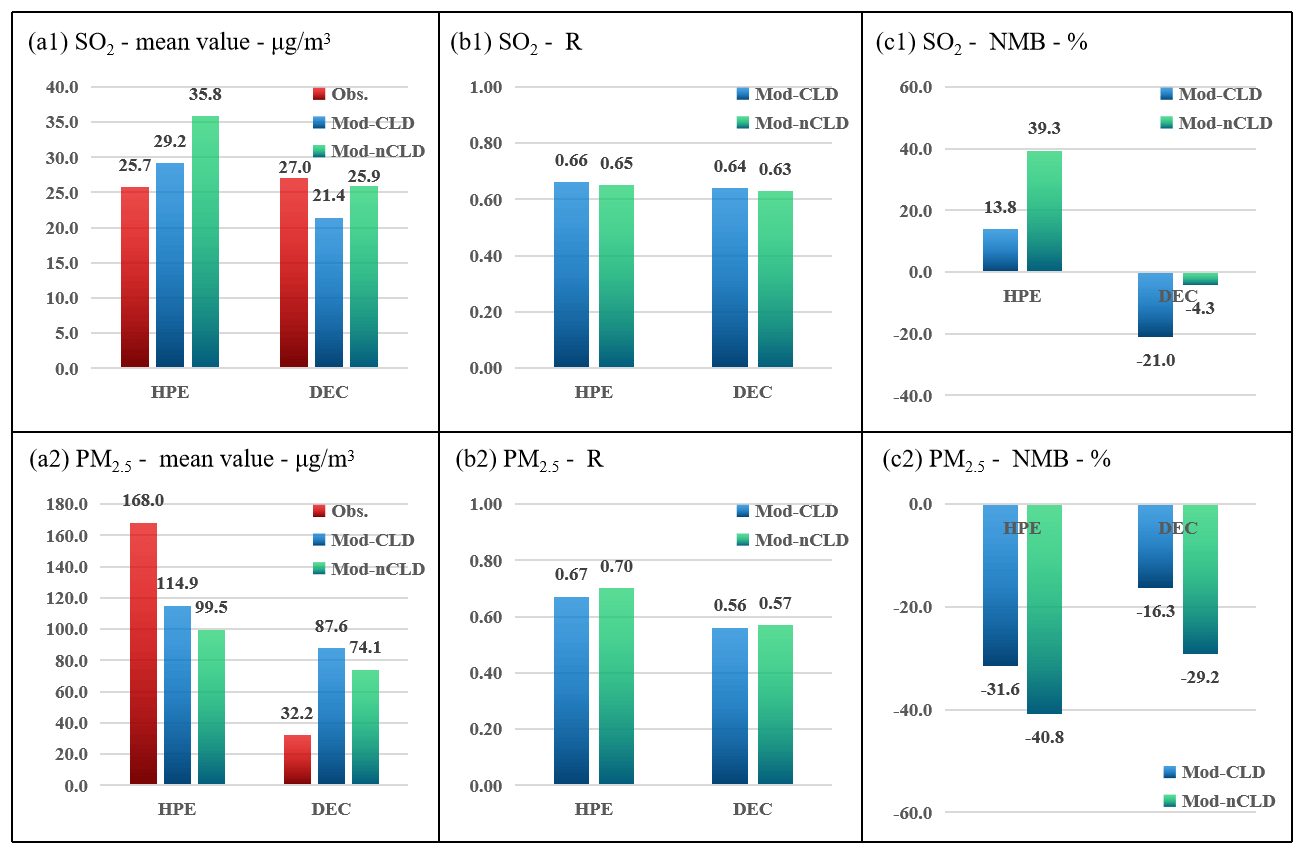
Figure 12Statistical metrics for hourly SO2 and PM2.5 in all selected sites for HPE-2 and DEC with (Mod-CLD) and without (Mod-nCLD) cloud chemistry. The mean value (a1, unit: µg m−3), R (b1), and NMB (c1, unit: %) of SO2, as well as the mean value (a2, unit: µg m−3), R (b2), and NMB (c2, unit: %) of PM2.5. Obs. denotes the observations.
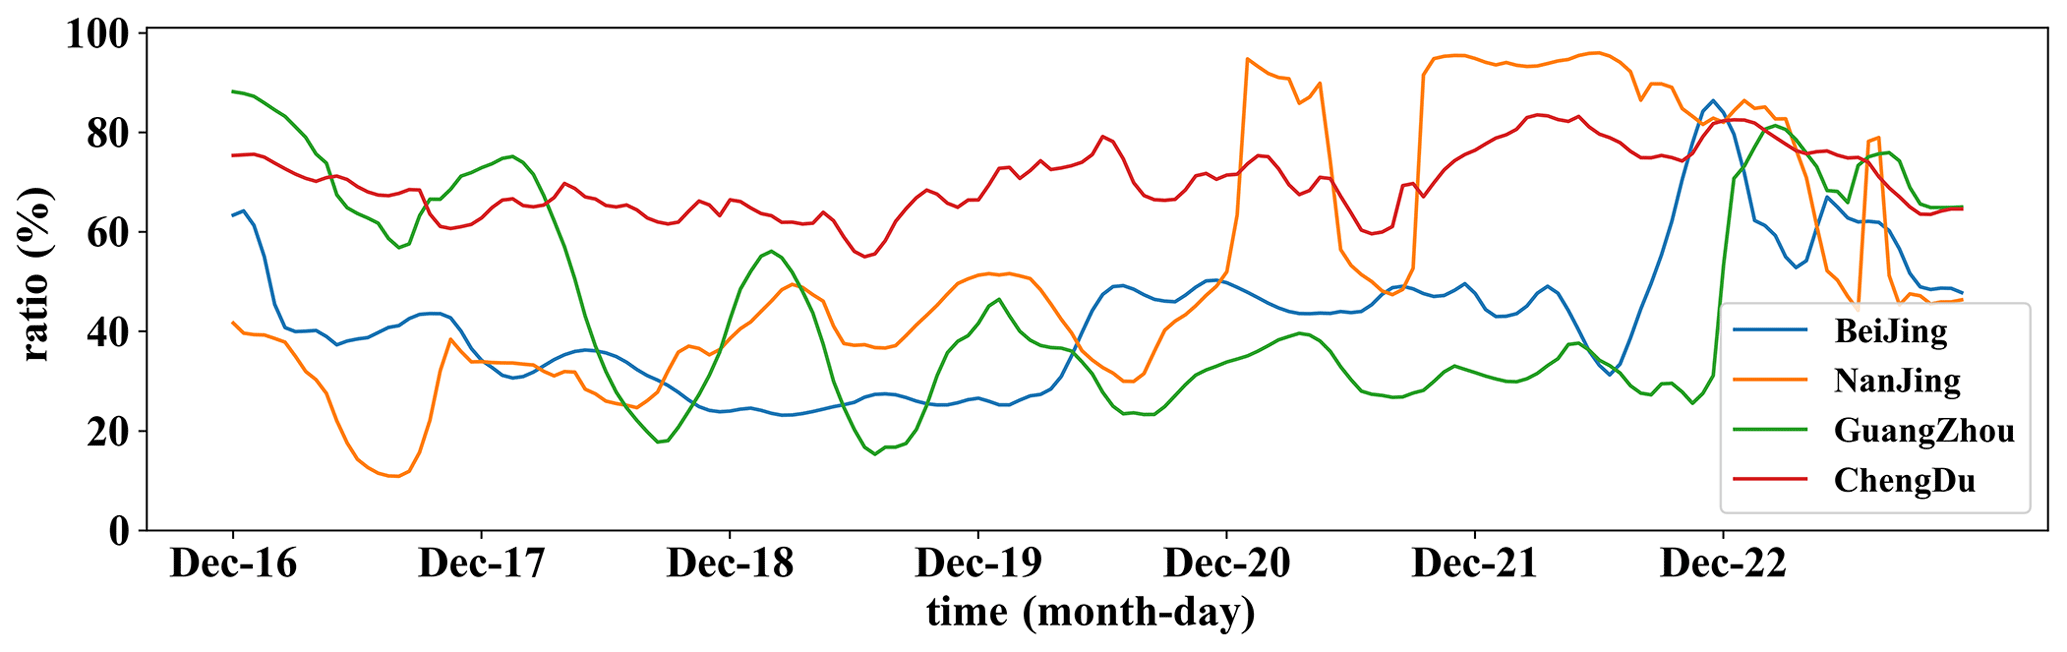
Figure 13The rates of SO2 column concentration reduced by cloud chemistry in Beijing (blue), Nanjing (yellow), Guangzhou (green), and Chengdu (red).
The impact of cloud chemistry (RT) on surface SO2 and sulfate in four sites is also shown in Fig. 13. The overall trend shows that the peak and valley timing of surface SO2 consumption and sulfate increase are coincident. The cloud chemical processes of the surface SO2 oxidation vary greatly between cities in different regions (Fig. 14a). In HPE-2, the percentage of surface SO2 consumption reached more than 90 % in Chengdu and Nanjing, while it was below 30 % in Beijing and Guangzhou, and did not reach 40 % until December 22. Although the percentage of surface SO2 consumption varies greatly, the increase in the percentage of sulfate does not vary much between cities. In HPE-2, the increase in surface sulfate in the four cities ranged from 60 %–95 % (Fig. 14b), which is consistent with the sulfate increase rates summarized by Turnock et al. (2019).
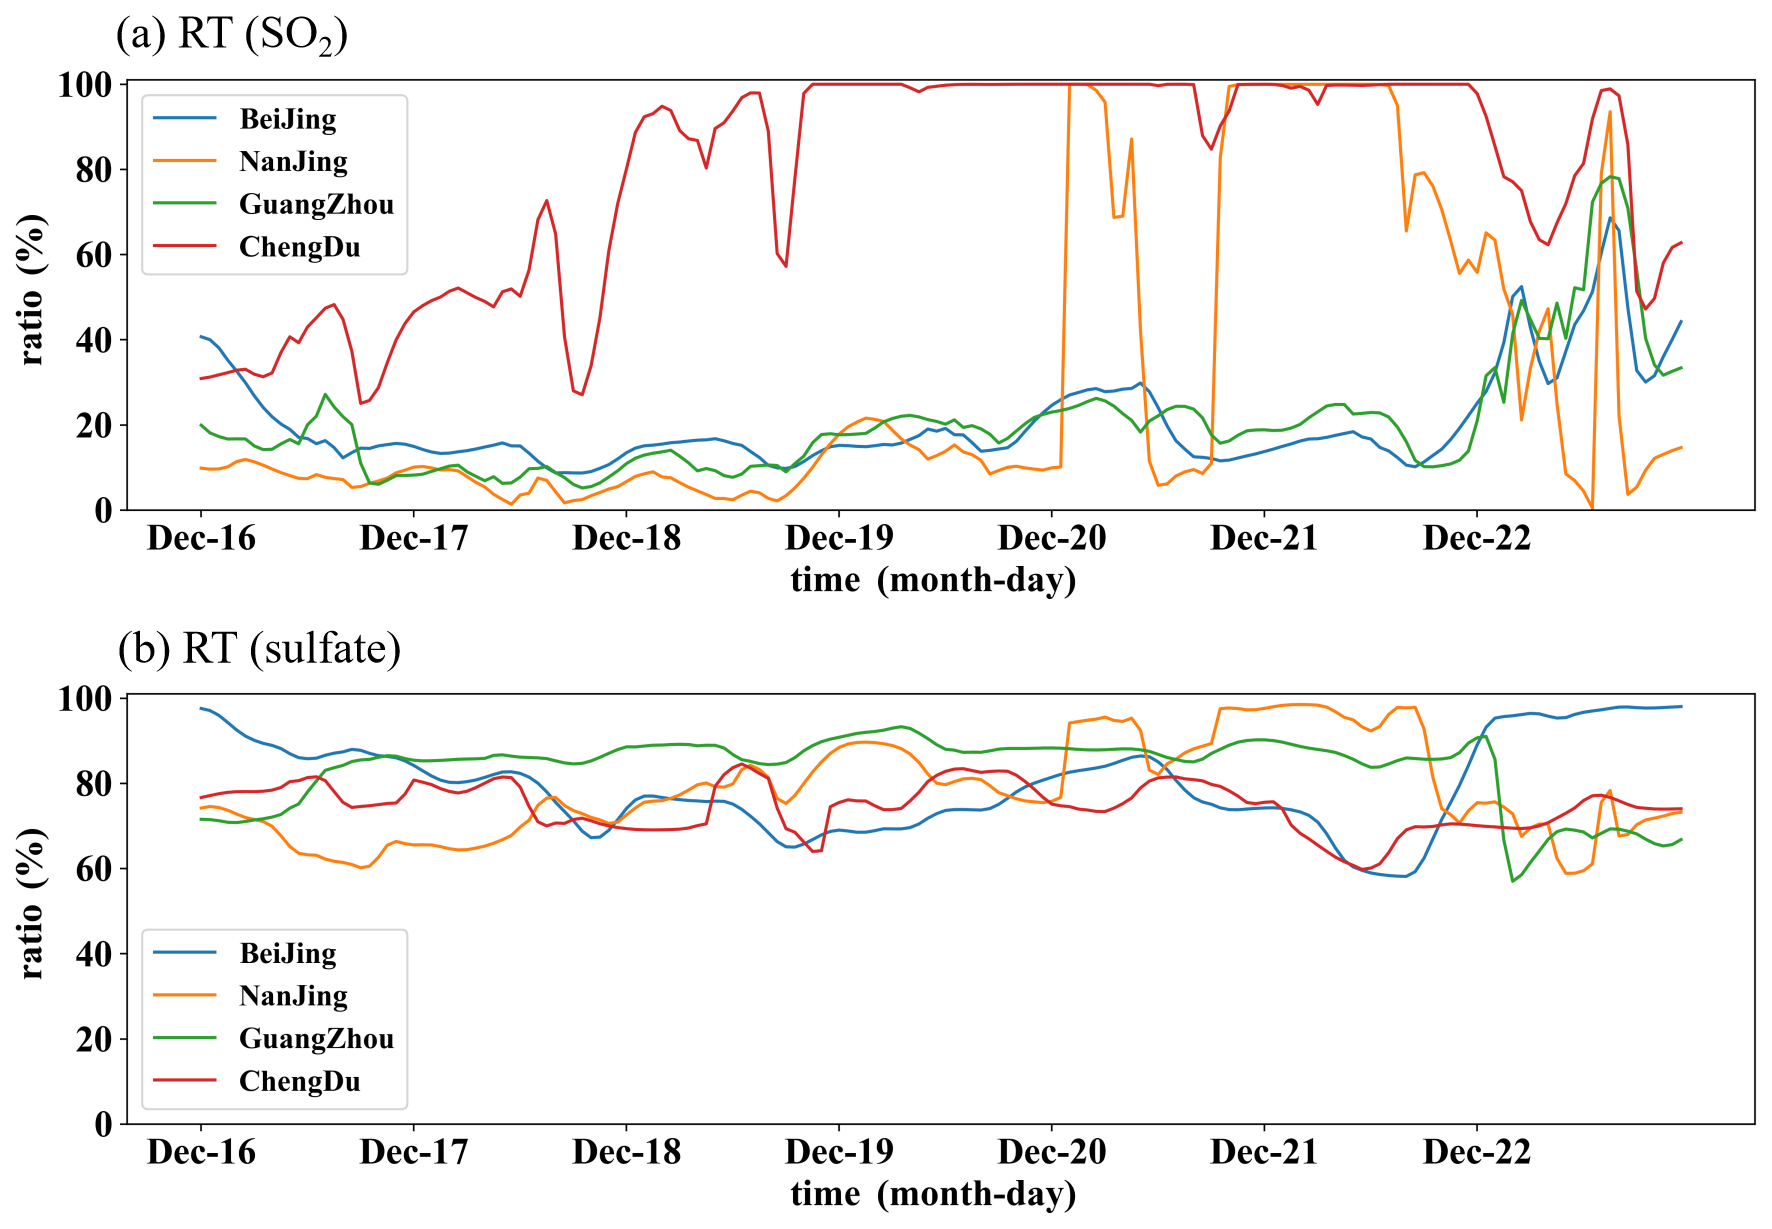
Figure 14The rates of surface SO2 reduced (a) and the surface sulfate increased (b), influenced by cloud chemistry in Beijing (blue), Nanjing (yellow), Guangzhou (green), and Chengdu (red).
Figure 15 shows the variation of vertical profiles of sulfate increase by the cloud chemistry at the four times of 12:00 LST on 20 December for HPE-2, 04:00 LST on 21 December for HPE-2, and 04:00 and 12:00 LST on 22 December for HPE-3 in Beijing, Nanjing, Chengdu, and Guangzhou. This shows that the sulfate produced by the cloud chemistry during this pollution process is concentrated mostly below 5 km in the troposphere and especially under 2 km. Again, less sulfate has been produced in Beijing in the vertical than that by others by cloud chemistry.
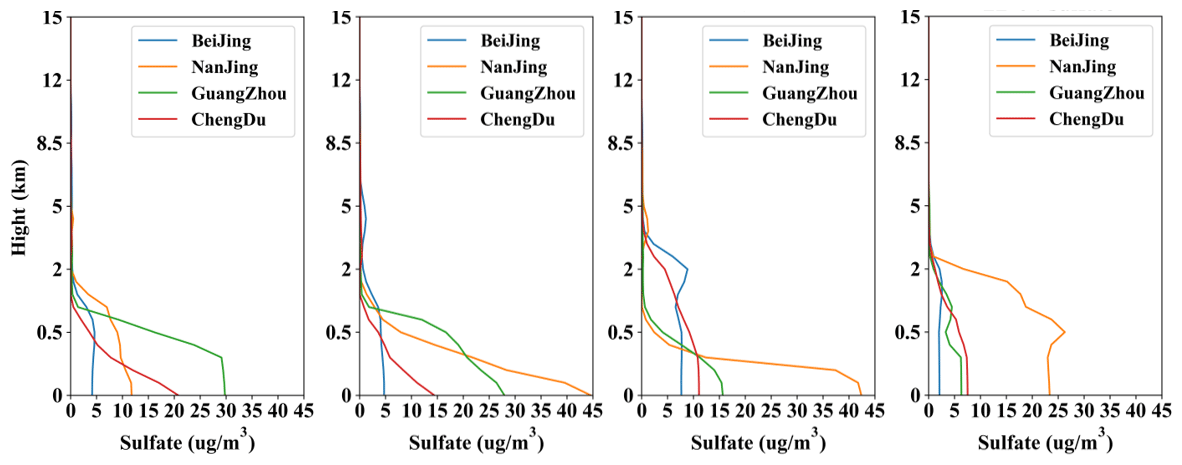
Figure 15Vertical profiles of sulfate concentration difference (DT) at 12:00 on 20 December, at 21:00 on 20 December, at 17:00 on 21 December, and at 12:00 on 22 December in Beijing (blue), Nanjing (yellow), Guangzhou (green), and Chengdu (red).
The cloud chemistry mechanism in WRF/CUACE has been assessed by using the in situ cloud chemistry observations of SO2, O3, and H2O2 from Mount Tai in June–July of 2015 and 2018. The results show that the mechanism has well captured the cloud processes for the oxidation of SO2, reducing SO2 by more than 80 % during the cloudy phase, which is in good agreement with the observations.
The cloud chemistry contributions to the changes of SO2 and sulfate concentrations in NCP, YRD, PRD, and SCB regions are assessed by WRF/CUACE. During heavy pollution (HPE-2), the four regions are significantly affected by cloud chemistry, with SCB being the most obvious. The surface SO2 reduction in SCB is 1.0–3.0 ppb and reaches 3.0–10.0 ppb in the high value areas, and surface sulfate concentration increased by 10.0–30.0 µg m−3 on average, with a maximum of more than 20.0–70.0 µg m−3. Most areas in NCP, YRD, and PRD have an average SO2 reduction of 0.5–3.0 ppb and sulfate increase of 5.0–30.0 µg m−3. Although the monthly average impact of cloud chemistry is much weaker in the NCP due to less water vapor in December, the contribution in the southern part of NCP during the heavy pollution episode is still significant and cannot be ignored. In PRD, the contribution of cloud chemistry is weaker than other regions due to lighter pollution, although there are many clouds with abundant liquid water there. In addition, the cloud chemistry increases surface sulfate concentrations by 60 %–95 % and reduces surface SO2 concentrations by more than 80 % in Beijing, Nanjing, Chengdu, and Guangzhou during HPE-2. Above all, the average contribution of cloud chemistry during HPE-2 is significantly greater than that for DEC. Vertically, the cloud chemistry influence is mainly in the middle and lower troposphere below 2 km for four representative cities in HPE-2. Generally, the cloud chemistry can improve the model performance by reducing the overestimates of SO2 and underestimates of sulfate.
In the future, more mechanisms should be added to improve the cloud chemistry mechanism in CUACE and to increase accuracy in simulating SO2, sulfate, and other aerosol components such as nitrate, ammonium, carbonate, and organic aerosols.
All source codes and data can be accessed by contacting the corresponding author Sunling Gong (gongsl@cma.gov.cn).
CZ and SG put forward the ideas and formulated the overarching research goals. JL carried them out and wrote the article with suggestions from all authors. LZ and JZ participated in the scientific interpretation and discussion. JC assisted with data acquisition and processing. All authors contributed to the discussion and improvement of the article.
The contact author has declared that none of the authors has any competing interests.
Publisher’s note: Copernicus Publications remains neutral with regard to jurisdictional claims in published maps and institutional affiliations.
This paper was edited by Qi Chen and reviewed by two anonymous referees.
This research has been supported by the National Key Project of the Ministry of Science and Technology of China (grant no. 2022YFC3701205) and the CMA Innovation Development Project (grant no. CXFZ2021J023).
Alexander, B., Park, R. J., Jacob, D. J., and Gong, S.: Transition metal-catalyzed oxidation of atmospheric sulfur: Global implications for the sulfur budget, J. Geophys. Res., 114, D02309, https://doi.org/10.1029/2008jd010486, 2009.
Binkowski, F. S. and Roselle, S. J.: Models-3 Community Multiscale Air Quality (CMAQ) model aerosol component 1. Model description, J. Geophys. Res.-Atmos., 108, 4183, https://doi.org/10.1029/2001jd001409, 2003.
Buchard, V., da Silva, A. M., Colarco, P., Krotkov, N., Dickerson, R. R., Stehr, J. W., Mount, G., Spinei, E., Arkinson, H. L., and He, H.: Evaluation of GEOS-5 sulfur dioxide simulations during the Frostburg, MD 2010 field campaign, Atmos. Chem. Phys., 14, 1929–1941, https://doi.org/10.5194/acp-14-1929-2014, 2014.
Caffrey, P., Hoppel, W., Frick, G., Pasternack, L., Fitzgerald, J., Hegg, D., Gao, S., Leaitch, R., Shantz, N., Albrechcinski, T., and Ambrusko, J.: In-cloud oxidation of SO2 by O3 and H2O2: Cloud chamber measurements and modeling of particle growth, J. Geophys. Res.-Atmos., 106, 27587–27601, https://doi.org/10.1029/2000jd900844, 2001.
Cao, J., Qiu, X., Gao, J., Wang, F., Wang, J., Wu, J., and Peng, L.: Significant decrease in SO2 emission and enhanced atmospheric oxidation trigger changes in sulfate formation pathways in China during 2008–2016, J. Clean. Product., 326, 129396, https://doi.org/10.1016/j.clepro.2021.129396, 2021.
Chang, J. S., Brost, R. A., Isaksen, I. S. A., Madronich, S., Middleton, P., Stockwell, W. R., and Walcek, C. J.: A three-dimensional eulerian acid deposition model physical concepts and formulation, J. Geophys. Res., 92, 14681–14700, https://doi.org/10.1029/jd092id12p14681, 1987.
Chapman, E. G., Gustafson Jr., W. I., Easter, R. C., Barnard, J. C., Ghan, S. J., Pekour, M. S., and Fast, J. D.: Coupling aerosol-cloud-radiative processes in the WRF-Chem model: Investigating the radiative impact of elevated point sources, Atmos. Chem. Phys., 9, 945–964, https://doi.org/10.5194/acp-9-945-2009, 2009.
Charlson, R. J., Schwartz, S. E., Hales, J. M., Cess, R. D., Coakley, J. D., Hansen, J. E., and Hofmann, D. J.: Climate forcing by anthropogenic aerosols, Science, 255, 423–423, https://doi.org/10.1126/science.255.5043.423, 1992.
Chen, F., and Dudhia, J.: Coupling an advanced land surface-hydrology model with the Penn State-NCAR MM5 modeling system. Part I: Model implementation and sensitivity, Mon. Weather Rev., 129, 569–585, https://doi.org/10.1175/1520-0493(2001)129<0587:caalsh>2.0.co;2, 2001.
Cheng, Y., Zheng, G., Wei, C., Mu, Q., Zheng, B., Wang, Z., Gao, M., Zhang, Q., He, K., and Carmichael, G.: Reactive nitrogen chemistry in aerosol water as asource of sulfate during haze events in China, Sci. Adv., 2, e1601530, https://doi.org/10.1126/sciadv.1601530, 2016.
Chou, M. D., and Suarez, M. J.: An efficient thermal infrared radiation parameterization for use in general circulation models, NASA Tech. Memorandum 104606 – Vol. 3, NASA, Goddard Space Flight Center, Greenbelt, MD, 1994.
Dovrou, E., Rivera-Rios, J. C., Bates, K. H., and Keutsch, F. N.: Sulfate Formation via Cloud Processing from Isoprene Hydroxyl Hydroperoxides (ISOPOOH), Environ. Sci. Technol., 53, 12476–12484, https://doi.org/10.1021/acs.est.9b04645, 2019.
Emery, C., Tai, E., and Yarwood, G.: Enhanced meteorological modeling and performance evaluation for two Texas ozone episodes, Corpus ID 127579774, Biology, 2001.
Faloona, I., Conley, S. A., Blomquist, B., Clarke, A. D., Kapustin, V., Howell, S., Lenschow, D. H., and Bandy, A. R.: Sulfur dioxide in the tropical marine boundary layer: dry deposition and heterogeneous oxidation observed during the Pacific Atmospheric Sulfur Experiment, J. Atmos. Chem., 63, 13–32, https://doi.org/10.1007/s10874-010-9155-0, 2010.
Fan, D., Ye. Y., and Wang, W.: Air Pollution Control and Public Health: Evidence from “Air Pollution Prevention and Control Action Plan” in China, Stat. Res., 38, 60–74, https://doi.org/10.19343/j.cnki.11-1302/c.2021.09.005, 2010.
Gao, M., Carmichael, G. R., Wang, Y., Ji, D., Liu, Z., and Wang, Z.: Improving simulations of sulfate aerosols during winter haze over Northern China: the impacts of heterogeneous oxidation by NO2, Front. Environ. Sci. Eng., 10, 11, https://doi.org/10.1007/s11783-016-0878-2, 2016.
Ge, W., Liu, J., Yi, K., Xu, J., Zhang, Y., Hu, X., Ma, J., Wang, X., Wan, Y., Hu, J., Zhang, Z., Wang, X., and Tao, S.: Influence of atmospheric in-cloud aqueous-phase chemistry on the global simulation of SO2 in CESM2, Atmos. Chem. Phys., 21, 16093–16120, https://doi.org/10.5194/acp-21-16093-2021, 2021.
Ge, W., Liu, J., Xiang, S., Zhou, Y., Zhou, J., Hu, X., Ma, J., Wang, X., Wan, Y., Hu, J., Zhang, Z., Wang, X., and Tao, S.: Improvement and uncertainties of global simulation of sulfate concentration and radiative forcing in CESM2, J. Geophys. Res.-Atmos., 127, e2022JD037623, https://doi.org/10.1029/2022JD037623, 2022.
Gen, M., Zhang, R., Huang, D. D., Li, Y., and Chan, C. K.: Heterogeneous Oxidation of SO(2) in Sulfate Production during Nitrate Photolysis at 300 nm: Effect of pH, Relative Humidity, Irradiation Intensity, and the Presence of Organic Compounds, Environ. Sci. Technol., 53, 8757–8766, https://doi.org/10.1021/acs.est.9b01623, 2019a.
Gen, M., Zhang, R., Huang, D. D., Li, Y., and Chan, C. K.: Heterogeneous SO2 Oxidation in Sulfate Formation by Photolysis of Particulate Nitrate, Environ. Sci. Technol. Lett., 6, 86–91, https://doi.org/10.1021/acs.estlett.8b00681, 2019b.
Georgiou, G. K., Christoudias, T., Proestos, Y., Kushta, J., Hadjinicolaou, P., and Lelieveld, J.: Air quality modelling in the summer over the eastern Mediterranean using WRF-Chem: chemistry and aerosol mechanism intercomparison, Atmos. Chem. Phys., 18, 1555–1571, https://doi.org/10.5194/acp-18-1555-2018, 2018.
Gong, S. L. and Zhang, X. Y.: CUACE/Dust – an integrated system of observation and modeling systems for operational dust forecasting in Asia, Atmos. Chem. Phys., 8, 2333–2340, https://doi.org/10.5194/acp-8-2333-2008, 2008.
Gong, S. L., Barrie, L. A., Blanchet, J. P., von Salzen, K., Lohmann, U., Lesins, G., Spacek, L., Zhang, L. M., Girard, E., Lin, H., Leaitch, R., Leighton, H., Chylek, P., and Huang, P.: Canadian Aerosol Module: A size-segregated simulation of atmospheric aerosol processes for climate and air quality models 1. Module development, J. Geophys. Res., 108, 4007, https://doi.org/10.1029/2001jd002002, 2003.
Grell, G. A.: Prognostic evaluation of assumptions used by cumulus parameterizations, Mon. Weather Rev., 121, 764–787, https://doi.org/10.1175/1520-0493(1993)121<0764:peoaub>2.0.co;2, 1993.
Guo, J., Wang, Y., Shen, X., Wang, Z., Lee, T., Wang, X., Li, P., Sun, M., Jeffrey, L., Collett, J., Wang, W., and Wang, T.: Characterization of cloud water chemistry at Mount Tai, China: Seasonal variation, anthropogenic impact, and cloud processing, Atmos. Environ., 60, 467–476, 10.1016/j.atmosenv.2012.07.016, 2012.
Guo, S., Hu, M., Zamora, M. L., Peng, J., Shang, D., Zheng, J., Du, Z., Wu, Z., Shao, M., Zeng, L., Molina, M. J., and Zhang, R.: Elucidating severe urban haze formation in China, P. Natl. Acad. Sci. USA, 111, 17373–17378, https://doi.org/10.1073/pnas.1419604111, 2014.
Harris, E., Sinha, B., van Pinxteren, D., Tilgner, A., Fomba, K. W., Schneider, J., Roth, A., Gnauk, T., Fahlbusch, B., Mertes, S., Lee, T., Collett, J., Foley, S., Borrmann, S., Hoppe, P., and Herrmann, H.: Enhanced role of transition metal ion catalysis during in-cloud oxidation of SO2, Science, 340, 727–730, https://doi.org/10.1126/science.1230911, 2013.
He, J. and Zhang, Y.: Improvement and further development in CESM/CAM5: gas-phase chemistry and inorganic aerosol treatments, Atmos. Chem. Phys., 14, 9171–9200, https://doi.org/10.5194/acp-14-9171-2014, 2014.
He, J., Zhang, Y., Glotfelty, T., He, R., Bennartz, R., Rausch, J., and Sartelet, K.: Decadal simulation and comprehensive evaluation of CESM/CAM5.1 with advanced chemistry, aerosol microphysics, and aerosol-cloud interactions, J. Adv. Model. Earth Syst., 7, 110–141, https://doi.org/10.1002/2014ms000360, 2015.
Hong, C., Zhang, Q., Zhang, Y., Tang, Y., Tong, D., and He, K.: Multi-year downscaling application of two-way coupled WRF v3.4 and CMAQ v5.0.2 over east Asia for regional climate and air quality modeling: model evaluation and aerosol direct effects, Geosci. Model Dev., 10, 2447–2470, https://doi.org/10.5194/gmd-10-2447-2017, 2017a.
Hong, C., Zhang, Q., He, K., Guan, D., Li, M., Liu, F., and Zheng, B.: Variations of China's emission estimates: response to uncertainties in energy statistics, Atmos. Chem. Phys., 17, 1227–1239, https://doi.org/10.5194/acp-17-1227-2017, 2017b.
Huang, L., An, J., Koo, B., Yarwood, G., Yan, R., Wang, Y., Huang, C., and Li, L.: Sulfate formation during heavy winter haze events and the potential contribution from heterogeneous SO2 + NO2 reactions in the Yangtze River Delta region, China, Atmos. Chem. Phys., 19, 14311–14328, https://doi.org/10.5194/acp-19-14311-2019, 2019.
Hung, H. M., Hsu, M. N., and Hoffmann, M. R.: Quantification of SO2 Oxidation on Interfacial Surfaces of Acidic Micro-Droplets: Implication for Ambient Sulfate Formation, Environ. Sci. Technol., 52, 9079–9086, https://doi.org/10.1021/acs.est.8b01391, 2018.
IIbusuki, T. and Takeuchi, K.: Sulfur dioxide oxidation by oxygen catalyzed by mixtures of manganese(II) and iron(III) in aqueous solutions at environmental reaction conditions, Atmos. Environ., 21, 1555–1560, https://doi.org/10.1016/0004-6981(87)90317-9, 1987.
Ivanova, I. T. and Leighton, H. G.: Aerosol–Cloud Interactions in a Mesoscale Model. Part II: Sensitivity to Aqueous-Phase Chemistry, J. Atmos. Sci., 65, 309–330, https://doi.org/10.1175/2007jas2276.1, 2008.
Janjić, Z. I.: The Step-Mountain Eta Coordinate Model: Further Developments of the Convection, Viscous Sublayer, and Turbulence Closure, Schemes, Mon. Weather Rev., 122, 927–945, https://doi.org/10.1175/1520-0493(1994)122<0927:tsmecm>2.0.co;2, 1994.
Ke, H., Gong, S., He, J., Zhou, C., Zhang, L., and Zhou, Y.: Assessment of Open Biomass Burning Impacts on Surface PM2.5 Concentration, Chi. Acad. Meteorol. Sci., 31, 105–116, https://doi.org/10.11898/1001-7313.20200110, 2020.
Kong, L., Feng, M., Liu, Y., Zhang, Y., Zhang, C., Li, C., Qu, Y., An, J., Liu, X., Tan, Q., Cheng, N., Deng, Y., Zhai, R., and Wang, Z.: Elucidating the pollution characteristics of nitrate, sulfate and ammonium in PM2.5 in Chengdu, southwest China, based on 3-year measurements, Atmos. Chem. Phys., 20, 11181–11199, https://doi.org/10.5194/acp-20-11181-2020, 2020.
Kotarba, A. Z.: Calibration of global MODIS cloud amount using CALIOP cloud profiles, Atmos. Meas. Tech., 13, 4995–5012, https://doi.org/10.5194/amt-13-4995-2020, 2020.
Leighton, H. G. and Ivanova, I. T.: Aerosol–Cloud Interactions in a Mesoscale Model. Part I: Sensitivity to Activation and Collision–Coalescence, J. Atmos. Sci., 65, 289–308, https://doi.org/10.1175/2007jas2207.1, 2008.
Lelieveld, J. and Heintzenberg, J.: Sulfate cooling effect on climate through in-cloud oxidation of anthropogenic SO2, Science, 258, 117–120, https://doi.org/10.1126/science.258.5079.117, 1992.
Li, J.: Microphysical Characteristics and S(IV) Multiphase Chemical Reaction Mechanism of Orographic Clouds, Ph.D. thesis, Department of Environmental Science & Engineering, Fudan University, 113 pp., 2020.
Li, J., Wang, X., Chen, J., Zhu, C., Li, W., Li, C., Liu, L., Xu, C., Wen, L., Xue, L., Wang, W., Ding, A., and Herrmann, H.: Chemical composition and droplet size distribution of cloud at the summit of Mount Tai, China, Atmos. Chem. Phys., 17, 9885–9896, https://doi.org/10.5194/acp-17-9885-2017, 2017.
Li, J., Zhu, C., Chen, H., Fu, H., Xiao, H., Wang, X., Herrmann, H., and Chen, J.: A More Important Role for the Ozone-S(IV) Oxidation Pathway Due to Decreasing Acidity in Clouds, J. Geophys. Res.-Atmos., 125, e2020JD033220, https://doi.org/10.1029/2020jd033220, 2020a.
Li, J., Zhu, C., Chen, H., Zhao, D., Xue, L., Wang, X., Li, H., Liu, P., Liu, J., Zhang, C., Mu, Y., Zhang, W., Zhang, L., Herrmann, H., Li, K., Liu, M., and Chen, J.: The evolution of cloud and aerosol microphysics at the summit of Mt. Tai, China, Atmos. Chem. Phys., 20, 13735–13751, https://doi.org/10.5194/acp-20-13735-2020, 2020b.
Li, M., Liu, H., Geng, G., Hong, C., Liu, F., Song, Y., Tong, D., Zheng, B., Cui, H., Man, H., Zhang, Q., and He, K.: Anthropogenic emission inventories in China: a review, Nat. Sci. Rev., 4, 834–866, https://doi.org/10.1093/nsr/nwx150, 2017.
Li, P.: Fog Water Chemistry and Fog-Haze Transformation in Shanghai, Ph.D. thesis, Department of Environmental Science & Engineering, Fudan University, 133 pp., 2011.
Lin, Y. L., Farley, R. D., and Orville, H. D.: Bulk Parameterization of the Snow Field in a Cloud Model, J. Appl. Meteorol., 22, 1065–1092, https://doi.org/10.1175/1520-0450(1983)022<1065:bpotsf>2.0.co;2, 1983.
Liu, S. C., McKeen, S. A., Hsie, E. Y., Lin, X., Kelly, K. K., Bradshaw, J. D., Sandholm, S. T., Browell, E. V., Gregory, G. L., Sachse, G. W., Bandy, A. R., Thornton, D. C., Blake, D. R., Rowland, F. S., Newell, R., Heikes, B. G., Singh, H., and Talbot, R. W.: Model study of tropospheric trace species distributions during PEM-WEST A, J. Geophys. Res., 101, 2073–2085, https://doi.org/10.1029/95JD02277, 1996.
Liu, T., Chan, A. W. H., and Abbatt, J. P. D.: Multiphase Oxidation of Sulfur Dioxide in Aerosol Particles: Implications for Sulfate Formation in Polluted Environments, Environ. Sci. Technol., 55, 4227–4242, https://doi.org/10.1021/acs.est.0c06496, 2021.
Lu, X., Zhang, S., Xing, J., Wang, Y., Chen, W., Ding, D., Wu, Y., Wang, S., Duan, L., and Hao, J.: Progress of Air Pollution Control in China and Its Challenges and Opportunities in the Ecological Civilization Era, Engineering, 6, 1423–1431, https://doi.org/10.1016/j.eng.2020.03.014, 2020.
Maahs, H. G.: Kinetics and Mechanism of the Oxidation of S(IV) by Ozone in Aqueous Solution With Particular Reference to SO2 Conversion in Nonurban Tropospheric Clouds, J. Geophys. Res.-Oceans, 88, 10721–10732, https://doi.org/10.1029/JC088iC15p10721, 1983.
Martin, G. M., Johnson D. W., and Spice A., The measurement and parameterization of effective radius in warm stratocumulus cloud, J. Atmos. Sci., 51, 1823–1842, https://doi.org/10.1175/1520-0469(1994)051<1823:TMAPOE>2.0.CO;2, 1994.
Martin, L. R. and Good, T. W.: Catalyzed oxidation of sulfur dioxide in solution: The iron-manganese synergism, Atmos. Environ., 25, 2395–2399, https://doi.org/10.1016/0960-1686(91)90113-L, 1991.
Menut, L., Bessagnet, B., Khvorostyanov, D., Beekmann, M., Blond, N., Colette, A., Coll, I., Curci, G., Foret, G., Hodzic, A., Mailler, S., Meleux, F., Monge, J.-L., Pison, I., Siour, G., Turquety, S., Valari, M., Vautard, R., and Vivanco, M. G.: CHIMERE 2013: a model for regional atmospheric composition modelling, Geosci. Model Dev., 6, 981–1028, https://doi.org/10.5194/gmd-6-981-2013, 2013.
Mlawer, E. J., Taubman, S. J., Brown, P. D., Iacono, M. J., and Clough, S. A.: Radiative transfer for inhomogeneous atmospheres: RRTM, a validated correlated-k model for the longwave, J. Geophys. Res. -Atmos., 102, 16663–16682, https://doi.org/10.1029/97jd00237, 1997.
Moch, J. M., Dovrou, E., Mickley, L. J., Keutsch, F. N., Cheng, Y., Jacob, D. J., Jiang, J., Li, M., Munger, J. W., Qiao, X., and Zhang, Q.: Contribution of Hydroxymethane Sulfonate to Ambient Particulate Matter: A Potential Explanation for High Particulate Sulfur During Severe Winter Haze in Beijing, Geophys. Res. Lett., 45, 11969–11979, https://doi.org/10.1029/2018gl079309, 2018.
Molina: Air Quality in the Mexico Megacity: An Integrated Assessment, All. Glo. Sus., 2, 141–145, https://doi.org/10.1007/978-94-010-0454-1, 2002.
Park, R. J. and Jacob, D. J.: Sources of carbonaceous aerosols over the United States and implications for natural visibility, J. Geophys. Res., 108, 4355, https://doi.org/10.1029/2002jd003190, 2003.
Peng, J., Hu, M., Shang, D., Wu, Z., Du, Z., Tan, T., Wang, Y., Zhang, F., and Zhang, R.: Explosive Secondary Aerosol Formation during Severe Haze in the North China Plain, Environ. Sci. Technol., 55, 2189–2207, https://doi.org/10.1021/acs.est.0c07204, 2021.
Pye, H. O. T., Nenes, A., Alexander, B., Ault, A. P., Barth, M. C., Clegg, S. L., Collett Jr., J. L., Fahey, K. M., Hennigan, C. J., Herrmann, H., Kanakidou, M., Kelly, J. T., Ku, I.-T., McNeill, V. F., Riemer, N., Schaefer, T., Shi, G., Tilgner, A., Walker, J. T., Wang, T., Weber, R., Xing, J., Zaveri, R. A., and Zuend, A.: The acidity of atmospheric particles and clouds, Atmos. Chem. Phys., 20, 4809–4888, https://doi.org/10.5194/acp-20-4809-2020, 2020.
Ramanathan, V., Crutzen, P. J., Kiehl, J. T., and Rosenfeld, D.: Aerosols, climate, and the hydrological cycle, Science, 294, 2119–2124, 10.1126/science.1064034, 2001.
Ravishankara, A. R.: Heterogeneous and Multiphase Chemistry in the Troposphere, Science, 276, 1058–1065, https://doi.org/10.1126/science.276.5315.1058, 1997.
Ren, Y., Ding, A., Wang, T., Shen, X., Guo, J., Zhang, J., Wang, Y., Xu, P., Wang, X., and Gao, J.: Measurement of gas-phase total peroxides at the summit of Mount Tai in China, Atmos. Environ., 43, 1702–1711, https://doi.org/10.1016/j.atmosenv.2008.12.020, 2009.
Sha, T., Ma, X., Jia, H., Tian, R., Chang, Y., Cao, F., and Zhang, Y.: Aerosol chemical component: Simulations with WRF-Chem and comparison with observations in Nanjing, Atmos. Environ., 218, 116982, https://doi.org/10.1016/j.atmosenv.2019.116982, 2019a.
Sha, T., Ma, X., Jia, H., van der A, R. J., Ding, J., Zhang, Y., and Chang, Y.: Exploring the influence of two inventories on simulated air pollutants during winter over the Yangtze River Delta, Atmos. Environ., 206, 170–182, https://doi.org/10.1016/j.atmosenv.2019.03.006, 2019b.
Shen, X., Lee, T., Guo, J., Wang, X., Li, P., Xu, P., Wang, Y., Ren, Y., Wang, W., Wang, T., Li, Y., Carn, S. A., and Collett, J. L.: Aqueous phase sulfate production in clouds in eastern China, Atmos. Environ., 62, 502–511, https://doi.org/10.1016/j.atmosenv.2012.07.079, 2012.
Sielski, J., Kazirod-Wolski, K., Jozwiak, M. A., and Jozwiak, M.: The influence of air pollution by PM2.5, PM10 and associated heavy metals on the parameters of out-of-hospital cardiac arrest, Sci. Total Environ., 788, 147541, https://doi.org/10.1016/j.scitotenv.2021.147541, 2021.
Song, S., Gao, M., Xu, W., Sun, Y., Worsnop, D. R., Jayne, J. T., Zhang, Y., Zhu, L., Li, M., Zhou, Z., Cheng, C., Lv, Y., Wang, Y., Peng, W., Xu, X., Lin, N., Wang, Y., Wang, S., Munger, J. W., Jacob, D. J., and McElroy, M. B.: Possible heterogeneous chemistry of hydroxymethanesulfonate (HMS) in northern China winter haze, Atmos. Chem. Phys., 19, 1357–1371, https://doi.org/10.5194/acp-19-1357-2019, 2019.
Sun, K., Liu, H., Ding, A., and Wang, X.: WRF-Chem Simulation of a Severe Haze Episode in the Yangtze River Delta, China, Aerosol Air Qual. Res., 16, 1268–1283, https://doi.org/10.4209/aaqr.2015.04.0248, 2016.
Terrenoire, E., Bessagnet, B., Rouïl, L., Tognet, F., Pirovano, G., Létinois, L., Beauchamp, M., Colette, A., Thunis, P., Amann, M., and Menut, L.: High-resolution air quality simulation over Europe with the chemistry transport model CHIMERE, Geosci. Model Dev., 8, 21–42, https://doi.org/10.5194/gmd-8-21-2015, 2015.
Tie, X.: Assessment of the global impact of aerosols on tropospheric oxidants, J. Geophys. Res., 110, D03204, https://doi.org/10.1029/2004jd005359, 2005.
Tuccella, P., Curci, G., Visconti, G., Bessagnet, B., Menut, L., and Park, R. J.: Modeling of gas and aerosol with WRF/Chem over Europe: Evaluation and sensitivity study, J. Geophys. Res., 117, D03303, https://doi.org/10.1029/2011JD016302, 2012.
Turnock, S. T., Mann, G. W., Woodhouse, M. T., Dalvi, M., O'Connor, F. M., Carslaw, K. S., and Sprackle, D. V.: The Impact of Changes in Cloud Water pH on Aerosol, Geophys. Res. Lett., 46, 4039–4048, 10.1029/2019GL082067, 2019.
Twomey, S.: Aerosols, clouds and radiation, Atmospheric Environment.part A.general Topics, 25, 2435–2442, https://doi.org/10.1016/0960-1686(91)90159-5, 1991.
Twomey, S. A., Piepgrass, M., and Wolfe, T. L.: An assessment of the impact of pollution on the global cloud albedo, Tellus B, 36B, 356–366, https://doi.org/10.1111/j.1600-0889.1984.tb00254.x, 1984.
von Salzen, K., Leighton, H. G., Ariya, P. A., Barrie, L. A., Gong, S. L., Blanchet, J. P., Spacek, L., Lohmann, U., and Kleinman, L. I.: Sensitivity of sulphate aerosol size distributions and CCN concentrations over North America to SOx emissions and H2O2 concentrations, J. Geophys. Res.-Atmos., 105, 9741–9765, https://doi.org/10.1029/2000jd900027, 2000.
Wang, G., Zhang, R., Gomez, M. E., Yang, L., Levy Zamora, M., Hu, M., Lin, Y., Peng, J., Guo, S., Meng, J., Li, J., Cheng, C., Hu, T., Ren, Y., Wang, Y., Gao, J., Cao, J., An, Z., Zhou, W., Li, G., Wang, J., Tian, P., Marrero-Ortiz, W., Secrest, J., Du, Z., Zheng, J., Shang, D., Zeng, L., Shao, M., Wang, W., Huang, Y., Wang, Y., Zhu, Y., Li, Y., Hu, J., Pan, B., Cai, L., Cheng, Y., Ji, Y., Zhang, F., Rosenfeld, D., Liss, P. S., Duce, R. A., Kolb, C. E., and Molina, M. J.: Persistent sulfate formation from London Fog to Chinese haze, P. Natl. Acad. Sci. USA, 113, 13630–13635, https://doi.org/10.1073/pnas.1616540113, 2016.
Wang, H., Shi, G. Y., Zhang, X. Y., Gong, S. L., Tan, S. C., Chen, B., Che, H. Z., and Li, T.: Mesoscale modelling study of the interactions between aerosols and PBL meteorology during a haze episode in China Jing–Jin–Ji and its near surrounding region – Part 2: Aerosols' radiative feedback effects, Atmos. Chem. Phys., 15, 3277–3287, https://doi.org/10.5194/acp-15-3277-2015, 2015.
Wang, J., Li, J., Ye, J., Zhao, J., Wu, Y., Hu, J., Liu, D., Nie, D., Shen, F., Huang, X., Huang, D. D., Ji, D., Sun, X., Xu, W., Guo, J., Song, S., Qin, Y., Liu, P., Turner, J. R., Lee, H. C., Hwang, S., Liao, H., Martin, S. T., Zhang, Q., Chen, M., Sun, Y., Ge, X., and Jacob, D. J.: Fast sulfate formation from oxidation of SO2 by NO2 and HONO observed in Beijing haze, Nat. Commun., 11, 2844, https://doi.org/10.1038/s41467-020-16683-x, 2020.
Wang, S., Zhou, S., Tao, Y., Tsui, W. G., Ye, J., Yu, J. Z., Murphy, J. G., McNeill, V. F., Abbatt, J. P. D., and Chan, A. W. H.: Organic Peroxides and Sulfur Dioxide in Aerosol: Source of Particulate Sulfate, Environ. Sci. Technol., 53, 10695–10704, https://doi.org/10.1021/acs.est.9b02591, 2019.
Wang, T., Liu, M., Liu, M., Song, Y., Xu, Z., Shang, F., Huang, X., Liao, W., Wang, W., Ge, M., Cao, J., Hu, J., Tang, G., Pan, Y., Hu, M., and Zhu, T.: Sulfate Formation Apportionment during Winter Haze Events in North China, Environ. Sci. Technol., 56, 7771–7778, https://doi.org/10.1021/acs.est.2c02533, 2022.
Wang, W., Liu, M., Wang, T., Song, Y., Zhou, L., Cao, J., Hu, J., Tang, G., Chen, Z., Li, Z., Xu, Z., Peng, C., Lian, C., Chen, Y., Pan, Y., Zhang, Y., Sun, Y., Li, W., Zhu, T., Tian, H., and Ge, M.: Sulfate formation is dominated by manganese-catalyzed oxidation of SO(2) on aerosol surfaces during haze events, Nat. Commun., 12, 1993, https://doi.org/10.1038/s41467-021-22091-6, 2021.
Wang, Y., Zhang, Q. Q., Jiang, J., Zhou, W., Wang, B., He, K., Duan, F., Zhang, Q., Philip, S., and Xie, Y.: Enhanced sulfate formation during China's severe winter haze episode in January 2013 missing from current models, J. Geophys. Res.-Atmos., 119, 10425-10440, https://doi.org/10.1002/2013JD021426, 2014.
Wei, Y., Chen, X., Chen, H., Li, J., Wang, Z., Yang, W., Ge, B., Du, H., Hao, J., Wang, W., Li, J., Sun, Y., and Huang, H.: IAP-AACM v1.0: a global to regional evaluation of the atmospheric chemistry model in CAS-ESM, Atmos. Chem. Phys., 19, 8269–8296, https://doi.org/10.5194/acp-19-8269-2019, 2019.
Xie, Y., Dai, H., Zhang, Y., Wu, Y., Hanaoka, T., and Masui, T.: Comparison of health and economic impacts of PM2.5 and ozone pollution in China, Environ. Int., 130, 104881, https://doi.org/10.1016/j.envint.2019.05.075, 2019.
Yao, M., Zhao, Y., Hu, M., Huang, D., Wang, Y., Yu, J. Z., and Yan, N.: Multiphase Reactions between Secondary Organic Aerosol and Sulfur Dioxide: Kinetics and Contributions to Sulfate Formation and Aerosol Aging, Environ. Sci. Technol. Lett., 6, 768-774, htttps://doi.org/10.1021/acs.estlett.9b00657, 2019.
Yao, S., Wang, Q., Zhang, J., and Zhang, R.: Characteristics of Aerosol and Effect of Aerosol-Radiation-Feedback in Handan, an Industrialized and Polluted City in China in Haze Episodes, Atmosphere, 12, 670, https://doi.org/10.3390/atmos12060670, 2021.
Ye, C., Xue, C., Zhang, C., Ma, Z., Liu, P., Zhang, Y., Liu, C., Zhao, X., Zhang, W., He, X., Song, Y., Liu, J., Wang, W., Sui, B., Cui, R., Yang, X., Mei, R., Chen, J., and Mu, Y.: Atmospheric Hydrogen Peroxide H2O2 at the Foot and Summit of Mt Tai Variations Sources, J. Geophys. Res.-Atmos., 126, e2020JD033975, https://doi.org/10.1029/2020JD033975, 2021.
Ye, J., Abbatt, J. P. D., and Chan, A. W. H.: Novel pathway of SO2 oxidation in the atmosphere: reactions with monoterpene ozonolysis intermediates and secondary organic aerosol, Atmos. Chem. Phys., 18, 5549–5565, https://doi.org/10.5194/acp-18-5549-2018, 2018.
Zhang, L., Gong, S., Zhao, T., Zhou, C., Wang, Y., Li, J., Ji, D., He, J., Liu, H., Gui, K., Guo, X., Gao, J., Shan, Y., Wang, H., Wang, Y., Che, H., and Zhang, X.: Development of WRF/CUACE v1.0 model and its preliminary application in simulating air quality in China, Geosci. Model Dev., 14, 703–718, https://doi.org/10.5194/gmd-14-703-2021, 2021.
Zhang, X. Y., Wang, Y. Q., Niu, T., Zhang, X. C., Gong, S. L., Zhang, Y. M., and Sun, J. Y.: Atmospheric aerosol compositions in China: spatial/temporal variability, chemical signature, regional haze distribution and comparisons with global aerosols, Atmos. Chem. Phys., 12, 779–799, https://doi.org/10.5194/acp-12-779-2012, 2012.
Zheng, B., Tong, D., Li, M., Liu, F., Hong, C., Geng, G., Li, H., Li, X., Peng, L., Qi, J., Yan, L., Zhang, Y., Zhao, H., Zheng, Y., He, K., and Zhang, Q.: Trends in China's anthropogenic emissions since 2010 as the consequence of clean air actions, Atmos. Chem. Phys., 18, 14095–14111, https://doi.org/10.5194/acp-18-14095-2018, 2018.
Zhou, C., Zhang, X., Zhang, J., and Zhang, X.: Representations of dynamics size distributions of mineral dust over East Asia by a regional sand and dust storm model, Atmos. Res., 250, 18965, https://doi.org/10.1016/j.atmosres.2020.105403, 2021.
Zhou, C., Zhang, X., Gong, S., Wang, Y., and Xue, M.: Improving aerosol interaction with clouds and precipitation in a regional chemical weather modeling system, Atmos. Chem. Phys., 16, 145–160, https://doi.org/10.5194/acp-16-145-2016, 2016.
Zhou, C. H., Gong, S., Zhang, X. Y., Liu, H. L., Xue, M., Cao, G. L., An, X. Q., and Che, H. Z.: Towards the improvements of simulating the chemical and optical properties of Chinese aerosols using an online coupled model – CUACE/Aero, Tellus B, 64, 18965, https://doi.org/10.3402/tellusb.v64i0.18965, 2012.
Zhou, Y., Gong, S., Zhou, C., Zhang, L., He, J., Wang, Y., Ji, D., Feng, J., Mo, J., and Ke, H.: A new parameterization of uptake coefficients for heterogeneous reactions on multi-component atmospheric aerosols, Sci. Total Environ., 781, 146372, https://doi.org/10.1016/j.scitotenv.2021.146372, 2021.
Zhu, Y., Yang, L., Chen, J., Kawamura, K., Sato, M., Tilgner, A., van Pinxteren, D., Chen, Y., Xue, L., Wang, X., Simpson, I. J., Herrmann, H., Blake, D. R., and Wang, W.: Molecular distributions of dicarboxylic acids, oxocarboxylic acids and α-dicarbonyls in PM2.5 collected at the top of Mt. Tai, North China, during the wheat burning season of 2014, Atmos. Chem. Phys., 18, 10741–10758, https://doi.org/10.5194/acp-18-10741-2018, 2018.