the Creative Commons Attribution 4.0 License.
the Creative Commons Attribution 4.0 License.
 | 06 Apr 2023
High-resolution regional emission inventory contributes to the evaluation of policy effectiveness: a case study in Jiangsu Province, China
Chen Gu
Lei Zhang
Zidie Xu
Sijia Xia
Yutong Wang
Li Li
Zeren Wang
Qiuyue Zhao
Hanying Wang
Yu Zhao
China has been conducting a series of actions on air quality improvement for the past decades, and air pollutant emissions have been changing swiftly across the country. Provinces are an important administrative unit for air quality management in China; thus a reliable provincial-level emission inventory for multiple years is essential for detecting the varying sources of pollution and evaluating the effectiveness of emission controls. In this study, we selected Jiangsu, one of the most developed provinces in China, and developed a high-resolution emission inventory of nine species for 2015–2019, with improved methodologies for different emission sectors, best available facility-level information on individual sources, and real-world emission measurements. Resulting from implementation of strict emission control measures, the anthropogenic emissions were estimated to have declined 53 %, 20 %, 7 %, 2 %, 10 %, 21 %, 16 %, 6 %, and 18 % for sulfur dioxide (SO2), nitrogen oxides (NOx), carbon monoxide (CO), non-methane volatile organic compounds (NMVOCs), ammonia (NH3), inhalable particulate matter (PM10), fine particulate matter (PM2.5), black carbon (BC), and organic carbon (OC) from 2015 to 2019, respectively. Larger abatement of SO2, NOx, and PM2.5 emissions was detected for the more developed region of southern Jiangsu. During the period from 2016 to 2019, the ratio of biogenic volatile organic compounds (BVOCs) to anthropogenic volatile organic compounds (AVOCs) exceeded 50 % in the month of July, indicating the importance of biogenic sources for summer O3 formation. Our estimates in annual emissions of NOx, NMVOCs, and NH3 were generally smaller than the national emission inventory, MEIC (the Multi-resolution Emission Inventory for China), but larger for primary particles. The discrepancies between studies resulted mainly from different methods of emission estimation (e.g., the procedure-based approach for AVOC emissions from key industries used in this work) and inconsistent information of emission source operation (e.g., the penetration and removal efficiencies of air pollution control devices). Regarding the different periods, more reduction of SO2 emissions was found between 2015 and 2017 and of NOx, AVOCs, and PM2.5 between 2017 and 2019. Among the selected 13 major measures, the ultra-low-emission retrofit in the power sector was the most important contributor to the reduced SO2 and NOx emissions (accounting for 38 % and 43 % of the emission abatement, respectively) for 2015–2017, but its effect became very limited afterwards as the retrofit had been commonly completed by 2017. Instead, extensive management of coal-fired boilers and the upgrade and renovation of non-electrical industry were the most important measures for 2017–2019, accounting collectively for 61 %, 49 %, and 57 % reduction of SO2, NOx, and PM2.5, respectively. Controls on key industrial sectors were the most effective for AVOC reduction in the two periods, while measures relating to other sources (transportation and solvent replacement) have become more important in recent years. Our provincial emission inventory was demonstrated to support high-resolution air quality modeling for multiple years. Through scenario setting and modeling, worsened meteorological conditions were found from 2015 to 2019 for PM2.5 and O3 pollution alleviation. However, the efforts on emission controls were identified to largely overcome the negative influence of meteorological variation. The changed anthropogenic emissions were estimated to contribute 4.3 and 5.5 µg m−3 of PM2.5 concentration reduction for 2015–2017 and 2017–2019, respectively. While O3 was elevated by 4.9 µg m−3 for 2015–2017, the changing emissions led to 3.1 µg m−3 of reduction for 2017–2019, partly (not fully though) offsetting the meteorology-driven growth. The analysis justified the validity of local emission control efforts on air quality improvement and provided a scientific basis to formulate air pollution prevention and control policies for other developed regions in China and worldwide.
- Article
(13679 KB) - Full-text XML
-
Supplement
(3431 KB) - BibTeX
- EndNote


Severe air pollution is of great concern for fast industrialized countries like China, especially in economically developed regions, where an overlap of serious pollution levels and dense populations has resulted in high exposure and adverse health outcomes (Klimont et al., 2013; Hoesly et al., 2018). An emission inventory, which contains complete information on the magnitude, spatial pattern, and temporal change of air pollutant emissions by sector, is essential for identifying the sources of air pollution and effectiveness of emission controls on air quality through numerical modeling (Zhao et al., 2013). Improving the understanding of emission behaviors and reducing the uncertainty of emission estimates have always been the main focus of emission inventory studies, given the big variety of source categories, fast changing mix of manufacturing and emission control technologies, and insufficient measurements of real-world emissions. At the global and continental scales, emission inventories have been developed by combining available information of large point sources and improved surrogate statistics for area sources, e.g., the Emissions Database for Global Atmospheric Research (EDGAR; https://edgar.jrc.ec.europa.eu/, last access: 10 October 2022, Crippa et al., 2020) and the Regional Emission Inventory in Asia (REAS; https://www.nies.go.jp/REAS/, last access: 10 October 2022, Kurokawa and Ohara, 2020). As the largest developing country in the world, China has been proven to contribute greatly to global emissions (Klimont et al., 2013; Huang et al., 2014; Wiedinmyer et al., 2014; Miyazaki et al., 2017).
Along with the improved methodology and increasing availability of emission source and field measurement data, the applicability and reliability of recent Chinese emission inventories (e.g., the Multi-resolution Emission Inventory for China, MEIC; Zheng et al., 2018) have been considerably improved compared to the earlier large-scale studies for Asia or the world. When the research focus switches to smaller provincial and city scales, the uncertainty of the national emission inventory may increase, attributed mainly to the insufficient information on detailed emission sources, particularly for medium-/small-sized stationary and area sources. Certain “proxies” including population and economic densities were commonly applied to downscale the emissions from coarser to finer horizontal resolution, based on the assumption that those proxies were strongly associated with emission intensity. Such a “coupling effect”, however, has been demonstrated to be weakened for recent years. For example, a great number of big industrial facilities have been gradually moved out of urban centers, resulting in an inconsistency between emission and population hotspots. Therefore, inappropriate application of those proxies could lead to great uncertainty in emission estimation and thereby enhanced bias in air quality modeling (Zhou et al., 2017; Zheng et al., 2017). For the urgent demand for preventing regional air pollution and relevant health damage, therefore, development of high-resolution emission inventories has been becoming essential, especially in regions with developed industry, large population, and complex emission sources (Zheng et al., 2009; Shen et al., 2017; Zhao et al., 2018). With an increased proportion of point sources and more complete facility-based information, the improved emission inventory could reduce the arbitrary use of a proxy-based downscaling technique and thereby the uncertainty of the emission estimates (Zhao et al., 2015; Zheng et al., 2021).
For the past decade, China has been conducting a series of actions to tackle the serious air pollution problem. With the mitigation of severe fine particulate matter (PM2.5) pollution set as a priority from 2013 to 2017, the National Action Plan on Air Pollution Control and Prevention (NAPAPCP; State Council of the People's Republic of China (SCC), 2013) pushed stringent end-of-pipe emission controls (e.g., the ultra-low-emission control for power sector) and the retirement of small and energy-inefficient factories (Q. Zhang et al., 2019; Y. Zhang et al., 2019; Zheng et al., 2018). On top of that, China announced the “Three-Year Action Plan to Fight Air Pollution” (TYAPFAP) to further reduce PM2.5 and ozone (O3) levels for 2018–2020 (SCC, 2018). Substantially enhanced measures have been required for reducing industrial (e.g., application of ultra-low-emission control for selected non-electrical industries) and residential emissions (e.g., promotion of advanced stoves and clean coal during heating seasons). These measures have changed the air pollutant emissions and thereby air quality over the country. Studies have been conducted to assess the contribution of the nation actions to the improvement of air quality, based usually on the national emission inventory. For example, Q. Zhang et al. (2019) estimated a nationwide 30 %–40 % reduction in PM2.5 concentration attributed to NAPAPCP from 2013 to 2017.
The province is an important administrative unit for air quality management in China. Given the heterogeneous economical and energy structures as well as atmospheric conditions, there is usually large diversity in the strategies and actions of reducing regional air pollution adopted by the local governments, leading to various levels of progress of emission and air quality changes (Liu et al., 2022; N. Wang et al., 2021). Limited by incomplete or inconsecutive information on emission sources and a lack of on-time emission measurements, however, there were few studies on provincial-level emission inventories for multiple years. Studies based on the national emission inventories would support policy makers less in formulating the emission control measures and evaluating their effectiveness on emission reduction and air quality improvement (An et al., 2021; Huang et al., 2021). Contrary to NAPAPCP, which has been analyzed, few analyses have been conducted for TYAPFAP since 2017, partly due to a lack of the most recent emission data, preventing comparison and comprehensive understanding of the effectiveness of emission controls for the two phases. Jiangsu Province, located on the northeast coast of the Yangtze River Delta region (YRD), is one of China's most industrial developed and heavy-polluted regions. It contributed to 10.1 % of the gross domestic product (GDP) in mainland China (ranking the second place in the country) and 6.4 %, 11.3 %, and 11.4 % of national cement, pig iron, and crude steel production in 2020, respectively (National Bureau of Statistics of China, 2016–2021). MEIC indicated the emissions per unit area of anthropogenic sulfur dioxide (SO2), nitrogen oxides (NOx), non-methane volatile organic compounds (NMVOCs), PM2.5, and ammonia (NH3) in Jiangsu were 2.8, 6.5, 7.0, 4.5, and 4.8 times the national average in 2017, respectively. Resulting from the implementation of air pollution prevention measures, PM2.5 pollution in Jiangsu has been alleviated since 2013, while the great changes in emissions due to varying energy use and industry and transportation development have made it the province with the highest O3 concentration and the fastest growth rate of O3 in the YRD in recent years (Zheng et al., 2016; Wang et al., 2017; S. J. Zhang et al., 2017; Zhou et al., 2017).
In this study, therefore, we took Jiangsu as an example to demonstrate the development of a high-resolution emission inventory and its application to evaluate the effectiveness of emission control actions. We integrated methodological improvements of the regional emission inventory by our previous studies (Zhou et al., 2017; Zhao et al., 2017, 2020; Wu et al., 2022; Y. Zhang et al., 2019; Zhang et al., 2020; Y. Zhang et al., 2021) and compiled and incorporated the best available facility-level information and real-world emission measurements (see details in the “Methodology and data” section). A provincial-level emission inventory for 2015–2019 was then thoroughly developed for nine gaseous and particulate species (SO2, NOx, NMVOCs, carbon dioxide (CO), inhalable particulate matter (PM10), PM2.5, NH3, black carbon (BC), and organic carbon (OC)). The difference between our emission inventory and others, as well as its main causes, was carefully explored. Using a measure-specific integrated evaluation approach, we further identified the drivers of emission changes of SO2, NOx, PM2.5, and anthropogenic volatile organic compounds (AVOCs), with an emphasis on the impacts of 13 major control measures summarized from NAPAPCP and TYAPFAP. Finally, air quality modeling was applied to assess the reliability of our emission inventory and to quantify the contribution of emission controls to the changing PM2.5 and O3 concentrations for 2015–2017 within NAPAPCP and 2017–2019 within TYAPFAP, and the differentiated impacts of emission controls on air quality were revealed for the two phases.
2.1 Emission estimation
2.1.1 Emission source classification
We applied a four-level framework of emission source categories for Jiangsu emission inventory, based on a thorough investigation on the energy and industrial structures in the province. The framework included six first-level categories, covering all the social and economic sectors in Jiangsu: the power sector, industry, transportation, agriculture, residential, and biogenic source (for NMVOCs only). Moreover, the framework contained 55 second-level categories based on facility/equipment types and economical subsectors; 240 third-level categories classified mainly by fuel, product, and material types; and a total of 870 fourth-level categories including sources of combustion, manufacturing, and emission control technologies of emission facilities (details on the first three-level sectors are listed in Table S1 in the Supplement).
Compared to the guidelines of national emission inventory development (He et al., 2018), 42 new categories (third-level) were added in this study, contained mainly in the second-level categories including metal products and the mechanical equipment manufacturing industries, non-industrial solvent usage from ship fittings and repairs, household appliances, and housing retrofitting emissions. These categories were identified as important sources of NMVOC emissions in Jiangsu. In particular, ship coating emissions, coming mainly from solvent usage during spraying, cleaning, and gluing in a wide range of procedures, could account for nearly 20 % of the solvent use emissions in the YRD region (Mo et al., 2021). Therefore, the updated framework provides a more complete coverage of source categories, thus considerably reducing the bias of emission estimation due to missing potentially important emitters.
2.1.2 Emission estimation methods
We applied the “bottom-up” methodology (i.e., the emissions were calculated at the finest source level (e.g., facility level if data allowed) and then aggregated to upper categories/regions) to develop the high-resolution emission inventory for Jiangsu (and its 13 cities, as shown in Fig. S1 in the Supplement) for 2015–2019. As mentioned in the Introduction, we have conducted a series of studies and made substantial improvements to the methodology of regional emission inventory development by source category or species, compared to the ones at larger spatial scales. Here we integrated those improvements as briefly described below, and additional further details can be found in corresponding published articles.
-
Power plant. We developed a method of examining, screening, and applying online measurement data from the continuous emission monitoring systems (CEMSs; Y. Zhang et al., 2019) to estimate the emissions at the power unit/plant level. For units without CEMS data, we applied the average flue gas concentrations obtained from CEMSs for units with the same installed capacity. The emissions were calculated based on the annual mean hourly flue gas concentration of air pollutant obtained from CEMSs and the theoretical annual flue gas volume of each unit/plant:
where E is the emission of air pollutant; i, j, and m represent the pollutant species, individual plant/unit, and fuel type, respectively; C is the annual average concentration in the flue gas; AL is the annual coal consumption; and V0 is the theoretical flue gas volume per unit of fuel consumption, which depends on the coal type and can be calculated following the method in Zhao et al. (2010).
-
Industrial plant. Emissions were principally calculated based on activity level data (production output or energy consumption) and emission factor (emissions per unit of activity level). For point sources with abundant information, we used a procedure-based approach to calculate the emissions of pollutants (Zhao et al., 2017). For example, we subdivided the iron and steel industry into sintering, pelletizing, iron making, steel making, rolling steel, and coking. The activity data and emission factors of each procedure were derived based on multiple pieces of information collected from regular enterprise reports, statistics, and/or on-site investigation at the facility level (see Sect. 2.1.3). The emissions of air pollutants were calculated using Eq. (2):
where r is the industrial procedure, AL is the activity level, EF is the unabated emission factor, and η is the pollutant removal efficiency of end-of-pipe control equipment.
-
Petrochemical industry. Certain procedures in petrochemical industry have been identified as the main contributors to AVOC emissions from the sector. For example, equipment leaks, storage tanks, and manufacturing lines were estimated to be responsible for over 90 % of the total emissions (Ke et al., 2020; Liu et al., 2020; Yen and Horng, 2009). Through field measurements and in-depth analysis of different emission calculation methods, L. Zhang et al. (2021) suggested that a procedure-based method would provide a better estimate of NMVOC emissions for petroleum industries than the common approach that applied a full emission factor for the whole factory. In this study, therefore, we applied the procedure-based method for four key procedures (manufacturing lines, storage tanks, equipment leaks, and wastewater collection and treatment systems), with the best available information from on-site surveys and regular enterprise reports.
-
Agriculture. Agricultural NH3 emissions can be influenced by the meteorology, soil environment, and farming practices and, thus, are more difficult to track compared to SO2 and NOx that commonly come from power and industrial plants. For example, high temperatures and top-dressing fertilization conducted in summer could elevate NH3 volatilization from urea fertilizer uses in the YRD. Our previous work (Zhao et al., 2020) quantified the effects of meteorology, soil properties, and various agricultural processes (e.g., fertilizer use and manure management) on YRD NH3 emissions for 2014. Here we expanded the research period and obtained the agricultural NH3 emission inventory for 2015–2019 in Jiangsu.
-
Off-road transportation. In this work, we combined the method developed by Zhang et al. (2020) and newly tested emission factors to estimate the emissions from off-road machines in Jiangsu for multiple years. We developed a novel method to estimate the emissions and their spatiotemporal distribution for in-use agricultural machinery, through the combination of satellite data, land and soil information, and in-house investigation (Zhang et al., 2020). In particular, the machinery usage was determined based on the spatial distribution and the growing and rotation pattern of the crops. Moreover, 12 construction and agricultural machines with different power capacity and emission grades (China I–III) were selected, and emission factors were measured under various working loads (unpublished).
-
Biogenic source. Located in the subtropics, Jiangsu has abundant broadleaf vegetation, a main contributor to biogenic volatile organic compound (BVOC) emissions. Our previous work (Y. Wang et al., 2020) evaluated the effect of land cover data, emission factors, and O3 exposure on BVOC emissions in the YRD with the Model of Emissions of Gases and Aerosols from Nature (MEGAN). Here we followed the improved method by Y. Wang et al. (2020) and calculated BVOC emissions with integrated land cover information, local BVOC emission factors, and the influence of actual O3 stress in Jiangsu.
-
Other sources. Emissions from on-road vehicles and residential sectors were estimated following our previous work (Zhou et al., 2017; Zhao et al., 2021), with updated activity levels and emission factors.
-
NMVOC speciation. We updated NMVOC speciation by incorporating the local source profiles from field measures (Zhao et al., 2017; L. Zhang et al., 2021) and massive literature reviews of previous studies (Mo et al., 2016; Li et al., 2014; Huang et al., 2021; R. Wang et al., 2020). Compared with the widely used SPECIATE 4.4 database (https://www.epa.gov/air-emissions-modeling/speciate, last access: 10 October 2022, Hsu et al., 2018), we included new source profiles from local measurements for the production of sugar, vegetable oil, and beer and refined the source profiles for the use of paints, inks, coatings, dyes, dyestuffs, and adhesives in the manufacturing industry (L. Zhang et al., 2021) and selected production processes of chemical engineering (Zhao et al., 2017). Moreover, we applied more detailed profiles for some finer categories compared to the coarser source categories in the guidelines of national emission inventory development, for example, NMVOC release during filling into petrol and diesel release; metal surface treatment into water-based and solvent-based paints; and ink printing into offset, gravure, and letterpress printing. These efforts made the NMVOC speciation more representative of local emission sources (L. Zhang et al., 2021).
2.1.3 Data compilation, investigation, and incorporation
In this study, we compiled, investigated, and incorporated most available information on emission sources to improve the completeness, representativeness, and reliability of provincial emission inventory. In particular, we collected officially reported data from the Environmental Statistics Database (ESD, 2015–2019) and the Second National Pollution Source Census (SNPSC, 2017) for stationary sources (mostly power and industrial ones). Both of them contained basic information on their location, raw material and energy consumption, product output, and manufacturing and emission control technologies. The former database was routinely reported for relatively big point sources every year, but some information could be outdated or inaccurate attributed to insufficient on-site inspection. Through wide on-site surveys, in contrast, the latter database included many more plants and provided or corrected crucial information at facility level, such as removal efficiency of air pollutant control devices (APCDs). However, the database was developed for 2017 and could not track the changes for recent years. Therefore, we further applied an internal database from the Air Pollution Source Emission Inventory Compilation and Analysis System (APSEICAS; http://123.127.175.61:31000, last access: 10 October 2022), which was developed by the Jiangsu Provincial Academy of Environmental Sciences. Following the principle of SNPSC, the information of APSEICAS has been collected and dynamically updated since 2018, based mainly on in-depth investigation for individual enterprises conducted jointly by themselves and local environmental administrators. We conducted cross-validation and necessary revision according to the three above-mentioned databases, to ensure the accuracy of information as much as possible.
As a result, we obtained sufficient numbers of point sources with satisfying facility-level information for provincial-level emission inventory development (57 457, 32 324, and 48 826 for 2017, 2018, and 2019, respectively). The shares of coal consumption by those sources of the total ranged 90 %–94 % for the 3 years. The high proportions of point sources could effectively reduce the uncertainty in estimation and spatial allocation of air pollutant emissions. For the remaining industrial sources, the emissions were calculated using the average emission factor of each sector in each city and were spatially allocated according to the distribution of local industrial parks and GDP data extracted from a database of the Chinese Academy of Sciences (CAS) for 2015 at a horizontal resolution of 1 km (https://www.resdc.cn/DOI/DOI.aspx?DOIid=33, last access: 10 October 2022).
Other information on area industrial sources, transportation, and agricultural and residential sources was taken from economical and energy statistical yearbooks at the city level. Activity data that were not recorded (e.g., civil solvent usage, catering, and biomass burning) were indirectly estimated from relevant statistics, including population, building area, and crop yields.
2.2 Analysis of emission change
In this study, we summarized 13 major control measures adopted between 2015 and 2019, based on NAPAPCP, TYAPFAP, and relative action plans promulgated by the Jiangsu government (Fig. S2 in the Supplement). These include the (1) ultra-low-emission retrofit of coal-fired power plants, (2) extensive management of coal-fired boilers, (3) upgrade and renovation of non-electrical industry, (4) phasing out of outdated industrial capacities, (5) promotion of clean energy use, (6) phasing out of small polluting factories, (7) construction of port shore power, (8) comprehensive treatment of mobile source pollution, (9) VOC emission control in key sectors, (10) application of leak detection and repair (LDAR), (11) oil and gas recovery, (12) replacement with low-VOC paints, and (13) control of non-point pollution. We applied the method from Q. Zhang et al. (2019) to quantify the benefits of those air clean actions for emission abatement. Briefly, the emission reduction resulting from the implementation of a specific measure was estimated by changing the parameters of emission calculation associated with the measure within the concerned period and keeping other parameters constant (same as initial year). The emission reduction from each measure was then estimated for 2015–2017 and 2017–2019. The provincial-level emission inventory developed in Sect. 2.1 was adopted as the baseline of the emission estimates. It is worth noting that the aggregated emission reduction from all the measures is not equal to the actual reduction, as the factors leading to emission growth were not counted in this analysis.
2.3 Air quality modeling
2.3.1 Model configurations
To evaluate the provincial-level emission inventory, we used the Community Multiscale Air Quality (CMAQ v5.1) model developed by the US Environmental Protection Agency (USEPA), to simulate the PM2.5 and O3 concentrations in Jiangsu. As the simulation periods, 4 months representing the four seasons (January, April, July, and October) of each year between 2015 and 2019 were selected, with a spin-up time of 7 d for each month to reduce the impact of the initial condition on the simulation. As shown in Fig. S1, three nested domains (D1, D2, and D3) were applied with the horizontal resolutions of 27, 9, and 3 km, respectively, and the most inner domain, D3, covered Jiangsu and parts of the YRD region including Shanghai, northern Zhejiang, and eastern Anhui. MEIC was applied for D1, D2, and the regions outside of Jiangsu in D3, and the provincial-level emission inventory was applied for Jiangsu in D3. The emission data outside Jiangsu in D3 were originally from MEIC and downscaled to the resolution of 3 km × 3 km with the “proxy-based” approach. The Carbon Bond Mechanism (CB05) and AERO5 mechanisms were used for the gas-phase chemistry and aerosol module, respectively.
The meteorological field for the CMAQ model was obtained from the Weather Research and Forecasting model (WRF v3.4). Meteorological initial and boundary conditions were obtained from the National Centers for Environmental Prediction (NCEP) datasets for the assimilation in simulations. Ground observations at 3 h intervals were downloaded from National Climatic Data Center (NCDC) to evaluate the WRF modeling performance, and statistical indicators including bias, index of agreement (IOA), and root mean squared error (RMSE) were calculated (J. Yang et al., 2021). The discrepancies between simulations and ground observations were within an acceptable range (Table S2 in the Supplement).
In order to evaluate the model performance of CMAQ, we collected ground observation data of hourly PM2.5 and O3 concentrations at the 110 state-operated air quality monitoring stations within Jiangsu (https://data.epmap.org/page/index, last access: 10 October 2022; see the station locations in Fig. S1). Correlation coefficient (R), normalized mean bias (NMB), and normalized mean error (NME) values between observations and the simulation for each month were calculated to evaluate the performance of CMAQ modeling:
where Sp and Op are the simulated and observed concentration of air pollutant, respectively, and n indicates the number of available data pairs.
We further compared the modeling performance using the provincial-level emission inventory in D3 with that using MEIC in D2. Basically, the proxies of total population and GDP were poorly correlated with gridded emissions dominated by point sources, and the proxy-based methodology would result in great uncertainty in downscaling emissions and thereby air quality modeling from coarser to finer resolution. For example, Zheng et al. (2017) suggested a much larger bias for high-resolution simulation (additional 8 %–73 % at 4 km) than that at coarser resolution (3 %–13 % for 36 km) when MEIC was applied in predicting surface concentrations of different air pollutants. Our previous work in the YRD also demonstrated that downscaling the national emission inventory with the proxy-based method resulted in a clearly larger bias in high-resolution (3 km) air quality modeling than the provincial-level emission inventory with more point sources included (Zhou et al., 2017). To avoid expanding the modeling bias, therefore, we did not directly downscale MEIC into the entire D3, and the improvement of provincial emission inventory could be demonstrated with better model performance (in D3) than MEIC (in D2).
2.3.2 Emission and meteorological factors affecting the variation of PM2.5 and O3
Besides the baseline simulations conducted for 2015, 2017, and 2019, we set up two extra scenarios, the meteorological variation (VMET) and the anthropogenic emission variation (VEMIS), to assess the impacts of emission and meteorological changes on the interannual variations of PM2.5 and O3 concentrations and to reveal their varying contributions for different periods, as summarized in Table S3 in the Supplement. VMET used the varying meteorological fields for the 3 years but fixed the emission input at the 2017 level and was thus able to quantify the impact of changing meteorological conditions on PM2.5 and O3 concentrations. For example, the difference between 2015 and 2017 in VMET indicated the contribution of changing meteorology to variation of air pollutant concentration. Similarly, the emission variation scenario (VEMIS) used the varying emission inventory for the 3 years but fixed meteorological fields at the 2017 level and was thus able to quantify the impact of changing emissions on PM2.5 and O3 concentrations. The contributions between 2015 and 2017 and those between 2017 and 2019 could then be compared to evaluate the effectiveness of emission control on air quality for the two periods. Notably, the anthropogenic emission change in the modeling scenario referred to that for the entire D3 domain, and thus the contribution of emission control to the changing air quality was from both Jiangsu and nearby regions. Given the clearly larger emission intensity for the former compared to the latter (An et al., 2021), the contribution of local emissions was expected to be more important for the air quality than regional transport. Moreover, the BVOC emissions were selected in accordance with the meteorological field used for the given year; thus the interannual changes of BVOC emissions were counted in the contribution of changing meteorology.
3.1 Air pollutant emissions by sector and region
3.1.1 Anthropogenic emissions by sector and their changes
From 2015 to 2019, the total emissions of anthropogenic SO2, NOx, AVOCs, NH3, CO, PM10, PM2.5, BC, and OC in Jiangsu were estimated to decline by 53 %, 20 %, 6 %, 10 %, 7 %, 21 %, 16 %, 6 %, and 18 % down to 296, 1122, 1271, 422, 7163, 565, 411, 32, and 36 Gg in 2019, respectively (Table S4 in the Supplement). On top of SO2 and NOx, NMVOCs have been incorporated into national economic and social development plans with emission reduction targets in China since 2015 because of their harmful impact on human health and important role in triggering O3 formation. The central government required the total national emissions of SO2, NOx, and AVOCs to be cut by 15 %, 15 %, and 10 % during the 13th Five-Year Plan period (2015–2020), respectively (Zhang et al., 2022). Our estimates show that the actual SO2 and NOx emission reductions were larger than planned in Jiangsu, due to the implementation of stringent pollution control measures. However, AVOC emissions did not decline considerably within the research period, resulting from less penetration of efficient APCDs and more fugitive leakage that were difficult to capture. As shown in Fig. 1, the GDP and vehicle population grew by 40 % and 24 %, respectively, while coal consumption declined slightly during 2015–2019. Along with stringent emission reduction actions, the provincial emissions of SO2, NOx, and PM2,5 were gradually decoupling from those economical and energy factors, while CO was still strongly influenced by the change of coal consumption.
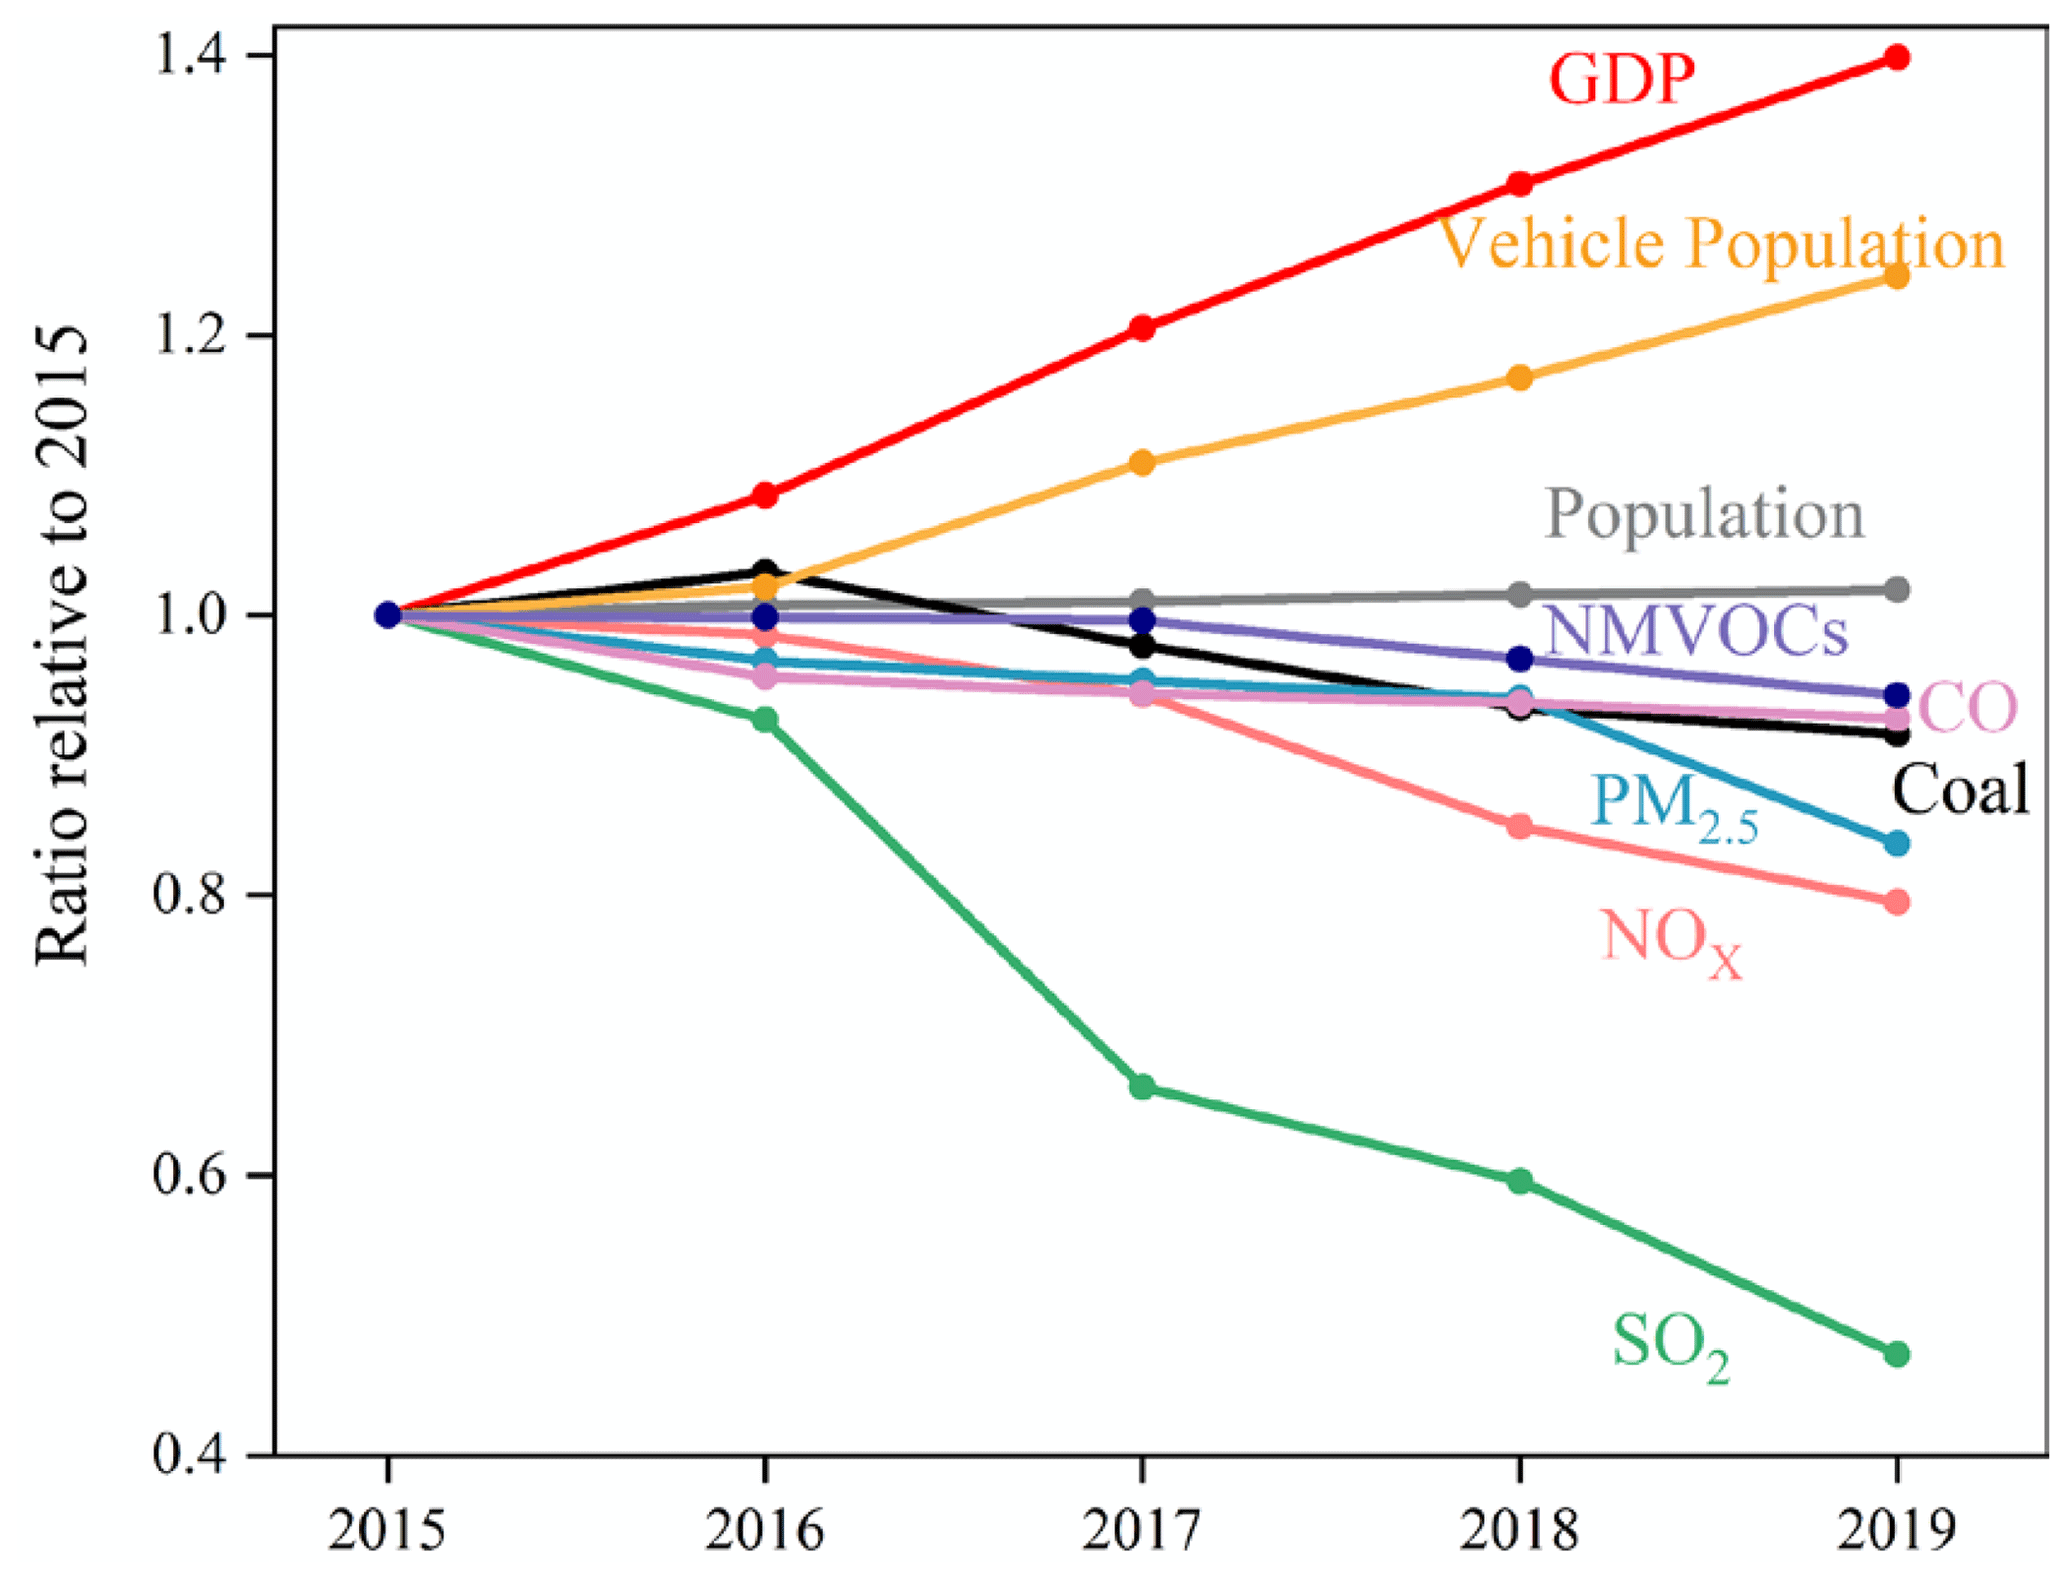
Figure 1Emission trends and underlying social and economic factors. Coal consumption is obtained from Chinese Energy Statistics (National Bureau of Statistics, 2016–2021). The GDP, population, and vehicle population data come from the National Bureau of Statistics (2016–2021). Data are normalized by dividing the value of each year by their corresponding value in 2015.
We present the sectoral contribution to anthropogenic emissions and their interannual changes in Figs. 2 and 3, respectively. The industrial sector was identified as the major contributor to SO2, CO, AVOCs, PM10, and PM2.5 emissions, of which the contribution accounted on average for 50 %, 62 %, 64 %, 68 %, and 61 % during 2015–2019, respectively (Fig. 2a, c, d, f, and g). The sector was found to drive the reductions in emissions of SO2, NOx, CO, PM10, PM2.5, and BC. In particular, the benefit of emission controls for the industrial sector after 2017 was found to clearly elevate and to surpass that of the power sector for SO2, NOx, PM10, and PM2.5 (Fig. 3a, b, f, and g).
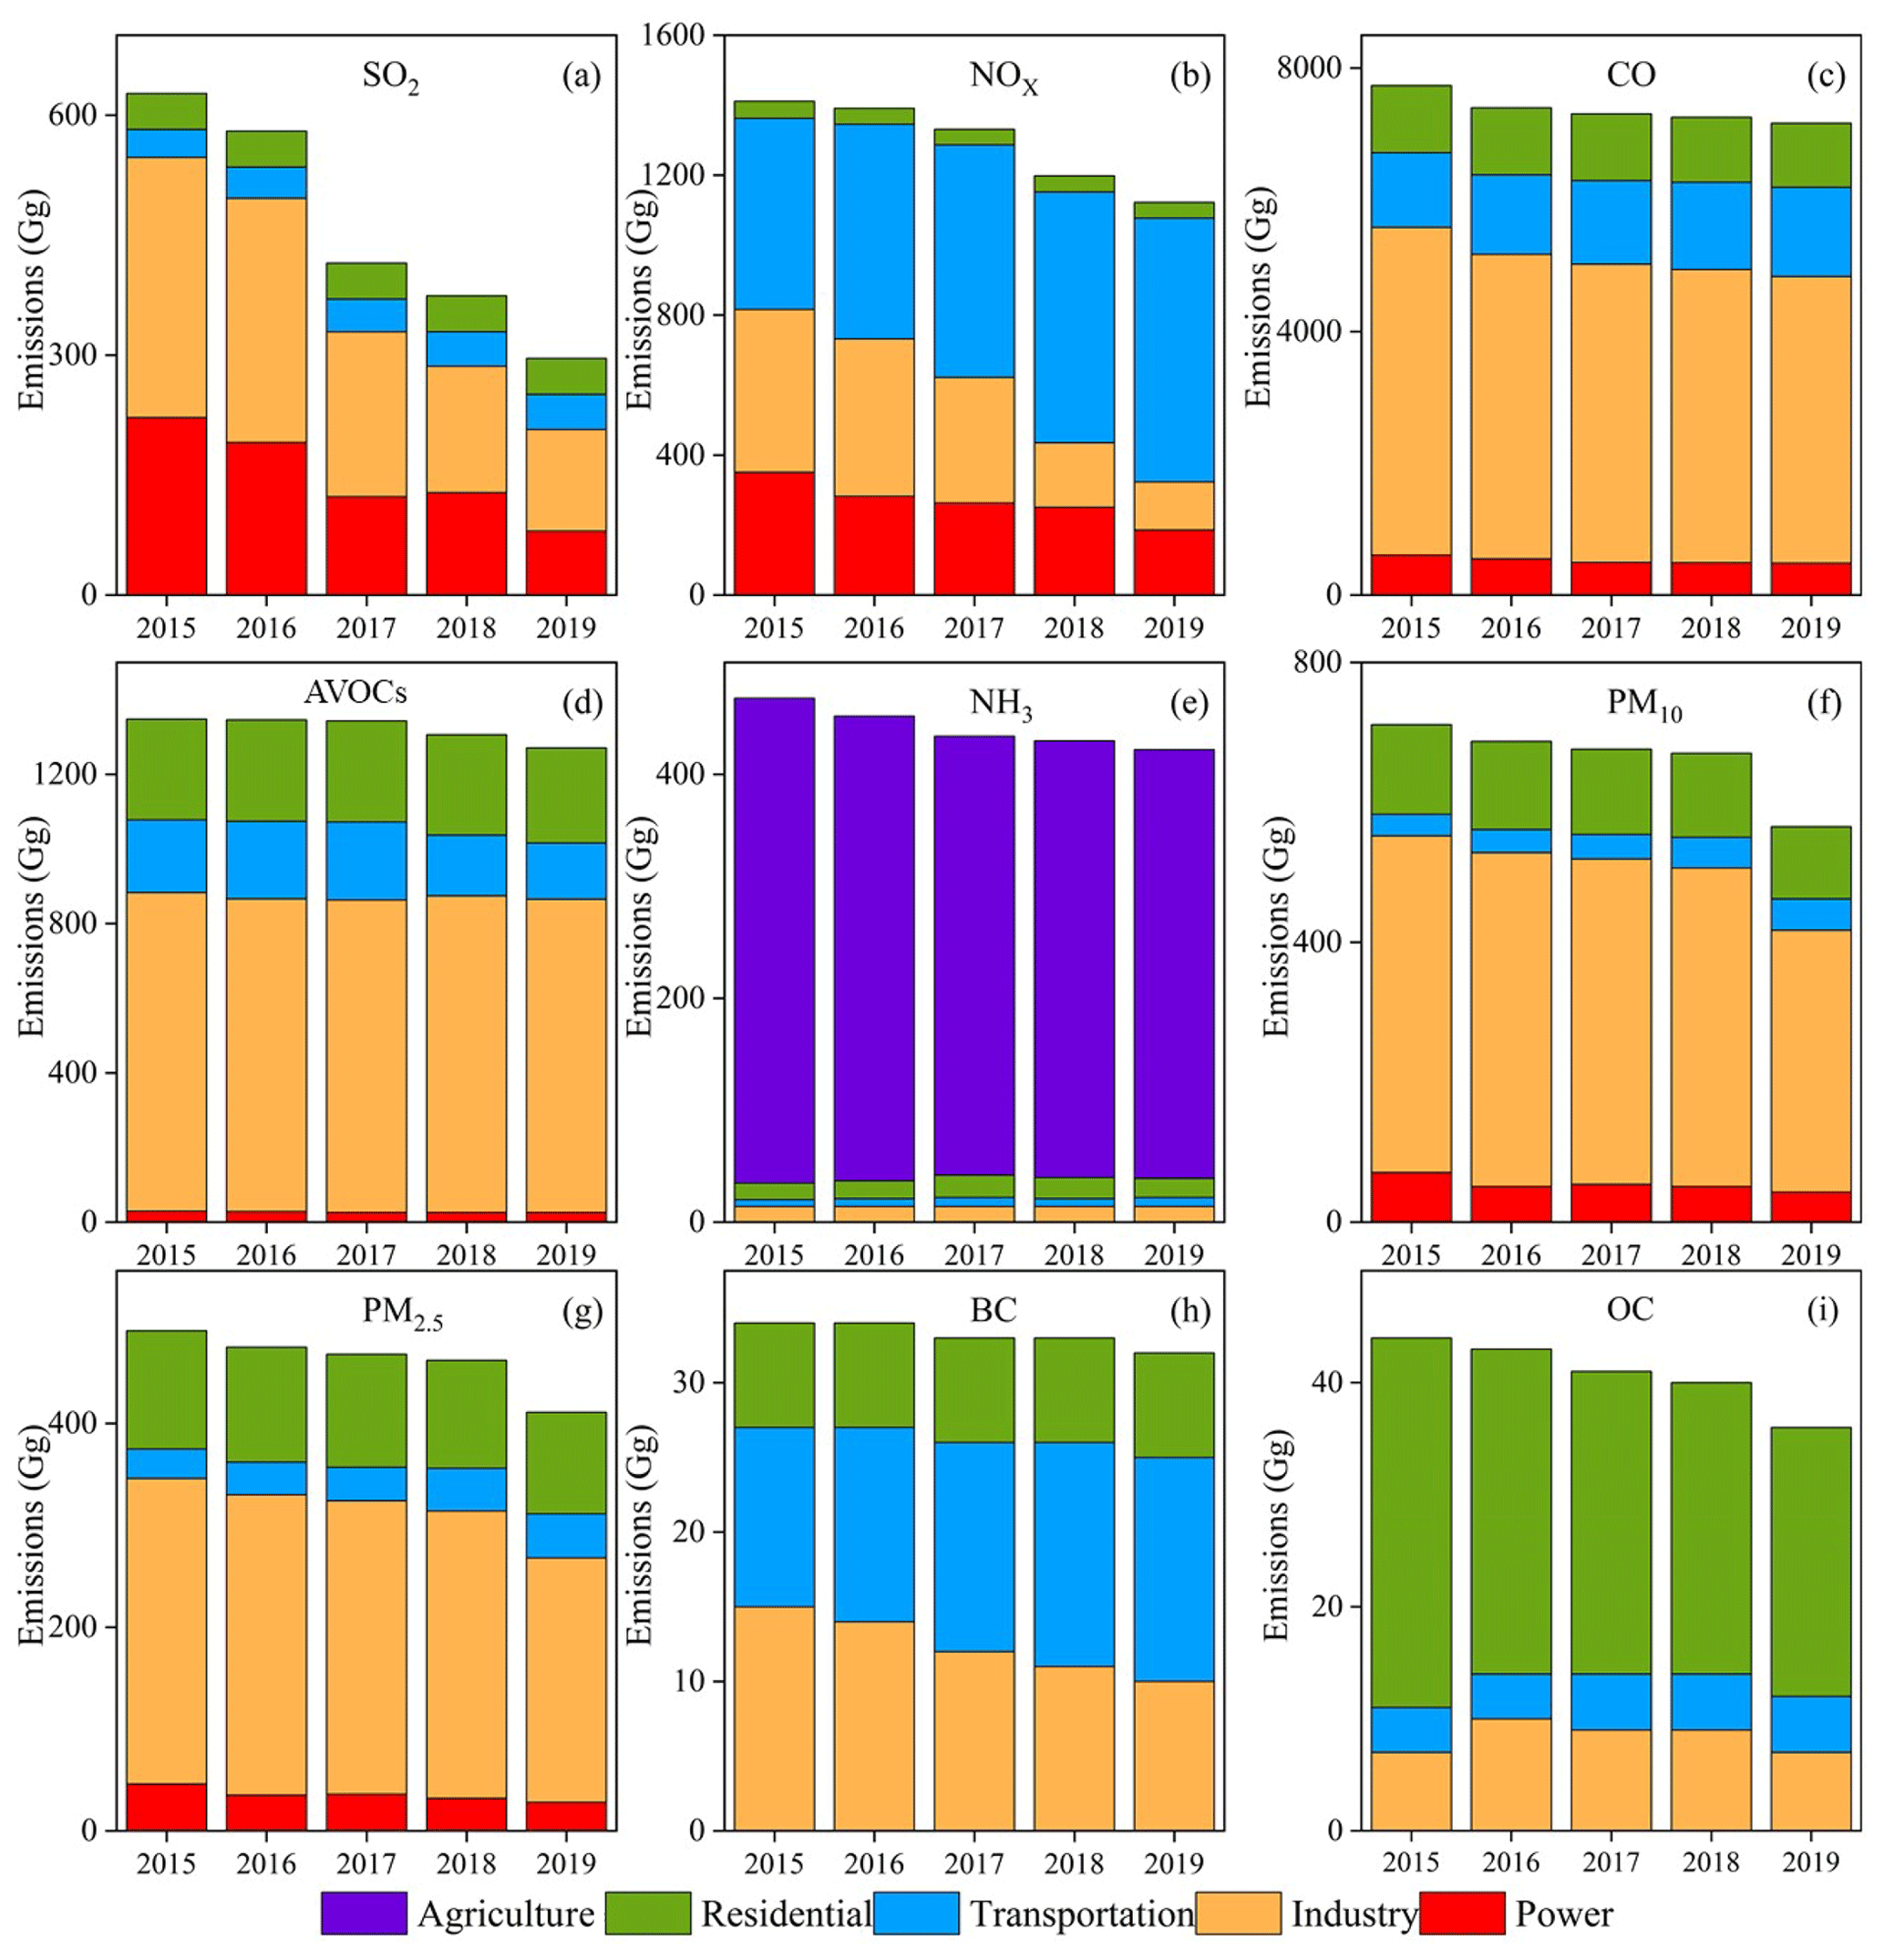
Figure 2Anthropogenic emissions by sector and year. The species include (a) SO2, (b) NOx, (c) CO, (d) AVOCs, (e) NH3, (f) PM10, (g) PM2.5, (h) BC, and (i) OC. Emissions are divided into five sectors: power, industry, transportation, residential, and agriculture.
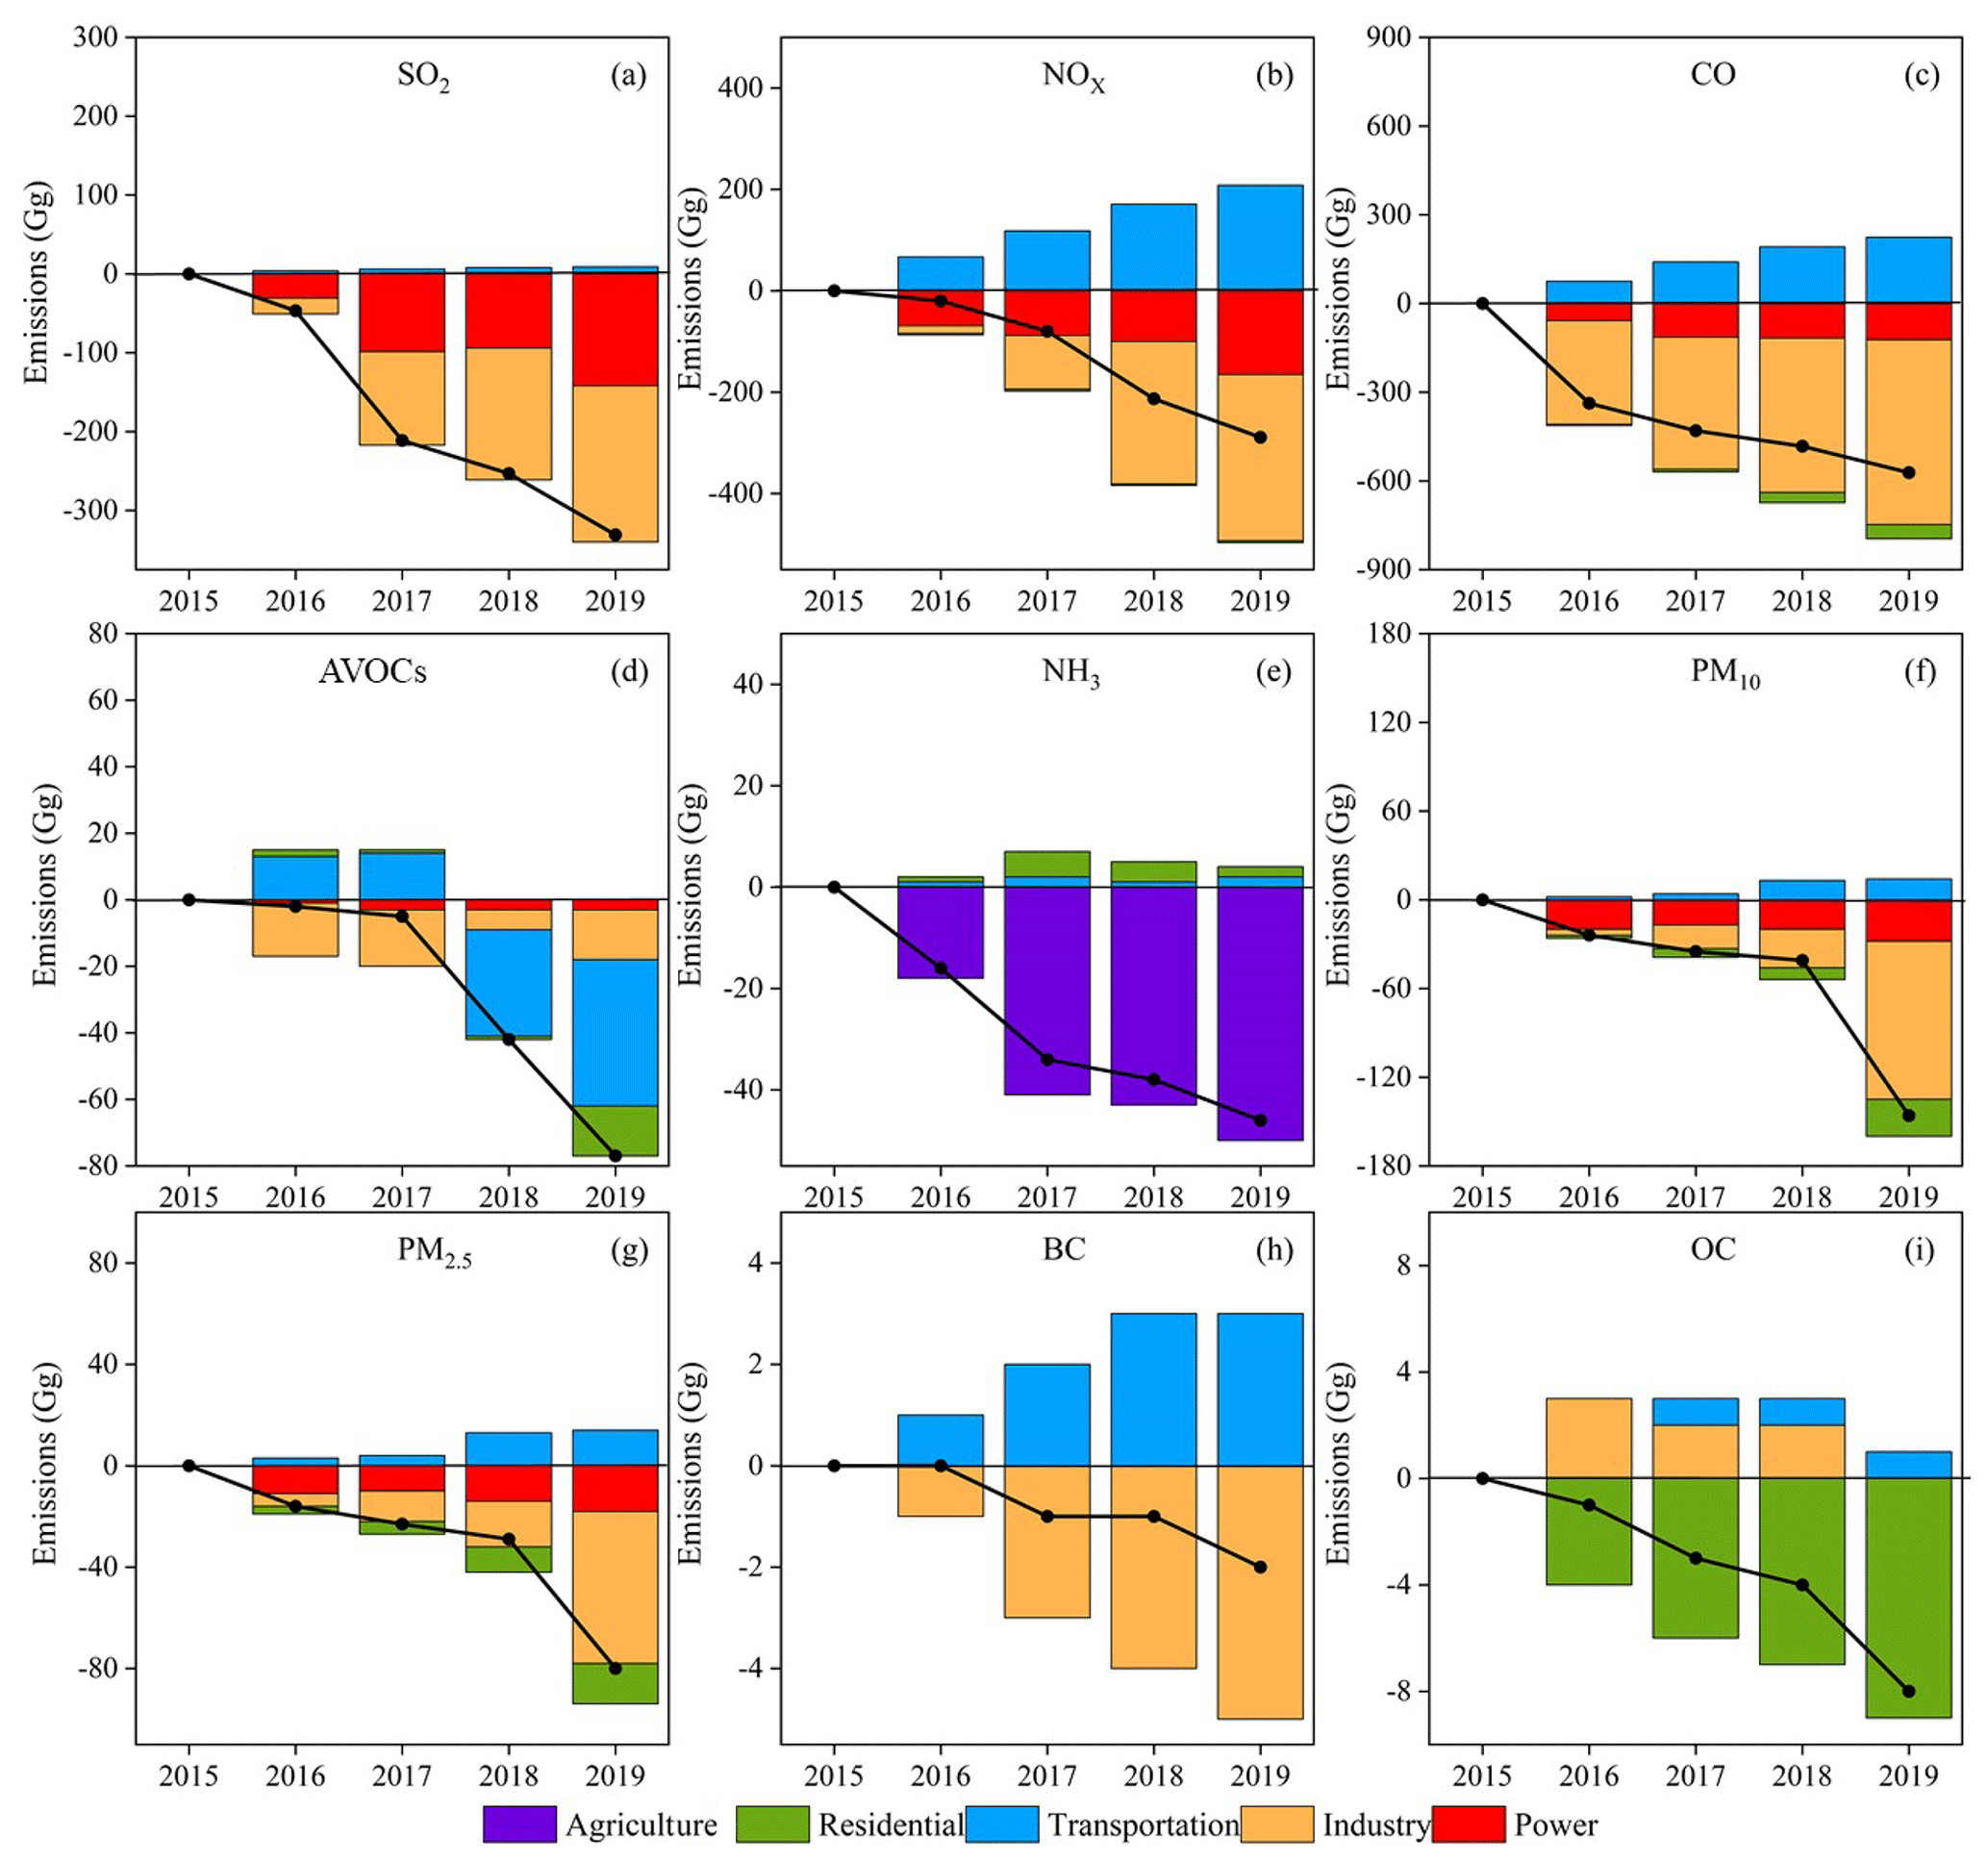
Figure 3Changes in emissions by sector and year. The species include (a) SO2, (b) NOx, (c) CO, (d) AVOCs, (e) NH3, (f) PM10, (g) PM2.5, (h) BC, and (i) OC. The 2015 emissions are subtracted from the emission data for each year to represent the additional emissions compared to 2015 levels.
The power sector, accounting for more than half of provincial coal burning, though, was not the most important contributor to the emissions of any pollutant (Fig. 2). Upgrading the units with advanced APCDs, phasing out outdated boilers, and retrofitting for ultra-low-emission requirement significantly reduced SO2, NOx, and particulate emissions from the power sector (Liu et al., 2015; Y. Zhang et al., 2021). With the completion of the ultra-low-emission retrofit in 2017, the declines of emissions for most species slowed down for the power sector (Fig. 3). The results indicated that the potential for further emission abatement from end-of-pipe controls has been very limited for the sector, unless an energy transition with less coal consumption is sustainably undertaken in Jiangsu.
The transportation sector on average accounted for 51 %, 17 %, 14 % and 42 % of NOx, CO, AVOC, and BC emissions, respectively (Fig. 2b, c, d, and h). The growth of vehicle population resulted in a 38 % increase in the annual NOx emissions from transportation from 2015 to 2019, faster than that of any other sector (Fig. 3b). Similarly, a 20 % and 25 % increase were found for transportation CO and BC emissions (Fig. 3c and h), respectively. Therefore, the rapid development of transportation in economically developed Jiangsu has expanded its contribution to air pollutant emissions for those species, particularly after the emissions from large power and industrial plants have been effectively curbed. However, the implementation of China V emission standard (equal to Euro V; https://publications.jrc.ec.europa.eu/repository/handle/JRC102115, last access: 10 October 2022) for motor vehicles since 2018 has effectively slowed down the growth of transportation NOx emissions: the annual growth rate was estimated to decrease from 12 % for 2015–2017 to 5 % in 2018–2019. Meanwhile, a downward trend was also found for transportation AVOC emissions from 2018 (Fig. 3d). These results show that emission controls for transportation could be crucial for limiting the key precursors of ozone production (Geng et al., 2021; Q. Zhang et al., 2019).
The residential sector was the most important source of OC, contributing on average 68 % to total emissions within 2015–2019 (Fig. 2i), and was the second most important source of PM10 (18 %, Fig. 2f) and PM2.5 (24 %, Fig. 2g). It dominated the abatement of OC emissions, attributed to the reduced bulk coal and straw burning (Fig. 3i). The agricultural sector dominated NH3 emissions (91 %, Fig. 2e), and the small decline resulted mainly from the reduced use of nitrogen fertilizer (13 %) from 2015 to 2019 (Fig. 3e).
It is worth noting that the PM2.5 and OC emissions decreased faster than BC (Fig. 2g–i). As mentioned above, the reduction in primary PM2.5 resulted mainly from the improved energy efficiencies and emission controls in industry and promotion of clean stoves and replacement of solid fuels with natural gas and electricity in residential sources. For OC, in particular, the reduced use of household biofuel and the prohibition of open biomass burning led to considerable emission abatement (18 % from 2015 to 2019). However, the lack of specific APCDs and increasing heavy-duty diesel vehicles partly offset the benefit of emission controls for other sources, resulting relatively small reduction in BC emissions (6 %). Besides the air quality issue, the slower decline of BC than OC raised the regional climate challenge, as the former has a warming impact, while the latter has a cooling one.
3.1.2 City-level emissions and spatial distribution
Figure 4 and Table S5 in the Supplement show the average annual emissions of SO2, NOx, AVOCs, NH3, and PM2.5 for the 5 years by city. In further discussions, we classified the 13 cities in Jiangsu as the southern cities (Nanjing, Zhenjiang, Changzhou, Wuxi, and Suzhou), central cities (Yangzhou, Taizhou, and Nantong), and northern cities (Xuzhou, Suqian, Lianyungang, Huaian, and Yancheng) (their distributions are shown in Fig. S1). Clearly larger emissions of most species were found in southern Jiangsu cities, with more developed industrial economy and transportation (Fig. 4a–e; see the detailed emission data by year in Table S5). The SO2 emissions per unit area were calculated as 7.7, 3.3, and 2.4 t km−2 for the southern, central, and northern cities, respectively. The analogous numbers were 23.0, 11.7, and 8.1 t km−2 for NOx; 22.5, 13.2, and 8.1 t km−2 for AVOCs; and 7.3, 5.2, and 2.9 t km−2 for PM2.5, respectively. As shown in Fig. S3 in the Supplement, the regions along the Yangtze River are of largest densities of power and industrial plants. In contrast, higher NH3 emissions were found for the central and northern cities with abundant agricultural activities (Fig. 4e). Figure S4 in the Supplement illustrates the spatial distributions of emissions for selected species for 2019, at a horizontal resolution of 3 km. Besides industrial sources, the spatial patterns of NOx, BC, CO, and AVOCs were also influenced by the road net, suggesting the role of heavy traffic on emissions. Particulate matter emissions were mainly distributed in urban industrial regions, while OC was more found in the broader central and northern areas, attributed partly to the contribution from residential biofuel use.
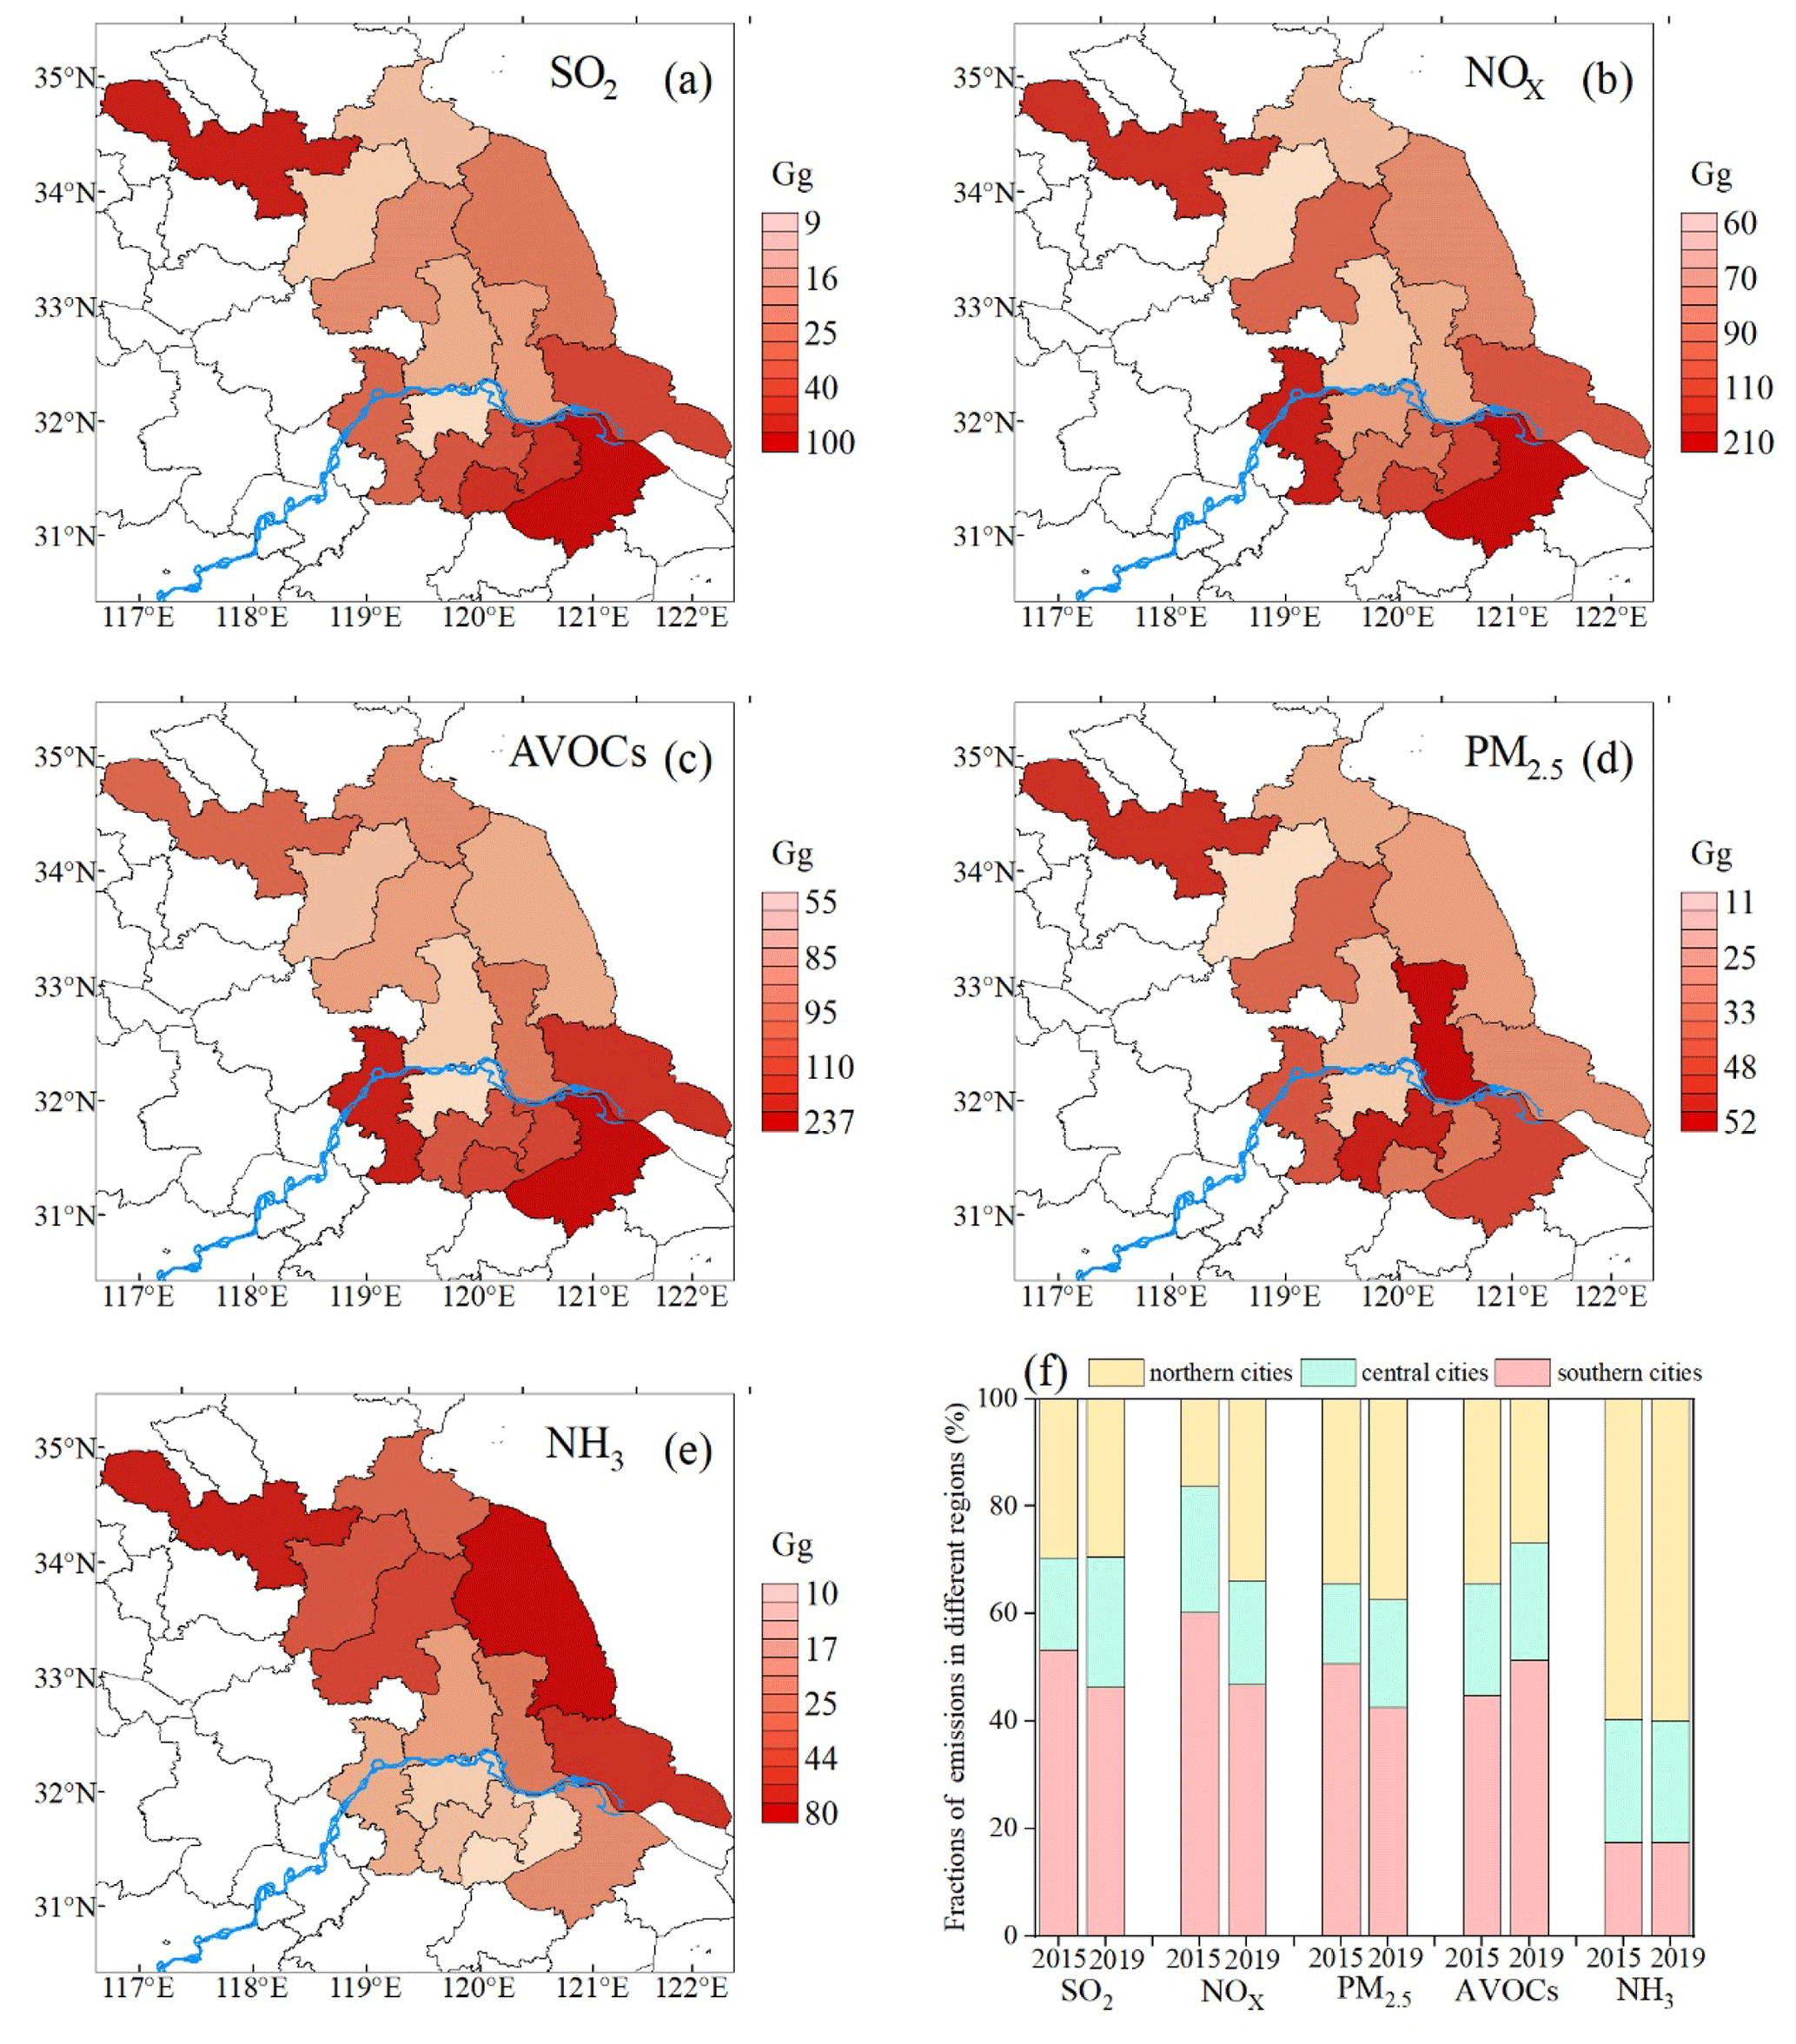
Figure 4The city-level emissions and spatial distribution include (a) SO2, (b) NOx, (c) AVOCs, (d) PM2.5, and (e) NH3. Panel (f) shows the proportions of emission by different regions for 2015 and 2019. The blue line indicates the Yangtze River. The map data provided by Resource and Environment Data Cloud Platform are freely available for academic use (http://www.resdc.cn/data.aspx?DATAID=201, last access: 10 October 2022), © Institute of Geographic Sciences & Natural Resources Research, Chinese Academy of Sciences.
According to Table S5, faster declines in annual SO2, NOx, and PM2.5 emissions for southern cities (59 %, 23 %, and 24 % from 2015 to 2019, respectively) could be found than for northern cities (53 %, 18 %, and 8 %, respectively). In contrast, AVOC emissions were estimated to increase by 10 % in southern cities and decrease by 27 % in northern cities. The fractions of southern cities to the total provincial emissions decreased from 2015 to 2019 except for AVOCs and NH3, indicating more benefits of stringent measures for emission controls for relatively developed regions (Fig. 4f).
Figure 5 illustrates the changes in the spatial distribution of major pollutant emissions from 2015 to 2019 in Jiangsu. It can be found that the areas with large emission reduction for SO2, NOx, and PM2.5 were consistent with the locations of super-emitters of corresponding species (Fig. 5a–c). Facing bigger challenges in air quality improvement, the economically developed region of southern Jiangsu has made more efforts on the emission controls of large-scale power and industrial enterprises and achieved greater emission reduction than the less developed northern Jiangsu. A different pattern in the spatial variation of emissions was found for AVOCs (Fig. 5d). There was a big development of industrial parks for chemical engineering along the riverside of Yangtze River in the cities of Suzhou, Nantong, and Wuxi in southern Jiangsu. The elevated solvent use and output of chemical products of those large-scale enterprises resulted in the growth of AVOC emissions. In northern Jiangsu, in contrast, small-scale chemical plants have been gradually closed, and the emissions were thus effectively reduced. There is a great need for substantial improvement of emission controls for the key regions and sectors for further abatement of AVOC emissions.
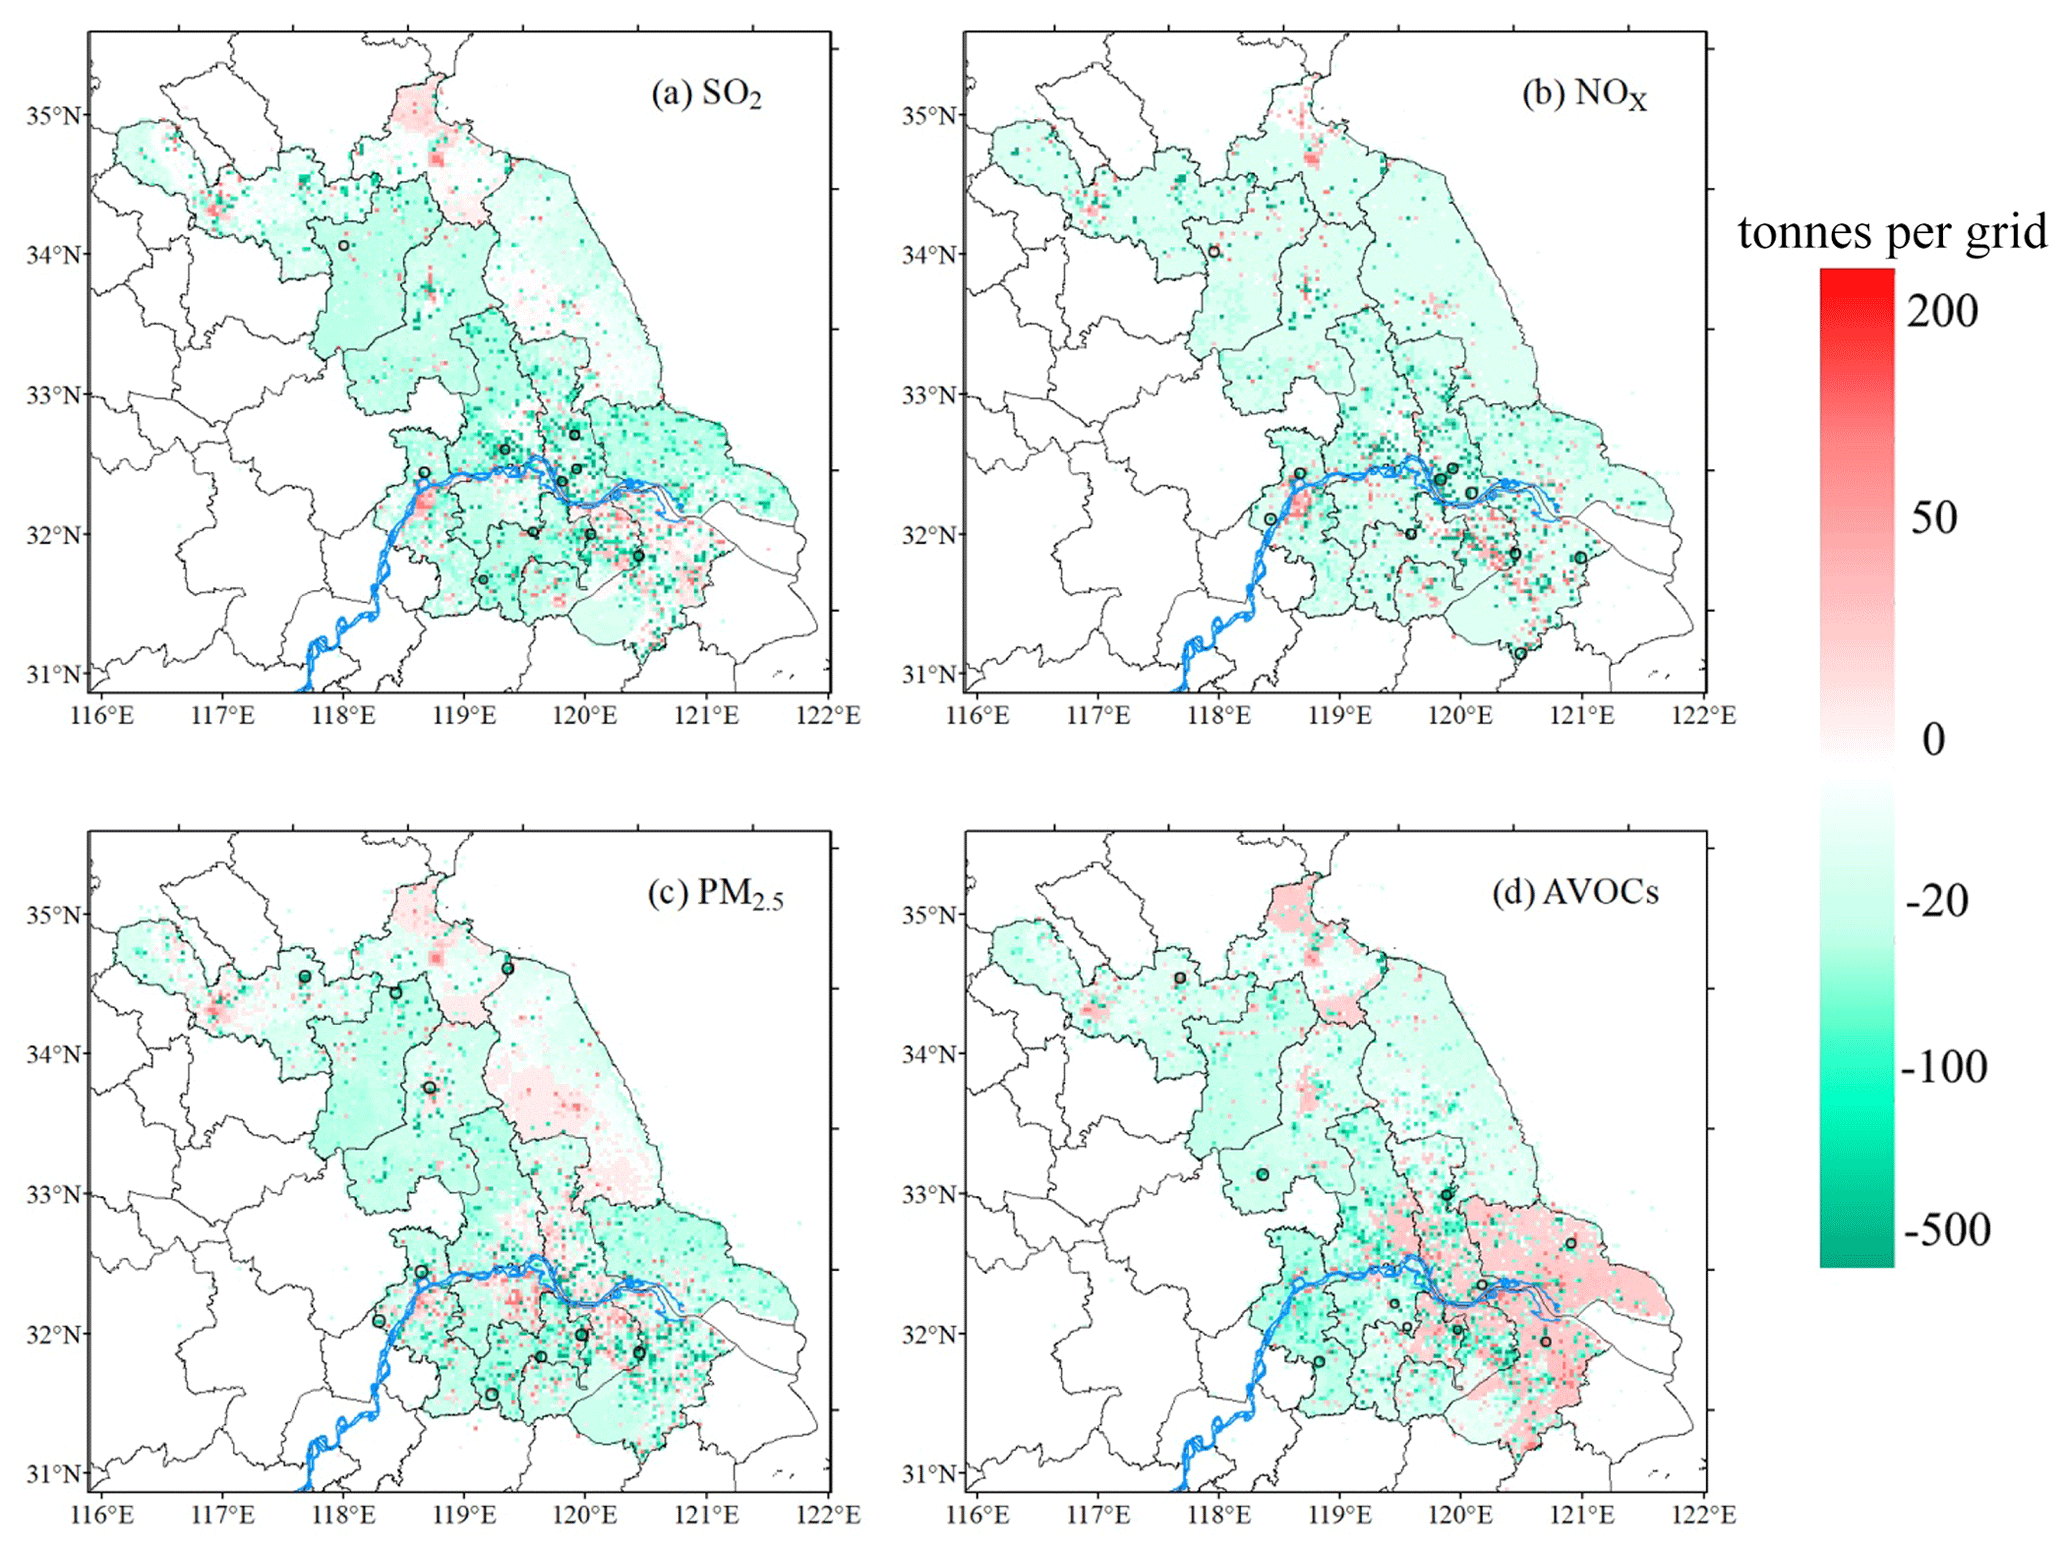
Figure 5Difference in the spatial distribution of major pollutant emissions between 2015 and 2019 for (a) SO2, (b) NOx, (c) PM2.5, and (d) AVOCs. The black circles represent the locations of top 10 emitters for corresponding species in each panel. The blue line indicates the Yangtze River.
3.1.3 Enhanced contribution of biogenic sources to total NMVOCs
Table 1 summarizes AVOC and BVOC emissions by month and year. Different from AVOCs that decreased slowly but continuously from 2015 to 2019, a clear growth of annual BVOC emissions was estimated between 2015 and 2017, followed by a slight reduction till 2019. The peak annual BVOC emissions reached 213 Gg in 2017. The interannual variation of BVOCs was mainly associated with that of temperature and shortwave radiation (Y. Wang et al., 2020). Influenced by meteorological conditions and vegetation growing, BVOC emissions were most abundant in July, less in April and October, and almost zero in January. Within the province, there was a general increasing gradient from southeast to northwest in BVOC emissions (Fig. S5 in the Supplement). The rapid development of industrial economy in southern Jiangsu has led to the expansion of urban centers and less vegetation cover, which limited the BVOC emissions.
Table 1Annual emissions of BVOCs and AVOCs and the ratios of BVOCs to AVOCs.
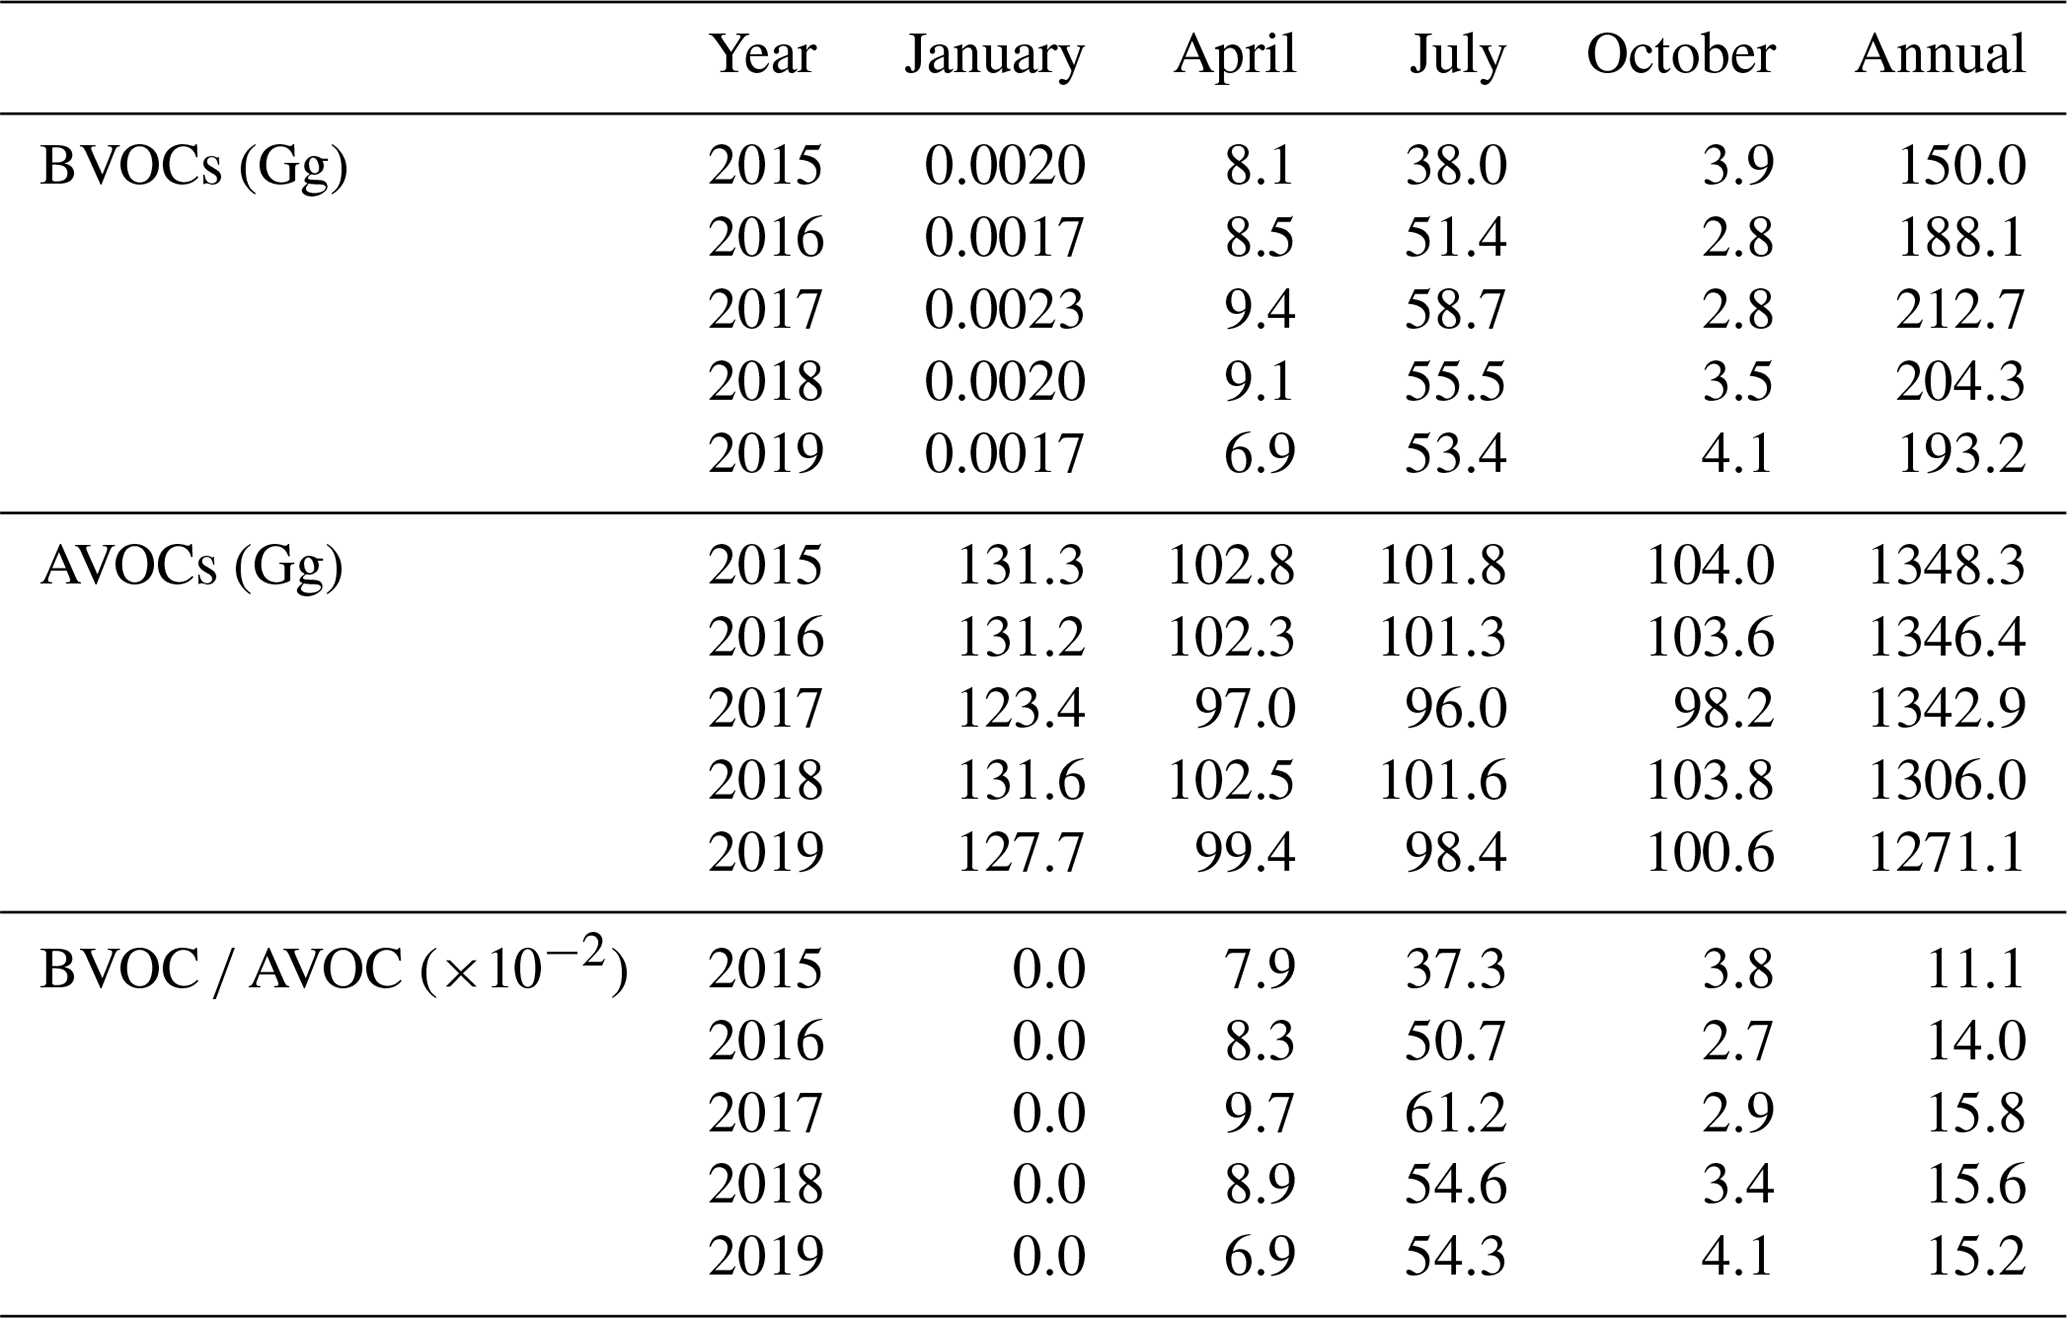
We calculated the ratio of BVOC to AVOC emissions by month and year (Table 1). Dependent on the trends of both BVOC and AVOC emissions, the annual ratio increased from 11.1 × 10⁻² in 2015 to 15.8 × 10⁻² in 2017 and stayed above 15 × 10−2 afterwards. There is also a clear seasonal difference in the ratio, with the averages for the 5 years estimated to be 0 × 10−2, 8 × 10⁻², 52 × 10−2, and 3 × 10⁻² for January, April, July, and October, respectively. Since 2016, the ratio of BVOC to AVOC emissions exceeded 50 × 10−2 in July, indicating that the O3 pollution in summer could be increasingly influenced by BVOCs. Regarding the spatial pattern, larger ratios were commonly found in northern Jiangsu, with a modest growth for recent years (Fig. 6). Moreover, greater growth of the ratio was found in parts of southern Jiangsu, where AVOC emissions were rapidly declining (e.g., Nanjing and Zhenjiang). This evolution indicated that biogenic sources became more influential in O3 production, even for some regions with developed industrial economy, along with controls of anthropogenic emissions. Due to the relatively high level of ambient NO2 from anthropogenic emissions, a broad area of Jiangsu was identified with a mixed or VOC-limited regime in terms of O3 formation (Jin and Holloway, 2015), indicating the impacts of NMVOCs (including BVOCs) on the ambient O3 concentration. In the future, the BVOC emissions may further increase with the elevated temperature, improved afforestation and vegetation protection, and they will probably play a more important role in summer O3 pollution once the controls of AVOC emissions are pushed forward (Ren et al., 2017; Gao et al., 2022a).
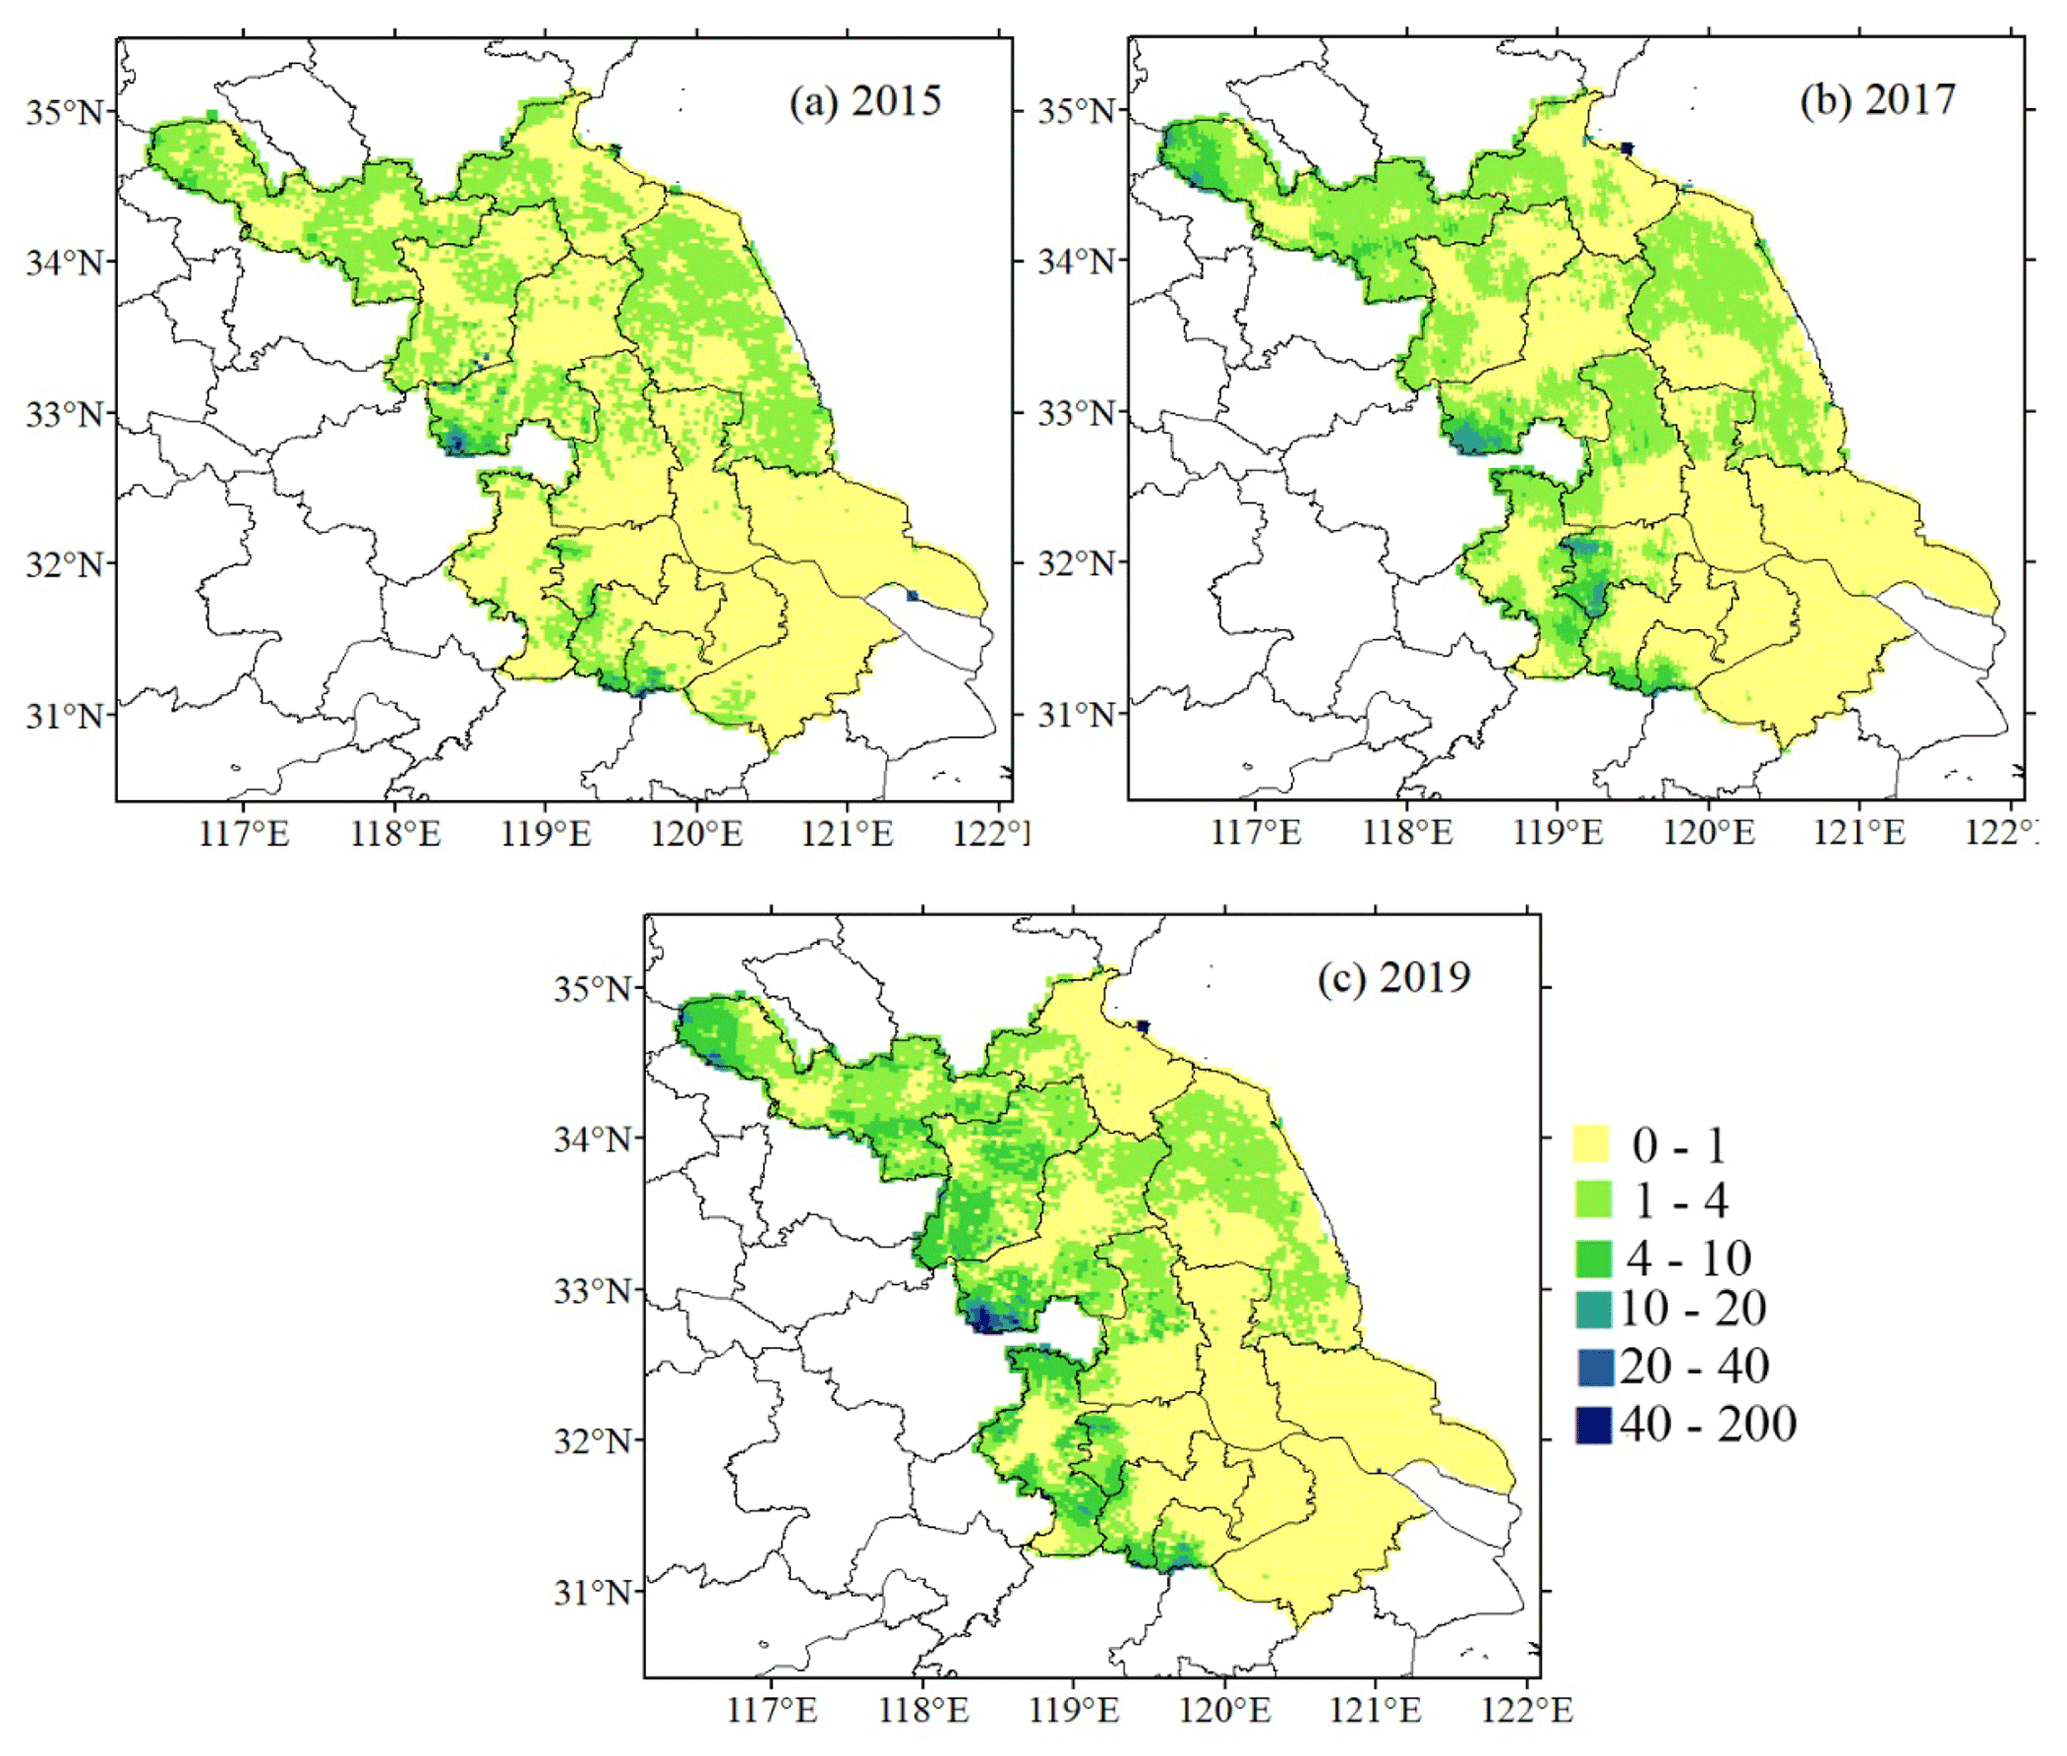
Figure 6The ratios of BVOC to AVOC emissions in July: (a) 2015, (b) 2017, and (c) 2019.
3.2 The comparisons between different emission inventories
3.2.1 Assessment of emission amounts
We compared our provincial-level emission inventory with previous studies on emissions in Jiangsu in terms of the total and sectoral emissions through examinations of activity data, emission factor, removal efficiency, and other parameters. The influence of data and methods on emission estimation was then revealed.
Table 2 compares our emission estimates, by year and species, with available global (EDGAR; Crippa et al., 2020), continental (REAS; Kurokawa and Ohara, 2020), national (MEIC), and regional emission inventories (Li et al., 2018; Sun et al., 2018; X. M. Zhang et al., 2017; Simayi et al., 2019; An et al., 2021; Gao et al., 2022b; J. Yang et al., 2021); official emission statistics of Jiangsu Province (http://sthjt.jiangsu.gov.cn/col/col83555/index.html, last access: 10 October 2022); and an emission estimate with the “top-down” approach, i.e., constrained by satellite observation and inverse chemistry transport modeling (Yang et al., 2019). In particular, we stressed the differences in emissions by sector among our study, MEIC, and An et al. (2021) for 2017 as an example (Fig. 8).
Table 2Air pollutant emissions in Jiangsu and comparison with previous studies.
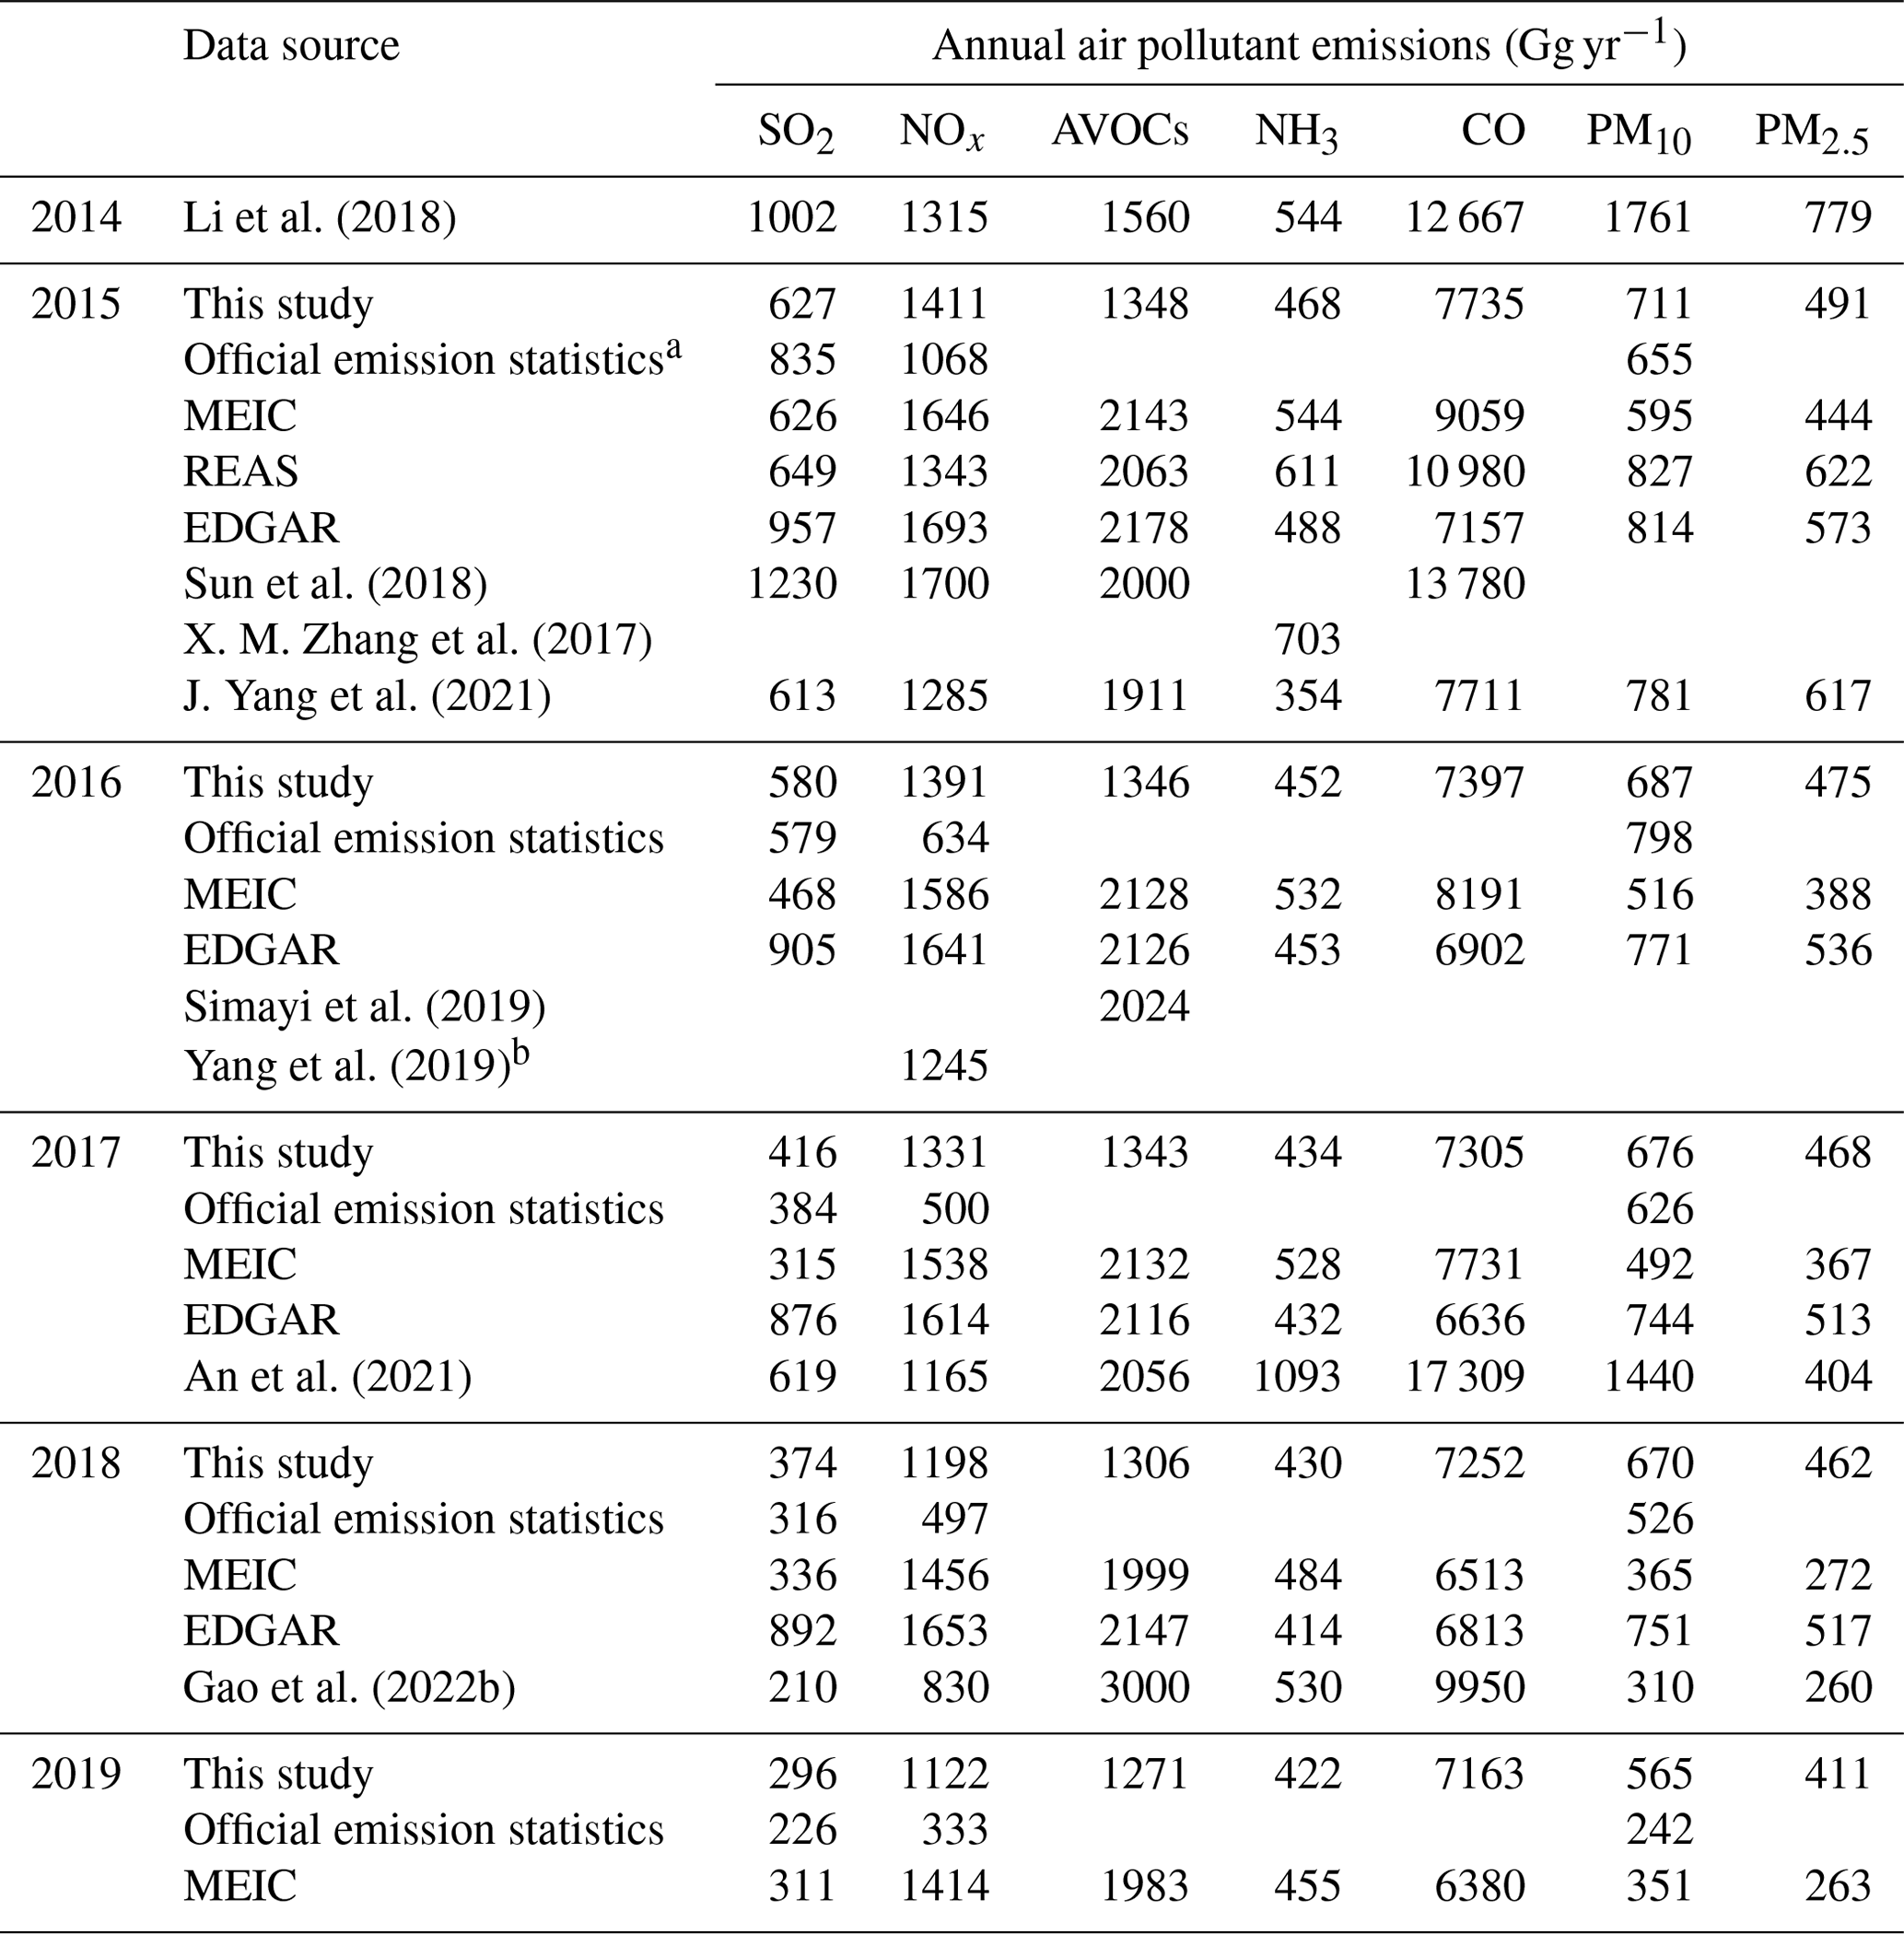
a The data were taken from Department of Ecology and Environment of Jiangsu Province (http://sthjt.jiangsu.gov.cn/col/col83555/index.html, last access: 10 October 2022). b An estimate with the “top-down” methodology, in which the emissions were constrained with satellite observation and inverse modeling.
The annual SO2 emissions in our provincial inventory were close to those in REAS (Kurokawa and Ohara, 2020), MEIC, J. Yang et al. (2021), and official statistics for most years but much smaller than those reported by EDGAR, Sun et al. (2018) and Li et al. (2018). The emissions in this work were 32 % higher than the MEIC for 2017, with the biggest difference (62 % higher in this work) for the power sector (Fig. 8). It results mainly from the discrepancies in the penetration and SO2 removal efficiency of flue gas desulfurization (FGD) systems applied in the two emission inventories. For example, Q. Zhang et al. (2019) assumed that the penetration rate of FGD in the coal-fired power sector reached 99.6 % in 2017, with the removal efficiency estimated to be 95 %. According to our unit-based investigation, the removal efficiencies in the power sector were typically less than 92 %, owing to the aging devices, low flue gas temperature, and other reasons. The main differences between this work and the YRD emission inventory by An et al. (2021) existed in the industrial sector, attributed partly to insufficient consideration of the comprehensive emission control regulations of coal-fired boilers in Jiangsu in the past few years in An et al. (2021).
The estimates of NOx emissions from MEIC, EDGAR, and Sun et al. (2018) were 14 %–38 % higher than ours, while the official statistics were much lower than ours, attributed mainly to the absence of emissions from traffic sources in the statistics. The major difference between MEIC and our provincial inventory existed in the power and industrial sector, and the total emissions in the former were 56 % larger than the latter (Fig. 8). For example, the emission factors for coal-fired power plants in this study were derived from CEMSs (0.03–2.8 g kg−1 coal) and were much smaller than those applied in MEIC and another research (2.88–8.12 g kg−1 coal; Y. Zhang et al., 2021). Similarly, the smaller emission factors for industrial boilers derived based on on-site investigations were commonly smaller than previous studies, leading to an estimation of 45 % smaller than MEIC for industrial sector in 2017. Correspondingly, some modeling and satellite studies suggested that the NOx emissions in previous studies were overestimated partly due to less consideration of improvement in NOx control measures for coal burning sources (Zhao et al., 2018; Sha et al., 2019). Constrained by satellite observation, the top-down estimation by Yang et al. (2019) was 10 % and 22 % smaller than our provincial emission estimation and MEIC for 2016.
As mentioned in Sect. 2.1.2, AVOC emissions for certain industrial sources in this study were estimated with a procedure-based approach, which took the removal efficiencies of different technologies into account (L. Zhang et al., 2021). Therefore, the annual AVOC emissions in the provincial inventory were commonly much smaller than others. Without sufficient the local information, for example, Simayi et al. (2019) applied the national average removal efficiencies of AVOCs in furniture manufacturing, automotive manufacturing, and textile dyeing industries at 18 %, 28 %, and 30 %, clearly lower than 21 %, 42 %, and 43 % in our inventory, respectively. As a result, the AVOC emissions from industrial source in the former were 45 % higher than the latter.
NH3 emissions in the provincial emission inventory were commonly smaller than others. In particular, the estimate was less than half of that by An et al. (2021) for 2017 (Fig. 8). The big difference resulted mainly from the methodologies. As indicated by our previous study (Zhao et al., 2020), the method characterizing agricultural processes usually provided smaller emission estimates than those using the constant emission factors. The former detected the emission variation by season and region and supported air quality modeling with better agreement with ground and satellite observation. Compared with Infrared Atmospheric Sounding Interferometer (IASI) observations, for example, application of the emission inventory characterizing agricultural processes in CMAQ reduced the monthly NMEs of vertical column density of NH3 from 44 %–84 % to 38 %–60 % in different seasons for the YRD region (Zhao et al., 2020).
For PM emissions, our estimates were larger than MEIC, Gao et al. (2022b), An et al. (2021), and official emission statistics but smaller than EDGAR, REAS, and J. Yang et al. (2021a). The discrepancies resulted mainly from the inconsistent penetration rates and removal efficiencies of dust collectors determined at a national level and from on-site surveys at a provincial level. Taking cement as an example, all the plants were assumed to be installed with dust collectors, and the national average removal efficiency was determined at 99.3 % in MEIC (Q. Zhang et al., 2019), clearly larger than that in Jiangsu from plant-by-plant surveys (93 %). The PM10 and PM2.5 emissions from the industrial sector in this study were 197 and 113 Gg higher than MEIC for 2017 (Fig. 8).
3.2.2 Assessment of interannual variability
Figure 7 compares the interannual trends of SO2 and NOx emissions estimated in this study with those in available global (EDGAR) and national emission inventories (MEIC), as well as those of annual averages of ambient concentrations for corresponding species collected from the state-operated observation sites in Jiangsu. Different from other inventories, the global emission inventory EDGAR could not reflect the rapid decline of SO2 and NOx emissions of Jiangsu for recent years. This is probably due to the lack of information on the gradually enhanced penetration and removal efficiencies of APCD use in power and industrial sectors in EDGAR. Therefore, we mainly compared the interannual variability of emissions in our provincial inventory and MEIC.
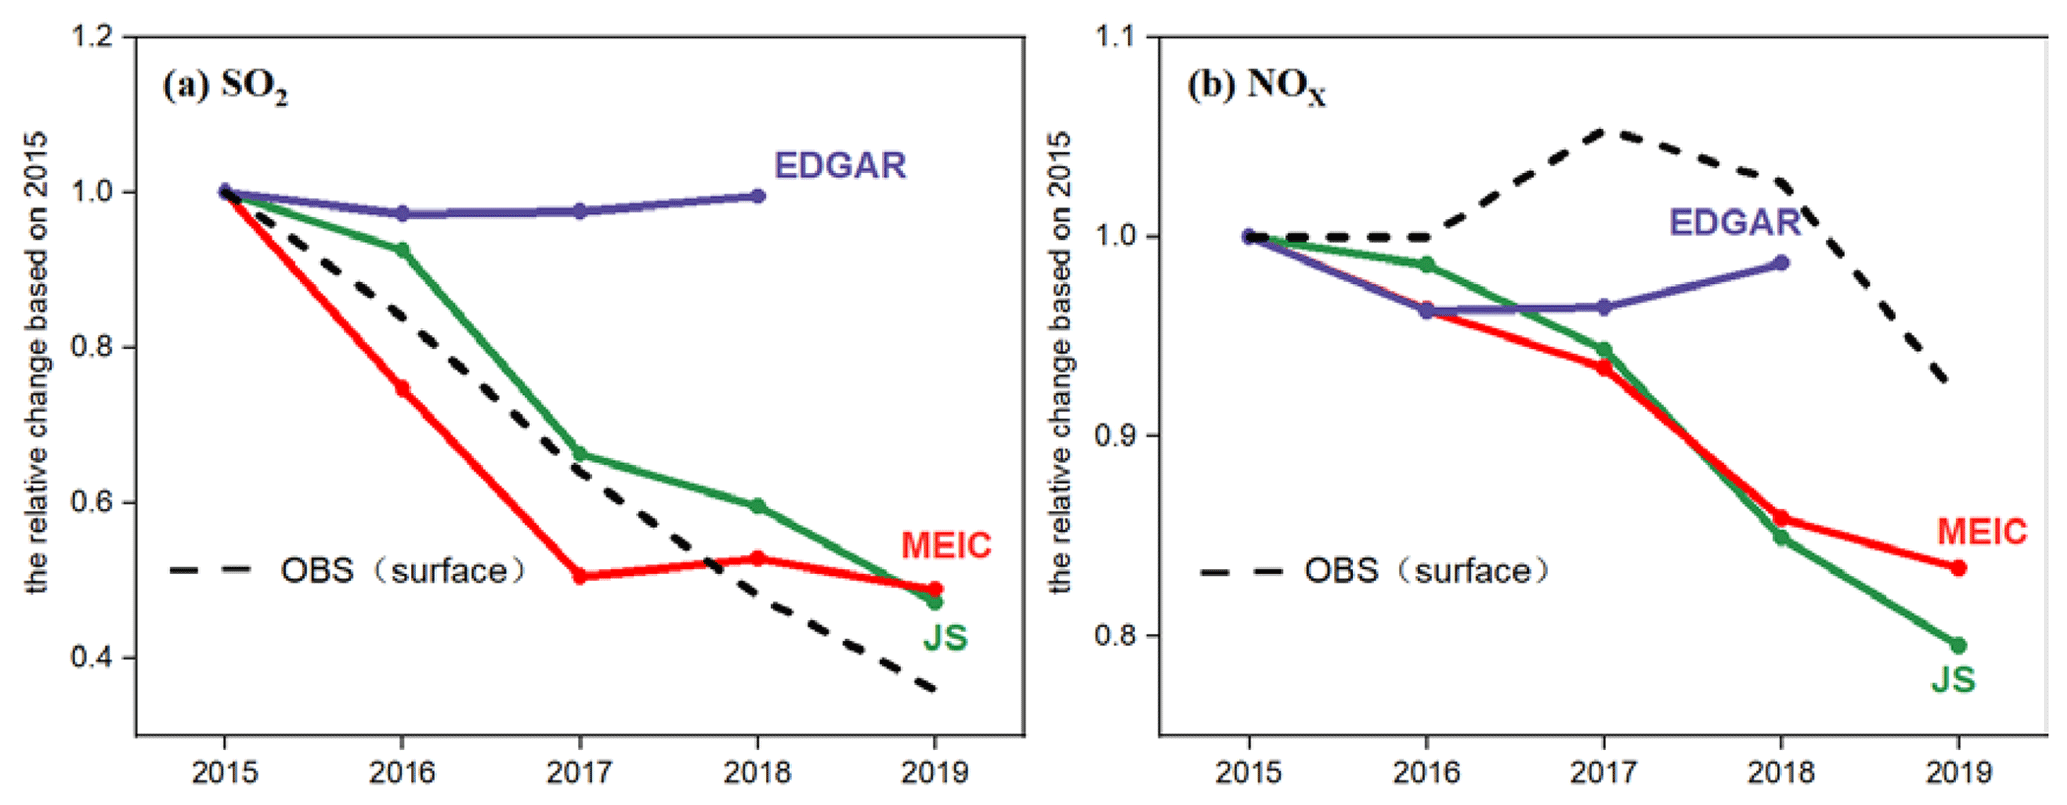
Figure 7Comparison of interannual trends with MEIC, EDGAR, and ground-based observations: (a) SO2 and (b) NOx (NO2).
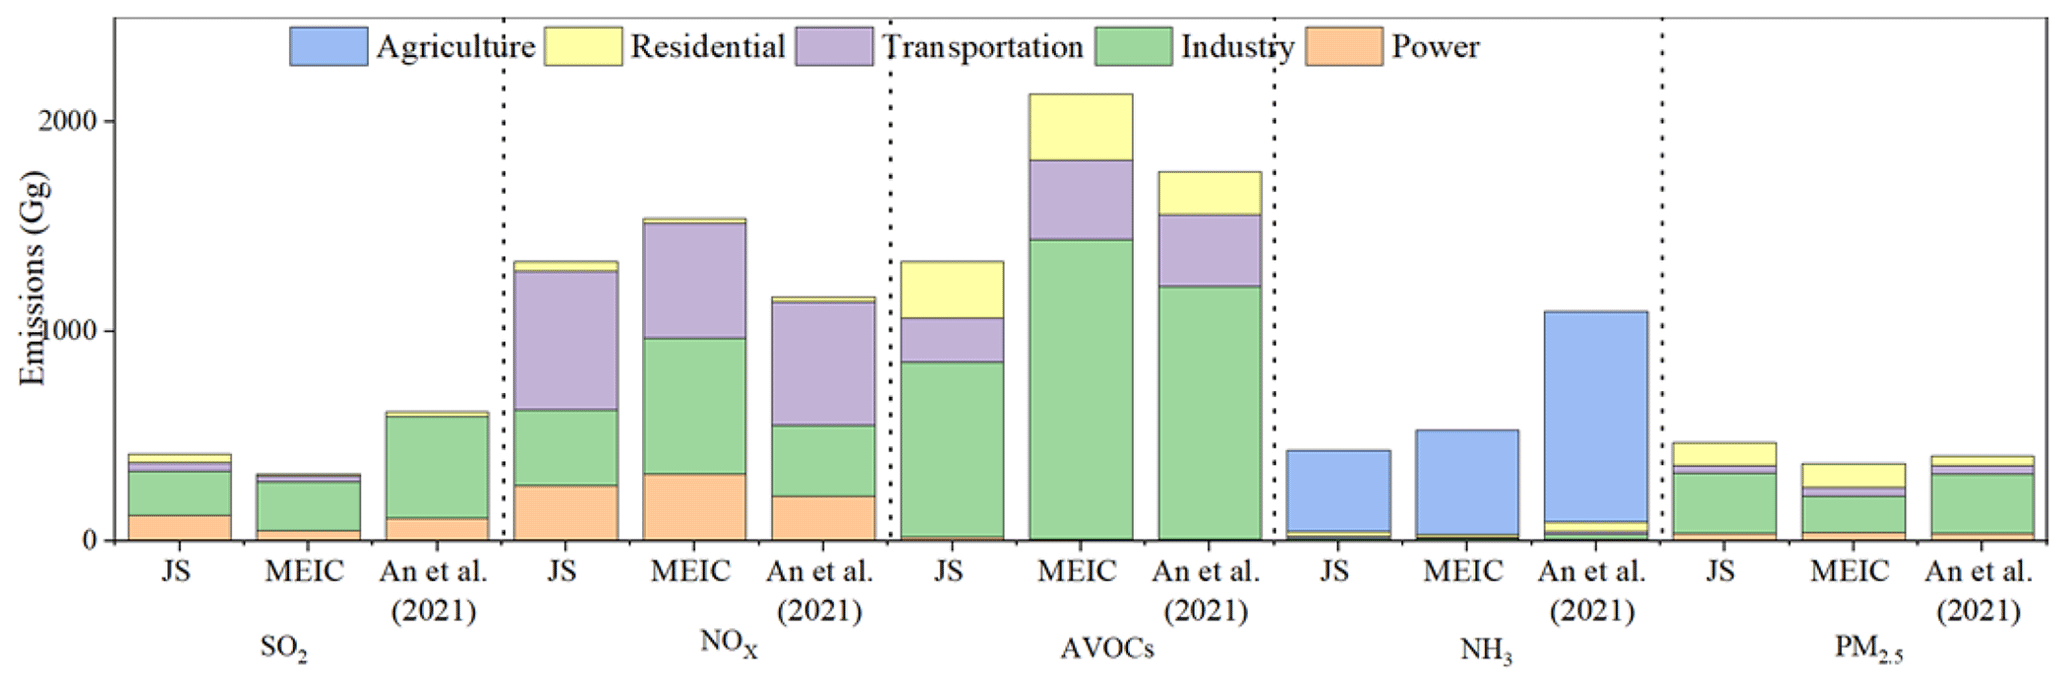
Figure 8Comparison of Jiangsu emissions for 2017 with MEIC and An et al. (2021). The air pollutants from left to right are SO2, NOx, VOCs, NH3, and PM2.5, respectively.
Both MEIC and our provincial inventory show the continuous declines in SO2 and NOx emissions for Jiangsu from 2015 to 2019, which could be partly confirmed by the ground observation. In general, quite similar trends were found for the two inventories, suggesting similar estimations in the interannual variation of total emissions at the national and provincial scales. However, there are some discrepancies between the two. Compared to MEIC, as shown in Fig. 7a, a slower decline in SO2 emissions between 2015 and 2017 was estimated by our provincial inventory but a faster one between 2017 and 2019. In other words, MEIC describes a more optimistic emission abatement for earlier years. The ultra-low-emission retrofit in the power sector started in 2015 in Jiangsu, which was expected to significantly reduce the emissions of coal-fired plants to the level of gas-fired ones. Through investigations and examinations of information on APCD operations for individual sources, we cautiously speculated that the benefit of the retrofit might not be as large as expected at the initial stage. This could be partly supported by the correspondence between online monitoring of SO2 emissions for individual power plants and satellite-derived SO2 columns around them when the ultra-low-emission retrofit was required (Karplus et al., 2018). From 2017 to 2019, we were more optimistic on the emission reduction, attributed partly to the larger benefit of emission controls for non-electric industries. A similar case with less of a discrepancy was also found for NOx emission (Fig. 7b).
3.3 Analysis of driving force of emission change from 2015 to 2019
The actual reductions of annual SO2, NOx, AVOC, NH3, and PM2.5 emissions were estimated to be 331, 289, 77, 46, and 80 Gg from 2015 to 2019, respectively, in our provincial emission inventory. We analyzed the emission abatement and its driving forces for two periods, 2015–2017 and 2017–2019, to represent the different influences of individual measures on emissions for NAPAPCP and TYAPFAP. As shown in Fig. S6 in the Supplement, the actual emission reductions of SO2 and NH3 during 2015–2017 (211 and 34 Gg respectively) exceeded those during 2017–2019 (120 and 12 Gg, respectively). As the retrofit of ultra-low-emission technologies for the power sector and the modification of large-scale intensive management of livestock farming in Jiangsu were basically completed between 2015 and 2017, the reductions of annual NOx, AVOC, and PM2.5 emissions during 2017–2019 were much larger (209, 72, and 57 Gg, respectively) than those during 2015–2017 (80, 5, and 23 Gg, respectively), implying bigger benefits of TYAPFAP for emission controls of those species.
Figure 9 summarizes the effect of individual measures on net emission reduction for the two periods. There were some common measures for SO2, NOx, and PM2.5 emission controls; thus, they are further discussed together below. During 2015–2017, the ultra-low-emission retrofit of coal-fired power plants was identified to be the most important driving factor for the reductions of SO2 and NOx emissions, responsible for 38 % and 43 % of the abatement for the two species, respectively. By the end of 2017, more than 95 % of the coal-fired power plants in Jiangsu were equipped with FGD and selective catalytic reduction/non-catalytic reduction (SCR/SNCR), and 91 % of coal-fired power generation capacity met the ultra-low-emission standards (35, 50, and 10 mg m−3 for SO2, NOx, and PM concentration in the flue gas, respectively; Q. Zhang et al., 2019). Through the information cross-check and incorporation based on different emission source databases as mentioned in Sect. 2.1.3, the average removal efficiencies of SO2 and NOx in the coal-fired power plants were estimated to increase from 89 % and 50 % in 2015 to 94 % and 63 % in 2017, respectively.
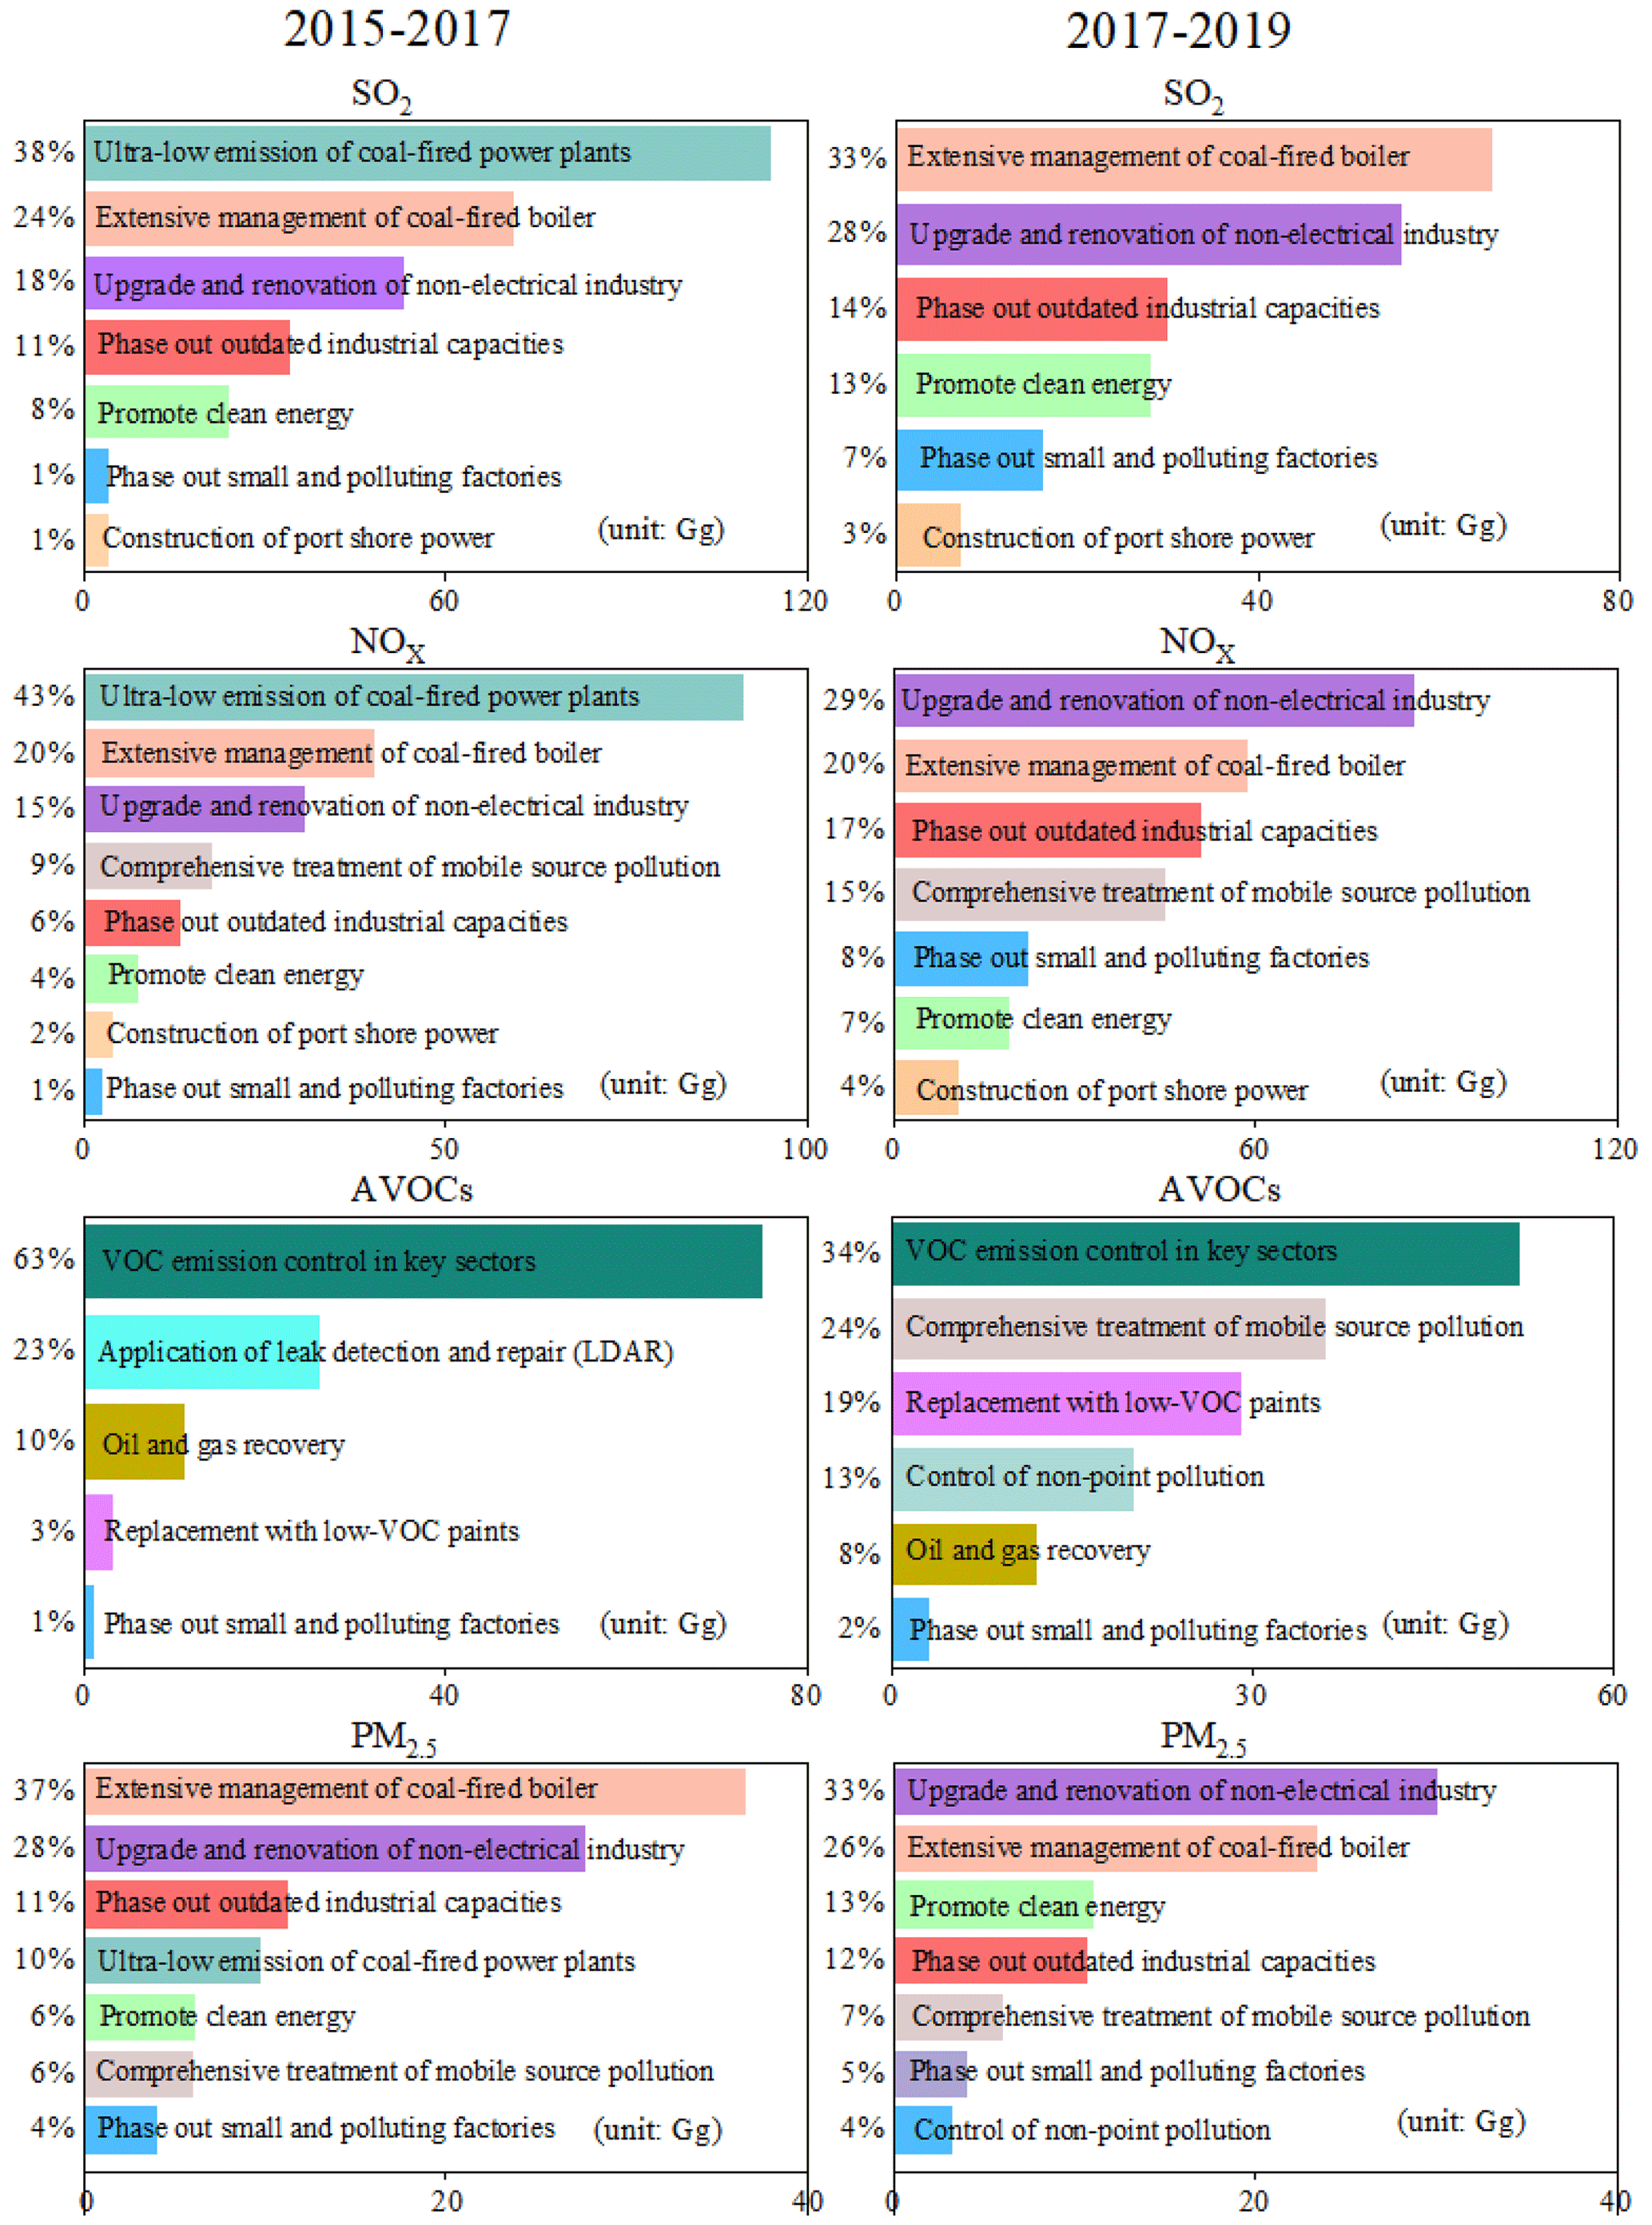
Figure 9Contributions of individual measures to emission reductions in SO2, NOx, VOCs, and PM2.5 for 2015–2017 (the left column) and 2017–2019 (the right column).
The extensive management of coal-fired boilers was the second most important driver for SO2 and NOx reduction and the most important driver for PM2.5, contributing to 24 %, 20 %, and 37 % of the emission reductions for corresponding species, respectively. The main actions included the elimination of 100 MW of coal-fired power generation capacity and the enhanced penetration of SO2 and particulate control devices on large coal-fired industrial boilers since the improved enforcement of the latest emission standard (GB 13271-2014).
The upgrade and renovation of non-electrical industry contributed 18 %, 15 %, and 28 % to the emission reductions for SO2, NOx, and PM2.5, respectively. Till 2017, more than 80 % of steel-sintering machines and cement kilns were equipped with FGD and SCR/SNCR systems. The average removal efficiency in the steel and cement production increased from 48 % and 43 % in 2015 to 60 % and 57 % in 2017 for SO2, and from 45 % and 38 % in 2015 to 54 % and 40 % in 2017 for NOx, respectively (as shown in Fig. S7 in the Supplement).
Phasing out outdated capacities in key industries including crude steel (8×10⁶ t), cement (9×10⁶ t), flat glass (3 million weight boxes), and other energy-inefficient production capacity contributed 11 %, 6 %, and 11 % to the emission reductions of corresponding species, respectively. Given their relatively small proportions to total emissions, the contributions of other emission reduction measures were less than 10 %, such as promoting clean energy, phasing out small and polluting factories, and the construction of port shore power.
The driving forces of emission abatement have been changing for the three species since the implementation of TYAPFAP. The potential for further reduction of SO2 and NOx emissions was narrowed through the end-of-pipe treatment in the power sector, and the ultra-emission retrofit on the sector was of very limited influence on the emissions during 2017–2019. Measures on the non-electric sector brought greater benefits for emission reduction. Extensive management of coal-fired boilers and upgrade and renovation of non-electrical industry remained the most important driving factors for the reduction of SO2, NOx, and PM2.5 emissions (33 %, 20 %, and 26 % for the former and 28 %, 29 %, and 33 % for the latter, respectively). After 2017, small coal boilers (≤30 MW) were continuously shut down, and remaining larger ones (≥60 MW) were all retrofitted with ultra-low-emission technology. Through the ultra-low-emission retrofit, the average removal efficiencies of NOx in the steel and cement production increased from 54 % and 40 % in 2017 to 70 % and 61 % in 2019, respectively.
Regarding AVOCs, the emission reduction resulted mainly from the implementation of controls on the key sectors, which accounted for 63 % and 34 % of the reduced emissions for 2015–2017 and 2017–2019, respectively. Besides, the application of LDAR was the second most important measure for 2015–2017, with the contribution to emission reduction reaching 23 %. The results also showed that AVOC emission reductions from all the concerned measures in 2017–2019 (152 Gg) were higher than those in 2015–2017 (116 Gg). Although more abatement in total AVOC emissions was found for 2017–2019 (Fig. S6), the contributions of the two above-mentioned measures reduced clearly in the period. Some other measures were identified to be important drivers of emission reduction, including control of mobile sources (e.g., implementation of the China V emission standard for on-road vehicles) and replacement with low-VOC paints. In our recent studies, we evaluated the average removal efficiency of AVOCs in the industrial sector to be less than 30 % (L. Zhang et al., 2021), and organic solvents with a low-VOC content accounted for less than 30 % of total solvent use (Wu et al., 2022). Therefore, there is still great potential for further reduction of AVOC emissions through improvement on the end-of-pipe emission controls and use of cleaner solvents.
In summary, expanding the end-of-pipe treatment (e.g., the ultra-low-emission retrofit) from power to non-electricity industry and phasing out the outdated industrial capacities have driven the declines of emissions for most species. Along with the limited potential for current measures, more substantial improvement of energy and industrial structures could be the option for further emission reduction in the future.
3.4 Effectiveness of emission controls for the changing air quality
3.4.1 Simulation of the O3 and PM2.5 concentrations
The CMAQ model performance was evaluated with available ground observation. The observed concentrations of PM2.5 (hourly) and O3 (the maximum daily 8 h average, MDA8) were compared with the simulations using the provincial emission inventory and MEIC for the 4 selected months for 2015–2019, as summarized in Tables S6 and S7 in the Supplement. Overall, the simulation with the provincial inventory shows acceptable agreement with the observations, with the annual means of NMB and NME ranging −21 % to 2 % and 43 % to 52 % for PM2.5 and −26 % to −14 % and 30 % to 41 % for O3. The analogous numbers for MEIC were −23 % to −5 % and 47 % to 53 % for PM2.5 and −26 % to −6 % and 33 % to 46 % for O3, respectively. Most of the NMBs and NMEs were within the proposed criteria (−30 % ≤ NMB ≤ 30 % and NME ≤ 50 %; Emery et al., 2017). Better performance was achieved using the provincial inventory, implying the benefit of applying refined emission data for high-resolution air quality simulation.
Besides O3 and PM2.5, better model performances were also found for SO2 and NO2 with the provincial emission inventory than MEIC, as shown in Table S8 in the Supplement. For 2017, the monthly NMB and NME ranged −38 % to −24 % and 43 % to 53 % for SO2 and 22 % to 40 % and 38 % to 61 % for NO2. The analogous numbers for MEIC were 35 % to 68 % and 84 % to 114 % for SO2 and 50 % to 133 % and 65 % to 138 % for NO2, respectively (unpublished data provided by MEIC development team, Tsinghua University).
Figure 10 compares the observed and simulated (with the provincial inventory) interannual trends in PM2.5 and MDA8 O3 concentrations from 2015 to 2019 (see the simulated spatiotemporal evolution in Figs. S8 and S9 in the Supplement). Satisfying correlations between observed and simulated concentrations were found for both PM2.5 and MDA8 O3, with the squares of correlation coefficients (R2) estimated to be 0.81 and 0.86 within the research period, respectively. The good agreement suggests the simulation with high-resolution emission inventory was able to capture the interannual changes in air quality well at the provincial scale.
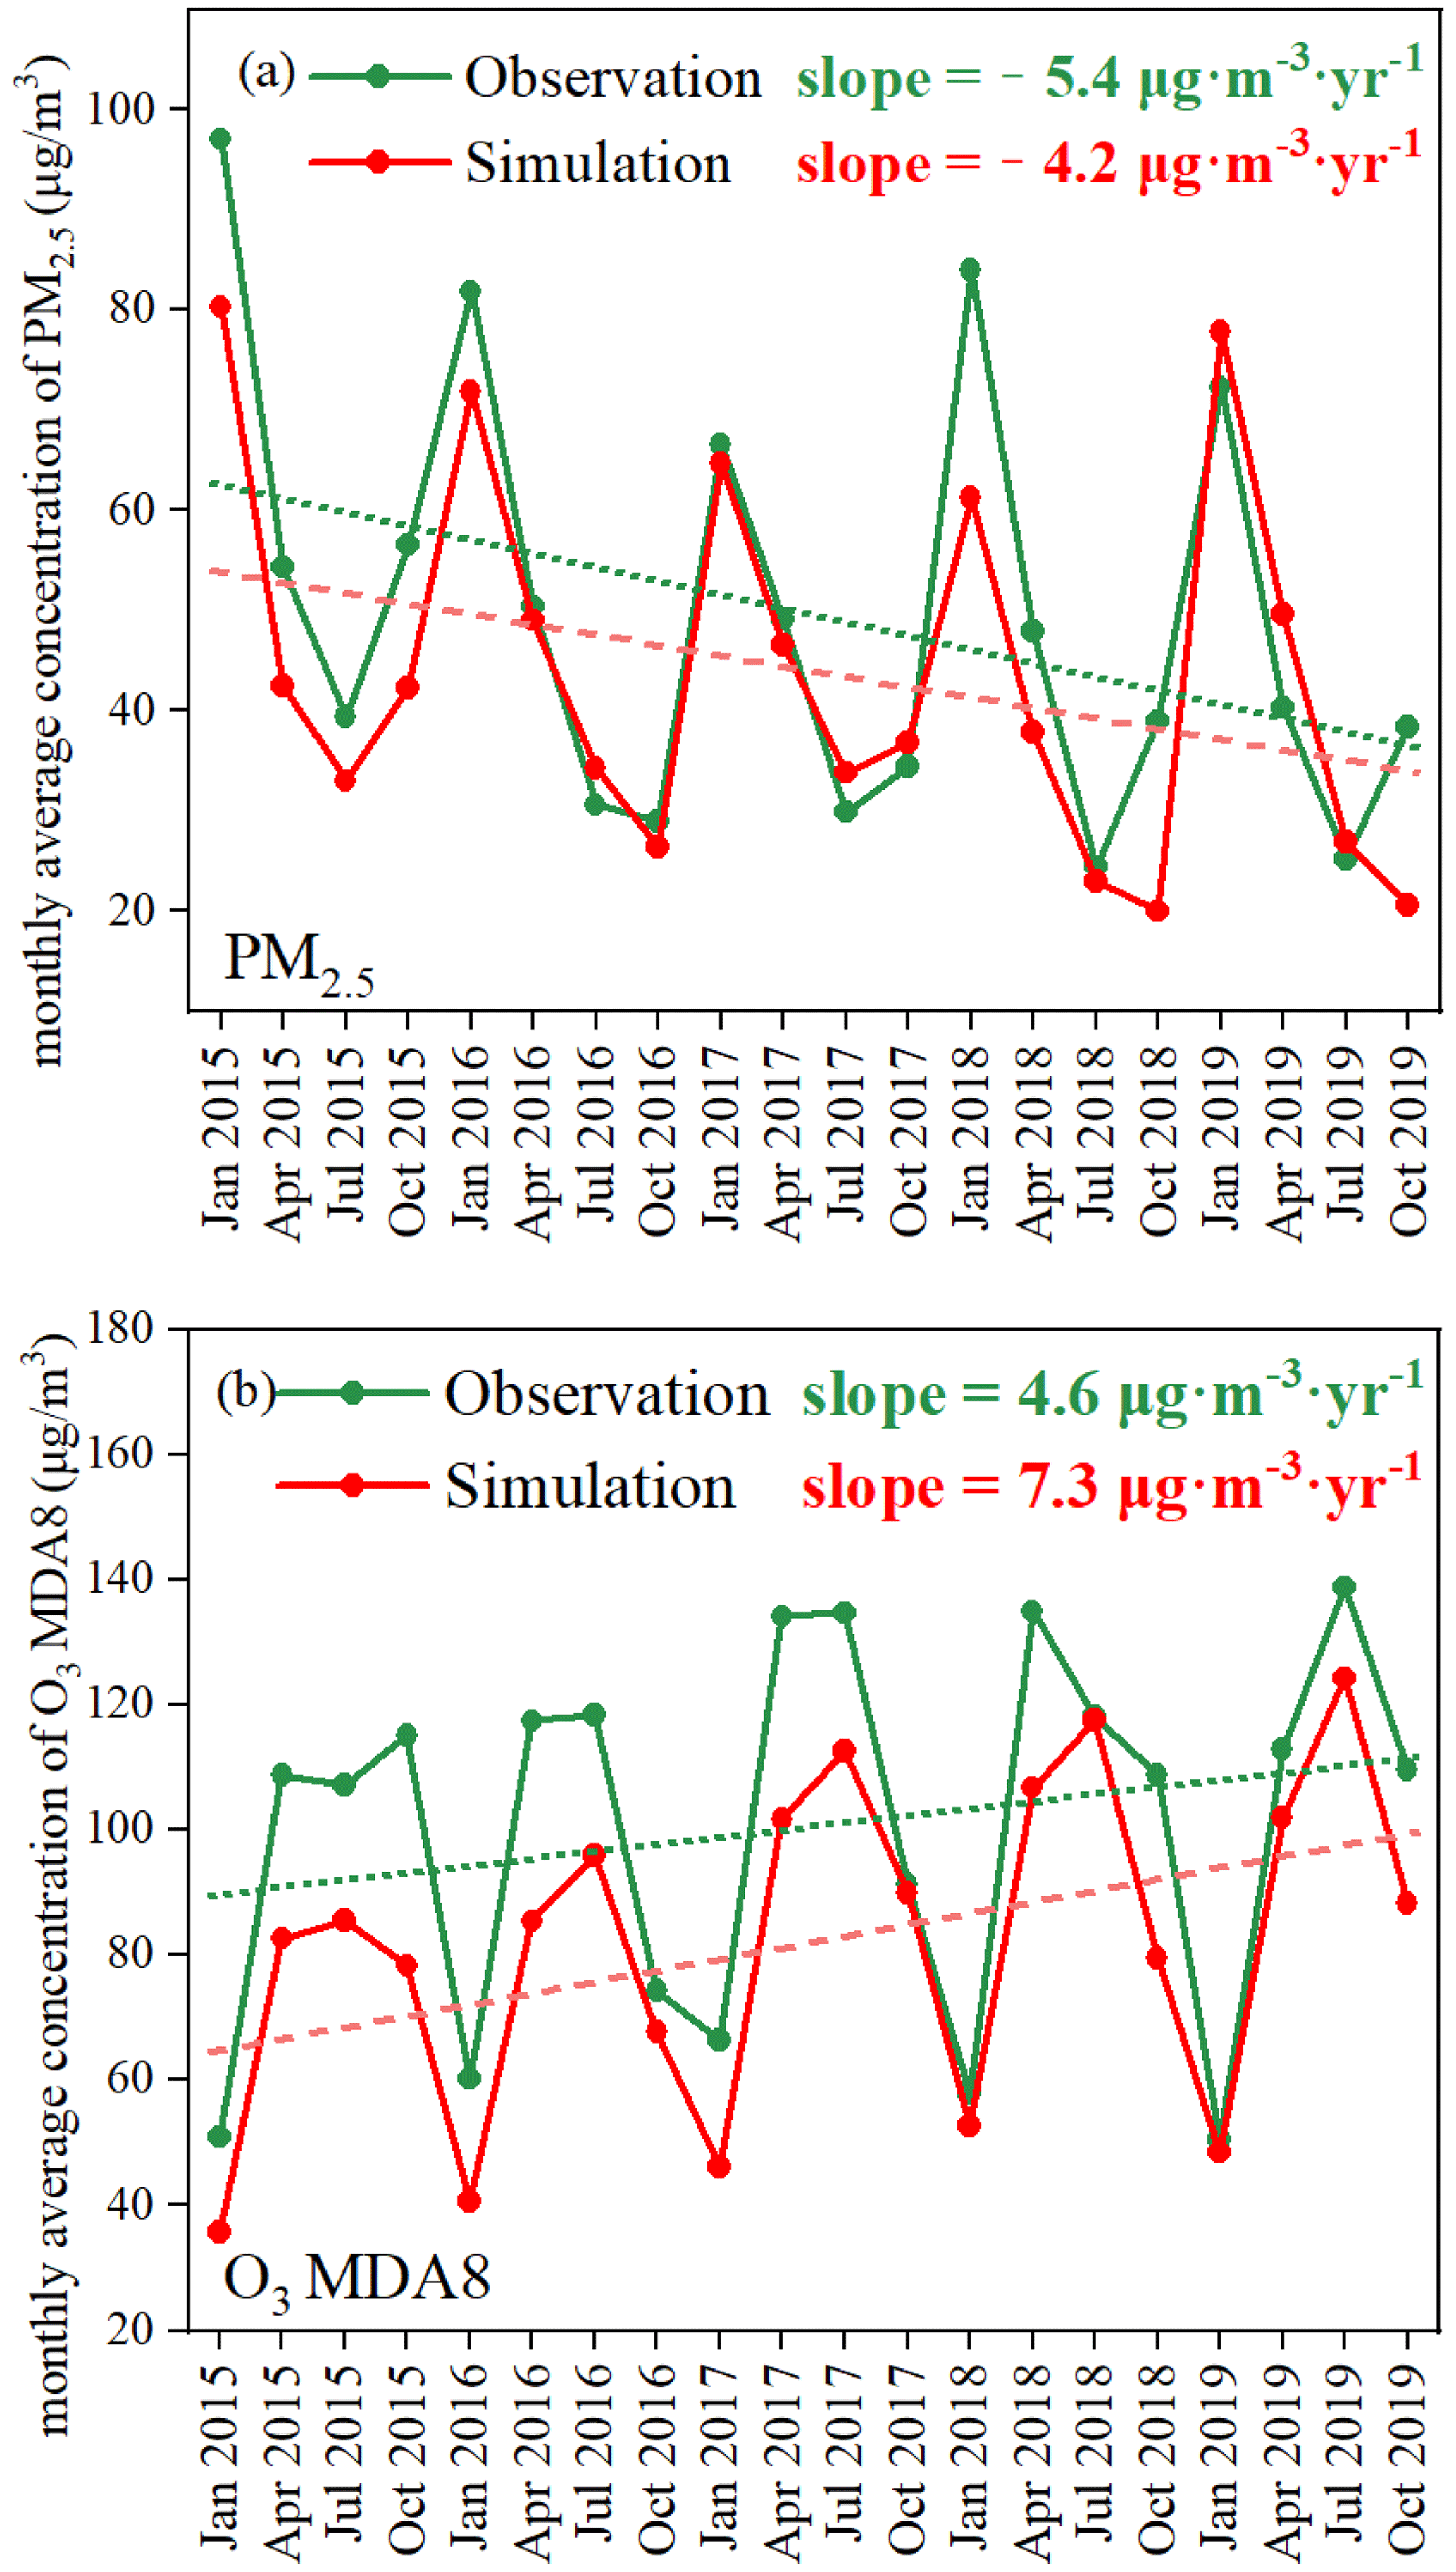
Figure 10The monthly averages of (a) PM2.5 and (b) MDA8 O3 from CMAQ simulation and ground observation for January, April, July, and October from 2015 to 2019. The slopes of linear regressions in the panels indicate the annual variation rates for corresponding species.
Both observations and the simulation indicated a declining trend of PM2.5 concentrations, with the annual decreasing rates estimated to be −5.4 and −4.2 µg m−3 yr−1, respectively (Fig. 10a). The decline reflected the benefit of improved implementation of emission control actions as well as the influence of meteorological condition change. In general, higher concentrations were found in winter and lower in summer. A rebound in PM2.5 level was notably found in winter after 2017, attributed possibly to the unfavorable meteorological conditions that were more likely to exacerbate air pollution (e.g., the reduced wind speed as shown in Table S2) for recent years. In contrast to PM2.5, MDA8 O3 was clearly elevated from 2015 to 2019, with the annual growth rates estimated to be 4.6 and 7.3 µg m−3 yr−1, by observation and simulation (Fig. 10b). Higher concentrations were found in spring and summer and lower in autumn and winter. Besides the impact of emission change, the O3 concentrations can be greatly influenced by the varying meteorological factors such as the decreased relative humidity and wind speed for recent years in the YRD region (Gao et al., 2021; Dang et al., 2021). In addition, the recent declining PM2.5 concentration in eastern China reduced the heterogeneous absorption of hydroperoxyl radicals (HO2) by aerosols and thereby enhanced O3 concentration (Li et al., 2019). If such an aerosol effect was considered in CMAQ modeling, the increasing rate of annual O3 concentration would possibly be further overestimated. The complex impacts of various factors on air quality triggered the separation of emission and meteorological contributions to the changing PM2.5 and O3 levels shown in Sect. 3.4.2.
The common underestimation of O3 should be stressed, partly resulting from the bias in the estimation of precursor emissions. In this study, the enhanced penetration and/or removal efficiencies of NOx control devices might not be fully considered in the emission inventory development, in particular for the non-electric industry, leading to possible overestimation of NOx emissions. Moreover, underestimation of AVOC emissions could exist, due to incomplete counting of emission sources, particularly for the uncontrolled fugitive leakage. As most of Jiangsu was identified as a VOC-limited region for O3 formation (Y. Wang et al., 2020; Y. Yang et al., 2021), the overestimation of NOx and underestimation of AVOCs could result in underestimation in O3 concentration with air quality modeling. Compared to MEIC, the improved provincial emission inventory partly corrected the overestimation of NOx emissions and NO2 concentrations (Table S8) and helped reduce the bias of O3 concentration simulation. Furthermore, a larger underestimation in O3 was revealed before 2017 (Fig. 8b), attributed partly to less data support on the emission sources and thereby less reliability in the emission inventory, compared with more recent years.
3.4.2 Anthropogenic and meteorological contribution to O3 and PM2.5 variation
As shown in Fig. 11, in the baseline simulation that accounted for the interannual changes of both anthropogenic emissions and meteorology, the provincial-level PM2.5 concentration (geographical mean) was calculated to decrease by 4.1 µg m−3 in 2015–2017 and 1.7 µg m−3 in 2017–2019 and MDA8 O3 to increase by 17.0 µg m−3 in 2015–2017 and 3.2 µg m−3 in 2017–2019. Smaller variations were found for more recent years for both species. With VEMIS and VMET, the contributions of the two factors were identified and discussed in the following. It should be noted that the air quality changes in the baseline did not equal the aggregated contributions in VEMIS and VMET due to non-linearity effects of the chemistry transport modeling, and the main goal of the analysis was to compare the relative contributions of the two factors.
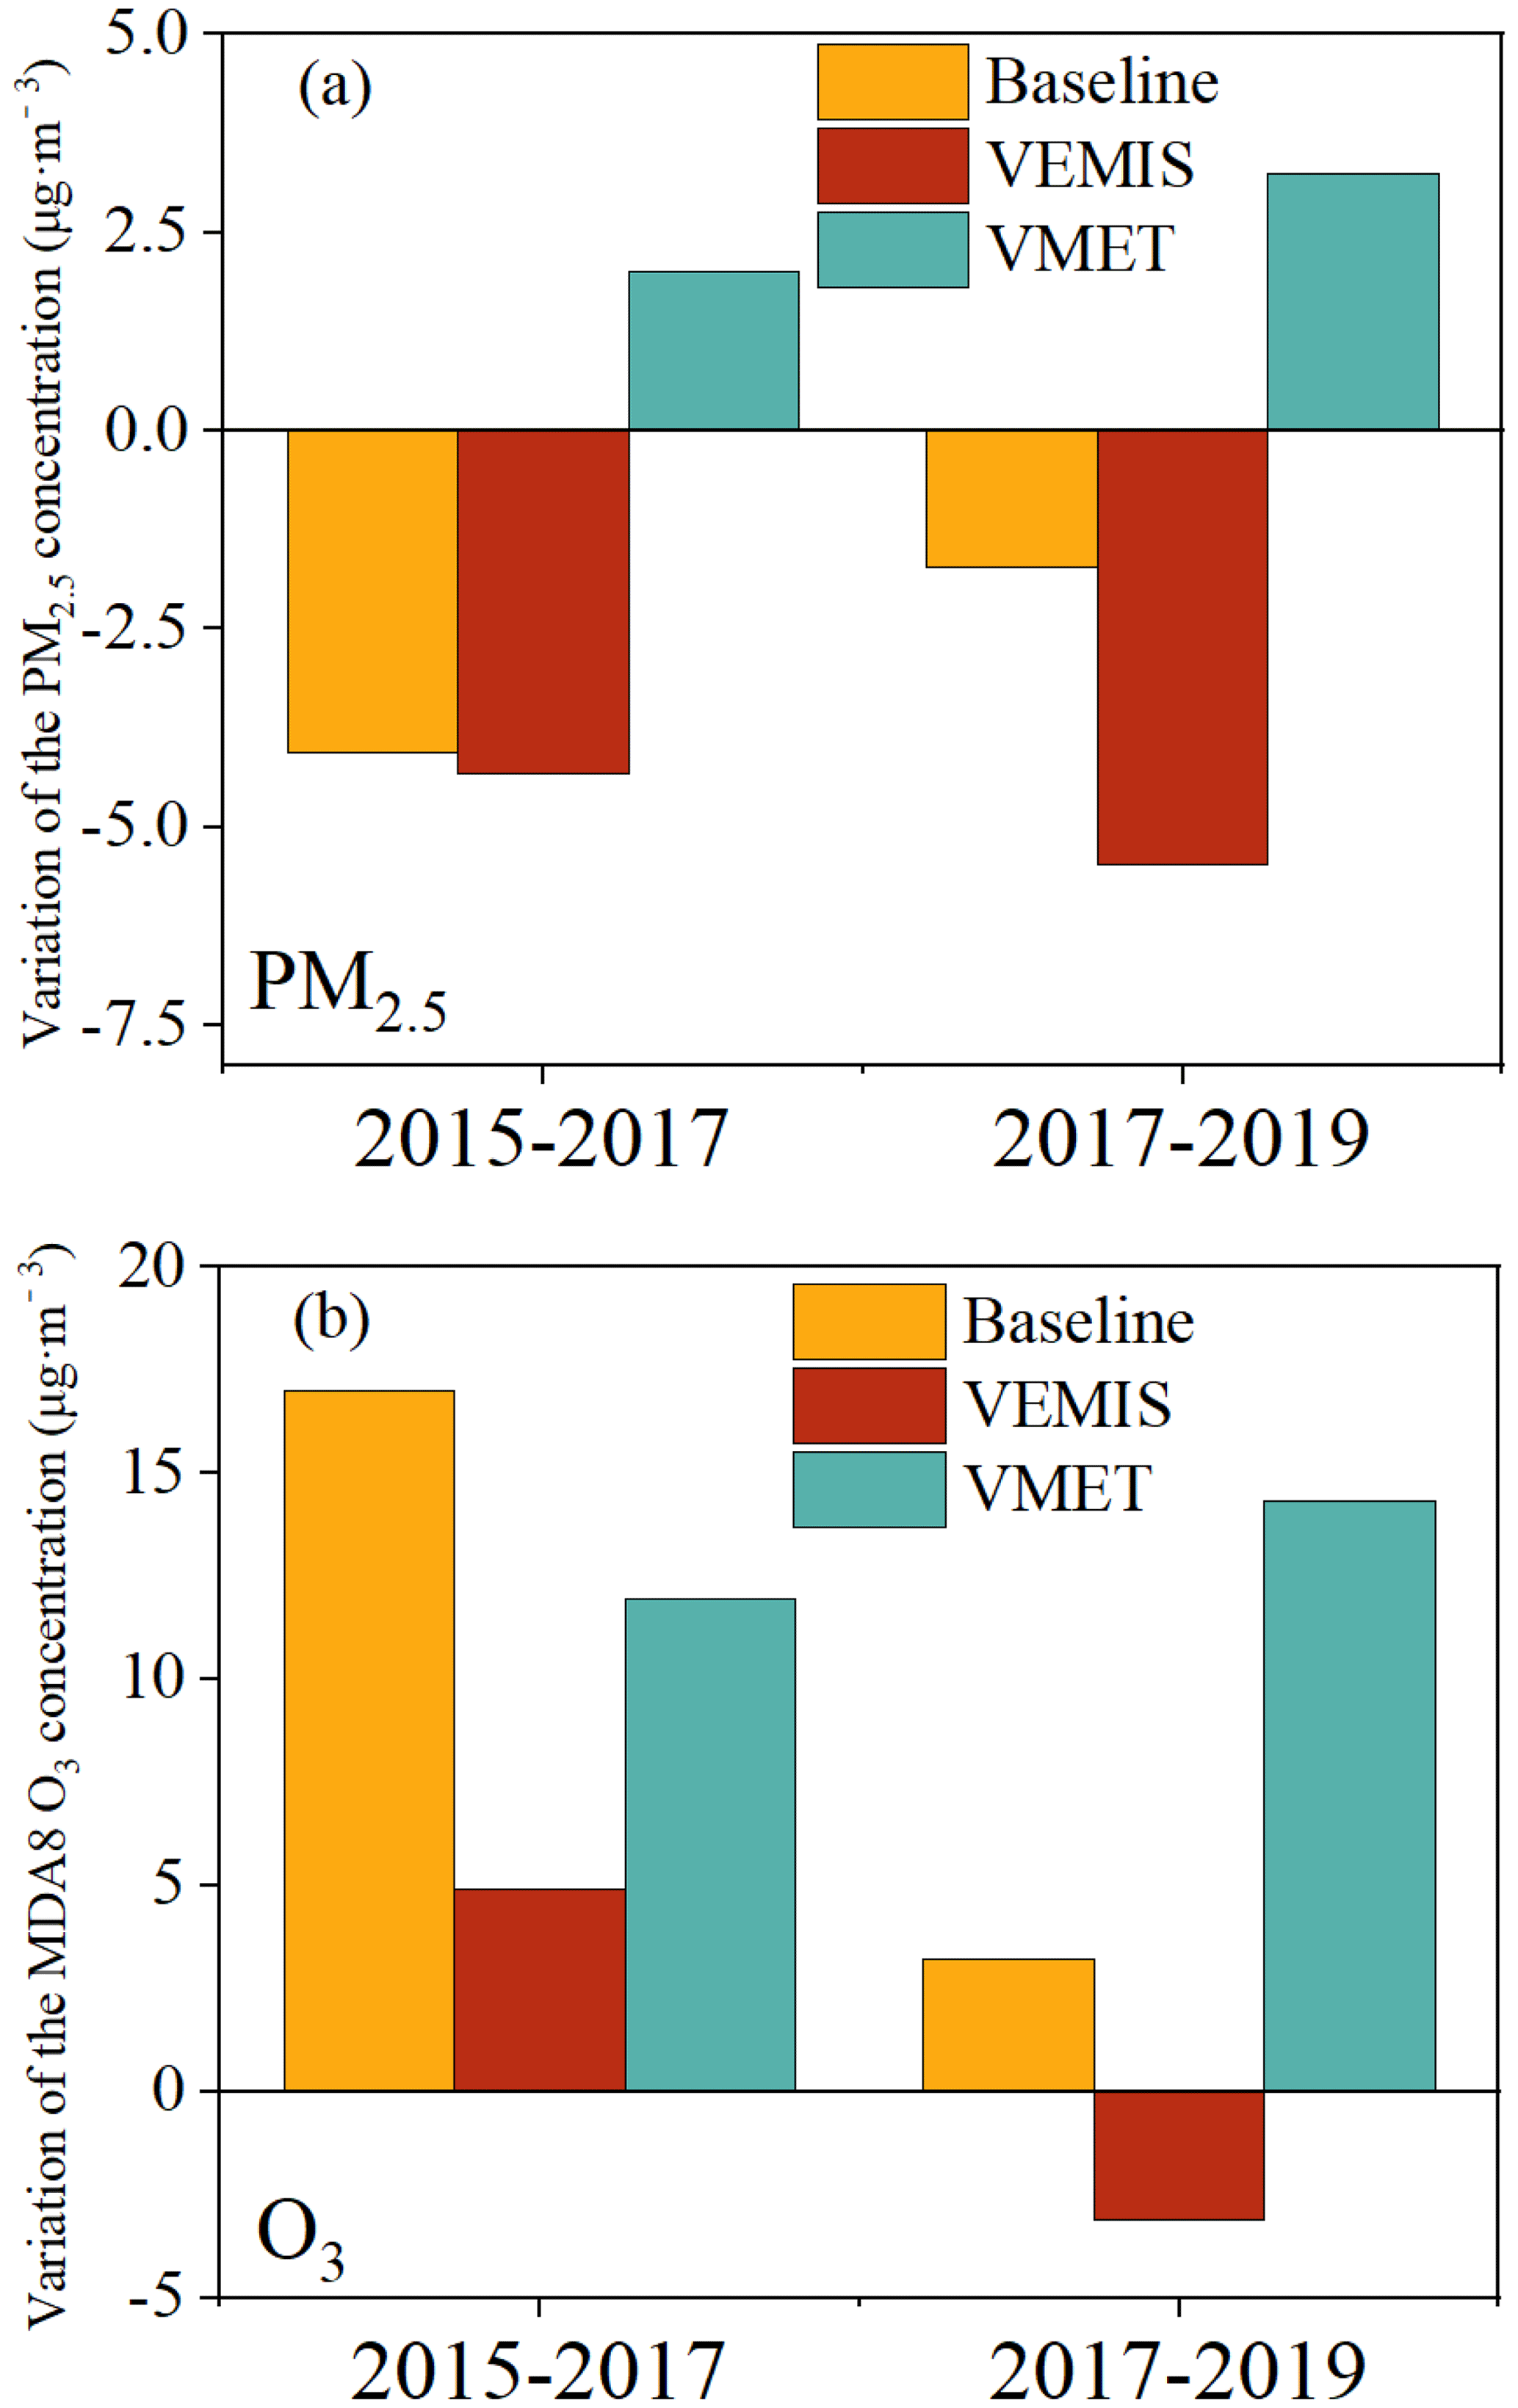
Figure 11The concentration changes during 2015–2017 and 2017–2019 from CMAQ for (a) PM2.5 and (b) O3 (VEMIS and VMET: meteorological conditions and emissions fixed at 2017 level, respectively).
As shown in Fig. 11a, similar patterns of driving factor contributions to PM2.5 were found during 2015–2017 and 2017–2019. While meteorological conditions consistently promoted the formation of PM2.5, the continuous abatement of anthropogenic emissions completely offset the adverse meteorological effects and contributed to the declines in PM2.5 concentrations. Although less reduction in PM2.5 concentration was found for 2017–2019 due mainly to the worsened meteorology, emission abatement was estimated to play a greater role in reducing PM2.5 concentration (5.5 µg m−3 in VEMIS) compared to 2015–2017 (4.3 µg m−3), implying the higher effectiveness of recent emission control actions on PM2.5 pollution alleviation.
The O3 case is different (Fig. 11b). Both the changing emissions and meteorology favored MDA8 O3 increase for 2015–2017, consistent with previous studies (Wang et al., 2019; Dang et al., 2021). The contribution of meteorology was estimated to be 11.9 µg m−3 (VMET), larger than that of emissions at 4.9 µg m−3 (VEMIS). As shown in Fig. S6, the abatement of annual NOx emissions in Jiangsu was estimated to be 104 Gg, while very limited reduction was achieved in AVOC emissions. Declining NOx emissions thus elevated O3 formation under the VOC-limited conditions, particularly in urban areas in Jiangsu.
During 2017–2019, the meteorological condition played a more important role in the O3 growth (14.3 µg m−3), attributed mainly to the decreased relative humidity and wind speed for recent years (Table S2). In contrast, the changing emissions were estimated to restrain the O3 growth by 3.1 µg m−3, implying the effectiveness of continuous emission controls on O3 pollution alleviation. As shown in Fig. S6, a much larger reduction in AVOC emissions was achieved in Jiangsu during 2017–2019 compared to 2015–2017, and the greater NOx emission reduction might have led to the shift from VOC-limited to the transitional regime across the province (W. Wang et al., 2021). The emission controls thus helped limit the total O3 production. Although the reduction in precursor emissions was not able to fully offset the effect of adverse meteorology condition, its encouraging effectiveness demonstrated the validity of current emission control measures, and actual O3 decline can be expected with more stringent control actions to overcome the influence of meteorological variation.
In this study, we developed a high-resolution emission inventory of nine air pollutants for Jiangsu 2015–2019, by integrating the improvements in methodology for different sectors and incorporating the best available facility-level information and real-world emission measurements. We evaluated this provincial-level emission inventory through comparison with other studies at different spatial scales and air quality modeling. We further linked the emission changes to various emission control measures and evaluated the effectiveness of pollution control efforts for the emission reduction and air quality improvement.
Our study indicated that the emission controls indeed played an important role in the prevention and alleviation of air pollution. Through a series of remarkable actions in NAPAPCP and TYAPFAP, the annual emissions in Jiangsu declined to varying degrees for different species from 2015 to 2019, with the largest relative reduction at 53 % for SO2 and smallest at 6 % for AVOCs. Regarding different periods, larger abatement of SO2 emissions was found between 2015 and 2017 but more substantial reductions of NOx, AVOCs, and primary PM2.5 between 2017 and 2019. Our estimates in SO2, AVOC, and NH3 emissions were mostly smaller than or close to other studies, while those for NOx and primary PM2.5 were less conclusive. The main reasons for the discrepancies between studies included the modified methodologies used in this work (e.g., the procedure-based approach for AVOCs and the agricultural process characterization for NH3) and the varied depths of details on emission source investigation (e.g., the penetration and removal efficiencies of APCDs). Air quality modeling confirmed the benefit of refined emission data on predicting the ambient levels of PM2.5 and O3, as well as capturing their interannual variations.
For 2015–2017 within NAPAPCP, the ultra-low-emission retrofit in the power sector was most effective for SO2 and NOx emission reduction, but the expansion of emission controls to non-electricity sectors, including coal-fired boilers and key industries, were more important for 2017–2019. AVOC control was still in its initial stage, and the measures on key industrial sectors and transportation were demonstrated to be effective. Along with the gradually reduced potential for emission reduction through end-of-pipe treatment, adjustment of energy and industrial structures should be the future path for Jiangsu as well as other regions with developed industrial economy. Air quality modeling suggested worsened meteorological conditions from 2015 to 2019 in terms of PM2.5 and O3 pollution alleviation. The continuous actions on emission reduction, however, have been taking effect on reducing PM2.5 concentration and restraining the growth of the MDA8 O3 level.
The analysis justified the big efforts and investments by the local government for air pollution controls and demonstrated how the investigations of detailed underlying data could help improve the precision, integrity, and continuity of emission inventories. Such demonstrations were more applicable at regional scale (smaller countries and territories) instead of national scale due to the huge cost and data gap for the latter. Furthermore, the work showed how the refined emission data could efficiently support the high-resolution air quality modeling and highlighted the varying and complex responses of air quality to different emission control efforts. Therefore, the study could shed light for other highly polluted regions in China and worldwide, with diverse stages of regional economical development and air pollution controls.
Limitations remain in the current study. Attributed to insufficient data support, there was little improvement on emission estimation for some sources compared to previous studies, e.g., on-road transportation and residential sector. Those sources may play an increasingly important role in emissions and air quality, along with stringent controls on power and industrial sectors, and thus need to be better stressed in the future. The temporal profiles of emissions for most source categories were not improved due to the difficulty in capturing the real-time variation of activity for individual emitters (e.g., the operation and energy consumption of industrial plant). It could be a reason for the bias in air quality modeling. Given the limited access to emission source information, moreover, the emission data for nearby regions around Jiangsu were not refined in this work. Such a limitation might lead to some bias in analyzing the effectiveness of emission controls on air quality, as regional transport could account for a considerable fraction of PM2.5 and O3 concentrations. Should better regional emission data become available, more analysis needs to be conducted to separate the effectiveness of local emission controls and efforts from nearby regions. Due to huge computational tasks through air quality modeling, the individual emission control measures were not directly linked to the ambient concentration, and their effectiveness on air quality improvement cannot be obtained in detail. Advanced numerical tools, e.g., the adjoint modeling, are recommended for further in-depth analysis.
The gridded emission data for Jiangsu Province 2015–2019 can be downloaded at http://www.airqualitynju.com/En/Data/List/Datadownload (Zhao, 2023).
The supplement related to this article is available online at: https://doi.org/10.5194/acp-23-4247-2023-supplement.
CG developed the methodology, conducted the research, and wrote the draft. YZ and LZ developed the strategy and designed the research, and YZ revised the manuscript. ZX provided the support of air quality modeling. YW, ZW, and HW provided the support of emission data processing. SX, LL, and QZ provided the support of emission data.
The contact author has declared that none of the authors has any competing interests.
Publisher’s note: Copernicus Publications remains neutral with regard to jurisdictional claims in published maps and institutional affiliations.
This work received support from the Natural Science Foundation of China (grant nos. 42177080 and 41922052), the Key Research and Development Programme of Jiangsu Province (grant no. BE2022838), and the Jiangsu Provincial Fund on PM2.5 and O3 Pollution Mitigation (grant no. 2019023). The authors are grateful to Qiang Zhang, Guannan Geng, and Nana Wu from Tsinghua University (the MEIC team) for national emission data and evaluation.
This research has been supported by the National Natural Science Foundation of China (grant nos. 42177080 and 41922052), the Key Research and Development Programme of Jiangsu Province (grant no. BE2022838), and the Jiangsu Provincial Fund on PM2.5 and O3 Pollution Mitigation (grant no. 2019023).
This paper was edited by Maria Kanakidou and reviewed by two anonymous referees.
An, J., Huang, Y., Huang, C., Wang, X., Yan, R., Wang, Q., Wang, H., Jing, S., Zhang, Y., Liu, Y., Chen, Y., Xu, C., Qiao, L., Zhou, M., Zhu, S., Hu, Q., Lu, J., and Chen, C.: Emission inventory of air pollutants and chemical speciation for specific anthropogenic sources based on local measurements in the Yangtze River Delta region, China, Atmos. Chem. Phys., 21, 2003–2025, https://doi.org/10.5194/acp-21-2003-2021, 2021.
Crippa, M., Solazzo, E., Huang G., Guizzardi D., Koffi E., Muntean M., Schieberle C., and Friedrich R.: High resolution temporal profiles in the Emissions Database for Global Atmospheric Research, Sci. Data, 7, 121, https://doi.org/10.1038/s41597-020-0462-2, 2020.
Dang, R., Liao, H., and Fu, Y.: Quantifying the anthropogenic and meteorological influences on summertime surface ozone in China over 2012–2017, Sci. Total Environ., 754, 142394, https://doi.org/10.1016/j.scitotenv.2020.142394, 2021.
Emery, C., Liu, Z., Russell, A. G., Odman, M. T., Yarwood, G., and Kumar, N.: Recommendations on statistics and benchmarks to assess photochemical model performance, J. Air Waste Manag. Assoc., 67, 582–598, https://doi.org/10.1080/10962247.2016.1265027, 2017.
Gao, D., Xie, M., Liu, J., Wang, T., Ma, C., Bai, H., Chen, X., Li, M., Zhuang, B., and Li, S.: Ozone variability induced by synoptic weather patterns in warm seasons of 2014–2018 over the Yangtze River Delta region, China, Atmos. Chem. Phys., 21, 5847–5864, https://doi.org/10.5194/acp-21-5847-2021, 2021.
Gao, Y., Ma, M., Yan, F., Su, H., Wang, S., Liao, H., Zhao, B., Wang, X., Sun, Y., Hopkins, J. R., Chen, Q., Fu, P., Lewis, A. C., Qiu, Q., Yao, X., and Gao, H.: Impacts of biogenic emissions from urban landscapes on summer ozone and secondary organic aerosol formation in megacities, Sci. Total Environ., 814, 152654, https://doi.org/10.1016/j.scitotenv.2021.152654, 2022a.
Gao, Y., Zhang, L., Huang, A., Kou, W., Bo, X., Cai, B., and Qu, J.: Unveiling the spatial and sectoral characteristics of a high-resolution emission inventory of CO2 and air pollutants in China, Sci. Total Environ., 847, 157623, https://doi.org/10.1016/j.scitotenv.2022.157623, 2022b.
Geng, G., Zheng, Y., Zhang, Q., Xue, T., Zhao, H., Tong, D., Zheng, B., Li, M., Liu, F., Hong, C., He, K., and Davis, S. J.: Drivers of PM2.5 air pollution deaths in China 2002–2017, Nat. Geosci., 14, 645–650, https://doi.org/10.1038/s41561-021-00792-3, 2021.
He, K., Zhang, Q., and Wang, S.: Technical manual for the preparation of urban air pollution source emission inventory, Tsinghua University, 2018 (in Chinese).
Hsu, C., Chiang, H., Shie, R., Ku, C., Lin, T., Chen, M., Chen, N., and Chen, Y.: Ambient VOCs in residential areas near a large-scale petrochemical complex: Spatiotemporal variation, source apportionment and health risk, Environ. Pollut., 240, 95–104, https://doi.org/10.1016/j.envpol.2018.04.076, 2018.
Huang, Y., Shen, H., Chen, H., Wang, R., Zhang, Y., Su, S., Chen, Y., Lin, N., Zhuo, S., Zhong, Q., Wang, X., Liu, J., Li, B., Liu, W., and Tao, S.: Quantification of Global Primary Emissions of PM2.5, PM10, and TSP from Combustion and Industrial Process Sources, Environ. Sci. Technol., 48, 13834–13843, https://doi.org/10.1021/es503696k, 2014.
Huang, Z., Zhong, Z., Sha, Q., Xu, Y., Zhang, Z., Wu, L., Wang, Y., Zhang, L., Cui, X., Tang, M., Shi, B., Zheng, C., Li, Z., Hu, M., Bi, L., Zheng, J., and Yan, M.: An updated model-ready emission inventory for Guangdong Province by incorporating big data and mapping onto multiple chemical mechanisms, Sci. Total Environ., 769, 144535, https://doi.org/10.1016/j.scitotenv.2020.144535, 2021.
Hoesly, R. M., Smith, S. J., Feng, L., Klimont, Z., Janssens-Maenhout, G., Pitkanen, T., Seibert, J. J., Vu, L., Andres, R. J., Bolt, R. M., Bond, T. C., Dawidowski, L., Kholod, N., Kurokawa, J.-I., Li, M., Liu, L., Lu, Z., Moura, M. C. P., O'Rourke, P. R., and Zhang, Q.: Historical (1750–2014) anthropogenic emissions of reactive gases and aerosols from the Community Emissions Data System (CEDS), Geosci. Model Dev., 11, 369–408, https://doi.org/10.5194/gmd-11-369-2018, 2018.
Jin, X. and Holloway, T.: Spatial and temporal variability of ozone sensitivity over China observed from the Ozone Monitoring Instrument, J. Geophys. Res., 120, 7229–7246, https://doi.org/10.1002/2015JD023250, 2015.
Karplus, V. J., Zhang, S., and Almond, D.: Quantifying coal power plant responses to tighter SO2 emissions standards in China, P. Natl. Acad. Sci. USA, 115, 7004–7009, https://doi.org/10.1073/pnas.1800605115, 2018.
Ke, J., Li, S., and Zhao, D.: The application of leak detection and repair program in VOCs control in China's petroleum refineries, J. Air Waste Manag. Assoc., 70, 862–875, https://doi.org/10.1080/10962247.2020.1772407, 2020.
Klimont, Z., Smith, S. J., and Cofala, J.: The last decade of global anthropogeni sulfur dioxide: 2000–2011 emissions, Environ. Res. Lett., 8, 014003, https://doi.org/10.1088/1748-9326/8/1/014003, 2013.
Kurokawa, J. and Ohara, T.: Long-term historical trends in air pollutant emissions in Asia: Regional Emission inventory in ASia (REAS) version 3, Atmos. Chem. Phys., 20, 12761–12793, https://doi.org/10.5194/acp-20-12761-2020, 2020.
Li, K., Jacob, D. J., Liao, H., Shen, L., Zhang, Q., and Bates, K. H.: Anthropogenic drivers of 2013-2017 trends in summer surface ozone in China, P. Natl. Acad. Sci. USA, 116, 422–427, https://doi.org/10.1073/pnas.1812168116, 2019.
Li, L., An, J. Y., Zhou, M., Qiao, L. P., Zhu, S. H., Yan, R. S., Ooi, C. G., Wang, H. L., Huang, C., Huang, L., Tao, S. K., Yu, J. Z., Chan, A., Wang, Y. J., Feng, J. L., and Chen, C. H.: An integrated source apportionment methodology and its application over the Yangtze River Delta region, China, Environ. Sci. Technol., 52, 14216–14227, 10.1021/acs.est.8b01211, 2018.
Li, M., Zhang, Q., Streets, D. G., He, K. B., Cheng, Y. F., Emmons, L. K., Huo, H., Kang, S. C., Lu, Z., Shao, M., Su, H., Yu, X., and Zhang, Y.: Mapping Asian anthropogenic emissions of non-methane volatile organic compounds to multiple chemical mechanisms, Atmos. Chem. Phys., 14, 5617–5638, https://doi.org/10.5194/acp-14-5617-2014, 2014.
Liu, F., Zhang, Q., Tong, D., Zheng, B., Li, M., Huo, H., and He, K. B.: High-resolution inventory of technologies, activities, and emissions of coal-fired power plants in China from 1990 to 2010, Atmos. Chem. Phys., 15, 13299–13317, https://doi.org/10.5194/acp-15-13299-2015, 2015.
Liu, M., Shang, F., Lu, X., Huang, X., Song, Y., Liu, B., Zhang, Q., Liu, X., Cao, J., Xu, T., Wang, T., Xu, Z., Xu, W., Liao, W., Kang, L., Cai, X., Zhang, H., Dai, Y., and Zhu, T.: Unexpected response of nitrogen deposition to nitrogen oxide controls and implications for land carbon sink, Nat. Commun., 13, 3126, https://doi.org/10.1038/s41467-022-30854-y, 2022.
Liu, Y., Han, F., Liu, W., Cui, X., Luan, X., and Cui, Z.: Process-based volatile organic compound emission inventory establishment method for the petroleum refining industry, J. Clean. Prod., 263, 121609, https://doi.org/10.1016/j.jclepro.2020.121609, 2020.
Miyazaki, K., Eskes, H., Sudo, K., Boersma, K. F., Bowman, K., and Kanaya, Y.: Decadal changes in global surface NOx emissions from multi-constituent satellite data assimilation, Atmos. Chem. Phys., 17, 807–837, https://doi.org/10.5194/acp-17-807-2017, 2017.
Mo, Z., Shao, M., and Lu, S.: Compilation of a source profile database for hydrocarbon and OVOC emissions in China, Atmos. Environ., 143, 209–217, https://doi.org/10.1016/j.atmosenv.2016.08.025, 2016.
Mo, Z., Lu, S., and Shao, M.: Volatile organic compound (VOC) emissions and health risk assessment in paint and coatings industry in the Yangtze River Delta, China, Environ. Pollut., 269, 115740, https://doi.org/10.1016/j.envpol.2020.115740, 2021.
National Bureau of Statistics of China: Statistical Yearbook of China, China Statistics Press, Beijing, http://www.stats.gov.cn/sj/ndsj/ (last access: 10 October 2022), 2016–2021 (in Chinese).
Ren, Y., Qu, Z., Du, Y., Xu, R., Ma, D., Yang, G., Shi, Y., Fan, X., Tani, A., Guo, P., Ge, Y., and Chang, J.: Air quality and health effects of biogenic volatile organic compounds emissions from urban green spaces and the mitigation strategies, Environ. Pollut., 230, 849–861, https://doi.org/10.1016/j.envpol.2017.06.049, 2017.
Sha, T., Ma, X. Y., Jia, H. L., van der A, R. J., Ding, J. Y., Zhang, Y. L., and Chang, Y. H.: Exploring the influence of two inventories on simulated air pollutants during winter over the Yangtze River Delta, Atmos. Environ., 206, 170–182, https://doi.org/10.1016/j.atmosenv.2019.03.006, 2019.
Shen, Y., Wu, Y., Chen, G., Van Grinsven, H. J. M., Wang, X., Gu, B., and Lou, X.: Non-linear increase of respiratory diseases and their costs under severe air pollution, Environ. Pollut., 224, 631–637, https://doi.org/10.1016/j.envpol.2017.02.047, 2017.
Simayi, M., Hao, Y. F., Li, J., Wu, R. R., Shi, Y. Q., Xi, Z. Y., Zhou, Y., and Xie, S. D.: Establishment of county-level emission inventory for industrial NMVOCs in China and spatial-temporal characteristics for 2010–2016, Atmos. Environ., 211, 194–203, https://doi.org/10.1016/j.atmosenv.2019.04.064, 2019.
State Council of the People's Republic of China (SCC): The air pollution prevention and control national action plan, http://www.gov.cn/zwgk/2013-09/12/content_2486773.htm (last access: 10 October 2022), 2013.
State Council of the People's Republic of China (SCC): Three-year Action Plan for Protecting Blue Sky, Central People's Government of the People's Republic of China, http://www.gov.cn/zhengce/content/2018-07/03/content_5303158.htm (last access: 10 October 2022), 2018.
Sun, X. W., Cheng, S. Y., Lang, J. L., Ren, Z. H., and Sun, C.: Development of emissions inventory and identification of sources for priority control in the middle reaches of Yangtze River Urban Agglomerations, Sci. Total Environ., 625, 155–167, https://doi.org/10.1016/j.scitotenv.2017.12.103, 2018.
Wang, J. D., Zhao, B., Wang, S. X., Yang, F. M., Xing, J., Morawska, L., Ding, A. J., Kulmala, M., Kerminen, V., Kujansuu, J., Wang, Z. F., Ding, D., Zhang, X. Y., Wang, H. B., Tian, M., Petäjä, T., Jiang, J. K., and Hao, J. M.: Particulate matter pollution over China and the effects of control policies, Sci. Total Environ., 584–585, 426–447, https://doi.org/10.1016/j.scitotenv.2017.01.027, 2017.
Wang, N., Xu, J., Pei, C., Tang, R., Zhou, D., Chen, Y., Li, M., Deng, X., Deng, T., Huang, X., and Ding, A.: Air quality during COVID-19 lockdown in the Yangtze River Delta and the Pearl River Delta: Two different responsive mechanisms to emission reductions in China, Environ. Sci. Technol., 55, 5721–5730, https://doi.org/10.1021/acs.est.0c08383, 2021.
Wang, P., Guo, H., Hu, J., Kota, S. H., Ying, Q., and Zhang, H.: Responses of PM2.5 and O3 concentrations to changes of meteorology and emissions in China, Sci. Total Environ., 662, 297–306, https://doi.org/10.1016/j.scitotenv.2019.01.227, 2019.
Wang, R., Yuan, Z., Zheng, J., Li, C., Huang, Z., Li, W., Xie, Y., Wang, Y., Yu, K., and Duan, L.: Characterization of VOC emissions from construction machinery and river ships in the Pearl River Delta of China, J. Environ. Sci., (China), 96, 138–150, https://doi.org/10.1016/j.jes.2020.03.013, 2020.
Wang, W., van der A, R., Ding, J., van Weele, M., and Cheng, T.: Spatial and temporal changes of the ozone sensitivity in China based on satellite and ground-based observations, Atmos. Chem. Phys., 21, 7253–7269, https://doi.org/10.5194/acp-21-7253-2021, 2021.
Wang, Y., Zhao, Y., Zhang, L., Zhang, J., and Liu, Y.: Modified regional biogenic VOC emissions with actual ozone stress and integrated land cover information: A case study in Yangtze River Delta, China, Sci. Total Environ., 727, 138703, https://doi.org/10.1016/j.scitotenv.2020.138703, 2020.
Wiedinmyer, C., Yokelson, R. J., and Gullett, B. K.: Global Emissions of Trace Gases, Particulate Matter, and Hazardous Air Pollutants from Open Burning of Domestic Waste, Environ. Sci. Technol., 48, 9523–9530, https://doi.org/10.1021/es502250z, 2014.
Wu, R., Zhao, Y., Xia, S., Hu, W., Xie, F., Zhang, Y., Sun, J., Yu, H., An, J., and Wang, Y.: Reconciling the bottom-up methodology and ground measurement constraints to improve the city-scale NMVOCs emission inventory: A case study of Nanjing, China, Sci. Total Environ., 812, 152447, https://doi.org/10.1016/j.scitotenv.2021.152447, 2022.
Yang, Y., Zhao, Y., Zhang, L., and Lu, Y.: Evaluating the methods and influencing factors of satellite-derived estimates of NOx emissions at regional scale: A case study for Yangtze River Delta, China, Atmos. Environ., 219, 117051, https://doi.org/10.1016/j.atmosenv.2019.117051, 2019.
Yang, J., Zhao, Y., Cao, J., and Nielsen, C. P.: Co-benefits of carbon and pollution control policies on air quality and health till 2030 in China, Environ. Int., 152, 106482, https://doi.org/10.1016/j.envint.2021.106482, 2021.
Yang, Y., Zhao, Y., Zhang, L., Zhang, J., Huang, X., Zhao, X., Zhang, Y., Xi, M., and Lu, Y.: Improvement of the satellite-derived NOx emissions on air quality modeling and its effect on ozone and secondary inorganic aerosol formation in the Yangtze River Delta, China, Atmos. Chem. Phys., 21, 1191–1209, https://doi.org/10.5194/acp-21-1191-2021, 2021.
Yen, C. and Horng, J.: Volatile organic compounds (VOCs) emission characteristics and control strategies for a petrochemical industrial area in middle Taiwan, J. Environ. Health, Part A, 44, 1424–1429, https://doi.org/10.1080/10934520903217393, 2009.
Zhang, B., Wang, S., Wang, D., Wang, Q., Yang, X., and Tong, R.: Air quality changes in China 2013–2020: Effectiveness of clean coal technology policies, J. Clean. Prod., 366, 132961, https://doi.org/10.1016/j.jclepro.2022.132961, 2022.
Zhang, J., Liu, L., Zhao, Y., Li, H., Lian, Y., Zhang, Z., Huang, C., and Du, X.: Development of a high-resolution emission inventory of agricultural machinery with a novel methodology: A case study for Yangtze River Delta region, Environ. Pollut., 266, 115075, https://doi.org/10.1016/j.envpol.2020.115075, 2020.
Zhang, L., Zhu, X., Wang, Z., Zhang, J., Liu, X., and Zhao, Y.: Improved speciation profiles and estimation methodology for VOCs emissions: A case study in two chemical plants in eastern China, Environ. Pollut., 291, 118192, https://doi.org/10.1016/j.envpol.2021.118192, 2021.
Zhang, Q., Zheng, Y., Tong, D., Shao, M., Wang, S., Zhang, Y., Xu, X., Wang, J., He, H., Liu, W., Ding, Y., Lei, Y., Li, J., Wang, Z., Zhang, X., Wang, Y., Cheng, J., Liu, Y., Shi, Q., Yan, L., Geng, G., Hong, C., Li, M., Liu, F., Zheng, B., Cao, J., Ding, A., Gao, J., Fu, Q., Huo, J., Liu, B., Liu, Z., Yang, F., He, K., and Hao, J.: Drivers of improved PM2.5 air quality in China from 2013 to 2017, P. Natl. Acad. Sci. USA, 116, 24463–24469, https://doi.org/10.1073/pnas.1907956116, 2019.
Zhang, S. J., Wu, Y., Zhao, B., Wu, X. M., Shu, J. W., and Hao, J. M.: City-specific vehicle emission control strategies to achieve stringent emission reduction targets in China's Yangtze River Delta region, J. Environ. Sci., 51, 75–87, https://doi.org/10.1016/j.jes.2016.06.038, 2017.
Zhang, X. M., Wu, Y. Y., Liu, X. J., Reis, S., Jin, J. X., Dragosits, U., Van Damme, M., Clarisse, L., Whitburn, S., Coheur, P., and Gu, B. J.: Ammonia emissions may be substantially underestimated in China, Environ. Sci. Technol., 51, 12089–12096, https://doi.org/10.1021/acs.est.7b02171, 2017.
Zhang, Y., Bo, X., Zhao, Y., and Nielsen, C. P.: Benefits of current and future policies on emissions of China's coal-fired power sector indicated by continuous emission monitoring, Environ. Pollut., 251, 415–424, https://doi.org/10.1016/j.envpol.2019.05.021, 2019.
Zhang, Y., Zhao, Y., Gao, M., Bo, X., and Nielsen, C. P.: Air quality and health benefits from ultra-low emission control policy indicated by continuous emission monitoring: a case study in the Yangtze River Delta region, China, Atmos. Chem. Phys., 21, 6411–6430, https://doi.org/10.5194/acp-21-6411-2021, 2021.
Zhao, Y.: Gridded emissions for Jiangsu China 2015–2019, Air Quality Nju [data set], http://www.airqualitynju.com/En/Data/List/Datadownload, last access: 2 April 2023.
Zhao, Y., Wang, S., Nielsen, C. P., Li, X., and Hao, J.: Establishment of a database of emission factors for atmospheric pollutants from Chinese coal-fired power plants, Atmos. Environ., 44, 1515–1523, https://doi.org/10.1016/j.atmosenv.2010.01.017, 2010.
Zhao, Y., Zhang, J., and Nielsen, C. P.: The effects of recent control policies on trends in emissions of anthropogenic atmospheric pollutants and CO2 in China, Atmos. Chem. Phys., 13, 487–508, https://doi.org/10.5194/acp-13-487-2013, 2013.
Zhao, Y., Qiu, L. P., Xu, R. Y., Xie, F. J., Zhang, Q., Yu, Y. Y., Nielsen, C. P., Qin, H. X., Wang, H. K., Wu, X. C., Li, W. Q., and Zhang, J.: Advantages of a city-scale emission inventory for urban air quality research and policy: the case of Nanjing, a typical industrial city in the Yangtze River Delta, China, Atmos. Chem. Phys., 15, 12623–12644, https://doi.org/10.5194/acp-15-12623-2015, 2015.
Zhao, Y., Mao, P., Zhou, Y., Yang, Y., Zhang, J., Wang, S., Dong, Y., Xie, F., Yu, Y., and Li, W.: Improved provincial emission inventory and speciation profiles of anthropogenic non-methane volatile organic compounds: a case study for Jiangsu, China, Atmos. Chem. Phys., 17, 7733–7756, https://doi.org/10.5194/acp-17-7733-2017, 2017.
Zhao, Y., Xia, Y., and Zhou, Y.: Assessment of a high-resolution NOx emission inventory using satellite observations: A case study of southern Jiangsu, China, Atmos. Environ., 190, 135–145, https://doi.org/10.1016/j.atmosenv.2018.07.029, 2018.
Zhao, Y., Yuan, M., Huang, X., Chen, F., and Zhang, J.: Quantification and evaluation of atmospheric ammonia emissions with different methods: a case study for the Yangtze River Delta region, China, Atmos. Chem. Phys., 20, 4275–4294, https://doi.org/10.5194/acp-20-4275-2020, 2020.
Zhao, Y., Huang, Y., Xie, F., Huang, X., and Yang, Y.: The effect of recent controls on emissions and aerosol pollution at city scale: A case study for Nanjing, China, Atmos. Environ., 246, 118080, https://doi.org/10.1016/j.atmosenv.2020.118080, 2021.
Zheng, B., Zhang, Q., Tong, D., Chen, C., Hong, C., Li, M., Geng, G., Lei, Y., Huo, H., and He, K.: Resolution dependence of uncertainties in gridded emission inventories: a case study in Hebei, China, Atmos. Chem. Phys., 17, 921–933, https://doi.org/10.5194/acp-17-921-2017, 2017.
Zheng, B., Tong, D., Li, M., Liu, F., Hong, C., Geng, G., Li, H., Li, X., Peng, L., Qi, J., Yan, L., Zhang, Y., Zhao, H., Zheng, Y., He, K., and Zhang, Q.: Trends in China's anthropogenic emissions since 2010 as the consequence of clean air actions, Atmos. Chem. Phys., 18, 14095–14111, https://doi.org/10.5194/acp-18-14095-2018, 2018.
Zheng, B., Cheng, J., Geng, G., Wang, X., Li, M., Shi, Q., Qi, J., Lei, Y., Zhang, Q., and He, K.: Mapping anthropogenic emissions in China at 1 km spatial resolution and its application in air quality modeling, Sci. Bull., 66, 612–620, https://doi.org/10.1016/j.scib.2020.12.008, 2021.
Zheng, J., Zhang, L., Che, W., Zheng, Z., and Yin, S.: A highly resolved temporal and spatial air pollutant emission inventory for the Pearl River Delta region, China and its uncertainty assessment, Atmos. Environ., 43, 5112–5122, https://doi.org/10.1016/j.atmosenv.2009.04.060, 2009.
Zheng, J. J., Jiang, P., Qiao, W., Zhu, Y., and Kennedy, E.: Analysis of air pollution reduction and climate change mitigation in the industry sector of Yangtze River Delta in China, J. Clean. Prod., 114, 314–322, https://doi.org/10.1016/j.jclepro.2015.07.011, 2016.
Zhou, Y., Zhao, Y., Mao, P., Zhang, Q., Zhang, J., Qiu, L., and Yang, Y.: Development of a high-resolution emission inventory and its evaluation and application through air quality modeling for Jiangsu Province, China, Atmos. Chem. Phys., 17, 211–233, https://doi.org/10.5194/acp-17-211-2017, 2017.