the Creative Commons Attribution 4.0 License.
the Creative Commons Attribution 4.0 License.
 | 10 Mar 2023
Source mechanisms and transport patterns of tropospheric bromine monoxide: findings from long-term multi-axis differential optical absorption spectroscopy measurements at two Antarctic stations
Udo Frieß
Karin Kreher
Richard Querel
Holger Schmithüsen
Dan Smale
Rolf Weller
Ulrich Platt
The presence of reactive bromine in polar regions is a widespread phenomenon that plays an important role in the photochemistry of the Arctic and Antarctic lower troposphere, including the destruction of ozone, the disturbance of radical cycles, and the oxidation of gaseous elemental mercury. The chemical mechanisms leading to the heterogeneous release of gaseous bromine compounds from saline surfaces are in principle well understood. There are, however, substantial uncertainties about the contribution of different potential sources to the release of reactive bromine, such as sea ice, brine, aerosols, and the snow surface, as well as about the seasonal and diurnal variation and the vertical distribution of reactive bromine. Here we use continuous long-term measurements of the vertical distribution of bromine monoxide (BrO) and aerosols at the two Antarctic sites Neumayer (NM) and Arrival Heights (AH), covering the periods of 2003–2021 and 2012–2021, respectively, to investigate how chemical and physical parameters affect the abundance of BrO. We find the strongest correlation between BrO and aerosol extinction (R=0.56 for NM and R=0.28 for AH during spring), suggesting that the heterogeneous release of Br2 from saline airborne particles (blowing snow and aerosols) is a dominant source for reactive bromine. Positive correlations between BrO and contact time of air masses, both with sea ice and the Antarctic ice sheet, suggest that reactive bromine is not only emitted by the sea ice surface but by the snowpack on the ice shelf and in the coastal regions of Antarctica. In addition, the open ocean appears to represent a source for reactive bromine during late summer and autumn when the sea ice extent is at its minimum. A source–receptor analysis based on back trajectories and sea ice maps shows that main source regions for BrO at NM are the Weddell Sea and the Filchner–Ronne Ice Shelf, as well as coastal polynyas where sea ice is newly formed. A strong morning peak in BrO frequently occurring during summer and that is particularly strong during autumn suggests a night-time build-up of Br2 by heterogeneous reaction of ozone on the saline snowpack in the vicinity of the measurement sites. We furthermore show that BrO can be sustained for at least 3 d while travelling across the Antarctic continent in the absence of any saline surfaces that could serve as a source for reactive bromine.
- Article
(15710 KB) - Full-text XML
-
Supplement
(28789 KB) - BibTeX
- EndNote


It has been known since the 1980s that reactive bromine compounds play an important role in the troposphere of polar regions (Barrie et al., 1988). Bromine radicals (Brx = [Br, BrO]) are known to have a strong impact on the oxidative capacity of the polar atmosphere already at mixing ratios in the lower parts per trillion (ppt) range. They cause photochemical destruction of ozone, which frequently drops to near-zero values in the presence of reactive bromine during so-called ozone depletion events (ODEs) (Hausmann and Platt, 1994; Helmig et al., 2012), but also affect other important photochemical species, such as HOx (OH+HO2) and NOx (NO+NO2), and volatile organic compounds (Barrie and Platt, 1997; Platt and Hönninger, 2003; von Glasow and Crutzen, 2007; Simpson et al., 2007; Abbatt et al., 2012; Simpson et al., 2015). Furthermore, bromine monoxide (BrO) is responsible for the oxidation of elemental mercury and its conversion from its insoluble gaseous elementary form to soluble oxidised compounds, leading to an enhanced deposition of mercury species in the vulnerable polar ecosystems (Lu et al., 2001; Ariya et al., 2002; Ebinghaus et al., 2002; Steffen et al., 2008; Angot et al., 2016; Dommergue et al., 2010). Satellite measurements of BrO reveal that the presence of reactive bromine is a widespread phenomenon, covering several millions of square kilometres of the sea-ice-covered oceans and parts of the adjacent Antarctic and Arctic land masses during polar spring (Wagner and Platt, 1998; Richter et al., 1998; Schönhardt et al., 2012; Bougoudis et al., 2020).
Reactive bromine is released to the gas phase via heterogeneous reactions on saline surfaces with low pH that contain a sufficient amount of bromide (Br−) via the following reaction cycle (Tang and McConnell, 1996; Vogt et al., 1996; Wennberg, 1999):
The fact that each gaseous HOBr molecule reacting on a saline surface via Reaction (R4) yields up to two bromine atoms in the gas phase after photolysis of Br2 (Reaction R1) can lead to an exponential increase in the amount of gaseous reactive bromine, the so-called bromine explosion (Platt and Hönninger, 2003). Apart from this bromine explosion mechanism, which requires sunlight, bromine can also be released during the night by reaction of ozone on saline surfaces via the following reactions (Oum et al., 1998; Artiglia et al., 2017; Pratt et al., 2013):
The HOBr produced by Reaction (R6) leads to a release of molecular bromine (Br2) to the gas phase via Reaction (R4). In contrast to the HOBr-driven cycle (Reactions R1–R4), the ozone-driven bromine release initiated by Reactions (R5) and (R6) is not self-accelerating but can lead to the accumulation of large amounts of molecular bromine in the nocturnal polar boundary layer, and its rapid photolysis during sunrise via Reaction (R1) can lead to a peak in the abundance of reactive bromine in the morning (Simpson et al., 2018). Apart from the aforementioned heterogeneous mechanisms, OH-mediated release of reactive bromine represents a further possible release process that also proceeds in the absence of sunlight (Halfacre et al., 2019).
The release mechanisms for reactive bromine are thought to be well understood, and photochemical simulations reaching from one-dimensional models (Piot and von Glasow, 2008; Toyota et al., 2014a, b) to full 3D chemistry-transport models (CTMs) (Toyota et al., 2011; Fernandez et al., 2019; Herrmann et al., 2021, 2022) are nowadays capable of reproducing surface and satellite-borne observations of ozone and BrO levels in the polar atmosphere. There is, however, still a large uncertainty in the contribution of different surface types and release mechanisms to the reactive bromine budget (Abbatt et al., 2012). A brine layer forming on top of the sea ice, in particular during its formation in open leads, is thought to be a major source of reactive bromine (Peterson et al., 2016), and frost flowers forming on top of the brine layer might provide additional surface areas for heterogeneous bromine release (Kaleschke et al., 2004), although their total area is now thought to be too small to have a strong impact on the total reactive bromine budget. Saline particles can become airborne at high wind speeds, e.g. by dispersion, saltation processes, wind pumping, and blowing snow impacting brine surfaces (Morin et al., 2008). Indeed, surface observations show high amounts of BrO in the presence of blowing snow (Frieß et al., 2011; Peterson et al., 2017), suggesting that these serve as a source for reactive bromine. Airborne snow particles and aerosols with high salinity provide a transport pathway for bromine compounds to the coastal inland, where their deposition can lead to an accumulation of halides on snow surfaces, from which reactive bromine can be released at a later time (Piot and von Glasow, 2008).
The abundance of reactive bromine is expected to be controlled by a multitude of dynamical and chemical parameters, such as the contact of air masses with sea ice (Frieß et al., 2004; Jones et al., 2006; Bognar et al., 2020), wind speed, blowing snow, and aerosols (Jones et al., 2009; Frieß et al., 2011); the availability of ozone (Helmig et al., 2012); ambient temperature (Pöhler et al., 2010); atmospheric stability; and solar radiation. The highest amounts of BrO are observed during polar spring, when the sea ice extent is at its maximum and the bromine release mechanism can proceed due to the availability of sunlight after polar sunrise. The abundance of BrO varies substantially with time and location. Maximum mixing ratios reported in different studies range from 5 ppt over the sea ice near Scott Base (Zielcke, 2015), over 50 ppt from ship-borne measurements over the frozen Weddell Sea (Wagner et al., 2007), and to 111 ppt at Neumayer Station using a long-path differential optical absorption spectroscopy (DOAS) instrument that directly measures the BrO mixing ratio near the surface (Nasse, 2019). For a detailed review of halogen observations in polar regions, see, for example, Simpson et al. (2015).
Ground-based measurements of tropospheric BrO in Antarctica are very sparse and restricted to a few locations (Frieß et al., 2004; Schofield et al., 2006; Prados-Roman et al., 2018; Nasse, 2019) and in many cases only performed during a short period of time (Kreher et al., 1997; Saiz-Lopez et al., 2007; Wagner et al., 2007; Hay, 2010; Roscoe et al., 2014; Zielcke, 2015).
Here we investigate the sources for reactive bromine, as well as the impact of a variety of parameters, on the abundance of BrO and aerosols on the basis of continuous long-term multi-axis differential optical absorption spectroscopy (MAX-DOAS) measurements at the two coastal sites Neumayer and Arrival Heights, which are located at adjacent sides of the Antarctic continent in the Atlantic and Pacific sector, respectively. Covering the period of 2003 to 2021 and 2012 to 2021, respectively, without any major gaps except for polar night, the measurements yield an unprecedented continuous data set, consisting of more than 100 000 pairs of BrO and aerosol vertical profiles in the lower troposphere. Together with co-located measurements, meteorological and chemical parameters, back-trajectory simulations, and sea ice maps, these offer the opportunity to study the sources of reactive bromine and its impact on the chemical processes in the Antarctic troposphere.
This paper is structured as follows. Instruments and data analysis are presented in Sect. 2. This includes a description of the measurement sites (Sect. 2.1), as well as a technical description of both instruments (Sect. 2.2), the data analysis (Sect. 2.4 and 2.5), and the back-trajectory modelling that represent the basis for a BrO source–receptor analysis (Sect. 2.6). This also includes the methodology for a statistical analysis of the observation (Sect. 2.7). Case studies illustrating the relationship between the vertical distribution of BrO, aerosols, and atmospheric parameters and the origin of air masses are presented in Sect. 3.1. Seasonal and diurnal variation, as well as the vertical distribution of BrO, is discussed in Sect. 3.2. The relationships of BrO and aerosols with meteorological and photochemical observables and with air mass history are presented in Sect. 3.3. Source regions for reactive bromine are identified on the basis of a source–receptor analysis presented in Sect. 3.4. Finally, Sect. 3.5 presents a case study for transcontinental transport of BrO from the Weddell Sea over the Antarctic ice shield to the Ross Sea, showing that BrO can be sustained for several days in the absence of any source for reactive bromine.
2.1 Measurement locations
Long-term scattered sunlight measurements of BrO and the oxygen collision complex O4 using MAX-DOAS instruments have been performed at the Antarctic research station Neumayer and at the Arrival Heights atmospheric observatory. The locations of the two measurement sites are depicted in Fig. 1. The German Antarctic research station Neumayer (NM) is operated by the Alfred Wegener Institute, Helmholtz Centre for Polar and Marine Research (AWI), Germany. The station is located at 70∘40′ S, 8∘16′ W on the Ekström Ice Shelf (EIS) in front of the Queen Maud Land (QML) at a distance of about 5 km from a naturally formed bay to the north-west of the station named Atka Bay and approximately 15 km from the open ocean in the north. The winterly build-up of sea ice usually starts in early May, and large-scale sea ice cover persists until about the end of November. The MAX-DOAS instrument is located on the roof of the Neumayer Air Chemistry Observatory at an altitude of approximately 5 m above the snow surface.
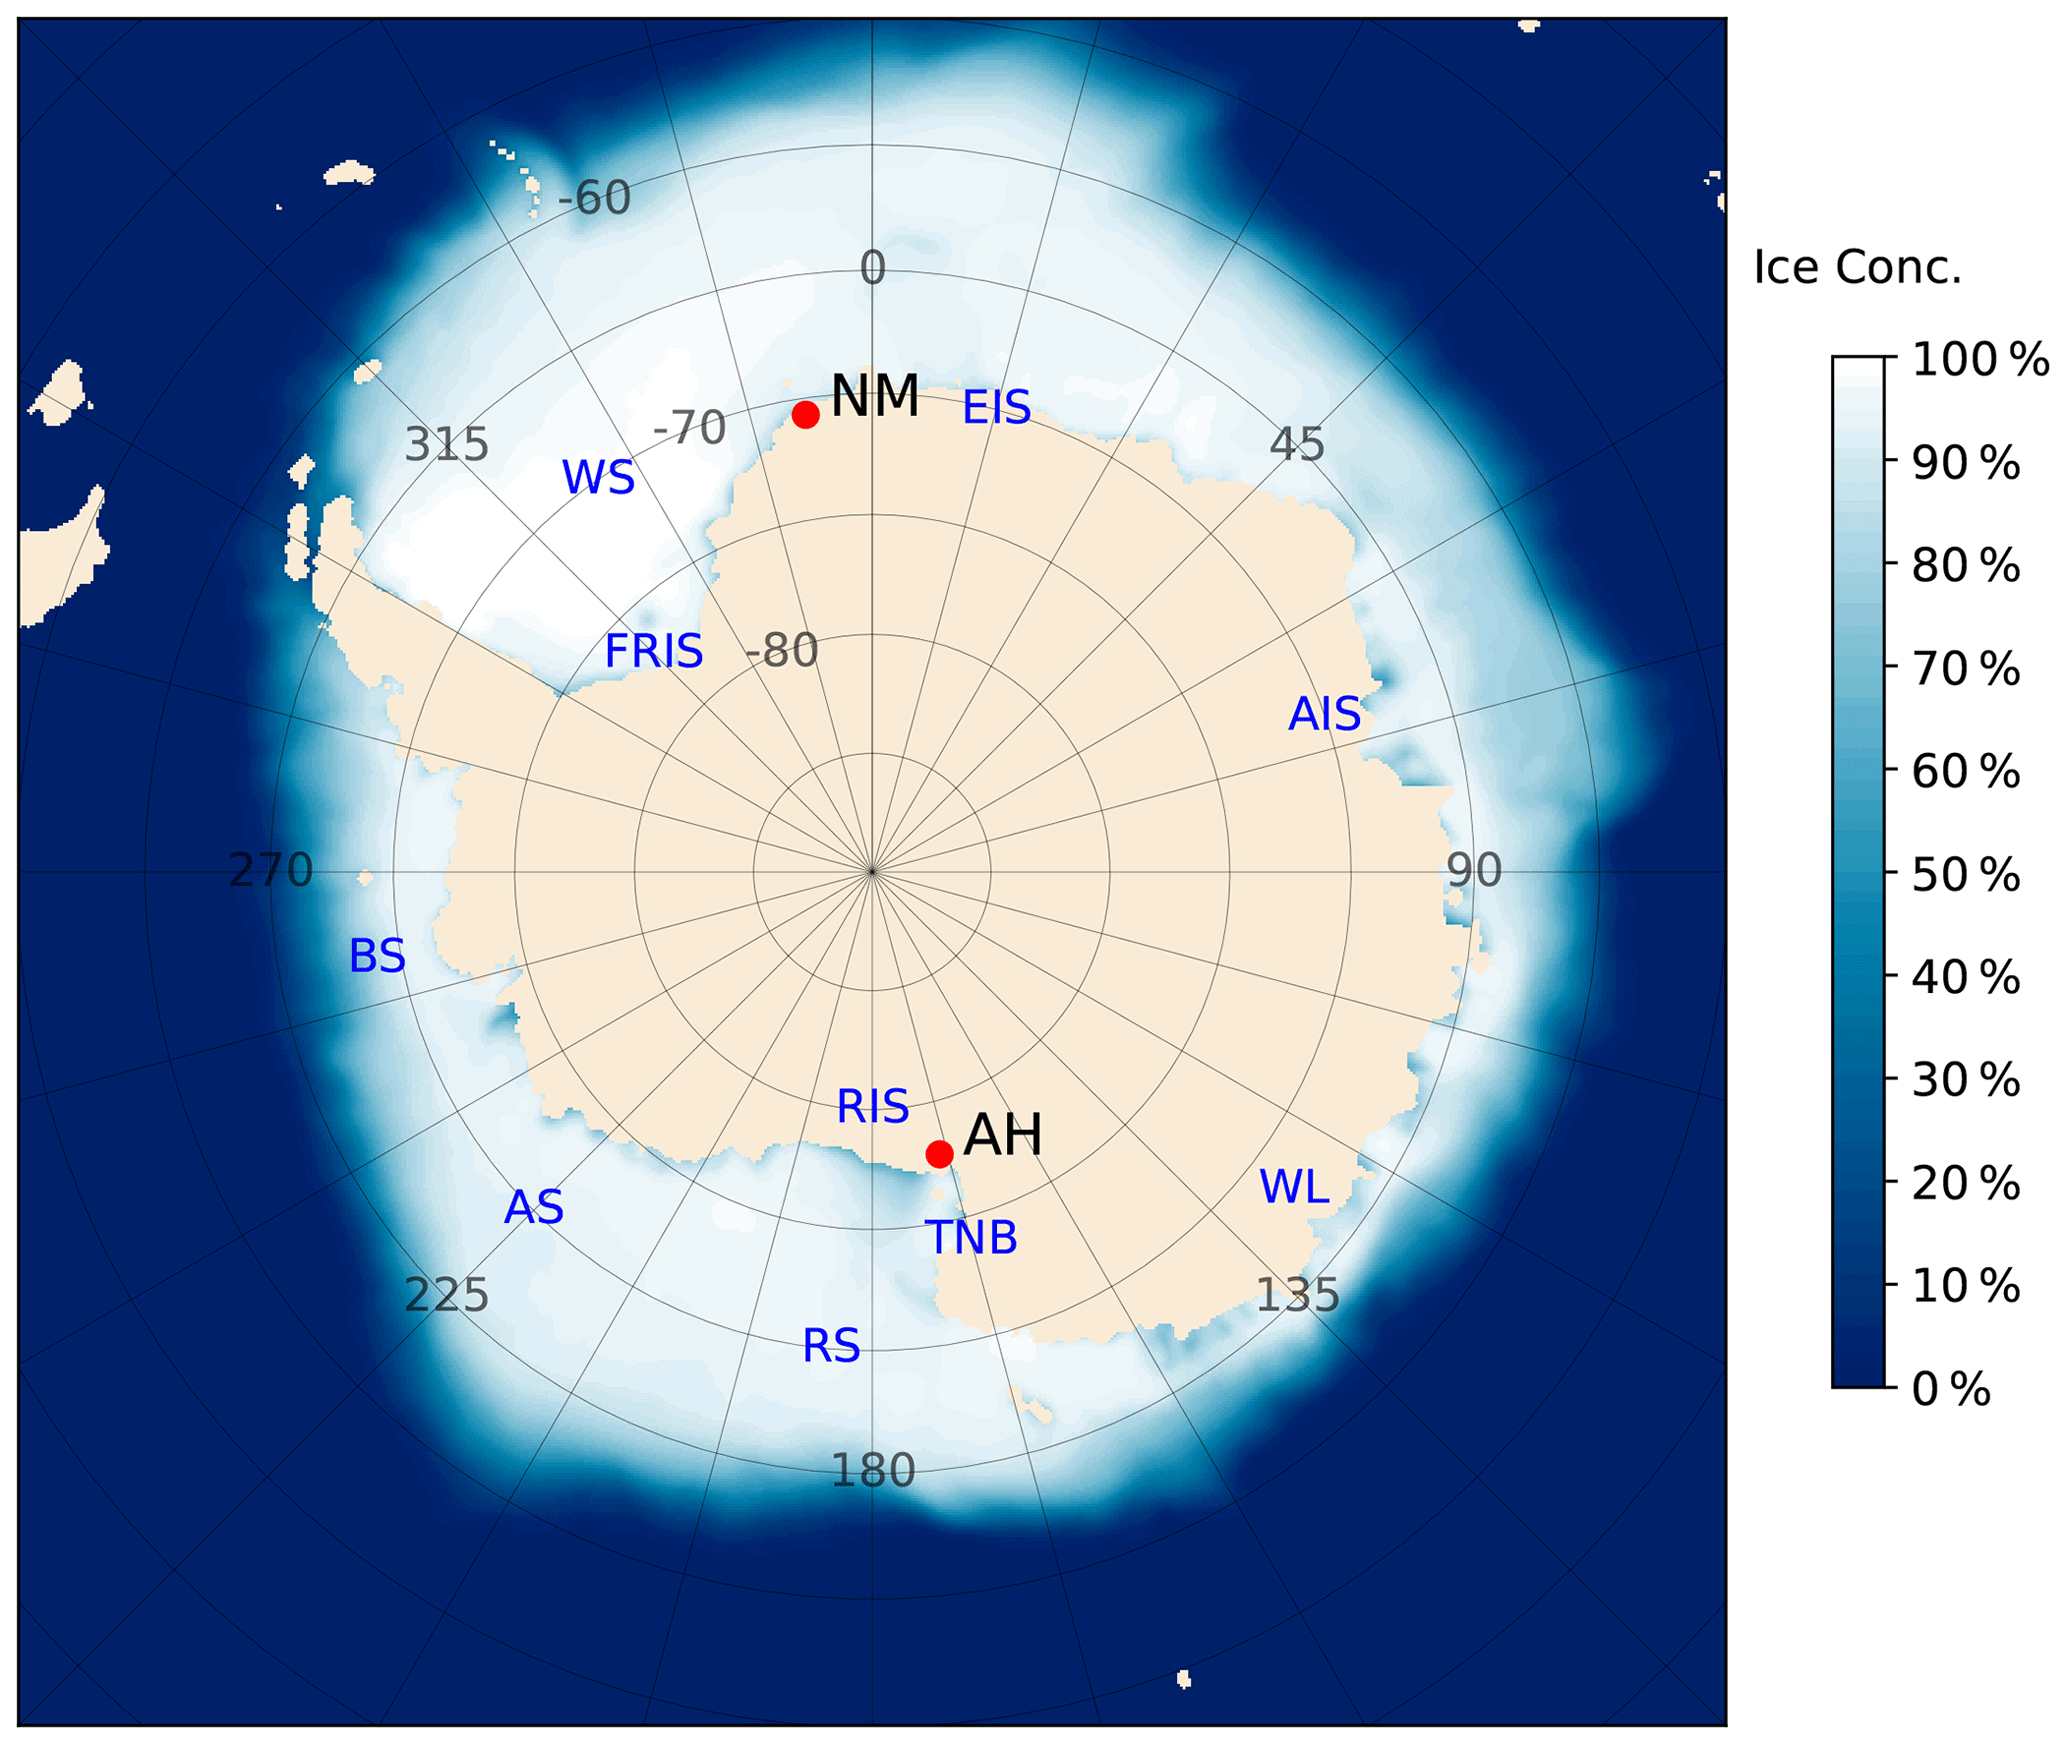
Figure 1Location of AH and NM on the Antarctic continent (red dots). Blue to white colours indicate the mean (2003–2021) OSI-SAF sea ice concentration (see Sect. 2.6) from August to October. Land masses and shelf ice areas are shown in beige. The abbreviations for the geographical names shown in blue are listed in Table 1.
Table 1List of abbreviations for the geographical names shown in Fig. 1.

Due to the flat surroundings of Neumayer Station, air masses can freely flow without any disturbing topographic obstacles. Katabatic winds, i.e. gravitationally driven flow of cold and dense air down the slope of the Antarctic continent, are very rare at Neumayer Station. The site is dominated by easterly winds, which are associated with eastward-moving cyclones, with some rare occurrences of southerly to south-westerly winds (König-Langlo et al., 1997). The origin of the air masses will be investigated in more detail in the framework of the trajectory modelling analysis, as detailed in Sect. 2.6.
The Arrival Heights observatory (AH), which is part of New Zealand's Scott Base, is located on the opposite side of the Antarctic continent at 77∘49′ S, 166∘39′ E at an altitude of 184 m a.s.l. (above sea level) on Hut Point Peninsula, which is part of Ross Island. The Ross Ice Shelf (RIS) is located south of Arrival Heights, and the MAX-DOAS instrument points northwards over the Ross Sea (RS), which is located at a distance of only 300 m from the AH observatory. The RS is usually covered by sea ice from late March to December.
Compared to NM, the topography around AH is far more complex, with the 3794 m a.s.l. Mount Erebus to the east and the Transantarctic Mountains to the west, leading to a more complex local meteorology with varying wind directions (Sinclair, 1988). The larger slope of the surrounding terrain compared to Neumayer, as well as the narrow flow channel formed by Ross Island and the Transantarctic Mountains, leads to the frequent occurrence of strong katabatic winds from the interior of the continent, observed as easterly and south-easterly winds due to deflection of the air masses by the mountains of Ross Island (Godfrey and Clarkson, 1998; Seefeldt et al., 2003; van Lipzig et al., 2004).
2.2 MAX-DOAS instruments
The spectrometer units of the MAX-DOAS instruments at NM and AH are of identical design, and their technical details have already been described elsewhere (Frieß et al., 2001, 2004, 2005, 2010). In brief, they consist of two separate spectrometer units for the UV (320–420 nm, resolution 0.5 nm full width at half maximum, FWHM) and Vis (400–650 nm, 1.8 nm FWHM). Light is dispersed using holographic imaging gratings and detected using thermoelectrically cooled photo diode arrays (Hamamatsu ST3904-1024) with 1024 channels. Scattered sunlight is collected by telescope units with a field of view of ≈0.5∘ and fed to the spectrometer units using quartz fibre bundles.
The NM instrument has been in continuous operation since 1999. Initially, only zenith-sky measurements were performed until a custom-built MAX-DOAS telescope unit was installed in January 2003. The telescope unit is equipped with two rotatable prisms for UV and Vis, respectively, allowing the collection of light from any elevation angle. The telescope points due north. The elevation angle sequence initially applied for the measurements at NM was 90 (zenith), 20, 10, 5, and 2∘. In August 2006, a downward-looking angle of −5∘ was added in order to increase the sensitivity for trace gases below the instrument and within the snowpack (Frieß et al., 2010), and elevation angles of 1 and −20∘ were finally added in September 2007.
The AH instrument has been in operation since August 1998. The entrance optics consists of a telescope housing located inside the AH observatory building. It is illuminated by scattered sunlight reflected from a solar tracker system installed on top of the roof, consisting of two motor-driven aluminium-coated mirrors. The solar tracker is protected by an acrylic glass dome and allows for pointing into any direction in the sky. Various different viewing angle sequences were applied until October 2012, but none of them included a sufficient number of elevation angles for a retrieval of aerosols and trace gases. Since then, the instrument has pointed in a fixed north-westerly azimuth direction (305∘), and the measurement sequence has consisted of the elevation angles of 90, 20, 10, 5, 2, 1, 0, and −4∘. The negative elevation angle, pointing downwards on the sea ice, is of particular importance for retrieving information about the atmosphere below the instrument at AH due to its elevated location at 184 m a.s.l. Unfortunately, the design of the solar tracker does not allow for the inclusion of further downward-looking directions that would further increase the information content of the air below the instrument. MAX-DOAS measurements are only performed for SZA < 89∘, i.e. from 1 August to 12 May at NM and from 23 August to 22 April at AH.
Both instruments measure spectra with a total integration time of 3 min during the day when the solar zenith angle (SZA) is below 90∘. The telescopes are equipped with mercury and halogen light sources, and calibration spectra (mercury and halogen lamp, dark current and offset) are recorded automatically each night.
2.3 Supporting data
In the framework of this study, a variety of supporting data were used for the interpretation of the MAX-DOAS observations at both Antarctic sites. Hourly averaged meteorological data, including surface temperature, wind speed and direction, and relative humidity and pressure, have been measured using a NIWA automatic weather station at AH (https://cliflo.niwa.co.nz/, last access: 31 March 2022) and continuously performed meteorological observations at NM (https://www.pangaea.de/, last access: 25 February 2022). Surface ozone has been measured at AH by NIWA in collaboration with NOAA using a Thermo Scientific Model 49C (McClure-Begley et al., 2013) and at NM by an Anysco Model O341M ozone analyser (https://www.pangaea.de/). Vertical profiles of pressure, relative humidity, and temperature were taken from regularly performed radiosonde measurements at both sites using Vaisala RS41-SGP devices. At AH, these are provided by the Antarctic Meteorological Research Center (AMRC) and launched at McMurdo Station in the vicinity of AH (https://amrc.ssec.wisc.edu, last access: 24 February 2022). The radiosondes launched at NM also have an ozone sensor attached at least weekly and multiple times per week during the ozone hole period in austral spring (Schmithüsen, 2022). Furthermore, back trajectories are modelled based on meteorological fields from the Global Data Assimilation System (GDAS) NCEP GDAS/FNL 0.25 Degree Global Tropospheric Analyses and Forecast data product (NCEP, 2015), and the OSI-SAF L3 Global Sea Ice Concentration product (OSI-SAF, 2017) is used for the assessment of the residence time of air parcels of sea ice, as detailed in Sect. 2.6.
At NM, the bromide and sodium content of aerosol particles has been analysed by ion chromatography from continuous filter samples using a ventilated electropolished stainless steel inlet stack. Starting in March 1983 through 2011, a high-volume sampling device with a temporal integration of 7 to 14 d was used. Here we only use data from 2012 on. Since that time, a low-volume sampling device has been used exclusively. From the in-line airstream, aerosol was continuously sampled using a two-stage filter system, consisting of a Teflon filter and a nylon filter connected in series. Roughly 60 m3 of ambient air was probed over a typical collection period of 24 h. It is important to note that, apart from particulate bromide, an unknown amount of gaseous reactive bromine can also be absorbed by the filters. Thus, gaseous and particulate bromine compounds cannot be distinguished unequivocally by this operational analysis of the filter samples, which would require a dedicated and more detailed procedure (e.g. Legrand et al., 2016).
2.4 DOAS analysis
Spectral analysis and retrieval of BrO and aerosol extinction vertical profiles have already been described elsewhere (Frieß et al., 2011) and are therefore only briefly summarised here. Differential slant column densities (dSCDs) of BrO and the oxygen collision complex O4 were determined from scattered light spectra using the DOASIS software developed at IUP Heidelberg (Kraus, 2006). These represent the integrated trace gas concentrations along the light path of a trace gas relative to a reference spectrum, usually measured in zenith sky. O4 dSCDs serve as a proxy for the light path through the atmosphere and thus for the abundance of aerosols. Absorption cross sections of trace gases with significant optical depth in the respective wavelength region are fitted to the logarithmic ratio of a spectrum measured off axis (elevation angle α<90∘) to a zenith-sky spectrum (α=90∘). According to the Beer–Lambert law, the fit coefficients yield the differential slant column densities , where ρi(s) represents the concentration of trace gas i at location s, and the integral is performed over all possible light paths from the top of the atmosphere to the instrument. Sref represents the slant column density contained in the reference spectrum. The literature-based absorption cross sections included in the BrO and O4 spectral analysis are listed in Table 2. In addition, second- and third-order polynomials included in the O4 and BrO fit, respectively, remove spectral broadband components caused by Rayleigh and Mie scattering in the atmosphere. A Ring spectrum (Grainger and Ring, 1962; Chance and Spurr, 1997) accounts for the filling in of Fraunhofer lines due to rotational Raman scattering. Furthermore, the fit allows for a shift and linear squeeze of the measurement spectrum in order to account for changes in the wavelength alignment of the instruments. In order to account for possible instrumental stray light, a constant is fitted to the intensity spectrum.
Wilmouth et al. (1999)Vandaele et al. (1998)Bogumil et al. (2000)Kromminga et al. (2003)Hermans et al. (2002)Meller and Moortgat (2000)Table 2Absorption cross sections used for the retrieval of BrO and O4.
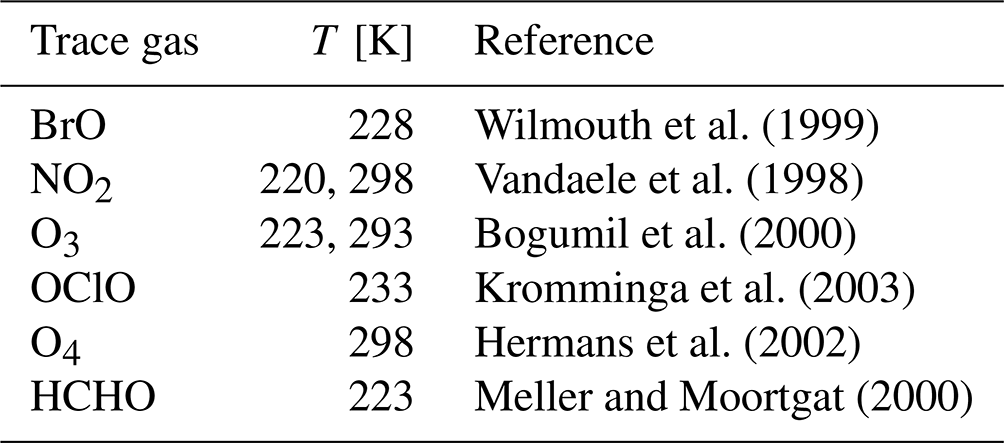
The BrO fit window extends from 332.5 to 359.5 nm, encompassing five BrO absorption bands. The O4 dSCDs at the 360 nm absorption band are retrieved in a fit window ranging from 350 to 370 nm. For each elevation sequence, the means between the two zenith-sky spectra prior to and after the sequence, weighted by the time difference to each spectrum of the sequence, serve as the Fraunhofer reference. This is done by setting the intensity of the Fraunhofer reference at a certain time t as , with I1 and I2 being the intensity of the zenith-sky spectra measured prior to and after the off-axis measurement at times t1 and t2, respectively. This approach removes the stratospheric signal, which is not of interest here.
Histograms of the BrO fit error for both sites are shown in Fig. S1 in the Supplement. The median fit errors for NM and AH amount to 7.7×10¹² and 6×10¹² molec. cm−2, respectively. This amounts to a relative error for measurements at low elevation angles of about 2 % in the case of a BrO event with a vertical column density (VCD) of 5×10¹³ molec. cm−2 (corresponding to about 40 ppt of BrO in a 500 m layer). The relative error in the O4 dSCD is typically in the range of 2 % and represents only a small contribution to the total error in the retrieved aerosol extinction profiles, which is dominated by the smoothing error (Frieß et al., 2006).
2.5 Retrieval of aerosol and BrO vertical profiles
Vertical profiles of aerosol extinction k and BrO number concentration ρBrO are retrieved from MAX-DOAS measurements of dSCDs of O4 and BrO, respectively, using the HEIPRO profile retrieval algorithm already described elsewhere (Frieß et al., 2006, 2011). Based on the well-known optimal estimation method (OEM) (Rodgers, 2000), the algorithm determines a maximum a posteriori solution for the atmospheric state (here using aerosol extinction and BrO concentration vertical profiles) by comparing measured MAX-DOAS dSCDs with dSCDs modelled by the SCIATRAN radiative transfer model (Rozanov et al., 2014). Note that all viewing directions listed in Sect. 2.2, including negative elevation angles, are included in the retrieval. The limited information content of the measurements requires additional constraints, which are provided by an a priori vertical profile and the according a priori covariance matrix. The a priori covariance matrix Sa contains the square of the a priori error in each layer as diagonal elements. Non-diagonal elements introduce a correlation between different layers and are set to , with hi being the centre height of layer i and the correlation length σa determining the degree of vertical smoothing.
Table 3The main settings of aerosol and BrO vertical profile retrievals.

a Error relative to value of a priori profile. b Centre altitude of layers in metres.
The main settings of the aerosol and BrO gas retrievals at both sites are listed in Table 3. A priori profiles that are exponentially decreasing with altitude are chosen. The state vectors are represented as the logarithm of the aerosol extinction and BrO number concentration profiles. Through this, negative extinction and concentration values are excluded, and the retrieved state can thus cover a larger range of possible values.
Although a complete elevation scan takes less than 15 min, vertical profiles are retrieved on an hourly basis in order to keep the computational effort for the processing of several decades of data on an acceptable level. For this purpose, all dSCDs measured during 1 h serve as input for a single retrieval. This means that between three and five elevation scans contribute to the measurement vector, and the resulting profiles represent an hourly average, with variations in the aerosol and BrO amount at shorter timescales not being resolved. Using all measurements during 1 h for a single retrieval reduces the noise error in the retrieved profile, but this has only a minor effect on the total error, which is dominated by the smoothing error (Frieß et al., 2006).
An important diagnostic variable of the OEM retrieval is the averaging kernel (AVK) matrix A. It is defined as the sensitivity of the retrieved profile to the true profile and provides a measure for the vertical resolution of the retrieval. The total information content of the retrieval is given by the degrees of freedom for signal (DOFS) ds=Tr(A), which represent the maximum number of independent quantities that can be inferred from the measurements.
The sensitivity of MAX-DOAS measurements in the near UV quickly decreases with altitude and is usually limited to the lowermost 1.5 km of the atmosphere above the instrument (Frieß et al., 2011). In order to distribute the information content more evenly over the individual layers, a vertical grid with the layer thickness increasing with altitude was applied for the Neumayer retrieval (see Table 3). Starting with 50 m at the ground, the layer thickness subsequently increases with height up to a thickness of 1 km for the layer centred at 2.5 km, as indicated by the dotted horizontal lines in Fig. 2a and b. Unfortunately, the application of a non-regular grid led to an unstable behaviour for the retrieval of vertical profiles at AH despite several attempts to find appropriate settings. It is not clear why this instability occurs, but a possible reason for this is that the instrument is located at an elevated altitude, which is represented in the radiative transfer model by an instrument being located at a height of 185 m above the ground (dotted red line in Fig. 2). Therefore, a regular grid (as in traditional MAX-DOAS OEM retrievals) was applied for the AH retrieval. The retrieval grid extends from the ground up to an altitude of 2 km and consists of 20 layers with a constant thickness of 100 m each (see Table 3).
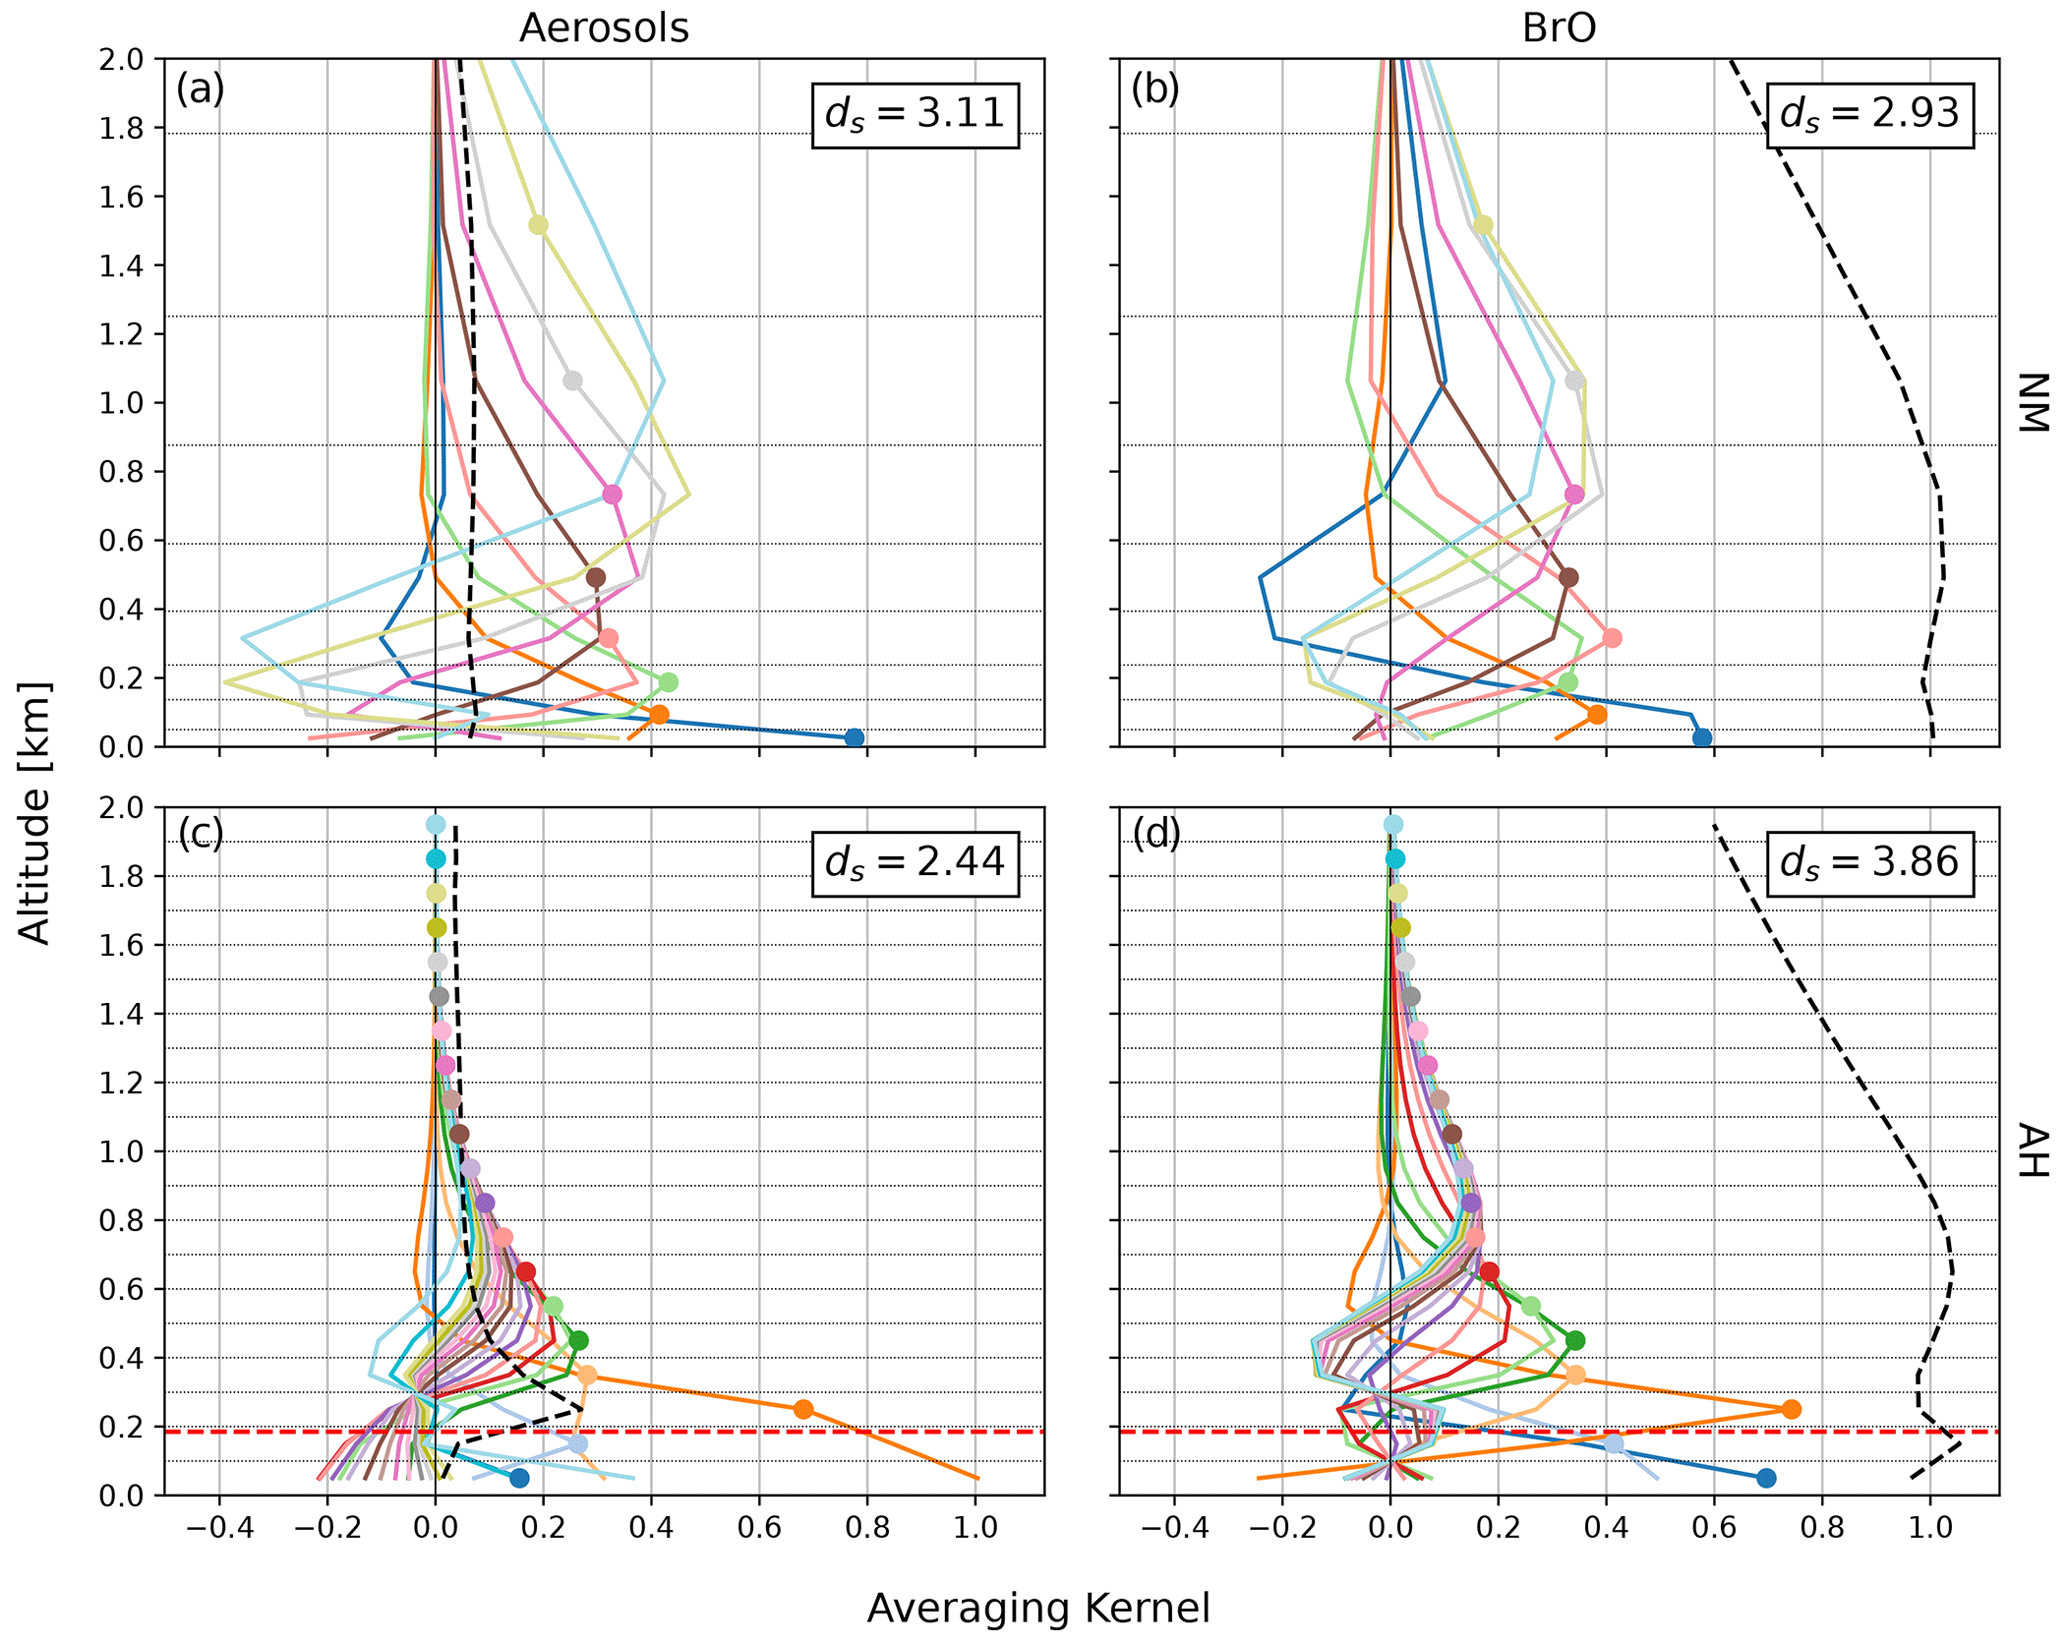
Figure 2Examples of clear-sky AVKs for aerosols (a, c) and BrO (b, d). Panels (a) and (b) show AVKs for NM on 2 November 2021, 13:30 UTC, with an aerosol optical depth (AOD) of . Panels (c) and (d) show AVKs for AH on 25 November 2018, 01:30 UTC, with an AOD of . Each colour shows the AVK for an individual height layer, with its nominal height indicated by a coloured dot. The dashed lines show the averaging kernels of the total column in kilometres. Layer boundaries are shown as dotted horizontal lines. The dashed red lines in (c) and (d) indicate the height of the AH instrument above sea level.
The clear-sky AVKs shown in Fig. 2 illustrate that the information is distributed more evenly over the different layers for the irregular grid (NM, Fig. 2a and b) than for the regular grid (AH, Fig. 2c and d). The AVKs for NM at the surface have peak values of 0.8 and 0.6 for aerosols and BrO, respectively, and remain at a nearly constant value of 0.4 for the layers above. BrO AVKs peak near their nominal altitude, indicating that the information comes from the nominal height level. In contrast, NM AVKs for aerosols at altitudes above 600 m peak below their nominal height, indicating that parts of the extinction retrieved at higher levels actually originate from lower altitudes.
The sensitivity of AH retrievals performed on a regular grid is restricted to lower altitudes, with little information on the atmosphere above 1 and 1.5 km for aerosols and BrO, respectively. Interestingly, the sensitivity near the instrument altitude and below is quite different for aerosols and trace gases. Using the additional downward-viewing direction, the BrO retrieval has good sensitivity for trace gases at low altitudes right above the sea ice, with an AVK peak value in the surface layer of 0.7. Furthermore, there is good sensitivity for the 200–300 m layer directly above the instrument, where the according AVK shows a marked peak. The sensitivity of the AVK in the 100–200 m layer, in which the instrument resides, is comparably low, with a peak value of 0.4. In contrast to BrO, the sensitivity of the aerosol retrieval to the lowermost two layers is very low (around 0.2). The fact that the 200–300 m layer does not peak at its nominal altitude but at the surface indicates that the aerosol extinction near the surface is falsely attributed to this layer.
The averaging kernels of the total column, quantifying the sensitivity of the total column to variations in the extinction or concentration in each layer, are shown as dashed lines in Fig. 2. The sensitivity of the BrO VCD is very similar for AH and NM, whereas there is a peak in sensitivity for aerosols in the layer right above the instrument at AH that is not present at NM. The AH aerosol total column AVK is close to zero below the instrument, indicating a lack of sensitivity to aerosols in this altitude range. Here and in the following, BrO VCD and aerosol optical depth (AOD) refer to tropospheric columns obtained from the MAX-DOAS measurements, with their specific sensitivity as quantified by the corresponding averaging kernels.
Histograms of the DOFS including all data are shown in the Fig. S2. The histograms for NM show two peaks because an additional 1∘ viewing direction introduced in February 2016 increased the information content by about half a unit for both aerosols and BrO. After including the 1∘ elevation angle, the information content of aerosol extinction profiles is slightly better for NM () than for AH (). However, the peak of the distribution of DOFS of BrO profiles is more than half a unit higher for AH () than for NM (). This illustrates that observations from elevated sites (mountains, towers, or tall buildings) and the inclusion of downward-viewing directions greatly enhance the sensitivity of MAX-DOAS measurements for atmospheric trace gases compared to measurements from the ground.
Note that a cloud filter has not been applied to the retrieved profiles because clouds and blowing snow cannot be distinguished unambiguously, and it would not be possible to investigate the impact of blowing snow on BrO when applying a could filter. Therefore, parts of the AOD reported in this study are owing to extinction by clouds and not aerosols or snow particles.
2.6 Trajectory modelling and source–receptor analysis
One of the main objectives of this study is the investigation of potential source regions for BrO and the influence of aerosols and meteorological parameters. This is done using a source–receptor analysis that is based on the approach presented by Frieß et al. (2004) and later applied for the interpretation of long-term measurements in the Arctic by Bognar et al. (2020). The 72 h back trajectories ending at each of the two measurement sites are calculated using the HYSPLIT model with GDAS meteorological data. Back trajectories are calculated for each hour, with end-point altitudes corresponding to the centre altitudes of the MAX-DOAS retrieval grids. An example for back trajectories ending at NM in the morning of 10 September 2016 is shown in Fig. 3. Also shown in this plot is the sea ice concentration from the OSI-SAF data product. For each of the trajectories, contact times of the respective air parcel with sea ice (τice), open ocean (τwater), and land (τland, including the Antarctic ice sheet and the shelf ice regions), as well as the residence time in the free troposphere (τfree), have been determined. The effective residence times over sea ice and open water are calculated by weighting the residence time with ρice and (1−ρice), respectively. An air parcel is considered to be in contact with the surface if its altitude is below the mixing-layer height (MLH) hml. The MLH is a quantity estimated by the HYSPLIT model and serves as an estimate for the boundary layer height. In this way, hourly vertical profiles of contact time of the air parcels above the measurement sites with these different surface types are constructed and can be related to the corresponding vertical profiles of BrO and aerosols from MAX-DOAS.

Figure 3Example for back trajectories ending at Neumayer Station on 10 September 2016 at 09:30 UTC. The trajectories end at the centre of the profile retrieval layers. In the top panel, the altitude of the air parcels above ground level (a.g.l.) are given by the line colour (red to white colour scale), and each circle indicates 6 h of travelling time, with the circle colour indicating the end-point altitude. Blue to white colours indicate the OSI-SAF sea ice concentration (© 2018 EUMETSAT) as denoted in the respective colour bar. The bottom panel shows the time–height cross section, with the height being normalised to the mixing-layer height. The line colour indicates the sea ice concentration below the air parcel (blue to white), with locations over the continent shown in grey. Note the change in y-axis scale from linear between 0 and 1 (grey area, corresponding to the vertical extent of the mixing layer) to logarithmic above 1.
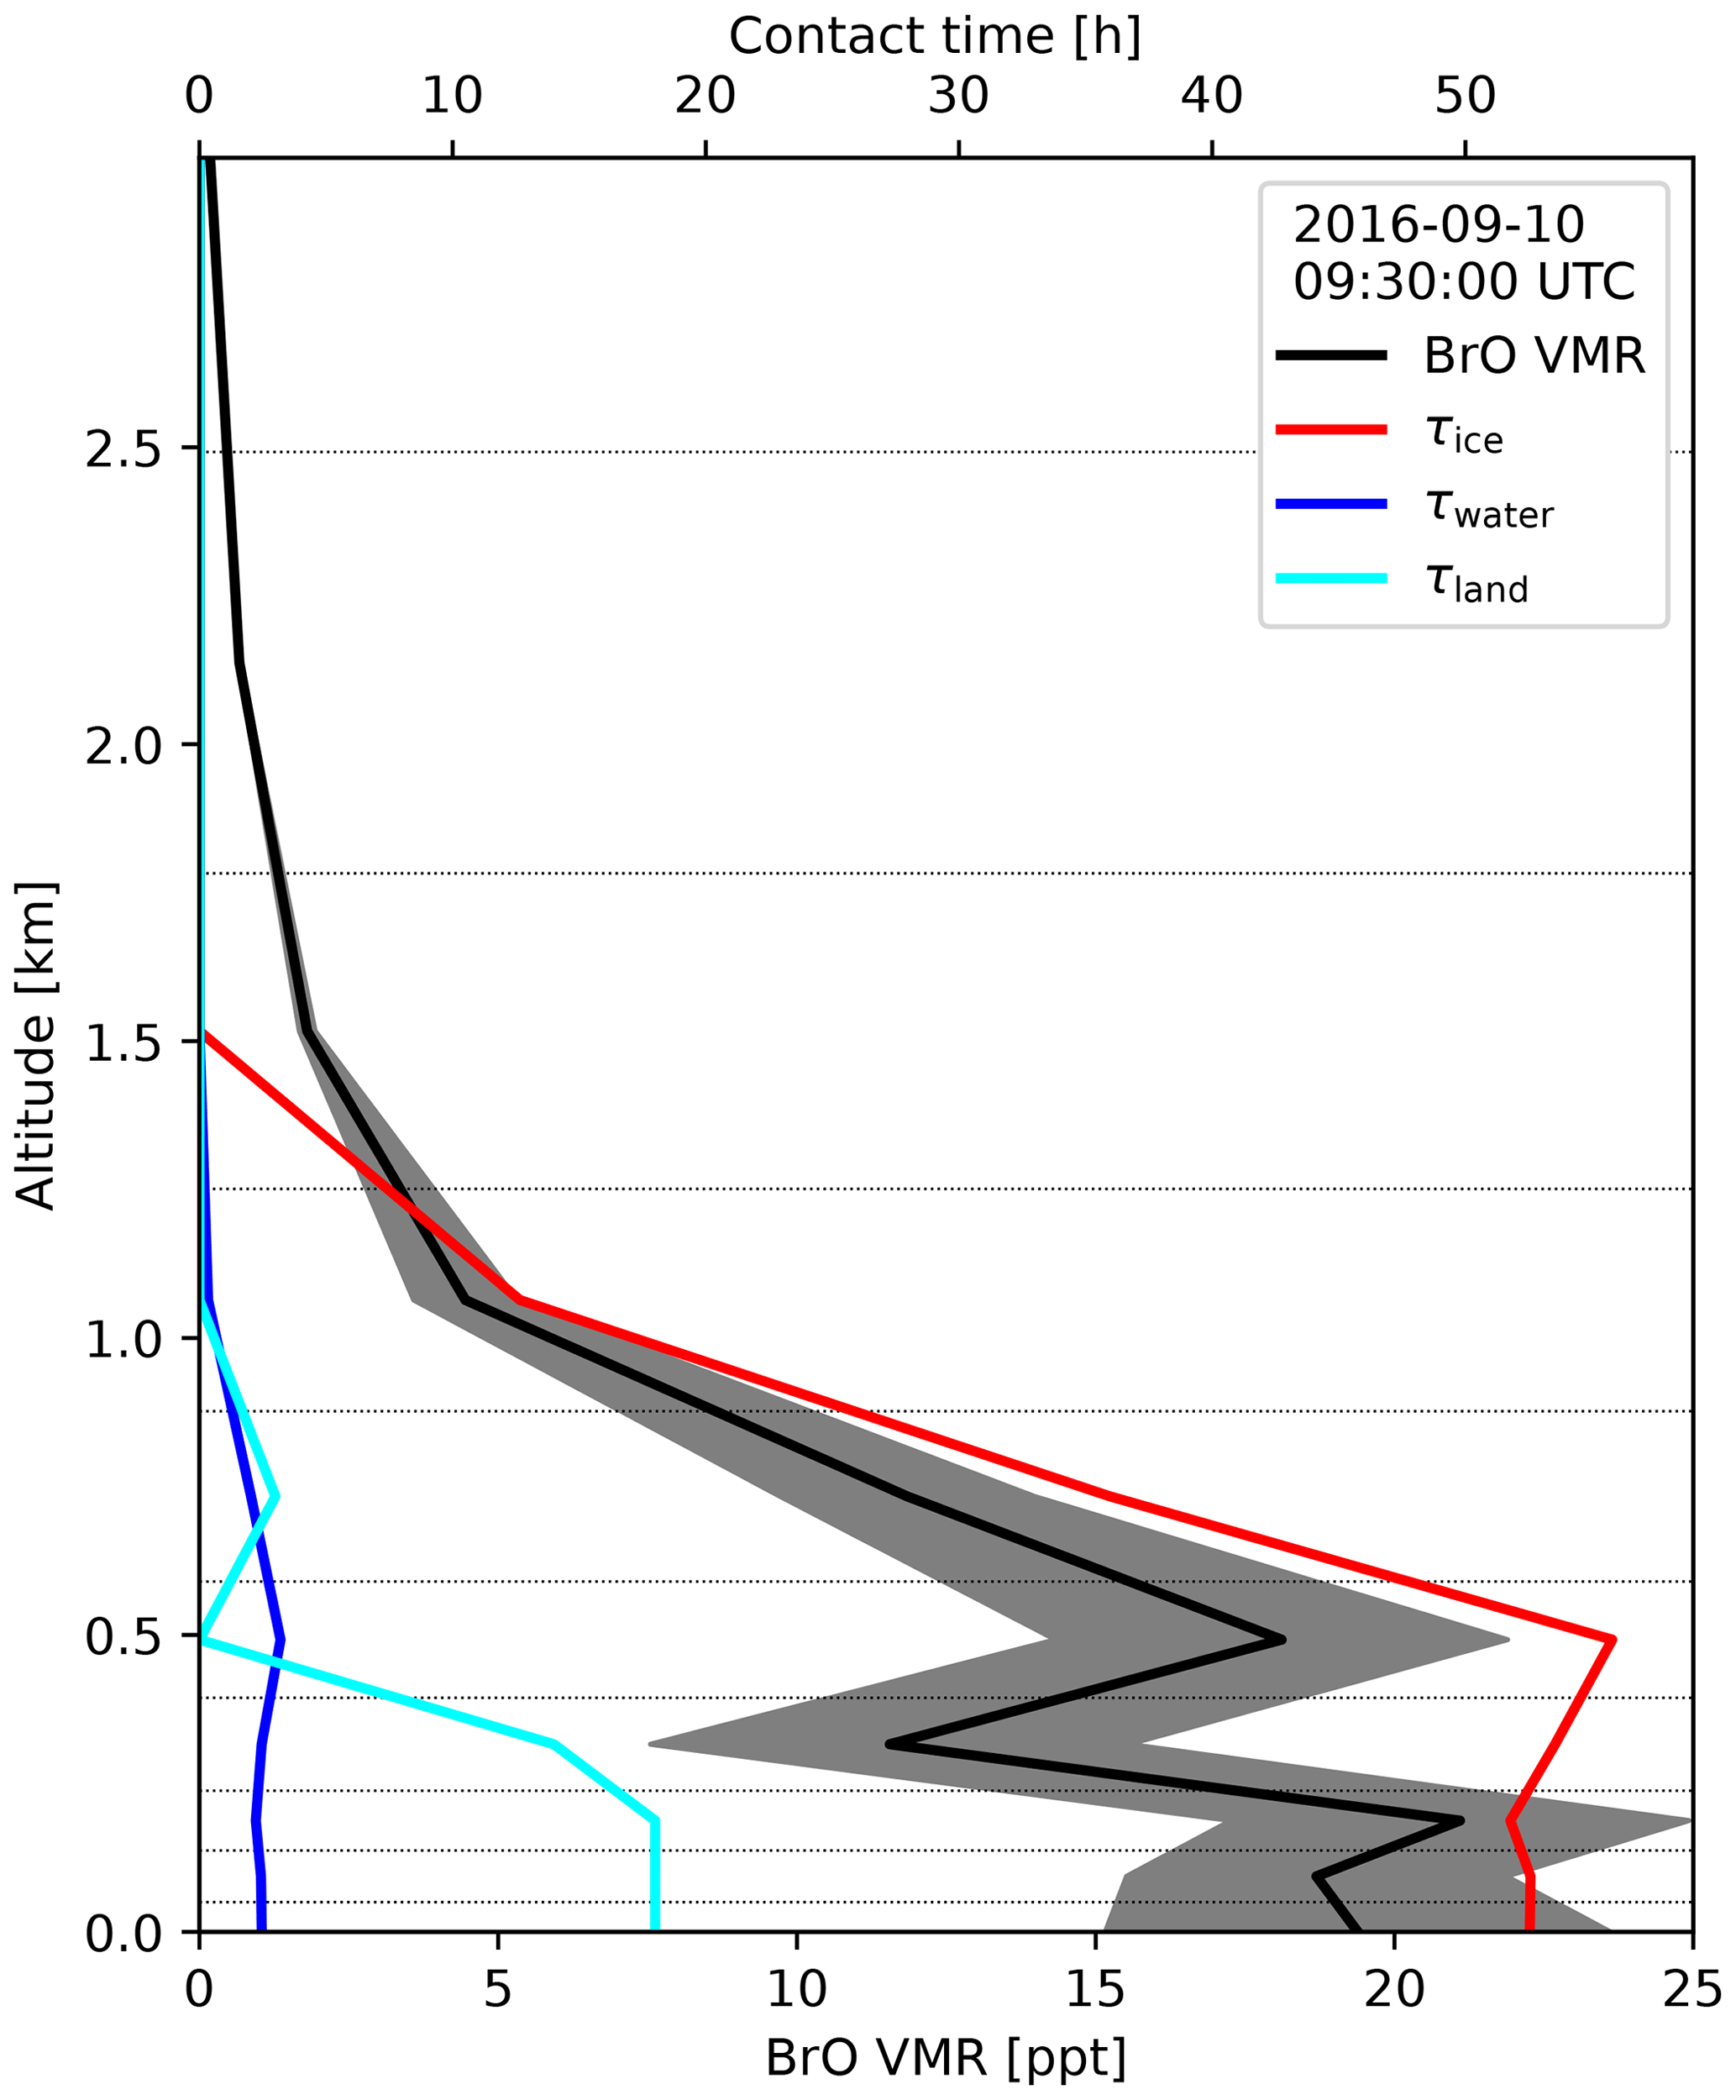
Figure 4Example for a vertical profile of BrO at NM (black line, bottom axis) together with the contact times (top axis) of the air parcels over ice (red), open water (blue), and land (cyan) on 10 September 2016 at 09:30 UTC. The grey-shaded area shows the random error in the BrO profile. Dotted horizontal lines indicate the retrieval layer boundaries.
An example for the results of the trajectory analysis during a period of enhanced BrO at NM in September 2016 is shown in Fig. 4. On 10 September 2016, about 20 ppt of BrO is present at the surface, and the BrO layer extends over an altitude of ≈1 km above the surface. The vertical profile of contact time with sea ice shows a large degree of similarity with the shape of the BrO profile from MAX-DOAS, while contact times with land are very small (<8 h), and there was very little contact with water surfaces. More detailed case studies on the relationship between BrO, aerosols, and air mass history will be presented in Sect. 3.1, and a statistical analysis of the relationship between different meteorological and geophysical parameters observed in situ and along the trajectories will be discussed in Sect. 3.3.
To identify potential source regions for reactive bromine, a source–receptor analysis was performed for BrO and aerosols as follows. First, the BrO volume mixing ratio (VMR) and aerosol extinction observed at the observation site, including measurements at all altitude layers, were assigned to the respective air parcel of the back-trajectory simulations. Following this, the median BrO VMR and aerosol extinction were calculated for all air parcels passing over each 1∘ × 1∘ latitude–longitude bin in an altitude below the MLH. By using the large number of observations from our long-term measurements, this yields maps of the source–receptor relation for BrO and aerosols in the Antarctic region. In addition, the mean wind speed and direction in each grid cell for air parcels located below the MLH are calculated from the trajectory data. The resulting source–receptor maps will be discussed in Sect. 3.4.
2.7 Regression analysis
The large number of MAX-DOAS measurements with more than 100 000 pairs of BrO and aerosol vertical profiles was used to infer the relationship between BrO and other parameters observed at both stations and modelled along the trajectories. The Pearson correlation coefficient (PCC) R for each pair of parameters observed at the measurement sites serves as a basis to investigate the relationship between the available meteorological and chemical quantities. To better account for possible non-linear effects, the PCC of BrO VMR and aerosol was determined using the logarithm of both parameters. The regression analysis was performed separately for the months August–September–October (ASO), November–December–January (NDJ), and February–March–April (FMA).
Table 4Surface parameters included in the regression analysis.
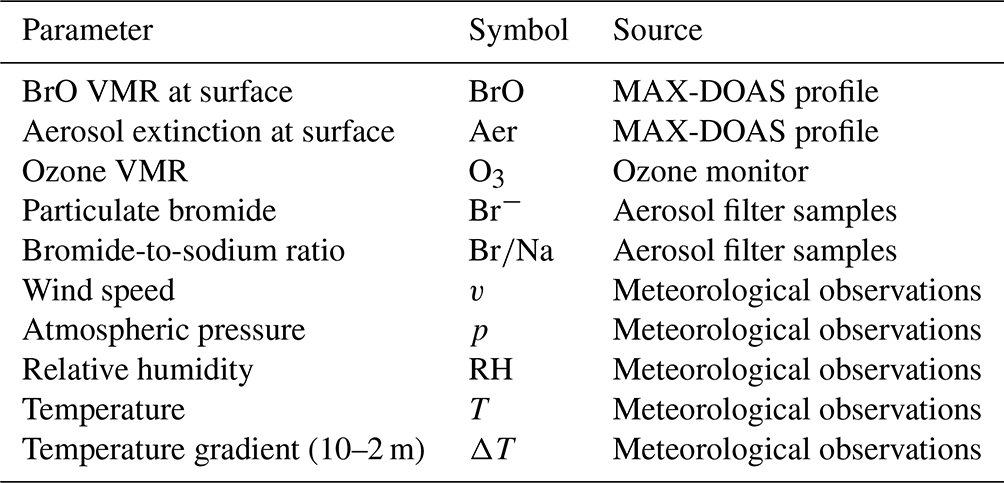
Table 5Columnar parameters included in the regression analysis.
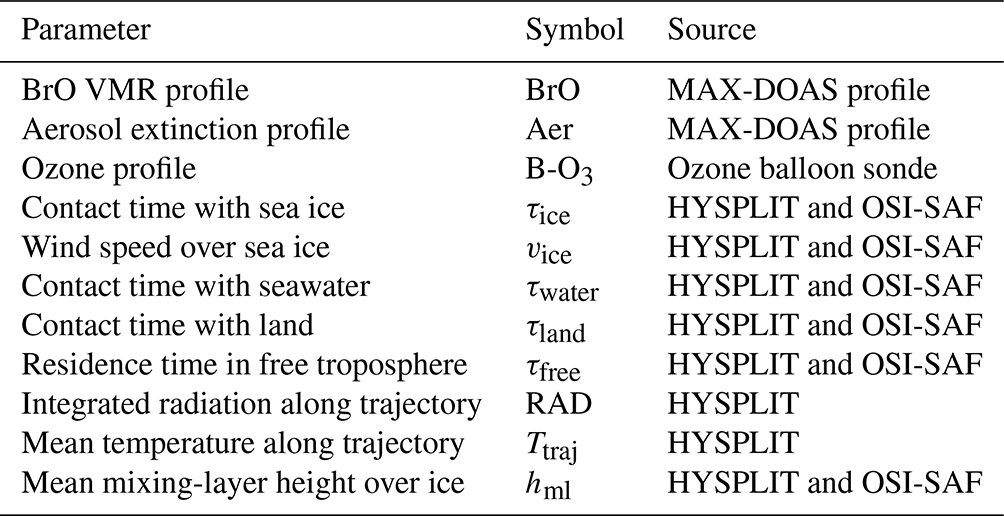
The parameters observed at the surface level that are included in the regression analysis are listed in Table 4. Apart from BrO and aerosol extinction retrieved at instrument altitude, these include the most important meteorological parameters (wind, temperature, pressure, relative humidity) and chemical parameters such as in situ ozone. The columnar parameters listed in Table 5 include BrO and aerosol extinction profiles from MAX-DOAS; ozone VMR from balloon soundings averaged over the MAX-DOAS retrieval layers; contact times with different surface types inferred from the back-trajectory analysis; and integrated radiation, mean temperature, and mean MLH over ice along the trajectories, which are calculated by the HYSPLIT model on the basis of GDAS meteorological fields. In order to exclude MAX-DOAS data with insufficient information content, the statistical analysis includes only BrO and aerosol profiles with a DOFS of ds>1.75. This means that measurements during extremely low visibility, in particular blowing snow, are excluded. In this way, about 24 % and 19 % of the profiles at NM and AH, respectively, are discarded. The results of the regression analysis will be presented in Sect. 3.3.
3.1 Relationship between BrO, aerosols, and air mass history: case studies
Examples for the relationship between BrO, aerosols, air mass history, meteorology, and ozone abundance during BrO enhancement episodes at NM and AH are presented in Figs. 5 and 6, respectively.

Figure 5Example for a BrO enhancement episode at NM during August–September 2006, showing (from top to bottom) (1) BrO VMR profiles; (2) aerosol extinction profiles; (3) profiles of the duration of sea ice contact; and (4) wind speed (black), surface temperature (blue), pressure (cyan), and surface ozone VMRs (red). Note the logarithmic colour scale of the BrO and aerosol extinction profiles. Dates and times are given in UTC.
The BrO enhancement episode at NM during August–September 2006 shown in Fig. 5 lasted for 12 d. Between 28 August and 8 September, air masses above NM were in contact with sea ice prior to their arrival at the measurement site for most of the time. At the same time, enhanced BrO was detected by the MAX-DOAS instrument. On 28 August, the lowermost 3 km of the atmosphere was in contact with sea ice for more than 30 h, while the MAX-DOAS instrument simultaneously detects enhanced BrO in the same altitude range. The surface layers are, however, less affected by sea ice contact and contain less BrO than the layers above. On 29 August, an uplifted layer of BrO with a peak altitude around 1 km builds up in coincidence with air masses with significant sea ice contact at slightly higher altitudes than on the previous day. The difference between the shape of the sea ice contact time profile and the BrO profile can be attributed to both uncertainties in the back trajectories and the lower sensitivity of MAX-DOAS to higher altitudes, which is even more limited by the presence of enhanced aerosol extinction near the surface, probably due to blowing snow at wind speeds close to 20 m s−1. Ozone is slightly depleted during this period, dropping from a background value of about 32 ppb to less than 25 ppb.
The period between 2 and 5 September is characterised by low aerosol extinction at slightly lower wind speeds than before. During this time, a shallow layer of enhanced BrO with a vertical extent of only 500–800 m is present. The trajectory analysis reveals that only these air masses close to the surface were previously in contact with sea ice. At the same time, ozone is significantly depleted, with minimum values below 10 ppb in the night from 3 to 4 September.
Between 6 and 8 September, wind speeds of up to 30 m s−1 led to blowing snow with reduced visibility and extinction coefficients of more than 10 km−1. On 7 and 8 September, air masses with sea ice contact times of more than 30 h are present at altitudes above 1.5 km. At the same time, uplifted BrO layers with peak altitudes around 1 km and BrO VMRs above 10 ppt are retrieved, despite the fact that the averaging kernels indicate a very low sensitivity to these altitudes due to the low visibility, which in turn results in large fluctuations in the BrO vertical profiles. Thus, it is quite possible that the true BrO layer was at higher altitudes than the retrieval indicates. At the same time, there is little ozone depletion, with the O3 VMR being reduced by less than 5 ppt, providing further evidence that the detected BrO resides in an uplifted layer.
The wind speed decreases and the visibility increases in the afternoon of 8 September. Afterwards, the air masses above NM were not in contact with sea ice any more, and only a very small BrO VMR below 1 ppt was detected, while the ozone VMR remains at values of 33 ppb, representing typical background levels for this time of the year.
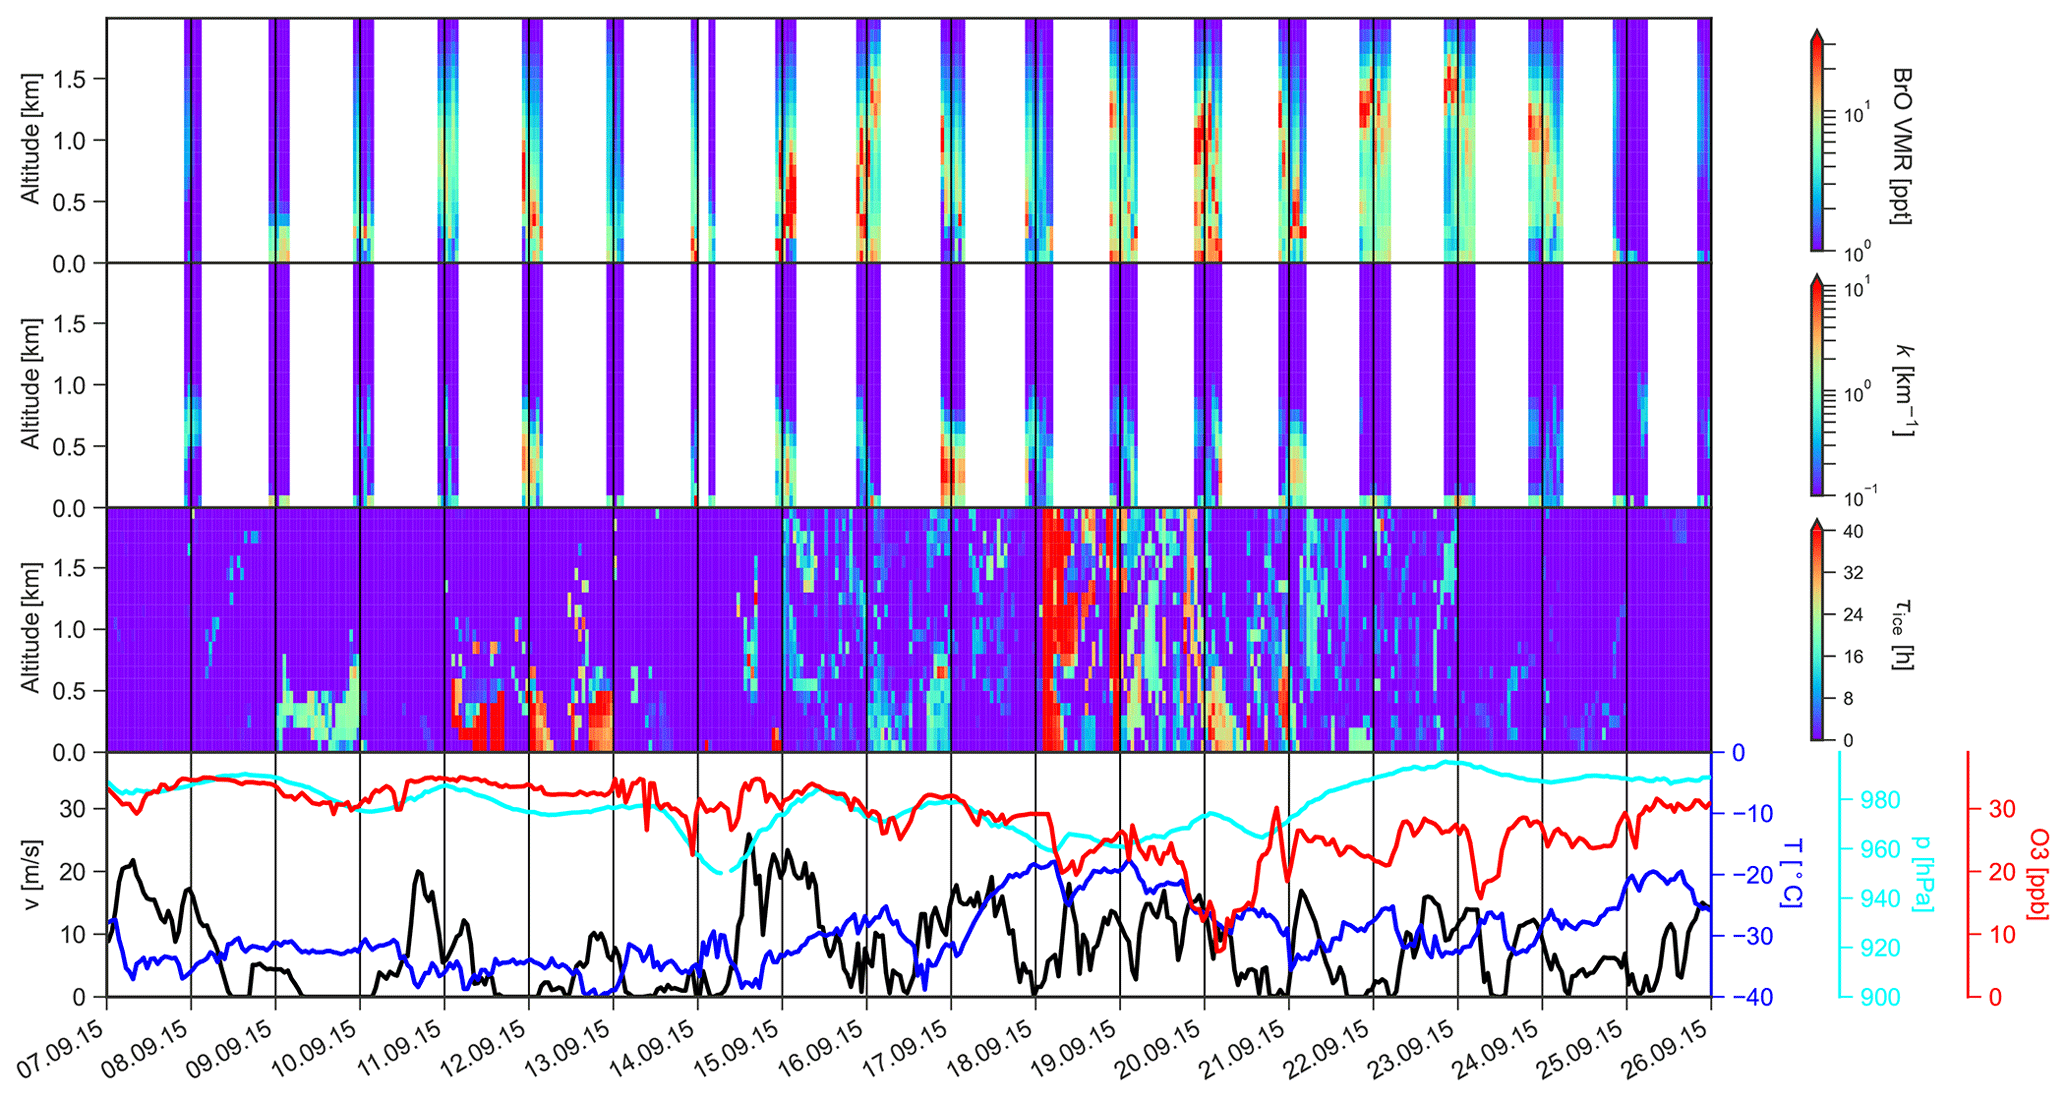
Figure 6The same as Fig. 5 but for a BrO enhancement episode at AH during September 2015. Note that meteorological parameters and ozone VMR are measured at the altitude of the MAX-DOAS instrument (184 m a.s.l.).
The BrO enhancement episode at AH during September 2015 shown in Fig. 6 illustrates that, in this place, BrO is usually distributed more diffusely and over a larger altitude range than at NM. This is a result of the more complex topography around AH, with the slopes of Ross Island leading to advection and vertical mixing of air masses. The period shown here is characterised by low temperatures, ranging between −20 and −40 ∘C, and wind speeds below 20 m s−1. The BrO enhancement episode was initiated on 9 September by air masses in the lowermost 1 km, i.e. mostly below the MAX-DOAS instrument, which were in contact with sea ice for a relatively short duration of about 15 h. At the same time, a BrO VMR of 5–10 ppt is detected by MAX-DOAS in the lowermost 400 m above the sea ice. Longer sea ice contact times in the same altitude range between 11 and 13 September lead to BrO VMRs above 10 ppt, distributed over an altitude range of 1.5–2 km, coincident with periods of enhanced aerosol extinction near the ground from 12 September onwards.
The wind speed increases after 14 September, and air masses with contact to the sea ice are present in the entire lower troposphere. BrO is found to be almost evenly distributed over the lowermost 3 km, despite the fact that the sensitivity of the MAX-DOAS retrieval is low at high altitudes. During this period, BrO VMRs exceed 20 ppt, and ozone starts to decline continuously until it reaches a minimum of 7 ppb on 20 September. Afterwards, there is only little contact of the air masses near the ground with sea ice, and ozone slowly recovers to reach background values of 30 ppb on 25 September.
An uplifted BrO layer at almost 3 km altitude, with peak values of VMR above 20 ppt, is present between 21 and 24 September, while around 2–5 ppt of BrO is present between the peak altitude and the surface. The trajectory analysis reveals that these air masses enriched in BrO had sea ice contact times of 15–20 h. A continuous decrease in the BrO peak altitude between 23 and 25 September is coincident with a similar decrease in the altitude range of air masses that were previously in contact with sea ice.
3.2 Spatio-temporal variability of BrO
The seasonal variation in BrO VCD and AOD is presented in Fig. 7. As expected, the highest BrO amounts are found during austral spring, with a maximum right after polar sunrise in August. During spring, BrO VCDs at NM are significantly larger than at AH and occasionally exceed 1014 molec. cm−2. The 95th percentile of the BrO VCD at NM is about 3 times larger than at AH. It can be excluded that these differences between both sites are due to the different vertical sensitivity of the profile retrieval because the averaging kernels for the BrO VCD are of similar magnitude (see Fig. 2). The larger abundance of BrO at NM compared to AH is instead caused by the differences in meteorological conditions, with the majority of the air masses at AH coming from the interior of the continent, while those at NM are mainly of maritime origin. Starting at polar sunset in August, the distribution of the BrO VCDs over the year follows an exponential-like decay at both stations.
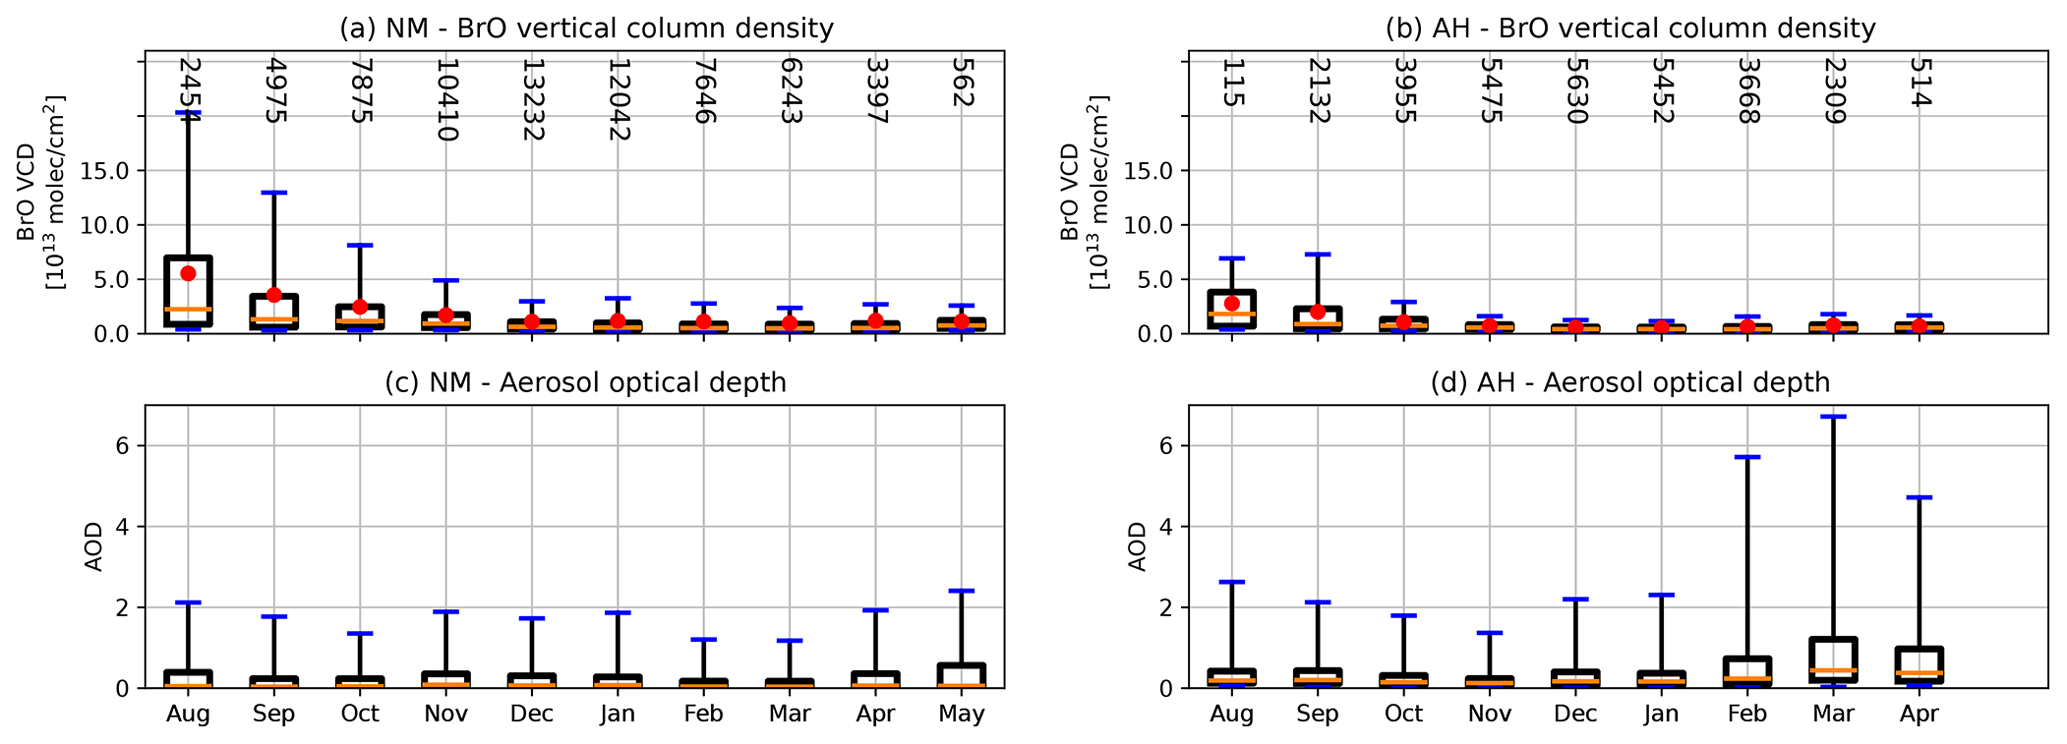
Figure 7Box-and-whisker plots of the seasonal variation in the BrO VCD (a, b) and AOD (c, d) for NM (a, c) and AH (b, d) based on all available data. Here (and in all following box and whisker plots), boxes indicate the 25th–75th percentile and whiskers the 9th–95th percentile. Mean and median are shown as red dots and vertical orange lines, respectively. The numbers denote the data count in each.
In contrast to AH, significant amounts of BrO are also present at NM during summer and autumn (December to May), with more than 5 % of the observations exhibiting BrO VCDs of more than 1.5×10¹³ molec. cm−2. The processes leading to the presence of BrO have been studied in detail by Nasse (2019) on the basis of continuous multi-annual long-path DOAS measurements at NM. It was found that BrO release during summer usually occurs under very calm and stable conditions with strong temperature inversions near the surface, which enable the accumulation of reactive bromine and lead to BrO VMRs of sometimes more than 100 ppt. These events are usually preceded by stormy periods, during which deposition of blowing snow, ice particles, and/or sea spray takes place. This provides evidence for the hypothesis that saline particles from the sea ice and/or from the open ocean transported to the measurement site on the shelf ice lead to the release of reactive bromine from the snow surface in situ. Only very little ozone destruction is observed during these BrO events in summer because their duration only ranges from several hours to at most 3 d. This situation is very different to the commonly known BrO explosions during spring, when large-scale transport of reactive bromine released from the sea ice to the measurement site takes place, leaving sufficient time for the depletion of ozone in the observed air masses. In contrast to NM, no significant amounts of BrO are detected at AH during summer and autumn. Again, this can be explained by the different meteorological conditions, with air masses coming mainly from the interior of the Antarctic continent.
In contrast to short-term variations in BrO and aerosols discussed below, there is no clear relationship between the BrO VCD and the AOD apparent in Fig. 7. At NM, aerosols are present in equal amounts over the year, while the highest amounts of aerosols are present during the period of lowest BrO abundance in FMA.
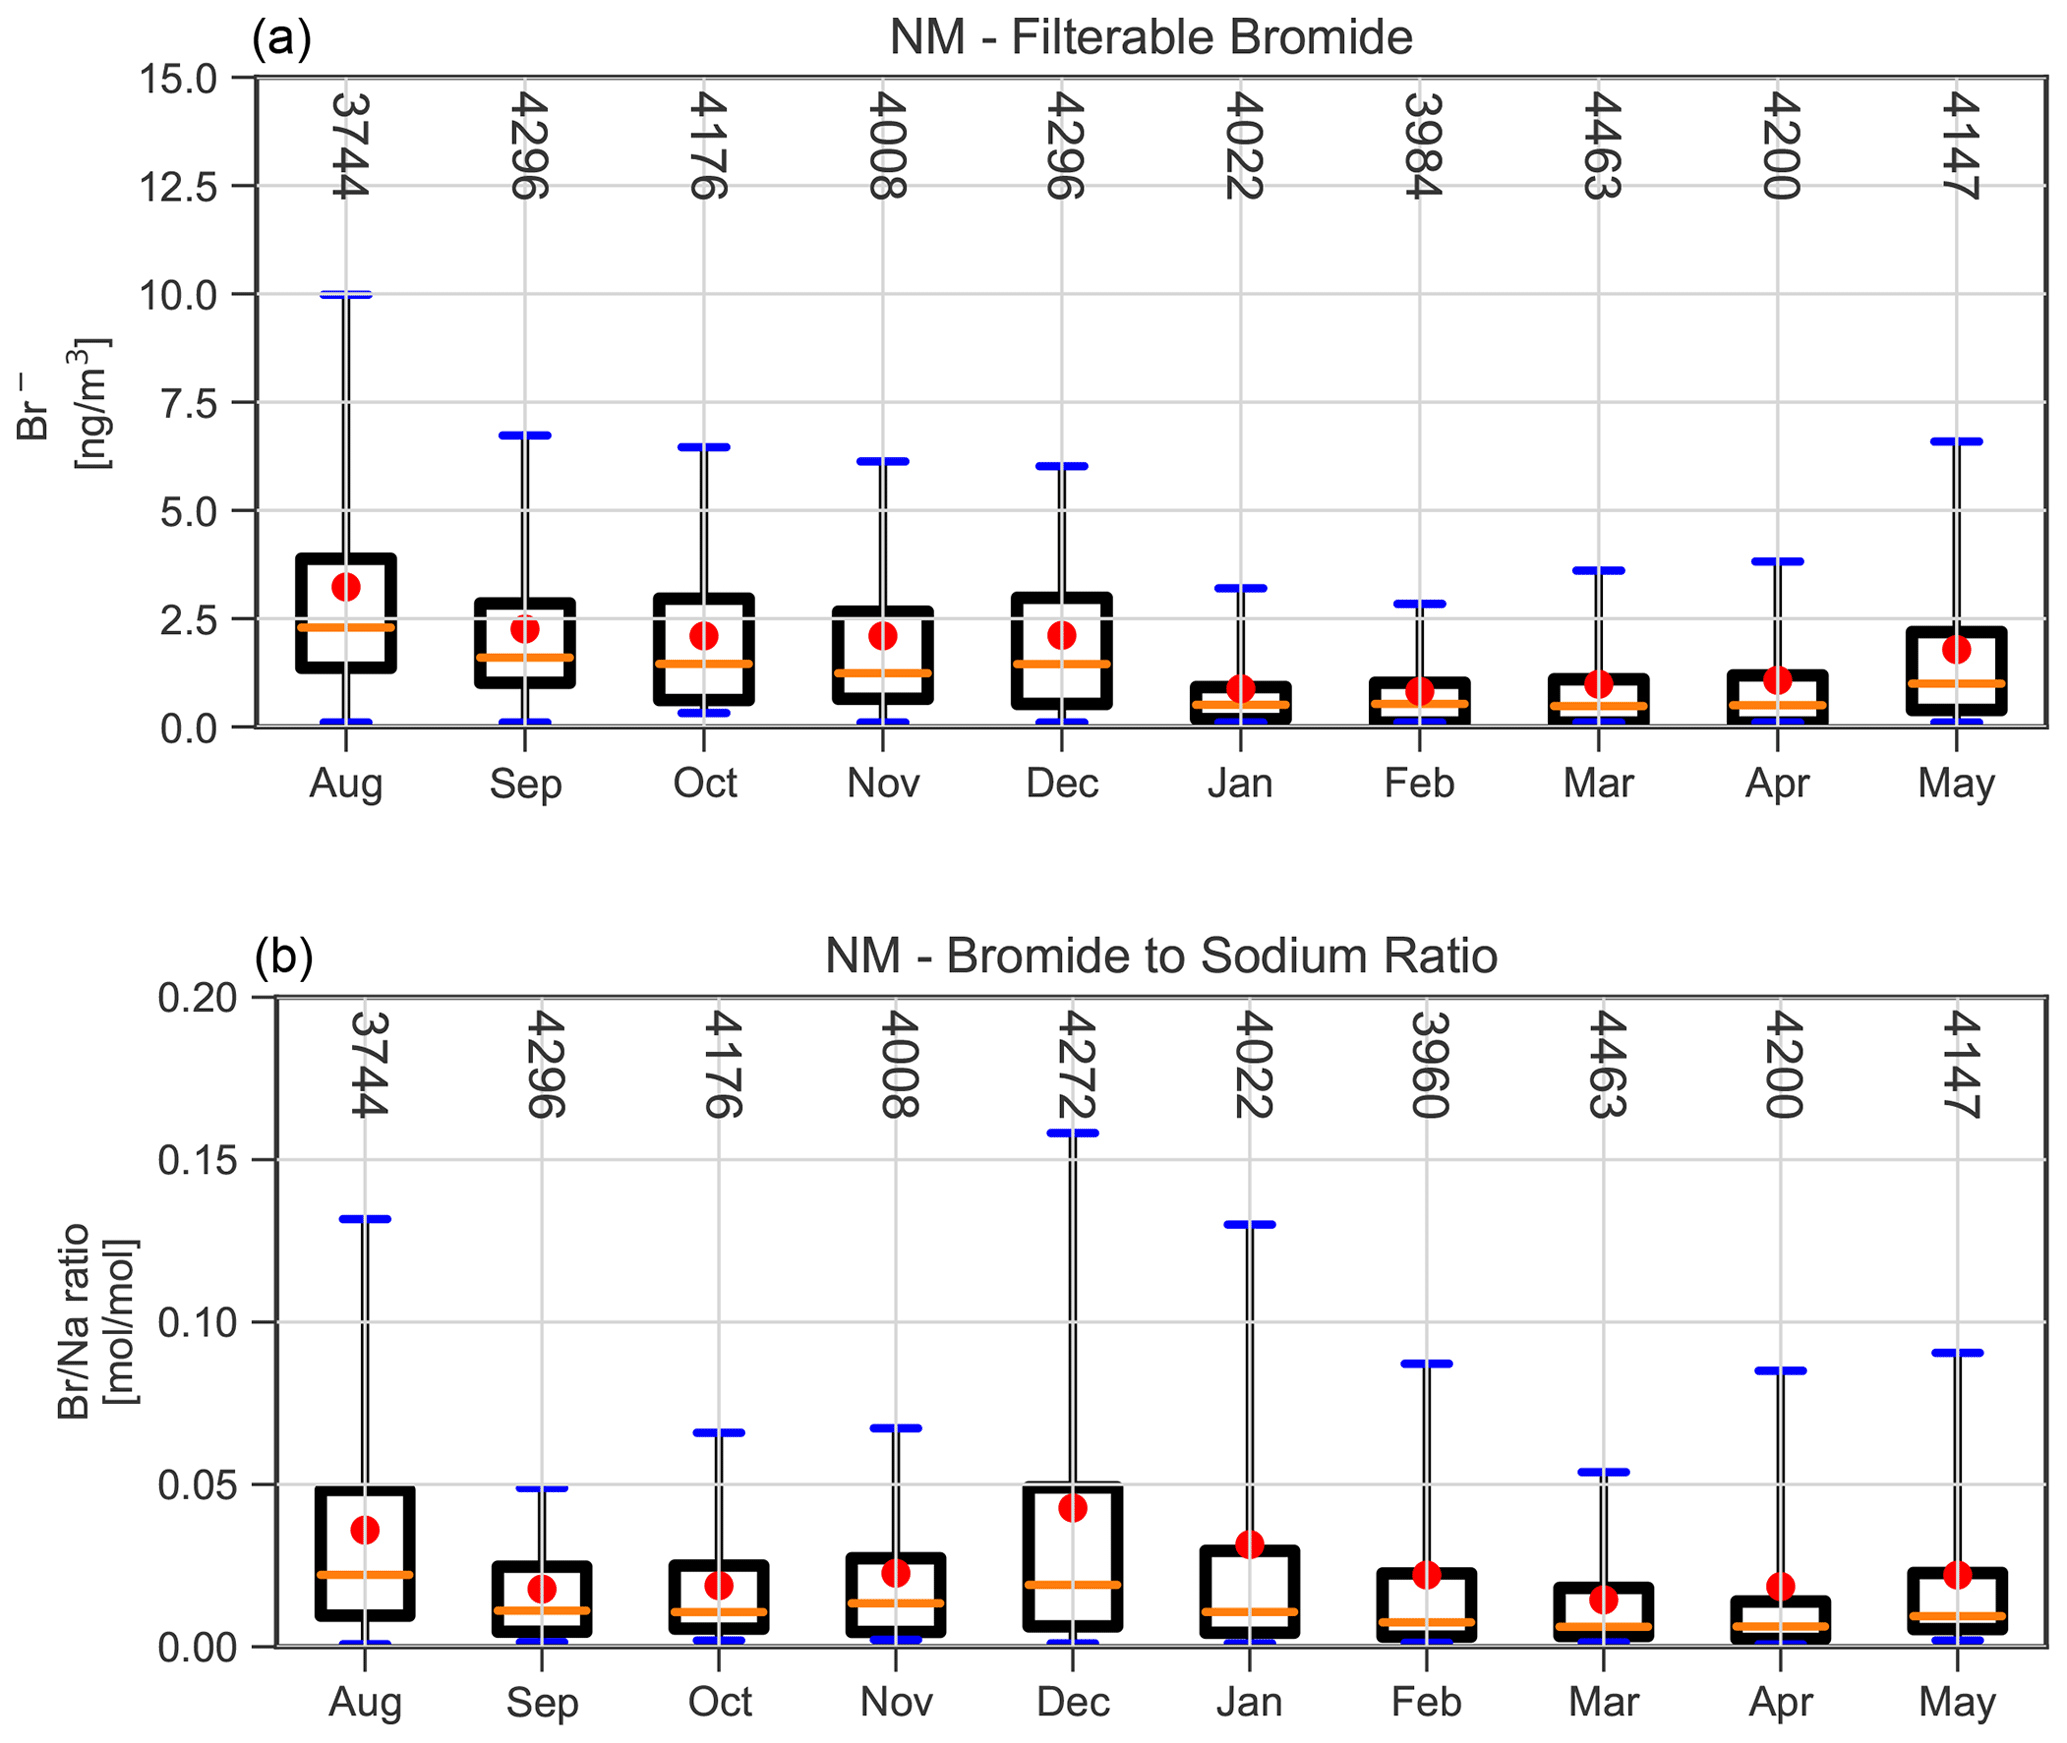
Figure 8Box and whisker plots of the seasonal variation in the particulate bromide concentration (a) and bromide to sodium ratio (b) determined from aerosol filter samples.
The bromide concentration derived from filter samples at NM shown in Fig. 8 has its maximum between August and December, remaining at a constant level during this period. There is a sudden decline in bromide from December to its minimum value in January, when most sea ice has disappeared. Particulate bromide concentrations increase again as the sea ice reforms during autumn, while the BrO abundance remains low. The molar bromide to sodium ratio in aerosols shown in Fig. 8b is strongly enhanced compared to mean seawater with a ratio of only , which means that an enrichment of the aerosol in bromide occurred either prior to the dispersion of the aerosol particles or by scavenging of gaseous bromide at the particle surfaces. This enhancement is in agreement with surface snow measurements on the Greenland ice sheet (Dibb et al., 2010), whereas snow sample measurements in the Arctic coastal region show ratios similar to the ocean water or even depleted in bromide (Simpson et al., 2005). The bromide to sodium ratio is smallest in September and October, as well as March and April, and has a maximum in August and December. This seasonality can be driven by a depletion of particulate bromide by heterogeneous release of reactive bromine on aerosols, by fractionation processes during the formation of the saline surfaces from which the particles originate, or by changes in the origin of the particles (sea ice versus open ocean) in the course of the year. In summary, it is not obvious from a seasonal perspective whether there is a direct link between bromine on airborne particles and BrO, which could point towards a heterogeneous release of reactive bromine from aerosols. More substantial conclusions will be drawn from the regression analysis presented in Sect. 3.3, where the relationship between particulate bromide and BrO is investigated separately for each season.
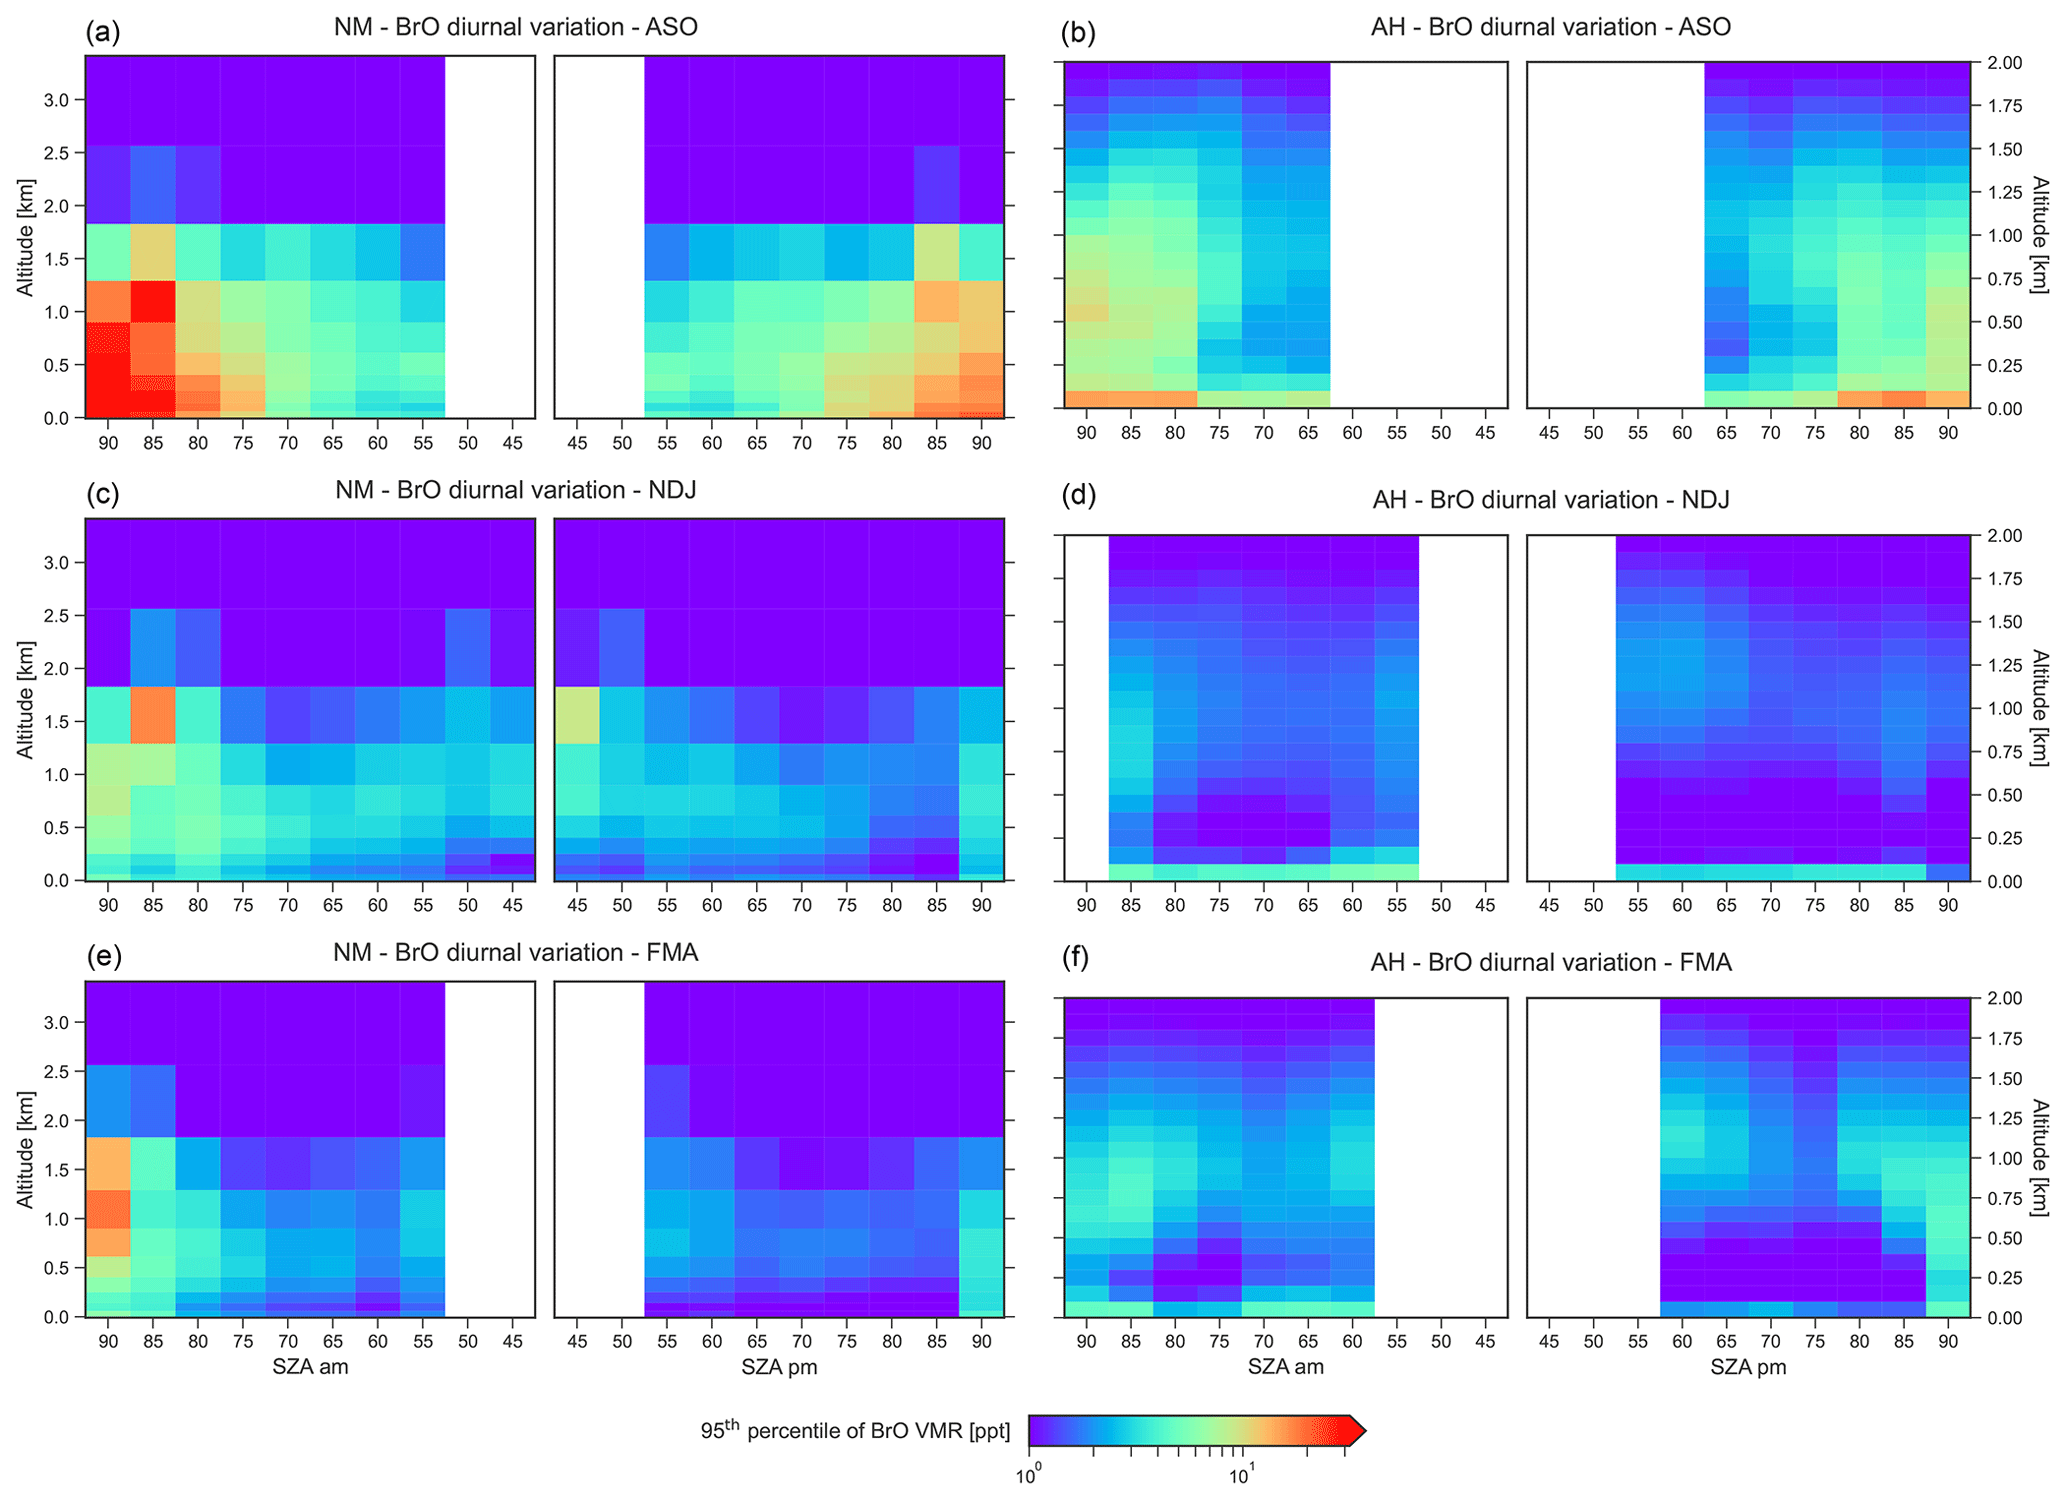
Figure 9The vertical distribution of the BrO VMR in the lowermost 3.5 km during periods of enhanced BrO as a function of SZA for NM (a, c, e) and AH (b, d, f) during ASO (a, b), NDJ (c, d), and FMA (e, f). The colour code indicates the 95th percentile of the BrO VMR in each season.
The vertical distribution of the BrO VMR as a function of SZA during periods of enhanced BrO, quantified by the 95th percentile of the BrO VMR, is shown in Fig. 9. During ASO, BrO shows a pronounced diurnal cycle with distinct maxima after sunrise and before sunset. The observed BrO minimum at noon is likely to be caused by an interplay of dynamics, with increased vertical mixing around noon, and photochemistry, with a shift in the partitioning between Br and BrO towards Br via Reaction (R1) in the presence of higher solar radiation. Higher BrO amounts are observed in the morning than in the evening at NM, whereas the diurnal variation at AH is more symmetrical. The morning peak in BrO is even more pronounced at NM during NDJ and FMA.
The morning maximum at NM is probably caused by the nocturnal release of molecular bromine (Br2) from the snowpack by reaction of ozone with bromide (Reactions R5 and R6), which is rapidly converted to reactive bromine via photolysis by visible light during sunrise. The fact that the strongest BrO morning peak is observed during FMA, when very little sea ice is present, indicates a local release of Br2 after deposition of saline particles, such as sea spray, on the snowpack during storms, a process that has already been observed from our LP-DOAS measurements at NM (Nasse, 2019).
The fact that the BrO abundance at AH is much smaller and does not show any diurnal variability during NDJ and FMA indicates that local sources are of less importance. This can be explained by the fact that the deposition rate of saline particles (sea spray or blowing snow dispersed from the sea ice surface) is expected to be much lower than at NM since air masses mostly come from the interior of the Antarctic continent.
The vertical distribution and the presence of uplifted layers of BrO are of particular interest since elevated BrO concentrations aloft are an indication of a possible transport of reactive bromine into the free troposphere, where small amounts are already expected to have a significant impact on ozone and cloud formation and thus on climate (von Glasow et al., 2004; Roscoe et al., 2014).
As shown in Fig. 9, the vertical distribution of BrO significantly changes over the year and is quite different at both sites. During ASO, BrO is equally distributed over the lowermost 1.5 km of the atmosphere at NM. In contrast, at AH a BrO maximum is present at the surface, and BrO is distributed over the lowermost 2 km with a lower abundance than at NM, probably because the local topography leads to enhanced vertical mixing.
During NDJ and FMA, BrO is present in a shallow layer at altitudes below 100 m at AH. In addition, a second BrO layer is present aloft at altitudes between 750 and 1500 m. The trajectory analysis indicates that at least parts of these uplifted BrO layers can be attributed to long-range transport of BrO-rich air parcels, with the air occasionally coming from the Weddell Sea (WS) and being transported over the Antarctic ice sheet to the RS. These transcontinental transport processes will be further discussed in Sect. 3.5. During NDJ and FMA, BrO is also present aloft at NM, where a layer low in BrO with a maximum thickness of about 300 m develops over the course of the day. This indicates that the snow surface on the ice shelf around NM acts as a sink for reactive bromine during the day due to insufficient amounts of bromide in the surrounding snowpack and/or dilution by vertical mixing, which means that Reaction (R4) does not lead to an amplification of gaseous reactive bromine compounds. However, during the night the surface acts as a source of gaseous bromine when Br2 accumulates in the boundary layer due to the release by heterogeneous reaction of bromide with ozone according to Reactions (R5) and (R6).
We further investigate the vertical distribution of BrO based on two key quantities, namely the BrO layer width w and the relative layer height , which are defined as follows. First, a Gaussian distribution is fitted to the BrO profile, yielding its centre height h and width σ. If the centre of the Gaussian distribution is above the surface (h≥0), then the width is defined either as w=σ if h≥σ or as if h<σ. The relative layer height is then defined as , and a profile can be considered as being uplifted if . If the centre of the fitted Gaussian is below the surface (h<0), then the layer width is defined as the e-folding height of an exponential fit to the profile, and the relative layer height is set to zero. Only observations with a BrO VCD >1013 molec. cm−2 are considered for the calculation of and w.
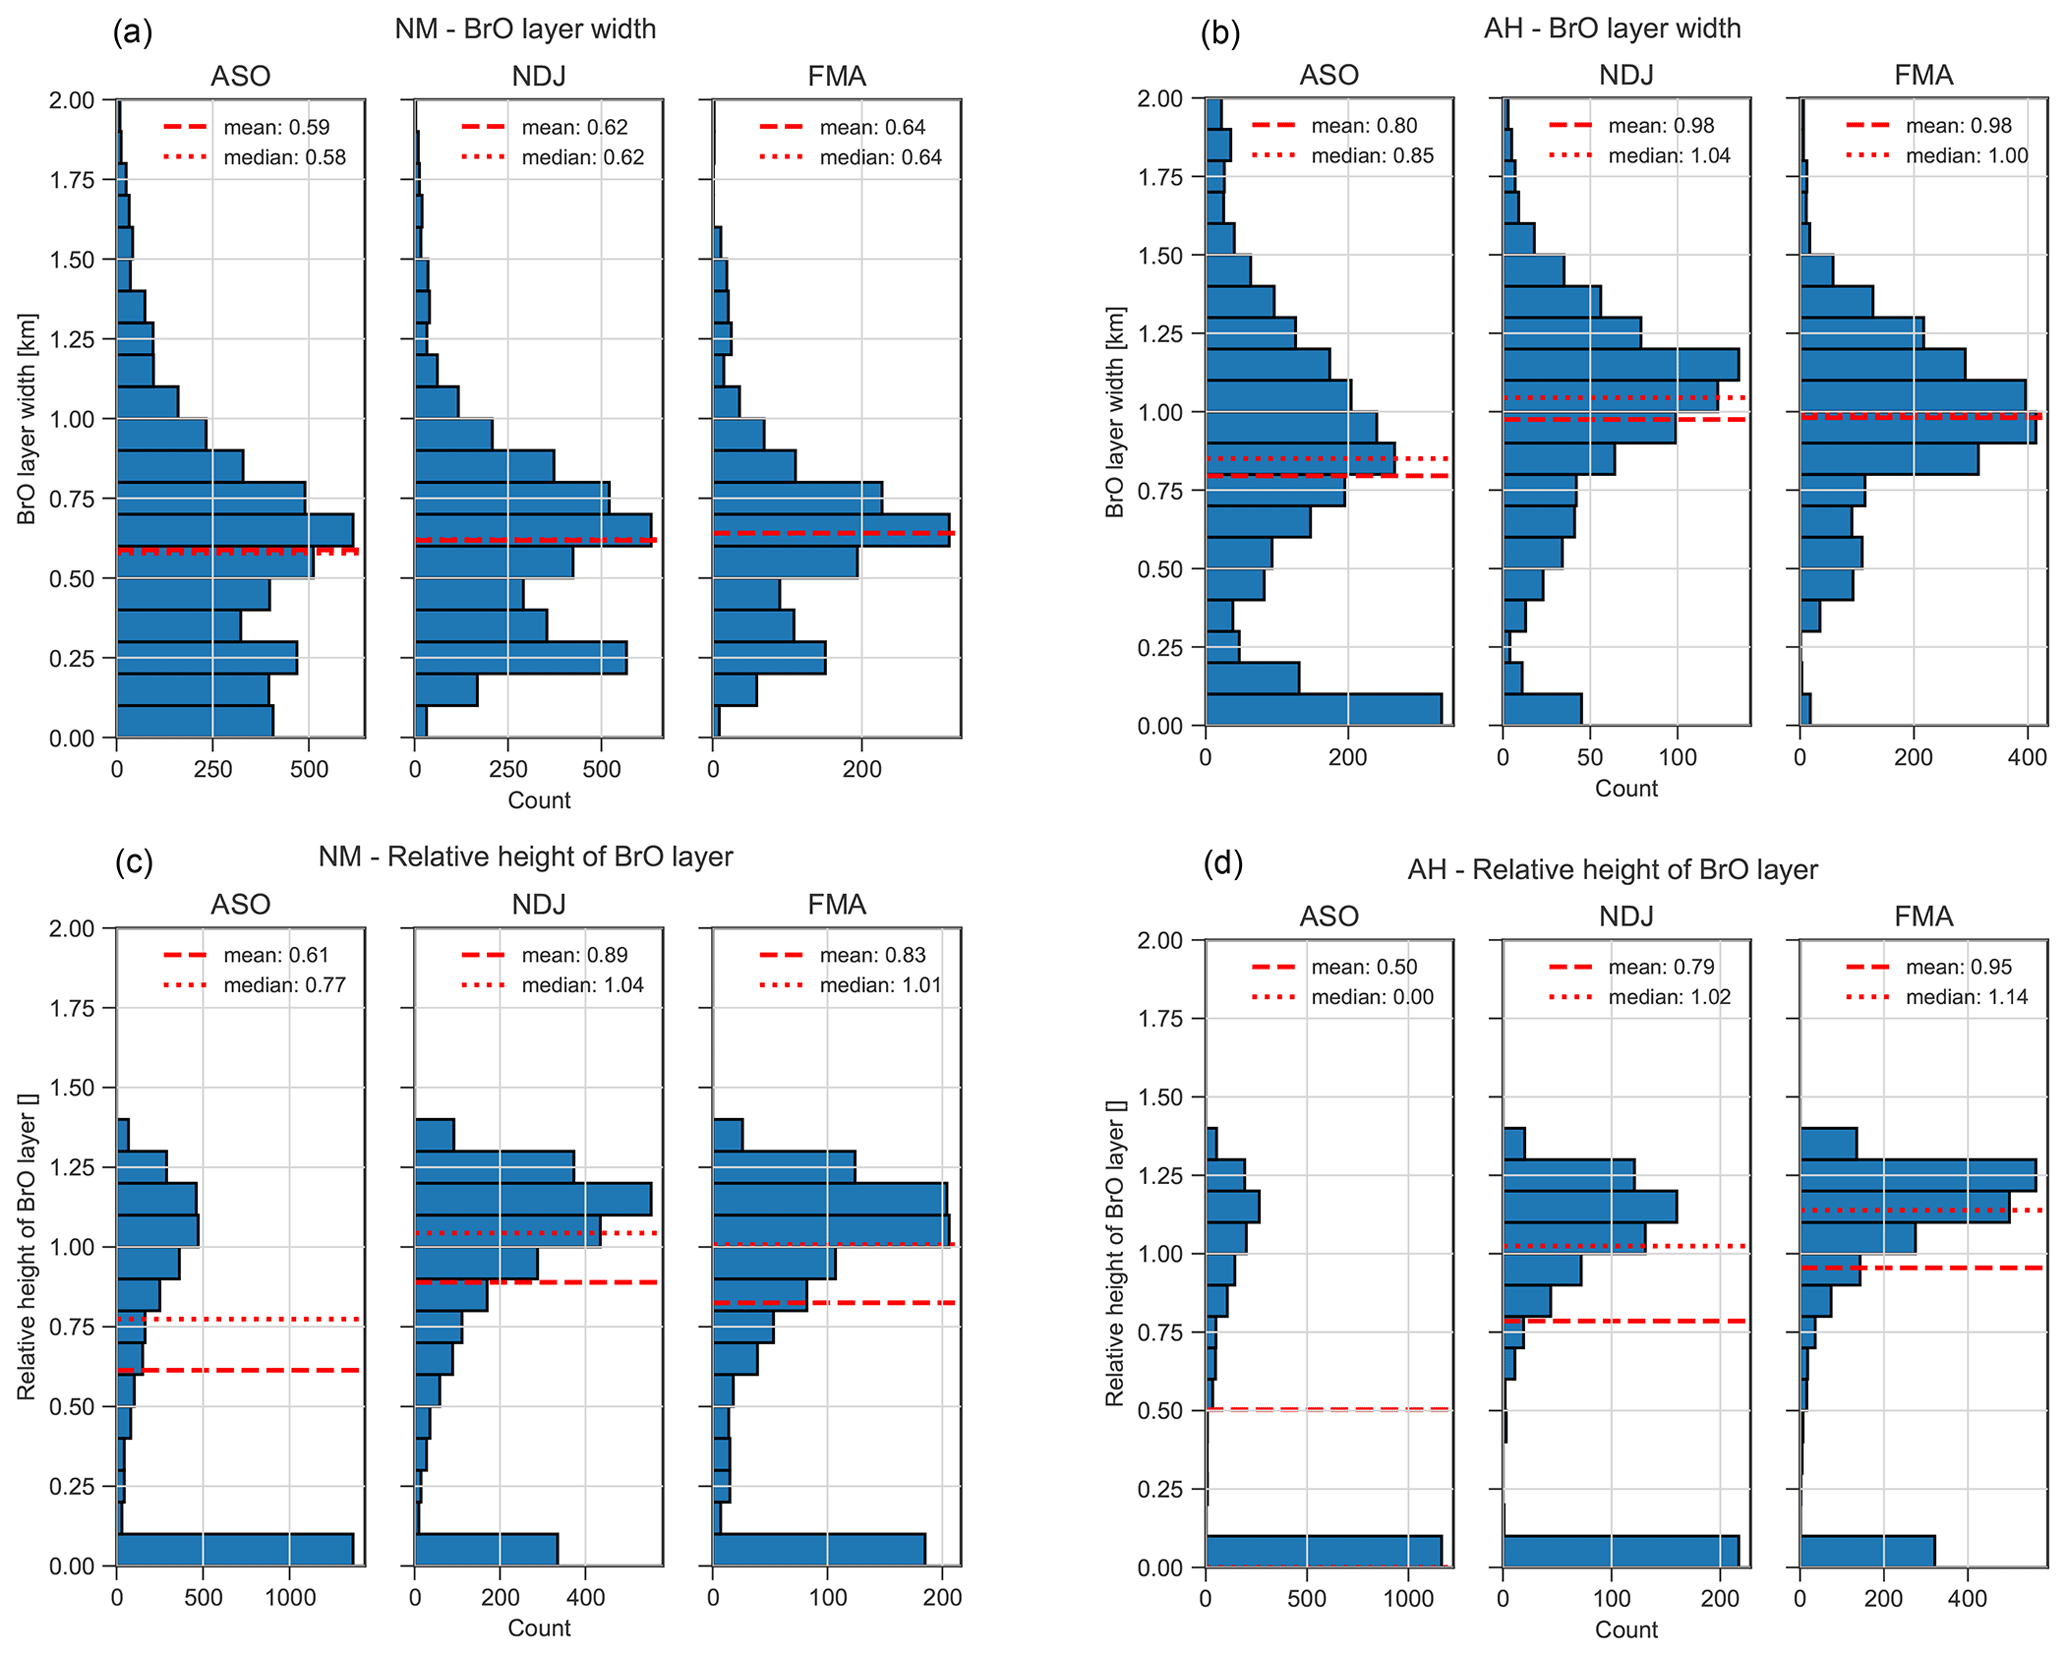
Figure 10Histograms of BrO layer width w (a, b) and relative layer height (c, d) for NM (a, c) and AH (b, d) during ASO, NDJ, and FMA (for a definition of w and , see Sect. 3.2). Dashed and dotted horizontal lines indicate mean and median, respectively.
The distribution of the layer width w shown in Fig. 10 ranges between 0 and 1 km for NM but reaches higher values of up to 1.5 km for AH, again indicating that there is stronger vertical mixing at AH. Very shallow layers with a vertical extent of less than 100 m are most frequently observed during ASO, while the layer width is larger during NDJ and FMA, when shallow layers with widths below 200 m are much less frequent, probably owing to enhanced vertical mixing in summer.
The distribution of the relative layer height shown in Fig. 10 confirms that the majority of the profiles reside at the surface during ASO, while uplifted profiles with a relative height become more frequent during NDJ and particularly during FMA. This represents a strong indication of transport of BrO into the free troposphere, where small amounts of reactive bromine are already expected to have a significant impact on the ozone budget, as well as on the oxidation of dimethyl sulfide (DMS), and thus on cloud formation (von Glasow et al., 2002a).
3.3 Regression analysis
The relation between different chemical, physical, and meteorological quantities available at both measurement sites is discussed here on the basis of a regression analysis as described in Sect. 2.7. Apart from the PCC for each pair of parameters, which quantifies the degree of correlation (R>0) or anti-correlation (R<0), we also inspected the corresponding p values (shown in Fig. S9), which represent the probability of the hypothesis that two parameters are not correlated. Apart from a few exceptions, p values are very close to zero, indicating that the probability of a correlation between most pairs of variables is high.
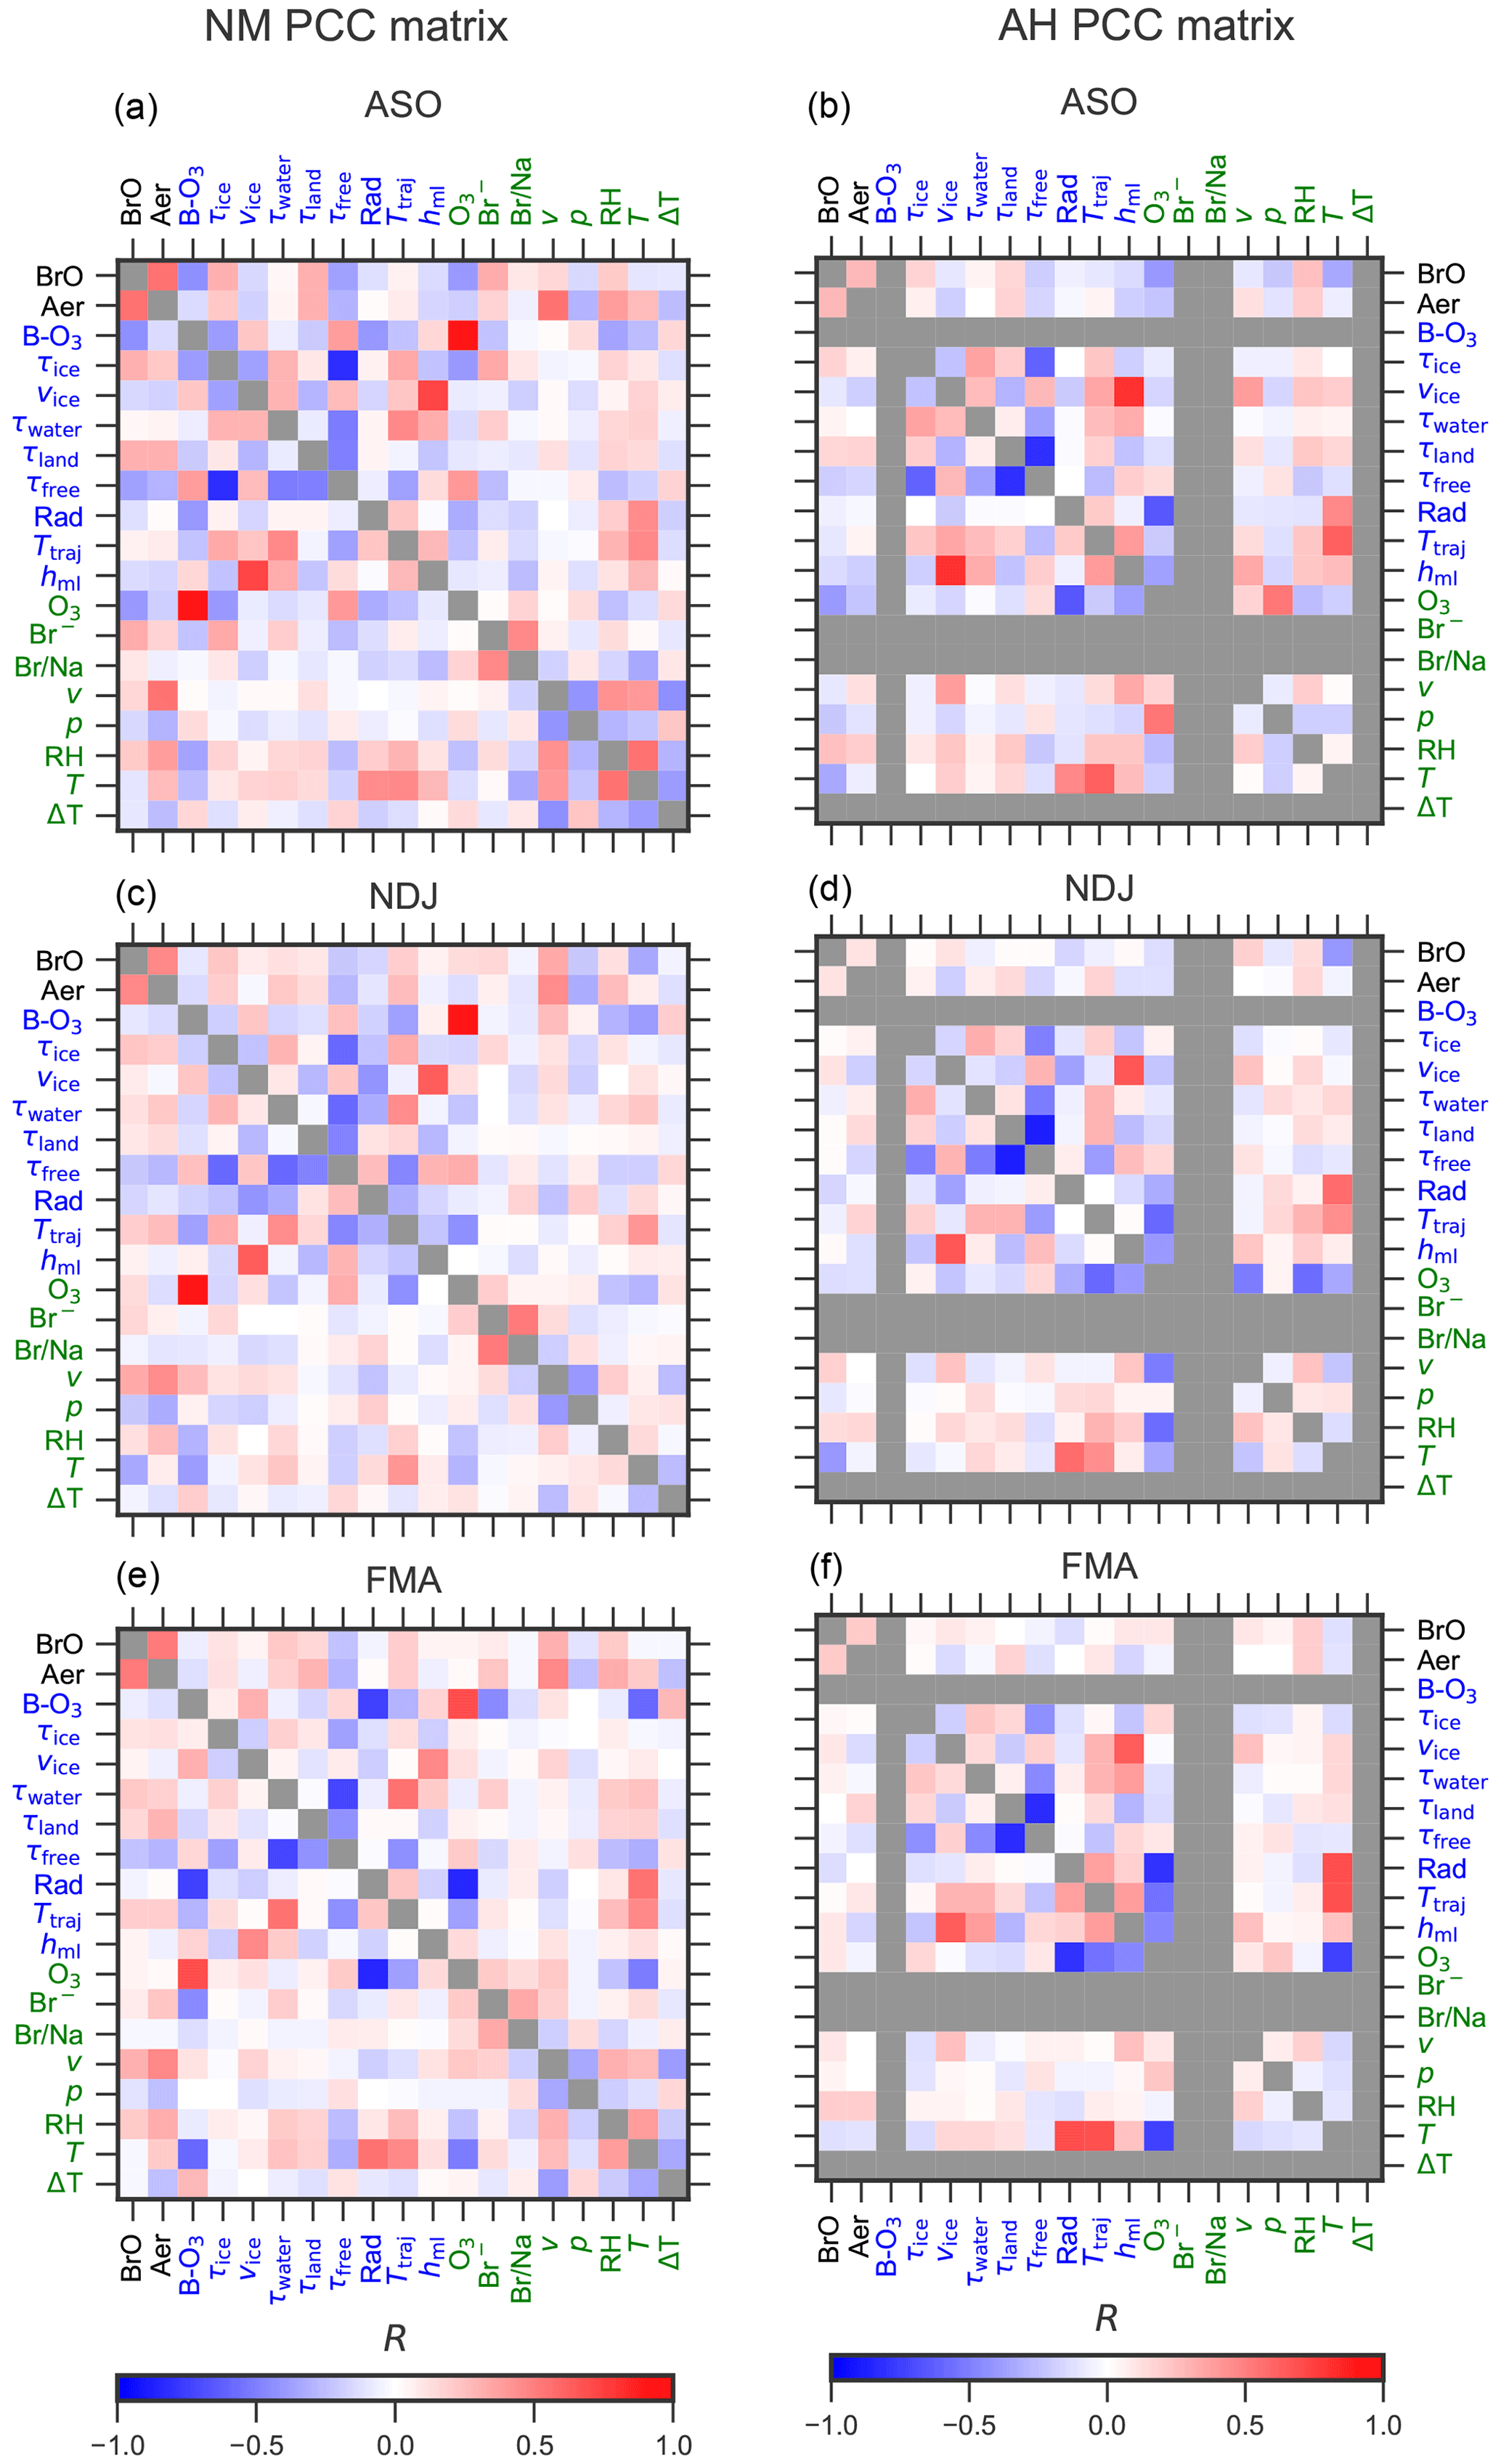
Figure 11Matrix of Pearson correlation coefficients (PCCs) between pairs of observed and modelled variables at NM (a, c, e) and AH (b, d, f) during each season. For a description of columnar and surface parameters, see Tables 5 and 4, respectively. Positively correlated parameters are shown in red, and anti-correlated parameters are shown in blue. Grey elements indicate unavailable data. Columnar variables related to the trajectory simulations and the ozone soundings are labelled in blue, while surface variables observed on site are labelled in green.
The PCCs for pairs of columnar and surface observables during each season are shown as matrices in Fig. 11. Correlation plots for each pair of variables can be found in the Supplement (Figs. S3–S8), where the slope and intercept of a linear fit based on orthogonal distance regression (Boggs et al., 1987) are also presented. At both sites, the most persistent correlation exists between BrO and aerosols ( at NM and at AH). This provides further evidence for the hypothesis that the release from saline particles, present either as blowing snow or sea salt aerosols, represents one of the most important sources for reactive bromine in polar regions (Frieß et al., 2011; Peterson et al., 2017; Choi et al., 2018; Hara et al., 2018).
At NM, BrO and aerosol extinction are both positively correlated to the duration of sea ice contact during all seasons, with a maximum during ASO (R=0.3 for the correlation between BrO and τice). In contrast, a noticeable positive correlation for BrO with τice at AH is only found during ASO (R=0.17) when sea ice extent is largest. These findings confirm that the sea ice is a main source for reactive bromine.
Bromide from aerosol filter samples at NM is positively correlated to BrO during all seasons. However, the PCC between bromide and BrO decreases from 0.32 during ASO and 0.16 during NDJ to 0.08 during FMA, while a correlation between bromide and aerosols is only observed during ASO (R=0.18) and FMA (0.23). The positive correlation between particulate bromide and sea ice contact during ASO (R=0.34) and NDJ (R=0.16) confirms that the bromide observed in filter samples at NM originates from the sea ice surface. The open ocean might, however, also contribute to particulate bromide during ASO and FMA, when bromide and τwater are positively correlated with PCCs of R=0.20 and R=0.19, respectively.
The bromide to sodium ratio from aerosol filter samples at NM does not correlate with the abundance of BrO (). Thus, a depletion of particulate bromide by heterogeneous release of reactive bromine, as observed on snow samples in the Arctic (Simpson et al., 2005), cannot be confirmed for NM. The bromide to sodium ratio shows some interesting relationships with other parameters. It is negatively correlated with temperature, solar radiation, and mixing-layer height during ASO, which may point towards the nature of the fractionation processes leading to an enhancement in particulate bromide. This topic requires, however, more detailed investigations that are outside of the scope of this study.
In most cases, BrO and aerosols are positively correlated with the locally measured wind speed v (during all seasons at NM and during NDJ and FMA at AH). Together with the positive correlation between aerosols and wind speed at NM (but not at AH), this again confirms the hypothesis that higher wind speeds lead to an increase in dispersion of snow and ice particles and to a subsequent BrO release from their surfaces. One would expect that the wind speed vice of the air parcels over sea ice would be an even better indicator for particle dispersion from the frozen ocean, but this parameter is negatively correlated to BrO and aerosols during ASO at both sites. A possible explanation for this discrepancy between local wind speed and mean wind speed over ice could be that the time the air parcels spend over sea ice, which anti-correlates with wind speed, is of more importance than a dispersion of particles. On the other hand, the wind speed over ice is strongly linked to the thickness of the boundary layer, with a PCC of up to R=0.8 between vice and hml, while both BrO and aerosols are negatively correlated to the mixing-layer height over ice. This could be caused by a stronger accumulation of BrO in a more shallow boundary layer with reduced vertical mixing, which in turn leads to a stronger release of reactive bromine because of the non-linear nature of the bromine explosion mechanism.
BrO and aerosols are positively correlated not only with the sea ice contact time τice but also with τland, which represents the contact time with the shelf ice regions and the interior of the Antarctic ice shield (at AH only during ASO and at NM during all seasons). This could be an indication that BrO is released from snow surfaces in the interior of the continent after deposition of saline particles that originate from the sea ice and/or the open ocean and are transported inland, as previously observed far from the coast on the Greenland ice sheet (Stutz et al., 2011). This aspect will be discussed in more detail in Sect. 3.4.
Except during ASO (when sea ice extent is at its maximum), BrO and aerosols at NM are positively correlated to the contact time with ocean water τwater. This could be caused by BrO release directly from sea spray, as observed in mid-latitudes and the tropics where BrO was found to be present in the lower parts per trillion range at coastal stations and during ship cruises (e.g. Leser et al., 2003; Saiz-Lopez et al., 2004). Another explanation could be the release of reactive bromine from the snow surface after deposition of saline particles, which is a likely source for the morning peak in BrO during FMA at NM discussed in Sect. 3.2.
BrO and aerosols are either anti-correlated or (in case of AH during NDJ and FMA) uncorrelated with the residence time of the air parcels in the free troposphere (τfree), where sources for neither reactive bromine nor particles are expected to be present.
Although one would expect that radiation would amplify the photochemical cycles that lead to the heterogeneous release of reactive bromine, leading to a positive correlation between BrO and integrated solar radiation along the trajectories, we instead find a small negative PCC between these variables at both sites during ASO and NDJ.
This is a further indication of the importance of a heterogeneous release of Br2 during the night (see Sect. 3.2), leading to a peak in reactive bromine right after sunrise when radiation levels are still low.
There is no clear relationship between temperature and BrO abundance at NM, with in situ temperature and mean temperature along the trajectories showing different signs. In contrast, BrO and temperature at AH are negatively correlated during ASO and NDJ both in situ and along the trajectories, which is a finding that is in agreement with BrO observations in the Arctic (Pöhler et al., 2010). Increased BrO release at low temperatures can be expected due to carbonate precipitation from sea ice at low temperatures, resulting in a reduction in its buffer capacity that facilitates acidification of saline surfaces, which is an important prerequisite for heterogeneous bromine release (Sander et al., 2006).
A significant impact of BrO on ozone, both from ozone soundings as a columnar parameter and from the ozone monitor as a surface parameter, is only found during ASO, with a PCC between BrO and O3 of . There is little correlation between BrO and O3 during NDJ and FMA, indicating that no significant ozone depletion takes place at times other than during polar spring, despite the fact that BrO is occasionally abundant during NDJ and FMA, with VCDs of more than 1.5×10¹³ molec. cm−2 at NM during these periods (see Fig. 7). This can be explained by the more sporadic nature of the bromine release events during summer, which are linked to stable conditions with strong temperature inversions, allowing for an accumulation of BrO without leaving sufficient time for a significant ozone depletion (Nasse, 2019).
3.4 BrO source–receptor analysis
Figure 12 shows source–receptor maps for BrO and aerosols at Neumayer Station during ASO (respective plots for NDJ and FMA for both stations are presented in Figs. S10–S15). Air masses rich in BrO mainly originate from the WS and from the coastline of the EIS east of Neumayer Station. A particular hot spot is the Filchner–Ronne Ice Shelf (FRIS) in the south of the WS. As can be seen from the stream lines in the wind direction plot in Fig. 12, air parcels are usually transported to the measurement location, either from the east along the coastline of the EIS or from the West Antarctic ice sheet over the FRIS and the WS. Observations of the BrO VCD at Belgrano Station at the southern end of the WS do not exceed 2×10¹³ molec. cm−2 (Prados-Roman et al., 2018), but the measurement period does not start before early October at this location far to the south, and the springtime BrO season is already at its end during this time at NM (see Fig. 7). Long-path DOAS measurements at Halley Bay show maximum BrO VMR of about 20 ppt during spring Saiz-Lopez et al. (2007), but these were located on the eastern coast of the Weddell Sea where our source–receptor analysis indicates a strong spatial gradient between onshore and offshore BrO.
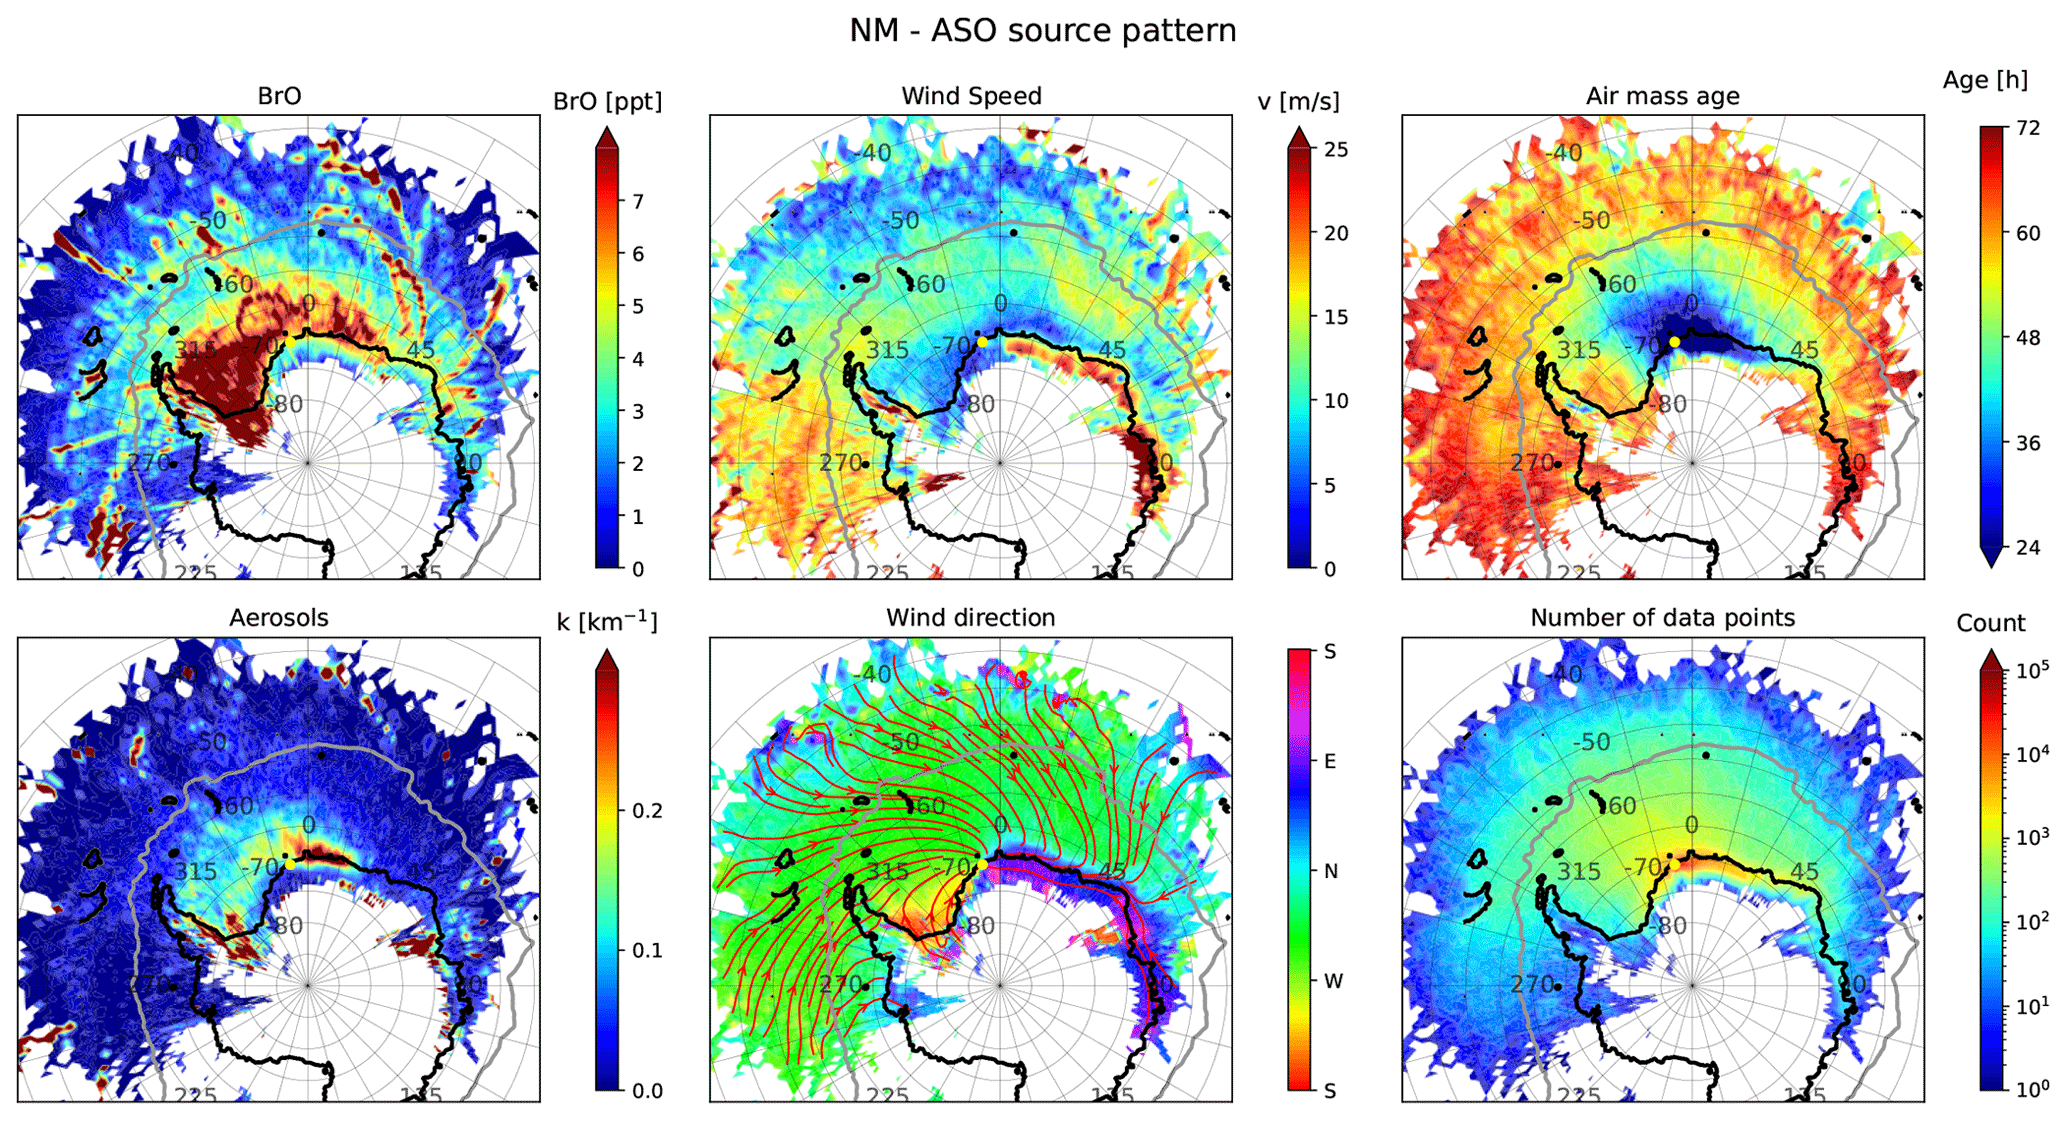
Figure 12Source–receptor maps of BrO at NM during ASO, together with source–receptor maps of mean aerosol extinction, wind speed, wind direction, and air mass age, as well total number of air parcels, within each 1∘ × 1∘ grid cell. The thick grey line indicates the mean location of the sea ice edge during ASO. The wind direction plot also contains average stream lines of the airflow (red lines with arrows). The yellow dot indicates the location of the measurement site.
The coastline east of Neumayer is an area where polynyas are frequently present and where the production rate for sea ice is high (Tamura et al., 2008; Nakata et al., 2021). The newly formed sea ice is usually covered by a brine layer that represents a potential source for reactive bromine (Morin et al., 2008). Frost flowers formed on top of the brine layer, which represent fragile crystals that easily become airborne, contribute 40 % of the deposition of sea salt on the ice shelf and continental ice sheet (Kaspari et al., 2005). Figure 12 shows that the aerosol extinction is significantly increased if the air travels along this coastline, which means that particles, probably with high salinity, are transported from there to NM. The eastern boundary of this area with enhanced extinction is located at about 20∘ E, where a persistent area of open water with a high sea ice production rate named the Cape Darnley polynya is located (Nihashi and Ohshima, 2015).
The fact that air masses originating from the FRIS are high in BrO is surprising since no ocean water (the primary source for reactive halogens) is present in this area. A possible explanation would be that dense air masses are transported from the interior of the continent past the FRIS and are afterwards in contact with sea ice in the WS. However, satellite measurements also detect high amounts of BrO in the FRIS region (e.g. Theys et al., 2011; Schönhardt et al., 2012), confirming that this area represents a hot spot for the production of reactive bromine. This requires a sufficient supply of halides from the ocean and/or sea ice to this region via deposition of saline particles. Cyclonic activity possibly leads to the transport of air masses from the southern WS, which represents a region of high sea ice production rate (Tamura et al., 2008; Nakata et al., 2021; Nihashi and Ohshima, 2015), to the ice shelf. However, the interplay between transport of saline particles to the FRIS and the subsequent release of reactive bromine in the presence katabatic winds, which leads to the transport of BrO-rich air masses to NM, remains a subject for future investigations that requires a more detailed analysis of the meteorological conditions in this area.
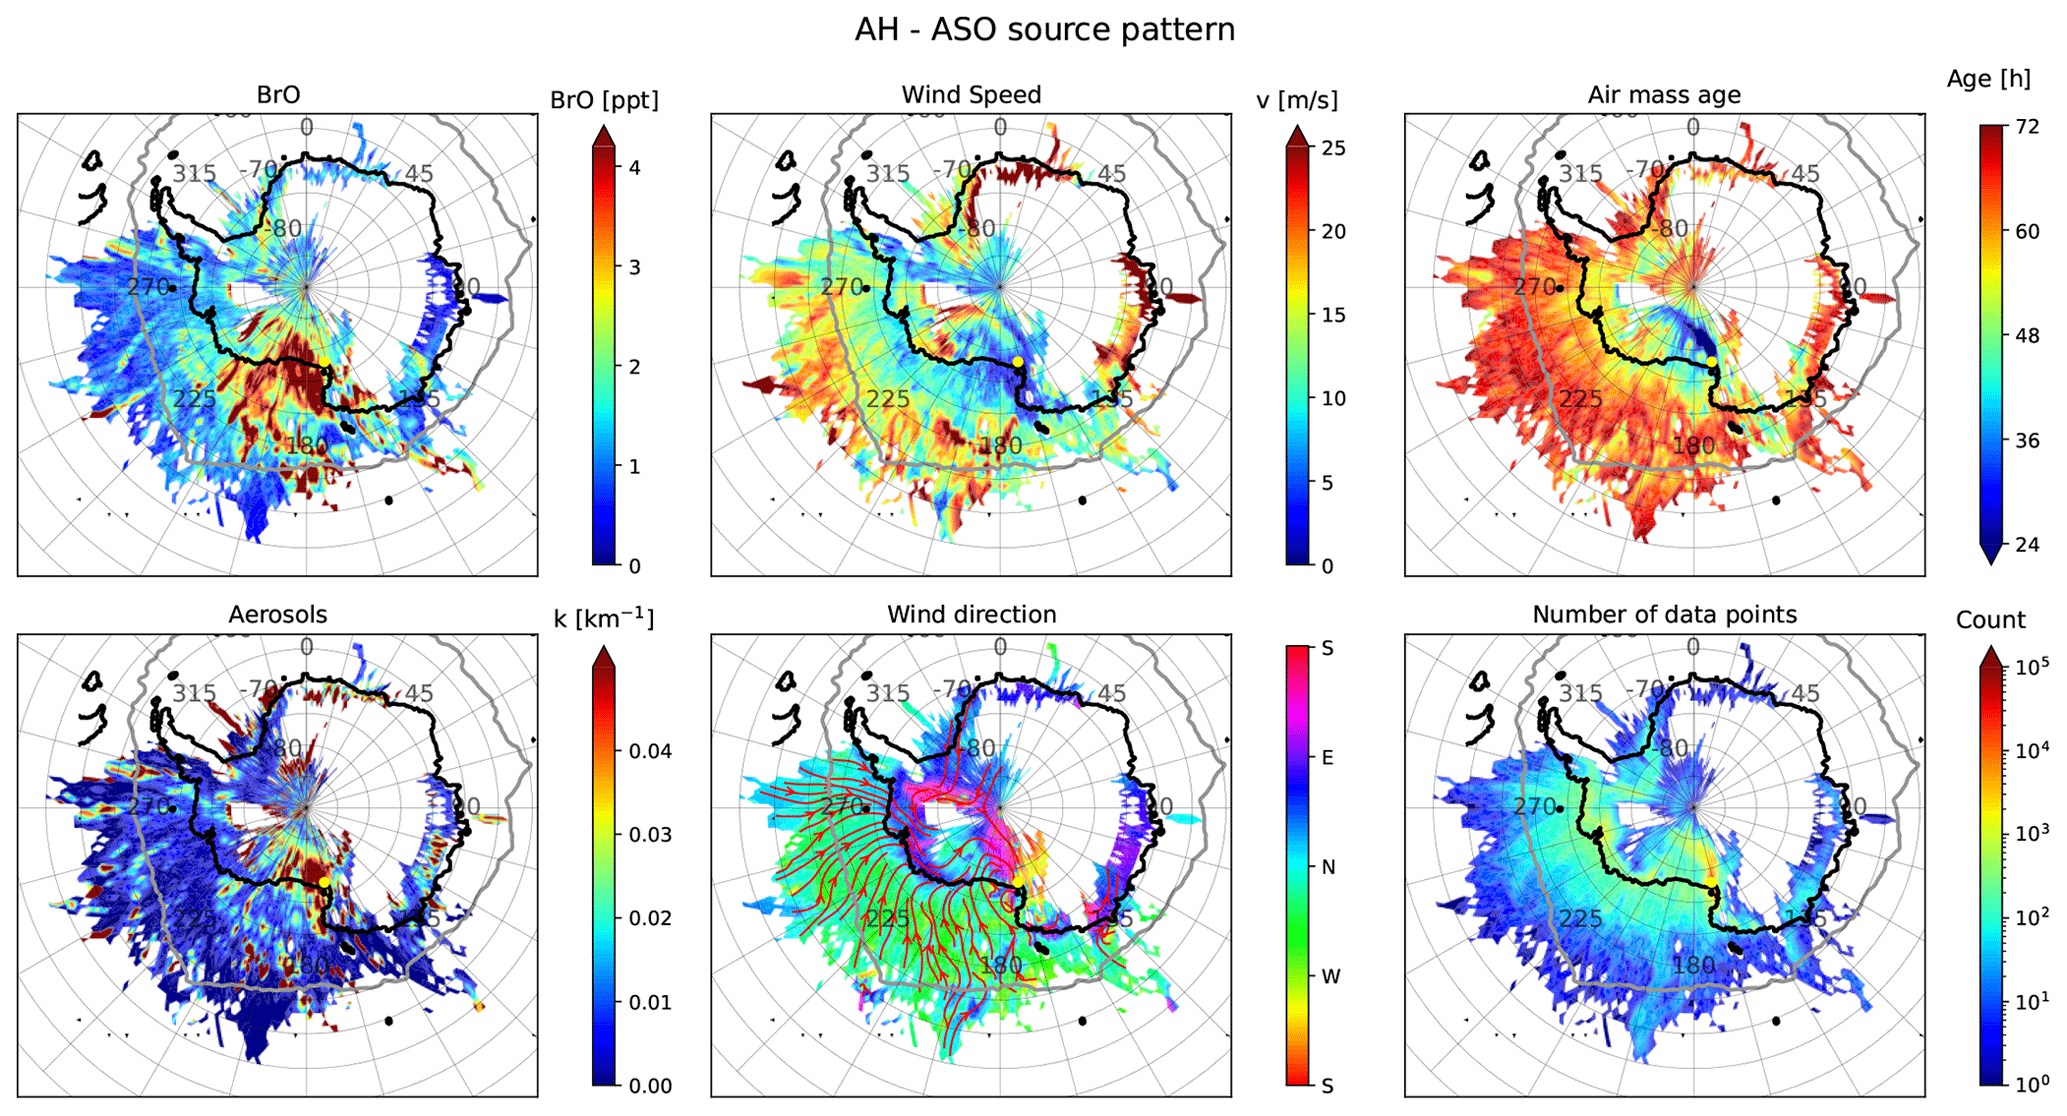
Figure 13The same as Fig. 12 but for AH. Note the different colour scales for BrO and aerosols.
The source–receptor analysis for AH presented in Fig. 13 shows that air masses observed at this site mainly originate from the coastal region of West Antarctica, the Ross Sea (RS), the Amundsen Sea (AS), the Bellingshausen Sea (BS), and (to a smaller extent) Wilkes Land (WL) to the west of the RIS. The average flow pattern shows that air masses are frequently transported south-eastwards over the sea ice, before they turn westwards and move along the coast of West Antarctica, move polewards over the RIS, become deflected by the Transantarctic Mountains, and finally approach AH as southerly winds. During ASO, BrO is mainly increased if the air masses originate from the sea ice over the RS and from the RIS. Aerosols are much lower (by about a factor of 10) at AH than at NM. Air masses travelling over the RIS in the vicinity of AH are subject to increased aerosol load, which probably originates from the large polynya usually present east of Ross Island that potentially supplies the surface of the shelf ice with halides. Another region of increased aerosol production is Terra Nova Bay (TNB) north of AH, where sea ice production rates are also high (Nihashi and Ohshima, 2015).
The air masses arriving at AH occasionally originate from the WS and RIS and traverse the Antarctic ice sheet, some of which are high in BrO. These cases of transcontinental transport of reactive bromine will be discussed in Sect. 3.5.
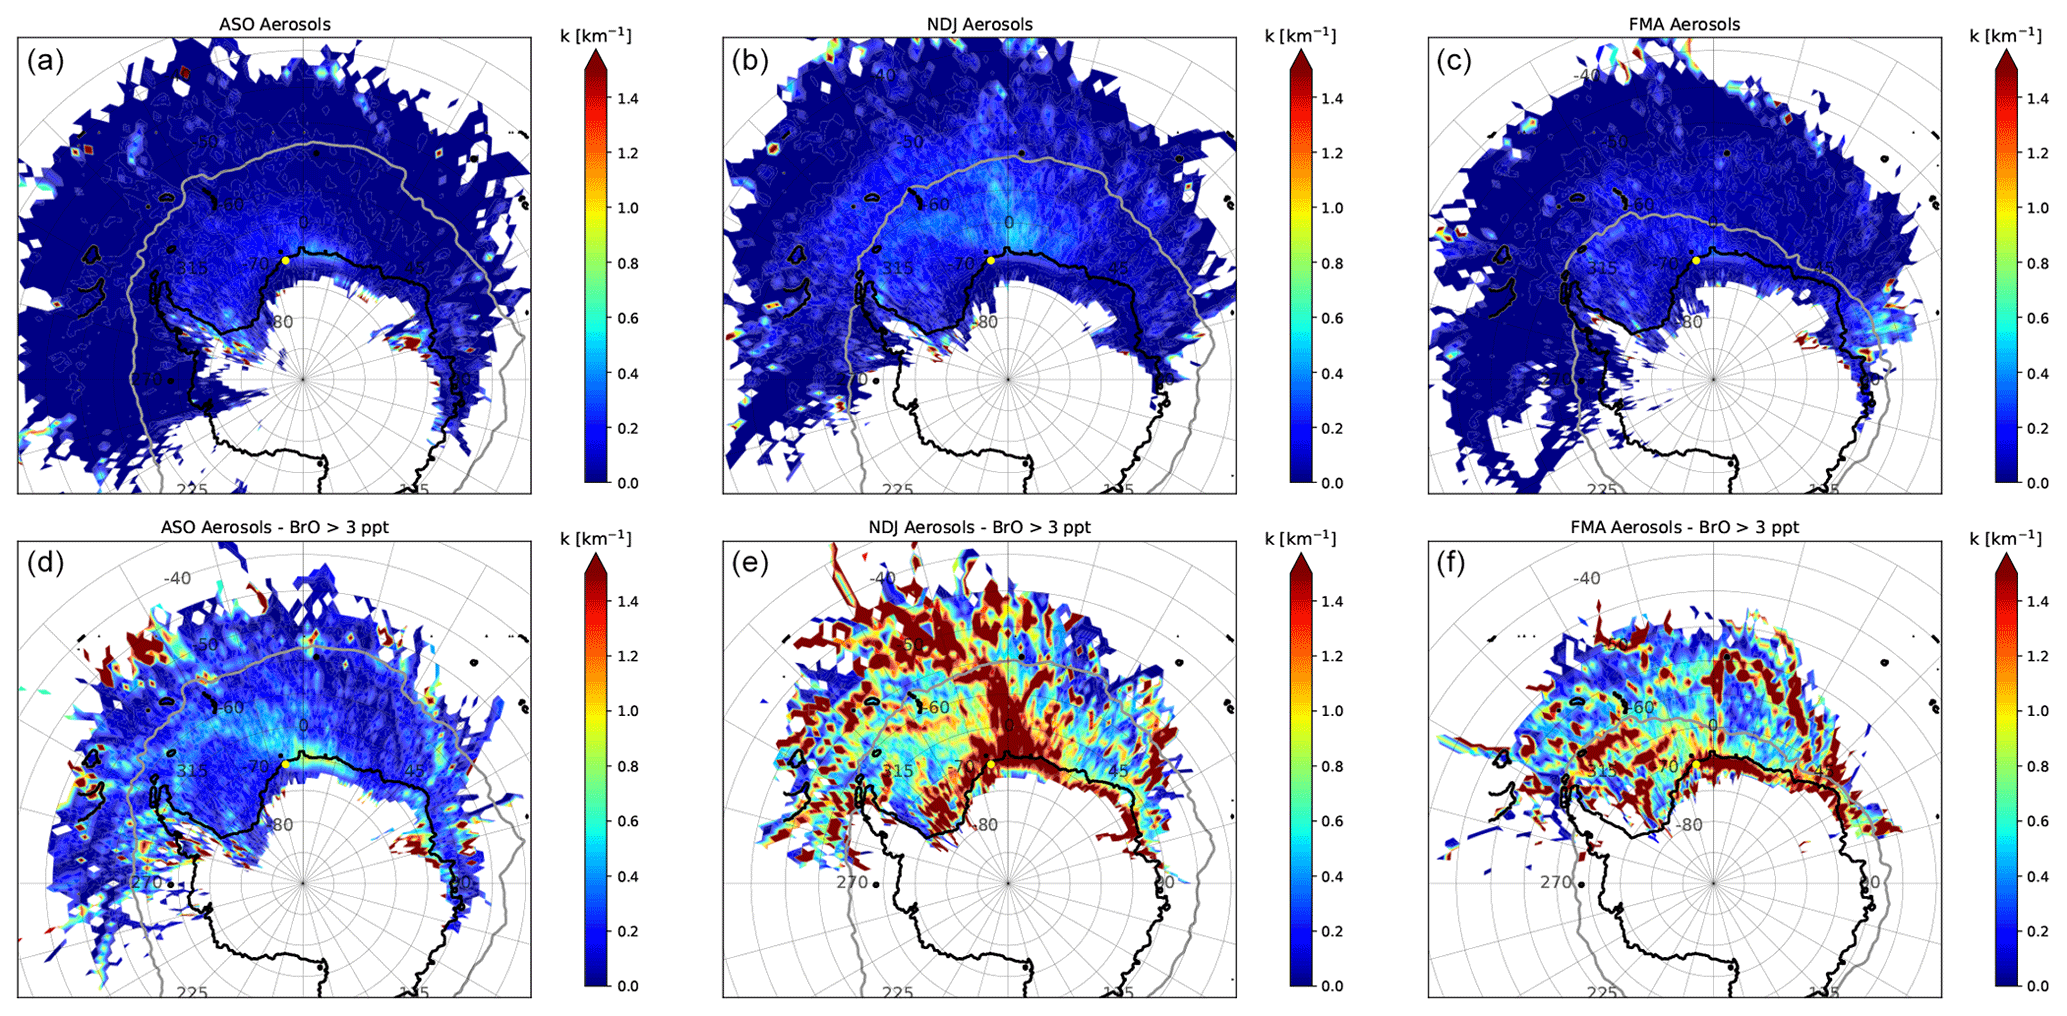
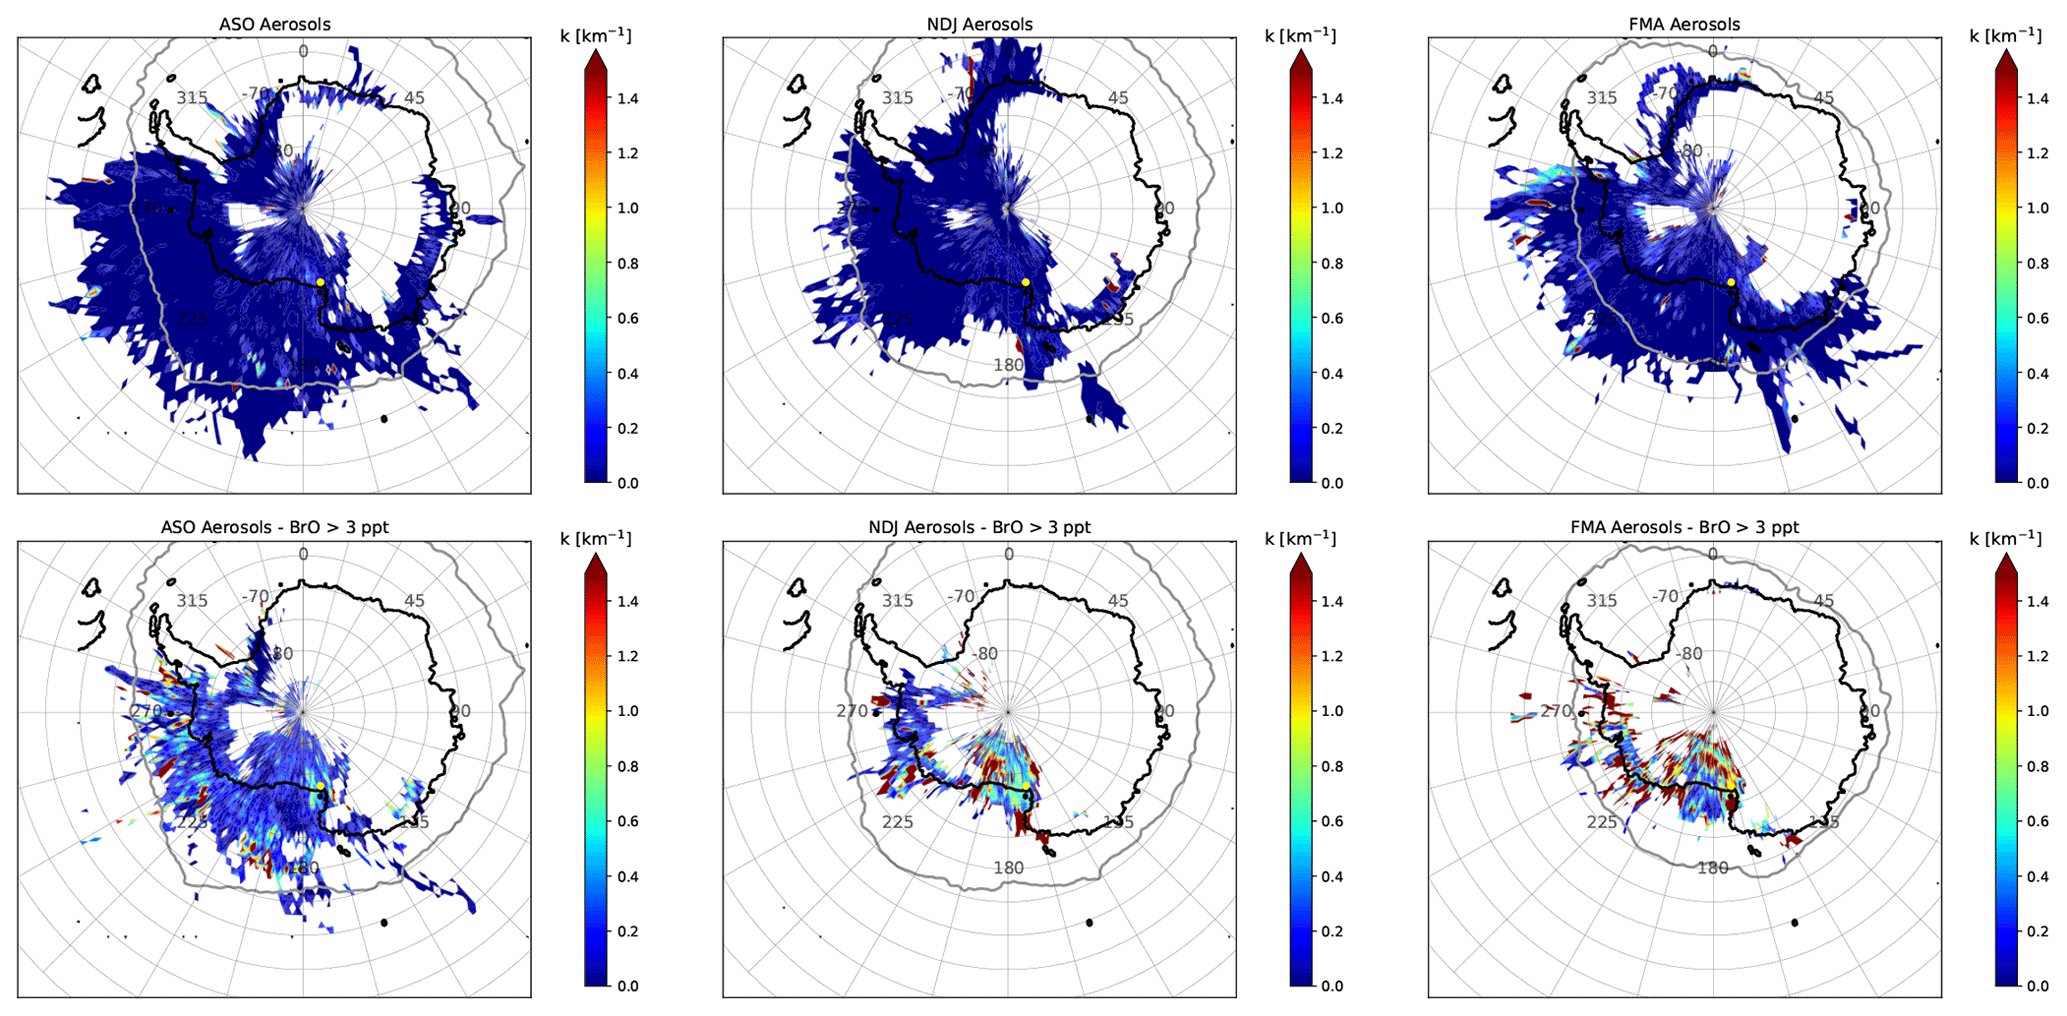
Figure 15The same as Fig. 14 but for AH.
The impact of aerosols on the abundance of BrO is illustrated in Figs. 14 and 15, where source–receptor maps of aerosols for all measurements (top panels) are compared to those when BrO VMR > 3 ppt (bottom panels) during each season. During ASO, there is little enhancement of aerosols when BrO is high, indicating that the release of reactive bromine from aerosols does not play a dominant role during this season. The only exception is the Amery Ice Shelf (AIS) located in West Antarctica, which appears to be a strong source of aerosols. The situation is very different during NDJ and FMA, when aerosols are often strongly enhanced in the presence of BrO. For NM, this is particularly the case when air masses originate from the RIS, the sea ice north of NM, or the coastline of the EIS east of the measurement site. Air coming from the EIS is particularly high in aerosols when BrO is high during FMA, which is when new sea ice forms along the coast that represents a potential source for reactive bromine. At AH, air masses containing enhanced BrO during NDJ and FMA mainly originate from the coastal areas of the RS and the AS, as well as from the RIS and TNB. These often contain enhanced aerosols, but compared to NM there are no clear patterns apparent in the aerosol source–receptor maps.
3.5 Transcontinental transport of reactive bromine
As can be seen from Fig. 13, some of the air parcels arriving at AH originate from the WS and even from the EIS in the vicinity of NM. They usually travel across the continent past the South Pole and along the Transantarctic Mountains before they finally reach AH. In the available data set (2012–2021), a transcontinental transport of air masses with enhanced BrO (VMR > 3 ppt) was observed on 24 d (1.8 % of all days with enhanced BrO). As an example, Fig. 16 shows BrO vertical profiles and sea ice contact time for a period of 6 d during late September 2017. Enhanced BrO with VMR > 20 ppt is observed at altitudes above 1.5 km from 26 to 28 September. An additional surface layer with high mixing ratios (VMR > 100 ppt) is present at altitudes below 200 m from 27 September on. As can be seen from the temperature profile in Fig. 17, the BrO surface layer resides within the boundary layer that is confined by a strong temperature inversion at ≈280 m altitude, while the uplifted layer resides in the free troposphere. The respective backward trajectories shown in Fig. 18 reveal that the air masses of the uplifted BrO layer originate from the WS, where they had contact with sea ice while they resided in the mixing layer. The respective air parcels travelled over the continental ice sheet for a duration of more than 60 h before reaching the measurement site, during which they had no contact with any potential source for reactive bromine. An enhancement of BrO owing to a stratospheric intrusion can be ruled out since the altitude of the air parcels was not higher than 2.6 km, and the ozone VMR observed at AH did not exceed 20 ppt.
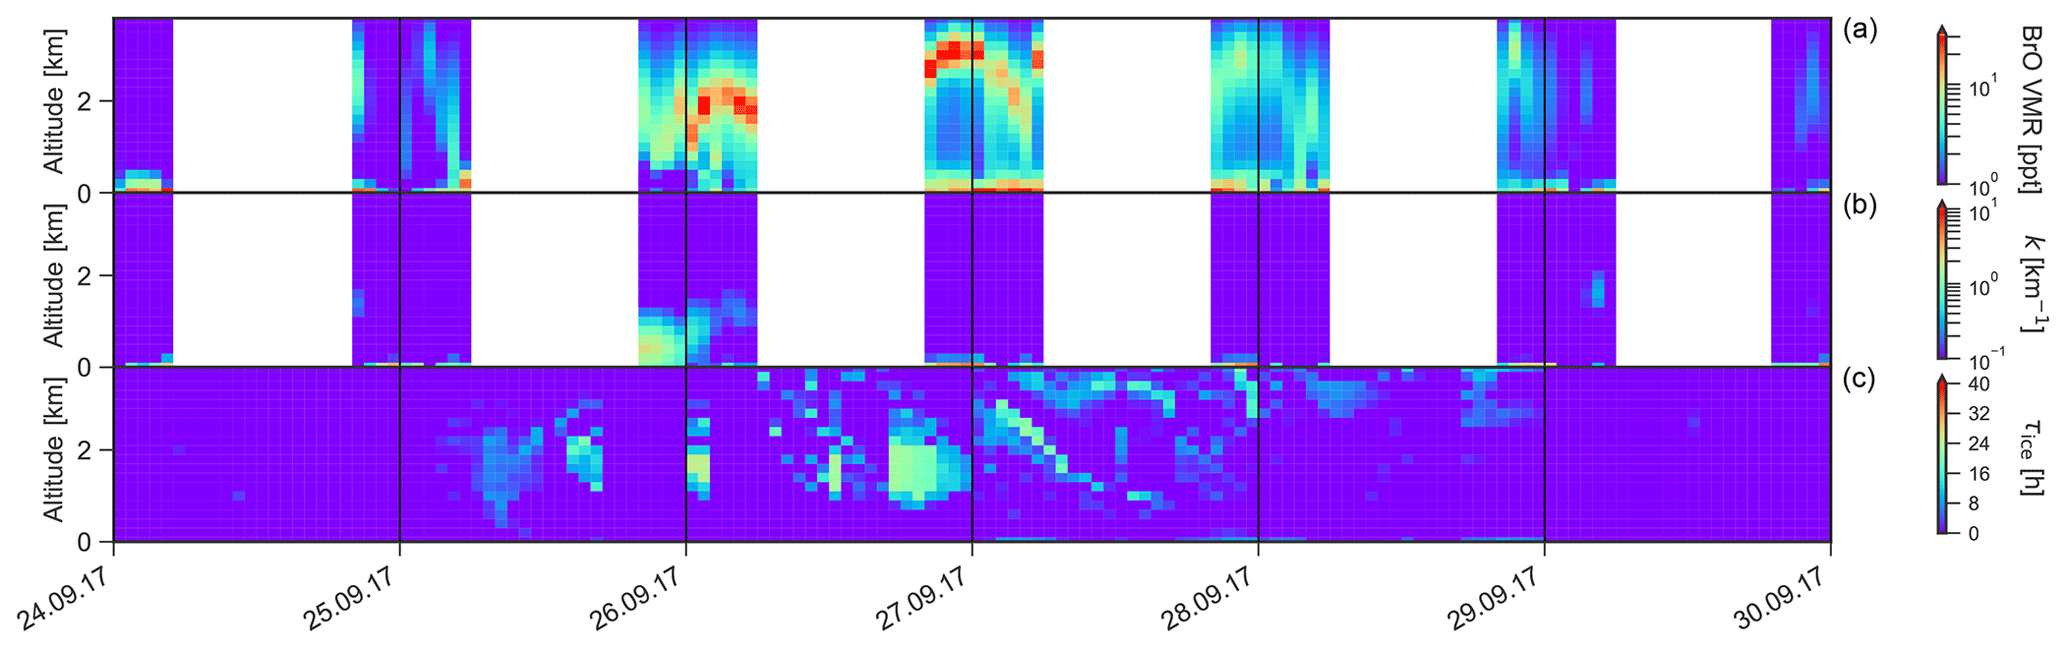
Figure 16BrO VMR profile (a), aerosol extinction (b), and sea ice contact time (c) observed at AH between 24 and 30 September 2017.
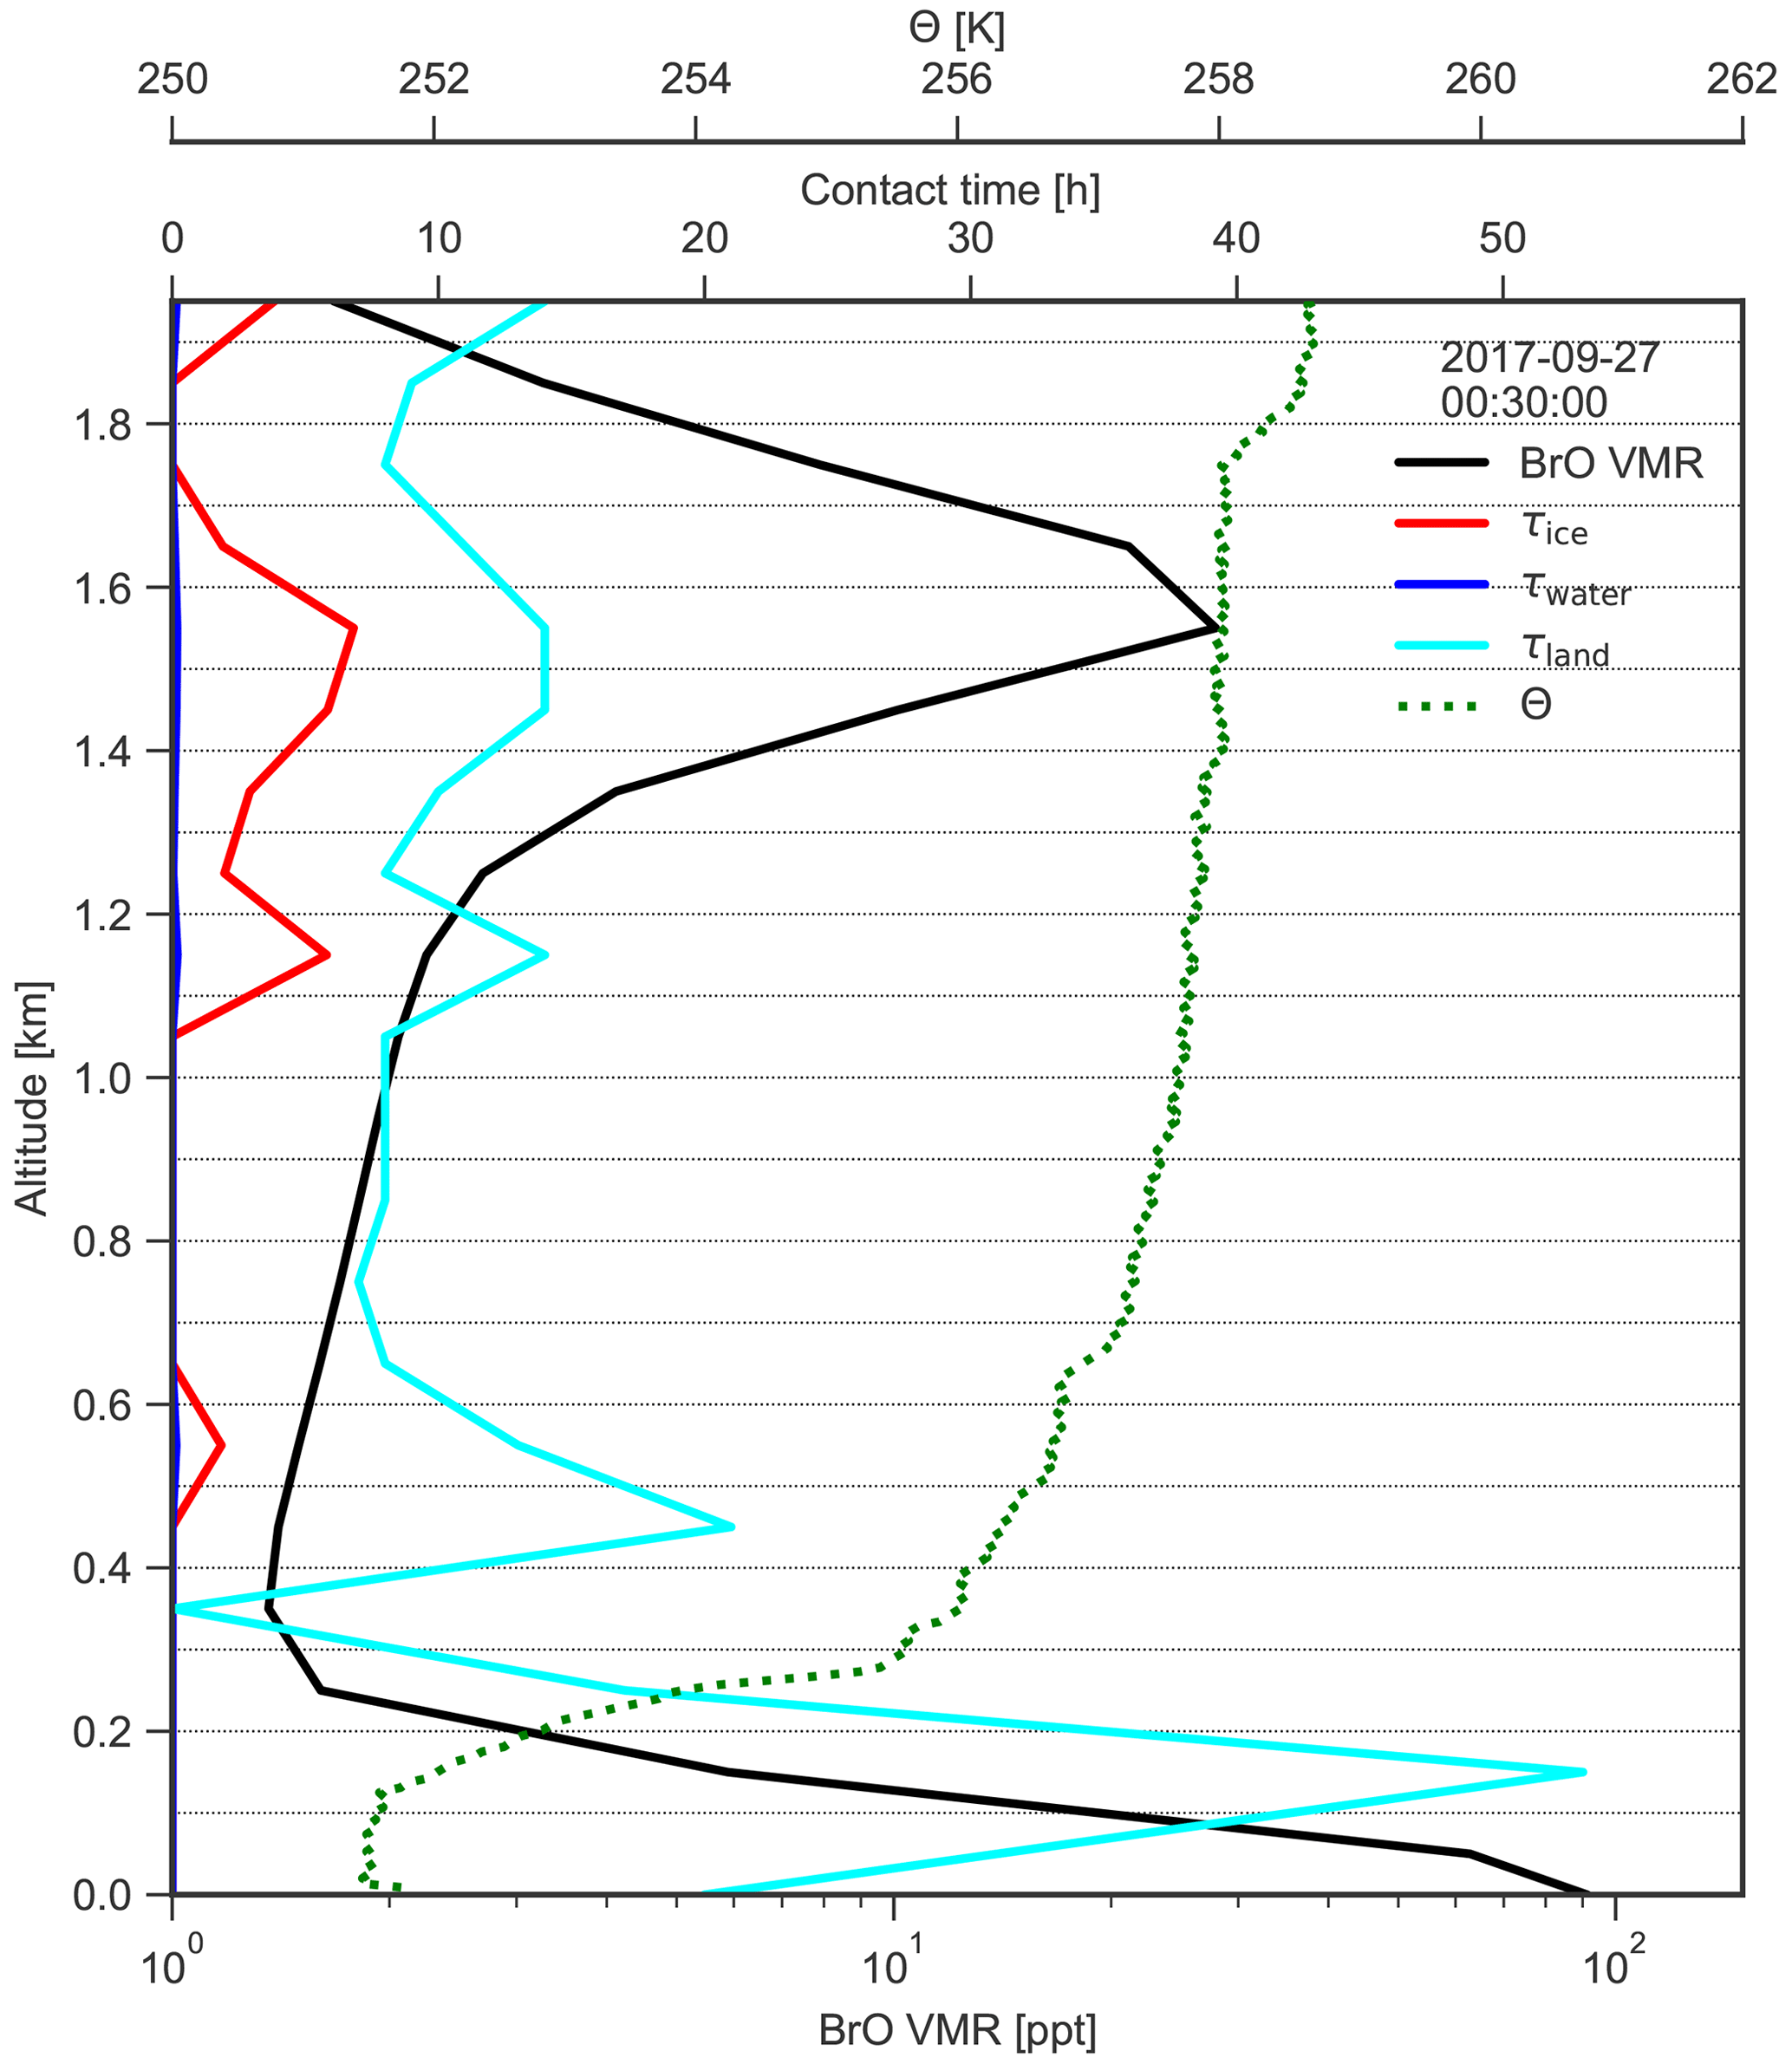
Figure 17Vertical profile of BrO VMR, as well as contact times with sea ice, land, and water at AH on 27 September 2017 at 00:30 UTC, together with the vertical profile of potential temperature Θ inferred from a coincident balloon sonde measurement. The dotted horizontal lines indicate the MAX-DOAS retrieval grid.

Figure 18The 3 d back trajectories ending at AH on 27 September 2017 at 00:30 UTC. Trajectories are shown for every second profile layer only. For further information, see the caption of Fig. 3.
A residual inversion layer is present right above the uplifted layer of BrO at 1.8 km altitude (see Fig. 17), most probably caused by advection of the boundary layer that initially resided in the southern WS where BrO was emitted. The fact that high concentrations of reactive bromine are sustained while the air parcels travel over the continental ice sheet for about 3 d is surprising, particularly since the MAX-DOAS instrument detects no significant aerosol extinction at the height of the BrO layer, which could sustain BrO concentrations by recycling on their surfaces. Model calculations indicate that, in the absence of sources, most BrO should be converted to reservoir species during its travelling time over the continent (Piot and von Glasow, 2008; Yang et al., 2005). Thus, either the initial BrO concentration in the WS was extraordinarily high or reactive bromine was recycled on the surfaces of very small saline particles not detectable by MAX-DOAS.
The near-surface air masses with enhanced BrO had contact with the RIS in the vicinity of AH until about 20 h before arrival at the measurement site before they became uplifted above the mixing layer. This shows that the shelf ice surface acts as a source for reactive bromine and that high levels of BrO (> 100 ppt) can be sustained over a period of almost 1 d without any contact surfaces on which bromine recycling could occur.
In this study, the dynamics and chemistry of reactive bromine in the Antarctic boundary layer are investigated using MAX-DOAS measurements from two coastal stations, covering about 20 years of measurements at Neumayer Station and 10 years of measurements at Arrival Heights. The resulting data set of more than 100 000 vertical profile pairs of BrO VMR and aerosol extinction is compared to a variety of co-located measurements of meteorological and chemical parameters of the atmosphere. Furthermore, sources of reactive bromine are investigated using a source–receptor analysis based on back trajectories and sea ice maps.
In agreement with previous ground-based and satellite-borne measurements, the highest BrO VCDs are observed after polar sunrise in August and September. The period during which enhanced BrO is present lasts until October at AH and early November at NM. There are, however, also a significant number of observations of enhanced BrO during summer and autumn, particularly at NM where BrO VCDs frequently exceed 1013 molec. cm−2. Such amounts of BrO are difficult to detect by satellite due to a lack of accuracy in the separation of the stratospheric and tropospheric partial columns of BrO and the shorter light path for nadir observations than for ground-based off-axis measurements (Seo et al., 2019). In addition, the detection limit (median retrieval error) of the tropospheric BrO VCD from our ground-based MAX-DOAS measurements amounts to only 0.3×10¹³ molec. cm−2, and the MAX-DOAS technique intrinsically eliminates the stratospheric contribution to the BrO signal.
The majority of BrO events during spring have their maximum VMR near the surface, but the probability of the occurrence of uplifted BrO profiles increases significantly in summer and autumn, when higher temperatures and solar irradiance lead to enhanced vertical mixing. The reduced BrO concentrations observed near the ground during NDJ and FMA indicate that the snow surface might be a sink during the day due to insufficient bromide concentrations, which could lead to an amplification of the reactive bromine concentration in the gas phase. These uplifted profiles, which are more frequent at AH than at NM owing to topographically induced vertical mixing at AH, represent a potential pathway of BrO to the free troposphere, where reactive bromine is expected to have a significant impact on the oxidative capacity of the atmosphere and eventually on climate by affecting the ozone budget and the formation of clouds (von Glasow et al., 2002a, b).
The diurnal variation in BrO at NM shows a strong asymmetry between morning and evening, with significantly higher values during the morning. This is most likely caused by the nocturnal release of Br2 from the local snow surface by heterogeneous reaction with ozone and the subsequent photolysis of Br2 during sunrise. Extremely high peaks in BrO VCD right after sunrise are observed during autumn, when sea ice extent is at its minimum and local release of reactive bromine dominates. Here, deposition of sea salt aerosols dispersed from the open ocean on the ice shelf probably plays an important role as a supply for halides, as can be seen from the positive correlation between BrO and seawater contact time during summer and autumn at NM. In contrast, springtime BrO events are much more widespread, when air masses rich in reactive bromine transported from the frozen ocean to the measurement site leave more processing time for the depletion of ozone.
A regression analysis based on a variety of meteorological parameters, as well as the residence time over sea ice, open water, and the continental ice sheet, shows a strong correlation between BrO and aerosol abundance during all seasons. This supports the hypothesis that aerosols play an important role in the release of reactive bromine in polar regions. A positive correlation between particulate bromide and gaseous BrO during ASO confirms a direct release of bromine radicals from aerosol surfaces. However, saline particles deposited on the snow surface most probably lead to an accumulation of bromide in the snowpack, where the bromine explosion mechanism can be triggered at a later time. This hypothesis is supported by the fact that during ASO the BrO VMR is positively correlated to the contact time with the continental ice sheet and ice shelf regions. Our source–receptor analysis reveals that the FRIS is one of the main sources of air containing high BrO concentrations at NM.
At NM, where air mainly originates from the ocean and coastal areas, BrO is positively correlated with the contact time with open water, with increasing correlation coefficients during summer and spring as the sea ice retreats. This indicates that the open ocean serves as a source for reactive bromine, with the bromine being released from sea spray and/or sea salt aerosols, either while the particles are airborne or after their deposition on the snow surface. In contrast, there is a much stronger influence of continental air at AH, and BrO enhancements are less frequent and weaker than at NM. The source–receptor analysis reveals that at AH air rich in BrO mainly comes from the sea ice and the RIS. There are, however, some cases when air enhanced in BrO travelled from the FRIS at the adjacent side of the continent over the Antarctic ice shield to AH, showing that reactive BrO can be sustained aloft for several days in the absence of any sources.
Time series of vertical profiles of BrO and aerosols retrieved from the MAX-DOAS instruments at Neumayer and Arrival Heights are available on the PANGAEA data server (https://doi.org/10.1594/PANGAEA.946295, Frieß, 2022a; https://doi.org/10.1594/PANGAEA.948027, Frieß, 2022b). The DOASIS analysis software and the HEIPRO retrieval algorithm are available from Udo Frieß upon request.
The supplement related to this article is available online at: https://doi.org/10.5194/acp-23-3207-2023-supplement.
UF designed and built the instruments, was responsible for the development of the HEIPRO algorithm, and conducted the data analysis and interpretation. UP supported the design of the instrument and the interpretation of the data since operation began. KK, RQ, and DS were responsible for the operation of the MAX-DOAS instrument at Arrival Heights, designed parts of the entrance optics, and provided ancillary data from Arrival Heights. HS was responsible for the meteorological observations at Neumayer and provided meteorological data. RW was responsible for the trace gas measurements at Neumayer, including the MAX-DOAS instrument, performed the chemical analysis of the aerosol filter measurements, and provided ancillary data from Neumayer.
The contact author has declared that none of the authors has any competing interests.
Publisher's note: Copernicus Publications remains neutral with regard to jurisdictional claims in published maps and institutional affiliations.
Our sincerest thanks go to the countless scientists and technicians at Neumayer Station and Scott Base, who have operated and maintained the MAX-DOAS instrument over so many years. Their immense support made sure that the instruments provided continuous measurements of high quality. We would also like to thank Paul Johnston, Alan Thomas, and Steven Wood from NIWA for their support of the operation of the AH MAX-DOAS instrument. We appreciate the support of the Automatic Weather Station Program and Antarctic Meteorological Research Center for the McMurdo radiosonde data (Matthew Lazzara, NSF grant nos. ARC-0713843, ANT-0944018, and ANT-1141908). We thank the National Oceanic and Atmospheric Administration (NOAA) for providing AH surface ozone data and for making the GDAS meteorological fields and the HYSPLIT trajectory model available. We would also like to express our gratitude to the EUMETSAT Data Centre (EDC) for providing OSI-SAF sea ice products. Many thanks are given to Alexei Rozanov for providing the SCIATRAN radiative transfer model, which serves as the forward model for the HEIPRO algorithm. Parts of this study were funded by the Deutsche Forschungsgemeinschaft (DFG) (grant nos. FR2497/2-1, FR2497/3-1, and FR2497/3-2).
This research has been supported by the Deutsche Forschungsgemeinschaft (grant nos. FR2497/3-2, FR2497/2-1, and FR2497/3-1).
This paper was edited by Michel Van Roozendael and reviewed by two anonymous referees.
Abbatt, J. P. D., Thomas, J. L., Abrahamsson, K., Boxe, C., Granfors, A., Jones, A. E., King, M. D., Saiz-Lopez, A., Shepson, P. B., Sodeau, J., Toohey, D. W., Toubin, C., von Glasow, R., Wren, S. N., and Yang, X.: Halogen activation via interactions with environmental ice and snow in the polar lower troposphere and other regions, Atmos. Chem. Phys., 12, 6237–6271, https://doi.org/10.5194/acp-12-6237-2012, 2012. a, b
Angot, H., Dastoor, A., De Simone, F., Gårdfeldt, K., Gencarelli, C. N., Hedgecock, I. M., Langer, S., Magand, O., Mastromonaco, M. N., Nordstrøm, C., Pfaffhuber, K. A., Pirrone, N., Ryjkov, A., Selin, N. E., Skov, H., Song, S., Sprovieri, F., Steffen, A., Toyota, K., Travnikov, O., Yang, X., and Dommergue, A.: Chemical cycling and deposition of atmospheric mercury in polar regions: review of recent measurements and comparison with models, Atmos. Chem. Phys., 16, 10735–10763, https://doi.org/10.5194/acp-16-10735-2016, 2016. a
Ariya, P. A., Khalizov, A., and Gidas, A.: Reactions of Gaseous Mercury with Atomic and Molecular Halogens: Kinetics, Product Studies, and Atmospheric Implications, J. Phys. Chem., 106, 7310–7320, https://doi.org/10.1021/jp020719o, 2002. a
Artiglia, L., Edebeli, J., Orlando, F., Chen, S., Lee, M.-T., Corral Arroyo, P., Gilgen, A., Bartels-Rausch, T., Kleibert, A., Vazdar, M., Andres Carignano, M., Francisco, J. S., Shepson, P. B., Gladich, I., and Ammann, M.: A surface-stabilized ozonide triggers bromide oxidation at the aqueous solution-vapour interface, Nat. Commun., 8, 700, https://doi.org/10.1038/s41467-017-00823-x, 2017. a
Barrie, L. and Platt, U.: Arctic tropospheric chemistry: and overview, Tellus B, 49, 449–454, https://doi.org/10.1034/j.1600-0889.49.issue5.2a.x, 1997. a
Barrie, L. A., Bottenheim, J. W., Schnell, R. C., Crutzen, P. J., and Rasmussen, R. A.: Ozone destruction and photochemical reactions at polar sunrise in the lower Arctic atmosphere, Nature, 334, 138–141, https://doi.org/10.1038/334138a0, 1988. a
Boggs, P. T., Byrd, R. H., and Schnabel, R. B.: A Stable and Efficient Algorithm for Nonlinear Orthogonal Distance Regression, SIAM J. Sci. Stat. Comput., 8, 1052–1078, https://doi.org/10.1137/0908085, 1987. a
Bognar, K., Zhao, X., Strong, K., Chang, R. Y.-W., Frieß, U., Hayes, P. L., McClure-Begley, A., Morris, S., Tremblay, S., and Vicente-Luis, A.: Measurements of Tropospheric Bromine Monoxide Over Four Halogen Activation Seasons in the Canadian High Arctic, J. Geophys. Res.-Atmos., 125, e2020JD033015, https://doi.org/10.1029/2020JD033015, 2020. a, b
Bogumil, K., Orphal, J., and Burrows, J. P.: Temperature-dependent absorption cross-sections of O3, NO2, and other atmospheric trace gases measured with the SCIAMACHY spectrometer, in: Proceedings of the ERS-Envisat Symposium, 16–20 October 2000, Gothenburg, Sweden, 2000. a
Bougoudis, I., Blechschmidt, A.-M., Richter, A., Seo, S., Burrows, J. P., Theys, N., and Rinke, A.: Long-term time series of Arctic tropospheric BrO derived from UV–VIS satellite remote sensing and its relation to first-year sea ice, Atmos. Chem. Phys., 20, 11869–11892, https://doi.org/10.5194/acp-20-11869-2020, 2020. a
Chance, K. and Spurr, R. J. D.: Ring effect studies; Rayleigh scattering, including molecular parameters for rotational Raman scattering and the Fraunhofer spectrum, Appl. Optics, 36, 5224–5230, https://doi.org/10.1364/AO.36.005224, 1997. a
Choi, S., Theys, N., Salawitch, R. J., Wales, P. A., Joiner, J., Canty, T. P., Chance, K., Suleiman, R. M., Palm, S. P., Cullather, R. I., Darmenov, A. S., Silva, A., Kurosu, T. P., Hendrick, F., and Van Roozendael, M.: Link Between Arctic Tropospheric BrO Explosion Observed From Space and Sea-Salt Aerosols From Blowing Snow Investigated Using Ozone Monitoring Instrument BrO Data and GEOS-5 Data Assimilation System, J. Geophys. Res.-Atmos., 123, 6954–6983, https://doi.org/10.1029/2017JD026889, 2018. a
Dibb, J. E., Ziemba, L. D., Luxford, J., and Beckman, P.: Bromide and other ions in the snow, firn air, and atmospheric boundary layer at Summit during GSHOX, Atmos. Chem. Phys., 10, 9931–9942, https://doi.org/10.5194/acp-10-9931-2010, 2010. a
Dommergue, A., Sprovieri, F., Pirrone, N., Ebinghaus, R., Brooks, S., Courteaud, J., and Ferrari, C. P.: Overview of mercury measurements in the Antarctic troposphere, Atmos. Chem. Phys., 10, 3309–3319, https://doi.org/10.5194/acp-10-3309-2010, 2010. a
Ebinghaus, R., Kock, H. H., Temme, C., Einax, J. W., Löwe, A. G., Richter, A., Burrows, J. P., and Schroeder, W. H.: Antarctic Springtime Depletion of Atmospheric Mercury, Environ. Sci. Technol., 36, 1238–1244, https://doi.org/10.1021/es015710z, 2002. a
Fernandez, R. P., Carmona-Balea, A., Cuevas, C. A., Barrera, J. A., Kinnison, D. E., Lamarque, J.-F., Blaszczak-Boxe, C., Kim, K., Choi, W., Hay, T., Blechschmidt, A.-M., Schönhardt, A., Burrows, J. P., and Saiz-Lopez, A.: Modeling the Sources and Chemistry of Polar Tropospheric Halogens (Cl, Br, and I) Using the CAM-Chem Global Chemistry-Climate Model, J. Adv. Model. Earth Sy., 11, 2259–2289, https://doi.org/10.1029/2019MS001655, 2019. a
Frieß, U.: Vertical profiles of BrO and aerosols from MAX-DOAS measurements at Neumayer Station, PANGAEA [data set], https://doi.org/10.1594/PANGAEA.946295, 2022a. a
Frieß, U.: Vertical profiles of BrO and aerosols from MAX-DOAS measurements at Arrival Heights, PANGAEA [data set], https://doi.org/10.1594/PANGAEA.948027, 2022b. a
Frieß, U., Wagner, T., Pundt, I., Pfeilsticker, K., and Platt, U.: Spectroscopic Measurements of Tropospheric Iodine Oxide at Neumayer Station, Antarctica, Geophys. Res. Lett., 28, 1941–1944, https://doi.org/10.1029/2000GL012784, 2001. a
Frieß, U., Hollwedel, J., König-Langlo, G., Wagner, T., and Platt, U.: Dynamics and chemistry of tropospheric bromine explosion events in the Antarctic coastal region, J. Geophys. Res., 109, D06305, https://doi.org/10.1029/2003JD004133, 2004. a, b, c, d
Frieß, U., Kreher, K., Johnston, P., and Platt, U.: Ground-based DOAS measurements of stratospheric trace gases at two Antarctic stations during the 2002 ozone hole period, J. Atmos. Sci., 62, 765–777, https://doi.org/10.1175/JAS-3319.1, 2005. a
Frieß, U., Monks, P., Remedios, J., Rozanov, A., Sinreich, R., Wagner, T., and Platt, U.: MAX-DOAS O4 measurements: A new technique to derive information on atmospheric aerosols: 2. Modeling studies, J. Geophys. Res., 111, D14203, https://doi.org/10.1029/2005JD006618, 2006. a, b, c
Frieß, U., Deutschmann, T., Gilfedder, B. S., Weller, R., and Platt, U.: Iodine monoxide in the Antarctic snowpack, Atmos. Chem. Phys., 10, 2439–2456, https://doi.org/10.5194/acp-10-2439-2010, 2010. a, b
Frieß, U., Sihler, H., Sander, R., Pöhler, D., Yilmaz, S., and Platt, U.: The vertical distribution of BrO and aerosols in the Arctic: Measurements by active and passive differential optical absorption spectroscopy, J. Geophys. Res., 116, D00R04, https://doi.org/10.1029/2011JD015938, 2011. a, b, c, d, e, f
Godfrey, J. and Clarkson, T.: Air quality modelling in a stable polar environment – Ross Island, Antarctica, Atmos. Environ., 32, 2899–2911, https://doi.org/10.1016/S1352-2310(98)00031-4, 1998. a
Grainger, J. F. and Ring, J.: Anomalous Fraunhofer line profiles, Nature, 193, 762, https://doi.org/10.1038/193762a0, 1962. a
Halfacre, J. W., Shepson, P. B., and Pratt, K. A.: pH-dependent production of molecular chlorine, bromine, and iodine from frozen saline surfaces, Atmos. Chem. Phys., 19, 4917–4931, https://doi.org/10.5194/acp-19-4917-2019, 2019. a
Hara, K., Osada, K., Yabuki, M., Takashima, H., Theys, N., and Yamanouchi, T.: Important contributions of sea-salt aerosols to atmospheric bromine cycle in the Antarctic coasts, Sci. Rep., 8, 13852, https://doi.org/10.1038/s41598-018-32287-4, 2018. a
Hausmann, M. and Platt, U.: Spectroscopic measurement of bromine oxide and ozone in the high Arctic during Polar Sunrise Experiment 1992, J. Geophys. Res., 99, 25399–25413, https://doi.org/10.1029/94JD01314, 1994. a
Hay, T.: MAX-DOAS measurements of bromine explosion events in McMurdo Sound, Antarctica, PhD thesis, University of Canterbury, http://hdl.handle.net/10092/5394 (last access: 14 January 2022), 2010. a
Helmig, D., Boylan, P., Johnson, B., Oltmans, S., Fairall, C., Staebler, R., Weinheimer, A., Orlando, J., Knapp, D. J., Montzka, D. D., Flocke, F., Frieß, U., Sihler, H., and Shepson, P. B.: Ozone dynamics and snow-atmosphere exchanges during ozone depletion events at Barrow, Alaska, J. Geophys. Res., 117, D20303, https://doi.org/10.1029/2012JD017531, 2012. a, b
Hermans, C., Vandaele, A. C., Fally, S., Carleer, M., Colin, R., Coquart, B., Jenouvrier, A., and Mérienne, M. F.: Absorption cross-section of the collision-induced bands of oxygen from the UV to the NIR, in: NATO Advanced Research Workshop: Weakly Interacting Molecular Pairs: Unconventional Absorbers of Radiation in the Atmosphere, St. Petersburg, Russia, 2002. a
Herrmann, M., Sihler, H., Frieß, U., Wagner, T., Platt, U., and Gutheil, E.: Time-dependent 3D simulations of tropospheric ozone depletion events in the Arctic spring using the Weather Research and Forecasting model coupled with Chemistry (WRF-Chem), Atmos. Chem. Phys., 21, 7611–7638, https://doi.org/10.5194/acp-21-7611-2021, 2021. a
Herrmann, M., Schöne, M., Borger, C., Warnach, S., Wagner, T., Platt, U., and Gutheil, E.: Ozone depletion events in the Arctic spring of 2019: a new modeling approach to bromine emissions, Atmos. Chem. Phys., 22, 13495–13526, https://doi.org/10.5194/acp-22-13495-2022, 2022. a
Jones, A. E., Anderson, P. S., Wolff, E. W., Turner, J., Rankin, A. M., and Colwell, S. R.: A role for newly forming sea ice in springtime polar tropospheric ozone loss? Observational evidence from Halley station, Antarctica, J. Geophys. Res., 111, D08306, https://doi.org/10.1029/2005JD006566, 2006. a
Jones, A. E., Anderson, P. S., Begoin, M., Brough, N., Hutterli, M. A., Marshall, G. J., Richter, A., Roscoe, H. K., and Wolff, E. W.: BrO, blizzards, and drivers of polar tropospheric ozone depletion events, Atmos. Chem. Phys., 9, 4639–4652, https://doi.org/10.5194/acp-9-4639-2009, 2009. a
Kaleschke, L., Richter, A., Burrows, J., Afe, O., Heygster, G., Notholt, J., Rankin, A. M., Roscoe, H. K., Hollwedel, J., Wagner, T., and Jacobi, H.-W.: Frost flowers on sea ice as a source of sea salt and their influence on tropospheric halogen chemistry, Geophys. Res. Lett., 31, L16114, https://doi.org/10.1029/2004GL020655, 2004. a
Kaspari, S., Dixon, D., Sneed, S., and Handley, M.: Sources and transport pathways of marine aerosol species into West Antarctica, Ann. Glaciol., 41, 1–9, https://doi.org/10.3189/172756405781813221, 2005. a
König-Langlo, G., King, J. C., and Pettré, P.: Climatology of the three coastal Antarctic stations Dumont d'Urville, Neumayer, and Halley, J. Geophys. Res., 103, 10935–10946, https://doi.org/10.1029/97JD00527, 1997. a
Kraus, S.: DOASIS: A Framework Design for DOAS, PhD thesis, University of Mannheim, https://hci.iwr.uni-heidelberg.de/publications/dip/2006/Kraus_PhD2006.pdf (last access: 15 April 2020), 2006. a
Kreher, K., Johnston, P. V., Wood, S. W., and Platt, U.: Ground-based measurements of tropospheric and stratospheric BrO at Arrival Heights (78∘ S), Antarctica, Geophys. Res. Lett., 24, 3021–3024, https://doi.org/10.1029/97GL02997, 1997. a
Kromminga, H., Orphal, J., Spietz, P., Voigt, S., and Burrows, J. P.: New measurements of OClO absorption cross-sections in the 325-435 nm region and their temperature dependence between 213 and 293 K, J. Photoch. Photobio. A, 157, 149–160, https://doi.org/10.1016/S1010-6030(03)00071-6, 2003. a
Legrand, M., Yang, X., Preunkert, S., and Theys, N.: Year-round records of sea salt, gaseous, and particulate inorganic bromine in the atmospheric boundary layer at coastal (Dumont d'Urville) and central (Concordia) East Antarctic sites, J. Geophys. Res., 121, 997–1023, https://doi.org/10.1002/2015JD024066, 2016. a
Leser, H., Hönninger, G., and Platt, U.: MAX-DOAS measurements of BrO and NO2 in the marine boundary layer, Geophys. Res. Lett., 30, 1537, https://doi.org/10.1029/2002GL015811, 2003. a
Lu, J. Y., Schroeder, W. H., Barrie, L. A., Steffen, A., Welch, H. E., Martin, K., Lockhart, L., Hunt, R. V., Boila, G., and Richter, A.: Magnification of Atmospheric Mercury Deposition to Polar Regions in Springtime: The Link to Tropospheric Ozone Depletion Chemistry, Geophys. Res. Lett., 28, 3219–3222, https://doi.org/10.1029/2000GL012603, 2001. a
McClure-Begley, A., Petropavlovskikh, I., and Oltmans, S.: NOAA ESRL Earth System Research Laboratory Ozone Water Vapor Group Surface Ozone Measurements, Version 1, NOAA [data set], https://doi.org/10.7289/V57P8WBF, 2013. a
Meller, R. and Moortgat, G. K.: Temperature dependence of the absorption cross sections of formaldehyde between 223 and 323 K in the wavelength range 225–375 nm, J. Geophys. Res.-Atmos., 105, 7089–7101, https://doi.org/10.1029/1999JD901074, 2000. a
Morin, S., Marion, G. M., von Glasow, R., Voisin, D., Bouchez, J., and Savarino, J.: Precipitation of salts in freezing seawater and ozone depletion events: a status report, Atmos. Chem. Phys., 8, 7317–7324, https://doi.org/10.5194/acp-8-7317-2008, 2008. a, b
Nakata, K., Ohshima, K. I., and Nihashi, S.: Mapping of Active Frazil for Antarctic Coastal Polynyas, With an Estimation of Sea-Ice Production, Geophys. Res. Lett., 48, e2020GL091353, https://doi.org/10.1029/2020GL091353, 2021. a, b
Nasse, J.-M.: Halogens in the coastal boundary layer of Antarctica, PhD thesis, University of Heidelberg, https://doi.org/10.11588/heidok.00026489, 2019. a, b, c, d, e
NCEP: NCEP GDAS/FNL 0.25 Degree Global Tropospheric Analyses and Forecast Grids, NCAR [data set], https://doi.org/10.5065/D65Q4T4Z, 2015. a
Nihashi, S. and Ohshima, K. I.: Circumpolar Mapping of Antarctic Coastal Polynyas and Landfast Sea Ice: Relationship and Variability, J. Climate, 28, 3650–3670, https://doi.org/10.1175/JCLI-D-14-00369.1, 2015. a, b, c
OSI-SAF: Global Sea Ice Concentration (netCDF) – DMSP, EUMETSAT SAF on Ocean and Sea Ice, EUMETSAT [data set], https://doi.org/10.15770/EUM_SAF_OSI_NRT_2004, 2017. a
Oum, K. W., Lakin, M. J., and Finlayson-Pitts, B. J.: Bromine activation in the troposphere by the dark reaction of O3 with seawater ice, Geophys. Res. Lett., 25, 3923–3926, https://doi.org/10.1029/1998GL900078, 1998. a
Peterson, P. K., Pratt, K. A., Simpson, W. R., Nghiem, S. V., Pérez, L. X. P., Boone, E. J., Pöhler, D., Zielcke, J., General, S., Shepson, P. B., Frieß, U., Platt, U., and Stirm, B. H.: The role of open lead interactions in atmospheric ozone variability between Arctic coastal and inland sites, Elementa, 4, 000109, https://doi.org/10.12952/journal.elementa.000109, 2016. a
Peterson, P. K., Pöhler, D., Sihler, H., Zielcke, J., General, S., Frieß, U., Platt, U., Simpson, W. R., Nghiem, S. V., Shepson, P. B., Stirm, B. H., Dhaniyala, S., Wagner, T., Caulton, D. R., Fuentes, J. D., and Pratt, K. A.: Observations of bromine monoxide transport in the Arctic sustained on aerosol particles, Atmos. Chem. Phys., 17, 7567–7579, https://doi.org/10.5194/acp-17-7567-2017, 2017. a, b
Piot, M. and von Glasow, R.: The potential importance of frost flowers, recycling on snow, and open leads for ozone depletion events, Atmos. Chem. Phys., 8, 2437–2467, https://doi.org/10.5194/acp-8-2437-2008, 2008. a, b, c
Platt, U. and Hönninger, G.: The role of halogen species in the troposphere, Chemosphere, 52, 325–338, https://doi.org/10.1016/S0045-6535(03)00216-9, 2003. a, b
Pöhler, D., Vogel, L., Frieß, U., and Platt, U.: Observation of halogen species in the Amundsen Gulf, Arctic, by active long-path differential optical absorption spectroscopy, P. Natl. Acad. Sci. USA, 107, 6582–6587, https://doi.org/10.1073/pnas.0912231107, 2010. a, b
Prados-Roman, C., Gómez-Martín, L., Puentedura, O., Navarro-Comas, M., Iglesias, J., de Mingo, J. R., Pérez, M., Ochoa, H., Barlasina, M. E., Carbajal, G., and Yela, M.: Reactive bromine in the low troposphere of Antarctica: estimations at two research sites, Atmos. Chem. Phys., 18, 8549–8570, https://doi.org/10.5194/acp-18-8549-2018, 2018. a, b
Pratt, K. A., Custard, K. D., Shepson, P. B., Douglas, T. A., Pöhler, D., General, S., Zielcke, J., Simpson, W. R., Platt, U., Tanner, D. J., Huey, G. L., Carlsen, M., and Stirm, B. H.: Photochemical production of molecular bromine in Arctic surface snowpacks, Nat. Geosci., 6, 351–356, https://doi.org/10.1038/ngeo1779, 2013. a
Richter, A., Wittrock, F., Eisinger, M., and Burrows, J. P.: GOME Observations of Tropospheric BrO in Northern Hemispheric Spring and Summer 1997, Geophys. Res. Lett., 25, 2683–2686, https://doi.org/10.1029/98GL52016, 1998. a
Rodgers, C. D.: Inverse methods for atmospheric sounding, theory and practice, Series on Atmospheric, Oceanic and Planetary Physics, edited by: Taylor, F. W., World Scientific, https://doi.org/10.1142/3171, 2000. a
Roscoe, H., Brough, N., Jones, A., Wittrock, F., Richter, A., Roozendael, M. V., and Hendrick, F.: Characterisation of vertical BrO distribution during events of enhanced tropospheric BrO in Antarctica, from combined remote and in-situ measurements, J. Quant. Spectrosc. Ra., 138, 70–81, https://doi.org/10.1016/j.jqsrt.2014.01.026, 2014. a, b
Rozanov, V., Rozanov, A., Kokhanovsky, A., and Burrows, J.: Radiative transfer through terrestrial atmosphere and ocean: Software package {SCIATRAN}, J. Quant. Spectrosc. Ra., 133, 13–71, https://doi.org/10.1016/j.jqsrt.2013.07.004, 2014. a
Saiz-Lopez, A., Plane, J. M. C., and Shillito, J. A.: Bromine oxide in the mid-latitude marine boundary layer, Geophys. Res. Lett., 31, L03111, https://doi.org/10.1029/2003GL018956, 2004. a
Saiz-Lopez, A., Mahajan, A., Salmon, R., Bauguitte, S., Jones, A., Roscoe, H., and Plane, J.: Boundary layer halogens in coastal Antarctica, Science, 317, 348–351, https://doi.org/10.1126/science.1141408, 2007. a, b
Sander, R., Burrows, J., and Kaleschke, L.: Carbonate precipitation in brine – a potential trigger for tropospheric ozone depletion events, Atmos. Chem. Phys., 6, 4653–4658, https://doi.org/10.5194/acp-6-4653-2006, 2006. a
Schmithüsen, H.: Radiosonde measurements from Neumayer Station (1983-02 et seq), PANGAEA [data set], https://doi.org/10.1594/PANGAEA.940584, 2022. a
Schofield, R., Johnston, P., Thomas, A., Kreher, K., Connor, B., Wood, S., Shooter, D., Chipperfield, M., Richter, A., Von Glasow, R., and Rodgers, C.: Tropospheric and stratospheric BrO columns over Arrival Heights, Antarctica, 2002, J. Geophys. Res., 111, D22310, https://doi.org/10.1029/2005JD007022, 2006. a
Schönhardt, A., Begoin, M., Richter, A., Wittrock, F., Kaleschke, L., Gómez Martín, J. C., and Burrows, J. P.: Simultaneous satellite observations of IO and BrO over Antarctica, Atmos. Chem. Phys., 12, 6565–6580, https://doi.org/10.5194/acp-12-6565-2012, 2012. a, b
Seefeldt, M. W., Tripoli, G. J., and Stearns, C. R.: A High-Resolution Numerical Simulation of the Wind Flow in the Ross Island Region, Antarctica, Mon. Weather Rev., 131, 435–458, https://doi.org/10.1175/1520-0493(2003)131<0435:AHRNSO>2.0.CO;2, 2003. a
Seo, S., Richter, A., Blechschmidt, A.-M., Bougoudis, I., and Burrows, J. P.: First high-resolution BrO column retrievals from TROPOMI, Atmos. Meas. Tech., 12, 2913–2932, https://doi.org/10.5194/amt-12-2913-2019, 2019. a
Simpson, W. R., Alvarez-Aviles, L., Douglas, T. A., Sturm, M., and Domine, F.: Halogens in the coastal snow pack near Barrow, Alaska: Evidence for active bromine air-snow chemistry during springtime, Geophys. Res. Lett., 32, L04811, https://doi.org/10.1029/2004GL021748, 2005. a, b
Simpson, W. R., von Glasow, R., Riedel, K., Anderson, P., Ariya, P., Bottenheim, J., Burrows, J., Carpenter, L. J., Frieß, U., Goodsite, M. E., Heard, D., Hutterli, M., Jacobi, H.-W., Kaleschke, L., Neff, B., Plane, J., Platt, U., Richter, A., Roscoe, H., Sander, R., Shepson, P., Sodeau, J., Steffen, A., Wagner, T., and Wolff, E.: Halogens and their role in polar boundary-layer ozone depletion, Atmos. Chem. Phys., 7, 4375–4418, https://doi.org/10.5194/acp-7-4375-2007, 2007. a
Simpson, W. R., Brown, S. S., Saiz-Lopez, A., Thornton, J. A., and Glasow, R. V.: Tropospheric Halogen Chemistry: Sources, Cycling, and Impacts, Chem. Rev., 115, 4035–4062, https://doi.org/10.1021/cr5006638, 2015. a, b
Simpson, W. R., Frieß, U., Thomas, J. L., Lampel, J., and Platt, U.: Polar Nighttime Chemistry Produces Intense Reactive Bromine Events, Geophys. Res. Lett., 45, 9987–9994, https://doi.org/10.1029/2018GL079444, 2018. a
Sinclair, M. R.: Local topographic influence on low-level wind at Scott Base, Antarctica, New Zeal. J. Geol. Geop., 31, 237–245, https://doi.org/10.1080/00288306.1988.10417772, 1988. a
Steffen, A., Douglas, T., Amyot, M., Ariya, P., Aspmo, K., Berg, T., Bottenheim, J., Brooks, S., Cobbett, F., Dastoor, A., Dommergue, A., Ebinghaus, R., Ferrari, C., Gardfeldt, K., Goodsite, M. E., Lean, D., Poulain, A. J., Scherz, C., Skov, H., Sommar, J., and Temme, C.: A synthesis of atmospheric mercury depletion event chemistry in the atmosphere and snow, Atmos. Chem. Phys., 8, 1445–1482, https://doi.org/10.5194/acp-8-1445-2008, 2008. a
Stutz, J., Thomas, J. L., Hurlock, S. C., Schneider, M., von Glasow, R., Piot, M., Gorham, K., Burkhart, J. F., Ziemba, L., Dibb, J. E., and Lefer, B. L.: Longpath DOAS observations of surface BrO at Summit, Greenland, Atmos. Chem. Phys., 11, 9899–9910, https://doi.org/10.5194/acp-11-9899-2011, 2011. a
Tamura, T., Ohshima, K. I., and Nihashi, S.: Mapping of sea ice production for Antarctic coastal polynyas, Geopyhs. Res. Lett., 35, L07606, https://doi.org/10.1029/2007GL032903, 2008. a, b
Tang, T. and McConnell, J. C.: Autocatalytic Release of Bromine from Arctic Snow Pack During Polar Sunrise, Geophys. Res. Lett., 23, 2633–2636, https://doi.org/10.1029/96GL02572, 1996. a
Theys, N., Van Roozendael, M., Hendrick, F., Yang, X., De Smedt, I., Richter, A., Begoin, M., Errera, Q., Johnston, P. V., Kreher, K., and De Mazière, M.: Global observations of tropospheric BrO columns using GOME-2 satellite data, Atmos. Chem. Phys., 11, 1791–1811, https://doi.org/10.5194/acp-11-1791-2011, 2011. a
Toyota, K., McConnell, J. C., Lupu, A., Neary, L., McLinden, C. A., Richter, A., Kwok, R., Semeniuk, K., Kaminski, J. W., Gong, S.-L., Jarosz, J., Chipperfield, M. P., and Sioris, C. E.: Analysis of reactive bromine production and ozone depletion in the Arctic boundary layer using 3-D simulations with GEM-AQ: inference from synoptic-scale patterns, Atmos. Chem. Phys., 11, 3949–3979, https://doi.org/10.5194/acp-11-3949-2011, 2011. a
Toyota, K., Dastoor, A. P., and Ryzhkov, A.: Air–snowpack exchange of bromine, ozone and mercury in the springtime Arctic simulated by the 1-D model PHANTAS – Part 2: Mercury and its speciation, Atmos. Chem. Phys., 14, 4135–4167, https://doi.org/10.5194/acp-14-4135-2014, 2014a. a
Toyota, K., McConnell, J. C., Staebler, R. M., and Dastoor, A. P.: Air–snowpack exchange of bromine, ozone and mercury in the springtime Arctic simulated by the 1-D model PHANTAS – Part 1: In-snow bromine activation and its impact on ozone, Atmos. Chem. Phys., 14, 4101–4133, https://doi.org/10.5194/acp-14-4101-2014, 2014b. a
Vandaele, A. C., Hermans, C., Simon, P. C., Carleer, M., Colin, R., Fally, S., Mérienne, M. F., Jenouvrier, A., and Coquart, B.: Measurements of the NO2 absorption cross-section from 42,000 cm−1 to 10,000 cm−1 (238–1000 nm) at 220 K and 294 K, J. Quant. Spectrosc. Ra., 59, 171–184, https://doi.org/10.1016/S0022-4073(97)00168-4, 1998. a
van Lipzig, N. P. M., Turner, J., Colwell, S. R., and van Den Broeke, M. R.: The near-surface wind field over the Antarctic continent, Int. J. Climatol., 24, 1973–1982, https://doi.org/10.1002/joc.1090, 2004. a
Vogt, R., Crutzen, P. J., and Sander, R.: A mechanism for halogen release from sea-salt aerosol in the remote marine boundary layer, Nature, 383, 327–330, https://doi.org/10.1038/383327a0, 1996. a
von Glasow, R. and Crutzen, P. J.: Tropospheric Halogen Chemistry, Vol. 4.02, chap. Treatise on Geochemistry, edited by: Holland, H. D. and Turekian, K. K., 1–67, Pergamon, https://doi.org/10.1016/B0-08-043751-6/04141-4, 2007. a
von Glasow, R., Sander, R., Bott, A., and Crutzen, P. J.: Modeling halogen chemistry in the marine boundary layer 2. Interactions with sulfur and the cloud-covered MBL, J. Geophys. Res., 107, 4323, https://doi.org/10.1029/2001JD000943, 2002a. a, b
von Glasow, R., Sander, R., Bott, A., and Crutzen, P. J.: Modeling halogen chemistry in the marine boundary layer 1. Cloud-free MBL, J. Geophys. Res., 107, 4341, https://doi.org/10.1029/2001JD000942, 2002b. a
von Glasow, R., von Kuhlmann, R., Lawrence, M. G., Platt, U., and Crutzen, P. J.: Impact of reactive bromine chemistry in the troposphere, Atmos. Chem. Phys., 4, 2481–2497, https://doi.org/10.5194/acp-4-2481-2004, 2004. a
Wagner, T. and Platt, U.: Satellite mapping of enhanced BrO concentrations in the troposphere, Nature, 395, 486–490, https://doi.org/10.1038/26723, 1998. a
Wagner, T., Ibrahim, O., Sinreich, R., Frieß, U., von Glasow, R., and Platt, U.: Enhanced tropospheric BrO over Antarctic sea ice in mid winter observed by MAX-DOAS on board the research vessel Polarstern, Atmos. Chem. Phys., 7, 3129–3142, https://doi.org/10.5194/acp-7-3129-2007, 2007. a, b
Wennberg, P.: Atmospheric chemistry: Bromine explosion, Nature, 397, 299–301, https://doi.org/10.1038/16805, 1999. a
Wilmouth, D. M., Hanisco, T. F., Donahue, N. M., and Anderson, J. G.: Fourier transform ultraviolet spectroscopy of the transition of BrO, J. Phys. Chem., 103, 8935–8945, https://doi.org/10.1021/jp991651o, 1999. a
Yang, X., Cox, R. A., Warwick, N. J., Pyle, J. A., Carver, G. D., O'Connor, F. M., and Savage, N. H.: Tropospheric bromine chemistry and its impacts on ozone: A model study, J. Geophys. Res., 110, D23311, https://doi.org/10.1029/2005JD006244, 2005. a
Zielcke, J.: Observations of reactive bromine, iodine and chlorine species in the Arctic and Antarctic with Differential Optical Absorption Spectroscopy, PhD thesis, University of Heidelberg, https://doi.org/10.11588/heidok.00018932, 2015. a, b