the Creative Commons Attribution 4.0 License.
the Creative Commons Attribution 4.0 License.
 | 24 Feb 2023
Technical note: Chemical composition and source identification of fluorescent components in atmospheric water-soluble brown carbon by excitation–emission matrix spectroscopy with parallel factor analysis – potential limitations and applications
Tao Cao
Meiju Li
Cuncun Xu
Xingjun Fan
Wanglu Jia
Ping'an Peng
Three-dimensional excitation–emission matrix (EEM) fluorescence spectroscopy is an important method for the identification of the occurrence, chemical composition, and source of atmospheric chromophores. However, current knowledge on the identification and interpretation of fluorescent components is mainly based on aquatic dissolved organic matter and might not be applicable to atmospheric samples. Therefore, this study comprehensively investigated EEM data of different types of strong light-absorbing organic compounds, water-soluble organic matter (WSOM) in different aerosol samples (combustion source samples and ambient aerosols), soil dust, and purified fulvic and humic acids supplemented by parallel factor (PARAFAC) modeling. The results demonstrated that organic compounds with high aromaticity and strong electron-donating groups generally present strong fluorescence spectra at longer emission wavelengths, whereas organic compounds substituted with electron-withdrawing groups have relatively weaker fluorescence intensity. In particular, aromatic compounds containing nitro groups (i.e., nitrophenols), which show strong absorption and are the major component of atmospheric brown carbon, exhibited no significant fluorescence. The EEM–PARAFAC method identified three fluorescent components (i.e., C1, C2, and C3) in ambient WSOM. Although EEM–PARAFAC-derived C1 (ExEm = 235, nm) in ambient WSOM is generally considered to be protein-like groups, our findings suggested that it is mainly composed of aromatic acids, phenolic compounds, and their derivatives, with only traces of amino acids. C2 is associated with the atmospheric chemical reaction of biomass burning and/or biogenic organic molecules, with a relatively lower degree of oxidation, which are more abundant in Guangzhou WSOM (56 %–69 %). C3, in contrast, is mainly attributed to highly oxygenated organic molecules derived from soil and atmospheric aging processes and has a relatively higher contribution in Chuzhou WSOM (23 %). These findings provide new insights into the analysis of chemical properties and sources of atmospheric fluorophores using the EEM method.
- Article
(2895 KB) - Full-text XML
-
Supplement
(2486 KB) - BibTeX
- EndNote


Water-soluble organic carbon (WSOC) constitutes a substantial fraction (10 %–80 %) of organic aerosols in the atmosphere and is ubiquitous in ambient aerosols, clouds or fog, and rainwater (Wozniak et al., 2012; Huang et al., 2022; Zhang et al., 2022a). Recent studies have highlighted that a portion of WSOC, termed brown carbon (BrC), can absorb light in the near-ultraviolet and visible ranges (Laskin et al., 2015; Frka et al., 2022; Ma et al., 2022). Owing to its strong light-absorption capacity, BrC can cause up to 45 % of solar radiation absorption by atmospheric aerosols and has potential effects on regional and even global climate (Zhang et al., 2013). In addition, BrC also participates in atmospheric photochemical reactions, affects the physicochemical properties of atmospheric aerosols (Laskin et al., 2015; Tang et al., 2020b), and can potentially be activated to form reactive oxygen species that cause adverse effects on human health (Cao et al., 2021; Zhang et al., 2022b).
Excitation–emission matrix (EEM) fluorescence spectroscopy is a highly sensitive and widely used analytical technique for the identification of the chemical characteristics and sources of chromophores in dissolved organic matter (DOM) in aquatic environments (Murphy et al., 2010, 2013; Zhang et al., 2014). Recently, the EEM method has been further extended and frequently applied to the investigation of water-soluble organic matter (WSOM), such as light-absorbing organic compounds in atmospheric aerosols and fine particles from combustion processes (Chen et al., 2020; Fan et al., 2016; Wu et al., 2020; Yang et al., 2022). For instance, humic-like substances (HULIS) and protein-like substances (PRLIS) have been identified as important fluorescent components in combustion-derived particles (Cao et al., 2021; Tang et al., 2021) and ambient aerosols (Ma et al., 2022; Wu et al., 2020; Yang et al., 2022). Chen et al. (2016b) used the EEM method coupled with parallel factor analysis (PARAFAC) and high-resolution mass spectrometry to identify chromophores in ambient aerosols and proposed that fluorescent components with longer excitation (Ex)emission (Em) wavelengths comprise more highly oxygenated groups (Chen et al., 2016a). In addition, further application of the EEM method has also revealed that the concentration and types of fluorophores obviously vary during atmospheric processes, such as photolytic aging of chromophores derived from biomass burning (BB) (Aftab et al., 2018; Tang et al., 2020b). Therefore, the EEM method has significant potential for the characterization (types, sources, and evolution) of atmospheric BrC.
However, application of the EEM method to the identification of atmospheric BrC has some limitations. It is well known that the present identification, classification, and interpretation of fluorescent components in atmospheric WSOM are mainly based on the fluorescence peak position of DOM in aquatic environments (Coble, 1996; Wünsch et al., 2019). Nonetheless, the chemical and molecular composition and source of WSOM in atmospheric aerosols significantly vary compared with those of DOM in aquatic environments (Graber and Rudich, 2006; Laskin et al., 2015); hence, the current fluorescence criterion derived from aquatic environments could lead to some inaccurate description of the fluorescent components in atmospheric WSOM. For instance, the EEM region at ExEm = nm is assigned to PRLIS and/or tryptophan-like substances in aquatic environments (Coble, 1996) but is also associated with non-nitrogen species such as polyphenols in atmospheric WSOM (Chen et al., 2016b). The EEM region at peak M (290––420 nm) is considered to be a typical signal of marine-derived HULIS (Coble, 2007; Zhao et al., 2019), but the source of this peak should be cautiously investigated when interpreting BrC in continental aerosols. In addition, the intensities of fluorescent species are not always linearly correlated with their concentrations, which can be affected by the aromatic ring system and the number and types of functional groups, thereby leading to greater uncertainty in intensity measurements (Andrade-Eiroa et al., 2013; Chen et al., 2020; Wang et al., 2020). Atmospheric BrC is composed of complex organic molecules with different light absorption properties (Lin et al., 2020; Huang et al., 2021; Jiang et al., 2022), and only a subset of BrC molecules that contain functional groups are capable of fluorescence emission upon relaxation from an excited state (Andrade-Eiroa et al., 2013). Hence, interpretation of fluorescence data may only correspond to fluorescent chromophores and may not be representative of BrC as a whole (Chen et al., 2020; Wang et al., 2020). All of these factors limit further application of the EEM method to the analysis of atmospheric BrC. Therefore, it is essential to investigate the light-absorbing species that can be detected using the EEM method and obtain important information for identifying the chemical compositions and possible sources of these species.
Accordingly, in the present study, the EEM profiles of a series of BrC model compounds and WSOM isolated from primary-combustion samples, soils, and atmospheric aerosols were investigated. The chemical characteristics and sources of the main fluorophores were interpreted according to the fluorescence peaks' location and intensity, and the chemical structures of the model compounds and source samples were analyzed. Following this, atmospheric aerosols in Guangzhou (GZ) and Chuzhou (CZ) cities were collected, and fluorescent chromophores within the water-soluble fraction were identified to estimate the application of the EEM–PARAFAC method with respect to characterizing atmospheric BrC. The results obtained help to broaden the application of the EEM–PARAFAC method to the study of atmospheric BrC.
2.1 Materials
For the accurate identification of the chemical composition and structure of fluorophores in atmospheric BrC and for the assessment of the application of the EEM method to examine atmospheric BrC, a total of 136 samples were investigated in this study. The samples comprised the following: (1) 35 BrC model compounds, including phenolic compounds, aromatic acids, nitroaromatic compounds (NACs), PRLIS, N-heterocyclic compounds, and polycyclic aromatic hydrocarbons (PAHs) as well as their derivatives (detailed information is given in Text S1.1 and Table S1 in the Supplement), which are usually detected in ambient samples and have been considered typical BrC model compounds (Frka et al., 2022; Lin et al., 2016, 2017; Wang et al., 2017; Huang et al., 2021); (2) 13 primary-combustion-source samples collected from BB, coal combustion (CC), and vehicle emission (VE); (3) 5 soil samples obtained from the rural area of Guangdong Province, China, with different vegetation, which is also an important source of atmospheric BrC and has been widely identified in previous studies (Chen et al., 2020; Vasilatou et al., 2017); (4) 6 purified fulvic acids and humic acids (FAs and HAs, respectively) kindly provided by Weilin Huang (Rutgers, The State University of New Jersey, NJ, USA); and (5) 34 diurnal fine-particulate-matter (PM2.5) samples collected from 6 to 22 April 2021 at GZ and CZ, respectively. In addition, 43 annual PM2.5 samples were collected from February 2018 to January 2019 at the GZ site and were classified as wet- or dry-season atmospheric PM2.5 samples (for detailed information, see Text S1 in the Supplement). Field blank samples were collected without the instrument power on during each sampling period.
2.2 Standard solution and aqueous extraction of ambient samples
Solutions of model organic compounds were prepared by dissolving a certain amount of dried solid or liquid sample in Milli-Q water or methanol. The ambient aerosol and soil samples were ultrasonically extracted with ultrapure water three times, and the supernatants were filtered using a 0.22 µm polytetrafluoroethylene (PTFE) syringe filter to isolate the WSOM. The specific separation and purification methods have been published in previous studies (Chen et al., 2020; Fu et al., 2015; Wang et al., 2020; Yan and Kim, 2017) and are presented in the Supplement (Test S2).
2.3 EEM–PARAFAC analysis
The EEM fluorescence spectra of the aqueous extraction of the samples in 1 cm quartz cuvettes were recorded using a three-dimensional fluorescence spectrophotometer (Aqualog; HORIBA Scientific, USA) at room temperature. The scanning ranges for Ex and Em were 200–500 and 250–550 nm, respectively. The wavelength increment of the Ex and Em scans was 5 nm, the integration time was 0.5 s, and Milli-Q water (18.2 MΩ cm) was used as the blank reference. The absorbance measurements were used to correct the EEM for inner-filter effects (IFEs), as described previously (Fu et al., 2015), if the absorbance was >0.05 at 250 nm (Murphy et al., 2013; Tang et al., 2020a). Background samples were also analyzed, and the background values were subtracted from the values obtained for all of the samples. It is noted that all of the EEM spectra were normalized by the water Raman peak area to produce a corrected fluorescence intensity in Raman units (RU). The corrected fluorescence intensity was then further divided by the organic carbon concentration of the corresponding sample to obtain the specific fluorescence intensity (RU/(mgC L−1)) (Yang et al., 2022), as shown in Table S2 in the Supplement.
The PARAFAC modeling procedure was conducted for 77 atmospheric WSOM samples in MATLAB 2014b (MathWorks, Inc., USA) using the drEEM toolbox (Murphy et al., 2018; Wünsch et al., 2019). PARAFAC was computed using two- to nine-component models, with non-negativity constraints and residual analysis, and split-half analysis was employed to validate the number of fluorescent components. Based on the results of the split-half and core consistency analyses, three-component models were chosen for further investigation. The relative contribution of individual chromophores was estimated by calculating the maximum fluorescence intensities (Fmax: maximum fluorescence intensity of the identified fluorescent components; relative content (%) = ) (Chen et al., 2020; Fan et al., 2020).
3.1 Fluorescence properties of BrC model compounds
To identify whether the light-absorbing species possess fluorescence, a series of BrC model compounds were tested using the EEM method, and the fluorescence profiles are shown in Fig. S1 in the Supplement. The results revealed that the location and intensity of the fluorescence peaks of different compounds were different, varying with the distinct functional groups and aromatic conjugate system.
Although phenolic compounds are important light-absorbing species in atmospheric BrC (Smith et al., 2016; Yu et al., 2014, 2016), not all of them exhibit strong fluorescence. As shown in Fig. S1a in the Supplement, a strong fluorescence peak in the EEM spectrum of phenol was observed at ExEm = 270/295 nm. When the phenol compounds were substituted with electron-donating groups (e.g., hydroxyl), all of the stronger fluorescence peaks were obviously red-shifted to 310–320 nm (e.g., catechol, hydroquinone, and 2-methoxyphenol). However, phenolic compounds substituted with electron-withdrawing groups (e.g., carboxyl and aldehyde) displayed weaker or even no fluorescence (Fig. S1a). These differences could be due to the ability of the electron-donating groups to form a larger conjugate system coupled with the benzene ring and decrease the transition energy, thereby leading to an increase in the Em wavelength (i.e., red shift) and variation in the fluorescence intensity (Chen et al., 2002; Andrade-Eiroa et al., 2013). In contrast, the electron-withdrawing group can reduce the conjugated structure formed by the benzene ring and hydroxyl group, reducing the fluorescence intensity (Andrade-Eiroa et al., 2010, 2013).
Aromatic acid and its derivatives are also important light-absorbing organic compounds in atmospheric BrC. Owing to the negative effects of the carboxyl group, a weak fluorescence peak ( nm) was identified for benzoic acid, and no fluorescence was detected for benzene polycarboxylic acids, such as phthalic acid, terephthalic acid, and trimesic acid (Fig. S1b). However, when benzoic acid was substituted with electron-donating groups (e.g., hydroxyl and methoxy), higher-intensity fluorescence peaks were observed. Two strong fluorescence peaks at and nm were identified for 2-hydroxybenzoic acid substituted with only one hydroxyl group. These peaks could have been the result of the ortho structure of the hydroxy and carboxyl groups, which is favorable for the formation of intramolecular hydrogen bonds and generates a double-ring conjugate structure, reducing the transition energy and, thus, presenting strong UV absorption and fluorescence (Andrade-Eiroa et al., 2013).
N-containing compounds, especially NACs, have strong light absorption, and have been reported to be the major components of atmospheric BrC, accounting for more than 60 % of the total light absorption intensity at 300–500 nm (Huang et al., 2021; Lin et al., 2016, 2017; Wang et al., 2017; Frka et al., 2022). However, most of the NACs did not exhibit any fluorescence (Fig. S1c), similar to the results reported by Chen et al. (2020), which could be due to the significant reduction in the electron density of the benzene ring by the nitro (–NO2) group – strong electron-withdrawing group – weakening the fluorescence.
Tryptophan and tyrosine are the two most studied PRLIS species, and their EEM spectra are generally used as standards for comparison with fluorophores in atmospheric WSOM (Matos et al., 2015; Qin et al., 2018). As shown in Fig. S1d in the Supplement, the ExEm peaks at and nm corresponded to tyrosine and tryptophan, respectively. The maximum Em wavelength of phenylalanine was more inclined to a short wavelength (280 nm) and with a much weaker fluorescence intensity. Moreover, the fluorescence peaks of PRLIS obviously overlapped with those of phenols and aromatic acids (Fig. S1a, b). It must be noted that the concentrations of phenols and aromatic acids were significantly higher than those of tryptophan and tyrosine in the atmospheric samples (Table S2); therefore, the aerosol BrC fluorophores in these regions are more likely to have originated from phenols and aromatic acids than from PRLIS.
N-heterocyclic compounds such as pyrrole, pyridine, and imidazole are commonly identified in atmospheric samples (Dou et al., 2015; Jiang et al., 2019; Kosyakov et al., 2020). However, no fluorescence was observed for these three species in the present study, indicating that the absorbed energy may have been consumed by relaxation or vibration (Fig. S1e). Nevertheless, imidazole-2-formaldehyde produced two strong fluorescence peaks at and nm, formed from the oxidation of imidazole, suggesting that some N-heterocyclic compounds from secondary reactions may exhibit strong fluorescence at higher wavelengths in atmospheric BrC (Ackendorf et al., 2017).
PAHs and their derivatives are mainly formed from incomplete combustion processes and are important components of BrC (Chen et al., 2020; Lin et al., 2017; Mahamuni et al., 2020). As shown in Fig. S1f in the Supplement, all PAHs exhibited strong fluorescence emission, with its peak location associated with the conjugated aromatic system. Naphthalene presented a fluorescence band located at the maximum Em wavelength of approximately 325 nm. As expected, with the increasing size of the π-bond system and degree of conjugation, the fluorescence band moved toward the longer wavelength range, and a new Em band was observed at 360–390 nm for 3- to 4-ring phenanthrene and pyrene and at 400–500 nm for ≥ 5-ring PAHs (Mahamuni et al., 2020). The fluorescence spectra of high-ring-number PAHs were more complex because of more types of double bonds. As shown in Fig. S1f in the Supplement, the intensity and location of the fluorescence peaks also significantly changed when different types of groups were substituted with PAHs. For example, 1-naphthol exhibited a stronger EEM peak at a relatively longer wavelength (230, nm) owing to its highly conjugated structure, compared with naphthalene. This EEM spectrum was located in the EEM region of FAs, implying that FAs are composed of aromatic units and O-containing groups. In contrast, relatively weaker fluorescence was observed for 9-fluorenone, anthraquinone, and 2-naphthalenecarboxylic acid, and no EEM signal was observed for 2-nitronaphthol (Fig. S1c), which was substituted with a strong electron-withdrawing group (–NO2).
3.2 Fluorescence properties of BrC from different sources
As shown in Fig. S4a and b in the Supplement, BB and CC WSOM exhibited similar fluorescence spectra (Tang et al., 2020a; Chen et al., 2020; Yang et al., 2022), with two types of fluorescence peaks at ExEm ≈ (230–240) (340–400) nm (peak A) and ExEm ≈ (260–280) (330–360) nm (peak B), respectively. The two fluorescence peaks were similar to those previously reported for BB WSOM and HULIS (Fan et al., 2020; Tang et al., 2020a; Yang et al., 2022). In general, peak A mainly corresponds to the protein-like UV region, with a minor contribution from fulvic-like substances, whereas peak B could be attributed to tryptophan-like fluorophores. However, based on the results of the present study, these two peaks could be mainly attributed to aromatic species such as aromatic acids, phenolic compounds, and minor quantities of PAHs (e.g., naphthalene) (Fig. 1). The fluorescence spectra of WSOM from two types of vehicles (diesel and gasoline) also presented two fluorophores. A relatively strong fluorescence peak was observed at the low Ex wavelength (ExEm ≈ nm), and a relatively weaker peak was detected at the high Ex wavelength (ExEm ≈ nm) (Fig. S4c). These results are consistent with those reported in previous studies on VE (Chen et al., 2020; Tang et al., 2020a; Yang et al., 2022) and are similar to the EEM fluorescence spectra of BB and CC WSOM (Chen et al., 2020; Fan et al., 2020; Cao et al., 2021; Yang et al., 2022). However, the fluorescence ranges of vehicle WSOM were obviously narrower, suggesting that BB and CC WSOM fluorescent components are more complex.
Soil-derived DOM is also a primary source of atmospheric WSOM. As shown in Fig. S5a in the Supplement, two main fluorescence peaks, located at ExEm = and nm, were detected in the fluorescence spectra of soil DOM; these two fluorescence peak positions of soil DOM were similar to those reported in previous studies (Ge et al., 2021; Liu et al., 2009) as well as to the fluorescence peak positions of FAs in this study (Fig. S5b).
Secondary chemical formation is another important source of atmospheric WSOM. For example, the aqueous-phase reactions of aldehydes with ammonium sulfate (AS) can produce highly fluorescent species (Hawkins et al., 2016). The glyoxal–AS and glyoxal/glycine reaction products fluoresce at nm, whereas the formaldehyde–AS reaction product fluoresces at nm. Secondary organic aerosols (SOAs) produced in the limonene O3 system have been reported to strongly fluoresce in the presence of NH3 (Bones et al., 2010). In addition, the aging of primary organic compounds has also been found to change the fluorescence spectra (Lee et al., 2013; Li et al., 2021; Powelson et al., 2014). For instance, the aging of syringic acid with OH radicals caused the initial fluorescence band to move toward the long wavelength range, producing a new fluorescence peak with a broad Em band at 400–600 nm. Similarly, the fluorescence peaks red-shifted (e.g., from 260– to 280––400 nm) during the O3 aging process (Fan et al., 2020), suggesting the degradation of the initial compound and the formation of new secondary organic compounds generally located at longer wavelengths, possibly with a high degree of aromaticity or highly oxidized functional groups (Chen et al., 2016a; Vidović et al., 2019, 2020; Powelson et al., 2014; Vione et al., 2019; Yu et al., 2016).
3.3 Identification of chemical species and potential sources of fluorescent components in ambient aerosols
Typical EEM spectra of atmospheric water-soluble light-absorbing compounds are shown in Fig. 2. Three fluorescence peaks were identified in the aerosol WSOM samples: a stronger fluorescence peak at ExEm = 230––420 nm and two relatively weaker fluorescence peaks at ExEm = 270––370 and 300––420 nm. Similar fluorescence bands have been previously identified in the EEM fluorescence spectra of WSOM from PM2.5 in the cold and warm seasons in Aveiro, Portugal (Matos et al., 2015); the High Arctic atmosphere (Fu et al., 2015); Godavari, Nepal (G. Wu et al., 2019); Lanzhou and Xi'an, northwestern China (Qin et al., 2018; Chen et al., 2020); Chongqing, southwestern China (Wang et al., 2020); and Harbin, northeastern China (Ma et al., 2022). Although the fluorescence intensities varied among sites and seasons, the shapes of the EEM spectra of WSOM were very similar, making it difficult to directly distinguish the different samples based solely on the characteristics of the EEM profiles. Therefore, a more powerful protocol known as the PARAFAC method was employed to identify the individual fluorophores in ambient WSOM.
3.3.1 Identification and quantification of fluorescent components using the PARAFAC method
As shown in Fig. 3, three fluorescent components (C1, C2, and C3) were identified in the atmospheric samples: C1 occurred at a relatively lower Em wavelength, exhibiting two fluorescence peaks at ExEm = 235(270) 330 nm; C2 presented fluorescence peaks at around ExEm = 235(320) 390 nm; and C3 had a longer Em wavelength than C1 and C2, which was located at ExEm = ∼ 250(355) 455 nm. In general, these fluorescent components have been interpreted based on knowledge of the fluorescence characteristics of aquatic DOM. Accordingly, C1 is considered to belong to the typical PRLIS (Coble, 1996; Wünsch et al., 2019), C2 is associated with fulvic-like substances or less-oxygenated HULIS (Liu et al., 2009; Zhang et al., 2014), and C3 is usually considered to correspond to terrestrial HULIS that are highly oxygenated organic matter (Table S3) (Liu et al., 2009; Wünsch et al., 2019; Zhou et al., 2017). However, it must be noted that the sources and transformation processes are significantly different for WSOM in aerosols and DOM in aquatic and terrestrial environments; therefore, the fluorescence classifications of DOM might not be applicable to atmospheric WSOM.
In general, the Ex and Em wavelengths of fluorescent components are mainly associated with their chemical characteristics and structures (Table S1, Fig. 1). In the present study, C1 was similar to tryptophan-like fluorophores associated with PRLIS in rainwater (Zhang et al., 2014; Zhou et al., 2017) and fog water (Bianco et al., 2014, 2016). However, this fluorophore might also be related to small molecular aromatic compounds, such as aromatic acids (e.g., 3,5-dihydroxybenzoic acid and 2-naphthalenecarboxylic acid) and PAHs (e.g., naphthalene, phenanthrene, and anthraquinone) (Fig. 1a) (Miyakawa et al., 2015; G. Wu et al., 2019). In addition, this fluorophore could also contain traces of some phenolic compounds, including catechol, hydroquinone, and 2-methoxyphenol. These organic species might be generated by various types of combustion processes and atmospheric oxidation reactions. It must be noted that investigations of the fluorescent components in atmospheric WSOM should not only consider their position in the fluorescence spectrum but also their concentration and possibility of trapping. Many previous studies have reported that the concentration of amino acids in atmospheric aerosols is almost negligible, when compared with that of lower-molecular-weight aromatic compounds such as aromatic acids and phenolic compounds (Table S2) (Bianco et al., 2016; Song et al., 2017; Vione et al., 2019; Mahamuni et al., 2020; and references therein). Therefore, fluorescent components in this ExEm region could be attributed to small molecular aromatic species (e.g., aromatic acids and phenolic compounds) rather than PRLIS. Moreover, this fluorophore overlapped with that of WSOM from combustion process such as BB, CC, and VE (Fig. 1b), suggesting a significant contribution from the combustion process.

Figure 1Comparison of the chemical characteristics of molecules assigned to each fluorescence component of BrC model compounds (a) and source WSOM (b).
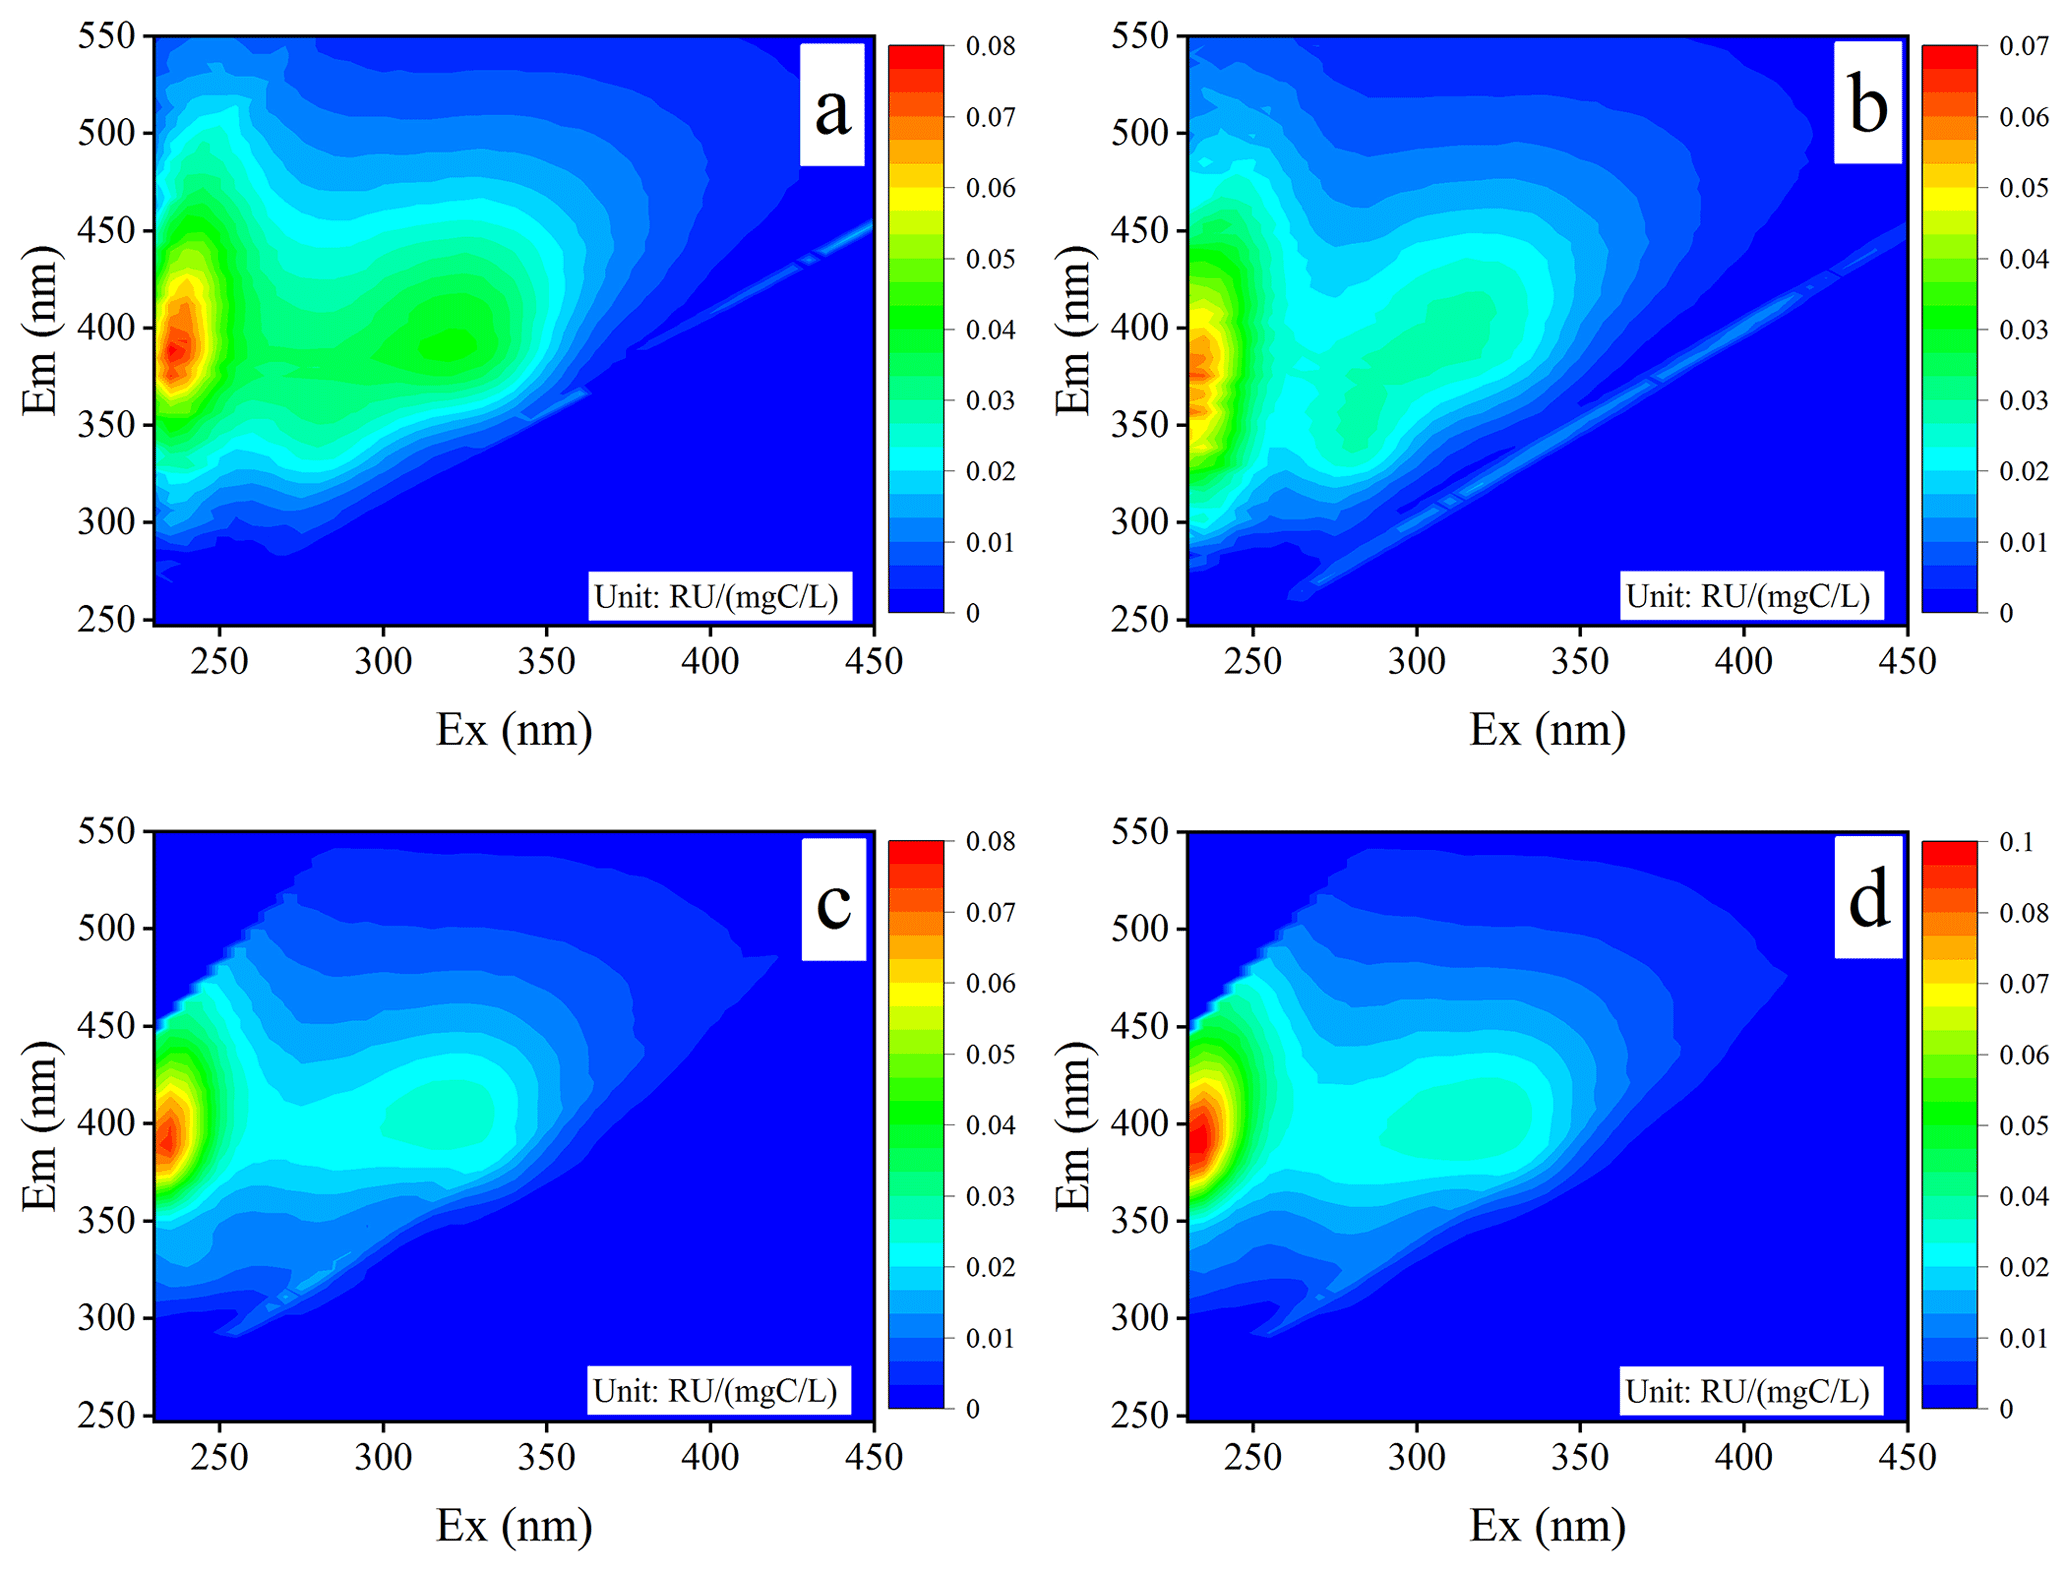
Figure 2The three-dimensional EEM spectra of WSOM in atmospheric PM2.5 samples for (a) Chuzhou (CZ), (b) Guangzhou (GZ), (c) GZ in the wet season, and (d) GZ in the dry season.
When compared with C1, C2 exhibited a strong fluorescence peak at a longer ExEm wavelength of 235(320) 390 nm, implying that this fluorescent component presented a relatively larger molecular size and higher aromaticity than C1 (Pöhlker et al., 2012). As shown in Fig. 1a, the fluorescence of C2 is similar to that of aromatic compounds (e.g., 2-naphthalenecarboxylic acid, 2-hydroxybenzoic acid, and anthraquinone) and high-ring-number PAHs (e.g., pyrene, anthraquinone, anthracene, and chrysene) (Mahamuni et al., 2020), and it overlaps with the fluorescence spectra of FAs. In addition, this fluorophore has also been reported to be related to the generation of SOAs from organic precursors emitted from biological/anthropogenic emission and combustion processes (Wang et al., 2020). For example, the aqueous-phase reactions of aldehydes with AS have been proposed as an important source of atmospheric BrC that present similar fluorescence spectral profiles (Hawkins et al., 2016; Lee et al., 2013) (Fig. 1b). In addition, oxidative oligomerization of phenols and their derivatives can also shift the ExEm wavelength of these substances to longer wavelengths, falling into similar fluorescence regions (Li et al., 2021; Tang et al., 2020a; Vione et al., 2019). As suggested by Chen et al. (2016a), this fluorescent component may be a less-oxygenated fluorescent group contributed by biomass combustion. Therefore, fluorophore C2 might be related to the derivatives of biomass burning and/or biogenic molecules, with a relatively lower degree of oxidation (Chen et al., 2016a; Jiang et al., 2022).
C3 presented a longer Em wavelength than C1 and C2, with two peaks at around ExEm = and nm (Fig. 3). This fluorescent component overlaps with the fluorescence of high-ring-number PAHs and their derivatives, such as fluoranthene, benzo[b]fluoranthene, benzo[a]pyrene, indeno[1,2,3-cd]pyrene, 1-naphthol, and N-heterocyclic compounds, including imidazole-2-formaldehyde (Chen et al., 2020; Mahamuni et al., 2020). Furthermore, this fluorescent component exhibited a similar ExEm wavelength to that of FAs and HAs (Fig. S5b), suggesting the possible contribution of soil dust, and thus could be assigned to HULIS (Lin and Guo, 2020). Similar fluorescent substances have also been identified in the study of atmospheric aerosol fluorescent chromophores, such as the highly oxygenated HULIS in Nagoya, Japan (Chen et al., 2016a); Lanzhou, China (Qin et al., 2018); Xi'an, China (Chen et al., 2020); a haze event in Harbin (Ma et al., 2022); and humic-like compounds with more aromatic and unsaturated bonds in Godavari, Nepal (G. Wu et al., 2019), and Tianjin, China (Deng et al., 2022). Based on the PARAFAC results with aerosol mass spectrometry data, C3 was considered to be a fluorescent group with a high oxygen content and a high ratio, close to that of aged organic aerosols (Chen et al., 2016a; Jiang et al., 2022) (Fig. 1b). It must be noted that low-molecular-weight organic compounds can further undergo oligomerization to high-molecular-weight species with long Em wavelengths during the aging process (Hawkins et al., 2016; Li et al., 2021; Tang et al., 2020b; Yu et al., 2016). The resulting compounds may present a more complex structure than their precursors, probably owing to the presence of condensed aromatic rings and other π-electron systems with a high level of conjugation; thus, atmospheric aging is assumed to be a potential contributor to C3 (Barsotti et al., 2016; De Laurentiis et al., 2013; Hawkins et al., 2016).
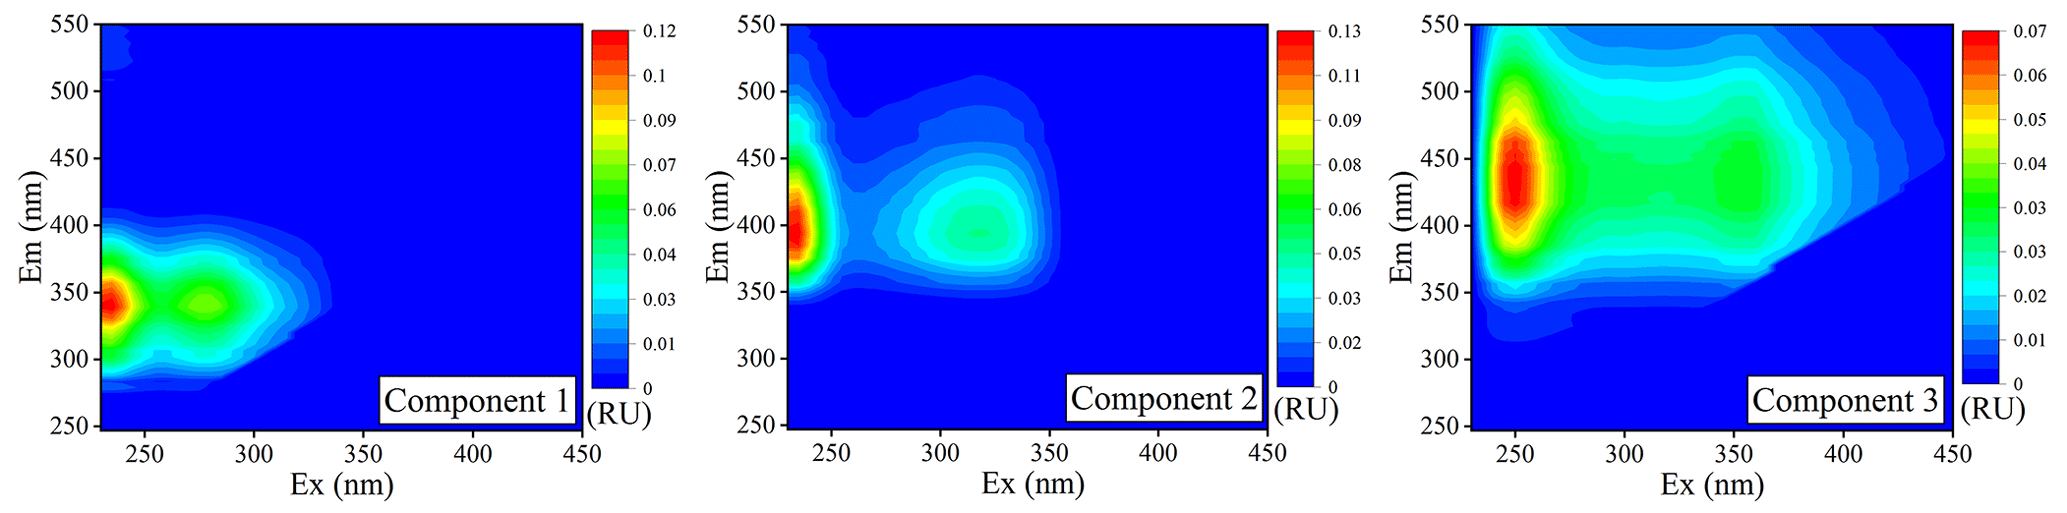
Figure 3The EEM components derived from the PARAFAC model of WSOC in atmospheric PM2.5 samples collected at the Chuzhou (CZ) and Guangzhou (GZ) sites.
3.3.2 Spatial and seasonal variations in fluorescent components in WSOM
The relative contributions of C1, C2, and C3 components to the total fluorescence intensities ( were calculated (Fig. 4) and were found to be similar for WSOM from CZ and GZ, exhibiting a maximum C2 content and relatively lower C1 and C3 contents. Furthermore, WSOM samples showed obvious spatial and seasonal variations, similar to the results reported in other regions in China (Zhang et al., 2022a, b). First, CZ WSOM presented a relatively higher C3 content (23 ± 4 %) than GZ WSOM (17 ± 3 %), whereas GZ WSOM had a relatively higher C2 content (56 ± 7 %) than CZ WSOM (49 ± 4 %) during the same sampling period. Such differences in the composition of fluorescent components may be ascribed to the variation in the primary emission sources and atmospheric aging process at the two sites. The relatively higher C3 content in CZ could be attributed to the comparatively high contribution of soil dust in the suburban region, which is consistent with the relatively higher Ca2+ contents in CZ PM2.5 (1.8 ± 1.2 %) compared with GZ PM2.5 (1.5 ± 0.8 %) (Vasilatou et al., 2017; L. Wu et al., 2019). In contrast, the relatively higher C2 content in GZ WSOM may be attributed to the comparatively stronger atmospheric chemical reaction associated with bio-volatile organic compounds (bio-VOCs) in the hot and humid region of GZ. This result was consistent with the relatively higher humification index (HIX) and normalized fluorescence volume (NFV) values (log(NFV)) of CZ WSOM (Fig. S6) (Chen et al., 2020; Yang et al., 2022).
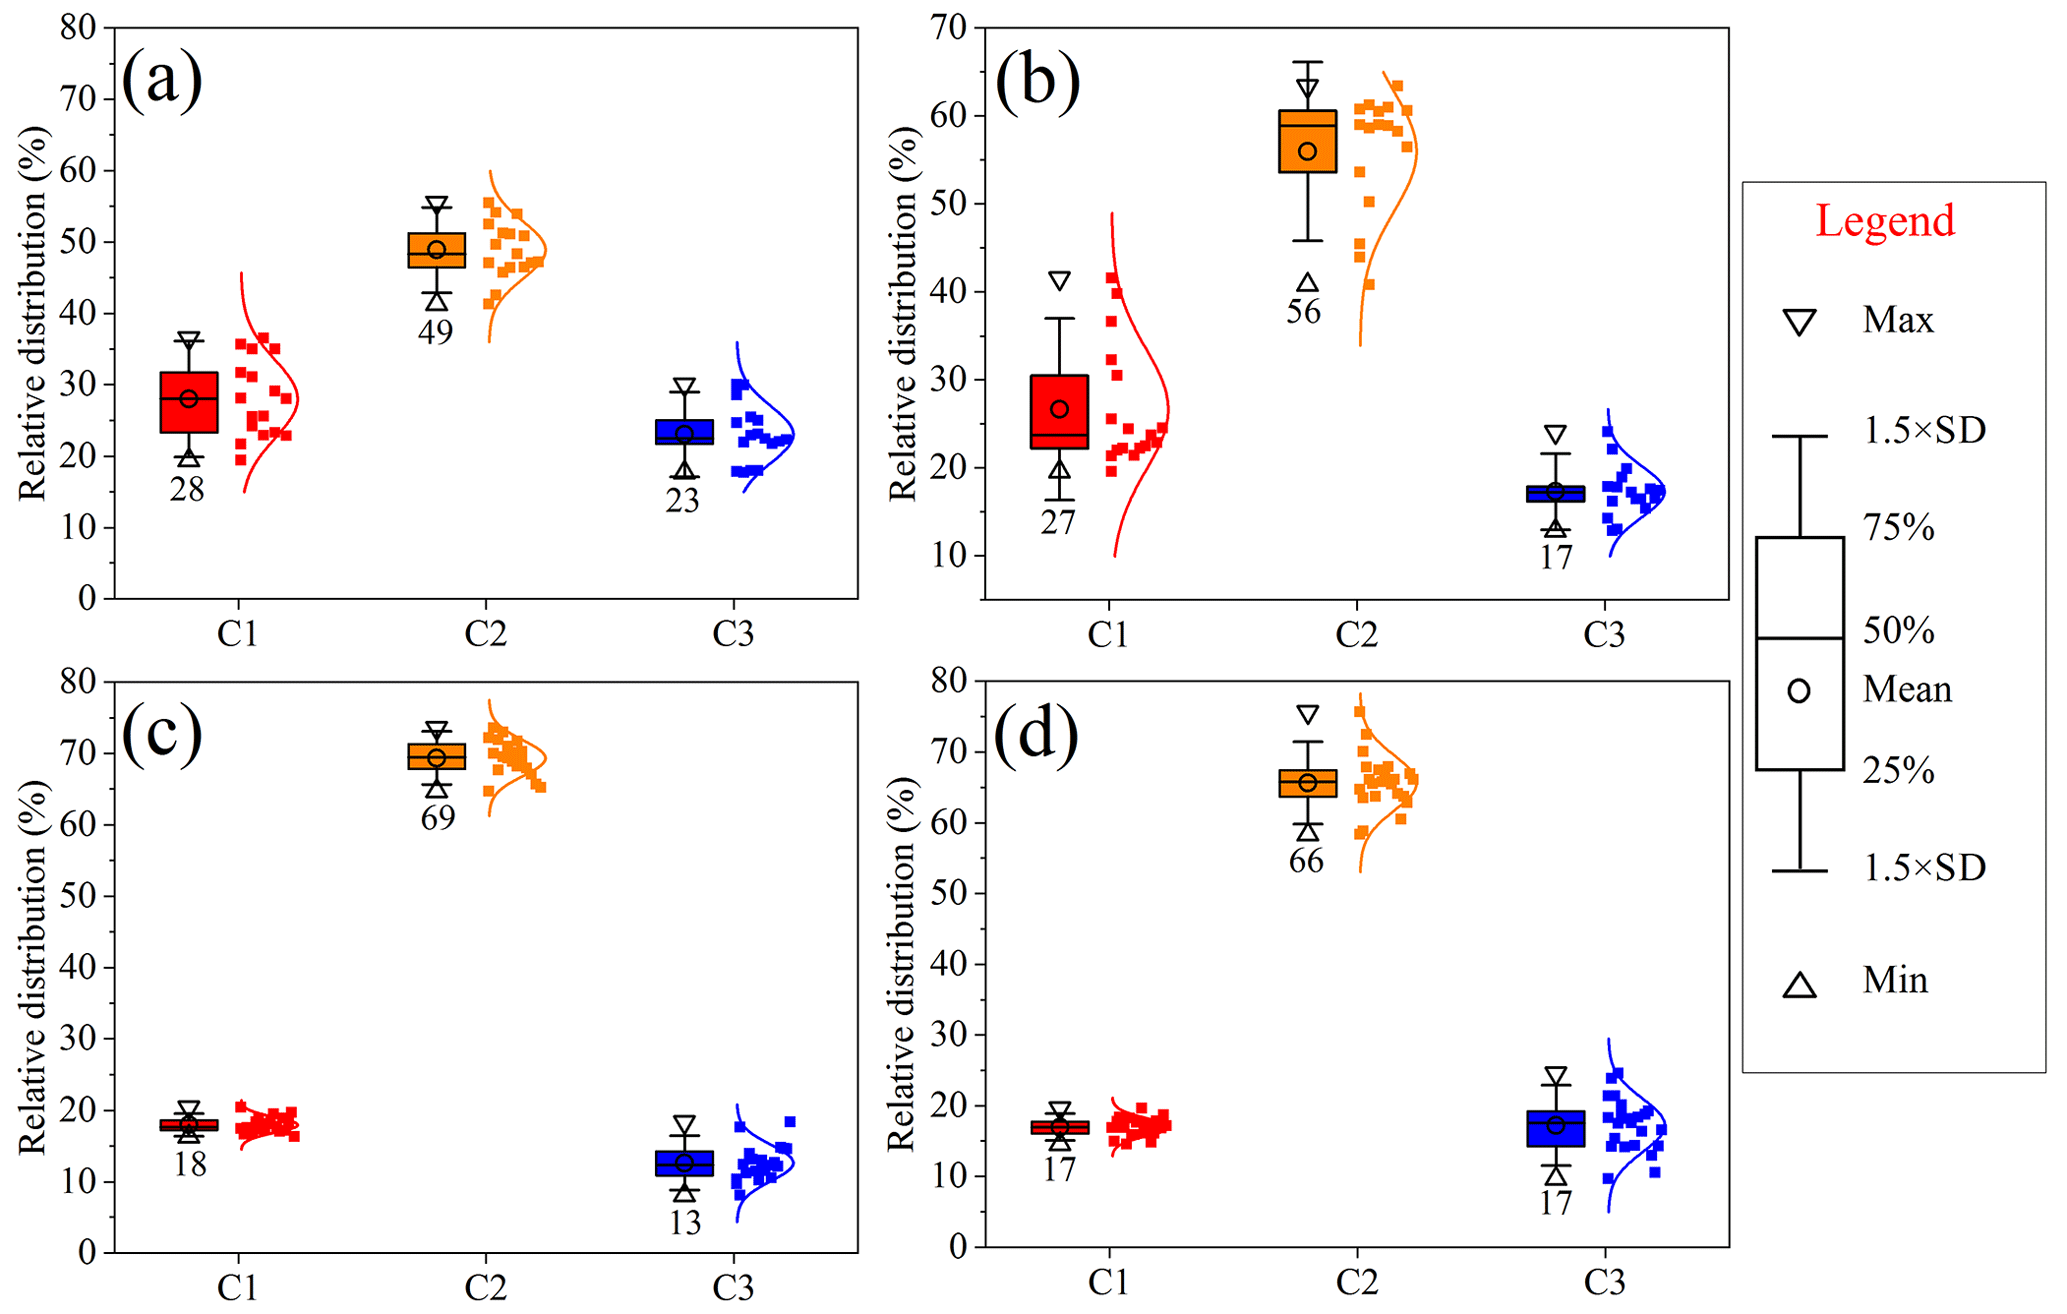
Figure 4Relative contribution of individual fluorophores of atmospheric WSOM for (a) Chuzhou (CZ), (b) Guangzhou (GZ), (c) the wet season in GZ, and (d) the dry season in GZ. The colored box represents the data range of 25 %–75 %; the horizontal line within the box represents the median line (50 %); the error bars represent 1.5 times the standard deviation; the circle in the box represents the mean value of the data; the triangles at the bottom and top represent the minimum and maximum values of the data, respectively; and the dots to the right of the box represent the overall data coupled with the Gaussian distribution line.
In addition, the resolved Ex and Em spectra for GZ WSOM were also similar in different seasons, implying that the types of fluorophores contributing to WSOM were predominantly the same throughout the year. However, the compositions of fluorescent components varied in different seasons. In the dry season (October–March), WSOM showed relatively higher contents of C3 fluorophores (17 ± 4 %), whereas slightly higher contents of C2 fluorophores (69 ± 4 %) were detected in the wet season (April–September) (Fig. 4; Chen et al., 2020; Wang et al., 2020). These differences might be associated with the variations in the source composition and aging effects of BrC in different seasons. The higher content of C3 in WSOM in the dry season suggested the occurrence of more highly aromatic and highly oxidized compounds. These results could be explained by the fact that more aged organic aerosols and dust were transported from the northern region of China (Jiang et al., 2021). In contrast, the slightly higher C2 content in the wet season may be attributed to the relatively stronger secondary formation of bio-SOAs and photodegradation effects in the high-temperature and high-relative-humidity season.
In this study, the fluorescence properties of BrC model compounds were investigated to determine the chromophoric species that can be evaluated by the EEM method. Accordingly, the aerosol WSOM samples at two sites (CZ and GZ) were investigated using the EEM–PARAFAC method, and the chemical characteristics and potential sources of fluorescent components were examined. The main conclusions and future prospects are as follows:
-
Fluorescent components have predominantly been evaluated based on the knowledge of fluorophores in aquatic DOM, which often leads to misinterpretation. In the present study, the chemical characteristics of fluorophores in different ExEm regions were discussed based on the fluorescence properties of BrC model compounds and their amounts in aerosols. In particular, the C1 fluorophore in atmospheric WSOM, which has been frequently assigned to PRLIS because of the similarity in fluorescence spectra, was demonstrated to mainly include aromatic acids, phenolic compounds, and their derivatives, with negligible amounts of amino acids.
-
The fluorescence properties of target compounds are mainly influenced by the aromatic system and characteristics of adjacent functional groups. Organic compounds with high aromaticity and strong electron-donating groups (e.g., hydroxyl and methoxyl) generally exhibited strong fluorescence spectra at longer Em wavelengths, whereas organic compounds substituted with electron-withdrawing groups presented relatively weaker fluorescence intensities. In particular, aromatic compounds containing nitro groups (i.e., nitrophenols) showed strong absorption and were the major component of atmospheric BrC; however, they did not exhibit significant fluorescence. Thus, the fluorescence method could only measure a subset of chromophores in aerosol BrC and should be used with caution for the investigation of aerosol BrC.
-
The EEM spectra for aerosol WSOM were very similar; however, the relative contents of certain fluorescent components significantly varied with the sampling site and season. For example, more fluorescent components associated with soil and secondary oxidation of small molecular compounds from combustion emissions were identified in CZ WSOM, whereas more fluorescent components derived from the atmospheric chemical reaction of bio-VOCs were observed in GZ WSOM. In addition, GZ WSOM exhibited more highly aromatic and highly oxidized compounds in the dry season.
Although many studies have applied the EEM–PARAFAC method to investigate atmospheric WSOM and have obtained useful data, there are still challenges and gaps that must be addressed. First, caution should be taken for credible interpretations of the fluorescent components in atmospheric WSOM because of the differences in chemical characteristics of organic matter derived from different sources. In addition, the same fluorophores may exhibit different ExEm ranges and intensities under different environmental conditions (e.g., pH and coexisting metal ions and inorganic salts). Therefore, more theoretical and experimental studies are necessary to understand the relationship between the fluorescent groups and positions of fluorescence peaks as well as the influences of sources and chemical formation processes of the fluorescent groups on fluorescence peaks.
The research data are available from the Harvard Dataverse: https://doi.org/10.7910/DVN/ULCIU9 (Song, 2022).
The supplement related to this article is available online at: https://doi.org/10.5194/acp-23-2613-2023-supplement.
JS designed the research. TC and CX analyzed the model compounds and the WSOM samples using UV–Vis and EEM methods. TC and XF resolved the EEM using the PARAFAC tool. ML carried out the PM2.5 sampling experiments. TC and JS wrote the paper. JL, WJ, and PP commented on and revised the paper.
The contact author has declared that none of the authors has any competing interests.
Publisher’s note: Copernicus Publications remains neutral with regard to jurisdictional claims in published maps and institutional affiliations.
This is contribution no. IS-3308 from GIGCAS.
This research has been supported by the National Natural Science Foundation of China (grant nos. 42192514 and 41977188) and the Guangdong Foundation for Program of Science and Technology Research (grant nos. 2020B1212060053 and 2019B121205006).
This paper was edited by Irena Grgić and reviewed by two anonymous referees.
Ackendorf, J. M., Ippolito, M. G., and Galloway, M. M.: pH Dependence of the Imidazole-2-carboxaldehyde Hydration Equilibrium: Implications for Atmospheric Light Absorbance, Environ. Sci. Technol. Let., 4, 551–555, https://doi.org/10.1021/acs.estlett.7b00486, 2017.
Aftab, B., Shin, H. S., and Hur, J.: Exploring the fate and oxidation behaviors of different organic constituents in landfill leachate upon Fenton oxidation processes using EEM-PARAFAC and 2D-COS-FTIR, J. Haza. Mat., 354, 33–41, https://doi.org/10.1016/j.jhazmat.2018.04.059, 2018.
Andrade-Eiroa, A., Leroy, V., and Dagaut, P.: Advances in PAHs/nitro-PAHs fractioning, Anal. Meth., 2, 2017, https://doi.org/10.1039/c0ay00484g, 2010.
Andrade-Eiroa, Á., Canle, M., and Cerdá, V.: Environmental Applications of Excitation-Emission Spectrofluorimetry: An In-Depth Review I, Appl. Spec. Rev., 48, 1–49, https://doi.org/10.1080/05704928.2012.692104, 2013.
Barsotti, F., Ghigo, G., and Vione, D.: Computational assessment of the fluorescence emission of phenol oligomers: A possible insight into the fluorescence properties of humic-like substances (HULIS), J. Photo. Photo. A., 315, 87–93, https://doi.org/10.1016/j.jphotochem.2015.09.012, 2016.
Bianco, A., Minella, M., De Laurentiis, E., Maurino, V., Minero, C., and Vione, D.: Photochemical generation of photoactive compounds with fulvic-like and humic-like fluorescence in aqueous solution, Chemosphere, 111, 529–536, https://doi.org/10.1016/j.chemosphere.2014.04.035, 2014.
Bianco, A., Passananti, M., Deguillaume, L., Mailhot, G., and Brigante, M.: Tryptophan and tryptophan-like substances in cloud water: Occurrence and photochemical fate, Atmos. Environ., 137, 53–61, https://doi.org/10.1016/j.atmosenv.2016.04.034, 2016.
Bones, D. L., Henricksen, D. K., Mang, S. A., Gonsior, M., Bateman, A. P., Nguyen, T. B., Cooper, W. J., and Nizkorodov, S. A.: Appearance of strong absorbers and fluorophores in limonene-O3 secondary organic aerosol due to NH-mediated chemical aging over long time scales, J. Geophys. Res.-Atmos., 115, D05203, https://doi.org/10.1029/2009jd012864, 2010.
Cao, T., Li, M. J., Zou, C. L., Fan, X. J., Song, J. Z., Jia, W. L., Yu, C. L., Yu, Z. Q., and Ping, P. A.: Chemical composition, optical properties, and oxidative potential of water- and methanol-soluble organic compounds emitted from the combustion of biomass materials and coal, Atmos. Chem. Phys., 21, 13187–13205, https://doi.org/10.5194/acp-21-13187-2021, 2021.
Chen, J., Gu, B. H., LeBoeuf, E. J., Pan, H. J., and Dai, S.: Spectroscopic characterization of the structural and functional properties of natural organic matter fractions, Chemosphere, 48, 59–68, https://doi.org/10.1016/s0045-6535(02)00041-3, 2002.
Chen, Q., Ikemori, F., and Mochida, M.: Light Absorption and Excitation-Emission Fluorescence of Urban Organic Aerosol Components and Their Relationship to Chemical Structure, Environ. Sci. Technol., 50, 10859–10868, https://doi.org/10.1021/acs.est.6b02541, 2016a.
Chen, Q., Miyazaki, Y., Kawamura, K., Matsumoto, K., Coburn, S., Volkamer, R., Iwamoto, Y., Kagami, S., Deng, Y., Ogawa, S., Ramasamy, S., Kato, S., Ida, A., Kajii, Y., and Mochida, M.: Characterization of Chromophoric Water-Soluble Organic Matter in Urban, Forest, and Marine Aerosols by HR-ToF-AMS Analysis and Excitation-Emission Matrix Spectroscopy, Environ. Sci. Technol., 50, 10351–10360, https://doi.org/10.1021/acs.est.6b01643, 2016b.
Chen, Q., Li, J., Hua, X., Jiang, X., Mu, Z., Wang, M., Wang, J., Shan, M., Yang, X., Fan, X., Song, J., Wang, Y., Guan, D., and Du, L.: Identification of species and sources of atmospheric chromophores by fluorescence excitation-emission matrix with parallel factor analysis, Sci. Total Environ., 718, 137322, https://doi.org/10.1016/j.scitotenv.2020.137322, 2020.
Coble, P. G.: Characterization of marine and terrestrial DOM in seawater using excitation emission matrix spectroscopy, Marin. Chem., 51, 325–346, https://doi.org/10.1016/0304-4203(95)00062-3, 1996.
Coble, P. G.: Marine optical biogeochemistry: The chemistry of ocean color, Chem. Rev., 107, 402–418, https://doi.org/10.1021/cr050350+, 2007.
De Laurentiis, E., Maurino, V., Minero, C., Vione, D., Mailhot, G., and Brigante, M.: Could triplet-sensitised transformation of phenolic compounds represent a source of fulvic-like substances in natural waters?, Chemosphere, 90, 881–884, https://doi.org/10.1016/j.chemosphere.2012.09.031, 2013.
Deng, J., Ma, H., Wang, X., Zhong, S., Zhang, Z., Zhu, J., Fan, Y., Hu, W., Wu, L., Li, X., Ren, L., Pavuluri, C. M., Pan, X., Sun, Y., Wang, Z., Kawamura, K., and Fu, P.: Measurement report: Optical properties and sources of water-soluble brown carbon in Tianjin, North China – insights from organic molecular compositions, Atmos. Chem. Phys., 22, 6449–6470, https://doi.org/10.5194/acp-22-6449-2022, 2022.
Dou, J., Lin, P., Kuang, B. Y., and Yu, J. Z.: Reactive Oxygen Species Production Mediated by Humic-like Substances in Atmospheric Aerosols: Enhancement Effects by Pyridine, Imidazole, and Their Derivatives, Environ. Sci. Technol., 49, 6457–6465, https://doi.org/10.1021/es5059378, 2015.
Fan, X., Cao, T., Yu, X., Wang, Y., Xiao, X., Li, F., Xie, Y., Ji, W., Song, J., and Peng, P.: The evolutionary behavior of chromophoric brown carbon during ozone aging of fine particles from biomass burning, Atmos. Chem. Phys., 20, 4593–4605, https://doi.org/10.5194/acp-20-4593-2020, 2020.
Frka, S., Šala, M., Brodnik, H., Štefane, B., Kroflič, A., and Grgić, I.: Seasonal variability of nitroaromatic compounds in ambient aerosols: Mass size distribution, possible sources and contribution to water-soluble brown carbon light absorption, Chemosphere, 299, 134381, https://doi.org/10.1016/j.chemosphere.2022.134381, 2022.
Fu, P., Kawamura, K., Chen, J., Qin, M., Ren, L., Sun, Y., Wang, Z., Barrie, L. A., Tachibana, E., Ding, A., and Yamashita, Y.: Fluorescent water-soluble organic aerosols in the High Arctic atmosphere, Sci. Rep., 5, 9845, https://doi.org/10.1038/srep09845, 2015.
Ge, Z., Gao, L., Ma, N., Hu, E., and Li, M.: Variation in the content and fluorescent composition of dissolved organic matter in soil water during rainfall-induced wetting and extract of dried soil, Sci. Total Environ., 791, 148296, https://doi.org/10.1016/j.scitotenv.2021.148296, 2021.
Graber, E. R., and Rudich, Y.: Atmospheric HULIS: How humic-like are they? A comprehensive and critical review, Atmos. Chem. Phys., 6, 729–753, https://doi.org/10.5194/acp-6-729-2006, 2006.
Hawkins, L. N., Lemire, A. N., Galloway, M. M., Corrigan, A. L., Turley, J. J., Espelien, B. M., and De Haan, D. O.: Maillard Chemistry in Clouds and Aqueous Aerosol As a Source of Atmospheric Humic-Like Substances, Environ. Sci. Technol., 50, 7443–7452, https://doi.org/10.1021/acs.est.6b00909, 2016.
Huang, R.-J., Yang, L., Shen, J., Yuan, W., Gong, Y., Ni, H., Duan, J., Yan, J., Huang, H., You, Q., and Li, Y. J.: Chromophoric Fingerprinting of Brown Carbon from Residential Biomass Burning, Environ. Sci. Technol. Let., 9, 102–111, https://doi.org/10.1021/acs.estlett.1c00837, 2021.
Huang, S., Luo, Y., Wang, X., Zhang, T., Lei, Y., Zeng, Y., Sun, J., Che, H., Xu, H., Cao, J., and Shen, Z.: Optical properties, chemical functional group, and oxidative activity of different polarity levels of water-soluble organic matter in PM2.5 from biomass and coal combustion in rural areas in Northwest China, Atmos. Environ., 283, 119179, https://doi.org/10.1016/j.atmosenv.2022.119179, 2022.
Jiang, H., Frie, A. L., Lavi, A., Chen, J. Y., Zhang, H., Bahreini, R., and Lin, Y.-H.: Brown Carbon Formation from Nighttime Chemistry of Unsaturated Heterocyclic Volatile Organic Compounds, Environ. Sci. Technol. Let., 6, 184–190, https://doi.org/10.1021/acs.estlett.9b00017, 2019.
Jiang, H. X., Li, J., Sun, R., Liu, G. Q., Tian, C. G., Tang, J., Cheng, Z. N., Zhu, S. Y., Zhong, G. C., Ding, X., and Zhang, G.: Determining the Sources and Transport of Brown Carbon Using Radionuclide Tracers and Modeling, J. Geophys. Res.-Atmos., 126, e2021JD034616, https://doi.org/10.1029/2021JD034616, 2021.
Jiang, H., Tang, J., Li, J., Zhao, S., Mo, Y., Tian, C., Zhang, X., Jiang, B., Liao, Y., Song, J., Chen, Y., and Zhang, G.: Molecular Signatures of Fluorescence Components in Atmospheric Organic Matters Inferred from Positive and Negative Electrospray Ionization Fourier Transform Ion Cyclotron Resonance Mass Spectrometry, Environ. Sci. Technol. Lett., 9, 913–920, https://doi.org/10.1021/acs.estlett.2c00629, 2022.
Kosyakov, D. S., Ul'yanovskii, N. V., Latkin, T. B., Pokryshkin, S. A., Berzhonskis, V. R., Polyakova, O. V., and Lebedev, A. T.: Peat burning – An important source of pyridines in the earth atmosphere, Environ. Pollut., 266, 115109, https://doi.org/10.1016/j.envpol.2020.115109, 2020.
Laskin, A., Laskin, J., and Nizkorodov, S. A.: Chemistry of atmospheric brown carbon, Chem. Rev., 115, 4335–4382, https://doi.org/10.1021/cr5006167, 2015.
Lee, H. J., Laskin, A., Laskin, J., and Nizkorodov, S. A.: Excitation-emission spectra and fluorescence quantum yields for fresh and aged biogenic secondary organic aerosols, Environ. Sci. Technol., 47, 5763–5770, https://doi.org/10.1021/es400644c, 2013.
Li, F., Tsona, N. T., Li, J., and Du, L.: Aqueous-phase oxidation of syringic acid emitted from biomass burning: Formation of light-absorbing compounds, Sci. Total Environ., 765, 144239, https://doi.org/10.1016/j.scitotenv.2020.144239, 2021.
Lin, H. and Guo, L.: Variations in Colloidal DOM Composition with Molecular Weight within Individual Water Samples as Characterized by Flow Field-Flow Fractionation and EEM-PARAFAC Analysis, Environ. Sci. Technol., 54, 1657–1667, https://doi.org/10.1021/acs.est.9b07123, 2020.
Lin, P., Aiona, P. K., Li, Y., Shiraiwa, M., Laskin, J., Nizkorodov, S. A., and Laskin, A.: Molecular Characterization of Brown Carbon in Biomass Burning Aerosol Particles, Environ. Sci. Technol., 50, 11815–11824, https://doi.org/10.1021/acs.est.6b03024, 2016.
Lin, P., Bluvshtein, N., Rudich, Y., Nizkorodov, S. A., Laskin, J., and Laskin, A.: Molecular Chemistry of Atmospheric Brown Carbon Inferred from a Nationwide Biomass Burning Event, Environ. Sci. Technol., 51, 11561–11570, https://doi.org/10.1021/acs.est.7b02276, 2017.
Liu, L., Song, C., Yan, Z., and Li, F.: Characterizing the release of different composition of dissolved organic matter in soil under acid rain leaching using three-dimensional excitation-emission matrix spectroscopy, Chemosphere, 77, 15–21, https://doi.org/10.1016/j.chemosphere.2009.06.026, 2009.
Ma, L., Li, B., Yabo, S. D., Li, Z., and Qi, H.: Fluorescence fingerprinting characteristics of water-soluble organic carbon from size-resolved particles during pollution event, Chemosphere, 307, 135748, https://doi.org/10.1016/j.chemosphere.2022.135748, 2022.
Mahamuni, G., Rutherford, J., Davis, J., Molnar, E., Posner, J. D., Seto, E., Korshin, G., and Novosselov, I.: Excitation–Emission Matrix Spectroscopy for Analysis of Chemical Composition of Combustion Generated Particulate Matter, Environ. Sci. Technol., 54, 8198–8209, https://doi.org/10.1021/acs.est.0c01110, 2020.
Matos, J. T. V., Freire, S. M. S. C., Duarte, R. M. B. O., and Duarte, A. C.: Natural organic matter in urban aerosols: Comparison between water and alkaline soluble components using excitation-emission matrix fluorescence spectroscopy and multiway data analysis, Atmos. Environ., 102, 1–10, https://doi.org/10.1016/j.atmosenv.2014.11.042, 2015.
Miyakawa, T., Kanaya, Y., Taketani, F., Tabaru, M., Sugimoto, N., Ozawa, Y., and Takegawa, N.: Ground-based measurement of fluorescent aerosol particles in Tokyo in the spring of 2013: Potential impacts of nonbiological materials on autofluorescence measurements of airborne particles, J. Geophys. Res.-Atmos., 120, 1171–1185, https://doi.org/10.1002/2014jd022189, 2015.
Murphy, K. R., Butler, K. D., Spencer, R. G. M., Stedmon, C. A., Boehme, J. R., and Aiken, G. R.: Measurement of Dissolved Organic Matter Fluorescence in Aquatic Environments: An Interlaboratory Comparison, Environ. Sci. Technol., 44, 9405–9412, https://doi.org/10.1021/es102362t, 2010.
Murphy, K. R., Stedmon, C. A., Graeber, D., and Bro, R.: Fluorescence spectroscopy and multi-way techniques. PARAFAC, Anal. Meth., 5, 6557, https://doi.org/10.1039/c3ay41160e, 2013.
Murphy, K. R., Timko, S. A., Gonsior, M., Powers, L. C., Wünsch, U. J., and Stedmon, C. A.: Photochemistry Illuminates Ubiquitous Organic Matter Fluorescence Spectra, Environ. Sci. Technol., 52, 11243–11250, https://doi.org/10.1021/acs.est.8b02648, 2018.
Pöhlker, C., Huffman, J. A., and Pöschl, U.: Autofluorescence of atmospheric bioaerosols – fluorescent biomolecules and potential interferences, Atmos. Meas. Tech., 5, 37–71, https://doi.org/10.5194/amt-5-37-2012, 2012.
Powelson, M. H., Espelien, B. M., Hawkins, L. N., Galloway, M. M., and De Haan, D. O.: Brown carbon formation by aqueous-phase carbonyl compound reactions with amines and ammonium sulfate, Environ. Sci. Technol., 48, 985–993, https://doi.org/10.1021/es4038325, 2014.
Qin, J., Zhang, L., Zhou, X., Duan, J., Mu, S., Xiao, K., Hu, J., and Tan, J.: Fluorescence fingerprinting properties for exploring water-soluble organic compounds in PM2.5 in an industrial city of northwest China, Atmos. Environ., 184, 203–211, https://doi.org/10.1016/j.atmosenv.2018.04.049, 2018.
Smith, J. D., Kinney, H., and Anastasio, C.: Phenolic carbonyls undergo rapid aqueous photodegradation to form low-volatility, light-absorbing products, Atmos. Environ., 126, 36–44, https://doi.org/10.1016/j.atmosenv.2015.11.035, 2016.
Song, J.: Data for CT, Harvard Dataverse [data set], https://doi.org/10.7910/DVN/ULCIU9, 2022.
Song, T., Wang, S., Zhang, Y., Song, J., Liu, F., Fu, P., Shiraiwa, M., Xie, Z., Yue, D., Zhong, L., Zheng, J., and Lai, S.: Proteins and Amino Acids in Fine Particulate Matter in Rural Guangzhou, Southern China: Seasonal Cycles, Sources, and Atmospheric Processes, Environ. Sci. Technol., 51, 6773–6781, https://doi.org/10.1021/acs.est.7b00987, 2017.
Tang, J., Li, J., Su, T., Han, Y., Mo, Y., Jiang, H., Cui, M., Jiang, B., Chen, Y., Tang, J., Song, J., Peng, P. A., and Zhang, G.: Molecular compositions and optical properties of dissolved brown carbon in biomass burning, coal combustion, and vehicle emission aerosols illuminated by excitation–emission matrix spectroscopy and Fourier transform ion cyclotron resonance mass spectrometry analysis, Atmos. Chem. Phys., 20, 2513–2532, https://doi.org/10.5194/acp-20-2513-2020, 2020a.
Tang, S., Li, F., Tsona, N. T., Lu, C., Wang, X., and Du, L.: Aqueous-Phase Photooxidation of Vanillic Acid: A Potential Source of Humic-Like Substances (HULIS), ACS Earth Space Chem., 4, 862–872, https://doi.org/10.1021/acsearthspacechem.0c00070, 2020b.
Tang, J., Wang, J., Zhong, G., Jiang, H., Mo, Y., Zhang, B., Geng, X., Chen, Y., Tang, J., Tian, C., Bualert, S., Li, J., and Zhang, G.: Measurement report: Long-emission-wavelength chromophores dominate the light absorption of brown carbon in aerosols over Bangkok: impact from biomass burning, Atmos. Chem. Phys., 21, 11337–11352, https://doi.org/10.5194/acp-21-11337-2021, 2021.
Vasilatou, V., Diapouli, E., Abatzoglou, D., Bakeas, E. B., Scoullos, M., and Eleftheriadis, K.: Characterization of PM2.5 chemical composition at the Demokritos suburban station, in Athens Greece. The influence of Saharan dust, Environ. Sci. Pollut. Res., 24, 11836–11846, https://doi.org/10.1007/s11356-017-8684-3, 2017.
Vidović, K., Kroflič, A., Jovanovič, P., Šala, M., and Grgić, I.: Electrochemistry as a Tool for Studies of Complex Reaction Mechanisms: The Case of the Atmospheric Aqueous-Phase Aging of Catechols, Environ. Sci. Technol., 53, 11195–11203, https://doi.org/10.1021/acs.est.9b02456, 2019.
Vidović, K., Kroflič, A., Šala, M., and Grgić, I.: Aqueous-Phase Brown Carbon Formation from Aromatic Precursors under Sunlight Conditions, Atmosphere, 11, 131, https://doi.org/10.3390/atmos11020131, 2020.
Vione, D., Albinet, A., Barsotti, F., Mekic, M., Jiang, B., Minero, C., Brigante, M., and Gligorovski, S.: Formation of substances with humic-like fluorescence properties, upon photoinduced oligomerization of typical phenolic compounds emitted by biomass burning, Atmos. Environ., 206, 197–207, https://doi.org/10.1016/j.atmosenv.2019.03.005, 2019.
Wünsch, U. J., Bro, R., Stedmon, C. A., Wenig, P., and Murphy, K. R.: Emerging patterns in the global distribution of dissolved organic matter fluorescence, Anal. Meth., 11, 888–893, https://doi.org/10.1039/c8ay02422g, 2019.
Wang, H., Zhang, L., Huo, T., Wang, B., Yang, F., Chen, Y., Tian, M., Qiao, B., and Peng, C.: Application of parallel factor analysis model to decompose excitation-emission matrix fluorescence spectra for characterizing sources of water-soluble brown carbon in PM2.5, Atmos. Environ., 223, 117192, https://doi.org/10.1016/j.atmosenv.2019.117192, 2020.
Wozniak, A. S., Bauer, J. E., and Dickhut, R. M.: Characteristics of water-soluble organic carbon associated with aerosol particles in the eastern United States, Atmos. Environ., 46, 181–188, https://doi.org/10.1016/j.atmosenv.2011.10.001, 2012.
Wu, G., Ram, K., Fu, P., Wang, W., Zhang, Y., Liu, X., Stone, E. A., Pradhan, B. B., Dangol, P. M., Panday, A. K., Wan, X., Bai, Z., Kang, S., Zhang, Q., and Cong, Z.: Water-Soluble Brown Carbon in Atmospheric Aerosols from Godavari (Nepal), a Regional Representative of South Asia, Environ. Sci. Technol., 53, 3471–3479, https://doi.org/10.1021/acs.est.9b00596, 2019.
Wu, G., Fu, P., Ram, K., Song, J., Chen, Q., Kawamura, K., Wan, X., Kang, S., Wang, X., Laskin, A., and Cong, Z.: Fluorescence characteristics of water-soluble organic carbon in atmospheric aerosol, Environ. Pollut., 268, 115906, https://doi.org/10.1016/j.envpol.2020.115906, 2020.
Wu, L., Luo, X.-S., Li, H., Cang, L., Yang, J., Yang, J., Zhao, Z., and Tang, M.: Seasonal Levels, Sources, and Health Risks of Heavy Metals in Atmospheric PM2.5 from Four Functional Areas of Nanjing City, Eastern China, Atmosphere, 10, 419, https://doi.org/10.3390/atmos10070419, 2019.
Yan, G. and Kim, G.: Speciation and Sources of Brown Carbon in Precipitation at Seoul, Korea: Insights from Excitation-Emission Matrix Spectroscopy and Carbon Isotopic Analysis, Environ. Sci. Technol., 51, 11580–11587, https://doi.org/10.1021/acs.est.7b02892, 2017.
Yang, Y., Qin, Y., Qin, J., Zhou, X., Xv, P., Tan, J., and Xiao, K.: Facile Differentiation of Four Sources of Water-Soluble Organic Carbon in Atmospheric Particulates Using Multiple Fluorescence Spectral Fingerprints, Environ. Sci. Technol. Let., 9, 359–365, https://doi.org/10.1021/acs.estlett.2c00128, 2022.
Yu, L., Smith, J., Laskin, A., Anastasio, C., Laskin, J., and Zhang, Q.: Chemical characterization of SOA formed from aqueous-phase reactions of phenols with the triplet excited state of carbonyl and hydroxyl radical, Atmos. Chem. Phys., 14, 13801–13816, https://doi.org/10.5194/acp-14-13801-2014, 2014.
Yu, L., Smith, J., Laskin, A., George, K. M., Anastasio, C., Laskin, J., Dillner, A. M., and Zhang, Q.: Molecular transformations of phenolic SOA during photochemical aging in the aqueous phase: competition among oligomerization, functionalization, and fragmentation, Atmos. Chem. Phys., 16, 4511–4527, https://doi.org/10.5194/acp-16-4511-2016, 2016.
Zhang, T., Shen, Z., Huang, S., Lei, Y., Zeng, Y., Sun, J., Zhang, Q., Ho, S. S. H., Xu, H., and Cao, J.: Optical properties, molecular characterizations, and oxidative potentials of different polarity levels of water-soluble organic matters in winter PM2.5 in six China's megacities, Sci. Total Environ., 853, 158600, https://doi.org/10.1016/j.scitotenv.2022.158600, 2022a.
Zhang, T., Huang, S., Wang, D., Sun, J., Zhang, Q., Xu, H., Hang Ho, S. S., Cao, J., and Shen, Z.: Seasonal and diurnal variation of PM2.5 HULIS over Xi'an in Northwest China: Optical properties, chemical functional group, and relationship with reactive oxygen species (ROS), Atmos. Environ., 268, 118782, https://doi.org/10.1016/j.atmosenv.2021.118782, 2022b.
Zhang, X. L., Lin, Y. H., Surratt, J. D., and Weber, R. J.: Sources, Composition and Absorption Angstrom Exponent of Light-absorbing Organic Components in Aerosol Extracts from the Los Angeles Basin, Environ. Sci. Technol., 47, 3685–3693, https://doi.org/10.1021/es305047b, 2013.
Zhang, Y. L., Gao, G., Shi, K., Niu, C., Zhou, Y. Q., Qin, B. Q., and Liu, X. H.: Absorption and fluorescence characteristics of rainwater CDOM and contribution to Lake Taihu, China, Atmos. Environ., 98, 483–491, https://doi.org/10.1016/j.atmosenv.2014.09.038, 2014.
Zhao, W. Y., Fu, P. Q., Yue, S. Y., Li, L. J., Xie, Q. R., Zhu, C., Wei, L. F., Ren, H., Li, P., Li, W. J., Sun, Y. L., Wang, Z. F., Kawamura, K., and Chen, J. M.: Excitation-emission matrix fluorescence, molecular characterization and compound-specific stable carbon isotopic composition of dissolved organic matter in cloud water over Mt. Tai, Atmos. Environ., 213, 608–619, https://doi.org/10.1016/j.atmosenv.2019.06.034, 2019.
Zhou, Y., Yao, X., Zhang, Y., Shi, K., Zhang, Y., Jeppesen, E., Gao, G., Zhu, G., and Qin, B.: Potential rainfall-intensity and pH-driven shifts in the apparent fluorescent composition of dissolved organic matter in rainwater, Environ. Pollut., 224, 638–648, https://doi.org/10.1016/j.envpol.2017.02.048, 2017.