the Creative Commons Attribution 4.0 License.
the Creative Commons Attribution 4.0 License.
 | 16 Feb 2023
Upper-tropospheric slightly ice-subsaturated regions: frequency of occurrence and statistical evidence for the appearance of contrail cirrus
Christoph Mahnke
Susanne Rohs
Ulrich Bundke
Nicole Spelten
Georgios Dekoutsidis
Silke Groß
Christiane Voigt
Ulrich Schumann
Andreas Petzold
Microphysical, optical, and environmental properties of contrail cirrus and natural cirrus were investigated by applying a new, statistically based contrail–cirrus separation method to 14.7 h of cirrus cloud measurements (sampling frequency 1 Hz, max. ∼ 290 m s−1, total length of sampled in-cloud space ∼ 15 000 km) during the airborne campaign ML-CIRRUS in central Europe and the northeast Atlantic flight corridor in spring 2014. We find that pure contrail cirrus appears frequently at the aircraft cruising altitude (CA) range with ambient pressure varying from 200 to 245 hPa. It exhibits a higher median ice particle number concentration (Nice), a smaller median mass mean radius (Rice), and lower median ice water content (IWC) (median: Nice=0.045 cm−3, Rice=16.6 µm, IWC = 3.5 ppmv), and it is optically thinner (median extinction coefficient Ext = ∼ 0.056 km−1) than the cirrus mixture of contrail cirrus, natural in situ-origin and liquid-origin cirrus found around the CA range (median: Nice=0.038 cm−3, Rice=24.1 µm, IWC = 8.3 ppmv, Ext = ∼ 0.096 km−1). The lowest and thickest cirrus, consisting of a few large ice particles, are identified as pure natural liquid-origin cirrus (median: Nice=0.018 cm−3, Rice=42.4 µm, IWC = 21.7 ppmv, Ext = ∼ 0.137 km−1). Furthermore, we observe that, in particular, contrail cirrus occurs more often in slightly ice-subsaturated instead of merely ice-saturated to supersaturated air as often assumed, thus indicating the possibility of enlarged contrail cirrus existence regions. The enlargement is estimated, based on IAGOS long-term observations of relative humidity with respect to ice (RHice) aboard passenger aircraft, to be approximately 10 % for Europe and the North Atlantic region, with the RHice threshold for contrail cirrus existence decreased from 100 % to 90 % RHice and a 4 h lifetime of contrail cirrus in slight ice subsaturation assumed. This increase may not only lead to a non-negligible change in contrail cirrus coverage and radiative forcing, but also affect the mitigation strategies of reducing contrails by rerouting flights.
Please read the corrigendum first before continuing.
-
Notice on corrigendum
The requested paper has a corresponding corrigendum published. Please read the corrigendum first before downloading the article.
-
Article
(2621 KB)
- Corrigendum
-
Supplement
(1591 KB)
-
The requested paper has a corresponding corrigendum published. Please read the corrigendum first before downloading the article.
- Article
(2621 KB) - Full-text XML
- Corrigendum
-
Supplement
(1591 KB) - BibTeX
- EndNote


The global aviation sector makes up approximately 5 % of anthropogenic global warming (Grewe et al., 2021; Klöwer et al., 2021). Contrail cirrus is one of the largest radiative forcing components of aviation (Lee et al., 2009; 2021) with uncertainties arising from many sources, including limited knowledge of cirrus cloud properties, spatial coverage, and life cycle (Schumann and Heymsfield, 2017; Kärcher, 2018; Burkhardt et al., 2018). Contrail cirrus comprises line-shaped contrails in the wake of high-flying aircraft and thin cirrus patches resulting from the dispersion of long-living contrails. Only a few models account for the water emitted from the aircraft causing contrails in slightly subsaturated air and for the ice water content in contrails during their life cycle extending their persistence (Schumann, 2012). Instead, models often estimate contrail cirrus coverage based on simplified contrail ageing and spreading mechanisms in ice-supersaturated regions (ISSRs) (Burkhardt et al., 2010; Burkhardt and Kärcher, 2011).
Contrails form when hot and humid aircraft exhaust mixes rapidly with cold and humid ambient air so that the humidity in the exhaust gases exceeds liquid water saturation (Appleman, 1953; Schmidt, 1941; Schumann, 1996). In such air supersaturated with respect to liquid water (RHw>100 %), aerosol particles emitted from the aircraft (combustion soot and sulfuric acid–water droplets) or pre-existing in the in-mixed ambient air become activated to form water droplets that freeze subsequently to contrail ice particles. According to the purely thermodynamic Schmidt–Appleman criterion (SAC), the threshold temperature for contrail formation depends on ambient air pressure and humidity, on the amount of water and heat emitted by the aircraft per fuel mass, and on the aircraft engine's overall propulsion efficiency (Schumann, 1996; Jensen et al., 1998). After reaching the ambient temperature by mixing with the surrounding air, the contrails grow or shrink in size depending on ambient humidity. If the ambient relative humidity remains supersaturated with respect to ice (RHice>100 %), contrails grow in ice water content and can persist for up to 5 h or even longer (Gierens and Vázquez-Navarro, 2018; Schumann and Heymsfield, 2017) and may spread and evolve into thin cirrus layers. Otherwise, contrail ice particles sublimate and dissipate on a timescale dependent on their sizes and the ambient air RHice (Schumann, 2012).
A robust estimation of contrail cirrus' radiative effect depends largely on their optical properties (related to their microphysical properties and age) and geographical appearance. Young contrails can exert an instantaneous radiative forcing to warm and cool the atmosphere that is 3 orders of magnitude larger than their net warming effect (Gierens et al., 2020). The microphysical features of contrail cirrus at different plume ages observed from various airborne campaigns were compiled and described in Schröder et al. (2000), Schumann et al. (2017) and Chauvigné et al. (2018). Fresh contrails are characterized by an ice crystal number concentration (Nice) of thousands of ice crystals per cubic centimetre in size up to a few micrometres in diameter, as observed in a plume approximately 2 min old (Petzold et al., 1997). Contrails 2–5 min old were frequently measured (e.g. Voigt et al., 2011; Gayet et al., 2012). Here, contrail ice crystal number concentrations were diluted to 100 to 400 cm−3 and ice crystal diameters increased to 4 to 10 µm due to condensational growth (Jeßberger et al., 2013; Bräuer et al., 2021). Slightly older contrails at a maximum plume age of 30 min are diluted further by the inmixing of ambient air down to less than hundreds of ice crystals that have grown to tens of micrometres (Schröder et al., 2000). The peculiar high Nice of small ice particles makes young contrails easy to be distinguished from natural cirrus. At an even later stage, Nice of contrail cirrus further decreases significantly to a few ice particles per cubic centimetre or less, with particle sizes being 2–3 orders of magnitude larger, becoming similar to natural cirrus and making the discrimination between contrail and natural cirrus difficult. Contrail cirrus is generally characterized by low ice water content (IWC) ranging from 0.1 to about 10 mg m−3 (Schumann et al., 2017), like natural cirrus of in situ-origin whose ice crystals have formed and grown in an ice-cloud-only environment (Luebke et al., 2016; Krämer et al., 2020). Different from contrail cirrus and in situ-origin cirrus, liquid-origin cirrus clouds often yield higher IWC (Krämer et al., 2016, 2020) because their ice crystals originally form as liquid drops in a warmer atmosphere (ambient temperature Tamb>235 K), which subsequently freeze while being lifted into the cirrus temperature region of the atmosphere.
The fact that contrails often coexist with natural cirrus and become embedded within thin or subvisible cirrus (Kübbeler et al., 2011; Gierens, 2012; Unterstrasser et al., 2017) makes it challenging to discriminate between aged contrails and natural cirrus, thus impeding clarification of contrail cirrus' contribution to the radiative balance. Chauvigné et al. (2018) employed a principal component analysis method to distinguish between contrail cirrus particles at different ages and natural cirrus measured during the CONCERT 2008 campaign (Voigt et al., 2010), which was successful because contrails sampled during the CONCERT campaign were rather young and more recognizable compared to natural cirrus. However, not all required optical and microphysical parameters can be obtained from single aircraft campaigns to apply this method widely, and the CONCERT dataset is small, around 4.0 h of contrail and natural cirrus sampling time in total (Kübbeler et al., 2011).
A common assumption on the conditions for contrail cirrus formation and evolution is that contrail cirrus occurs and persists merely in ISSRs (Kärcher, 2018). In fact, contrails and contrail cirrus were also observed in ice-subsaturated air, not only during contrail-dedicated research flights (Kübbeler et al., 2011; Voigt et al., 2011; Gayet et al., 2012; Schumann et al., 2017; Chauvigné et al., 2018) but also from IAGOS commercial aircraft observations in the North Atlantic region (Petzold et al., 2017). Apart from a high number of small contrail ice particles, large particles (ice particle diameter Dp>100 µm) were also detected but at relatively low concentrations (Voigt et al., 2010; Kübbeler et al., 2011; Chauvigné et al., 2018). Such large ice crystals were also observed in contrail cirrus during the ML-CIRRUS campaign (Voigt et al., 2017). However, attention to contrail cirrus in ice-subsaturated environments and the role that large ice particles play in contrail cirrus was raised only by Kübbeler et al. (2011) and Schumann (2012). Kübbeler et al. (2011) discussed that the subsaturation feature observed in contrail cirrus during the CONCERT campaign is accompanied by the sublimation of those large ice particles, which might be sedimented from higher levels after being formed under ISSRs. As the contrail cirrus dataset is limited to only a few segments of several flights, it could not be corroborated that the existence of contrail cirrus in ice-subsaturated environments is a common feature. But Schumann and Graf (2013) found it necessary to reduce the critical humidity above which contrails form to a value below ice saturation to model contrail occurrence and their longwave radiative forcing in agreement with multi-year satellite observations over the North and South Atlantic.
Currently, the prevalent strategy for contrail avoidance is to reroute the aircraft around ice-supersaturated regions by flying at slightly higher or lower altitudes to avoid contrail formation or minimize contrail radiative forcing (Teoh et al., 2020a; Niklaß et al., 2021). Teoh et al. (2020a) showed that focusing on the avoidance of strong contrails, the so-called big hits, reduces the radiative forcing effect because only for these cases does the “saved” radiative forcing overrule the additional CO2 emitted during the rerouting of the aircraft. Gierens et al. (2020) showed that the formation of contrails can be predicted with some success, but there are problems in predicting contrail persistence due to limited knowledge about the occurrence of air masses around ice saturation. Particularly from this study, it becomes evident that further knowledge of the distribution of air masses around ice saturation and the resulting properties of aircraft-induced cirrus and natural cirrus is required (Teoh et al., 2022).
In this study, we investigate a larger dataset of 14.7 h cirrus cloud sampling (frequency 1 Hz, max. ∼ 290 m s−1) obtained during the ML-CIRRUS 2014 campaign (Sect. 2.1) than the 4 h CONCERT dataset. With commonly available parameters describing the microphysical properties of cirrus, such as Nice, ice crystal sizes, and IWC, we adopt a simpler statistical approach to separate aviation-induced cirrus from natural cirrus compared with Chauvigné et al. (2018). It consists of the SAC, the most frequent aircraft cruising altitude range and a newly developed aircraft exhaust plume detection algorithm (Mahnke et al., 2022) to differentiate aged contrail cirrus (>0.5 h lifetime, Schumann et al., 2017; Voigt et al., 2017) and natural cirrus (Sect. 2.3). Step by step, we show the sharpened differentiation of contrail cirrus from natural cirrus and report on their microphysical properties and occurrence conditions (Sect. 3.1–3.2). In addition, we analyse the humidity of the environments of contrail and natural cirrus (Sect. 3.3). Based on these observations, we simulate the lifetime of ice particles that have similar microphysical properties to the contrail cirrus sampled during ML-CIRRUS in slightly ice-subsaturated environments. Furthermore, we inspect 15 years of RHice measurements aboard passenger aircraft in the IAGOS global monitoring framework to shed light on how the existence of contrail cirrus in environments with RHice≥90 % might influence contrail mitigation (Sect. 4).
2.1 ML-CIRRUS dataset
The Mid-Latitude CIRRUS (ML-CIRRUS) campaign was conducted from Oberpfaffenhofen, Germany, to probe cirrus clouds over central Europe and the northeast Atlantic region in March and April 2014 (Voigt et al., 2017). The High Altitude and Long-Range Research Aircraft (HALO; Krautstrunk and Giez, 2012) was deployed to investigate the formation mechanism, life cycle and climate impact of natural cirrus and aircraft-induced cloudiness. Excluding test flights and the ones with strong instrumental issues, 12 of 17 research flights with the focus on natural and contrail cirrus, as listed in Table S1, are considered here for studying the microphysical properties of contrail cirrus and mid-latitude natural cirrus, which serve as the basis to distinguish contrail cirrus from natural cirrus.
The ML-CIRRUS dataset (Voigt et al., 2017) includes the parameters important for cloud characterization – in situ relative humidity with respect to ice RHice, ice water content IWC, ice particle number concentration Nice, and mass mean radius Rice.
The in situ RHice was calculated using water vapour mixing ratios measured by the tuneable diode laser hygrometer SHARC (Meyer et al., 2015), ambient temperature Tamb and pressure measurements provided by the Basis Halo Measurement and Sensor System (BAHAMAS) (Mallaun et al., 2015; Giez et al., 2017). The overall uncertainty of SHARC H2O measurement is 5 % relative and ±1 ppm absolute offset uncertainty (Kaufmann et al., 2018). The nominal accuracies of the BAHAMAS pressure and Tamb measurement are 0.3 hPa and 0.5 K (Mallaun et al., 2015; Giez et al., 2017; Kaufmann et al., 2018). The overall accuracy of the in situ RHice measurements here is between 10 %–20 %, with the respective uncertainties of the temperature, pressure, and water vapour measurements considered (Krämer et al., 2016). The in situ RHice, water vapour, and temperature measurements were compared with other instruments on board and model data from the European Centre of Medium-range Weather Forecasting (ECMWF) by Kaufmann et al. (2018). No systematic instrument bias in either water vapour or temperature was identified in the upper troposphere. A further discussion on the reliability of the RHice measurements can be found in the Supplement (Sect. S3).
Cloud measurements were performed using the cloud spectrometer NIXE-CAPS (New Ice eXpEriment: Cloud and Aerosol Particle Spectrometer; later referred to as NIXE) at a time resolution of 1 Hz (max. ∼ 290 m s−1) with the instrument mounted under the aircraft wing (Krämer et al., 2016; Luebke et al., 2016). As a combination of the two instruments CAS-DPOL (Cloud and Aerosol Spectrometer with Detection of POLarization) and CIPg (Cloud Imaging Probe grayscale), NIXE measures Nice in the particle diameter (Dp) range of 0.61–937 µm, with Dp meaning optical-equivalent diameter for CAS-DPOL and area-equivalent diameter for CIPg, respectively. Only particles of Dp>3 µm are considered for cloud measurements, while smaller particles are classified as aerosols. In fresh contrails, particle sizes can be smaller than 3 µm, but for consistency and comparability, the lower threshold Dp=3 µm is maintained in the analysis of contrails and contrail cirrus. NIXE gives a total uncertainty of ±20 % (Meyer, 2012) in particle number concentration measurement. IWC is derived from the ice particle size distribution (PSDice) in the Dp range of 3–930 µm. How the IWC is determined from a mass–dimension relation and the robustness of the IWC have been stated in Krämer et al. (2016), Luebke et al. (2016), and Afchine et al. (2018). The lower IWC detection limit of NIXE is 0.15 ppmv (parts per million by volume). The ice crystal mass mean radius Rice in micrometres (µm) is calculated with , where IWC is in milligrams per cubic metre (mg m−3; converted from IWC in ppmv), ρ is 0.92 g cm−3, and Nice is the total number of ice crystals (Dp>3 µm) per cubic centimetre (cm−3).
Additional parameters for discriminating contrail and natural cirrus are total aerosol particle number concentration, total reactive nitrogen NOy mixing ratio, and airborne lidar RHice. Here, the measurements are summarized below (see Voigt et al., 2017, for details).
The total aerosol particle number concentration was measured by the instrument AMETYST (Voigt et al., 2017), which is a combination of four condensation particle counters (CPCs) measuring total and non-volatile aerosols in the size range of 4 nm–2 µm. The uncertainty of the CPCs of AMETYST is in the typical CPC uncertainty range, which is estimated to be of the order of 10 % (Petzold et al., 2011, 2013). NOy was measured by the instrument AENEAS (Ziereis et al., 2000) by catalytically converting NOy to nitrogen monoxide NO on a gold surface heated to 300 ∘C. The converted NO will then be directly detected with chemiluminescence technique. AENEAS has an NOy detection range of 5 pptv (parts per trillion by volume) to 60 ppbv (parts per billion by volume) (Voigt et al., 2017), with an overall uncertainty of 30 % or 40 pptv.
The airborne lidar RHice is derived from water vapour measurement in the 935 nm absorption band of H2O by the lidar WALES and ambient temperature from ECMWF (Wirth et al., 2009; Groß et al., 2014). For retrieving cirrus clouds from the remote-sensing technique, only the particles producing a back-scattering ratio (BSR) greater than 3 and having a depolarization ratio greater than 20 % at Tamb<235 K are interpreted as cirrus cloud particles (Urbanek et al., 2018). Note that SHARC measures water vapour concentrations at aircraft positions, while WALES obtains atmospheric cloud columns with its laser penetrating through clouds from the cloud top or bottom. The two instruments do not measure water vapour in parallel. Therefore, the in situ RHice and lidar RHice are not from the same clouds. However, the intercomparison of in situ and lidar RHice measurements inside cirrus clouds promotes the evaluation of the robustness of the in situ RHice dataset and uncertainties related to the quality of the Tamb dataset.
2.2 RHice dataset from IAGOS passenger aircraft
The RHice dataset spanning from 1995 to 2010, based on the Measurement of Ozone and Water Vapour on Airbus In-service Aircraft (MOZAIC) programme, is used for the analysis of the RHice distribution in air masses in the northern mid-latitudes. The MOZAIC programme (Marenco et al., 1998) was initiated in August 1994 and was carried on within the new European Research Infrastructure IAGOS (In-service Aircraft for a Global Observing System; https://www.iagos.org/, last access: 6 December 2022) in 2011 (Petzold et al., 2015). The measurement of atmospheric trace gases and aerosol particles is conducted by autonomous instruments installed on commercial passenger aircraft. Up to now, over 63 000 flights have contributed to a global-scale dataset of water vapour and RHice in the upper troposphere and lower stratosphere (Petzold et al., 2017, 2020; Reutter et al., 2020).
The dataset used for this study has aerial boundaries of 40–60∘ N covering the North Atlantic (65–5∘ W) and Europe (5∘ W–30∘ E). It contains temperature, pressure, and RHice measurements. RHice is directly measured by the IAGOS Capacitive Hygrometer (ICH). The details regarding the principles of the ICH sensor and sensor calibration as well as the procedures to determine the ambient air temperature from the sensor temperature can be found elsewhere (Neis et al., 2015; Smit et al., 2014). The ICH sensors are usually calibrated before being deployed in the aeroplane and after deployment. During the deployment period (3–6 months), the sensor output signal in voltage may drift. Therefore, an in-flight calibration method is applied to the reanalysis data to overcome the drifts of sensor signals and, thus, to correct erroneous RHice values (Smit et al., 2008). The overall uncertainty of IAGOS RHice is about 5 % (2 %–8 %) at 10–12 km at cruising altitudes with a detection limitation of ∼ 10 % RHice (Petzold et al., 2020; Smit et al., 2014). The MOZAIC RHice dataset has been quality-checked, successfully validated against RHice observations by high-precision instruments aboard research aircraft, and also compared to ERA-Interim reanalysis data (Dee et al., 2011) to be reliable for scientific studies (Neis et al., 2015; Petzold et al., 2020; Reutter et al., 2020). The same dataset was described in detail in the study of ice-supersaturated air masses in the northern mid-latitudes (Petzold et al., 2020). Here, the occurrence fractions of air masses at different RHice thresholds are determined for the North Atlantic region and Europe from this dataset and utilized for the discussion about the potential influence on contrail avoidance (Sect. 3.5).
2.3 Contrails and contrail cirrus detection
Data suitable for statistically analysing the microphysical properties of cirrus induced by aircraft emissions or by atmospheric dynamic systems should meet the following criteria:
-
ambient pressure p<350 hPa, which constrains the pressure altitude to be higher than ∼ 8.1 km under standard atmospheric conditions, also the common cruising altitude of commercial aeroplanes;
-
ambient temperature Tamb<235 K, which is the cirrus formation temperature region.
2.3.1 The Schmidt–Appleman criterion (SAC)
To determine the potential for contrail formation in the air masses meeting the above thresholds, air mass thermodynamic properties are analysed by applying the Schmidt–Appleman criterion (SAC). The SAC at aircraft pressure level p depends on the gradient G of the mixing line (see Fig. 1) (Schumann, 1996):
where p is the ambient air pressure, cp is the isobaric heat capacity of air (1004 J kg−1 K−1), and ε is the ratio of molar masses of water and dry air (0.622). For the calculation of G, the emission index of water vapour and fuel heat capacity Q from burning conventional jet fuel (kerosene) are considered: kg (kg fuel)−1 and Q=43.2 MJ (kg fuel)−1, assuming an overall propulsion efficiency η=0.31. G (unit: Pa K−1) represents the gradient of the trajectory of aircraft exhaust air isobaric mixing with the surrounding ambient air – the blue line in Fig. 1, where the dependence of the water vapour partial pressure on temperature in the isobaric mixture of an aircraft plume and ambient air is illustrated (adapted from Fig. 3 in Schumann, 1996). The sampled air masses are assumed to be released from aircraft engines and have undergone the isobaric mixing process while detraining into ambient air. Tamb and RHice at an assumed measuring position (the red dot in Fig. 1), therefore, mark the ending point of an individual air parcel's mixing line. If the mixing line touched or crossed the ice–liquid saturation curve, for example, the blue, dashed black, or cyan lines in Fig. 1, the measured cloud particle could have been very probably involved in the formation of contrails during its evolution. Cirrus cloud particles sampled at thermodynamic positions not fulfilling SAC are considered irrelevant to contrail formation and are treated as natural cirrus.
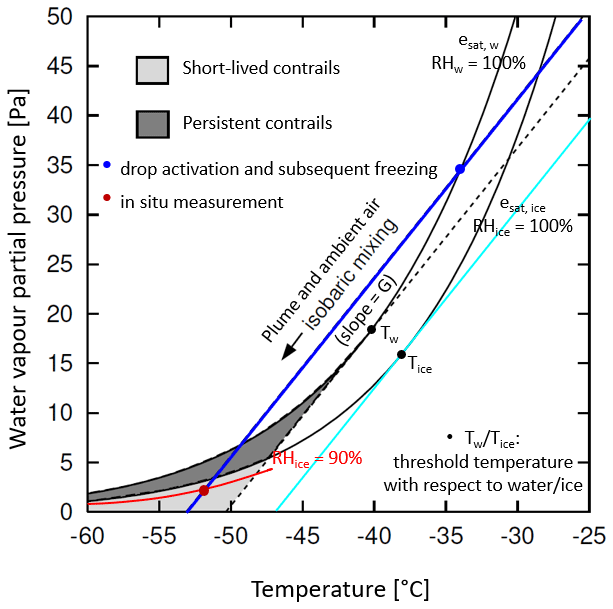
Figure 1Water vapour saturation partial pressure with respect to liquid water (esat, w) and ice (esat, ice) as a function of temperature. The blue line represents the isobaric mixing of the aircraft exhaust plume with the surrounding ambient air at a gradient of G along the black arrow. During the isobaric mixing, liquid drops form when surpassing water saturation; the drops freeze subsequently at ∼ 235 K. The red dot represents an in situ-measured cloud sample that marks the ending point of the cloud sample's mixing. Tw is the threshold temperature for contrails to form. This occurs when the isobaric mixing line (the dashed line) just touches the water saturation curve. In this case, contrails persist in ice-supersaturated environments and live only shortly in ice subsaturation, as indicated by the dark- and light-grey areas, respectively. The cyan line shows a situation where the aircraft exhaust air parcel just reaches ice saturation so that contrail ice particles might form directly from the gas phase heterogeneously or homogeneously at the corresponding ice supersaturation. The red curve at RHice=90 % represents the proposed lower RHice threshold of persistent contrails in this work (Sect. 3.3).
2.3.2 The most frequent aircraft cruising altitude (CA) range
To better discriminate between contrail and natural cirrus, we define another criterion by dividing the altitude range of the dataset fulfilling SAC into the most frequent aircraft cruising altitude (CA) range and the altitudes beyond. To determine the CA pressure range, we surveyed the 15 years of IAGOS-MOZAIC pressure measurements over the North Atlantic and Europe regions aboard passenger aircraft. The occurrence probabilities of flight levels per 10 hPa bin are shown in Fig. 2. The most frequently visited atmospheric pressure levels are from 200 to 270 K. However, ice cloud properties at lower altitudes with pressure greater than 245 hPa show distinct behaviour from those at higher altitudes below 245 hPa and seem closer to those observed at positions not fulfilling SAC, implying that they could be natural cirrus or extensively aged contrail cirrus. Hence, the pressure altitude range of 200–245 hPa is adopted as the CA range for further analysis.

Figure 2Occurrence fractions of passenger aircraft flight levels in pressure (unit: hPa) measured during the IAGOS-MOZAIC period (1996–2010) over the North Atlantic and Europe. The pressure range 200–245 hPa between the dashed lines is adopted as the most frequent aircraft cruising altitude (CA) range (see text for the determination of the boundary pressure thresholds).
2.3.3 Aircraft plume detection
The principle of the aircraft exhaust plume detection assumes that a simultaneous enhancement of multiple products emitted from aviation fuel combustion, here total aerosol particles and reactive nitrogen NOy measured by the instruments AMETYST and AENEAS (Sect. 2.1), serves as a clear marker for air masses influenced by aircraft exhaust (Schumann et al., 2002). In this work, the total aerosol particle number concentration and the mixing ratio of NOy, which can be considered a passive tracer in aircraft plumes up to a plume age of 18 h, are used to detect aircraft exhaust plumes along the flights from the concurrent increased particle number concentrations and NOy mixing ratios in comparison to atmospheric background values (Mahnke et al., 2022). The plume detection algorithm is restricted to a minimum NOy excess of around 0.1 ppbv above the atmospheric background, which corresponds to a maximum plume age of approximately 2–5 h, depending on the diffusion speed of aircraft exhaust and NOy emission index according to aircraft type.
The plume detection algorithm is applied to 10 ML-CIRRUS flights, for which both NOy and aerosol measurements are available. Only the air masses containing ice particles detected at Tamb<235 K are considered as contrail cirrus. Different from the passive tracer NOy, cirrus particles are subjected to gravity waves and turbulence. As a result, at some point the contrail ice particles may become spatially separated from the plume, and/or the plume may become spatially associated with particles formed in natural cirrus clouds. Therefore, the plume detection algorithm may miss contrail cirrus particles. The contrails that can be found with the help of the plume detection algorithm can be viewed as a subset of the contrails because as long as the plume is detected and contains cirrus ice particles, these ice crystals are highly likely to stem from contrails. The final in-cloud sampling time with aircraft exhaust plume encounter, as identified by the plume detection algorithm, is approximately 0.99 h, around 3200 cloud samples (max. ∼ 1 km length of sampled in-cloud space) at 1 Hz sampling frequency. The sizes in flight hours of each sub-datasets after applying the SAC, CA, and plume detection criteria are listed in Table S2. We use the plume subset to show that the microphysical properties of these contrails are comparable to those from the larger dataset (determined with SAC + CA) that also includes contrail ice particles spatially separated from the plume. This comparison increases our confidence in the method to identify contrails via the SAC and CA criteria.
3.1 Cirrus cloud observations
The full ensemble of cirrus cloud properties (Nice and Rice) observed during ML-CIRRUS as a function of ambient temperature is shown in Fig. 3 together with in situ RHice. The number of flight hours spent in cirrus clouds is 14.7 h, approximately 15 000 km of the sampled in-cloud space in total. Figure 3a and b show the temperature dependence of Nice (Dp>3 µm) and Rice, respectively, binned in 1 K intervals and colour-coded by the occurrence frequency that is normalized to the total counts in each temperature interval. One pronounced signature of contrail cirrus is the high Nice>0.1 or even >1 cm−3 between 208–220 K, which could be linked to aviation-induced cirrus (Petzold et al., 2017; Schumann et al., 2017; Krämer et al., 2020) as the median Nice of the large climatology of cirrus shown by Krämer et al. (2020) is 0.03 cm−3. In the same temperature range, Rice exhibits the highest occurrence frequency at a small mass mean radius around 20 µm or even lower. The occurrence frequency of Nice in relation to Rice is displayed in Fig. 3c for the whole cirrus dataset with the isolines representing IWC (in ppmv), which means that the same IWC could arise from many small ice particles (the upper-left segment of the IWC isolines) or a few large ice crystals (the lower-right segment).
Contrail cirrus often appears in the upper-left side of the banana-shaped Nice–Rice relation (Fig. 3c), typical of high Nice, small Rice and low IWC, while natural cirrus more typically clusters in the middle and lower right parts, with low Nice, large Rice, and high IWC. The 50th (grey) and 90th (black) percentile contours indicate a pronounced occurrence of contrail cirrus, with IWC mostly below 10 ppmv. The 10 ppmv IWC isoline also roughly sets in situ-origin cirrus apart from liquid-origin cirrus with higher IWC. This classification of cirrus origins was applied to the ML-CIRRUS measurements by Luebke et al. (2016) and is replotted in Fig. S1 (see Supplement), where it can be seen that in situ-origin cirrus appears more frequently with Rice<30 µm and IWC <10 ppmv, while liquid-origin cirrus shows exactly the opposite.
The occurrence frequency of in-cloud RHice in relation to temperature, as depicted in Fig. 3d, shows one maximum at around 90 % RHice in the temperature range of 208–220 K, which corresponds to the temperature range showing contrail cirrus signals in Fig. 3a and b. The observed occurrence of contrail cirrus in slight subsaturation with respect to ice observed in ML-CIRRUS is consistent with what was reported in Kübbeler et al. (2011) based on the CONCERT dataset. A similar feature is reported from the first analysis of the IAGOS RHice and cloud dataset in the North Atlantic flight corridor for the years 2014 and 2015 (Petzold et al., 2017).
In the following we will discriminate between contrail and natural cirrus and obtain an understanding of the occurrence of contrail cirrus regarding spatial occurrence probabilities, cloud properties, and their favourable atmospheric conditions.
3.2 Cirrus classification
3.2.1 Cirrus differentiated by the Schmidt–Appleman criterion (SAC)
Our attempt at SAC calculation divides the ML-CIRRUS cirrus dataset discussed in the previous section into two categories: the dataset of cloud particles sampled under conditions fulfilling SAC (SAC+, ∼ 11.2 h) and the complementary dataset not fulfilling SAC (SAC−, ∼ 3.5 h); see Fig. 1d for details. As discussed in Sect. 2.3.1 and shown in Fig. 1, a cloud sample fulfilling SAC is considered very possibly involved in the formation of contrails during its evolution, and the one measured at thermodynamic positions failing SAC is considered irrelevant to contrail formation and is regarded as natural cirrus.
Note, however, that natural cirrus could also be included in the SAC+ group, meaning that SAC alone is not a sufficient criterion to identify contrail cirrus, while cirrus detected in the SAC− group can be unambiguously attributed to natural cirrus. Despite the limited differentiation between contrail and natural cirrus using SAC alone, we will first discuss the differences in the microphysical properties between the SAC+ and SAC− datasets. The sharpening of the separation of the full ensemble into aviation-influenced cirrus and natural cirrus by adding another criterion of the most frequent cruising altitude range will then be discussed in Sect. 3.2.2.
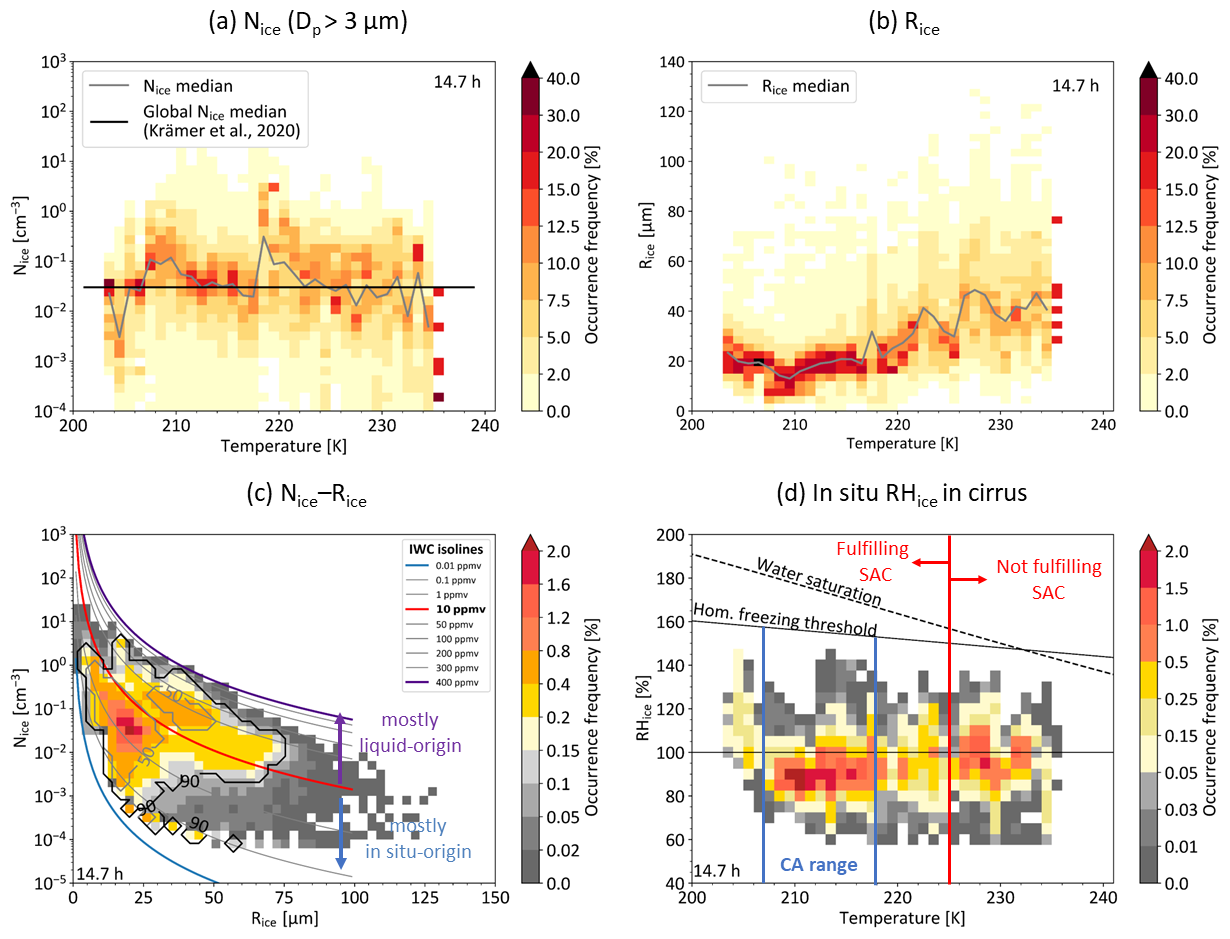
Figure 3Overview of the cirrus cloud properties measured in central Europe and the northeast Atlantic flight corridor during the ML-CIRRUS research aircraft campaign in spring 2014. (a) Occurrence frequency of ice particle number concentrations (Nice) for all cirrus crystals larger than 3 µm in diameter (Dp), binned in 1 K intervals. The grey line shows the median Nice in single temperature intervals. The horizontal bar indicates the Nice median from in situ Nice global climatology (Krämer et al., 2020). (b) The same as (a) but for the mass mean radius Rice of cirrus particles. (c) Normalized occurrence frequency of Nice as a function of Rice. Coloured curves are ice water content (IWC) isolines in parts per million by volume (ppmv). The same amount of IWC could consist of many small ice particles pointing to the left end of the isoline or a few large ice crystals to the right end. The grey and black contours enclose 50 % and 90 % of the most frequently occurring cloud particles. Ice crystals with IWC <10 ppmv are mostly in situ-origin cirrus, while those with IWC >10 ppmv are mostly liquid-origin cirrus. (d) Normalized occurrence frequency of in situ RHice in cirrus clouds. The water saturation (Murphy and Koop, 2005) and homogeneous freezing threshold (Koop et al., 2000) are added. The vertical red line marks the temperature threshold for possible contrail formation, calculated from the Schmidt–Appleman criterion (SAC). The most frequent aircraft cruising altitude boundaries are marked by the vertical blue lines and correspond to a pressure range of 200–245 hPa (207–218 K in temperature).
Microphysical properties in the cirrus fulfilling SAC and in natural cirrus
Figure 4a and b display the Nice–Rice relations for the SAC+ and SAC− datasets, respectively, with the occurrence frequency normalized to the total number of measurements in each dataset. Small ice crystals in higher concentrations are mainly found in the SAC+ group. In the SAC+ dataset, the median Nice=0.04 cm−3 doubles the median value of the SAC− dataset. Conversely, the median Rice of the SAC+ group (20.6 µm) is only half of the value (42.4 µm) of the SAC− counterpart. Nice in the SAC+ dataset reaches values as high as 20 cm−3 for Rice smaller than 30 µm, while Nice in the SAC− dataset is mostly below 1 cm−3, with most particles larger than 30 µm. The highest occurrence frequencies in the SAC+ and SAC− datasets (enclosed by the 50th percentile contours) dwell on the lower and upper sides of the 10 ppmv IWC isoline, respectively.
Besides the fact that in the SAC+ dataset both natural and contrail cirrus can be found, the SAC− group only contains natural cirrus. The two groups largely correspond to cirrus formed from different mechanisms, namely in situ- and liquid-origin cirrus. Most in situ-origin (IWC <10 ppmv) and some liquid-origin cirrus (IWC >10 ppmv) are found in the SAC+ group; conversely, most of the liquid-origin cirrus and a small part of the in situ-origin cirrus are in the SAC− counterpart. Contrail cirrus belongs to the in situ-origin cirrus type, since it appears in the temperature range Tamb<235 K, either without pre-existing cirrus (contrail cirrus) or superimposed on existing cirrus (embedded contrails). As embedded contrails, they could also appear as the liquid-origin cirrus.
The contrast between the SAC+ and SAC− groups is illustrated in Fig. 4c, showing the differences between Fig. 4a and b. The reddish area indicates that ice crystals measured in the environments satisfying SAC are prone to contrail cirrus, whereas the bluish area, in contrast, shows ice crystals that are linked to natural cirrus.
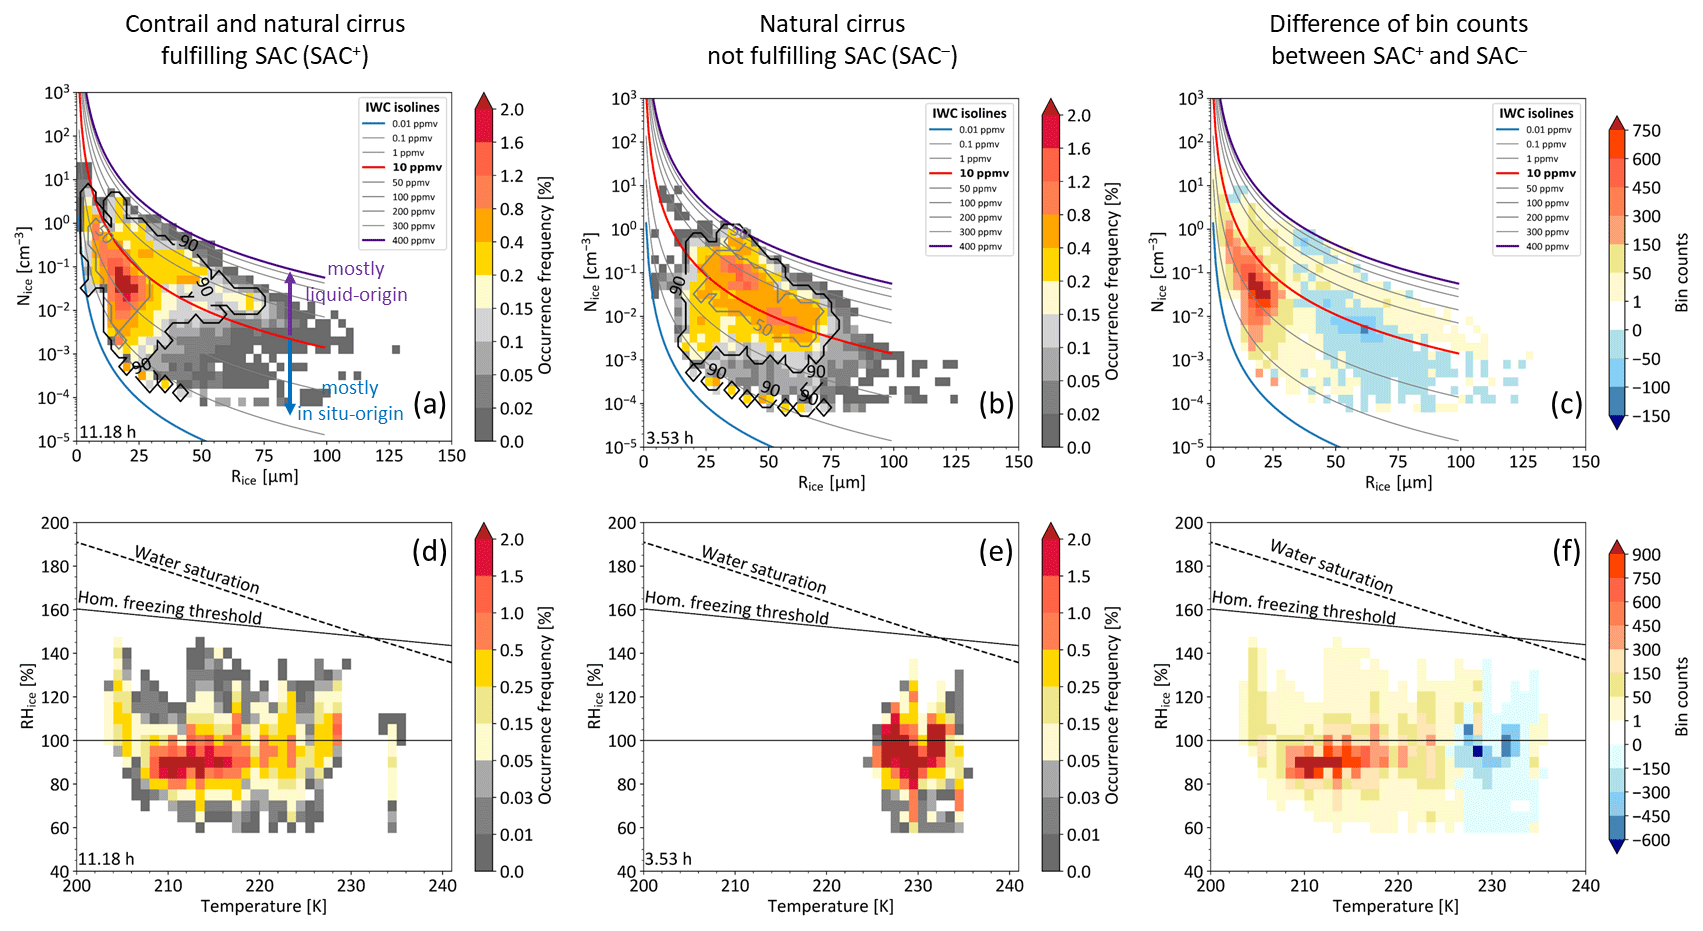
Figure 4(a)–(c) Similar to Fig. 3c but for (a) the Schmidt–Appleman criterion (SAC) fulfilled dataset of contrail and natural cirrus (median: Nice=0.04 cm−3 and Rice=20.6 µm); (b) the SAC unfulfilled dataset of natural cirrus (median: Nice=0.018 cm−3 and Rice=42.4 µm); and (c) the difference of data points between (a) and (b) in single Nice–Rice bins. (d)–(f) Similar to Fig. 3d but for (d) the dataset of contrail and natural cirrus fulfilling SAC; (e) the natural cirrus not fulfilling the SAC; and (f) the difference of data points between (d) and (e) in single RHice–Tamb bins.
RHice in the cirrus fulfilling SAC and in natural cirrus
The other pronounced differences between the SAC+ and SAC− groups are the most frequently appearing RHice and the respective temperature ranges, as shown in the lower panel of Fig. 4. The highest occurrence frequencies of RHice in the SAC+ group concentrate at slight ice subsaturation at ∼ 90 % RHice in the Tamb range of 207–218 K. The slight ice-subsaturation feature is associated with younger contrails with high Nice and small Rice, as can been seen from Fig. S2b (see Supplement), where the Nice–Rice relation is shown colour-coded with RHice for the SAC+ group in the CA range (see Sect. 2.3.2). In the SAC− dataset, the highest frequencies of RHice cluster around 100 % at 10 K warmer temperatures and spread over the Nice–Rice parameter space (Fig. S2c). The warm temperature range, which is already shown in Fig. 3, reflects the fact that colder temperatures are needed to fulfil SAC because the water saturation pressure at warmer temperatures is almost always so high that the amount of water in the ambient air together with the additional water from aircraft exhaust is insufficient to reach supersaturation with respect to water to form droplets.
In spite of the clear differences in ice particle properties and ambient RHice conditions resulted from applying SAC (Fig. 4f), ambiguities remain to characterize contrail cirrus and distinguish it from natural cirrus because the natural cirrus of in situ-origin that has formed at rather low temperatures can show the characteristics of medium Nice (0.1 cm−3), low IWC, and small Rice as well and would thus be misclassified as contrail cirrus. Additionally, even high Nice accompanied by small Rice can appear in natural cirrus as a result of in situ homogeneously freezing in high updraughts (Krämer et al., 2016).
3.2.2 Cirrus fulfilling SAC inside and outside the cruising altitude (CA) range
Here, the SAC+ dataset shown in Fig. 4a and d is split into one group inside the most frequent cruising altitude (CA) range and the other one outside the CA range using the CA pressure boundaries defined in Sect. 2.3.2. The ice cloud properties and RHice occurrence frequencies related to ambient temperature inside and outside the CA range are presented and discussed below.
Microphysical properties inside and outside the cruising altitude range
The Nice–Rice relation of the cirrus fulfilling the SAC and detected inside the CA range is shown in Fig. 5a, while the cirrus outside the CA range is depicted in Fig. 5c. Comparing the Nice–Rice relation showing all SAC+ cirrus (Fig. 4a) to that inside and outside the CA range, it becomes clear that the entire group of liquid-origin cirrus (Rice>30 µm and IWC >10 ppmv) and a part of the in situ-origin cirrus (Rice<30 µm and IWC <10 ppmv) occur outside the CA range; i.e., the cirrus outside the CA range represents a mixture of contrail cirrus, in situ-origin cirrus, and liquid-origin cirrus, later referred to as a cirrus mixture. Inside the CA range, almost only in situ-origin cirrus is present. The mean Rice and Nice of cirrus particles inside the CA range (Fig. 5a) are approximately 17 µm and 0.21 cm−3, corresponding to previous field observations of pure contrail cirrus older than 30 min (Schröder et al., 2000; Voigt et al., 2017; Schumann et al., 2017; Chauvigné et al., 2018).
The classification that the cirrus fulfilling SAC and inside the CA range is pure contrail cirrus is confirmed by the validated contrail cirrus, which fulfils SAC and is identified by applying the aircraft plume detection algorithm (Mahnke et al., 2022) described in Sect. 2.3.3. Since the aerosol and NOy measurements for both flights on 22 March 2014 were missing and aircraft plumes detected at Tamb>235 K are screened out, the valid sampling time encountered aircraft exhaust plumes is approximately 0.9 h, around 3200 cloud samples at 1 Hz sampling frequency, among which 1270 cloud samples are located in the CA range. As adding the CA constraint to the SAC fulfilled plume dataset does not improve the validation significantly (See Sect. S4 in the Supplement for detailed analysis), the following discussion is based on the plume dataset with only the SAC applied.
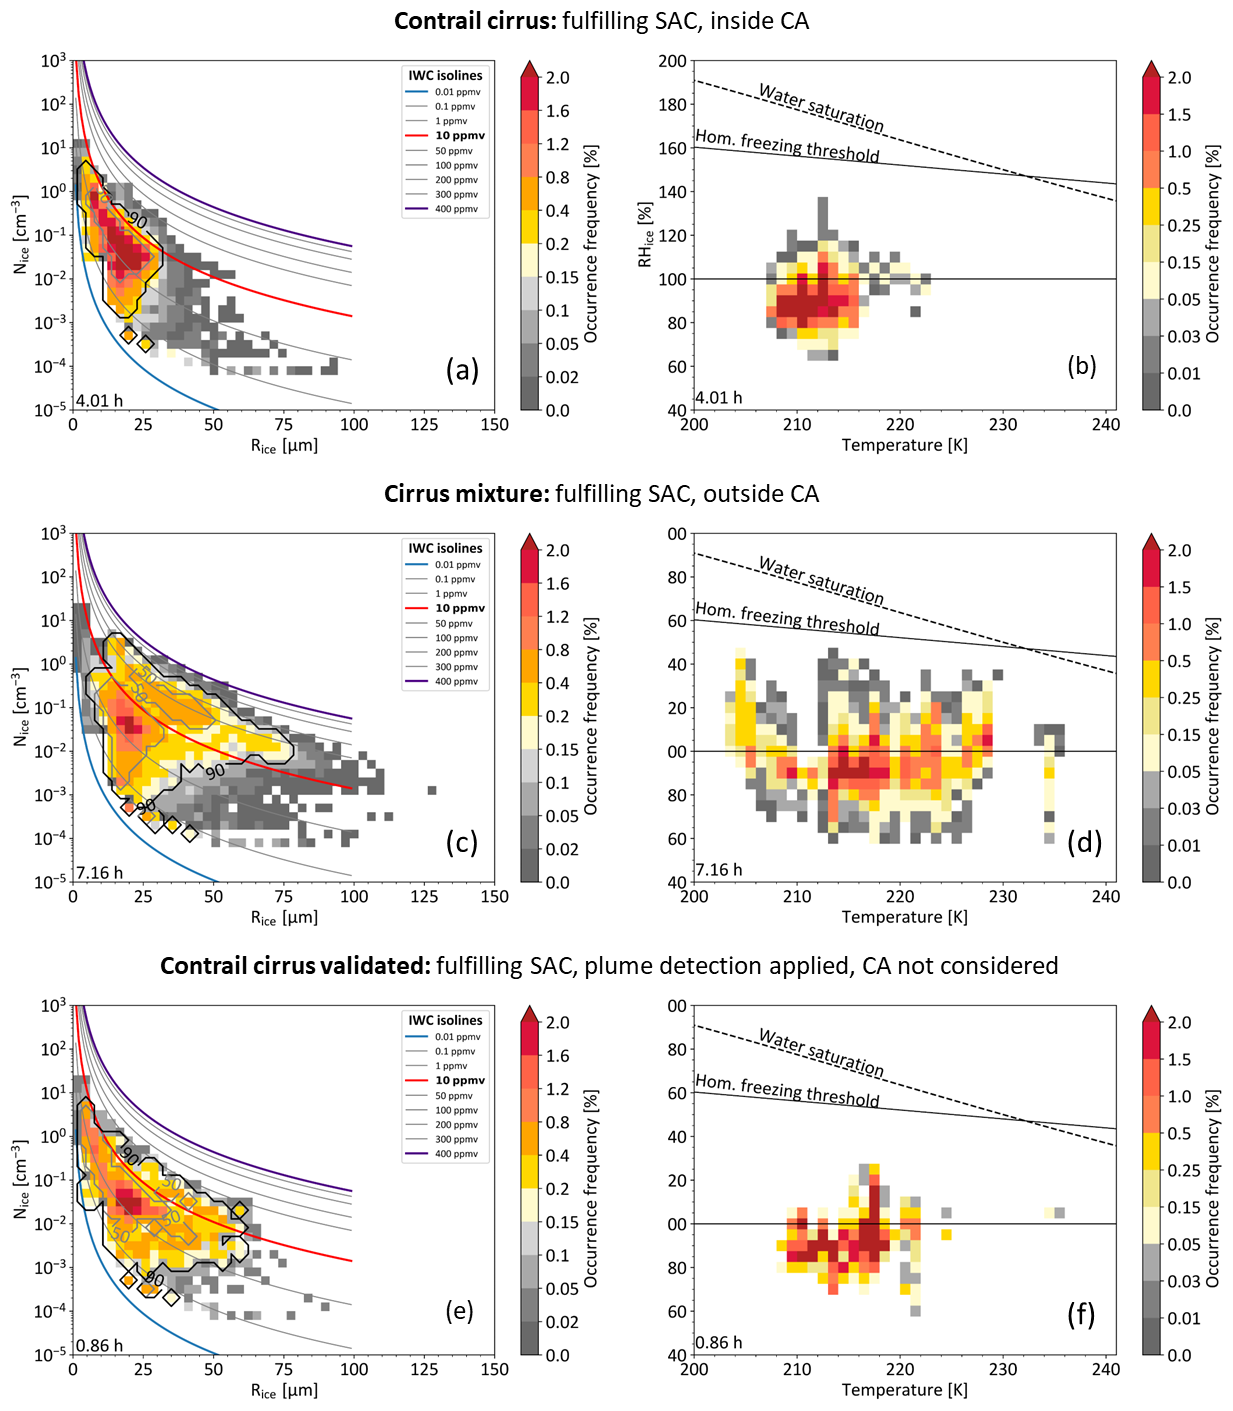
Figure 5Nice–Rice (a, c, e) and RHice–Tamb (b, d, f) relations colour-coded by normalized occurrence frequency, similar to Fig. 4a and d. (a, b) The contrail cirrus fulfilling the Schmidt–Appleman criterion (SAC) and found inside the cruising altitude range (CA; ambient pressure 200–245 hPa) (median: Nice=0.045 cm−3 and Rice=16.6 µm). (c, d) The cirrus mixture fulfilling SAC and outside the CA range (in situ- and liquid-origin cirrus) (median: Nice=0.038 cm−3 and Rice=24.1 µm). (e, f) Contrail cirrus with plume detection applied and fulfilling the SAC (median: Nice=0.027 cm−3 and Rice=21.7 µm), but the CA range is not considered here.
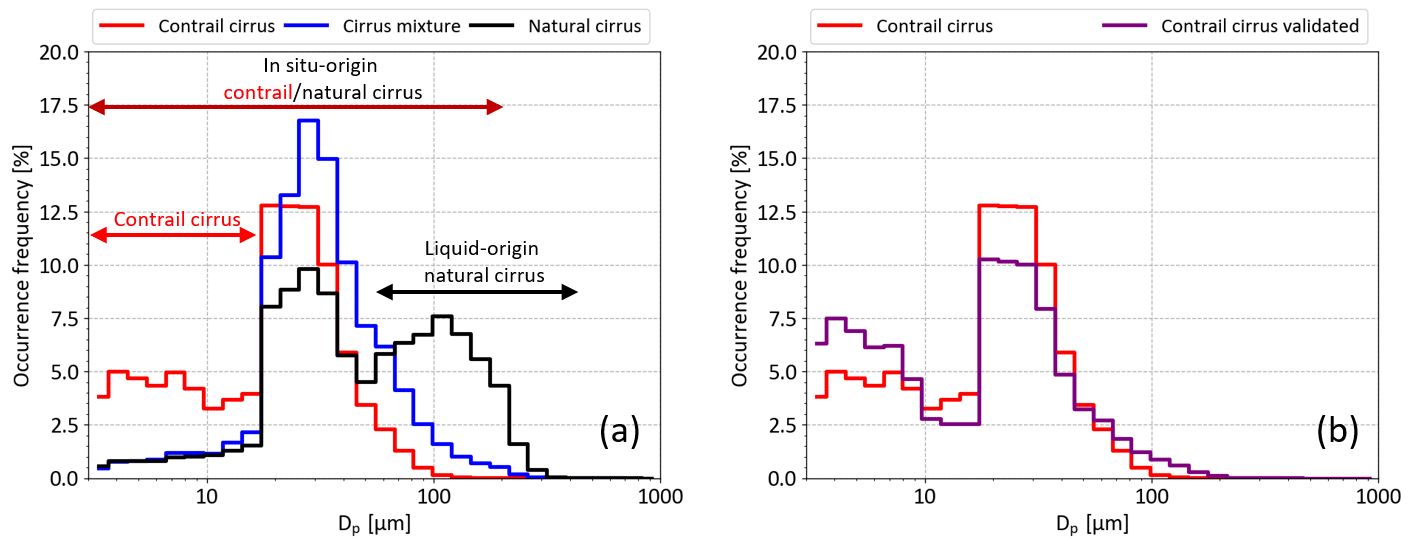
Figure 6(a) Normalized occurrence frequency of ice particle sizes in diameter (Dp, unit: µm) in the contrail cirrus (red), cirrus mixture (contrail cirrus, in situ- and liquid-origin natural cirrus, blue), and natural cirrus (black). The ice particle size ranges for contrail cirrus, in situ-origin contrail or natural cirrus, and liquid-origin cirrus are marked by the arrows. (b) Similar to (a) but for contrail cirrus (red) and contrail cirrus satisfying the Schmidt–Appleman criterion (SAC) and validated with the aircraft exhaust plume detection method (purple). Note that Dp stands for optical-equivalent diameter for NIXE-CAS-DPOL in the size range of 3–17 µm and area-equivalent diameter for NIXE-CIPg in the sizes greater than 17 µm.
The Nice–Rice relation for the validated contrail cirrus is displayed in Fig. 5e. The shape of the overall Nice–Rice occurrence frequency distribution for the validated contrail cirrus shows similarity to the pure contrail cirrus differentiated by combining SAC and the CA range (Fig. 5a), especially when looking at the particle population that contains 50 % of the most frequently appearing ice crystals. The median Rice and Nice of the pure contrail cirrus are also close to those of the validated cirrus. In conclusion, combining SAC and the CA range has effectively exposed the differences in the microphysical properties of pure contrail cirrus (SAC+; inside the CA range, Fig. 5a), a cirrus mixture (SAC+; outside the CA range, Fig. 5c), and mostly liquid-origin natural cirrus (SAC−; outside the CA range, Fig. 4b).
In addition, we also inspected the frequency distributions of ice particle sizes in diameter, which are not integrated like mass mean radius and will give further insights into the differences among the cirrus categories and, in addition, confirm the differentiation using the SAC–CA method.
Figure 6a shows the normalized occurrence frequencies of ice particle sizes in the contrail cirrus (in situ-origin), cirrus mixture (contrail cirrus and in situ- and liquid-origin natural cirrus), and mostly liquid-origin natural cirrus. Three size modes of ice particle sizes can be identified from the frequency distributions of the contrail cirrus and natural cirrus: ice particles in the first size mode – Dp=3–17 µm (marked by the short red arrow) – appear more frequently inside the CA range and are attributed to pure contrail cirrus. The next size mode – Dp=3–200 µm (the long red arrow) – is present in contrail cirrus as well as in natural cirrus and is attributed to aged contrails or in situ-origin natural cirrus. The mode Dp=50–400 µm (the black arrow) originates from liquid-origin cirrus. The maximum sizes represent the largest ice particle size of the particle population including 90 % data. Large ice crystals up to about 200–300 µm do appear in contrail cirrus but with a low frequency (see the blue curve in Fig. 6a and also Kübbeler et al., 2011; Voigt et al., 2010). Also, note that 17 µm marks the instrument switches from NIXE-CAS-DPOL to NIXE-CIPg. This might cause the jump of occurrence frequencies instead of a smooth transition.
The histograms in Fig. 6a show that the contrail (red line) and liquid-origin natural (black line) cirrus are most probably distinguishable in the small ice particle diameter range (Dp<17 µm) and the larger size range (Dp>80 µm). Ice crystals between Dp=17–45 µm occur frequently in the contrail cirrus but also in the natural cirrus, which makes it difficult to discriminate between the contrail and natural cirrus in this size range. The signature of a larger number of small ice crystals in natural cirrus occurs in the early phase of homogeneous ice nucleation in faster updraughts. However, such events are transient in time and space and are, therefore, not often found in in situ measurements (Krämer et al., 2020). The contrail cirrus considered here does not contain such homogeneous freezing events. Therefore, ice crystals in the diameter range Dp=3–17 µm with relatively high occurrence frequencies and the large particles of maximum size of about 200 µm can be attributed to contrail cirrus, as already noted above. On the contrary, the natural cirrus has the second highest frequency peak in the ice crystals larger than 54 µm, with the maximum diameter being about 400 µm. This means that the observed contrail cirrus was formed in situ with the special feature of frequently appearing small ice crystals; the natural cirrus, however, as introduced before, is a mixture of in situ-origin and liquid-origin cirrus. It is to be noted here that adding an extra constraint of the CA range to the SAC+ group has greatly minimized the interference of the natural cirrus as well as possibly undistinguishable, deeply aged contrail cirrus of much larger sizes.
The cirrus mixture is interpreted above as a mixture of aged contrail cirrus, mainly in situ-origin cirrus with a small portion of middle-sized liquid-origin cirrus. This is confirmed by the frequency distribution of ice particle sizes shown in Fig. 6a (blue line), where the majority (80 % of the total frequencies) of particle diameters are between 17 and 66 µm, and the maximum size is near 300 µm. From this analysis, it is impossible to judge whether the in situ-origin cirrus is aged contrails, which show the same properties as natural cirrus, or whether these cirrus clouds have formed naturally.
Figure 6b shows that the occurrence frequency distribution of ice particle sizes in the contrail cirrus identified using the SAC–CA combination is very similar to that of the validated contrail cirrus aided by the plume detection scheme. In the reference case of the plume-marked contrail cirrus, there are even more smaller ice particles than in the SAC–CA-determined contrail cirrus. Furthermore, the large ice particles occur with very low frequencies not only in the plume-marked contrail cirrus but also in the contrail cirrus constrained by SAC and the CA range. This adds confidence in the discrimination between contrail cirrus and natural cirrus with the SAC–CA combination.
RHice inside and outside the cruising altitude range
The RHice–Tamb distribution for the contrail cirrus (SAC+, inside the CA range) is shown in Fig. 5b, while Fig. 5d depicts that for the cirrus mixture (SAC+, outside the CA range). In comparison to Fig. 4e, where the frequencies of RHice in the natural cirrus (SAC−) centre around 100 % at temperatures above 225 K (also reported in regional and global research flight measurements by Krämer et al. (2020), Patnaude et al. (2021), Diao et al. (2014, 2017), and RHice observations on board passenger aircraft by Spichtinger et al. (2004), the RHice inside the contrail cirrus (Fig. 5b) distributes most frequently around 90 % and appears almost exclusively in the temperature range Tamb=207–218 K. As mentioned in Sect. 3.2.1, this subsaturation feature is associated with high Nice and small Rice inside the CA range (Fig. 5a), namely the contrail cirrus, as discussed in previous subsections and shown in the Nice–Rice relations colour-coded with RHice in Fig. S2 (see Supplement). Compared to the RHice distribution in the contrail cirrus (Fig. 5b) and natural cirrus (Fig. 4e), the RHice frequencies in the cirrus mixture (in Fig. 5d) are more broadly distributed around 100 % RHice between 204 and 229 K, yet with slightly higher frequencies between 80 and 100 % at Tamb=207–218 K, similar to the contrail cirrus. The high RHice values up to 140 % in the cirrus mixture are closely related to the in situ-origin cirrus (Nice<0.1 cm−3 and Rice<30 µm) and liquid-origin cirrus (IWC >10 ppmv, Rice>50 µm), as seen from Fig. S2d.
Figure 5f shows that RHice in the validated contrail cirrus falls mostly below ice saturation in the temperature range of 208–218 K, consistent with the ice-subsaturation feature in the pure contrail cirrus (Fig. 5b). We consider the agreement as verification of the method for separating contrail cirrus from natural cirrus using only SAC and the CA range.
3.3 In-cloud ice sub- and supersaturation – comparisons and causes
In Fig. 7a, we present the RHice occurrence frequencies of the different cirrus types distinguished using the criteria of SAC, CA, and plume detection: the contrail cirrus, validated contrail cirrus (identified using the plume detection method), and natural cirrus. RHice in the contrail and the validated contrail cirrus peaks at 90 % RHice, i.e., in slight ice subsaturation, with much higher occurrence frequency than at 100 % RHice. Furthermore, the RHice distribution in the contrail cirrus tilts to the left – lower ice subsaturation (80 % RHice) – while the distribution of RHice in the natural cirrus has a heavier weight in the right part of the peak – more towards ice supersaturation (110 %).
The slight subsaturation observed here seems to be doubtful, although previous instrumental intercomparisons have suggested that there is no non-negligible bias in the RHice measurements (see Sect. 2.1). However, the possibility of a small bias in the in situ RHice dataset due to a positive bias in the measured temperature (Tmeas) was brought up in Schumann (2021; see p. 108), arguing that the true Tamb might be slightly smaller than Tmeas from HALO BAHAMAS. Later in this section, the effect of a possible positive Tmeas bias will be discussed in relation to the observation of ice subsaturation contrail cirrus. But first, the in-cloud RHice occurrence frequency distribution from the WALES lidar observations (see Sect. 2.1) is plotted in Fig. 7b in comparison to the in situ RHice of all cirrus. The RHice distribution of all in situ-measured cirrus (the orange curve) peaks at 90 % RHice with an occurrence frequency of ∼ 22 %, nearly overlapped with the distribution of the lidar RHice shown in green, which is broader, with a blunt peak around 95 % RHice (∼ 15 % of occurrence frequency). The lidar RHice of mixed contrail and natural cirrus spans from approximately 80 %–110 % at the full width half maximum of the peak, the same RHice range observed in most in situ measurements. Despite the different Tamb sources used for the in situ RHice (from BAHAMAS) and lidar RHice (from ECMWF) calculations, the RHice distributions related to temperature of in situ (see Fig. 3d) and remote-sensing measurements (see Fig. 8) in the same environment exhibit a consistent view of RHice occurrence frequencies in the cirrus clouds in central Europe and the northeast Atlantic flight corridor in spring 2014. The subsaturation feature of cirrus is also evident in the temperature dependence of the lidar RHice at cold temperatures between ∼ 215–220 K, while at warmer temperatures above 220 K, RHice centres at around 100 %. The good agreement between the independent in situ and lidar RHice measurements gives confidence in the assignment of the slight ice-subsaturation feature to contrail cirrus.

Figure 7(a) Normalized RHice occurrence frequency distributions in 5 % RHice bin width for the contrail cirrus identified using the combination of the Schmidt–Appleman criterion (SAC) and the cruising altitude range (CA) (red), contrail cirrus validated by the plume detection algorithm (purple), and natural cirrus not fulfilling SAC and located outside the CA range (black). The most frequently occurring RHice in the contrail cirrus and natural cirrus is marked by the dashed red and black lines, respectively. (b) Normalized RHice occurrence frequency distributions for all cirrus measured in situ (orange) and by the lidar WALES (green).
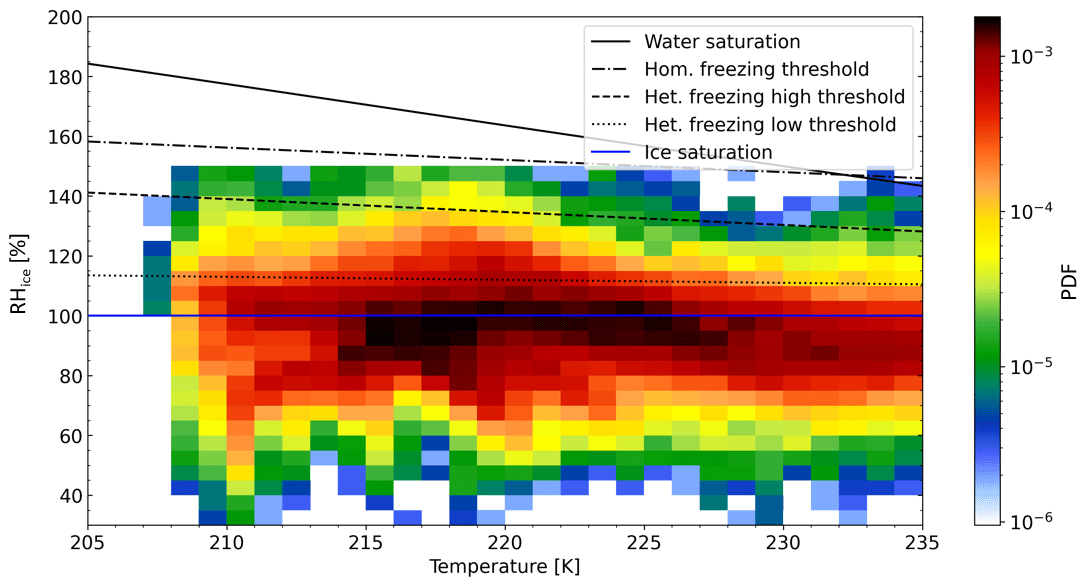
Figure 8Probability distribution of in-cloud RHice measured by the lidar WALES below 235 K as a function of ECMWF model temperature. Only the cloud particles producing a back-scattering ratio greater than 3 and depolarization greater than 20 % are included in the plot. The water saturation (Murphy and Koop, 2005), homogeneous freezing threshold (Koop et al., 2000), and heterogeneous freezing high (mineral dust as ice-nucleating particles) and low (coated soot) thresholds (Krämer et al., 2016) are added in the figure. Ice saturation is also marked by the horizontal blue line.
However, because of the strong dependence of RHice on the temperature, the above-mentioned effect of a positive temperature bias in Tmeas on the RHice distribution is tested because lower temperatures enhance RHice. The RHice frequency distribution in all cirrus clouds, at temperatures assumed to be constantly 0.5 K colder than the current in situ Tmeas, is shown in Fig. S3 (see Supplement). The peak of the RHice frequency distribution shifts from 90 % to 95 % at slightly colder temperatures, so the slight ice-subsaturation feature is still visible in the contrail cirrus above central Europe and the northeast Atlantic region in spring 2014.
Since finding contrail cirrus in an ice-subsaturated environment may seem surprising, we discuss possible reasons for this in the following. During the campaign phase in spring 2014, the background atmosphere in the investigated region was relatively calm with slow vertical velocities mostly below 0.2 m s−1 in frontal systems and warm conveyor belts. Why contrail cirrus was sampled in slight ice subsaturation can be assumed from two perspectives:
-
Contrails could have formed in slight ice-supersaturation in pre-existing thin/subvisible cirrus, which have been formed heterogeneously and of which the ice particles have grown to large sizes (Kübbeler et al., 2011). Marjani et al. (2022) have revealed from satellite retrievals that the perturbation of aircraft on cirrus ice number concentrations is located 300–540 m beneath the flight tracks, right where the primary aircraft vortex descends after formation. The temperature increase following this descent causes RHice to decrease to ice subsaturation, which was observed for instance by Gayet et al. (2012; Fig. 3h). In such cases, the occurring cirrus would be contrail cirrus embedded in already existing, possibly subvisible natural cirrus.
-
Contrails could also have formed in slightly ice-subsaturated to slightly supersaturated environments where natural cirrus could not emerge because the threshold humidity for heterogeneous freezing is not reached. But water vapour in the environment together with that emitted from aircraft is sufficient to surpass water saturation and form a contrail in the hot and moist aircraft exhaust. Mixing of the ambient air together with the descent to lower altitudes as described in (1) would also place the contrail cirrus in a subsaturated environment. The question here is if the ice crystals can grow to the observed sizes of maximum ∼ 200 µm during their time in supersaturation. However, this would be the classic case of a blue sky without any cirrus cloud, which turns into a grey sky covered with contrail cirrus in the presence of air traffic.
The next obvious question regarding how long the contrail cirrus can persist in a slightly ice-subsaturated environment will be discussed in Sect. 4.
3.4 Survey of cirrus and contrail cirrus characteristics
The 10th, 25th, 50th, 75th, and 90th percentiles of the different characteristics of the cirrus types, detected over central Europe in spring 2014 and separated by the combined analysis of SAC, CA, and the plume detection scheme (Sect. 2.3), are summarized in Table 1. The median Nice, Rice, IWC, and RHice in the contrail cirrus constrained by SAC and the CA range as well as that contrail cirrus identified using the aircraft exhaust detection method are correspondent, giving confidence in the new, statistically based contrail–cirrus separation method.
The parameters determining the probable origin, optical property, and evolution state of the clouds are the median IWC (Sect. 1), extinction coefficient (Ext), and RHice. Ext is calculated from the empirical formulation in Gayet et al. (2004): , where the effective diameter Deff is in micrometres (µm), IWC is in grams per cubic metres (g m−3; calculated from IWC in ppmv using H2O molar mass, ambient pressure, and temperature), and A=3000 mm3 g−1. The Deff is converted from the mass mean radius Rice, assuming a ratio of 0.7 ± 0.3 between Rice and the effective radius Reff of ice particles in contrails and contrail cirrus based on Schumann et al. (2011). The uncertainty of the Ext is approximately ±43 %. For contrail cirrus, found in the temperature range 207–218 K, these are IWC = 3.5 ppmv, Ext = ∼ 0.056 km−1, and RHice=88.8 %, thus classifying them as in situ-origin, optically thin, sublimating cirrus clouds (Fig. 11a). The warm, natural cirrus (temperature range 225–235 K) is mostly liquid-origin, thick and persisting cirrus (Fig. 11c) exhibiting a higher median IWC = 21.7 ppmv, a larger Ext = ∼ 0.137 km−1, and RHice=95.9 % close to saturation. The cirrus mixture, with contrails embedded within in situ- and liquid-origin cirrus (Fig. 11b), is in the intermediate temperature range of 218 to 225 K. Its median properties are IWC = 8.3 ppmv, Ext = ∼ 0.096 km−1, and RHice=94.3 %; however, no clear assignment is made here due to its mixed nature. The slightly subsaturated contrails observed under the conditions (Rice, Nice, RHice, temperature range shown in Table 1) would need ∼ 30 min to relax to ice saturation after their descent is completed (assuming no vertical motion and changes in the ice particle size negligible) (Korolev and Mazin, 2003), while it would take slightly longer for the natural cirrus to reach saturation.
The slight ice-subsaturation feature of the contrail cirrus observed over central Europe in spring 2014 agrees with the occurrence of contrails in ice subsaturated atmosphere that was observed during the CONCERT campaign (Kübbeler et al., 2011; Voigt et al., 2010; Gayet et al., 2012), although contrail cirrus crystals sampled during ML-CIRRUS were much older (Schumann et al., 2017; Voigt et al., 2017) than those young contrails at the age of a few minutes detected during the CONCERT campaign (Voigt et al., 2010; Chauvigné et al., 2018). A comprehensive compilation of contrails and contrail cirrus measurements from a series of research aircraft campaigns confirmed that the occurrence in slight subsaturation with respect to ice is a pronounced characteristic of contrail cirrus (Schumann et al., 2017). Furthermore, Petzold et al. (2017) reported the observation of contrail cirrus in slight ice subsaturation in the North Atlantic flight corridor using RHice measurements aboard the passenger aircraft in the IAGOS research infrastructure. In conclusion, contrail cirrus occurrence in slight ice subsaturation is not an uncommon feature.
Table 1Percentiles of ice number concentration Nice, mass mean radius Rice, ice water content IWC, relative humidity with respect to ice RHice, and extinction coefficient Ext in the contrail cirrus, the contrail cirrus validated with the aircraft plume detection algorithm, the cirrus mixture, and the natural cirrus over central Europe and the northeast Atlantic region in spring 2014.
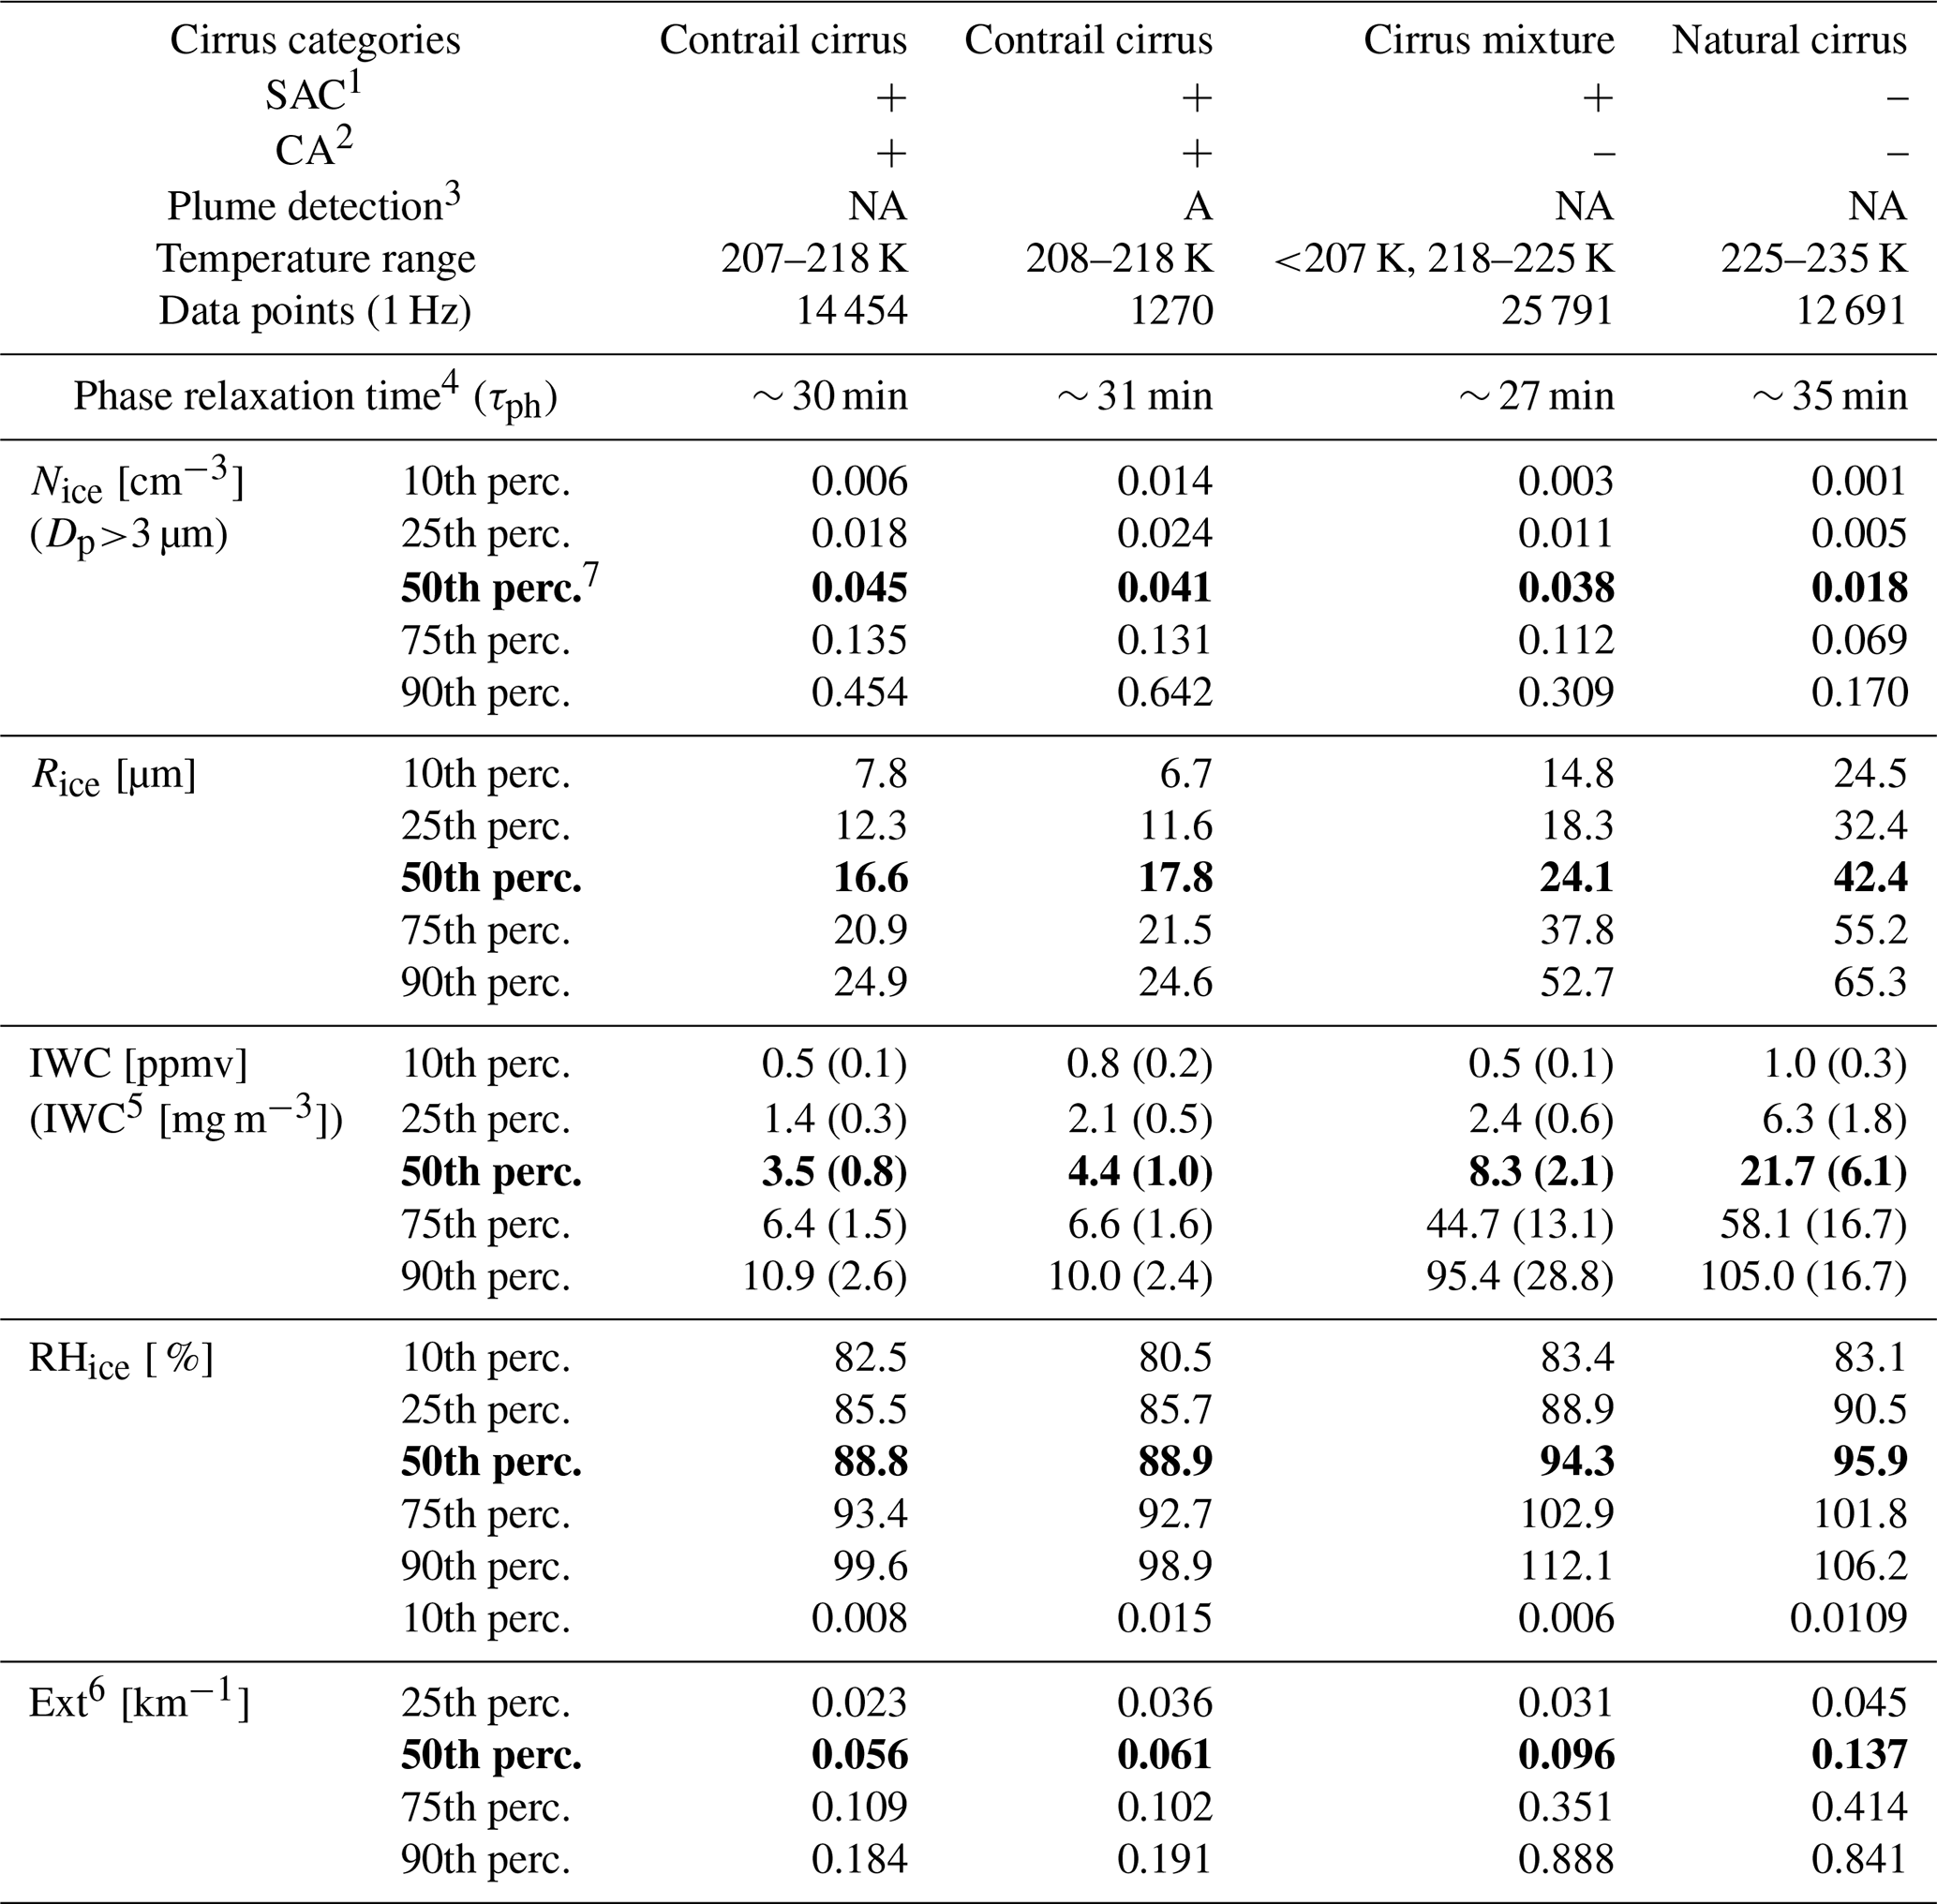
1 SAC: the Schmidt–Appleman criterion, “+” fulfilling SAC, “–” not fulfilling SAC. 2 CA: the cruising altitude range, “+” inside CA, “–” outside CA. 3 Plume detection: the plume detection algorithm, “A” applied, “NA” not applied. 4 Phase relaxation time: the time for in-cloud air in ice subsaturation to reach saturation under quasi-steady conditions (Korolev and Mazin, 2003), i.e. with no vertical movement of the air parcels. 5IWC [mg m−3]: ice water content in milligrams per cubic metre (mg m−3) is converted from the IWC in parts per million per volume (ppmv) using H2O molar mass, ambient pressure, and temperature. 6 Ext: the extinction coefficient. It is calculated after the Eq. (3) in Gayet et al. (2004) with IWC in grams per cubic metre (g m−3); see the text for details. 7 50th perc.: the median values of the parameters (in bold), representing the average properties of different cirrus types.
Whether the contrail cirrus existing in slight ice subsaturation might affect the radiative forcing is connected to the lifetime of ice crystals in such environment. Therefore, we investigated the lifetime of cirrus ice particles of the size and concentration identified for contrail cirrus in slight ice subsaturation using the SAC–CA combination. A scenario of cirrus cloud particles formed at Tamb<210 K was simulated using the detailed microphysical box model MAID (Model for Aerosol and Ice Dynamics) (Bunz et al., 2008; Rolf et al., 2012; Krämer et al., 2016). The simulation was initialized with a water amount of 90 % RHice (Tamb) and an ice-nucleating particle concentration of 0.1 cm−3. The adiabatic cooling or warming rate at vertical wind speeds of 0.1 m s−1 was added to present the constant updraughts or downdraughts in the atmosphere. Ice crystal sublimation and sedimentation processes were not considered in the simulation. The formation and evolution of cirrus particles in the simulated scenario are plotted in Fig. 9. As the contrail cirrus formation process is not implemented in the model, the cooling phase of the simulated scenario in Fig. 9 is to produce cirrus particles that have similar properties (Nice=0.2 cm−3 and Rice=17 µm, Fig. 5a, within the 50 % contour) to the contrail cirrus separated by the combined SAC–CA method. Driven by the vortex dynamics, the distribution of the vertical velocity in the wake of aircraft is distorted towards downdraughts, different from natural cirrus. The warming phase in Fig. 9 simulates the descending of contrails to several hundred metres below flight altitude, after their formation in primary aircraft vortex; see Sect. 3.3. As the warming procedure reduces RHice to below ice saturation, cirrus ice particles of similar properties to the observed contrail cirrus gradually diminish, which takes approximately 4 h for the ice particles to sublimate until RHice declines to below 80 %. This implies that contrail cirrus existing in a slightly ice-subsaturated environment could survive for a long timescale, during which it might also alter the Earth's radiation budget, similar to the persistent contrails formed in ISSRs.
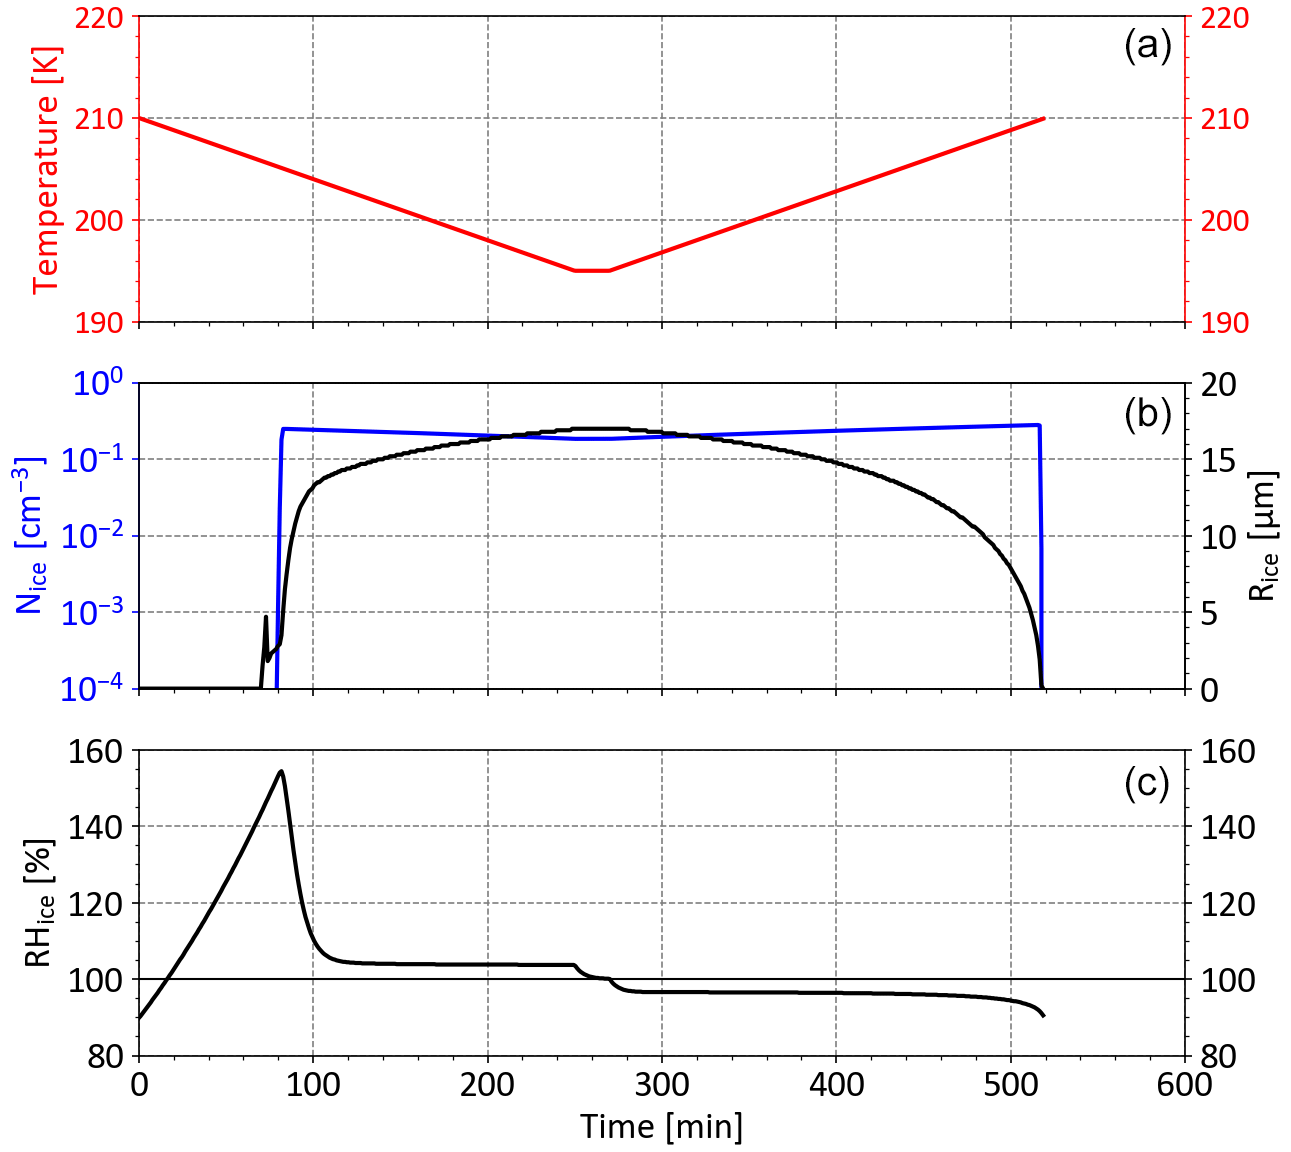
Figure 9Simulated evolution of cirrus cloud particles initialized at 210 K and 90 % RHice as a function of the simulation time in minutes. (a) Temperature of air parcels (unit: K). (b) Ice particle number concentration Nice (cm−3, blue) and mass radius mean Rice (µm, black) of cirrus crystals. (c) Relative humidity with respect to ice RHice (%).
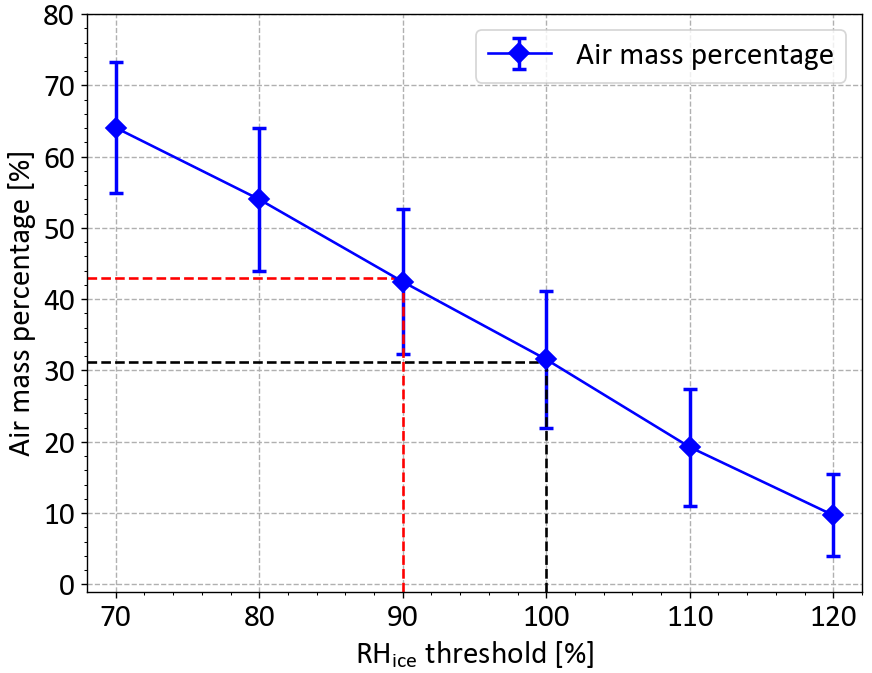
Figure 10Percentage of air masses as a function of RHice thresholds in the upper troposphere, averaged over the North Atlantic (65–5∘ W) and Europe (5∘ W–30∘ E) regions for the MOZAIC period from 1995 to 2010. The percentages of air masses above 90 % and 100 % RHice thresholds are labelled with the dashed red and black lines, respectively.
Whether slightly ice-subsaturated regions are relevant for the influence of contrail cirrus on climate depends on the frequency of the occurrence of such regions. For this reason, we assessed the changes in air masses for a further potential radiative impact of contrail cirrus when lowering the threshold of contrail persistence in RHice from 100 % to 90 %. Figure 10 summarizes the air mass percentages under different RHice thresholds averaged over the North Atlantic and Europe for the IAGOS-MOZAIC observational period from 1995 to 2010 (see Petzold et al., 2020, for details). The air mass percentage of RHice ≥90 % for the Europe and North Atlantic flight corridor is approximately 43 %, increased by more than 10 % in comparison to the air mass percentage of RHice≥100 %. Whether this finding might lead to a larger impact of aviation on the climate is unclear, particularly when the recent results on the relevance of strong warming contrails, the so-called big hits (Teoh et al., 2020b; Gierens et al., 2020), are considered.
The climate impact of aviation-induced cirrus clouds by today's knowledge is predominantly linked to contrail cirrus in ISSRs and so is the current recommendation for diverting the aircraft to avoid the formation of contrails with strong radiative forcing potential (Teoh et al., 2020a, b). It is unclear how the existence of contrail cirrus in slightly ice-subsaturated regions could influence the assessment of the climate impact of contrails and contrail cirrus. However, as we have shown in our analysis, contrail cirrus does survive several hours in such slight ice subsaturation (90 % RHice), and there might be a non-negligible increase in contrail cirrus coverage if considering the existence of contrail cirrus in RHice≥90 %. Thus, we recommend considering the slightly ice-subsaturated regions for the benefit of safe contrail avoidance during air traffic management and a reliable estimation of the radiative forcing of aviation-induce cloudiness.
Fresh contrails can be easily identified owing to their brightness and linear shape. Apart from that, contrail cirrus, especially the one that has aged and turned into a thin cirrus layer, is difficult to be separated from natural cirrus to tackle aviation-induced climate impact. In this work, a new approach to filter out contrail cirrus from natural cirrus is developed: we combined the Schmidt–Appleman criterion (SAC) – the fundamental thermodynamical approach to predict contrail formation – with a new aircraft exhaust plume detection algorithm to statistically discriminate between the contrail and natural cirrus measured above central Europe during the ML-CIRRUS research aircraft campaign in spring 2014.
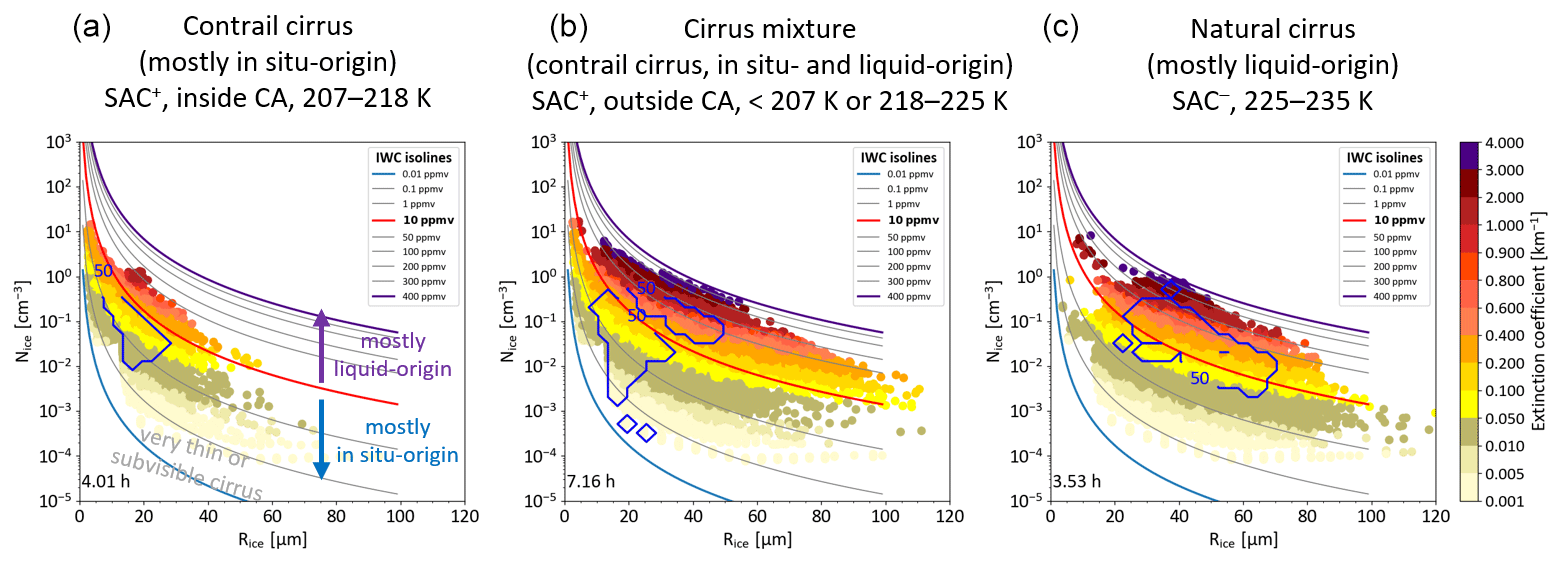
Figure 11Ice crystal number concentration Nice vs. mass mean radius Rice colour-coded with extinction coefficient Ext (unit: km−1) of ice particles. Ice water content (IWC) isolines in relation to Nice and Rice are also plotted. (a) The contrail cirrus that fulfil the Schmidt–Appleman criterion (SAC) inside the cruising altitude (CA; ambient pressure 200–245 hPa, ambient temperature 207–218 K), also identified as in situ-origin cirrus; median: Nice = 0.045 cm−3, Rice = 16.6 µm, IWC = 3.5 ppmv, Ext = ∼ 0.056 km−1. (b) The cirrus mixture (fulfilling SAC and outside the CA range), which is a mixture of contrail cirrus and in situ- and liquid-origin natural cirrus; median: Nice = 0.038 cm−3, Rice = 24.1 µm, IWC = 8.3 ppmv, Ext = ∼ 0.096 km−1. (c) the natural cirrus of liquid-origin (not fulfilling SAC and below the CA range); median: Nice = 0.018 cm−3, Rice = 42.4 µm, IWC = 21.7 ppmv, Ext = ∼ 0.137 km−1. The 50 % (blue) contour encloses 50 % the most frequently occurring ice crystals. The total sampling hours of each cirrus dataset at 1 Hz sampling frequency are inserted in the lower left corners of the figures.
Cloud particles matching SAC are presumably attributed to contrail cirrus, while those missing SAC are treated as natural cirrus. Comparatively young contrail cirrus was encountered most frequently in the cruising altitude (CA) with ambient pressure ranging from 200 to 245 hPa (ambient temperature range 207–218 K). Figure 11 summarizes the microphysical and optical properties of the contrail and natural cirrus observed during the ML-CIRRUS. It shows that the microphysical and optical properties of the contrail (Fig. 11a) and natural cirrus (Fig. 11c) differ markedly, with the contrail cirrus occurring in a much higher median number density Nice=0.045 cm−3 accompanied by a smaller mass mean radius Rice=16.6 µm and mostly ice water content IWC <10 ppmv, compared to Nice=0.018 cm−3, Rice=42.4 µm, and IWC frequently above 10 ppmv in the natural cirrus. The relatively low extinction coefficients of the contrail cirrus (median 0.056 km−1 compared to 0.137 km−1 in the natural liquid-origin cirrus) reveal that the observed contrail cirrus clouds were rather optically thin, indicating aged contrail cirrus particles. Altogether, the contrail cirrus sampled inside CA shares the characteristics of in situ-origin cirrus, in contrast to the large and optically thicker natural cirrus of liquid origin. Cirrus clouds outside CA (Fig. 11b) are a complex of in situ- and liquid-origin cirrus with contrails embedded.
An important finding of this study is that the highest probability of RHice in the contrail cirrus occurs in slight ice subsaturation, centring at around 90 % RHice, concurring with previous studies based on a smaller dataset of in situ measurements. The RHice distribution in the natural cirrus agrees with the worldwide climatology compiled by Krämer et al. (2020; Fig. 7), which centres around ice saturation at Tamb>∼ 200 K. The existence of contrail cirrus in slightly ice subsaturated environments seems to be surprising from the perspective of thermodynamic equilibrium, but Krämer et al. (2020) and Jensen et al. (2001) also reported natural cirrus under subsaturated conditions. As predicted by a cirrus scenario simulated with the box model MAID, contrail cirrus can persist up to over 4 h in around 90 % RHice environment, which means that contrail cirrus likely plays a role in the overall contrail radiative feedback provided that it appears frequently. An estimation of the air mass percentage with RHice≥90 % in air traffic cruise regions, based on 15 years of MOZAIC RHice measurements, shows an increase by approximately 10 % in comparison to the air mass percentage in the ISSRs. This suggests that we might need to lower the RHice threshold to achieve the efficacy of contrail avoidance by rerouting aircraft. We also call for deeper investigations into the spatial coverage and optical depth of the contrail cirrus in slight ice-subsaturated environments as well as the associated microphysical processes to predicate their climate effect robustly. In turn, this will also facilitate the mitigation of aviation's climate impact by reducing the occurrence of contrails and contrail cirrus.
The ML-CIRRUS dataset supporting this study is available from the HALO database at https://halo-db.pa.op.dlr.de/mission/2 (last access: 6 December 2022) (https://doi.org/10.17616/R39Q0T, German Aerospace Center, 2022), or it may be provided by the authors upon request. The IAGOS data are available through the IAGOS data portal at https://doi.org/10.25326/20 (Boulanger, 2021).
The supplement related to this article is available online at: https://doi.org/10.5194/acp-23-2251-2023-supplement.
YL and MK designed the study. YL carried it out and prepared the manuscript with contributions from all co-authors. CM and UB developed and applied the plume detection algorithm to identify cirrus particles influenced by aircraft exhaust. SR and AP analysed the pressure levels of IAGOS-MOZAIC flights over the North Atlantic and Europe and provided air mass fractions at different RHice thresholds in this region observed during the IAGOS-MOZAIC period. NS prepared the particle size distribution data for calculating the frequency of ice particle sizes. MK performed the cirrus life cycle simulation. GD and SG provided the RHice data from WALES. CV and US coordinated the ML-CIRRUS campaign.
At least one of the (co-)authors is a member of the editorial board of Atmospheric Chemistry and Physics. The peer-review process was guided by an independent editor, and the authors also have no other competing interests to declare.
Publisher’s note: Copernicus Publications remains neutral with regard to jurisdictional claims in published maps and institutional affiliations.
We would like to thank Martin Zöger (DLR, Germany) for providing BAHAMAS and SHARC data from ML-CIRRUS, Armin Afchine (FZJ, Germany) for NIXE data, Daniel Sauer (DLR, Germany) for aerosol data, and Helmut Ziereis (DLR, Germany) for providing NOy data. We are grateful to Klaus Gierens (DLR, Germany) for helpful discussion. MOZAIC/IAGOS data are created with support from the European Commission, national agencies in Germany (BMBF), France (MESR), and the UK (NERC), and the IAGOS member institutions (https://www.iagos.org/organisation/members/, last access: 6 December 2022). The participating airlines (Deutsche Lufthansa, Air France, China Airlines, Iberia, Cathay Pacific, Hawaiian Airlines, Air Namibia, Sabena, Austrian) supported IAGOS by carrying the measurement equipment free of charge since 1994. The data are available at https://doi.org/10.25326/20 (Boulanger, 2021) thanks to additional support from AERIS. Martina Krämer thanks JGU Mainz for support as a GFK fellow. Christiane Voigt acknowledges the support from the Helmholtz Association and the German Research Foundation.
This research has been supported by the Horizon 2020 (ACACIA (grant no. 875036)) and the Bundesministerium für Bildung und Forschung (grant no. 01LK1301A).
The article processing charges for this open-access publication were covered by the Forschungszentrum Jülich.
This paper was edited by Matthias Tesche and reviewed by Minghui Diao and Alexei Korolev.
Afchine, A., Rolf, C., Costa, A., Spelten, N., Riese, M., Buchholz, B., Ebert, V., Heller, R., Kaufmann, S., Minikin, A., Voigt, C., Zöger, M., Smith, J., Lawson, P., Lykov, A., Khaykin, S., and Krämer, M.: Ice particle sampling from aircraft – influence of the probing position on the ice water content, Atmos. Meas. Tech., 11, 4015–4031, https://doi.org/10.5194/amt-11-4015-2018, 2018.
Appleman, H.: The Formation of Exhaust Condensation Trails by Jet Aircraft, B. Am. Meteorol. Soc., 34, 14–20, https://doi.org/10.1175/1520-0477-34.1.14, 1953.
Boulanger, D.: IAGOS data portal, IAGOS [data set], https://doi.org/10.25326/20, 2021.
Bräuer, T., Voigt, C., Sauer, D., Kaufmann, S., Hahn, V., Scheibe, M., Schlager, H., Diskin, G. S., Nowak, J. B., Digangi, J. P., Huber, F., Moore, R. H., and Anderson, B. E.: Airborne Measurements of Contrail Ice Properties – Dependence on Temperature and Humidity, Geophys. Res. Lett., 48, e2020GL092166, https://doi.org/10.1029/2020gl092166, 2021.
Bunz, H., Benz, S., Gensch, I., and Krämer, M.: MAID: a model to simulate UT/LS aerosols and ice clouds, Environ. Res. Lett., 3, 035001, https://doi.org/10.1088/1748-9326/3/3/035001, 2008.
Burkhardt, U. and Kärcher, B.: Global radiative forcing from contrail cirrus, Nat. Clim. Change, 1, 54–58, https://doi.org/10.1038/nclimate1068, 2011.
Burkhardt, U., Kärcher, B., and Schumann, U.: Global modeling of the contrail and contrail cirrus climate impact, B. Am. Meteorol. Soc., 91, 479–484, https://doi.org/10.1175/2009BAMS2656.1, 2010.
Burkhardt, U., Bock, L., and Bier, A.: Mitigating the contrail cirrus climate impact by reducing aircraft soot number emissions, npj Clim. Atmos. Sci., 1, 37, https://doi.org/10.1038/s41612-018-0046-4, 2018.
Chauvigné, A., Jourdan, O., Schwarzenboeck, A., Gourbeyre, C., Gayet, J. F., Voigt, C., Schlager, H., Kaufmann, S., Borrmann, S., Molleker, S., Minikin, A., Jurkat, T., and Schumann, U.: Statistical analysis of contrail to cirrus evolution during the Contrail and Cirrus Experiment (CONCERT), Atmos. Chem. Phys., 18, 9803–9822, https://doi.org/10.5194/acp-18-9803-2018, 2018.
Dee, D. P., Uppala, S. M., Simmons, A. J., Berrisford, P., Poli, P., Kobayashi, S., Andrae, U., Balmaseda, M. A., Balsamo, G., Bauer, P., Bechtold, P., Beljaars, A. C. M., van de Berg, L., Bidlot, J., Bormann, N., Delsol, C., Dragani, R., Fuentes, M., Geer, A. J., Haimberger, L., Healy, S. B., Hersbach, H., Hólm, E. V., Isaksen, L., Kållberg, P., Köhler, M., Matricardi, M., McNally, A. P., Monge-Sanz, B. M., Morcrette, J.-J., Park, B.-K., Peubey, C., de Rosnay, P., Tavolato, C., Thépaut, J.-N., and Vitart, F.: The ERA-Interim reanalysis: configuration and performance of the data assimilation system, Q. J. Roy. Meteor. Soc., 137, 553–597, https://doi.org/10.1002/qj.828, 2011.
Diao, M., Zondlo, M. A., Heymsfield, A. J., Avallone, L. M., Paige, M. E., Beaton, S. P., Campos, T., and Rogers, D. C.: Cloud-scale ice-supersaturated regions spatially correlate with high water vapor heterogeneities, Atmos. Chem. Phys., 14, 2639–2656, https://doi.org/10.5194/acp-14-2639-2014, 2014.
Diao, M. H., Bryan, G. H., Morrison, H., and Jensen, J. B.: Ice Nucleation Parameterization and Relative Humidity Distribution in Idealized Squall-Line Simulations, J. Atmos. Sci., 74, 2761–2787, https://doi.org/10.1175/JAS-D-16-0356.1, 2017.
Gayet, J.-F., Ovarlez, J., Shcherbakov, V., Ström, J., Schumann, U., Minikin, A., Auriol, F., Petzold, A., and Monier, M.: Cirrus cloud microphysical and optical properties at southern and northern midlatitudes during the INCA experiment, J. Geophys. Res.-Atmos., 109, D20206, https://doi.org/10.1029/2004JD004803, 2004.
Gayet, J.-F., Shcherbakov, V., Voigt, C., Schumann, U., Schäuble, D., Jessberger, P., Petzold, A., Minikin, A., Schlager, H., Dubovik, O., and Lapyonok, T.: The evolution of microphysical and optical properties of an A380 contrail in the vortex phase, Atmos. Chem. Phys., 12, 6629–6643, https://doi.org/10.5194/acp-12-6629-2012, 2012.
German Aerospace Center: HALO database, German Aerospace Center [data set], https://doi.org/10.17616/R39Q0T, 2022.
Gierens, K.: Selected topics on the interaction between cirrus clouds and embedded contrails, Atmos. Chem. Phys., 12, 11943–11949, https://doi.org/10.5194/acp-12-11943-2012, 2012.
Gierens, K. and Vázquez-Navarro, M.: Statistical analysis of contrail lifetimes from a satellite perspective, Meteorol. Z., 27, 183–193, https://doi.org/10.1127/metz/2018/0888, 2018.
Gierens, K., Matthes, S., and Rohs, S.: How Well Can Persistent Contrails Be Predicted?, Aerospace, 7, 169, https://doi.org/10.3390/aerospace7120169, 2020.
Giez, A., Mallaun, C., Zöger, M., Dörnbrack, A., and Schumann, U.: Static Pressure from Aircraft Trailing-Cone Measurements and Numerical Weather-Prediction Analysis, J. Aircr., 54, 1728–1737, https://doi.org/10.2514/1.C034084, 2017.
Grewe, V., Gangoli Rao, A., Grönstedt, T., Xisto, C., Linke, F., Melkert, J., Middel, J., Ohlenforst, B., Blakey, S., Christie, S., Matthes, S., and Dahlmann, K.: Evaluating the climate impact of aviation emission scenarios towards the Paris agreement including COVID-19 effects, Nat. Commun., 12, 3841, https://doi.org/10.1038/s41467-021-24091-y, 2021.
Groß, S., Wirth, M., Schäfler, A., Fix, A., Kaufmann, S., and Voigt, C.: Potential of airborne lidar measurements for cirrus cloud studies, Atmos. Meas. Tech., 7, 2745–2755, https://doi.org/10.5194/amt-7-2745-2014, 2014.
Jensen, E. J., Toon, O. B., Kinne, S., Sachse, G. W., Anderson, B. E., Chan, K. R., Twohy, C. H., Gandrud, B., Heymsfield, A., and Miake-Lye, R. C.: Environmental conditions required for contrail formation and persistence, J. Geophys. Res.-Atmos., 103, 3929–3936, https://doi.org/10.1029/97JD02808, 1998.
Jensen, E. J., Toon, O. B., Vay, S. A., Ovarlez, J., May, R., Bui, T. P., Twohy, C. H., Gandrud, B. W., Pueschel, R. F., and Schumann, U.: Prevalence of ice-supersaturated regions in the upper troposphere: Implications for optically thin ice cloud formation, J. Geophys. Res.-Atmos., 106, 17253–17266, https://doi.org/10.1029/2000jd900526, 2001.
Jeßberger, P., Voigt, C., Schumann, U., Sölch, I., Schlager, H., Kaufmann, S., Petzold, A., Schäuble, D., and Gayet, J.-F.: Aircraft type influence on contrail properties, Atmos. Chem. Phys., 13, 11965–11984, https://doi.org/10.5194/acp-13-11965-2013, 2013.
Kärcher, B.: Formation and radiative forcing of contrail cirrus, Nat. Commun., 9, 1824, https://doi.org/10.1038/s41467-018-04068-0, 2018.
Kaufmann, S., Voigt, C., Heller, R., Jurkat-Witschas, T., Krämer, M., Rolf, C., Zöger, M., Giez, A., Buchholz, B., Ebert, V., Thornberry, T., and Schumann, U.: Intercomparison of midlatitude tropospheric and lower-stratospheric water vapor measurements and comparison to ECMWF humidity data, Atmos. Chem. Phys., 18, 16729–16745, https://doi.org/10.5194/acp-18-16729-2018, 2018.
Klöwer, M., Allen, M. R., Lee, D. S., Proud, S. R., Gallagher, L., and Skowron, A.: Quantifying aviation's contribution to global warming, Environ. Res. Lett., 16, 104027, https://doi.org/10.1088/1748-9326/ac286e, 2021.
Koop, T., Luo, B., Tsias, A., and Peter, T.: Water activity as the determinant for homogeneous ice nucleation in aqueous solutions, Nature, 406, 611–614, https://doi.org/10.1038/35020537, 2000.
Korolev, A. V. and Mazin, I. P.: Supersaturation of water vapor in clouds, J. Atmos. Sci., 60, 2957–2974, https://doi.org/10.1175/1520-0469(2003)060<2957:Sowvic>2.0.Co;2, 2003.
Krämer, M., Rolf, C., Luebke, A., Afchine, A., Spelten, N., Costa, A., Meyer, J., Zöger, M., Smith, J., Herman, R. L., Buchholz, B., Ebert, V., Baumgardner, D., Borrmann, S., Klingebiel, M., and Avallone, L.: A microphysics guide to cirrus clouds – Part 1: Cirrus types, Atmos. Chem. Phys., 16, 3463–3483, https://doi.org/10.5194/acp-16-3463-2016, 2016.
Krämer, M., Rolf, C., Spelten, N., Afchine, A., Fahey, D., Jensen, E., Khaykin, S., Kuhn, T., Lawson, P., Lykov, A., Pan, L. L., Riese, M., Rollins, A., Stroh, F., Thornberry, T., Wolf, V., Woods, S., Spichtinger, P., Quaas, J., and Sourdeval, O.: A microphysics guide to cirrus – Part 2: Climatologies of clouds and humidity from observations, Atmos. Chem. Phys., 20, 12569–12608, https://doi.org/10.5194/acp-20-12569-2020, 2020.
Krautstrunk, M. and Giez, A.: The Transition From FALCON to HALO Era Airborne Atmospheric Research, in: Atmospheric Physics: Background – Methods – Trends, 1st edn., edited by: Schumann, U., Springer Berlin Heidelberg, 609–624, ISBN 978-3-642-30183-4, https://doi.org/10.1007/978-3-642-30183-4_37, 2012.
Kübbeler, M., Hildebrandt, M., Meyer, J., Schiller, C., Hamburger, Th., Jurkat, T., Minikin, A., Petzold, A., Rautenhaus, M., Schlager, H., Schumann, U., Voigt, C., Spichtinger, P., Gayet, J.-F., Gourbeyre, C., and Krämer, M.: Thin and subvisible cirrus and contrails in a subsaturated environment, Atmos. Chem. Phys., 11, 5853–5865, https://doi.org/10.5194/acp-11-5853-2011, 2011.
Lee, D. S., Fahey, D. W., Forster, P. M., Newton, P. J., Wit, R. C. N., Lim, L. L., Owen, B., and Sausen, R.: Aviation and global climate change in the 21st century, Atmos. Environ., 43, 3520–3537, https://doi.org/10.1016/j.atmosenv.2009.04.024, 2009.
Lee, D. S., Fahey, D. W., Skowron, A., Allen, M. R., Burkhardt, U., Chen, Q., Doherty, S. J., Freeman, S., Forster, P. M., Fuglestvedt, J., Gettelman, A., De León, R. R., Lim, L. L., Lund, M. T., Millar, R. J., Owen, B., Penner, J. E., Pitari, G., Prather, M. J., Sausen, R., and Wilcox, L. J.: The contribution of global aviation to anthropogenic climate forcing for 2000 to 2018, Atmos. Environ., 244, 117834, https://doi.org/10.1016/j.atmosenv.2020.117834, 2021.
Luebke, A. E., Afchine, A., Costa, A., Grooß, J.-U., Meyer, J., Rolf, C., Spelten, N., Avallone, L. M., Baumgardner, D., and Krämer, M.: The origin of midlatitude ice clouds and the resulting influence on their microphysical properties, Atmos. Chem. Phys., 16, 5793–5809, https://doi.org/10.5194/acp-16-5793-2016, 2016.
Mahnke, C., Gomes, R., Bundke, U., Berg, M., Ziereis, H., Sharma, M., Righi, M., Hendricks, J., Zahn, A., and Petzold, A.: Properties and processing of aviation induced aerosol within the UTLS observed from the IAGOS-CARIBIC Flying Laboratory, EGU General Assembly 2022, Vienna, Austria, 23–27 May 2022, EGU22-908, https://doi.org/10.5194/egusphere-egu22-908, 2022.
Mallaun, C., Giez, A., and Baumann, R.: Calibration of 3-D wind measurements on a single-engine research aircraft, Atmos. Meas. Tech., 8, 3177–3196, https://doi.org/10.5194/amt-8-3177-2015, 2015.
Marenco, A., Thouret, V., Nédélec, P., Smit, H., Helten, M., Kley, D., Karcher, F., Simon, P., Law, K., Pyle, J., Poschmann, G., Von Wrede, R., Hume, C., and Cook, T.: Measurement of ozone and water vapor by Airbus in-service aircraft: The MOZAIC airborne program, an overview, J. Geophys. Res.-Atmos., 103, 25631–25642, https://doi.org/10.1029/98JD00977, 1998.
Marjani, S., Tesche, M., Bräuer, P., Sourdeval, O., and Quaas, J.: Satellite Observations of the Impact of Individual Aircraft on Ice Crystal Number in Thin Cirrus Clouds, Geophys. Res. Lett., 49, e2021GL096173, https://doi.org/10.1029/2021GL096173, 2022.
Meyer, J.: Ice Crystal Measurements with the New Particle Spectrometer NIXE-CAPS, Dissertation/PhD ThesisBook, Schriften des Forschungszentrums Jülich : Energie & Umwelt/Energy & Environment, Universität Wuppertal, Jülich, http://hdl.handle.net/2128/18497 (last access: 6 December 2022), 2012.
Meyer, J., Rolf, C., Schiller, C., Rohs, S., Spelten, N., Afchine, A., Zöger, M., Sitnikov, N., Thornberry, T. D., Rollins, A. W., Bozóki, Z., Tátrai, D., Ebert, V., Kühnreich, B., Mackrodt, P., Möhler, O., Saathoff, H., Rosenlof, K. H., and Krämer, M.: Two decades of water vapor measurements with the FISH fluorescence hygrometer: a review, Atmos. Chem. Phys., 15, 8521–8538, https://doi.org/10.5194/acp-15-8521-2015, 2015.
Murphy, D. M. and Koop, T.: Review of the vapour pressures of ice and supercooled water for atmospheric applications, Q. J. Roy. Meteor. Soc., 131, 1539–1565, https://doi.org/10.1256/qj.04.94, 2005.
Neis, P., Smit, H. G. J., Rohs, S., Bundke, U., Krämer, M., Spelten, N., Ebert, V., Buchholz, B., Thomas, K., and Petzold, A.: Quality assessment of MOZAIC and IAGOS capacitive hygrometers: insights from airborne field studies, Tellus Ser. B-Chem. Phys. Meteorol., 67, 28320, https://doi.org/10.3402/tellusb.v67.28320, 2015.
Niklaß, M., Grewe, V., Gollnick, V., and Dahlmann, K.: Concept of climate-charged airspaces: a potential policy instrument for internalizing aviation's climate impact of non-CO2 effects, Clim. Policy, 21, 1066–1085, https://doi.org/10.1080/14693062.2021.1950602, 2021.
Patnaude, R., Diao, M., Liu, X., and Chu, S.: Effects of thermodynamics, dynamics and aerosols on cirrus clouds based on in situ observations and NCAR CAM6, Atmos. Chem. Phys., 21, 1835–1859, https://doi.org/10.5194/acp-21-1835-2021, 2021.
Petzold, A., Busen, R., Schröder, F. P., Baumann, R., Kuhn, M., Ström, J., Hagen, D. E., Whitefield, P. D., Baumgardner, D., Arnold, F., Borrmann, S., and Schumann, U.: Near-field measurements on contrail properties from fuels with different sulfur content, J. Geophys. Res.-Atmos., 102, 29867–29880, https://doi.org/10.1029/97JD02209, 1997.
Petzold, A., Marsh, R., Johnson, M., Miller, M., Sevcenco, Y., Delhaye, D., Ibrahim, A., Williams, P., Bauer, H., Crayford, A., Bachalo, W. D., and Raper, D.: Evaluation of Methods for Measuring Particulate Matter Emissions from Gas Turbines, Environ. Sci. Technol., 45, 3562–3568, https://doi.org/10.1021/es103969v, 2011.
Petzold, A., Formenti, P., Baumgardner, D., Bundke, U., Coe, H., Curtius, J., DeMott, P. J., Flagan, R. C., Fiebig, M., Hudson, J. G., McQuaid, J., Minikin, A., Roberts, G. C., and Wang, J.: In Situ Measurements of Aerosol Particles, in: Airborne Measurements for Environmental Research, 157–223, https://doi.org/10.1002/9783527653218.ch4, 2013.
Petzold, A., Thouret, V., Gerbig, C., Zahn, A., Brenninkmeijer, C. A. M., Gallagher, M., Hermann, M., Pontaud, M., Ziereis, H., Boulanger, D., Marshall, J., Nédélec, P., Smit, H. G. J., Friess, U., Flaud, J.-M., Wahner, A., Cammas, J.-P., and Volz-Thomas, A.: Global-scale atmosphere monitoring by in-service aircraft – current achievements and future prospects of the European Research Infrastructure IAGOS, Tellus Ser. B-Chem. Phys. Meteorol., 67, 28452, https://doi.org/10.3402/tellusb.v67.28452, 2015.
Petzold, A., Krämer, M., Neis, P., Rolf, C., Rohs, S., Berkes, F., Smit, H. G. J., Gallagher, M., Beswick, K., Lloyd, G., Baumgardner, D., Spichtinger, P., Nédélec, P., Ebert, V., Buchholz, B., Riese, M., and Wahner, A.: Upper tropospheric water vapour and its interaction with cirrus clouds as seen from IAGOS long-term routine in situ observations, Faraday Discuss., 200, 229–249, https://doi.org/10.1039/C7FD00006E, 2017.
Petzold, A., Neis, P., Rütimann, M., Rohs, S., Berkes, F., Smit, H. G. J., Krämer, M., Spelten, N., Spichtinger, P., Nédélec, P., and Wahner, A.: Ice-supersaturated air masses in the northern mid-latitudes from regular in situ observations by passenger aircraft: vertical distribution, seasonality and tropospheric fingerprint, Atmos. Chem. Phys., 20, 8157–8179, https://doi.org/10.5194/acp-20-8157-2020, 2020.
Reutter, P., Neis, P., Rohs, S., and Sauvage, B.: Ice supersaturated regions: properties and validation of ERA-Interim reanalysis with IAGOS in situ water vapour measurements, Atmos. Chem. Phys., 20, 787–804, https://doi.org/10.5194/acp-20-787-2020, 2020.
Rolf, C., Krämer, M., Schiller, C., Hildebrandt, M., and Riese, M.: Lidar observation and model simulation of a volcanic-ash-induced cirrus cloud during the Eyjafjallajökull eruption, Atmos. Chem. Phys., 12, 10281–10294, https://doi.org/10.5194/acp-12-10281-2012, 2012.
Schmidt, E.: Die Entstehung von Eisnebel aus den Auspuffgasen von Flugmotoren, in: Schriften der Deutschen Akademie der Luftfahrtforschung, R. Oldenbourg, 5, 1–15, 1941.
Schröder, F., Kärcher, B., Duroure, C., Ström, J., Petzold, A., Gayet, J.-F., Strauss, B., Wendling, P., and Borrmann, S.: On the Transition of Contrails into Cirrus Clouds, J. Atmos. Sci., 57, 464–480, https://doi.org/10.1175/1520-0469(2000)057<0464:OTTOCI>2.0.CO;2, 2000.
Schumann, U.: On conditions for contrail formation from aircraft exhausts, Meteorol. Z., 5, 4–23, https://doi.org/10.1127/metz/5/1996/4, 1996.
Schumann, U.: A contrail cirrus prediction model, Geosci. Model Dev., 5, 543–580, https://doi.org/10.5194/gmd-5-543-2012, 2012.
Schumann, U.: Measurement and model data comparisons for the HALO-FAAM formation flight during EMeRGe on 17 July 2017, Zenodo [data set], https://doi.org/10.5281/zenodo.4427965, 2021.
Schumann, U. and Graf, K.: Aviation-induced cirrus and radiation changes at diurnal timescales, J. Geophys. Res.-Atmos., 118, 2404–2421, https://doi.org/10.1002/jgrd.50184, 2013.
Schumann, U. and Heymsfield, A. J.: On the Life Cycle of Individual Contrails and Contrail Cirrus, Meteorol. Monogr., 58, 3.1–3.24, https://doi.org/10.1175/amsmonographs-d-16-0005.1, 2017.
Schumann, U., Arnold, F., Busen, R., Curtius, J., Kärcher, B., Kiendler, A., Petzold, A., Schlager, H., Schröder, F., and Wohlfrom, K.-H.: Influence of fuel sulfur on the composition of aircraft exhaust plumes: The experiments SULFUR 1–7, J. Geophys. Res.-Atmos., 107, AAC 2-1–AAC 2-27, https://doi.org/10.1029/2001JD000813, 2002.
Schumann, U., Mayer, B., Gierens, K., Unterstrasser, S., Jessberger, P., Petzold, A., Voigt, C., and Gayet, J.-F.: Effective Radius of Ice Particles in Cirrus and Contrails, J. Atmos. Sci., 68, 300–321, https://doi.org/10.1175/2010jas3562.1, 2011.
Schumann, U., Baumann, R., Baumgardner, D., Bedka, S. T., Duda, D. P., Freudenthaler, V., Gayet, J.-F., Heymsfield, A. J., Minnis, P., Quante, M., Raschke, E., Schlager, H., Vázquez-Navarro, M., Voigt, C., and Wang, Z.: Properties of individual contrails: a compilation of observations and some comparisons, Atmos. Chem. Phys., 17, 403–438, https://doi.org/10.5194/acp-17-403-2017, 2017.
Smit, H. G. J., Volz-Thomas, A., Helten, M., Paetz, W., and Kley, D.: An in-flight calibration method for near-real-time humidity measurements with the airborne MOZAIC sensor, J. Atmos. Ocean. Technol., 25, 656–666, https://doi.org/10.1175/2007JTECHA975.1, 2008.
Smit, H. G. J., Rohs, S., Neis, P., Boulanger, D., Krämer, M., Wahner, A., and Petzold, A.: Technical Note: Reanalysis of upper troposphere humidity data from the MOZAIC programme for the period 1994 to 2009, Atmos. Chem. Phys., 14, 13241–13255, https://doi.org/10.5194/acp-14-13241-2014, 2014.
Spichtinger, P., Gierens, K., Smit, H. G. J., Ovarlez, J., and Gayet, J.-F.: On the distribution of relative humidity in cirrus clouds, Atmos. Chem. Phys., 4, 639–647, https://doi.org/10.5194/acp-4-639-2004, 2004.
Teoh, R., Schumann, U., and Stettler, M. E. J.: Beyond Contrail Avoidance: Efficacy of Flight Altitude Changes to Minimise Contrail Climate Forcing, Aerospace, 7, 121, https://doi.org/10.3390/aerospace7090121, 2020a.
Teoh, R., Schumann, U., Majumdar, A., and Stettler, M. E. J.: Mitigating the Climate Forcing of Aircraft Contrails by Small-Scale Diversions and Technology Adoption, Environ. Sci. Technol., 54, 2941–2950, https://doi.org/10.1021/acs.est.9b05608, 2020b.
Teoh, R., Schumann, U., Gryspeerdt, E., Shapiro, M., Molloy, J., Koudis, G., Voigt, C., and Stettler, M. E. J.: Aviation contrail climate effects in the North Atlantic from 2016 to 2021, Atmos. Chem. Phys., 22, 10919–10935, https://doi.org/10.5194/acp-22-10919-2022, 2022.
Unterstrasser, S., Gierens, K., Sölch, I., and Wirth, M.: Numerical simulations of homogeneously nucleated natural cirrus and contrail-cirrus. Part 2: Interaction on local scale, Meteorol. Z., 26, 643–661, https://doi.org/10.1127/metz/2016/0780, 2017.
Urbanek, B., Groß, S., Wirth, M., Rolf, C., Krämer, M., and Voigt, C.: High Depolarization Ratios of Naturally Occurring Cirrus Clouds Near Air Traffic Regions Over Europe, Geophys. Res. Lett., 45, 13166–13172, https://doi.org/10.1029/2018gl079345, 2018.
Voigt, C., Schumann, U., Jurkat, T., Schäuble, D., Schlager, H., Petzold, A., Gayet, J.-F., Krämer, M., Schneider, J., Borrmann, S., Schmale, J., Jessberger, P., Hamburger, T., Lichtenstern, M., Scheibe, M., Gourbeyre, C., Meyer, J., Kübbeler, M., Frey, W., Kalesse, H., Butler, T., Lawrence, M. G., Holzäpfel, F., Arnold, F., Wendisch, M., Döpelheuer, A., Gottschaldt, K., Baumann, R., Zöger, M., Sölch, I., Rautenhaus, M., and Dörnbrack, A.: In-situ observations of young contrails – overview and selected results from the CONCERT campaign, Atmos. Chem. Phys., 10, 9039–9056, https://doi.org/10.5194/acp-10-9039-2010, 2010.
Voigt, C., Schumann, U., Jessberger, P., Jurkat, T., Petzold, A., Gayet, J.-F., Krämer, M., Thornberry, T., and Fahey, D. W.: Extinction and optical depth of contrails, Geophys. Res. Lett., 38, L11806, https://doi.org/10.1029/2011GL047189, 2011.
Voigt, C., Schumann, U., Minikin, A., Abdelmonem, A., Afchine, A., Borrmann, S., Boettcher, M., Buchholz, B., Bugliaro, L., Costa, A., Curtius, J., Dollner, M., Dörnbrack, A., Dreiling, V., Ebert, V., Ehrlich, A., Fix, A., Forster, L., Frank, F., Fütterer, D., Giez, A., Graf, K., Grooß, J.-U., Groß, S., Heimerl, K., Heinold, B., Hüneke, T., Järvinen, E., Jurkat, T., Kaufmann, S., Kenntner, M., Klingebiel, M., Klimach, T., Kohl, R., Krämer, M., Krisna, T. C., Luebke, A., Mayer, B., Mertes, S., Molleker, S., Petzold, A., Pfeilsticker, K., Port, M., Rapp, M., Reutter, P., Rolf, C., Rose, D., Sauer, D., Schäfler, A., Schlage, R., Schnaiter, M., Schneider, J., Spelten, N., Spichtinger, P., Stock, P., Walser, A., Weigel, R., Weinzierl, B., Wendisch, M., Werner, F., Wernli, H., Wirth, M., Zahn, A., Ziereis, H., and Zöger, M.: ML-CIRRUS: The Airborne Experiment on Natural Cirrus and Contrail Cirrus with the High-Altitude Long-Range Research Aircraft HALO, B. Am. Meteorol. Soc., 98, 271–288, https://doi.org/10.1175/BAMS-D-15-00213.1, 2017.
Wirth, M., Fix, A., Mahnke, P., Schwarzer, H., Schrandt, F., and Ehret, G.: The airborne multi-wavelength water vapor differential absorption lidar WALES: system design and performance, Appl. Phys. B-Lasers O., 96, 201–213, https://doi.org/10.1007/s00340-009-3365-7, 2009.
Ziereis, H., Schlager, H., Schulte, P., van Velthoven, P. F. J., and Slemr, F.: Distributions of NO, NOx, and NOy in the upper troposphere and lower stratosphere between 28∘ and 61∘ N during POLINAT 2, J. Geophys. Res.-Atmos., 105, 3653–3664, https://doi.org/10.1029/1999jd900870, 2000.
- Abstract
- Introduction
- Datasets and methods
- Properties of contrail and natural cirrus
- Persistent cirrus in slight ice subsaturation – potential influence on aviation's climate impact
- Summary
- Data availability
- Author contributions
- Competing interests
- Disclaimer
- Acknowledgements
- Financial support
- Review statement
- References
- Supplement
The requested paper has a corresponding corrigendum published. Please read the corrigendum first before downloading the article.
- Article
(2621 KB) - Full-text XML
- Corrigendum
-
Supplement
(1591 KB) - BibTeX
- EndNote
- Abstract
- Introduction
- Datasets and methods
- Properties of contrail and natural cirrus
- Persistent cirrus in slight ice subsaturation – potential influence on aviation's climate impact
- Summary
- Data availability
- Author contributions
- Competing interests
- Disclaimer
- Acknowledgements
- Financial support
- Review statement
- References
- Supplement