the Creative Commons Attribution 4.0 License.
the Creative Commons Attribution 4.0 License.
 | 05 Jan 2023
Dependence of strategic solar climate intervention on background scenario and model physics
Jadwiga H. Richter
Model dependence in simulated responses to stratospheric aerosol injection (SAI) is a major uncertainty surrounding the potential implementation of this solar climate intervention strategy. We identify and aim to understand the drivers of large differences in the aerosol mass latitudinal distributions between two recently produced climate model SAI large ensembles using two models from the same modeling center despite using similar climate targets and controller algorithms. Using a hierarchy of recently produced simulations, we identify three main contributors to the differences including (1) the rapid adjustment of clouds and rainfall to elevated levels of carbon dioxide, (2) the low-frequency dynamical responses in the Atlantic meridional overturning circulation, and (3) the contrasts in future background forcing scenarios. Each uncertainty is unlikely to be significantly narrowed over the likely timeframe of a potential SAI deployment if a 1.5 ∘C target of global warming over preindustrial conditions is to be met.
- Article
(11725 KB) - Full-text XML
- BibTeX
- EndNote


Solar climate intervention (SCI), or solar geoengineering, has been proposed as a means of reducing the adverse impacts of climate change via artificial enhancement of Earth's albedo. One intervention method proposed to temporarily offset anthropogenic warming and associated impacts is stratospheric aerosol injection (SAI), which involves the delivery of aerosols or precursor gases into the stratosphere. A major uncertainty surrounding the enactment of SAI is the climate system response to both continued emissions of carbon dioxide and prolonged elevated levels of stratospheric sulfate aerosols.
It is in the context of this uncertainty that the National Academies of Sciences, Engineering, and Medicine (NASEM) recently called for further research to understand various SCI approaches (NASEM, 2021), as SAI has been shown, in principle, to be a method of global climate intervention capable of achieving various temperature-based targets (Tilmes et al., 2018; MacMartin et al., 2019; Simpson et al., 2019). However, there remain large uncertainties in associated climate responses and impacts (Fasullo et al., 2018; Kravitz and MacMartin, 2020), and adverse effects have been identified involving the water cycle and circulations in the troposphere, stratosphere, and ocean (Tilmes et al., 2018; Kawatani et al., 2011; Watanabe and Kawatani, 2012; Fasullo et al., 2018; Xu et al., 2020; Xie et al., 2022; Sun et al., 2020; Abiodun et al., 2021; Banerjee et al., 2021; Krishnamohan and Bala, 2022).
Climate models are an essential tool for exploring the potential benefits and impacts of the broad range of proposed SAI approaches. They depict the interactions between multiple processes involved in the climate response and simulate impact-relevant fields. They also provide a physically based representation of response mechanisms and timescales. Due to the large internal variability of the climate system, a realistic evaluation of SAI approaches often requires climate model large ensembles (Deser et al., 2012; Kay et al., 2015; Maher et al., 2021) using Earth system models (ESMs) capable of accurately representing a diverse set of processes involving stratospheric and tropospheric dynamics and chemistry and time-varying aerosol distributions, aspects that are well represented in only a few currently available ESMs (Franke et al., 2021).
While some recent work has found broad consistency in simulated responses to simple SAI depictions such as solar dimming (e.g., Kravitz et al., 2021; Visioni et al., 2021), this work identifies and explores substantial climate response dependencies to a more realistic SAI representation based on explicitly resolved stratospheric aerosol injections, their evolving aerosol size distributions, and their burdens. The simulations used are also fully coupled and depict aerosol interactions with dynamical, chemical, and hydrological processes, and related couplings between the land, atmosphere, ocean, and cryosphere (MacMartin et al., 2017; Tilmes et al., 2018; Richter et al., 2022). Evidence of model dependence can be inferred from previous studies, for example in the contrast between implementation of the SAI strategy employed in Kravitz et al. (2017) (Fig. 2) and Tilmes et al. (2018) (Fig. 2), but our understanding of the drivers of such dependencies is poor. While a full understanding of the inter-model differences identified in this work is beyond the scope of any single study, we highlight key differences in the models used and their effects on climate under SAI. Specifically, we focus on the origin of inter-model differences and their physical bases. The models, experiments, and methods used are described in Sect. 2. The spatial and temporal structures of injected aerosols and climate responses are presented and discussed in Sect. 3, while the broader consequences for the potential implementation of SAI and suggestions for future work are presented in Sect. 4.
2.1 Models
With the goal of explicitly representing the dynamical, chemical, and hydrological aspects of the climate response to SAI, this work uses versions 1 and 2 of the Community Earth System Model (CESM1, CESM2). Both versions can be run in so-called high-top and low-top atmospheric configurations. The CESM1 high-top configuration uses the Whole Atmosphere Community Climate Model, version 5 (CESM1-WACCM5, Mills et al., 2017) as its atmospheric component and the CESM2 uses WACCM6 (CESM2-WACCM6, Gettelman et al., 2019). For the atmosphere, CESM1-WACCM5 has zonal and meridional resolutions of 0.9 and 1.25∘, respectively, with 70 vertical levels and a model top of 140 km. The configuration allows for a full representation of stratospheric dynamics, has extensive middle atmospheric chemistry, and is a key improvement upon earlier model generations and many current climate models (e.g., Ferraro and Griffith, 2016). Tropospheric physics in WACCM5 are the same as in the lower top configuration, the Community Atmosphere Model version 5 (CAM5, Park et al., 2014), the atmospheric component of the CESM1 (Hurrell et al., 2013). CESM1-WACCM5 explicitly simulates sulfate aerosol concentrations and size distributions via the Modal Aerosol Module (MAM3; Mills et al., 2017). Associated responses in ozone concentrations have a beneficial impact on stratospheric circulation and its biennial variability (Richter et al., 2017), and these have been shown to reduce the CO2-driven midlatitude jets' poleward shift under present-day climate change (Chiodo and Polvani, 2019). Confidence in the representations of sulfate aerosol processes and their radiative effects are bolstered by the relatively close agreement that exists between simulated and observed radiative responses to the 1991 eruption of Mount Pinatubo (Mills et al., 2017). The ocean component of all models used in this study is the Parallel Ocean Program version 2 (POP2; Smith et al., 2010; Danabasoglu et al., 2012), which has uniform zonal resolution of 1.125∘ and variable meridional resolution ranging from 0.27∘ in the tropics to 0.64∘ in the extratropical Northern Hemisphere (NH). The model has 60 vertical levels with a uniform resolution of 10 m in the ocean's upper 160 m.
CESM2-WACCM6 uses the same horizonal and vertical resolution as CESM1-WACCM5 but incorporates various advances including fully interactive tropospheric chemistry and an interactive crop model. Tropospheric physics is largely the same as in the low-top configuration, the Community Atmosphere Model version 6 (CAM6) as a concerted effort was made during model development to use the same model tuning in the low-top and high-top configurations (Gettelman et al., 2019). CAM6 is the atmospheric component of CESM2 (Danabasoglu et al., 2020) and uses the Cloud Layers Unified By Binormals (CLUBB; Golaz et al., 2002; Thayer-Calder et al., 2015) unified turbulence scheme and the updated Morrison–Gettelman microphysics scheme (MG2; Gettelman and Morrison, 2015). Minor changes to POP2 are incorporated in CESM2-WACCM6 (Danabasoglu et al., 2020).
2.2 CESM1-WACCM5 simulations
A summary of the design characteristics for the simulations used here is given in Table 1. We use CESM1-WACCM5 SAI simulations that are a part of the Geoengineering Large Ensemble (GLENS, Tilmes et al., 2018). GLENS consists of two large ensembles of simulations: one without and one with SAI. Both ensembles use the Representative Concentration Pathway 8.5 (RCP85) background emissions scenario for greenhouse gases. The baseline GLENS simulations consist of free-running RCP85 simulations from 2005 through 2030 (17 members), with an additional three members continuing through 2099 (CESM1-WACCM5-RCP85). The second set of GLENS simulations, GLENS-SAI, utilizes strategically enacted SAI (following Kravitz et al., 2017), which consists of 20 members from 2020 to 2097 in which aerosol injection rates are specified by a controller algorithm (MacMartin et al., 2014; Kravitz et al., 2017) to achieve stabilization of temperature targets at their mean 2020 conditions under RCP85. These targets include near-surface air temperature's global mean, equator-to-pole gradient, and inter-hemispheric gradient, which are all successfully stabilized in GLENS-SAI, though the equator-to-pole gradient increases slightly (by about 0.1 K from 2050 to 2070; Tilmes et al., 2018). While these targets are chosen to address known pitfalls of simple SAI approaches, such as disproportionate tropical cooling and hemispheric imbalances in the energy budget that displace tropical rainfall, alternative metrics can also be chosen that would likely entail different magnitudes of inter-model contrast in SAI implementation. Similarly, the choice of different target metrics would also be likely to entail differences in the climate response. The predefined injection latitudes for GLENS-SAI are 15 and 30∘ in each hemisphere and SO2 is injected about 5 km above the tropopause, or approximately 25 and 23 km for the 15 and 30∘ sites, respectively, with an arbitrarily chosen longitude of 180∘ (Tilmes et al., 2018). The initialization of GLENS-SAI is made from three distinct members of the RCP85 experiment, which itself branched from distinct historical-era simulations, thus providing a diversity of initialized ocean states. GLENS has been used in a range of contexts (Fasullo et al., 2018; Simpson et al., 2019; Pinto et al., 2020; Da-Allada et al., 2020).
Table 1Climate model experiments used in this study and their design characteristics. Time spans are arbitrary for idealized experiments, as denoted by (*).
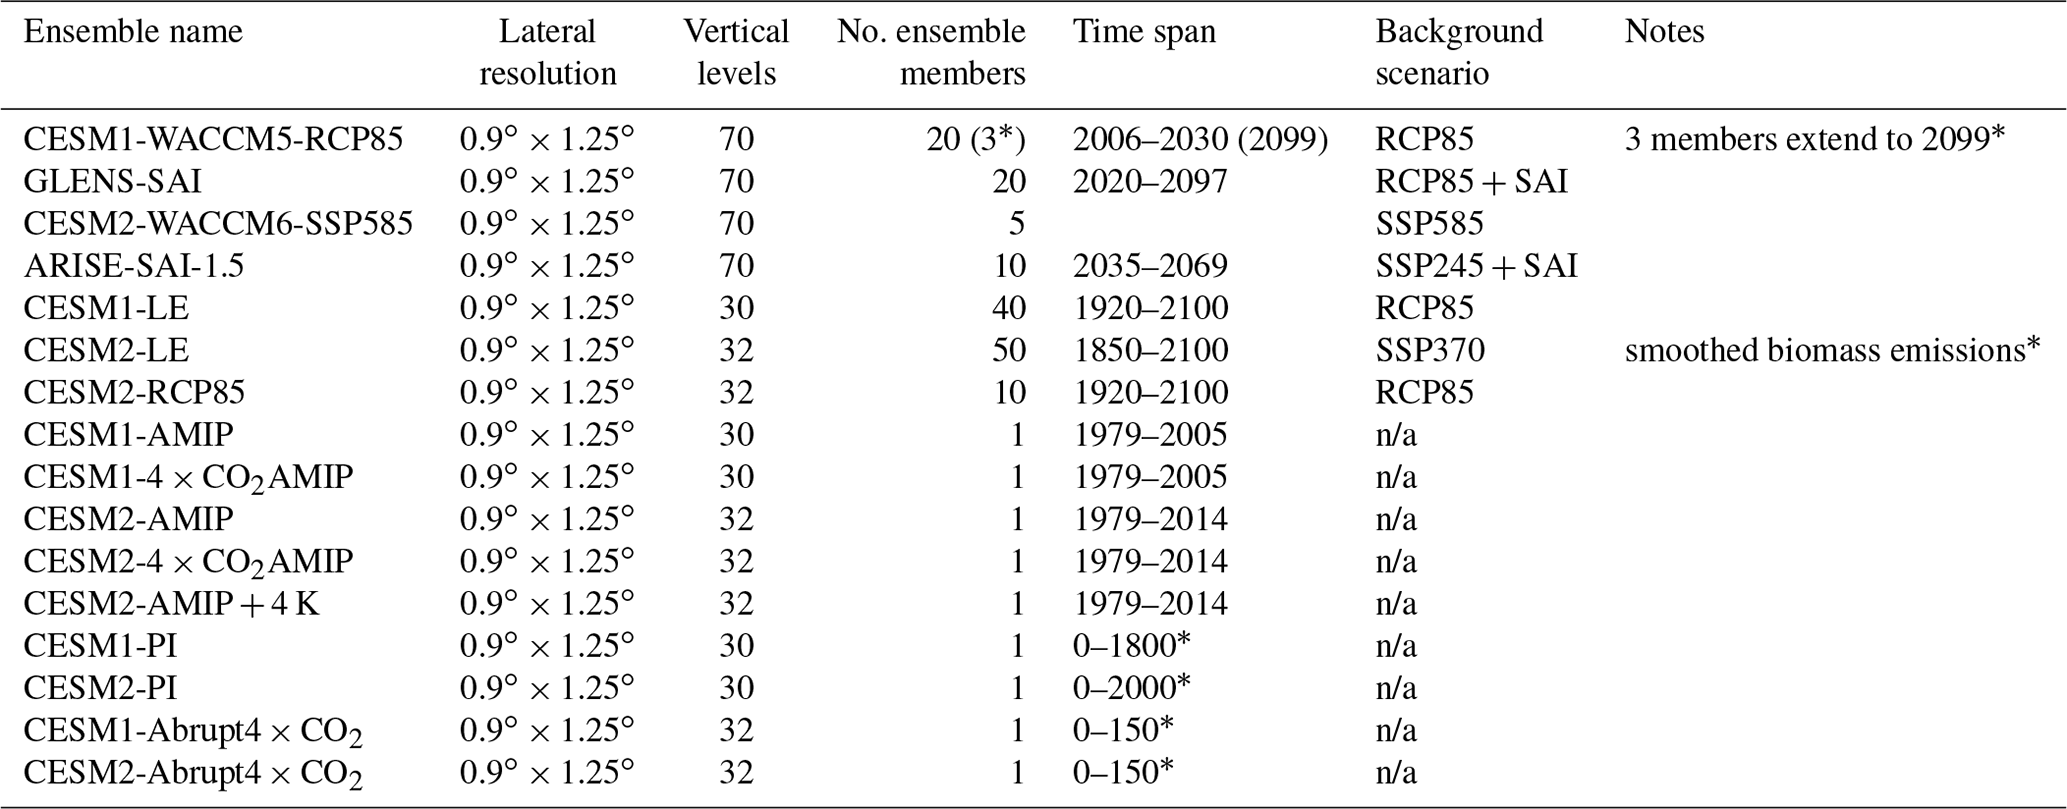
n/a stands for not applicable.
2.3 CESM2-WACCM6 simulations
As with GLENS, we use two sets of CESM2-WACCM6 experiments. The CESM2-WACCM6 baseline simulations used are from the Coupled Model Intercomparison Project version 6 (CMIP6, Eyring et al., 2016) and the Assessing Responses and Impacts of Solar Climate Intervention on the Earth System with Stratospheric Aerosol Injection project (ARISE-SAI, Richter et al., 2022). These include the unmitigated CMIP6 Shared Socioeconomic Pathway (SSP) background scenario SSP585 simulations, to allow for comparison with the RCP85 experiments in GLENS (Tilmes et al., 2020). The second experiment used is the SAI ensemble, with strategically placed sulfur dioxide injection to keep the global mean temperature at ∼1.5 ∘C above preindustrial temperatures (ARISE-SAI-1.5, Richter et al., 2022). These simulations extend from 2035 to 2069 and use the same controller algorithm and target metrics as GLENS-SAI but for the 2020–2039 time average in the unmitigated CESM2-WACCM6 baseline simulations, in contrast to GLENS-SAI where targets are based on the 2010–2030 period. Target metrics are successfully met in ARISE-SAI-1.5 to within 0.05 K over the period 2050 to 2070 (Richter et al., 2022). The injections are again at 15 and 30∘ in both hemispheres and at an arbitrarily chosen longitude of 180∘, as in GLENS-SAI, but occur lower in the stratosphere (approximately 21 km). The slight difference in injection height between GLENS-SAI and ARISE-SAI does not significantly impact their efficacy, however, as the shortwave optical depth of the stratosphere is small relative to the troposphere. Moreover, single point injections result in strong similarity in the latitudinal structure of aerosol optical depth between CESM1 (Tilmes et al., 2018) and CESM2 (Visioni et al., 2022), with circulation differences and lifetime effects contributing to slightly greater aerosol optical depths in GLENS (Visioni et al., 2022). ARISE-SAI-1.5 simulations use the moderate SSP scenario of SSP245 for its future background scenario (Burgess et al., 2021), a scenario where “the world follows a path in which social, economic, and technological trends do not shift markedly from historical patterns” (O'Neill et al., 2016). The temperature targets for ARISE-SAI-1.5 are based on the same regional metrics as used in GLENS-SAI and the simulations consist of a 10-member ensemble.
2.4 Additional simulations
To gain insight into the drivers of contrasts between the above SAI simulations, we use additional experiments. Below the stratosphere, CAM5 and CAM6 use physical representations of the climate system that are highly similar to their WACCM counterparts. Simulations using them therefore provide a means for inferring the tropospheric contribution to contrasts in our SAI experiments. For example, the ensemble-mean of the CESM1 and CESM2 large ensembles (LE) provides an estimate of the future forced response (to both warming and CO2 increases) by averaging across members and through internally driven variability. Simulations used here include the 40-member CESM1-LE (Kay et al., 2015) and 100-member CESM2-LE (Rodgers et al., 2021), and a 10-member ensemble of CESM2 that makes use of CMIP5 historical and RCP85 prescribed forcing agents (CESM2-RCP85, Forster et al., 2013). These large ensembles extend from 1850 to 2100, though for CESM1-LE and CESM2-RCP85, only a single member spans 1850–1920. The CESM2-LE uses SSP370 for its future background scenario, rather than the SSP245 used in ARISE or the SSP585 used in future CESM2-WACCM6 simulations, and these differences complicate direct comparisons, as discussed further below. SSP370 represents the medium to high end of plausible future pathways and represents a forcing level common to several unmitigated SSP baselines (Eyring et al., 2016).
To quantify rapid adjustments to CO2, those that occur in the absence of surface warming (e.g., Tilmes et al., 2013), idealized experiments using CESM1 and CESM2 are also used in which CO2 is quadruped in both fixed sea surface temperature (SST, 4×CO2AMIP) and coupled ocean (Abrupt4×CO2) frameworks. Conversely, slow responses to warming are those that ensue in response to surface warming when CO2 levels and other climate-forcing agents are fixed, and these are estimated from so-called AMIP + 4 K experiments, where uniform SST increases of 4 K are imposed on an AMIP background state. For these sensitivity experiments, the accompanying AMIP and pre-industrial coupled experiments are used to estimate “control” conditions. Together, these simulations allow for the estimation of both so-called rapid adjustments to CO2 and slow responses to warming, and these are found to provide important insight into contrasts between GLENS and ARISE. Rapid adjustments also exist for other climate forcings, such as aerosols, and in the stratosphere, these effects can be significant locally (Richter et al., 2017). On planetary scales, however, these have been shown to be generally small relative to the adjustment to CO2 (Andrews et al., 2009; Bala et al., 2010; Samset et al., 2016; Tilmes et al., 2013).
The yearly stratospheric aerosol mass injections specified in GLENS-SAI and ARISE-SAI-1.5 are shown in Fig. 1, where we examine the common period of 2035 to 2069 (Table 1). The greater total emissions in GLENS-SAI than in ARISE-SAI-1.5 are expected, as they correspond to greater total offset CO2 concentrations. However, less expected is the large disparity in the latitudinal distribution of injections, with most of the GLENS-SAI aerosols injected at 30∘ N and 30∘ S, with modest injection amounts occurring at 15∘ N and negligible injection mass at 15∘ S. This contrasts starkly with ARISE-SAI-1.5, where injections occur overwhelmingly at 15∘ S, with much smaller injection amounts at 15∘ N and 30∘ S, and negligible injection mass at 30∘ N. These relative proportions and their contrasts are approximately constant over time from 2035 to 2069, suggesting that they are relatively insensitive to both the associated total avoided warming and the control period used for climate targets. Rather the persistence of the distributions over time suggests the possibility of an intrinsic contrast in the climate responses between the two ensembles.
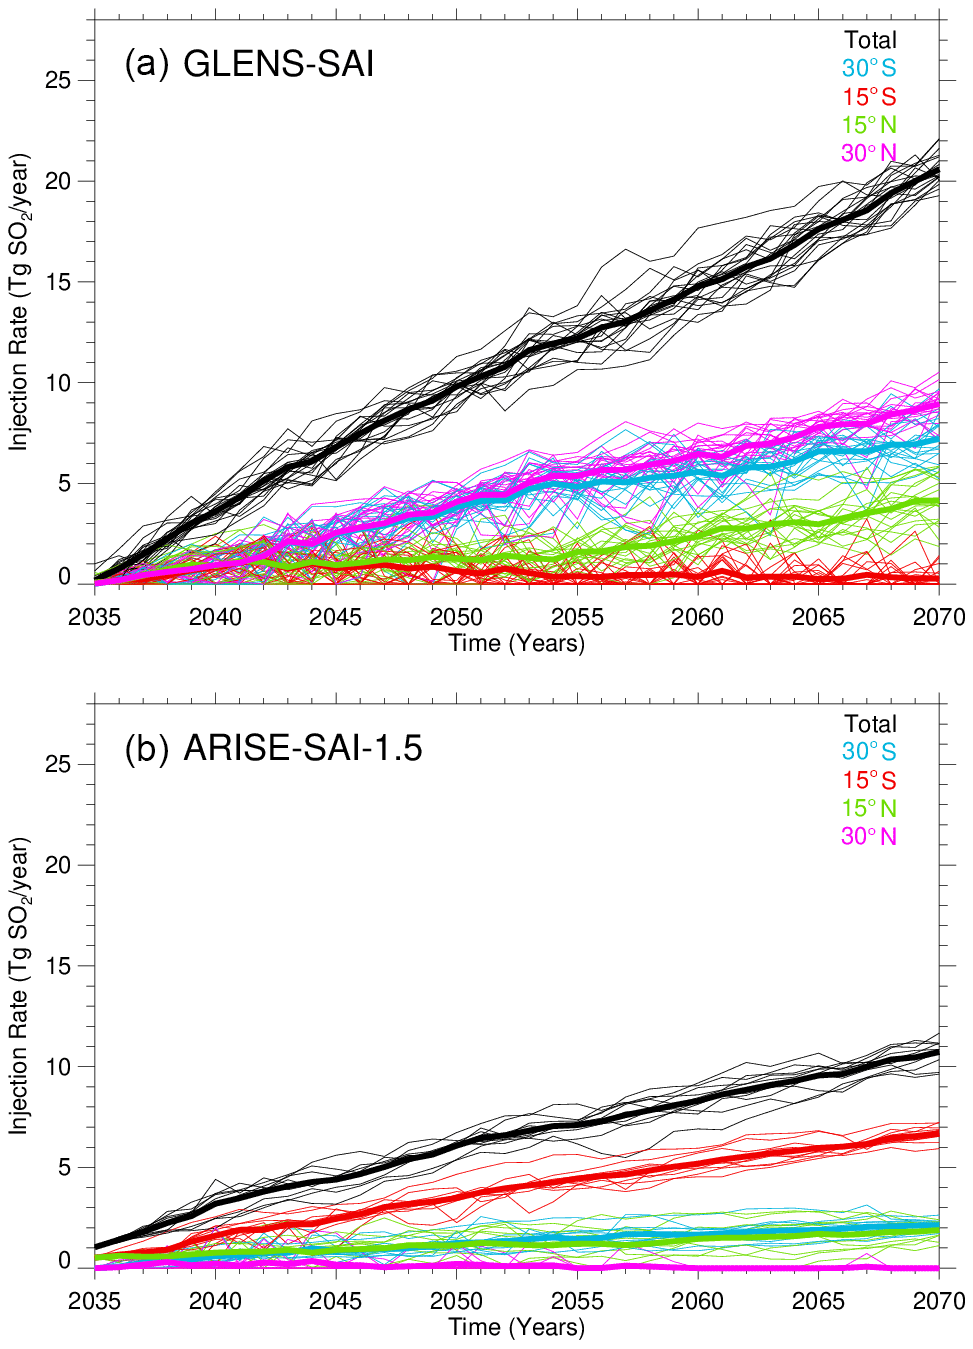
Figure 1Evolution of yearly sulfur dioxide injections (Tg SO2 yr−1) over time at the four injection latitudes for (a) GLENS-SAI and (b) ARISE-SAI-1.5 from 2035 to 2070.
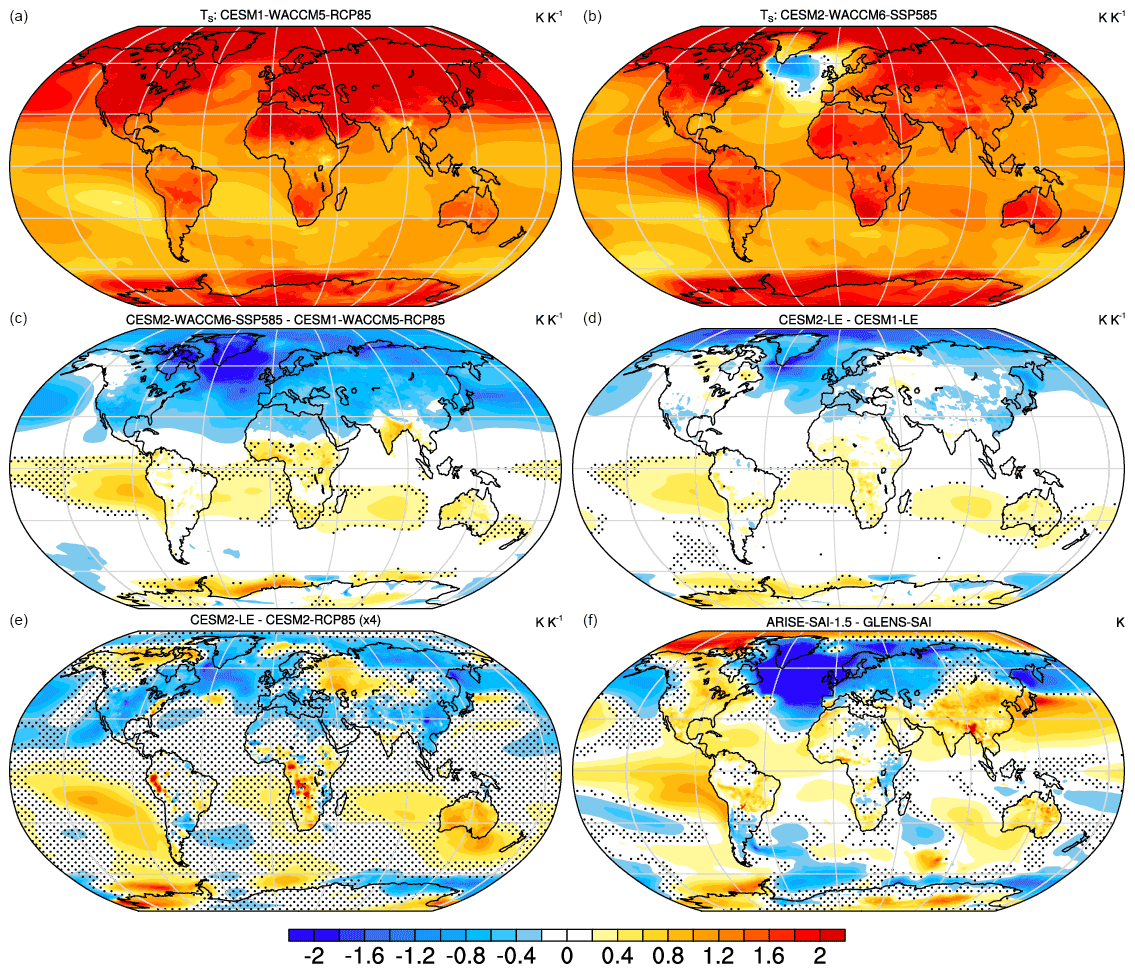
Figure 2Normalized response in near-surface air temperature (TS) estimated from the change between 2020–2039 and 2050–2069 per degree global warming for unmitigated (a) CESM1-WACCM5-RCP85 and (b) CESM2-WACCM6-SSP585 simulations, and (c) their difference (a minus b). Also shown is (d) the analogous difference for CESM1-LE and CESM2-LE and (e) CESM2-RCP85 and CESM2-LE (multiplied by 4 for clarity using a single color bar). The difference between the geoengineered climate states in ARISE-SAI-1.5 and GLENS-SAI is shown in panel (f). Units for all panels are K K−1, except in panel (f) where units are K, and stippled regions indicate differences that are less than twice the ensemble standard error.
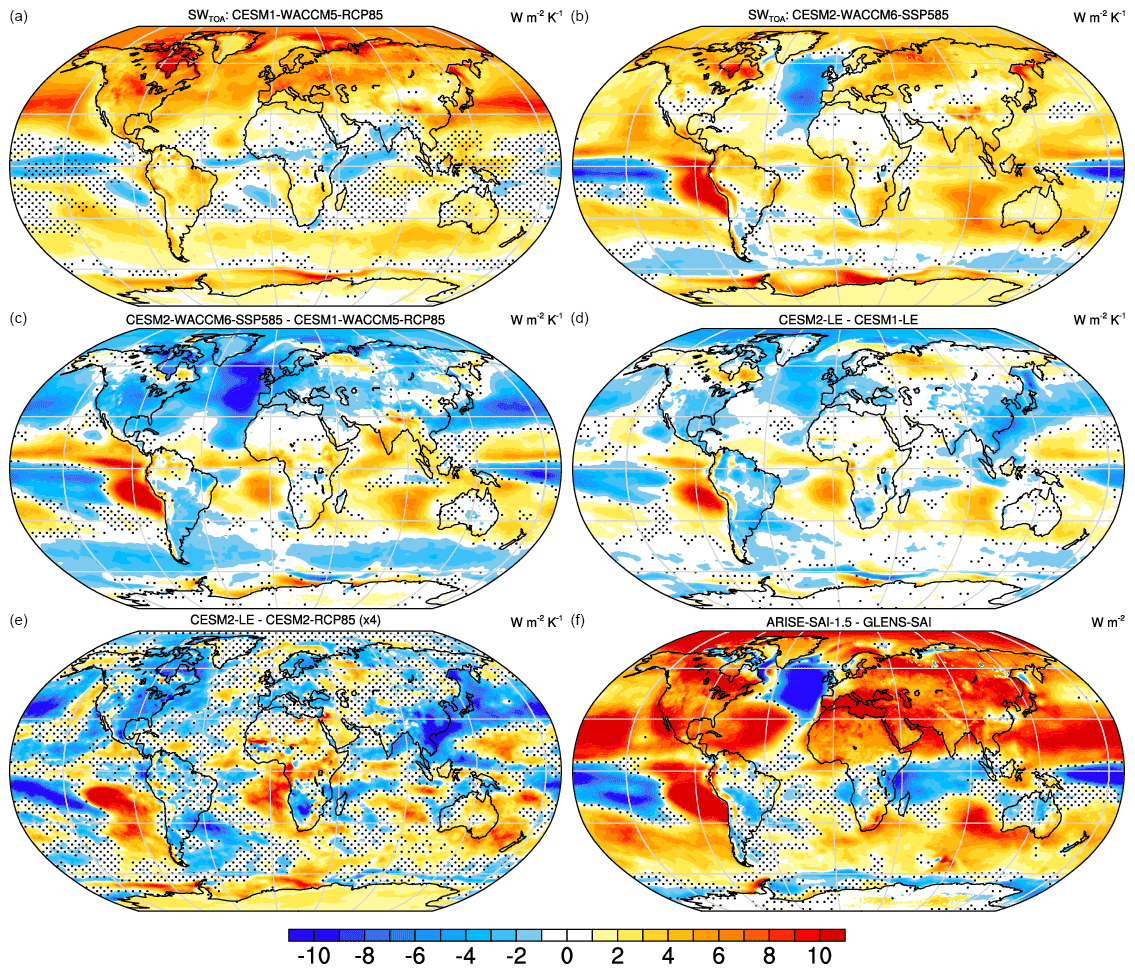
Figure 3Normalized response in net absorbed top-of-atmosphere shortwave radiation (SWTOA) estimated from the change between 2020–2039 and 2050–2069 per degree global warming for unmitigated (a) CESM1-WACCM5-RCP85 and (b) CESM2-WACCM6-SSP585 simulations, and (c) their difference (a minus b). Also shown is (d) the analogous difference for CESM1-LE and CESM2-LE and (e) CESM2-RCP85 and CESM2-LE (multiplied by 4). The difference between the geoengineered climate states in ARISE-SAI-1.5 and GLENS-SAI is shown in panel (f). Units for all panels are W m−2 K−1, except in panel (f) where units are W m−2, and stippled regions indicate differences that are less than twice the ensemble standard error.
To explore the processes that may underlie the contrasts in Fig. 1, the normalized structure of warming in a range of additional simulations is examined in Fig. 2. Normalized warming patterns from 2020–2039 and 2050–2069 in the associated unmitigated simulations (i.e., CESM1-WACCM5-RCP85 and CESM2-WACCM6-SSP585) show various features expected under anthropogenic climate change such as greater warming over land and in polar regions (Fig. 2a and b). Differences between the experiments are also clear, particularly in the NH extratropics, where warming is stronger in CESM1-WACCM5-RCP85 and a strong cooling in the North Atlantic (NATL) is evident in CESM2-WACCM6-SSP585. Differencing the normalized warming patterns (Fig. 2c) highlights systematically weaker warming in the NH in CESM2-WACCM6-SSP585 and stronger warming in the Southern Hemisphere (SH) subtropics, particularly in the subtropical stratocumulus cloud deck regions in the eastern ocean basins. The associated contrasts in the hemispheric gradients are 1.1±0.1 K (Fig. 2a) and K (Fig. 2b). When the analogous difference is computed between CESM1-LE and CESM2-LE (Fig. 2d), a similar overall pattern emerges, albeit with slightly weaker magnitudes in the extratropical NH and SH. The strong similarities of patterns in Fig. 2c and d suggest a potentially dominant contribution from tropospheric physics in CAM5 and CAM6, which are shared by their WACCM counterparts. The existence of differences between Fig. 2c and d suggests a potential role for both WACCM physics and background scenario contrasts between the ensembles. The role of background scenario can be estimated by examining differences between CESM2-RCP85 and CESM2-LE (Fig. 2e; note the scaling used). The persisting negative differences in the NH and positive differences in the SH subtropics suggest that the contrasts between SSP370, which is the future background scenario used for CESM2-LE (Fig. 2d), and RCP85 contribute to the pattern in Fig. 2d but are not the dominant contributor to it. Given this, potential contributors to the pattern are explored further below. Various features of the unmitigated warming contrast between CESM1-WACCM5-RCP85 and CESM2-WACCM6-SSP585 (Fig. 2c) are shared by the differences in SAI regional warming patterns (Fig. 2f), such as the elevated warming in the southern subtropics, and the relative cooling in the NATL and NH subpolar regions in ARISE-SAI-1.5 relative to GLENS-SAI. The existence of the patterns in the differences of both ensembles suggests that these features may be intrinsic model responses.
To further explore the origin of model responses, changes in top-of-atmosphere (TOA) absorbed solar radiation (SWTOA) are assessed and found to be strongly tied to patterns of warming. In unmitigated CESM1-WACCM5-RCP85 and CESM2-WACCM6-SSP585 simulations (Fig. 3a and b), normalized increases in SWTOA are widespread, consistent with 21st century climate projections generally (Trenberth and Fasullo, 2009). However, the inter-model difference (Fig. 3c) shows a strong spatial correlation with contrasting patterns of warming (Fig. 2c), as stronger SH subtropical warming in CESM1-WACCM5-RCP85 is accompanied by disproportionate SWTOA increases while enhanced NATL cooling is coincident with SWTOA decreases. The associated contrasts in the hemispheric gradients are 2.4±1.0 W m−2 (Fig. 2a) and W m−2 (Fig. 2b). When normalized patterns in CESM1-LE and CESM2-LE are compared (Fig. 3d), a similar general pattern of SWTOA differences exists, albeit slightly weaker, again suggesting the patterns to be an intrinsic feature of CAM5 and CAM6, with a potential secondary contribution from WACCM or background scenario contrasts. When CESM2-LE is compared to CESM2-RCP85, a similar but weaker pattern of differences is evident (Fig. 3e; note the scaling used), suggesting a modest but detectible role for the background scenario in driving contrasts between the simulations. Unlike the temperature response under SAI, the difference pattern of SWTOA change between ARISE-SAI-1.5 and GLENS-SAI is not strongly correlated with that of the unmitigated simulations and instead largely reflects the combined and complex influence of changes in clouds and SAI (Fig. 3f).
Various additional analyses provide important background for interpreting contrasts in our SAI experiments. In Fig. 3, a focus on changes in patterns of SWTOA is motivated by their dominant contribution to the overall pattern of net TOA flux (Fig. A1). While changes in outgoing longwave radiation exist (Fig. A2), these can generally be viewed as responding to differences in warming rather than driving them, as they are positively correlated to temperature anomalies and thus offset, in many cases, changes in SWTOA. Understanding the origin of spatial patterns and interhemispheric SWTOA gradients in unmitigated simulations is therefore critical to anticipating the latitudinal distribution of injection amounts under SAI.
3.1 Rapid adjustments
In this context, the 4×CO2AMIP and Abrupt4×CO2 simulations provide important insight, as they demonstrate that responses in shortwave radiation and clouds to elevated levels of CO2 (i.e., rapid adjustments) also differ considerably between CESM1 and CESM2 in a way that is consistent with the need for greater NH mitigation in the GLENS-SAI experiment. For example, in CESM1 there is a strong hemispheric gradient in SWTOA rapid adjustments (Fig. 4), such that the NH absorbs 2.4 W m−2 more energy than the SH in response to a CO2 quadrupling. In contrast, in CESM2 the response is relatively symmetric between hemispheres, with an imbalance of only 0.4 W m−2 and with strong warming contributions evident in the SH subtropics, as also identified as being key in Figs. 2 and 3. These experiments therefore show that rapid adjustments are likely an important contributor to the patterns in unmitigated simulations and to injection mass contrasts between GLENS-SAI and ARISE-SAI-1.5, as CO2 levels continue to increase in these simulations. Moreover, the radiation contrasts can be linked to rapid adjustments in clouds, with reductions in cloud amount in the SH subtropics being closely tied to associated increases in SWTOA. Hemispheric contrasts in the slow responses to warming also contrast between models, with the pattern in CESM1 being hemispherically asymmetric and offsetting rapid adjustments, and the pattern in CESM2 being approximately symmetric (Fig. A4). Under SAI, however, where temperature changes are mitigated, the offsetting effects of slow responses are reduced. While regional features are more difficult to interpret in fully coupled simulations due to the presence of coupled internal variability, it is noteworthy that disproportionate SWTOA increases in the NH also emerge in the early years of Abrupt4×CO2 experiments and that these are sustained for several decades. Together, these findings highlight the need to understand the sensitivity of the climate response directly to CO2, and particularly rapid adjustments, if uncertainties in the implementation of SAI are to be reduced.
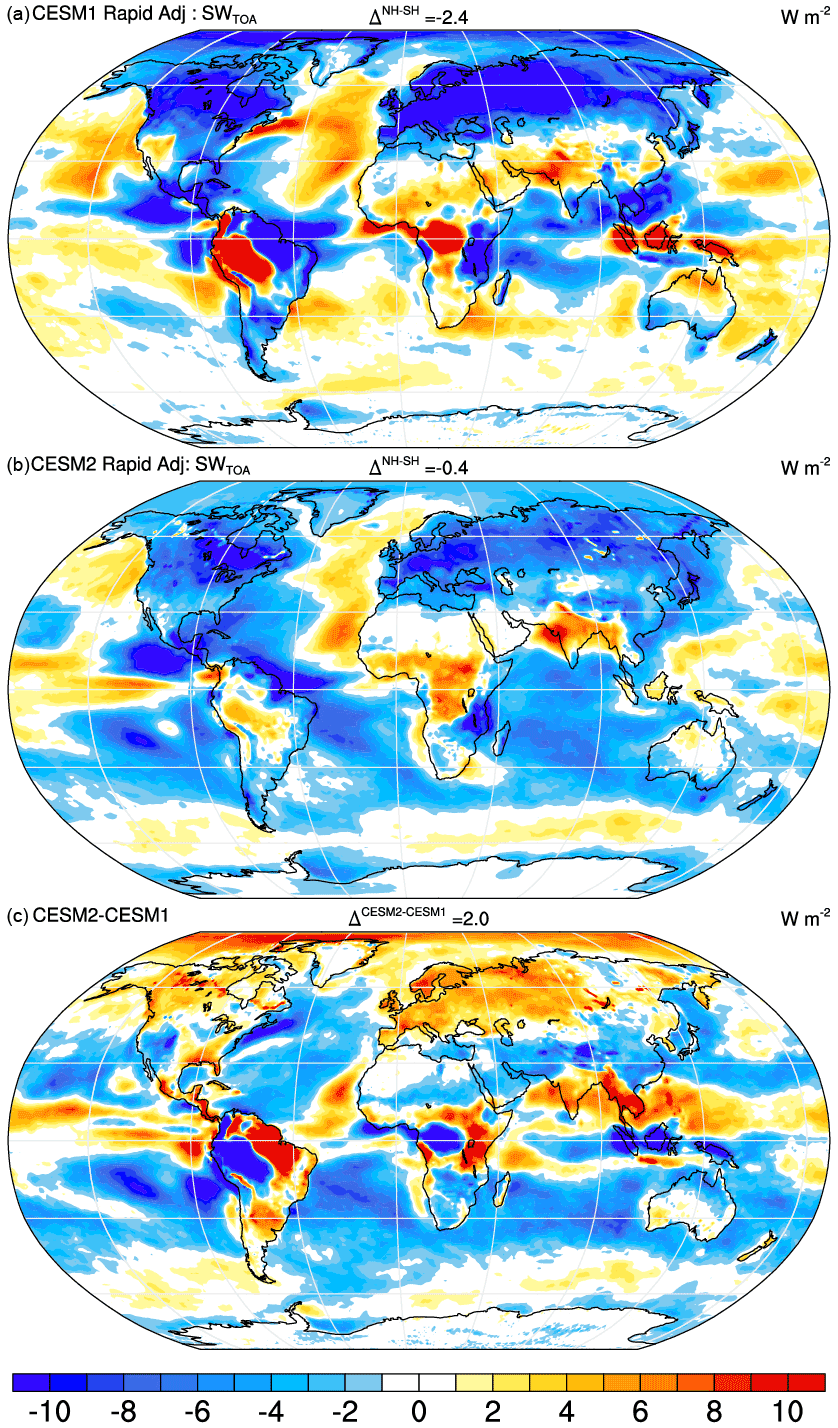
Figure 4Estimates of the rapid adjustment of TOA net absorbed SW flux to CO2 for CESM1 (a), CESM2 (b), and their difference (c) based on estimates from 4×CO2AMIP and AMIP simulations. Differences in the hemispheric means are shown in panel titles. All units are W m−2.
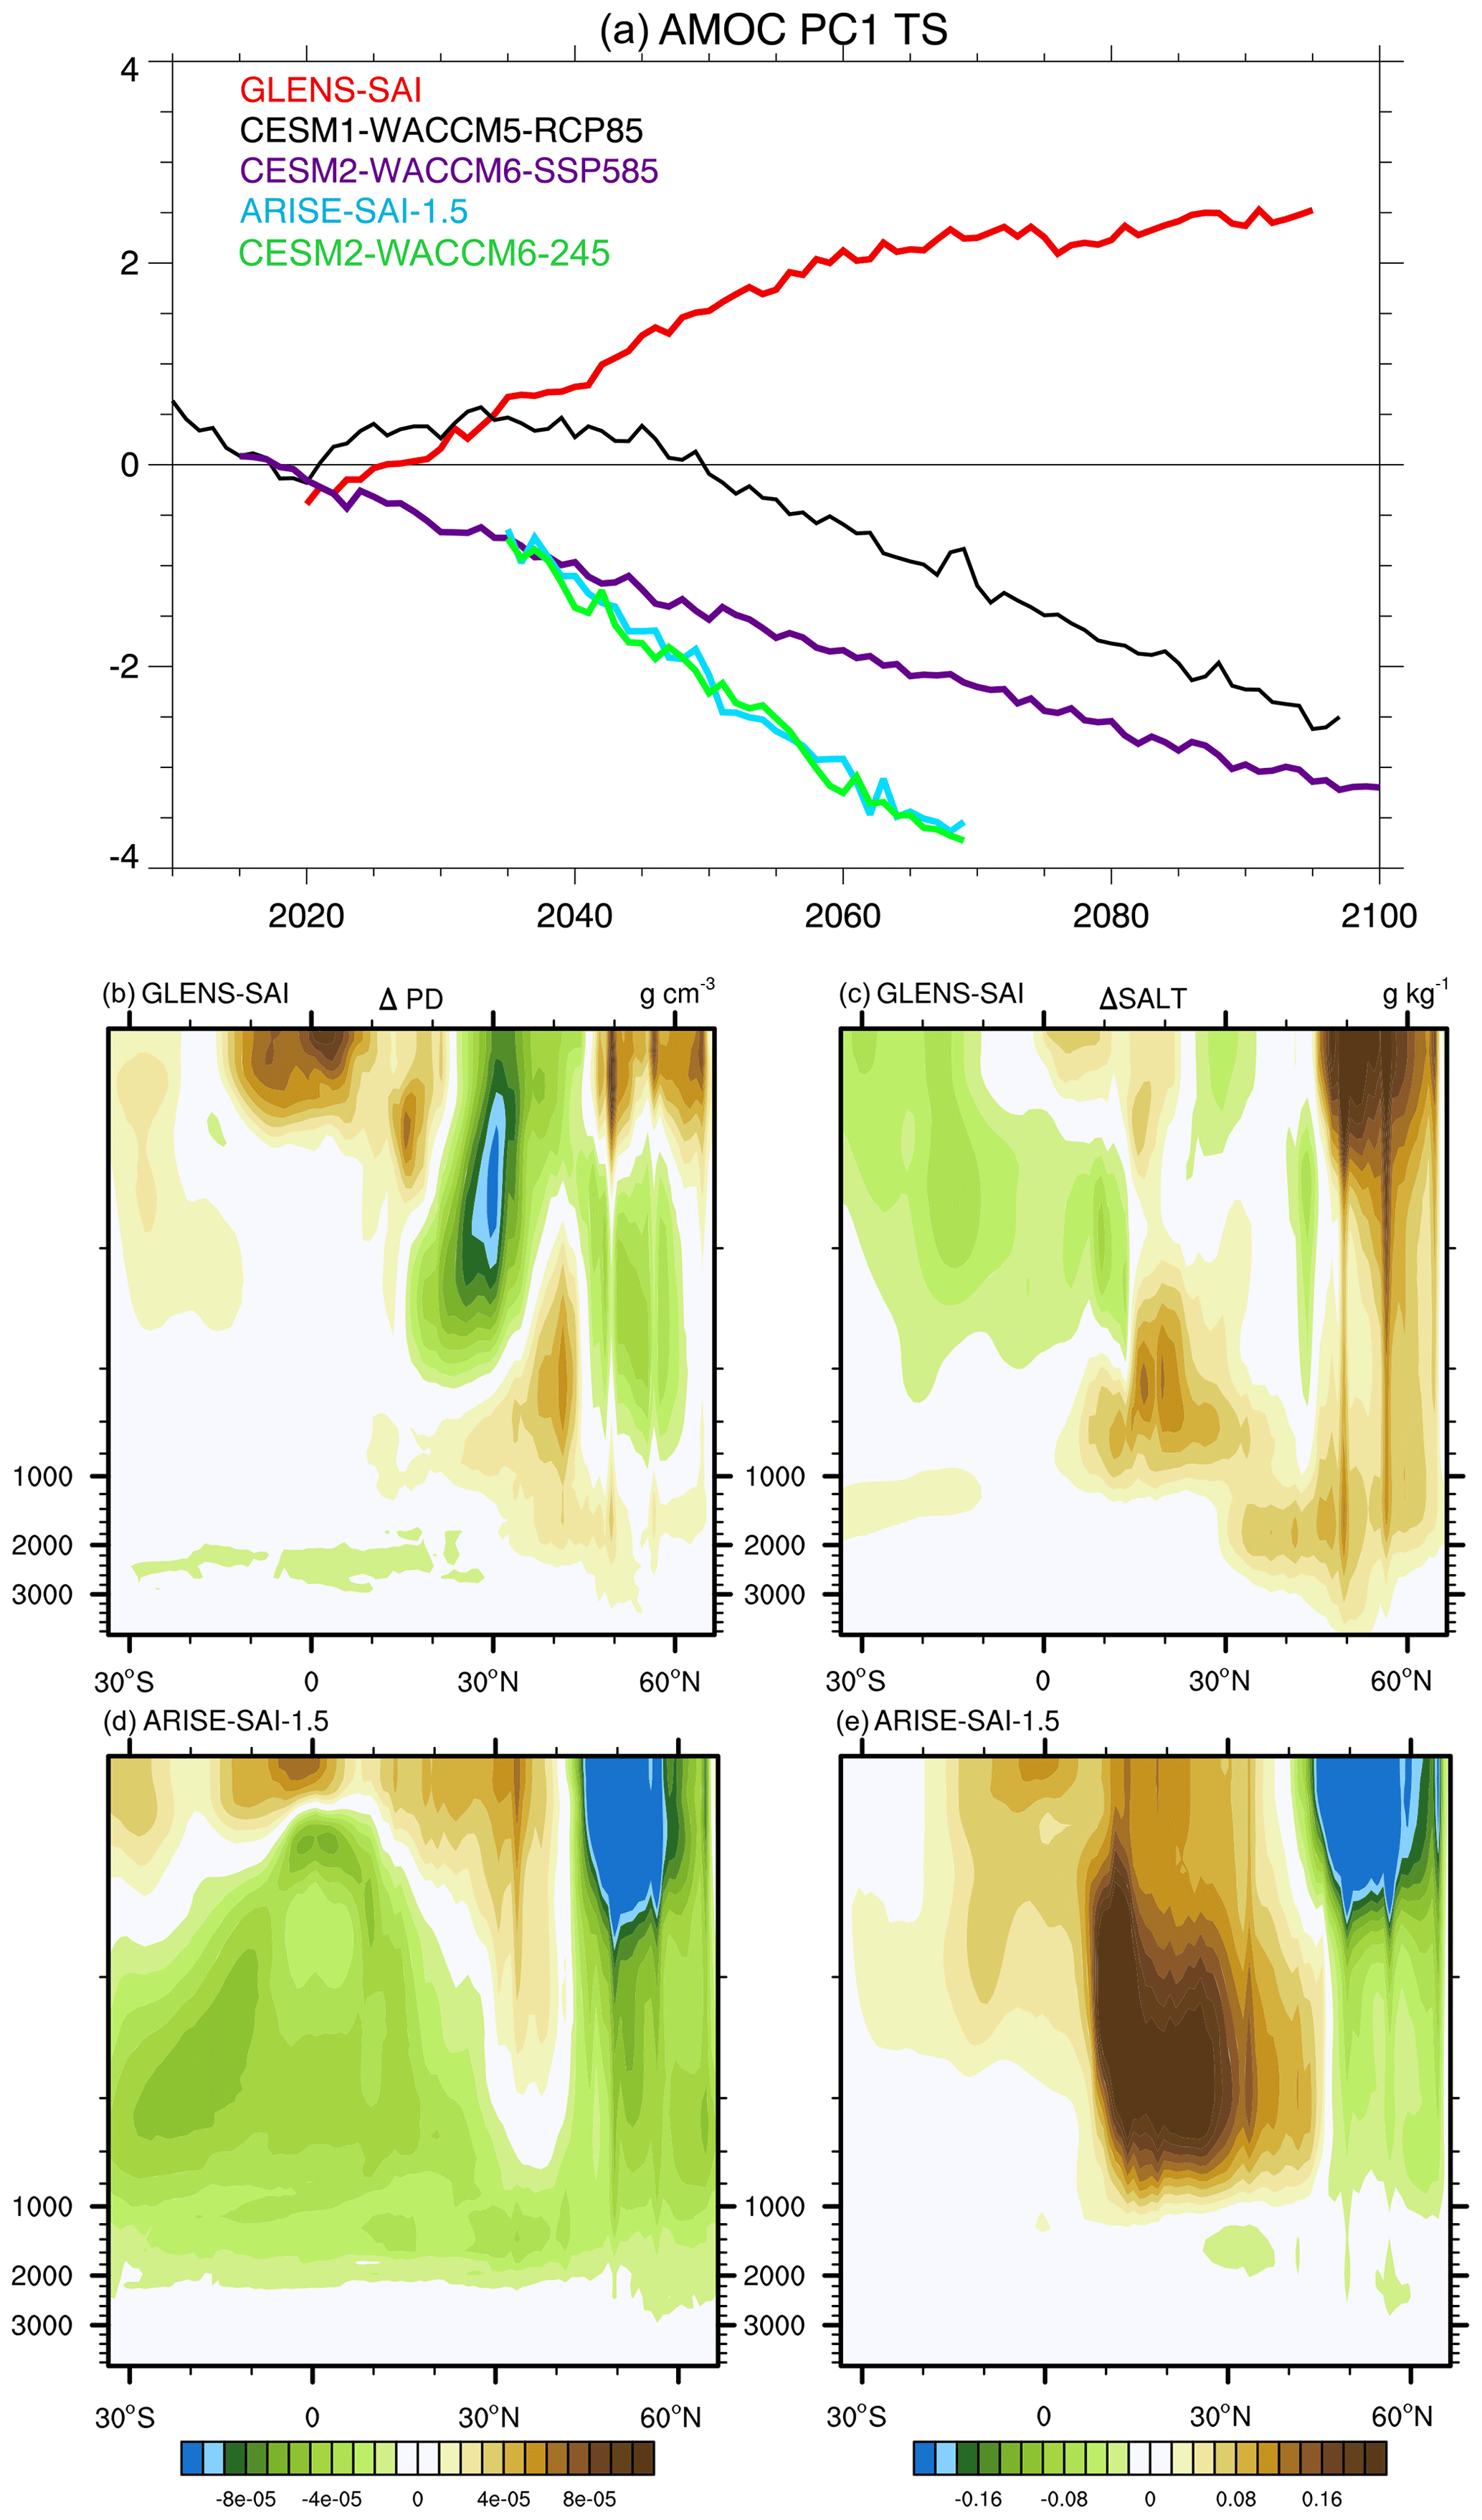
Figure 5(a) Changes in the normalized leading principal component of the Atlantic meridional overturning circulation, which is unitless, in unmitigated (CESM1-WACCM5-RCP85, CESM2-WACCM6-SSP245, CESM2-WACCM6-SSP585) and mitigated (GLENS-SAI, ARISE-SAI-1.5) experiments. Also shown are changes between 2020–2039 and 2050–2069 in the latitude-depth structure in the Atlantic Ocean of ocean potential density (PD; b, d; units of g cm−3) and salinity (SALT; c, e; units of g kg−1) for GLENS-SAI (b, c) and ARISE-SAI-1.5 (d, e), respectively.
3.2 Response in the Atlantic meridional overturning circulation
Contrasting warming patterns in the Atlantic Ocean are also suggestive of the involvement of an additional important component of the energy budget, the Atlantic meridional overturning circulation (AMOC), which transports heat northward in the Atlantic and redistributes ocean mass, nutrients, salinity, and energy globally (Zhang et al., 2019). Differences between the response in AMOC in our experiments are explored in Fig. 5, where the normalized changes in the leading principal component of the ocean overturning circulation are shown along with changes in the ocean's potential density and salinity structures. Changes in the strength of the leading mode of AMOC (Fig. 5a) contrast considerably across the experiments. In GLENS-SAI, the intensity of AMOC increases and this drives an associated enhanced northward transport of heat into the NATL (Fasullo et al., 2018). The strengthening contrasts, however, with all other simulations considered here (Fig. 5a) and with unmitigated climate projections generally (Zhang et al., 2019; Xie et al., 2022), where AMOC typically weakens during the 21st century. Unlike the significant strengthening effect that SAI has on AMOC strength in CESM1, a consistent weakening is evident between ARISE-SAI-1.5 and the unmitigated CESM1-WACCM5-RCP85, CESM2-WACCM-SSP245, and CESM2-WACCM-SSP585 experiments. In fact, greater weakening is simulated in CESM2-WACCM-SSP245 than in CESM2-WACCM-SSP585, highlighting the lack of a simple scaling between temperature changes and AMOC. Changes in the leading principal component of the AMOC also do not provide information on the spatial structure of change. To estimate the spatial structure of trends, changes in AMOC PC1 can be used to scale the leading EOF pattern and these fields are shown in Fig. A6. The trends confirm a large-scale strengthening of AMOC in GLENS-SAI and weakening in ARISE-SAI-1.5 rather than a mere spatial displacement of the circulation, which can potentially also project onto PC1. A key driver of AMOC's leading mode and a potential driver of AMOC differences across experiments is deep water formation in the NATL, and in this region, simulation of ocean density and salinity also differ substantially between the various experiments. In GLENS-SAI, the subpolar NATL becomes denser and more saline (Fig. 5b and c), while the subtropical north Atlantic Ocean becomes less dense. These changes accompany increases in evaporation and a net negative surface freshwater flux, which enhances salinity and density (Fasullo et al., 2018). In ARISE-SAI-1.5 the situation is reversed, with the subpolar NATL becoming substantially less dense and fresher, with associated reductions in evaporation (not shown). In ARISE-SAI-1.5, density reductions are evident in the Atlantic at all latitudes below 200 to 500 m due to warming (not shown) and salinity increases are evident south of 40∘ N, patterns that contrast markedly with GLENS-SAI. Causal connections between salinity, density, and AMOC intensity can be complex, however, and are discussed further below.
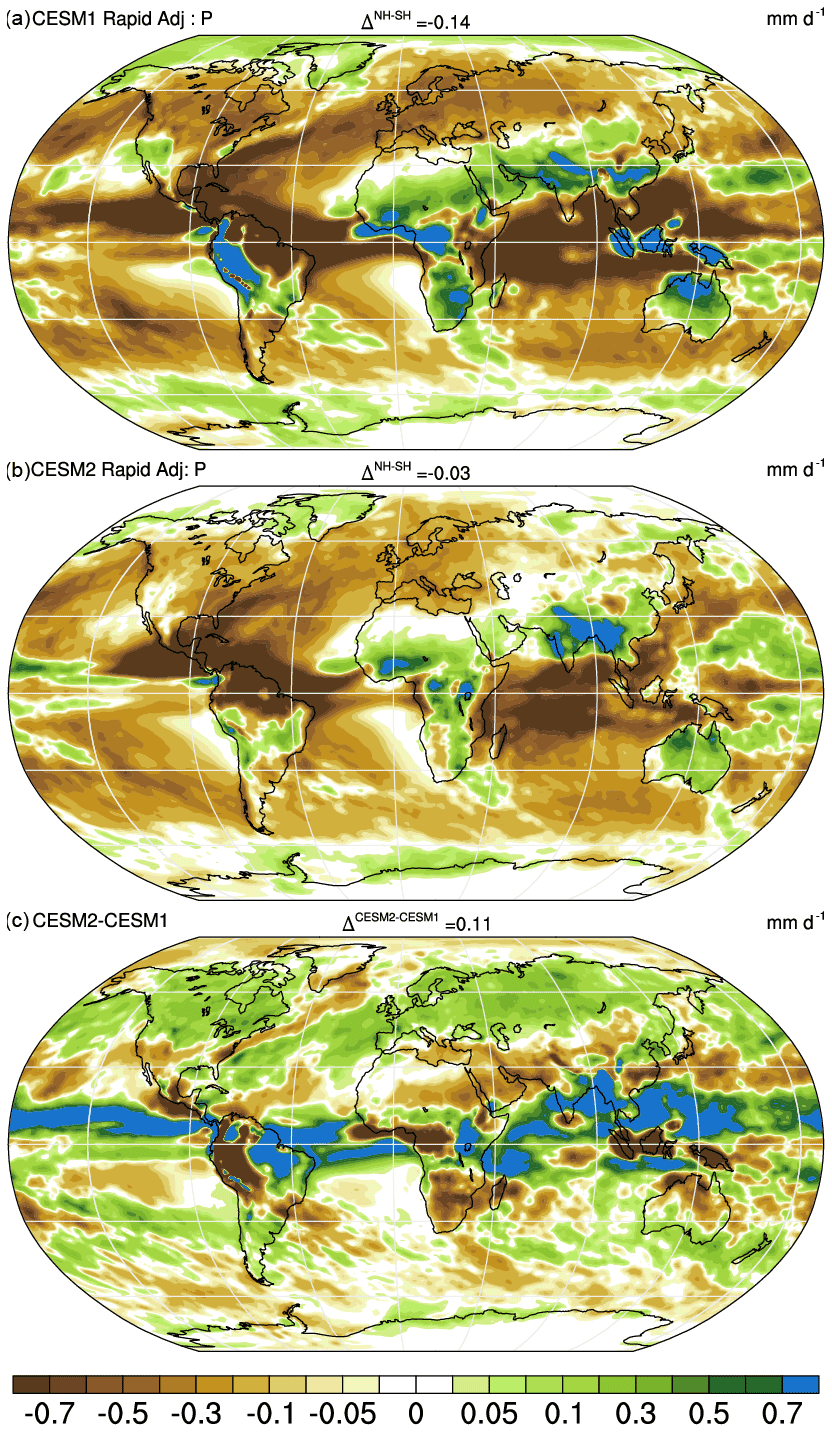
Figure 6The rapid adjustment of total precipitation to CO2 quadrupling for CESM1 (a), CESM2 (b), and their difference (c) based on estimates from 4×CO2AMIP and AMIP simulations. Differences in the hemispheric means are shown in panel titles. All units are mm d−1.
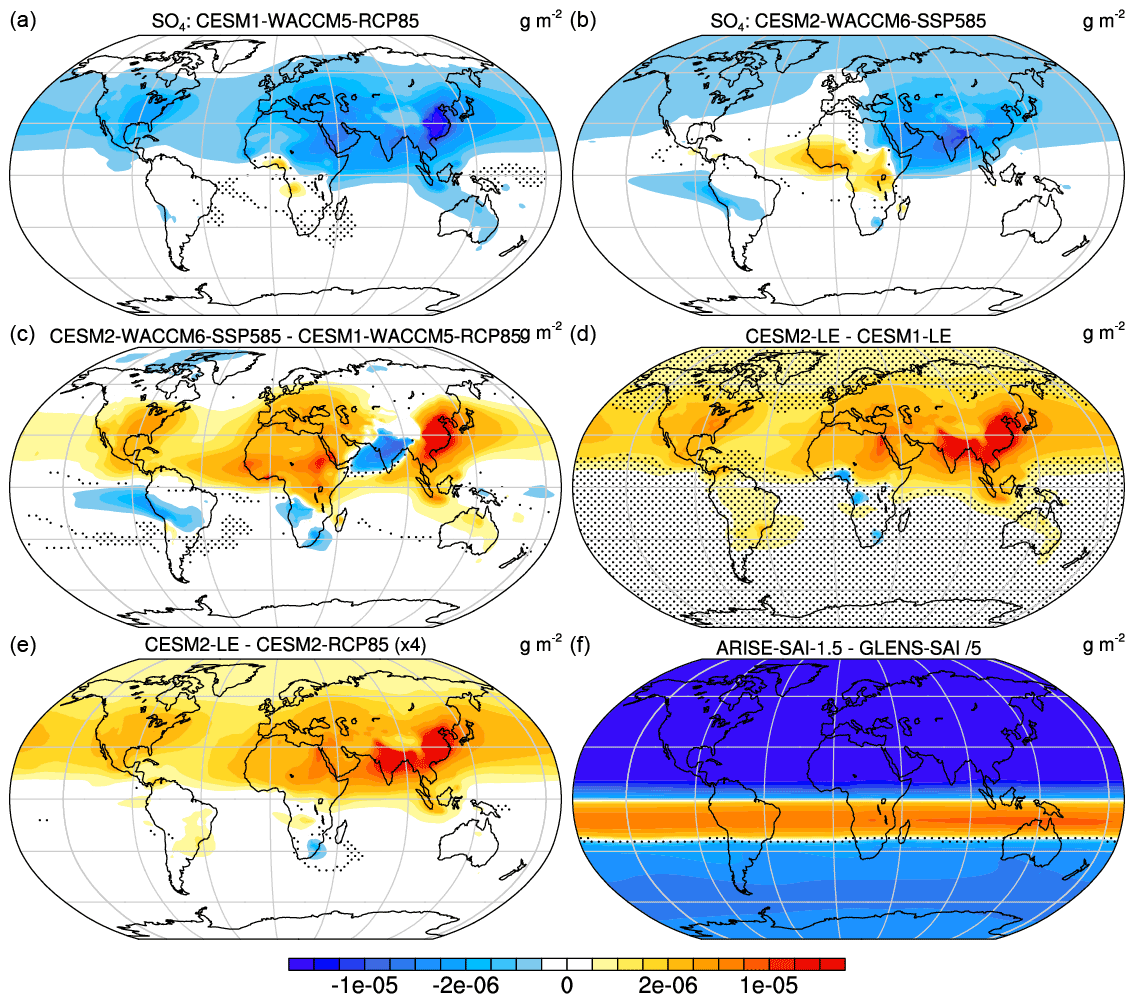
Figure 7Absolute change in sulfate aerosol burdens (SO4) estimated from the difference between 2020–2039 and 2050–2069 for unmitigated (a) CESM1-WACCM5-RCP85 and (b) CESM2-WACCM6-SSP585 simulations, and (c) their difference (a minus b). Also shown is (d) the analogous difference for CESM1-LE and CESM2-LE and (e) CESM2-RCP85 and CESM2-LE. The difference between the geoengineered climate states in ARISE-SAI-1.5 and GLENS-SAI is shown in panel (f). Units for all panels are g m−2 and stippled regions indicate differences that are less than twice the ensemble standard error. The difference field in panel (f) is scaled by th.
The sensitivity of AMOC to CO2 and SAI also exists as a key uncertainty. Diagnosing individual drivers of AMOC in fully coupled simulations is extremely challenging given the diversity of thermal, saline, and dynamical processes that drive its changes (Zhang et al., 2019) and achieving a full understanding of contrasts between GLENS-SAI and ARISE-SAI-1.5 is left for future work. However, various changes are simulated that are consistent with having an influence and these include the modulation of salinity and density in the NATL (Zhang et al., 2022), as in ARISE-SAI-1.5, a widespread freshening and decrease in density are simulated, in contrast to salinity and density increases simulated in GLENS-SAI (Fig. A7). A similar salinity contrast is also simulated in future unmitigated simulations using CESM2-WACCM-SSP585 and CESM1-WACCM5-RCP85, and in CESM2-LE and CESM1-LE, suggesting that the contrast is intrinsic, at least in part, to CAM5 and CAM6 structural contrasts (Fig. A7). This possibility is supported further by rapid adjustments in precipitation to CO2, as CESM2 simulates systematically weaker reductions in precipitation in the northern extratropics than does CESM1 (Fig. 6), both over the Atlantic Ocean and over much of northern extratropical land, where river discharge influences ocean salinity. While neither model simulates changes in rainfall that on their own would weaken AMOC, the potential for negative surface freshwater contributions to offset the elevated buoyancy driven by warming is suggested to differ considerably. More precise attribution of AMOC changes and their contrasts between experiments likely requires additional targeted experiments; the results here point to a potentially important role for rapid adjustments in the water cycle.
3.3 Background scenario anthropogenic aerosol burdens
Lastly, a role for the future background scenario in influencing the latitudinal distribution of SAI injection mass is suggested by the differences between CESM2-LE and CESM2-RCP85 warming and radiation patterns, given the stronger NH warming and SWTOA increases east of important sulfate emission regions in Asia in simulations using RCP85 (negative differences in Figs. 2e, 3e, A1e, and A2e). This hypothesis can be explored by examining changes in atmospheric sulfate burdens (Fig. 7), which differ significantly through the 2030–2070 period between the experiments used. As discussed previously, comparison across these experiments is complicated by the differences in the scenarios used in each. However, the fact that differences in the sulfate distributions across experiments are both significant and correspond directly to simulated features in radiation and temperature suggests a role as a mediating effect on SAI experiments. In general, simulations that use RCP85 emissions show stronger reductions in burdens than those that use SSP370 (Fig. 7d and e) or SSP585 (Fig. 7c). Given the strong cooling associated with the burdens via their impact on clouds, these differences constitute an anomalous NH warming contribution in the 21st century for RCP85-based experiments (Fig. 7c–e) that thus requires additional NH mitigation (Fig. 7f).
The analysis of our climate intervention and complementary experiments highlights a fundamental and perhaps underappreciated contributor to uncertainties surrounding SAI, namely the rapid adjustments of the climate system to CO2. Such adjustments include both the responses of patterns in cloud fields, which drive radiation contrasts between hemispheres, and precipitation (Fig. A8), which can influence upper ocean salinity, density, and associated ocean circulations and energy flows. As shown here, the simulation of rapid adjustments can vary considerably across models and understanding these inter-model discrepancies is thus critical to better constrain the design parameters of SAI if implemented in nature. Uncertainties in background scenarios must also be reduced to winnow the spread across SAI simulations, and progress along this front has been made in recent years with the identification of biases in prescribed CMIP6 emissions (e.g., Paulot et al., 2018; Wang et al., 2021). However, the climate response uncertainty associated with prescribed sulfate emissions is magnified by the broad range with which aerosol indirect effects on clouds are represented across climate models. The inference from the SAI simulations explored here is that given the target metrics employed, the latitude of SAI injections will depend explicitly on the ambient anthropogenic emissions of sulfate aerosols. Formulation of an SAI strategy should therefore be accompanied by well-defined industrial emissions targets. The choice of climate stabilization goals is itself subjective and if the SAI strategy in GLENS and ARISE had been guided by a different set of metrics, such as, for example, simply by the global mean temperature, the uncertainty in injection mass by latitude would likely not have been as striking as that shown in Fig. 1.
There are also important limits on the results shown here. First, they are based on model versions from a single climate modeling center, and in many respects these models share physics central to the representation of SAI. A broader consideration of structural model uncertainty is therefore warranted, and it is likely that key sources of uncertainty, such as cloud–aerosol interactions, are not well estimated in contrasts between our experiments. A need therefore exists for a broader multi-model effort to realistically depict SAI and its uncertainties and to coordinate associated model development efforts. A vast majority of climate models currently cannot represent the diversity of associated processes and fields simulated in WACCM. Observational efforts to monitor relevant fields and guide model development activities are also crucial if the inherent risks and uncertainties of SAI are to be fully understood and quantified.
These supporting figures provide further insight into the radiative responses in unmitigated warming scenarios in CESM1-WACCM5-RCP85 and CESM2-WACCM6-SSP585, CESM1-LE and CESM2-LE, CESM2-RCP85, and the target geoengineered climate state in GLENS-SAI and ARISE-SAI-1.5. They also document rapid adjustments to CO2 of clouds and radiation in CESM1 and CESM2 based on idealized 4×CO2AMIP and abrupt4×CO2 coupled simulations differences with AMIP and pre-industrial control simulations (see Table 1 of the main text). These figures thus provide key context for the interpretation of SAI uncertainties provided in the main text discussion.
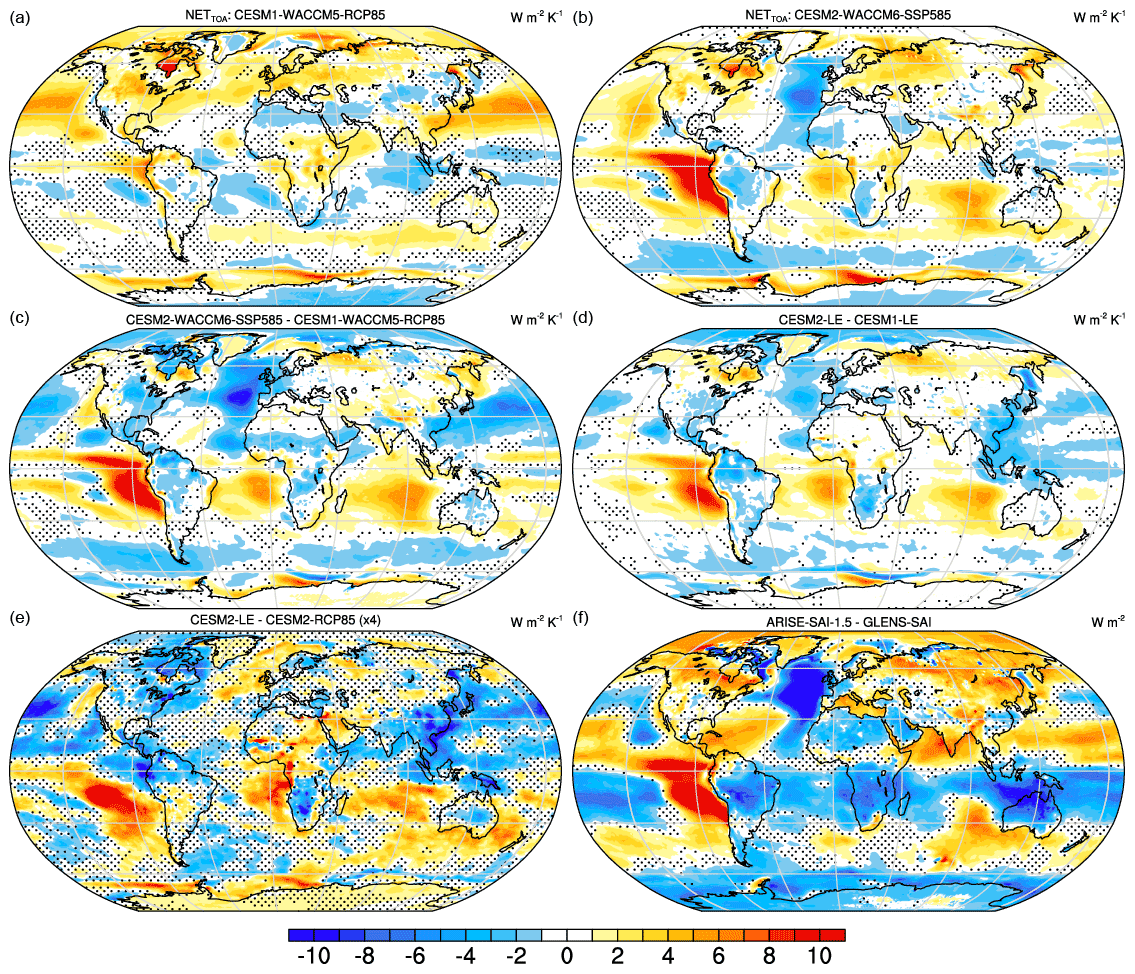
Figure A1Normalized response in net incoming top-of-atmosphere radiative flux (RTMT) estimated from the change between 2020–2039 and 2050–2069 per degree global warming for unmitigated (a) CESM1-WACCM5-RCP85 and (b) CESM2-WACCM6-SSP585 simulations, and (c) their difference (a minus b). Also shown is (d) the analogous difference for CESM1-LE and CESM2-LE and (e) CESM2-RCP85 and CESM2-LE (scaled by 4). The difference between the geoengineered climate states in ARISE-SAI-1.5 and GLENS-SAI is shown in panel (f). Units for all panels are W m−2 K−1, except in panel (f) where units are W m−2, and stippled regions indicate differences that are less than twice the ensemble standard error.
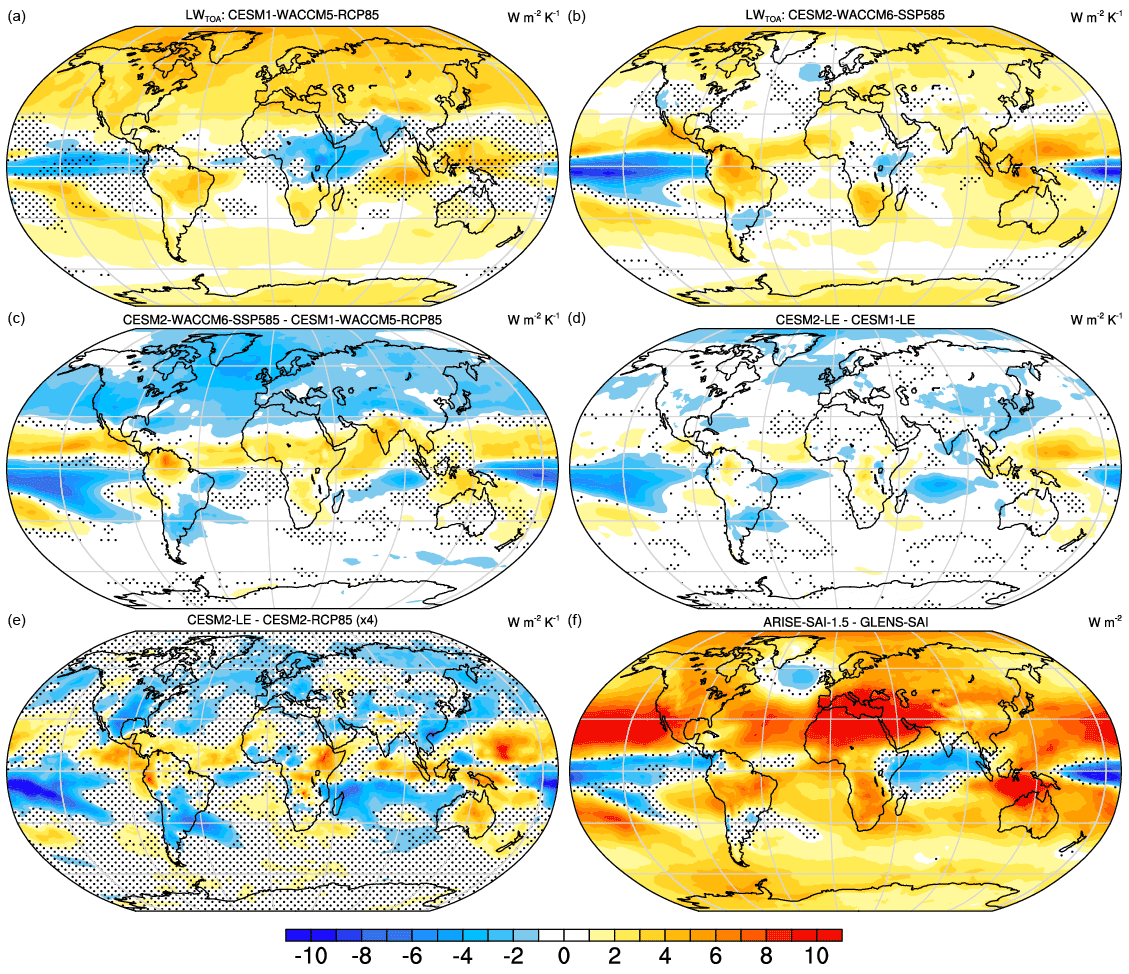
Figure A2Normalized response in net outgoing top-of-atmosphere longwave flux (LWTOA) per degree global warming estimated from the change between 2020–2039 and 2050–2069 for unmitigated (a) CESM1-WACCM5-RCP85 and (b) CESM2-WACCM6-SSP585 simulations, and (c) their difference (a minus b). Also shown is (d) the analogous difference for CESM1-LE and CESM2-LE and (e) CESM2-RCP85 and CESM2-LE (scaled by 4). The difference between the geoengineered climate states in ARISE-SAI-1.5 and GLENS-SAI is shown in panel (f). Units for all panels are W m−2 K−1, except in panel (f) where units are W m−2, and stippled regions indicate differences that are less than twice the ensemble standard error.
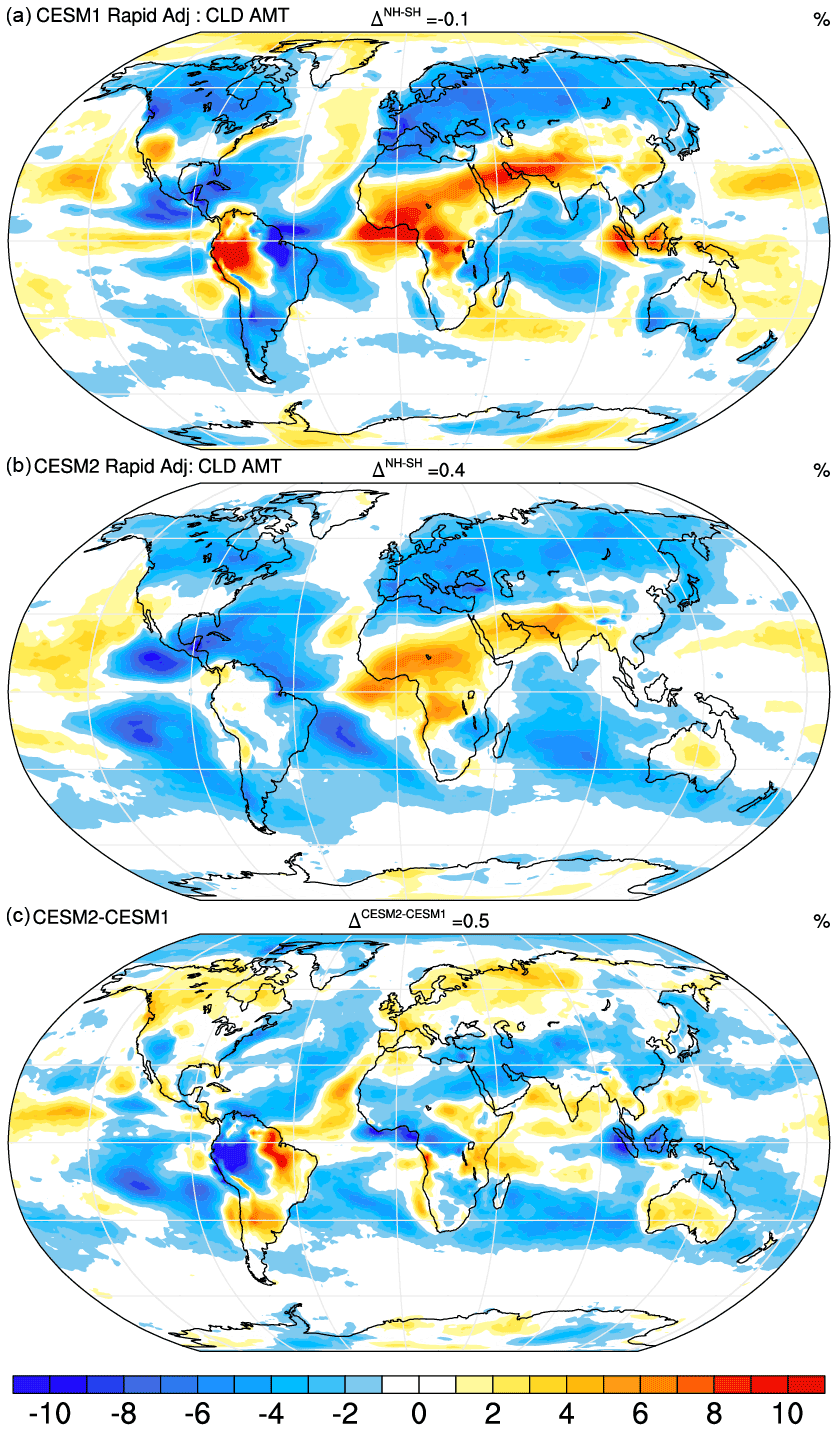
Figure A3Rapid adjustments of cloud amount (%) to CO2 based on 4×CO2AMIP–AMIP simulation differences in (a) CESM1, (b) CESM2, and (c) their difference (a minus b).
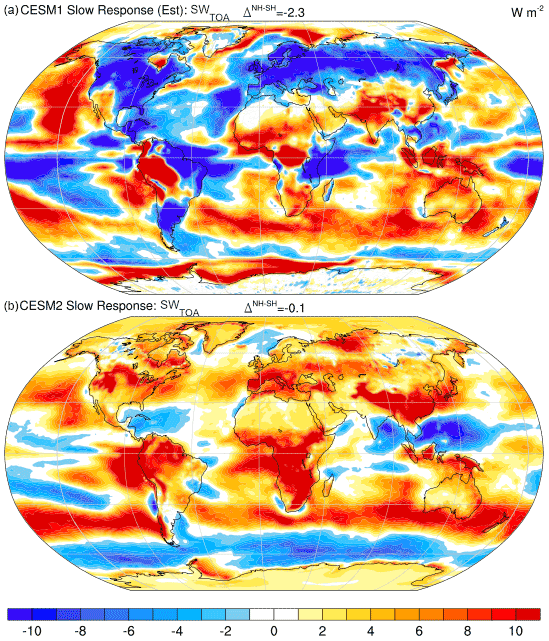
Figure A4Slow responses of net absorbed TOA solar radiation (W m−2) to CO2 estimated from abrupt4×CO2 simulations in CESM1 (a) and computed directly from AMIP + 4 K-AMIP simulation differences in CESM2 (b). The hemispheric contrasts are large for CESM1 (−2.3 W m−2) and small for CESM2 (0.1 W m−2).
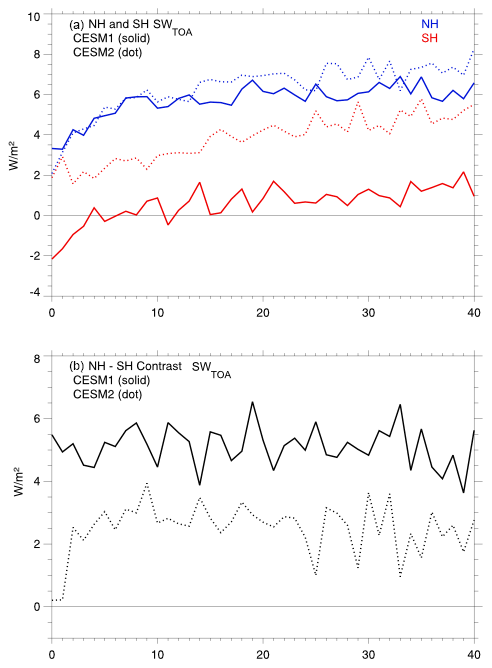
Figure A5Time series of hemispheric mean absorbed TOA shortwave fluxes in CESM1 and CESM2 (a) and their differences (b) in abrupt4×CO2 simulations.
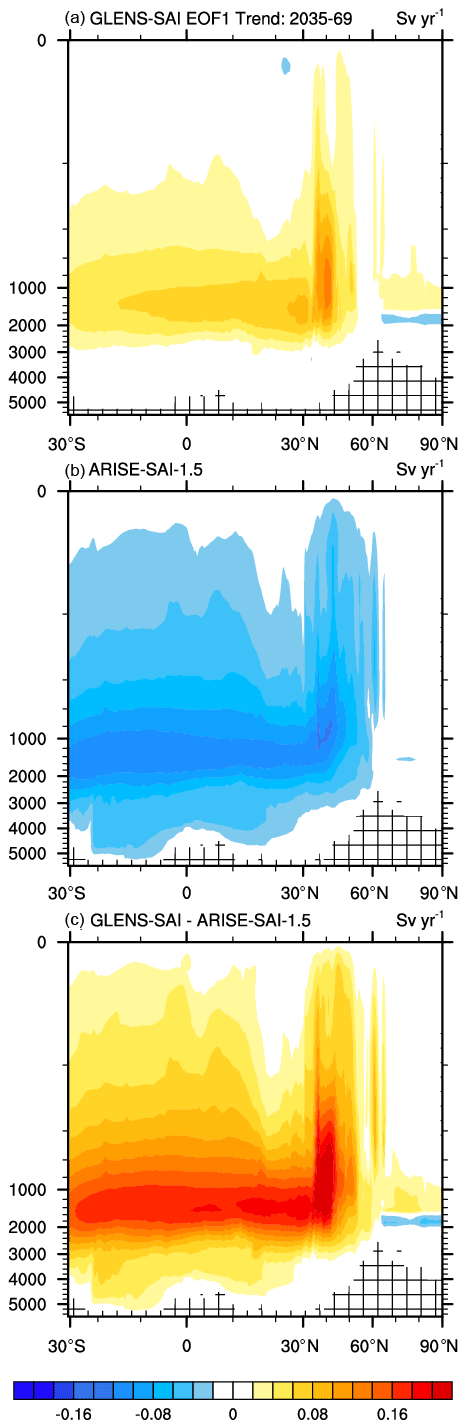
Figure A6Latitude-depth structure of ensemble-mean changes in the leading mode of the overturning circulation scaled by the linear trend in PC1 from 2035 to 2069 for (a) GLENS-SAI, (b) ARISE-SAI-1.5, and (c) their difference.
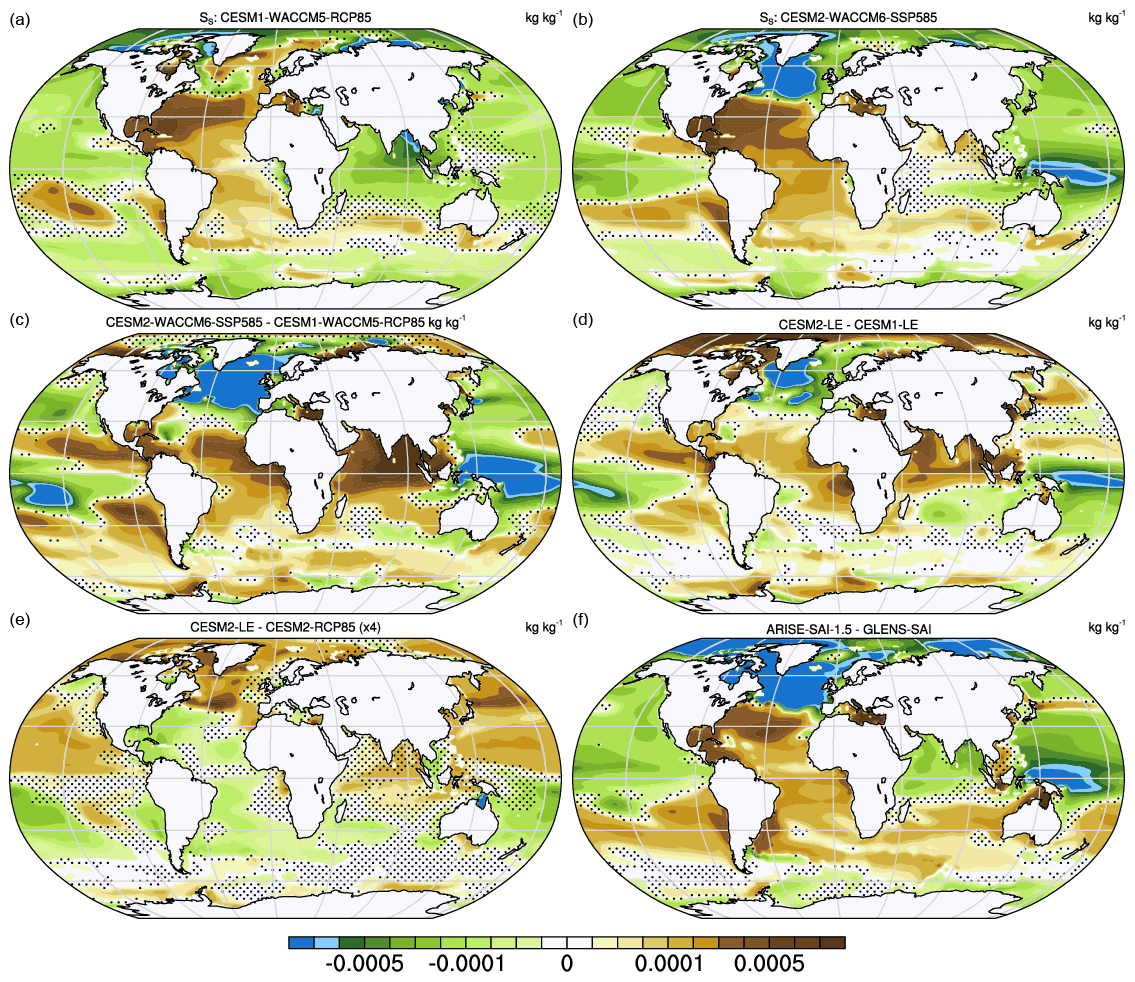
Figure A7Response in surface salinity (SS) estimated from the change between 2020–2039 and 2050–2069 for unmitigated (a) CESM1-WACCM5-RCP85 and (b) CESM2-WACCM6-SSP585 simulations, and their difference (c). Also shown is the analogous difference for (d) CESM1-LE and CESM2-LE (d) and (e) CESM2-RCP85 and CESM2-LE. The difference between the geoengineered climate states in ARISE-SAI-1.5 and GLENS-SAI is shown in panel (f). Units for all panels are kg kg−1, and stippled regions indicate differences that are less than twice the ensemble standard error.
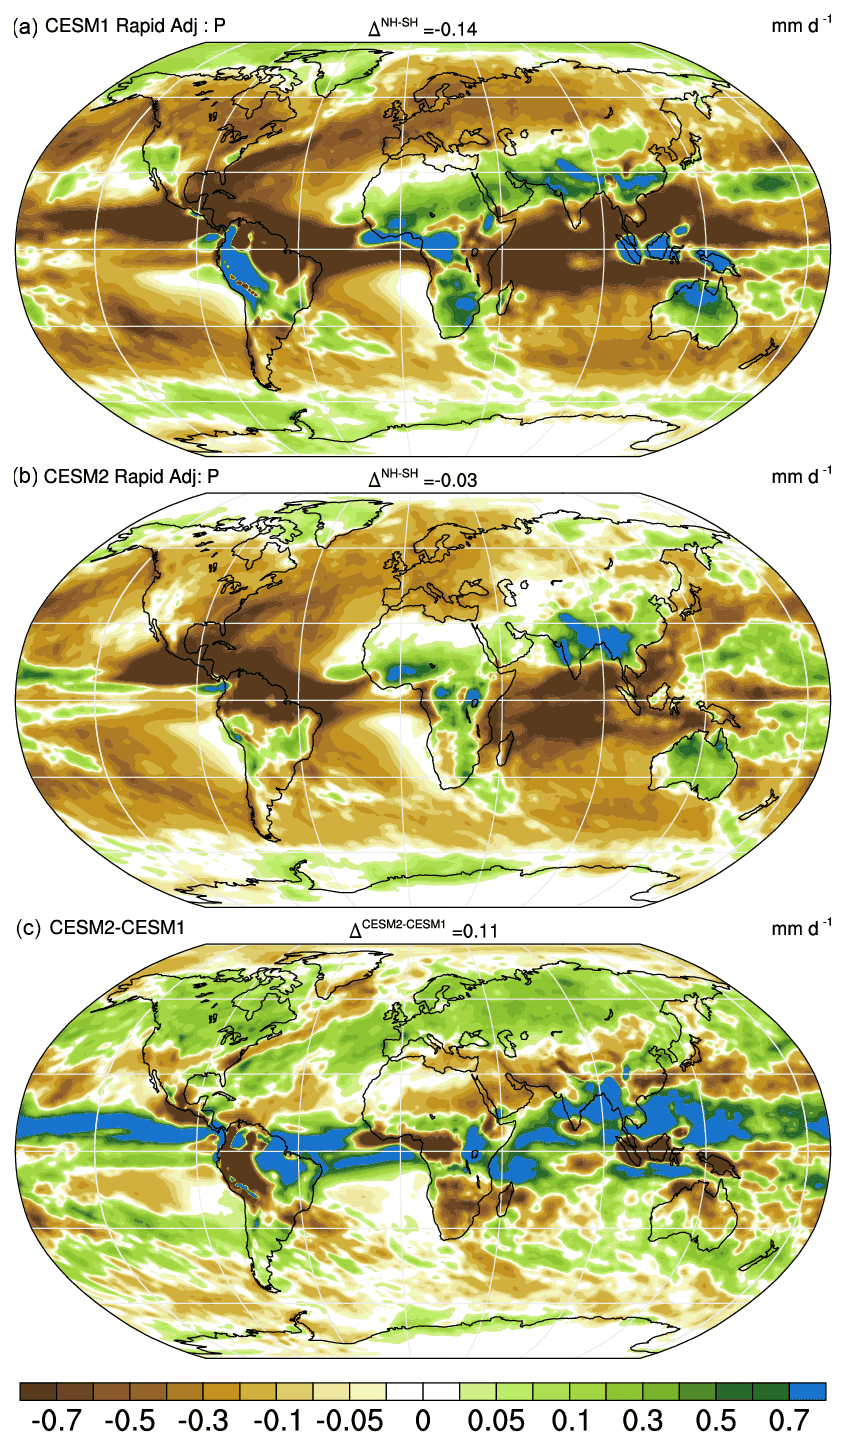
Figure A8Rapid adjustments of precipitation (mm d−1) to CO2 based on 4×AMIP–AMIP simulation differences in (a) CESM1, (b) CESM2, and (c) their difference (a minus b).
CESM software is available at https://github.com/ESCOMP/CESM (CESM Team, 2022).
All GLENS-SAI and CESM1-WACCM5-RCP85 simulations are available to the community via the Earth System Grid (see information at https://www.cesm.ucar.edu/projects/community-projects/GLENS/; NCAR, 2023a). Outputs from the CESM1-LE, CESM2-LE, CESM2-RCP85, and CESM2-WACCM6-SSP585 simulations and the ARISE-SAI-1.5 simulations are freely available the NCAR Climate Data Gateway at https://doi.org/10.26024/0cs0-ev98 (NCAR, 2023b) and https://doi.org/10.5065/9kcn-9y79 (NCAR, 2023c) respectively. CMIP6 data including CESM2-WACCM6-SSP585, 4×CO2AMIP, and 4×AbruptCO2 simulations are available online (https://esgf-node.llnl.gov/projects/cmip6/; WCRP, 2023).
This study was conceptualized by JTF and JHR. Data curation was done by JTF and JHR. The methodology was developed by JTF and JHR. Formal analysis was performed by JTF and funding acquisition was done by JHR.
The contact author has declared that neither of the authors has any competing interests.
Publisher's note: Copernicus Publications remains neutral with regard to jurisdictional claims in published maps and institutional affiliations.
This article is part of the special issue “Resolving uncertainties in solar geoengineering through multi-model and large-ensemble simulations (ACP/ESD inter-journal SI)”. It is not associated with a conference.
This material is based upon work supported by the National Center for Atmospheric Research, which is a major facility sponsored by the National Science Foundation under Cooperative Agreement no. 1852977 and by SilverLining through its Safe Climate Research Initiative. The Community Earth System Model (CESM) project is supported primarily by the National Science Foundation. Computing and data storage resources, including the Cheyenne supercomputer (https://doi.org/10.5065/D6RX99HX), were provided by the Computational and Information Systems Laboratory (CISL) at NCAR. The efforts of John T. Fasullo in this work were also supported by NASA Awards 80NSSC17K0565 and 80NSSC22K0046.
This research has been supported by Silver-Lining through its Save Climate Research Initiative. Computing and data storage resources, including the Cheyenne supercomputer (https://doi.org/10.5065/D6RX99HX), were provided by the Computational and Information Systems Laboratory (CISL) at NCAR. The efforts of John T. Fasullo in this work were also supported by NASA Awards 80NSSC17K0565 and 80NSSC22K0046.
This paper was edited by Susannah Burrows and reviewed by Douglas MacMartin and Alan Robock.
Abiodun, B. J., Odoulami, R. C., Sawadogo, W., Olumuyiwa, A., Abayomi, O., Abatan, A., New, M., Lennard, C., Izidine, P., Egbebiyi, T. S., and MacMartin, D. G.: Potential impacts of stratospheric aerosol injection on drought risk managements over major river basins in Africa, Climatic Change, 169, 1–19, https://doi.org/10.1007/s10584-021-03268-w, 2021.
Andrews, T., Forster, P. M., and Gregory, J. M. A surface energy perspective on climate change, J. Climate, 22, 2557–2570, https://doi.org/10.1175/2008JCLI2759.1, 2009.
Bala, G., Caldeira, K., and Nemani, R.: Fast versus slow response in climate change: Implications for the global hydrological cycle, Clim. Dynam., 35, 423–434, https://doi.org/10.1007/s00382-009-0583-y, 2010.
Banerjee, A., Butler, A. H., Polvani, L. M., Robock, A., Simpson, I. R., and Sun, L.: Robust winter warming over Eurasia under stratospheric sulphate geoengineering–the role of stratospheric dynamics, Atmos. Chem. Phys., 21, 6985–6997, https://doi.org/10.5194/acp-21-6985-2021, 2021.
Burgess, M. G., Ritchie, J., Shapland, J., and Pielke Jr., R.: IPCC baseline scenarios have over-projected CO2 emissions and economic growth, Environ. Res. Lett., 16, 014016, https://doi.org/10.1088/1748-9326/abcdd2, 2021.
CESM Team: CESM2.1.4-rc.07, GitHub [code], https://github.com/ESCOMP/CESM (last access: 4 January 2023), 2022.
Chiodo, G. and Polvani, L. M.: The Response of the Ozone Layer to Quadrupled CO2 Concentrations: Implications for Climate, J. Climate, 32, 7629–7642, https://doi.org/10.1175/JCLI-D-19-0086.1, 2019.
Da-Allada, C. Y., Baloïtcha, E. , Alamou, E. A. , Awo, F. M., Bonou, F., Pomalegni, Y., Biao, E. I., Obada, E., Zandagba, J. E., Tilmes, S., and Irvine, P. J.: Changes in west African summer monsoon precipitation under stratospheric aerosol geoengineering, Earth's Future, 8, e2020EF001595, https://doi.org/10.1029/2020EF001595, 2020.
Danabasoglu, G., Bates, S. C., Briegleb, B. P., Jayne, S. R., Jochum, M., Large, W. G., Peacock, S., and Yeager, S. G.: The CCSM4 ocean component, J. Climate, 25, 1361–1389, https://doi.org/10.1175/JCLI-D-11-00091.1, 2012.
Danabasoglu, G., Lamarque, J.-F., Bacmeister, J., Bailey, D. A., DuVivier, A. K., Edwards, J., Emmons, L. K., Fasullo, J., Garcia, J. R., Gettelman, A., Hannay, C., Holland, M. M., Large, W. G., Lauritzen, P. H., Lawrence, D. M., Lenaerts, J. T. M., Lindsay, K., Lipscomb, W. H., Mills, M. J., Neale, R., Oleson, K. W., Otto‐Bliesner, B., Phillips, A. S., Sacks, W., Tilmes, S., van Kampenhout, L., Vertenstein, M., Bertini, A., Dennis, J., Deser, C., Fischer, C., Fox-Kemper, B., Kay, J. E., Kinnison, D., Kushner, P. J., Larson, V. E., Long, M. C., Mickelson, S. Moore, J. K., Nienhouse, E., Polvani, L., Rasch, P. J., and Strand, W. G.: The community earth system model version 2 (CESM2), J. Adv. Model. Earth Syst., 12, e2019MS001916, https://doi.org/10.1029/2019MS001916, 2020.
Deser, C., Phillips, A., Bourdette, V., and Teng, H.: Uncertainty in climate change projections: the role of internal variability, Clim. Dynam., 38, 527–546, https://doi.org/10.1007/s00382-010-0977-x, 2012.
Eyring, V., Bony, S., Meehl, G. A., Senior, C. A., Stevens, B., Stouffer, R. J., and Taylor, K. E.: Overview of the Coupled Model Intercomparison Project Phase 6 (CMIP6) experimental design and organization, Geosci. Model Dev., 9, 1937–1958, https://doi.org/10.5194/gmd-9-1937-2016, 2016.
Fasullo, J. T., Tilmes, S., Richter, J. H., Kravitz, B., MacMartin, D. G., Mills, M. J., and Simpson, I. R.: Persistent polar ocean warming in a strategically geoengineered climate, Nat. Geosci., 11, 910–914, 2018.
Ferraro, A. J. and Griffiths, H. G.: Quantifying the temperature-independent effect of stratospheric aerosol geoengineering on global-mean precipitation in a multi-model ensemble, Environ. Res. Lett., 11, 034012, https://doi.org/10.1088/1748-9326/11/3/034012, 2016.
Forster, P. M., Andrews, T., Good, P., Gregory, J. M., Jackson, L. S., and Zelinka, M.: Evaluating adjusted forcing and model spread for historical and future scenarios in the CMIP5 generation of climate models, J. Geophys. Res.-Atmos., 118, 1139–1150, https://doi.org/10.1002/jgrd.50174, 2013.
Franke, H., Niemeier, U., and Visioni, D.: Differences in the quasi-biennial oscillation response to stratospheric aerosol modification depending on injection strategy and species, Atmos. Chem. Phys., 21, 8615–8635, https://doi.org/10.5194/acp-21-8615-2021, 2021.
Gettelman, A. and Morrison, H.: Advanced two-moment bulk microphysics for global models. Part I: Off-line tests and comparison with other schemes, J. Climate, 28, 1268–1287, https://doi.org/10.1175/JCLI-D-14-00102.1, 2015.
Gettelman, A., Mills, M. J., Kinnison, D. E., Garcia, R. R., Smith, A. K., Marsh, D. R., Tilmes, S., Vitt, F., Bardeen, C. G., McInerny, J., Liu, H.-L., Solomon, S. C., Polvani, L. M., Emmons, L. K., Lamarque, J.-F., Richter, J. H., Glanville, A. S., Bacmeister, J. T., Phillips, A. S., Neale, R. B., Simpson, I. R., DuVivier, A. K., Hodzic, A., and Randel, W. J.: The whole atmosphere community climate model version 6 (WACCM6), J. Geophys. Res.-Atmos., 124, 12380–12403, https://doi.org/10.1029/2019JD030943, 2019.
Golaz, J.-C., Larson, V. E., and Cotton, W. R.: A PDF-based model for boundary layer clouds. Part I: Method and model description, J. Atmos. Sci. 59, 3540–3551, https://doi.org/10.1175/1520-0469(2002)059<3540:APBMFB>2.0.CO;2, 2002.
Hurrell, J. W., Holland, M. M., Gent, P. R., Ghan, S., Kay, J. E., Kushner, P. J., Lamarque, J.-F., Large, W. G., Lawrence, D., Lindsay, K., Lipscomb, W. H., Long, M. C., Mahowald, N., Marsh, D. R., Neale, R. B., Rasch, P., Vavrus, S., Vertenstein, M., Bader, D., Collins, W. D., Hack, J. J., Kiehl, J., and Marshall, S.: The community earth system model: a framework for collaborative research, B. Am. Meteorol. Soc., 94, 1339–1360, https://doi.org/10.1175/BAMS-D-12-00121.1, 2013.
Kawatani, Y., Hamilton, K., and Watanabe, S.: The quasi-biennial oscillation in a double CO2 climate, J. Atmos. Sci., 68, 265–283, https://doi.org/10.1175/2010JAS3623.1, 2011.
Kay, J. E., Deser, D., Phillips, A., Mai, A., Hannay, C., Strand, G., Arblaster, J. M., Bates, S. C., Danabasoglu, G., Edwards, J., Holland, M., Kushner, P., Lamarque, J.-F., Lawrence, D., Lindsay, K., Middleton, A., Munoz, E., Neale, R., Oleson, K., Polvani, L., and Vertenstein, M.: The Community Earth System Model (CESM) large ensemble project: A community resource for studying climate change in the presence of internal climate variability, B. Am. Meteorol. Soc., 96, 1333–1349, 2015.
Kravitz, B. and MacMartin, D. G.: Uncertainty and the basis for confidence in solar geoengineering research, Nat. Rev. Earth Environ., 1, 64–75, https://doi.org/10.1038/s43017-019-0004-7, 2020.
Kravitz, B., MacMartin, D. G., Mills, M. J., Richter, J. H., Tilmes, S., Lamarque, J.-F., Tribbia, J. J., and Vitt, F.: First simulations of designing stratospheric sulfate aerosol geoengineering to meet multiple simultaneous climate objectives, J. Geophys. Res.-Atmos., 122, 12616–12634, 2017.
Kravitz, B., MacMartin, D. G., Visioni, D., Boucher, O., Cole, J. N. S., Haywood, J., Jones, A., Lurton, T., Nabat, P., Niemeier, U., Robock, A., Séférian, R., and Tilmes, S.: Comparing different generations of idealized solar geoengineering simulations in the Geoengineering Model Intercomparison Project (GeoMIP), Atmos. Chem. Phys., 21, 4231–4247, https://doi.org/10.5194/acp-21-4231-2021, 2021.
Krishnamohan, K. S. and Bala, G.: Sensitivity of tropical monsoon precipitation to the latitude of stratospheric aerosol injections, Clim. Dynam., 59, 151–168, https://doi.org/10.1007/s00382-021-06121-z, 2022.
MacMartin, D. G., Kravitz, B., Keith, D. W., and Jarvis, A.: Dynamics of the coupled human–climate system resulting from closed-loop control of solar geoengineering, Clim. Dynam., 43, 243–258, https://doi.org/10.1007/s00382-013-1822-9, 2014.
MacMartin, D., Kravitz, B., Tilmes, S., Richter, J. H., Mills, M. J., Lamarque, J.-F., Tribbia, J. J., and Vitt, F.: The climate response to stratospheric aerosol geoengineering can be tailored using multiple injection locations, J. Geophys. Res.- Atmos., 122, 12574–12590, https://doi.org/10.1002/2017JD026868, 2017.
MacMartin, D. G., Wang, W., Kravitz, B., Tilmes, S., Richter, J. H., and Mills, M. J.: Timescale for detecting the climate response to stratospheric aerosol geoengineering, J. Geophys. Res.-Atmos., 124, 1233–1247, https://doi.org/10.1029/2018JD028906, 2019.
Maher, N., Milinski, S., and Ludwig, R.: Large ensemble climate model simulations: introduction, overview, and future prospects for utilising multiple types of large ensemble, Earth Syst. Dynam., 12, 401–418, https://doi.org/10.5194/esd-12-401-2021, 2021.
Mills, M. J., Richter, J. H., Tilmes, S., Kravitz, B., MacMartin, D. G., Glanville, A. A., Tribbia, J. T, Lamarque, J.-F., Vitt, F., Schmidt, A., Gettelman, A., Hannay, C., Bacmeister, J. T., and Kinnison, D. E.: Radiative and chemical response to interactive stratospheric sulphate aerosols in fully coupled CESM1 (WACCM), J. Geophys. Res.-Atmos., 122, 13061–13078, https://doi.org/10.1002/2017JD027006, 2017.
NASEM – National Academies of Sciences, Engineering, and Medicine: Reflecting Sunlight: Recommendations for Solar Geoengineering Research and Research Governance, The National Academies Press, Washington, DC, https://doi.org/10.17226/25762, 2021.
NCAR: Geoengineering Large Ensemble Project (GLENS), https://www.cesm.ucar.edu/projects/community-projects/GLENS/ (last access: 3 January 2023), 2023a.
NCAR: CESM2-WACCM6-SSP245, NCAR [data set], https://doi.org/10.26024/0cs0-ev98, 2023b.
NCAR: ARISE-SAI-1.5, NCAR [data set], https://doi.org/10.5065/9kcn-9y79, 2023c.
O'Neill, B. C., Tebaldi, C., Van Vuuren, D. P., Eyring, V., Friedlingstein, P., Hurtt, G., Knutti, R., Kriegler, E., Lamarque, J.-F., Lowe, J., Meehl, G. A., Moss, R., Riahi, K., and Sanderson, B. M.: The Scenario Model Intercomparison Project (ScenarioMIP) for CMIP6, Geosci. Model Dev., 9, 3461–3482, https://doi.org/10.5194/gmd-9-3461-2016, 2016.
Park, S., Bretherton, C. S., and Rasch, P. J.: Integrating cloud processes in the Community Atmosphere Model, version 5, J. Climate, 27, 6821–6856, https://doi.org/10.1175/JCLI-D-14-00087.1, 2014.
Paulot, F., Paynter, D., Ginoux, P., Naik, V., and Horowitz, L. W.: Changes in the aerosol direct radiative forcing from 2001 to 2015: observational constraints and regional mechanisms, Atmos. Chem. Phys., 18, 13265–13281, https://doi.org/10.5194/acp-18-13265-2018, 2018.
Pinto, I., Jack, C., Lennard, C., Tilmes, S., and Odoulami, R. C.: Africa's climate response to solar radiation management with stratospheric aerosol, Geophys. Res. Lett., 47, e2019GL086047, https://doi.org/10.1029/2019GL086047, 2020.
Richter, J. H., Visioni, D., MacMartin, D. G., Bailey, D. A., Rosenbloom, N., Dobbins, B., Lee, W. R., Tye, M., and Lamarque, J.-F.: Assessing Responses and Impacts of Solar climate intervention on the Earth system with stratospheric aerosol injection (ARISE-SAI): protocol and initial results from the first simulations, Geosci. Model Dev., 15, 8221–8243, https://doi.org/10.5194/gmd-15-8221-2022, 2022.
Richter, J. H., Tilmes, S., Mills, M. J., Tribbia, J., Kravitz, B., MacMartin, D. G., Vitt, F., and Lamarque, J.-F. : Stratospheric dynamical response and ozone feedbacks in the presence of SO2 injections, J. Geophys. Res.-Atmos., 122, 12557–12573, https://doi.org/10.1002/2017JD026912, 2017.
Rodgers, K. B., Lee, S.-S., Rosenbloom, N., Timmermann, A., Danabasoglu, G., Deser, C., Edwards, J., Kim, J.-E., Simpson, I. R., Stein, K., Stuecker, M. F., Yamaguchi, R., Bódai, T., Chung, E.-S., Huang, L., Kim, W. M., Lamarque, J.-F., Lombardozzi, D. L., Wieder, W. R., and Yeager, S. G.: Ubiquity of human-induced changes in climate variability, Earth Syst. Dynam., 12, 1393–1411, https://doi.org/10.5194/esd-12-1393-2021, 2021.
Samset, B. H., Myhre, G., Forster, P. M., Hodnebrog, Ø., Andrews, T., Faluvegi, G., Fläschner, D., Kasoar, M., Kharin, V., Kirkevåg, A., Lamarque, J.-F., Olivié, D., Richardson, T., Shindell, D., Shine, K. P., Takemura, T., and Voulgarakis, A.: Fast and slow precipitation responses to individual climate forcers: A PDRMIP multimodel study, Geophys. Res. Lett., 43, 2782–2791, https://doi.org/10.1002/2016GL068064, 2016.
Simpson, I. R., Tilmes, S., Richter, J. H., Kravitz, B., MacMartin, D. G., Mills, M. J., Fasullo J. T., and Pendergrass A. G.: The regional hydroclimate response to stratospheric sulphate geoengineering and the role of stratospheric heating, J. Geophys. Res.-Atmos., 124, 12587–12616, https://doi.org/10.1029/2019JD031093, 2019.
Smith, R., Jones, P., Briegleb, B., Bryan, F., Danabasoglu, G., Dennis, J., Dukowicz, J., Eden, C., Fox-Kemper, B., Gent, P., Hecht, M., Jayne, S., Jochum, M., Large, W., Lindsay, K., Maltrud, M., Norton, N., Peacock, S., Vertenstein, M., and Year, S.: The Parallel Ocean Program (POP) reference manual, ocean component of the Community Climate System Model (CCSM), Tech. Rep. LAUR-10-01853, Los Alamos National Laboratory, https://opensky.ucar.edu/islandora/object/manuscripts:825 (last access: 3 January 2023), 2010.
Sun, W., Wang, B., Chen, D., Gao, C., Lu, G., and Liu, J.: Global monsoon response to tropical and Arctic stratospheric aerosol injection, Clim. Dynam., 55, 2107–2121, https://doi.org/10.1007/s00382-020-05371-7, 2020.
Thayer-Calder, K., Gettelman, A., Craig, C., Goldhaber, S., Bogenschutz, P. A., Chen, C. C., Morrison, H., Höft, J., Raut, E., Griffin, B. M., Weber, J. K., Larson, V. E., Wyant, M. C., Wang, M., Guo, Z., and Ghan, S. J.: A unified parameterization of clouds and turbulence using CLUBB and subcolumns in the Community Atmosphere Model, Geosci. Model Dev., 8, 3801–3821, https://doi.org/10.5194/gmd-8-3801-2015, 2015.
Tilmes, S., Fasullo, J., Lamarque, J. F., Marsh, D. R., Mills, M., Alterskjær, K., Muri, H. Kristjánsson, J. E., Boucher, O., Schulz, M. J., Cole, J. N. S., Curry, C. L., Jones, A., Haywood, J., Irvine, P. J., Ji, D., Moore, J. C., Karam, D. B., Kravitz, B., Rasch, P. J., Singh, B., Yoon, J.-H., Niemeier, U., Schmidt, H., Robock, A., Yang, S., and Watanabe, S.: The hydrological impact of geoengineering in the Geoengineering Model Intercomparison Project (GeoMIP), J. Geophys. Res.- Atmos., 118, 11036–11058, https://doi.org/10.1002/jgrd.50868, 2013.
Tilmes, S., Richter, J. H., Kravitz, B., MacMartin, D. G., Mills, M. J., Simpson, I. R., Glanville, A. S., Fasullo, J. T., Phillips, A. S., Lamarque, J.-F., Tribbia, J., Edwards, J., Mickelson, S., and Ghosh, S.: CESM1 (WACCM) stratospheric aerosol geoengineering large ensemble project, B. Am. Meteorol. Soc., 99, 2361–2371, https://doi.org/10.1175/BAMS-D-17-0267.1, 2018.
Tilmes, S., MacMartin, D. G., Lenaerts, J. T. M., van Kampenhout, L., Muntjewerf, L., Xia, L., Harrison, C. S., Krumhardt, K. M., Mills, M. J., Kravitz, B., and Robock, A.: Reaching 1.5 and 2.0 ∘C global surface temperature targets using stratospheric aerosol geoengineering, Earth Syst. Dynam., 11, 579–601, https://doi.org/10.5194/esd-11-579-2020, 2020.
Trenberth, K. E. and Fasullo, J. T.: Global warming due to increasing absorbed solar radiation, Geophys. Res. Lett., 36, L07706, https://doi.org/10.1029/2009GL037527, 2009.
Visioni, D., MacMartin, D. G., Kravitz, B., Boucher, O., Jones, A., Lurton, T., Martine, M., Mills, M. J., Nabat, P., Niemeier, U., Séférian, R., and Tilmes, S.: Identifying the sources of uncertainty in climate model simulations of solar radiation modification with the G6sulfur and G6solar Geoengineering Model Intercomparison Project (GeoMIP) simulations, Atmos. Chem. Phys., 21, 10039–10063, https://doi.org/10.5194/acp-21-10039-2021, 2021.
Visioni, D., Bednarz, E. M., Lee, W. R., Kravitz, B., Jones, A., Haywood, J. M., and MacMartin, D. G.: Climate response to off-equatorial stratospheric sulfur injections in three Earth System Models – Part 1: experimental protocols and surface changes, EGUsphere [preprint], https://doi.org/10.5194/egusphere-2022-401, 2022.
Wang, Z., Lin, L., Xu, Y., Che, H., Zhang, X., Zhang, H., Dong, W., Wang, C., Gui, K., and Xie, B.: Incorrect Asian aerosols affecting the attribution and projection of regional climate change in CMIP6 models, NPJ Clim. Atmos. Sci., 4, 1–8, https://doi.org/10.1038/s41612-020-00159-2, 2021.
Watanabe, S. and Kawatani, Y.: Sensitivity of the QBO to mean tropical upwelling under a changing climate simulated with an earth system model, J. Meteorol. Soc. Jpn. Ser. II, 90, 351–360, https://doi.org/10.2151/jmsj.2012-A20, 2021.
WCRP: WCRP Coupled Model Intercomparison Project (Phase 6), WCRP [data set], https://esgf-node.llnl.gov/projects/cmip6/, last access: 3 January 2023.
Xie, M., Moore, J. C., Zhao, L., Wolovick, M., and Muri, H.: Impacts of three types of solar geoengineering on the Atlantic Meridional Overturning Circulation, Atmos. Chem. Phys., 22, 4581–4597, https://doi.org/10.5194/acp-22-4581-2022, 2022.
Xu, Y., Lin, L., Tilmes, S., Dagon, K., Xia, L., Diao, C., Cheng, W., Wang, Z., Simpson, I., and Burnell, L.: Climate engineering to mitigate the projected 21st-century terrestrial drying of the Americas: a direct comparison of carbon capture and sulfur injection, Earth Syst. Dynam., 11, 673–695, https://doi.org/10.5194/esd-11-673-2020, 2020.
Zhang, Q., Chang, P., Yeager, S. G., Danabasoglu, G., and Zhang, S.: Role of sea-surface salinity in simulating historical decadal variations of Atlantic meridional overturning circulation in a coupled climate model, Geophys. Res. Lett., 49, e2021GL096922, https://doi.org/10.1029/2021GL096922, 2022.
Zhang, R., Sutton, R., Danabasoglu, G., Kwon, Y.-O., Marsh, R., Yeager, S. G., Amrhein, D. E., and Little, C. M.: A review of the role of the Atlantic meridional overturning circulation in Atlantic multidecadal variability and associated climate impacts, Rev. Geophys., 57, 316–375, https://doi.org/10.1029/2019RG000644, 2019.