the Creative Commons Attribution 4.0 License.
the Creative Commons Attribution 4.0 License.
 | 29 Nov 2023
Development, intercomparison, and evaluation of an improved mechanism for the oxidation of dimethyl sulfide in the UKCA model
Scott Archer-Nicholls
James Weber
N. Luke Abraham
Paul T. Griffiths
Lorrie Jacob
Y. Matthew Shin
Laura E. Revell
Matthew Woodhouse
Dimethyl sulfide (DMS) is an important trace gas emitted from the ocean. The oxidation of DMS has long been recognised as being important for global climate through the role DMS plays in setting the sulfate aerosol background in the troposphere. However, the mechanisms in which DMS is oxidised are very complex and have proved elusive to accurately determine in spite of decades of research. As a result the representation of DMS oxidation in global chemistry–climate models is often greatly simplified.
Recent field observations and laboratory and ab initio studies have prompted renewed efforts in understanding the DMS oxidation mechanism, with implications for constraining the uncertainty in the oxidation mechanism of DMS as incorporated in global chemistry–climate models. Here we build on recent evidence and develop a new DMS mechanism for inclusion in the UK Chemistry Aerosol (UKCA) chemistry–climate model. We compare our new mechanism (CS2-HPMTF) to a number of existing mechanisms used in UKCA (including the highly simplified three-reactions–two-species mechanism used in CMIP6 studies with the model) and to a range of recently developed mechanisms reported in the literature through a series of global and box model experiments. Global model runs with the new mechanism enable us to simulate the global distribution of hydroperoxylmethyl thioformate (HPMTF), which we calculate to have a burden of 2.6–26 Gg S (in good agreement with the literature range of 0.7–18 Gg S). We show that the sinks of HPMTF dominate uncertainty in the budget, not the rate of the isomerisation reaction forming it and that, based on the observed DMS HPMTF ratio from the global surveys during the NASA Atmospheric Tomography mission (ATom), rapid cloud uptake of HPMTF worsens the model–observation comparison. Our box model experiments highlight that there is significant variance in simulated secondary oxidation products from DMS across mechanisms used in the literature, with significant divergence in the sensitivity of the rates of formation of these products to temperature exhibited; especially for methane sulfonic acid (MSA). Our global model studies show that our updated DMS scheme performs better than the current scheme used in UKCA when compared against a suite of surface and aircraft observations. However, sensitivity studies underscore the need for further laboratory and observational constraints. In particular our results suggest that as a priority long-term DMS observations be made to better constrain the highly uncertain inputs into the system and that laboratory studies be performed that address (1) the uptake of HPMTF onto aerosol surfaces and the products of this reaction and (2) the kinetics and products of the following reactions: CH3SO3 decomposition, CH3S + O2, CH3SOO decomposition, and CH3SO + O3.
- Article
(8053 KB) - Full-text XML
-
Supplement
(12228 KB) - BibTeX
- EndNote


It is estimated that 16–28 Tg S yr−1 are emitted in the form of dimethyl sulfide (DMS, CH3SCH3) from the ocean, making DMS the most abundant biological source of sulfur in the Earth system (Andreae, 1990; Tesdal et al., 2015; Bock et al., 2021). Elucidating the atmospheric fate of DMS has been a long-standing goal of the atmospheric chemistry research community owing to a proposed biogeochemical feedback cycle (CLAW; Charlson et al., 1987), whereby DMS oxidation is key to a homeostatic feedback loop. The initial steps in DMS oxidation are well understood (Barnes et al., 2006). Focusing on oxidation via OH (NO3), the most important oxidant during the daytime (nighttime), DMS is oxidised in the gas phase through two main pathways: the abstraction pathway forms the methyl thiomethyl peroxy radical (MTMP, CH3SCH2OO) in the first step, while the addition pathway leads to dimethyl sulfoxide (DMSO, CH3SOCH3 and, to a lesser extent, DMSO2) as an important intermediate.
Ultimately, the oxidation of DMS leads to products such as H2SO4 and sulfate (SO, as these represent the highest oxidation states of sulfur (S(VI)). Along the way from DMS, a number of secondary oxidation products such as sulfur dioxide (SO2), methane sulfonic acid (MSA, CH3SO3H), and carbonyl sulfide (OCS) can be formed; however, the yields of these species depend on the mechanisms involved, which themselves are a function of the chemical (e.g. levels of oxidants) and environmental conditions (e.g. temperature and humidity). The yields of these products are relatively uncertain, with estimates of the DMS-to-SO2 yield spanning 14 %–96 % (von Glasow and Crutzen, 2004). The oxidation products can participate in aerosol growth and in new particle formation, affecting the number of cloud condensation nuclei (CCN). As such, DMS oxidation can impact cloud formation and lifetime and hence climate, although the absolute effect is still highly uncertain due to the uncertainty in the kinetics and mechanisms of DMS oxidation. Indeed, natural aerosols such as DMS contribute to large uncertainties in the radiative forcing of the pre-industrial atmosphere (Carslaw et al., 2013; Fung et al., 2022).
Substantial discrepancies between different DMS oxidation mechanisms under different conditions have been found (de Bryn et al., 2002; von Glasow and Crutzen, 2004). The intercomparison study by Karl et al. (2007) looked at seven different chemistry schemes in a box model (using the same inputs) and observed that SO2 mixing ratios varied from 2 to 44 ppt. Differences between models are even greater when looking at MSA yield (Karl et al., 2007; Hoffmann et al., 2021). The large uncertainties in product ratios indicate the need for more observational constraints for DMS chemistry in models.
In the UK Chemistry and Aerosol model (UKCA), two different chemistry schemes are implemented: StratTrop (Archibald et al., 2020), which is a simplified chemistry mechanism included in the UK Earth System Model (Sellar et al., 2019), and CRI-Strat2 (Archer Nicholls et al., 2021; Weber et al., 2021). The DMS oxidation mechanism in StratTrop is, like those used in many Earth system models (ESMs), a very simple scheme (see Sect. 1.4.1 for more details). We believe modellers have opted to keep the DMS chemistry incredibly simple for two main reasons, i.e. (1) numerical efficiency and (2) uncertainty in what to do owing to lack of detailed DMS oxidation mechanisms that have been calibrated against laboratory data. The StratTrop DMS mechanism only includes four reactions and no intermediates for the DMS oxidation scheme.
Omitting intermediates might lead to a misrepresentation of the spatial distribution of oxidation products and an overestimation in their formation since the intermediates might be subject to wet and dry deposition or cloud uptake. Because a unity yield of SO2 is assumed, a change in the distribution of oxidation products due to a changing climate cannot be evaluated.
CRI-Strat2 (hereafter CS2) (Archer-Nicholls et al., 2021; Weber et al., 2021) is a mechanism that aims to be of intermediate complexity. CS2 includes 19 reactions and 7 intermediates (DMSO, MSIA, MTMP, CH3S, CH3SO, CH3SO2, CH3SO3) as part of its DMS scheme and is primarily based on the work of von Glasow and Crutzen (2004). While the CS2 DMS mechanism is much more complex than the StratTrop scheme, it represents an understanding of DMS chemistry that is far from up to date.
In this work, the gas-phase DMS oxidation by OH and NO3 in CS2 is updated according to the current scientific understanding. The greatest update is the inclusion of the recently discovered intermediate hydroperoxymethyl thioformate (HPMTF, HOOCH2SCHO), which is formed through the autoxidation of the methyl thiomethyl peroxy radical (MTMP, CH3SCH2OO) in the abstraction pathway (Wu et al., 2015; Berndt et al., 2019; Veres et al., 2020). Currently, it is estimated that ∼30 %–50 % of DMS yields HPMTF (Veres et al., 2020; Novak et al., 2021; Fung et al., 2022). There are large uncertainties about the value of the rate constant of the first H-shift, which is the rate-determining step for HPMTF formation (Fig. 1). (given that the first isomerisation step is rate limiting, the overall rate constant for isomerisation is denoted kisom). This determines if autoxidation can compete with or surpass the bimolecular reactions of MTMP with HO2 and NO. The chamber study by Ye et al. (2021) estimates a probability distribution based on their measurements with 1 geometric standard deviation spanning an order of magnitude. The isomerisation rate constant is predicted using ab initio methods to be strongly temperature dependent, indicating that this pathway could be more relevant under a warming climate (Wu et al., 2015; Veres et al., 2020). Following the end of the discussion phase during the publication of this paper the first temperature-dependent direct kinetic study of the isomerisation of rate constant for MTMP to HPMTF was published (Assaf et al., 2023). In that study the authors calculate the Arrhenius temperature barrier as 7278 ± 99 K, confirming the high temperature dependence of the reaction experimentally.
As of now, the fate of HPMTF in the atmosphere is largely unknown. Wu et al. (2015) postulate further oxidation with OH, ultimately yielding SO2 as the dominant product and OCS as a side product. Veres et al. (2020) observe an abrupt decrease in HPMTF mixing ratio in clouds and therefore suggest that heterogeneous loss to aerosol and cloud uptake plays a big role. Vermeuel et al. (2020) support this hypothesis: they find a diurnal profile of HPMTF in the vicinity of California's coast and suggest this is due to the consistent diurnal profile of cloud present. This hypothesis is further supported by the study by Novak et al. (2021), which looks at two case studies and concludes that cloud uptake determines the lifetime of HPMTF. Novak et al. (2021) found that cloud uptake of HPMTF reduces SO2 production from DMS by over a third, while providing a more direct pathway to sulfate formation. On the contrary, the chamber study and calculation of Henry's law constant by Wollesen de Jonge et al. (2021) predict that HPMTF does not directly contribute to new particle formation or aerosol growth. Instead, their study proposes aqueous oxidation by OH, ultimately still yielding gas-phase SO2. Khan et al. (2021) stress the importance of photolysis as a potential loss pathway, which might explain the observed diurnal concentrations throughout the day. Overall, loss processes of HPMTF are poorly understood.
In this work, we perform a series of updates to the CS2 DMS oxidation scheme, which are evaluated against the current CS2 and the very simplified DMS chemistry in StratTrop. The aim of this work is to improve the representation of DMS chemistry in UKCA and determine the influence of some of the major mechanistic uncertainties in model simulated SO2 levels compared against Atmospheric Tomography mission (ATom) observations (Wofsy et al., 2018; Veres et al., 2020). Our study includes a comprehensive set of box model studies, including an intercomparison of our new DMS scheme against other recently reported schemes in the literature, and global 3D simulations with the UKCA model. To complement the work of Fung et al. (2022), sensitivity studies with variable rates of production and cloud and aerosol uptake of HPMTF are performed to investigate the effects of the uncertainty in HPMTF formation and depletion on the distribution and burden of SO2 and sulfate (given their importance in climate) using a structurally different model to that they used.
2.1 Model description
2.1.1 Set-up
Box model
For the box model experiments, BOXMOX (Knote et al., 2015), the box modelling extension to the Kinetic PreProcessor (KPP) (Sandu and Sander, 2006) was used. The initial and background concentrations of the species were set to be representative of the remote marine boundary layer (MBL) (and are detailed in Table S1 in the Supplement). NOx concentration was kept at approximately 10 ppt, unless otherwise specified.
The box model set-up simulates an MBL air parcel exchanging with the free troposphere. The diurnal profile of the planetary boundary layer height was modelled after the diurnal profile of the MBL in Ho et al. (2015) (Table S2). Mixing of the air within the box with the free troposphere is described by the increases in box height: it is assumed that changes in the box volume are due to the influx of background air. Emissions of DMS are added at 3.48 × 10⁹ molec. cm−2 s−1 (consistent with the higher emission flux in von Glasow and Crutzen (2004)). Emissions mix instantaneously within the box. Temperature varies throughout a 24 h period between 289–297 K, with a mean of 293 K (Table S2). Photolysis reactions are scaled depending on the time of day and make use of the pre-calculated “J” rates obtained from the MCMv3.3.1. The simulations were run for 192 h (8 d) with 10 min time steps. CRI v2.2 R5 (CS2) (Jenkin et al., 2019; Weber et al., 2021) was employed as the base chemical mechanism. Unless otherwise specified, only reactions of the DMS scheme were changed. Neither dry nor wet deposition was included in the box model experiments. The analysis of the BOXMOX simulations discussed in Sect. 3.1.1 and 3.2.1 focuses on the continuous (hourly) output. In Sect. 3.1.2 and 3.2.2, simulations with a prescribed temperature (260–310 K, step size of 5 K) were conducted. The data from days 7 and 8 of the runs were averaged to enable the effects of changes in the temperature on species concentration simulated in the box model to be calculated (following Archibald et al., 2010)
Three-dimensional simulations
For the 3D simulations we use UKCA, the chemistry and aerosol component of UKESM1, with a horizontal resolution of 1.25∘ × 1.875∘ with 85 vertical levels up to 85 km (Walters et al., 2019). UKCA uses the GLOMAP-mode aerosol scheme, which simulates sulfate, sea salt, black carbon (BC), organic matter, and dust but does not currently simulate nitrate aerosol (Mulcahy et al., 2020). Simulations were run for 18 months, using the first 6 months as spin-up. In order to look at high time resolution, output simulations were rerun for limited time periods using the restart files of the longer runs but outputting data at hourly frequency.
Temperature and horizontal wind fields were nudged (Telford et al., 2013) in all model runs to the ERA-Interim atmospheric reanalysis from ECMWF (Dee et al., 2011). See the Supplement Sect. S2.1 for further details.
The emissions used in this study for UKCA are the same as those from Archer-Nicholls et al. (2021) and are those developed for the Coupled-Model Intercomparison Project 6 (CMIP6) (Collins et al., 2017). See the Supplement Sect. S2.1 for further details. Oceanic emissions of DMS are calculated from seawater DMS concentrations (Sellar et al., 2019). In the atmosphere-only setup employed here, seawater DMS concentrations for 2014 from a UKESM1 fully coupled SSP3-70 ensemble member were prescribed. The DMS emission flux from the ocean used in the model was 16 Tg S yr−1, and therefore it was on the low end of estimates of oceanic DMS emissions (e.g. Lana et al., 2011; Bock et al., 2021).
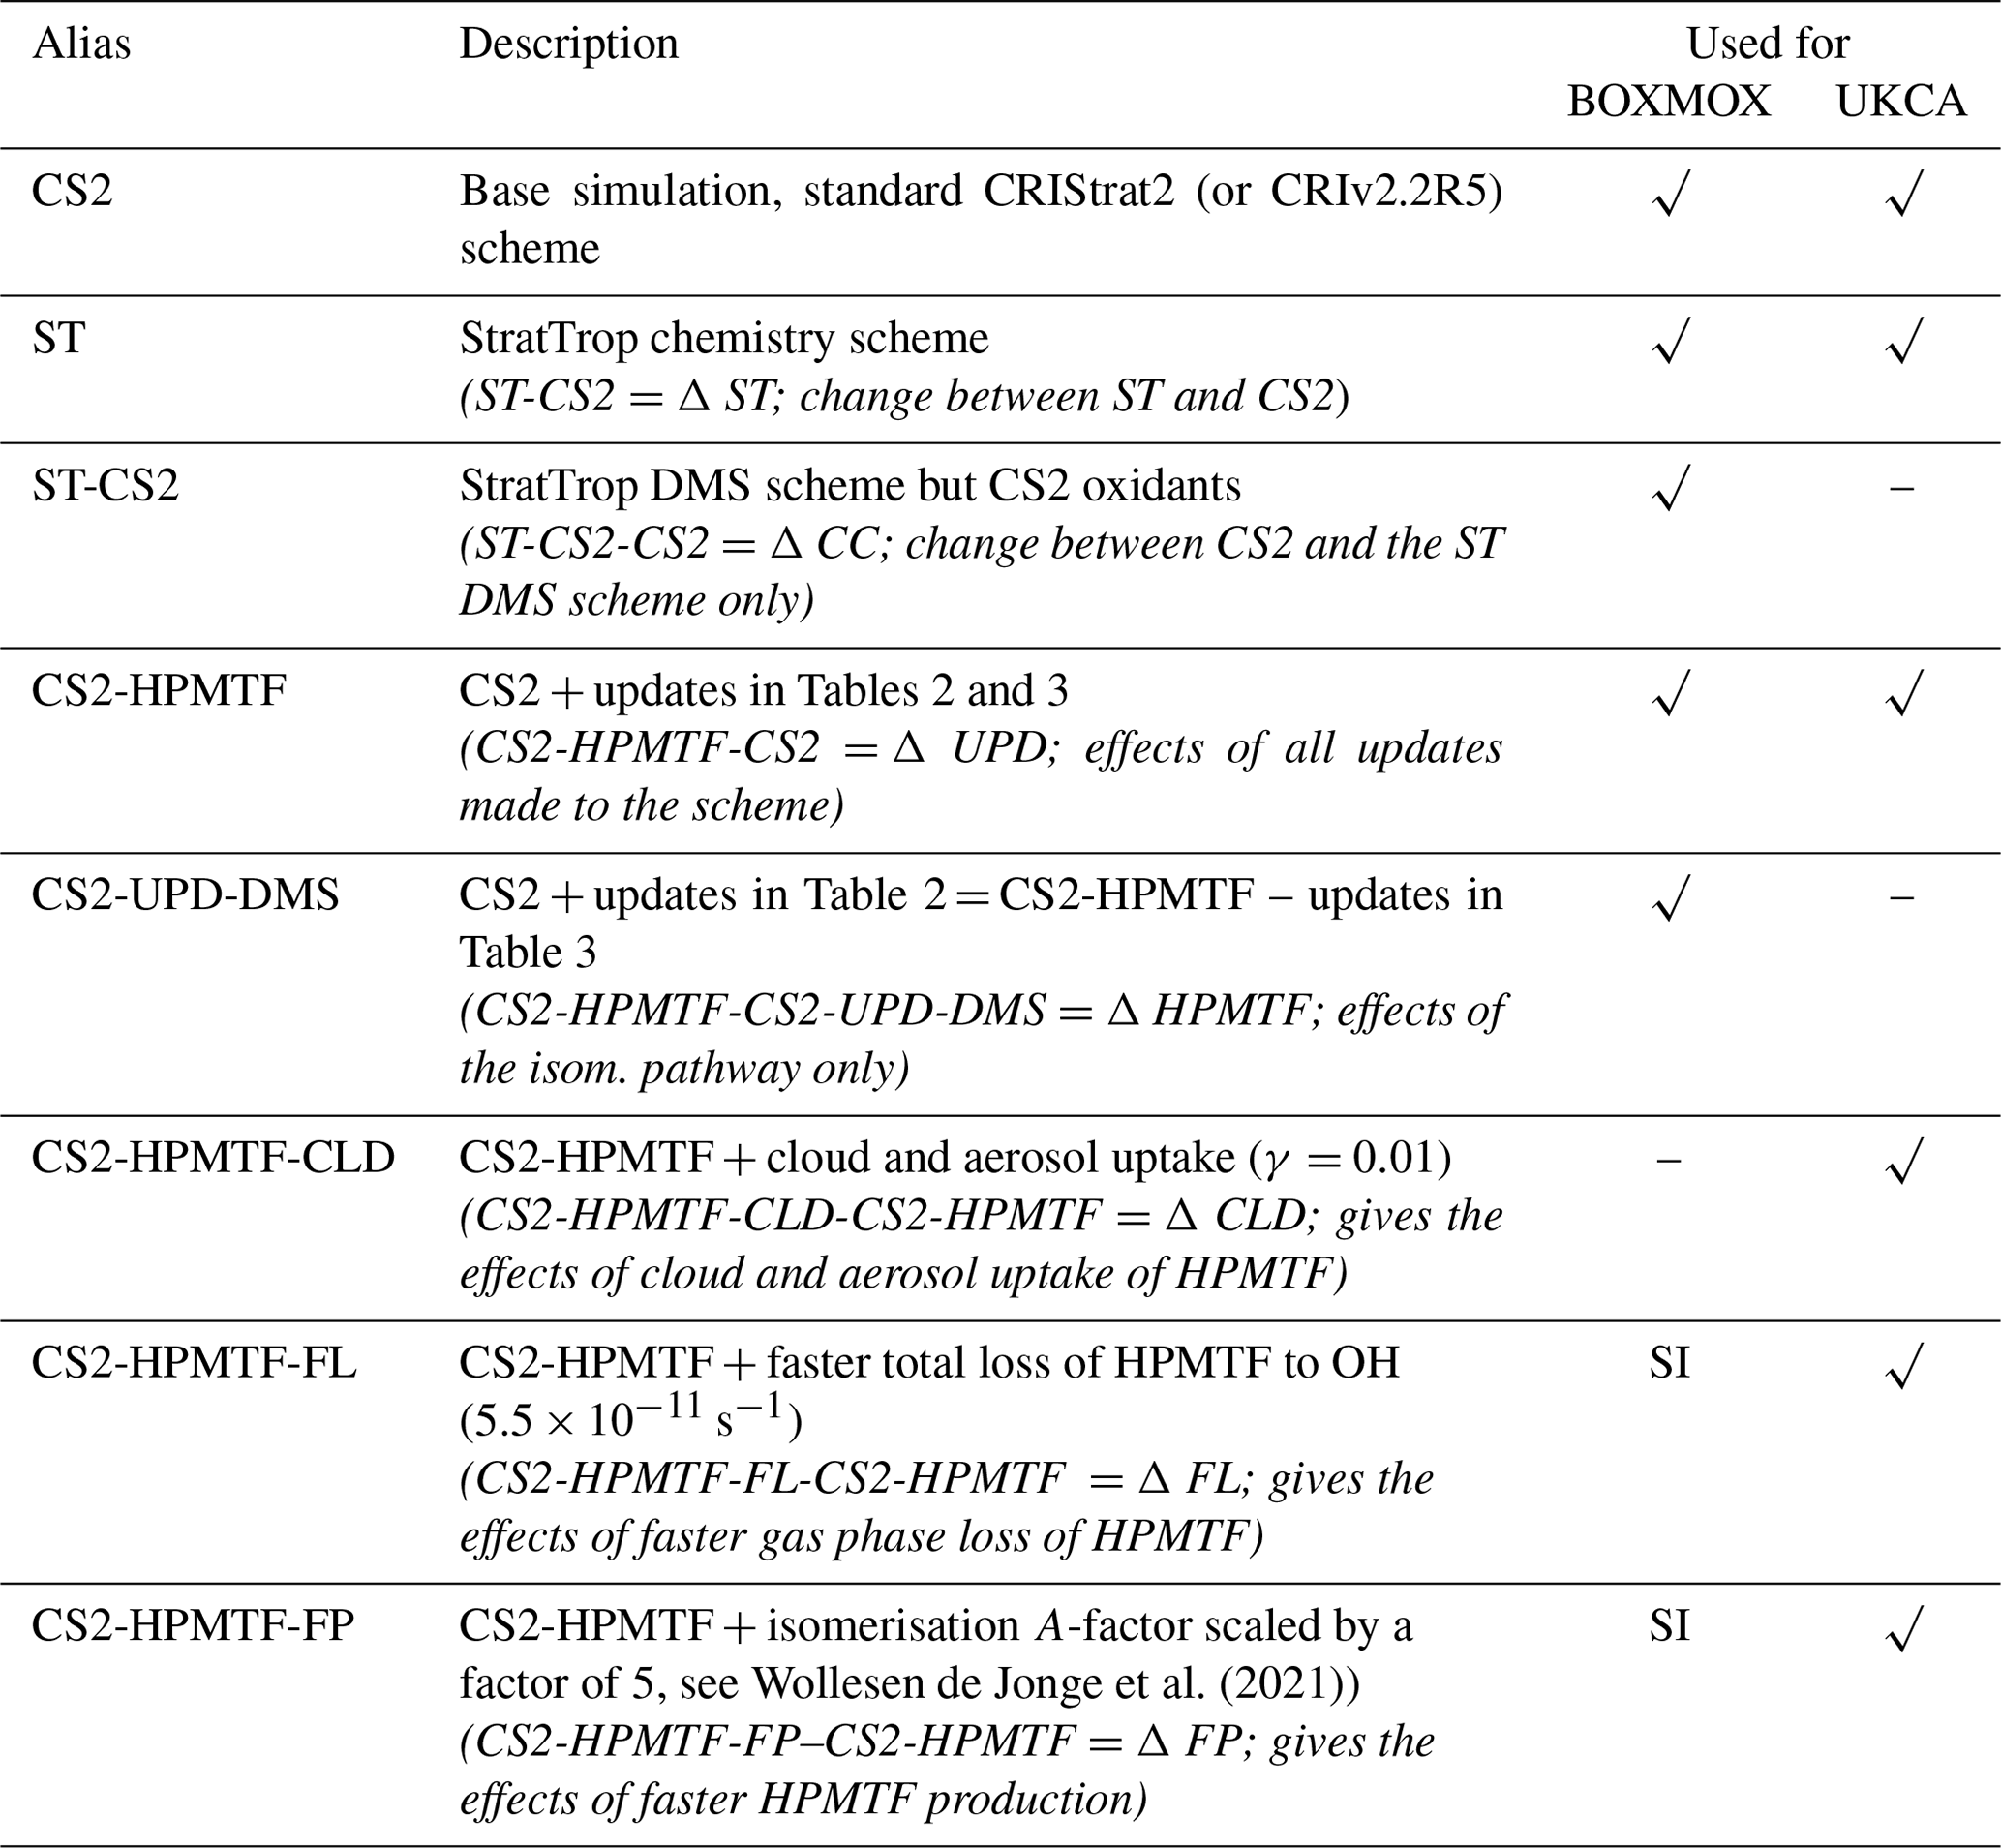
Table 1Configuration of model runs in this study. The last two columns indicate whether this scheme was used for the BOXMOX experiments or the UKCA runs or both. Additional BOXMOX simulations were performed and the results of which are included in the Supplement Sect. S1.2 for completeness.
2.1.2 Model runs
Simulations are performed with the standard or updated DMS scheme to quantify the impacts of the mechanistic changes. Details are given in Table 1. We chose as our base run a simulation with the CRIStrat2 chemistry scheme, hereafter referred to as CS2 (Weber et al., 2021). We perform two simulations with StratTrop (hereafter ST): ST is the default mechanism as used in UKESM1, while ST-CS2 uses the ST DMS chemistry (Reactions R1–R4) but all other reactions (HOx, NOx, volatile organic carbon (VOC), etc.) are identical to CS2. This allows us to attribute the changes arising solely to differences in the oxidising capacity or environment (driven by the chemistry not strongly coupled to DMS) and isolate the role of differences in the DMS reactions themselves.
In updating the representation of DMS chemistry for UKCA a number of changes were considered. Broadly these fall into two categories: (1) Incorporation of the chemistry of HPMTF (shown in red in Fig. 1) (2) updates to other aspects of DMS oxidation chemistry (shown in blue in Fig. 1). CS2-HPMTF is used to identify the fully updated DMS mechanism (Tables 2, 3). All other runs act as sensitivity runs. CS2-UPD-DMS allows the evaluation of only updating the standard DMS chemistry (Table 2), without the addition of the isomerisation branch and HPMTF formation (Table 3). CS2-HPMTF-CLD adds cloud and aerosol uptake of HPMTF with subsequent sulfate formation, similar to Novak et al. (2021). With CS2-HPMTF-FP and CS2-HPMTF-FL the effects of faster production and faster loss of HPMTF can be assessed.
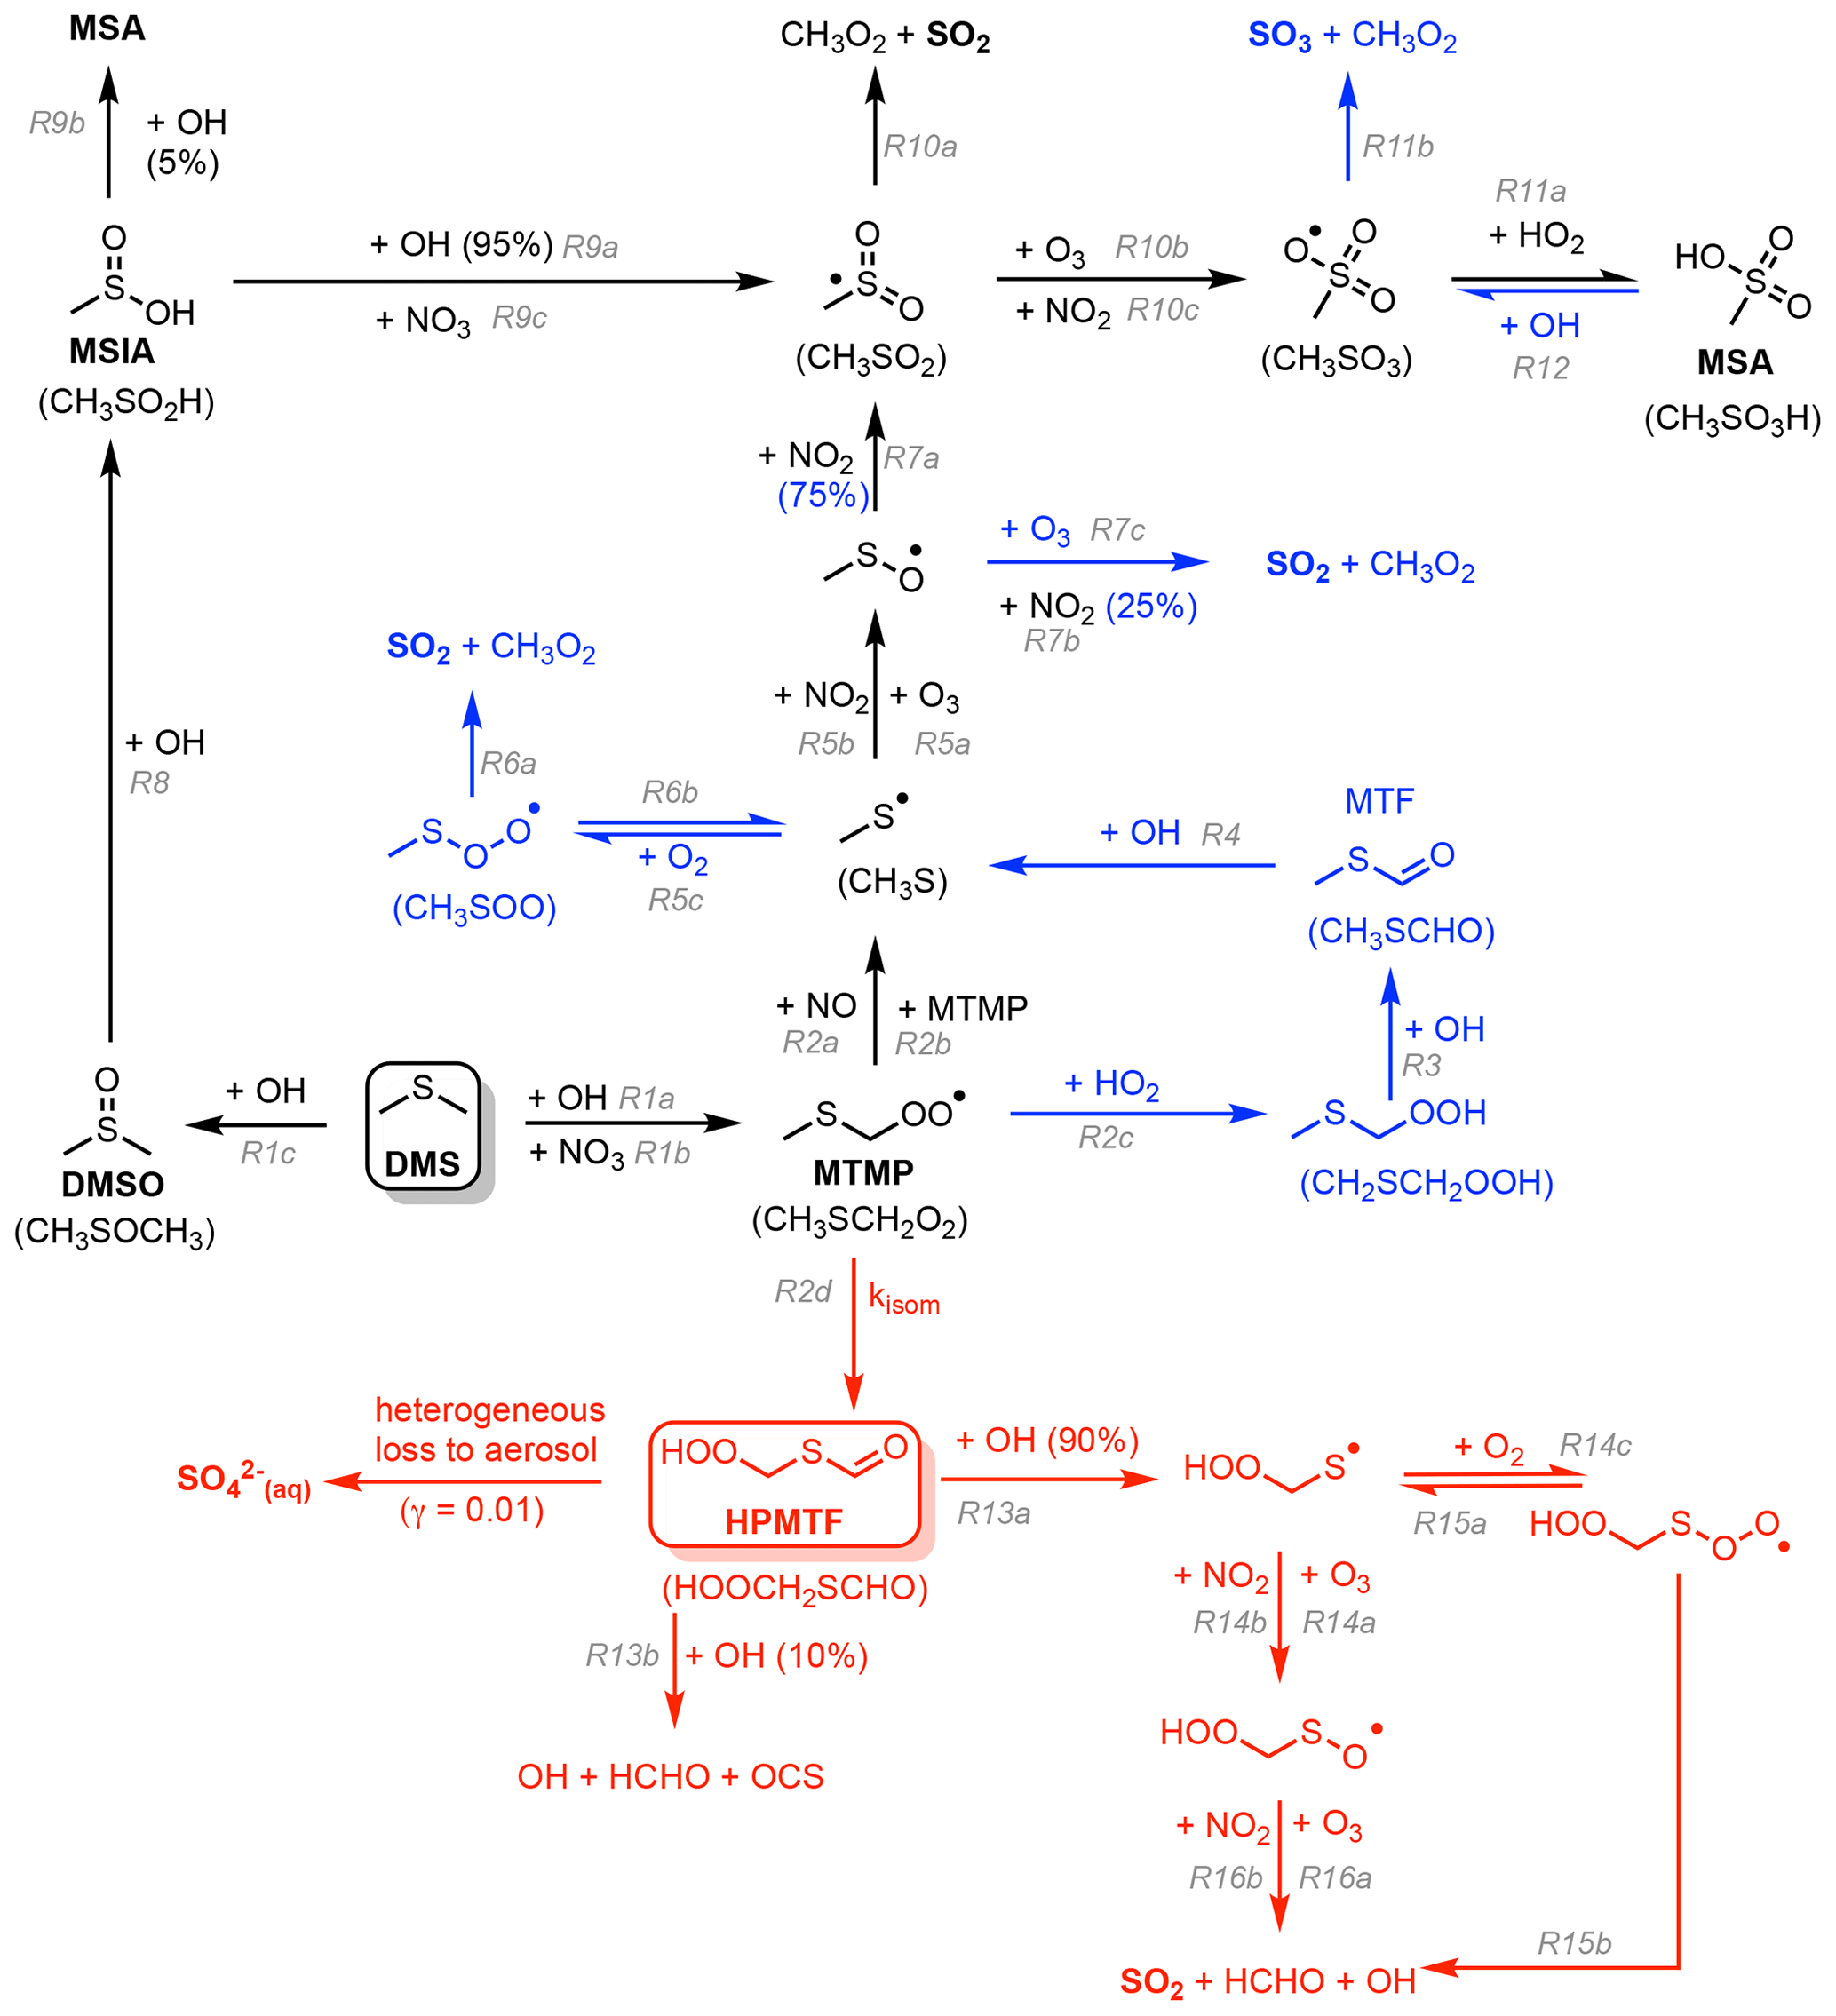
Figure 1Schematic summary of the changes and additions to the gas-phase DMS oxidation mechanism in CS2. The current chemistry in CS2 (Weber et al., 2021) is in black, changes associated with CS2-UPD-DMS are shown in blue, and changes associated with the addition of the isomerisation pathway for CS2-HPMTF are shown in red.
2.2 New mechanism development
The current CS2 DMS oxidation mechanism is based on von Glasow and Crutzen (2004). This mechanism is based on an outdated understanding of DMS oxidation, which excludes key pathways and intermediates that are now known to be well established (Barnes et al., 2006) and more recent pathways and products that have been shown to be important (Veres et al., 2020). Our aim with the development of the new mechanism is to build upon the existing mechanism in CS2 and to update and extend it. To this end we performed a literature review and constructed a number of mechanistic variants that were examined in a series of box model experiments (see the Supplement Sect. S1.2 for further details). As with all mechanism development exercises, a series of target compounds were chosen to reduce the mechanism to achieve a scheme that is parsimonious for use in a 3D chemistry–climate model. In our study we chose DMS, SO2, sulfate (H2SO4), and HPMTF as the key target molecules for mechanism optimisation. Figure 1 shows the two-step improvement of this mechanism. First, the improvement of the standard chemistry by updating rate constants for existing reactions in the scheme or the addition of reactions that were missing (denoted with blue colouring in Fig. 1) and, second, the addition of the HPMTF pathway (in red in Fig. 1). The focus in this study is on gas-phase DMS oxidation by OH and NO3. Our prime focus is on the primary oxidation products (DMSO and MTMP) and their subsequent chemistry. While other studies include DMS oxidation by BrO and Cl, the contribution is either negligible or there is a large uncertainty attached due to substantial discrepancies between or within models and measurements of halogens and halogen oxides (Wang et al., 2021; Fung et al., 2022). Moreover, UKCA currently does not have a comprehensive tropospheric halogen mechanism, and levels of BrO and Cl simulated are much lower than observations suggest.
The updates made to the standard CRIStrat 2 DMS scheme are presented in Tables 2 and 3. Please see Sect. S1.2 in the Supplement for a complete description of how these updates were made.
Table 2Summary of the H-abstraction and OH-addition branches in the DMS oxidation pathway. Reactions in bold are newly added in this work.
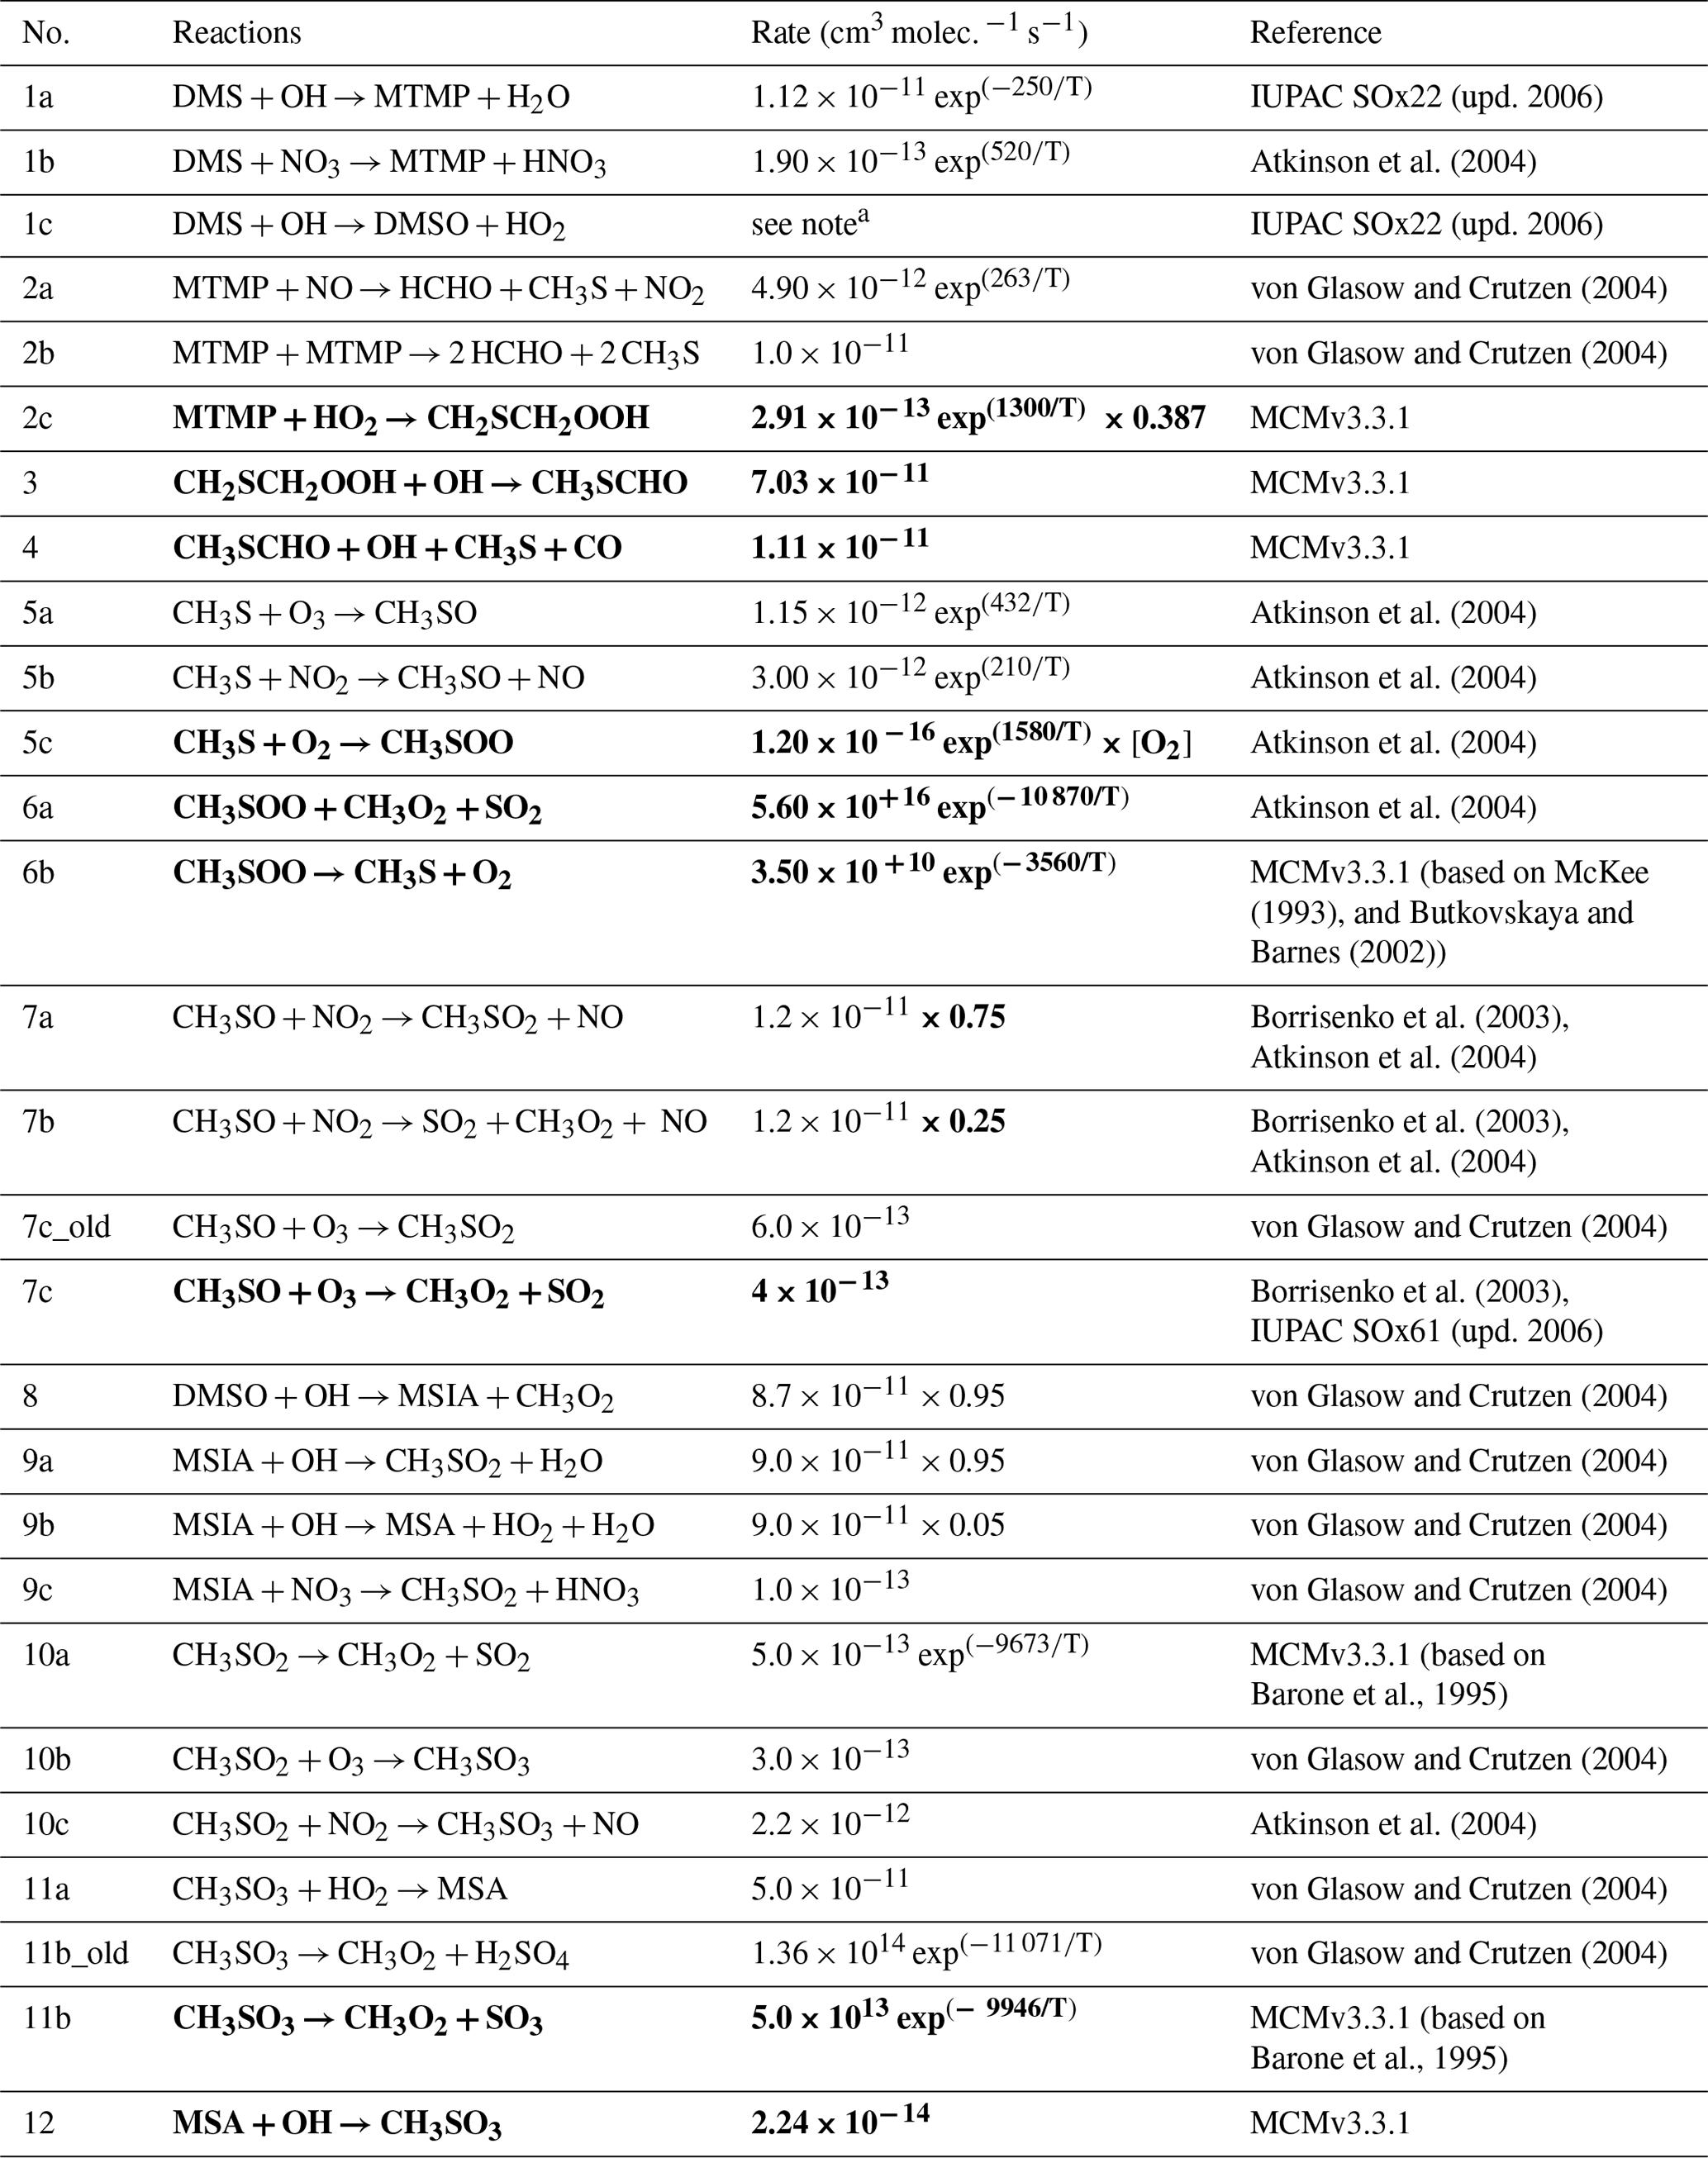
a 9.5 × 10−39 exp × [O2] (1+7.5 × 10⁻²⁹ exp × [O2]).
Table 3Summary of the isomerisation branch of the H-abstraction pathway. Rate constants referenced to this work are described in Sect. S1.2.1 in the Supplement.
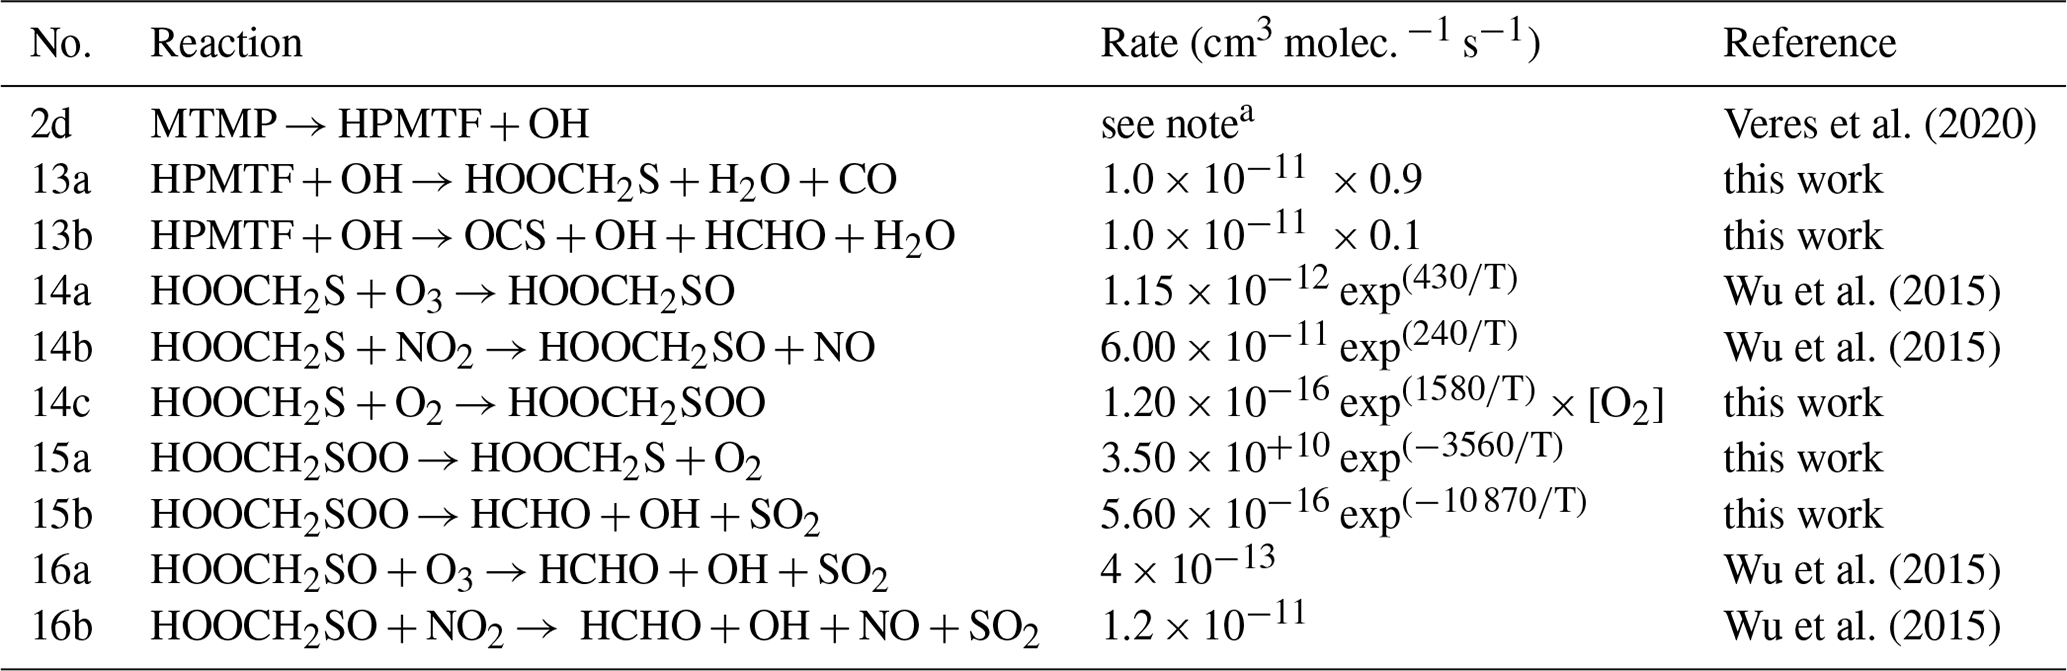
a 2.24 × 10+11 exp exp.
2.3 Description of observational data
2.3.1 The NASA Atmospheric Tomography (ATom) mission
An observational dataset used to compare with the model simulations stems from the fourth flight campaign of the NASA Atmospheric Tomography mission (ATom-4). ATom-4 took place during April and May 2018 and completed a global circuit around the Americas: from the Arctic to the Antarctic over the remote Pacific and Atlantic oceans at varying altitudes up to 12 km. A vast number of atmospheric species were measured, including DMS, HPMTF, and SO2 (Wofsy et al., 2018).
In order to compare the 3D model outputs with the data from the ATom-4 campaign, the hourly outputs from the respective model runs were interpolated in regard to time and space to generate the data along the flight path. Only model data at times where valid atmospheric measurements were available are taken into account, resulting in 313 data points for DMS (whole-air sampling) and 36 652 for SO2 (laser-induced fluorescence).
2.3.2 Surface observations
Other observational measurements are monthly averages (mean) from the years 1990 to 1999 for DMS measurements made on Amsterdam Island (37∘ S, 77∘ E) in the southern Indian Ocean (Sciare et al., 2000) and the monthly means from 1991 to 1995 for sulfate at the Dumont d'Urville station (66∘ S, 140∘ E) on the coast of Antarctica (Minikin et al., 1998). The diel profile of HPMTF as measured at Scripps Pier in July 2018 was taken from Vermeuel et al. (2020). See the Supplement Sect. S2.1 for the analysis of the modelled and observed DMS mixing ratios.
Here we present the results of a series of box model simulations using the BOXMOX model (Weber et al., 2020). With BOXMOX we look at the diversity in results from simulations using a range of mechanisms, including our newly developed mechanism. These simulations are not constrained to observations or simulation chamber data. The set-up of the BOXMOX simulations is described in Sect. 2.1.1. We focus the analysis here on DMS and its major oxidation products and the effects of temperature and [NOx] on these. Sect. 3.1 compares DMS mechanisms based around the CS2 and ST schemes used in UKCA (Table 1). In Sect. 3.2 our newly developed mechanism is compared to other DMS mechanisms from recent literature that also include HPMTF formation.
3.1 Comparison of DMS mechanisms used for UKCA
3.1.1 Time series analysis
The BOXMOX set-up allows a quasi steady state to be achieved for a number of key sulfur species, with the main exception being H2SO4, which builds up over time in the model as the model is run without aerosol formation and aerosol microphysics included (Fig. 2). The DMS concentration simulated with different DMS mechanisms used in UKCA is simulated to be very similar throughout all model runs; the small variations stem from different oxidant concentrations or small differences in the rate constants used for the initiation reaction in the different mechanisms (Fig. 2a). For instance, the ST run has higher DMS concentration because the NOx concentration is lower (as is OH) and less DMS is oxidised.
The SO2 concentration is increased and MSA significantly decreased in the updated CS2 runs (CS2-HPMTF and CS2-UPD-DMS) compared to CS2 (Fig. 2b, c). Comparing CS2-HPMTF and CS2-UPD-DMS, we can see that this pattern (increased SO2 and decreased MSA) is due to Reaction (7c), which directly forms SO2 and suppresses CH3SO2, consequently lowering MSA formation. The SO2 concentration is lower in CS2-HPMTF compared to CS2-UPD-DMS because the addition of HPMTF produces OCS, which acts as a long-lived sulfur reservoir. While MSA concentration is very similar between CS2 and ST, SO2 concentration is not. This is primarily explained through the difference in the treatment of MSA and SO2 production in CS2 and ST. MSA is not treated as a reactive species in CS2 and ST (in so much as there are no further reactions of MSA after its production). In ST and ST-CS2, 100 % of DMS yields SO2, regardless of the amount of MSA production. However, as more MSA is produced in CS2 the SO2 yield is lowered. In spite of higher SO2 concentrations in the ST DMS schemes, this trend does not translate to H2SO4 concentration (Fig. 2d). SO2 is a relatively long-lived species (∼2 d in our model but with a range from 0.5–2.5 d (Lee et al., 2011)) and can therefore be lost through the mixing processes with the background air in the BOXMOX setup. In CS2, CH3SO3 decomposition provides a direct pathway to H2SO4 production. In the updated CS2 schemes (CS2-UPD-DMS and CS2-HPMTF) SO3 production with instantaneous transformation to H2SO4 is included. The slower rate constant in CS2 for the decomposition of CH3SO3 (11b_old) is compensated for by a higher production of CH3SO3.
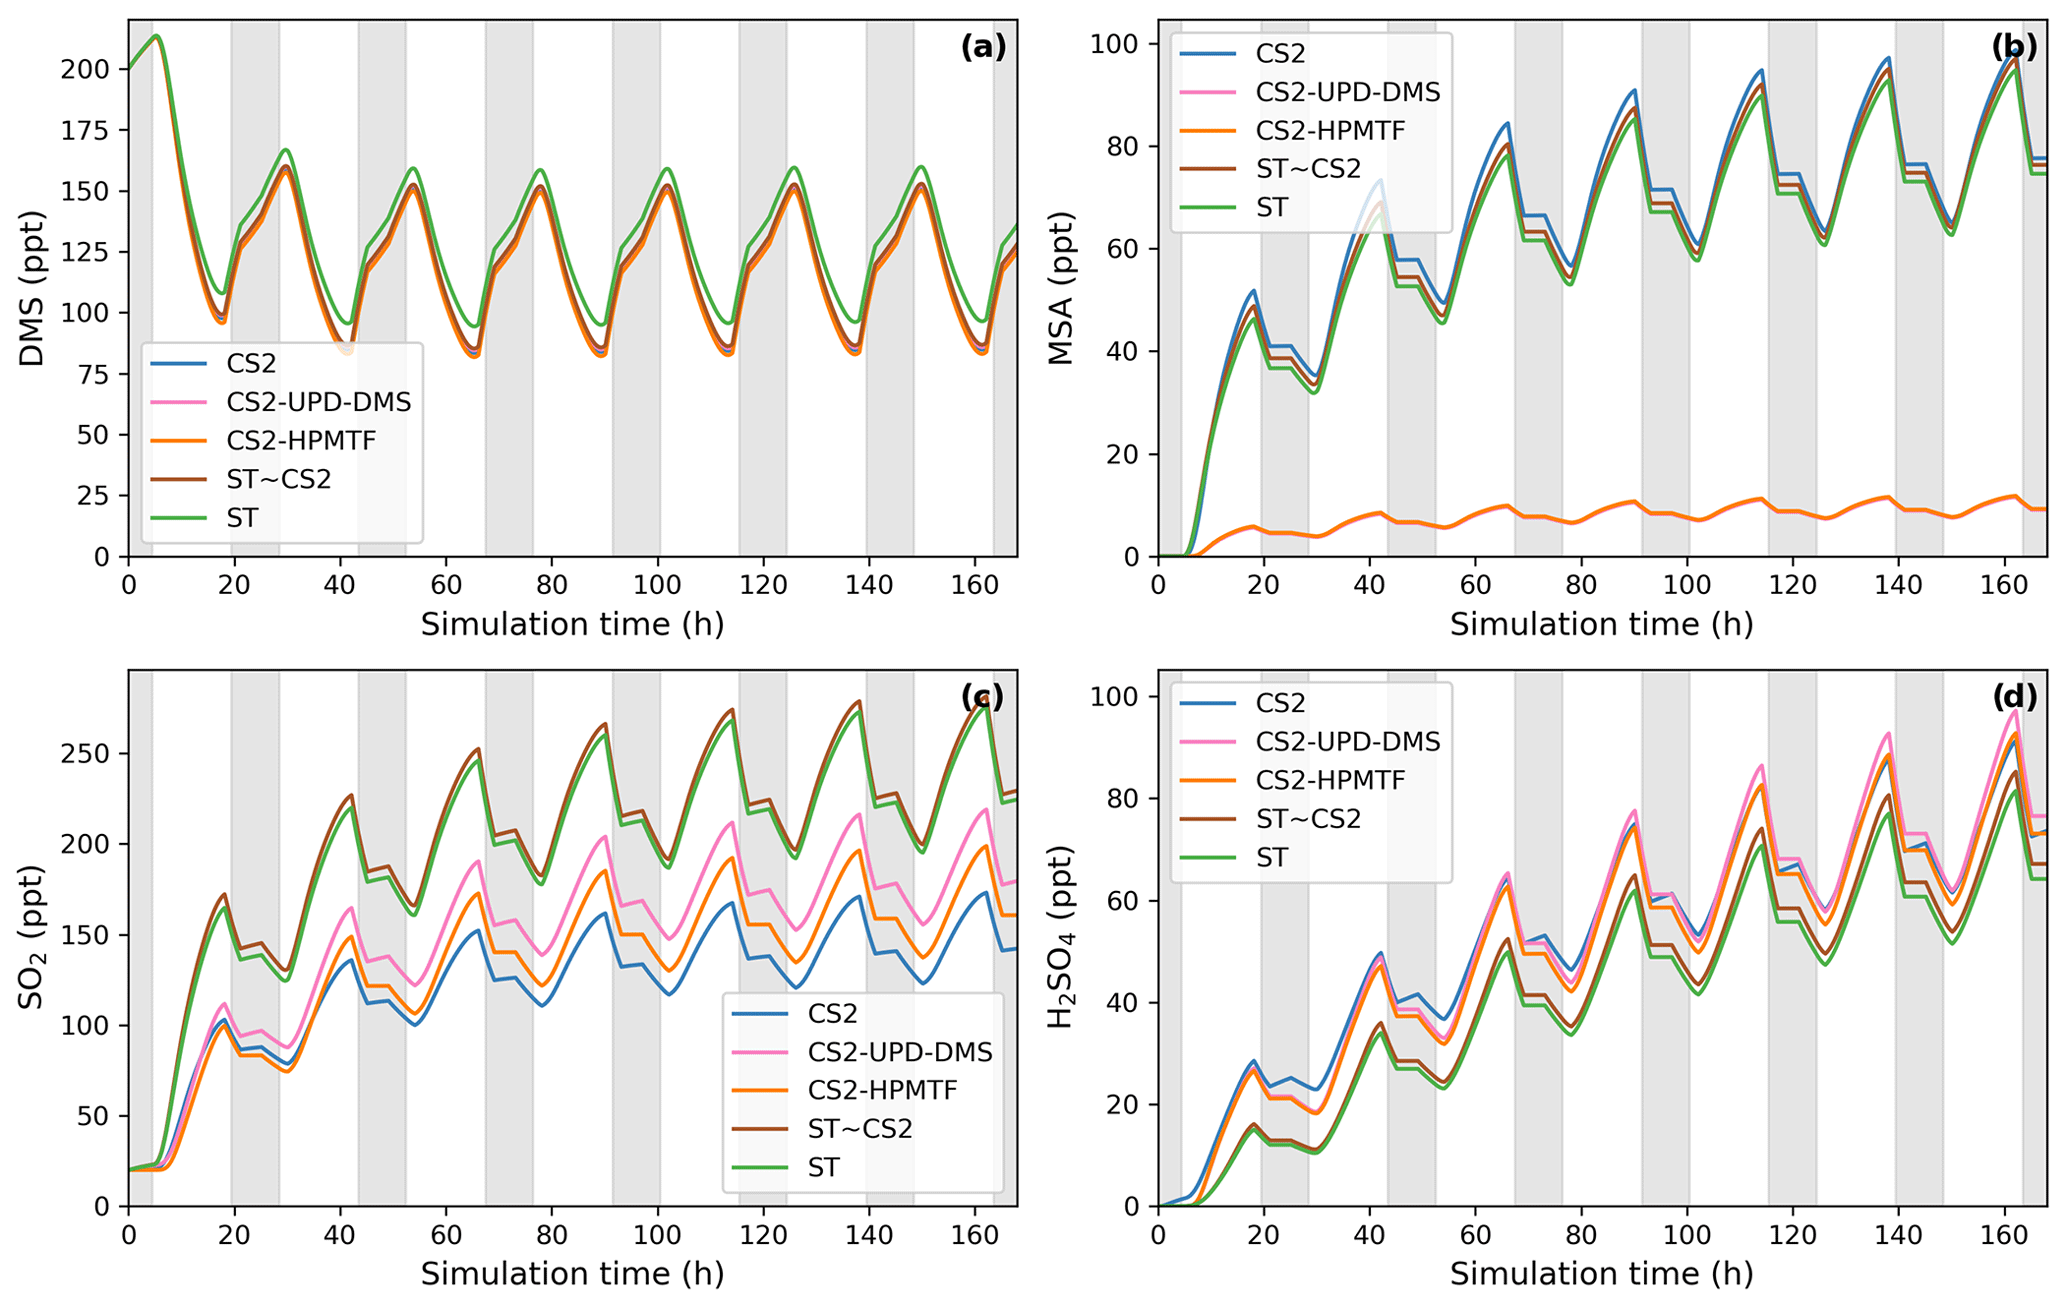
Figure 2BOXMOX-simulated gas-phase concentrations as a function of time for a selection of species simulated with the different DMS gas-phase oxidation schemes used in UKCA configurations (oxidation by OH and NO3). Grey areas denote nighttime, when no photolysis reactions are taking place. Average NOx concentration is approximately 10 ppt, with an average temperature of 293 K (range: 289–297 K).
3.1.2 Sensitivity of UKCA DMS schemes to temperature
As described in Sect. 2.1.1, a series of BOXMOX experiments were performed perturbing the temperature profile in the model (Fig. 3).
As temperature increases in the box model, the steady-state DMS concentration increases in all simulations. This is mainly because the DMS oxidation by OH addition is negatively temperature dependent. For most models, DMS concentration increases by 85–93 ppt throughout the temperature range from 260 to 310 K, except the ST run, where at temperatures over 290 K a stronger increase in DMS concentration is found, with a total increase of 106 ppt. This could be due to different oxidant concentrations in the model runs using the ST mechanism and independent of the DMS scheme since this stronger increase is not found with CS2-ST.
Although the kinetics, and therefore temperature dependence, of DMS loss are comparable across the different schemes, the dependence of MSA and SO2 on temperature differ significantly.
Most MSA is formed from the OH-addition channel, which is favoured at low temperatures (Barnes et al., 2006). Therefore, the MSA concentration is higher at lower temperatures across all the UKCA DMS schemes considered (Fig. 3b). In the ST schemes (ST and ST-CS2), MSA decreases by around 88 % (−189 and −197 ppt) throughout the temperature range considered, while in all the CS2 schemes MSA is shown to be much more sensitive to temperature, decreasing by >96 % (CS2: −300 ppt, CS2-UPD-DMS: −222 ppt, CS2-HPMTF: −222 ppt ) between 270 to 290 K. We attribute this to differences in the rate constant of DMS oxidation through the OH-addition channel (see Tables 2 and S1.4.1) used in the UKCA ST schemes and the UKCA CS2 schemes. The expression used in the ST family of schemes (the provenance of which is Pham et al. (1995); see Table S1.4.1) has a much shallower gradient with temperature than the expression used in the CS2 family of schemes (which is based on the latest IUPAC recommendation). The average MSA concentration for the UKCA schemes diverges most in the temperature range between 270–300 K.
The difference in SO2 concentrations between the CS2 schemes and ST schemes is greatest at lower temperatures (Fig. 3c), with the ST and CS2-ST schemes simulating ∼5 times (+200 ppt) the SO2 that is simulated in the other schemes based around CS2. In the ST schemes, SO2 concentration either stays at a similar level across the whole temperature range (ST: +3 %) or slightly decreases (ST-CS2: −9 %). Conversely, the CS2 family of schemes show a positive temperature dependence (i.e. , across the temperature range, especially in the range of relevant atmospheric temperatures from 270 to 290 K. SO2 increases by 298 % in CS2, 84 % in CS2-UPD-DMS, and 79 % CS2-HPMTF. In the CS2 schemes, more DMS reacts through the addition pathway, which favours the production of MSA, instead of SO2; therefore, the SO2 concentration is reduced. In ST, the addition pathway still leads to 100 % SO2 formation, making the average SO2 concentration less dependent on temperature. Experimental findings (Arsene et al., 1999) and field measurements (Sciare et al., 2001) both show a positive temperature dependence of SO2 concentration. This trend is only reproduced by the DMS schemes based on the CS2 mechanistic features (i.e. not the very simple mechanism used in ST), indicating that the ST DMS chemistry is likely insufficient to explain laboratory and field observations, particularly in cold environments and under climate change.
In these box model experiments only gas phase losses and mixing of species with background air are considered. Under the conditions of our simulations, we find that the MTMP isomerisation pathway mainly yields SO2, as does the rest of the abstraction pathway. Therefore, the addition of the isomerisation branch does not have a significant impact on the temperature dependence of SO2 concentration (comparing CS2-UPD-DMS and CS2-HPMTF), even though the isomerisation step itself is greatly temperature dependent.
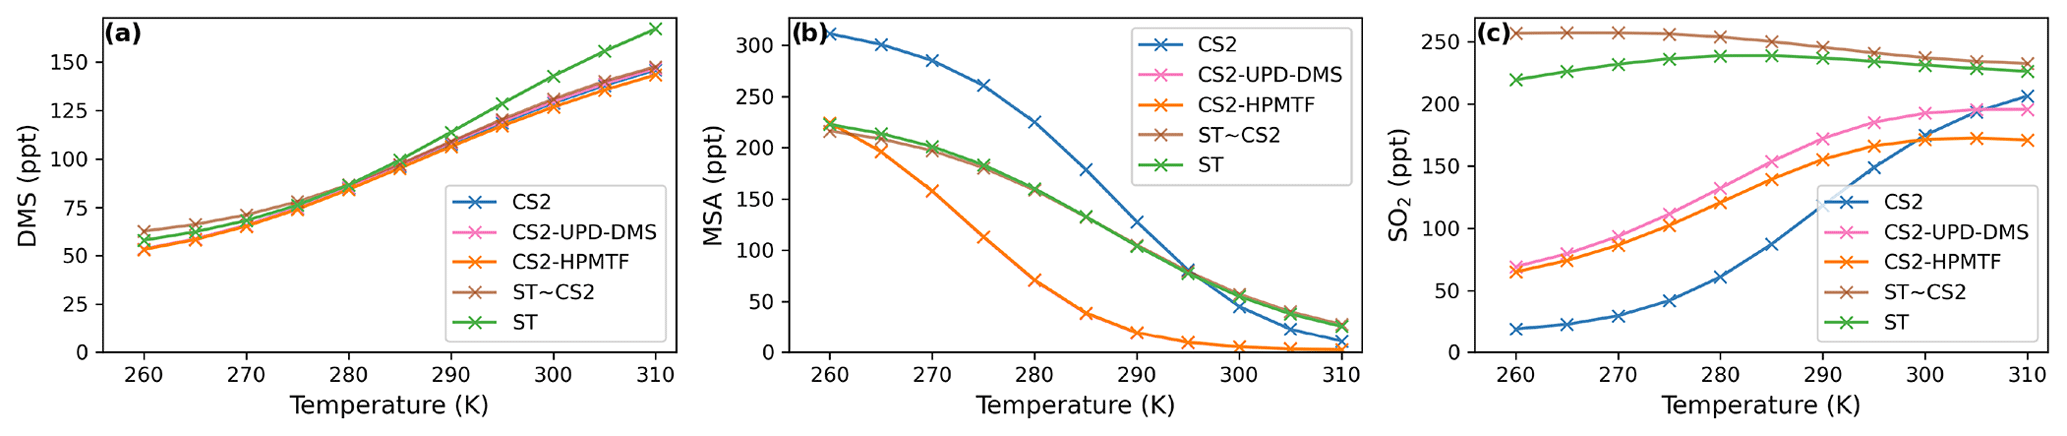
Figure 3Temperature dependence of average (a) DMS, (b) MSA, and (c) SO2 concentration after a quasi-steady state is reached in the box model simulations using the DMS schemes for UKCA.
3.2 Comparison with DMS schemes that include HPMTF from the recent literature
Here, four recently published DMS schemes that also include the isomerisation pathway and formation of HPMTF are compared with our new mechanism, CS2-HPMTF (CS-H, 36 reactions in DMS scheme), as follows. To make the studies comparable, only DMS oxidation by NO3 and OH and gas-phase reactions are considered. The implementation of these chemical schemes in BOXMOX can be found in the Sect. S1.3.
-
Fung et al. (2022) (FG). This scheme includes 32 reactions for the DMS oxidation chemistry. The H-abstraction pathway is based on the Master Chemical Mechanism (MCM), while the rate constants in the OH-addition pathway mostly stem from Burkholder et al. (2015) or a scaled up version of those. The rate constant of MTMP isomerisation to HPMTF is based on Veres et al. (2020).
-
Wollesen de Jonge et al. (2021) (WJ). This scheme is the most complex and consists of 98 reactions, including reactions from the MCM and from Hoffmann et al. (2016). The isomerisation branch mostly uses the rate constants by Wu et al. (2015), except the first isomerisation rate constant, which is a combination of Veres et al. (2020) and Berndt et al. (2019).
-
Khan et al. (2021) (KH). This scheme is based on Khan et al. (2016), which is equivalent to the DMS chemistry in CS2 (CRI v2 R5). The mechanism was modified to include the isomerisation pathway and photolysis loss and temperature-dependent OH oxidation of HPMTF by the authors. In total, the DMS chemistry consists of 38 reactions, 5 of which are photolysis reactions.
-
Novak et al. (2021) (NV). This is a simplified scheme that aims to only include the intermediates necessary for HPMTF formation and consists of only 10 reactions. DMS therefore either directly yields MSA (without DMSO formation) or first forms MTMP, which isomerises to form HPMTF or is oxidised to SO2.
Using this ensemble of gas-phase DMS oxidation schemes in BOXMOX simulations leads to significant differences in the concentrations of important oxidation intermediates and products despite DMS concentrations being similar across all models (Fig. 4).
3.2.1 Time series analysis of different DMS-HPMTF schemes
The depletion of DMS due to OH and NO3 oxidation is similar across most models (Fig. 4a) since the major oxidants are relatively constrained by the box model experiment set-up (see Sect. 2.1.1) and mostly rely on IUPAC or JPL recommended values (Atkinson et al., 2004; Burkholder et al., 2015). One exception is NO3 oxidation in the FG scheme, which uses a rate constant that is a factor of approximately 6 higher than the JPL recommendation. On the one hand, this does not affect DMS concentration, since OH oxidation of DMS plays a greater role; on the other hand, the concentration of NO3 in the FG scheme's simulation run is controlled by the greater NO3 oxidation rate (Fig. 4b). WJ includes the intermediate CH3S(OH)CH3 and its decomposition back to DMS (based on Hoffmann et al., 2016), which in their experiments improved the fit between their measured and modelled DMS concentration. Here, this does not have any significant impact on DMS concentration compared to all the other schemes.
Significant differences between the models can be found for the DMSO concentration (Fig. 4c). KH and CS-H have the highest DMSO concentration since all DMS that is oxidised through the OH-addition pathway yields DMSO. This is not the case for WJ, where CH3SOH and to a lesser extent DMSO2 are also possible products. In the FG simulation, DMSO concentration is close to zero, which is due to a much faster loss of DMSO, i.e. a rate constant a factor of 15 faster than experimental measurements by Urbanski et al. (1998). NV does not include DMSO as an intermediate. Since the lifetime of DMSO was found to be several hours (Urbanski et al., 1998; Ye et al., 2021), deposition of DMSO could act as a significant sink of atmospheric sulfur (as found by Chen et al., 2018). Fast oxidation of DMSO in FG or omitting the species in NV might therefore lead to an over-estimation of other DMS oxidation products in those schemes.
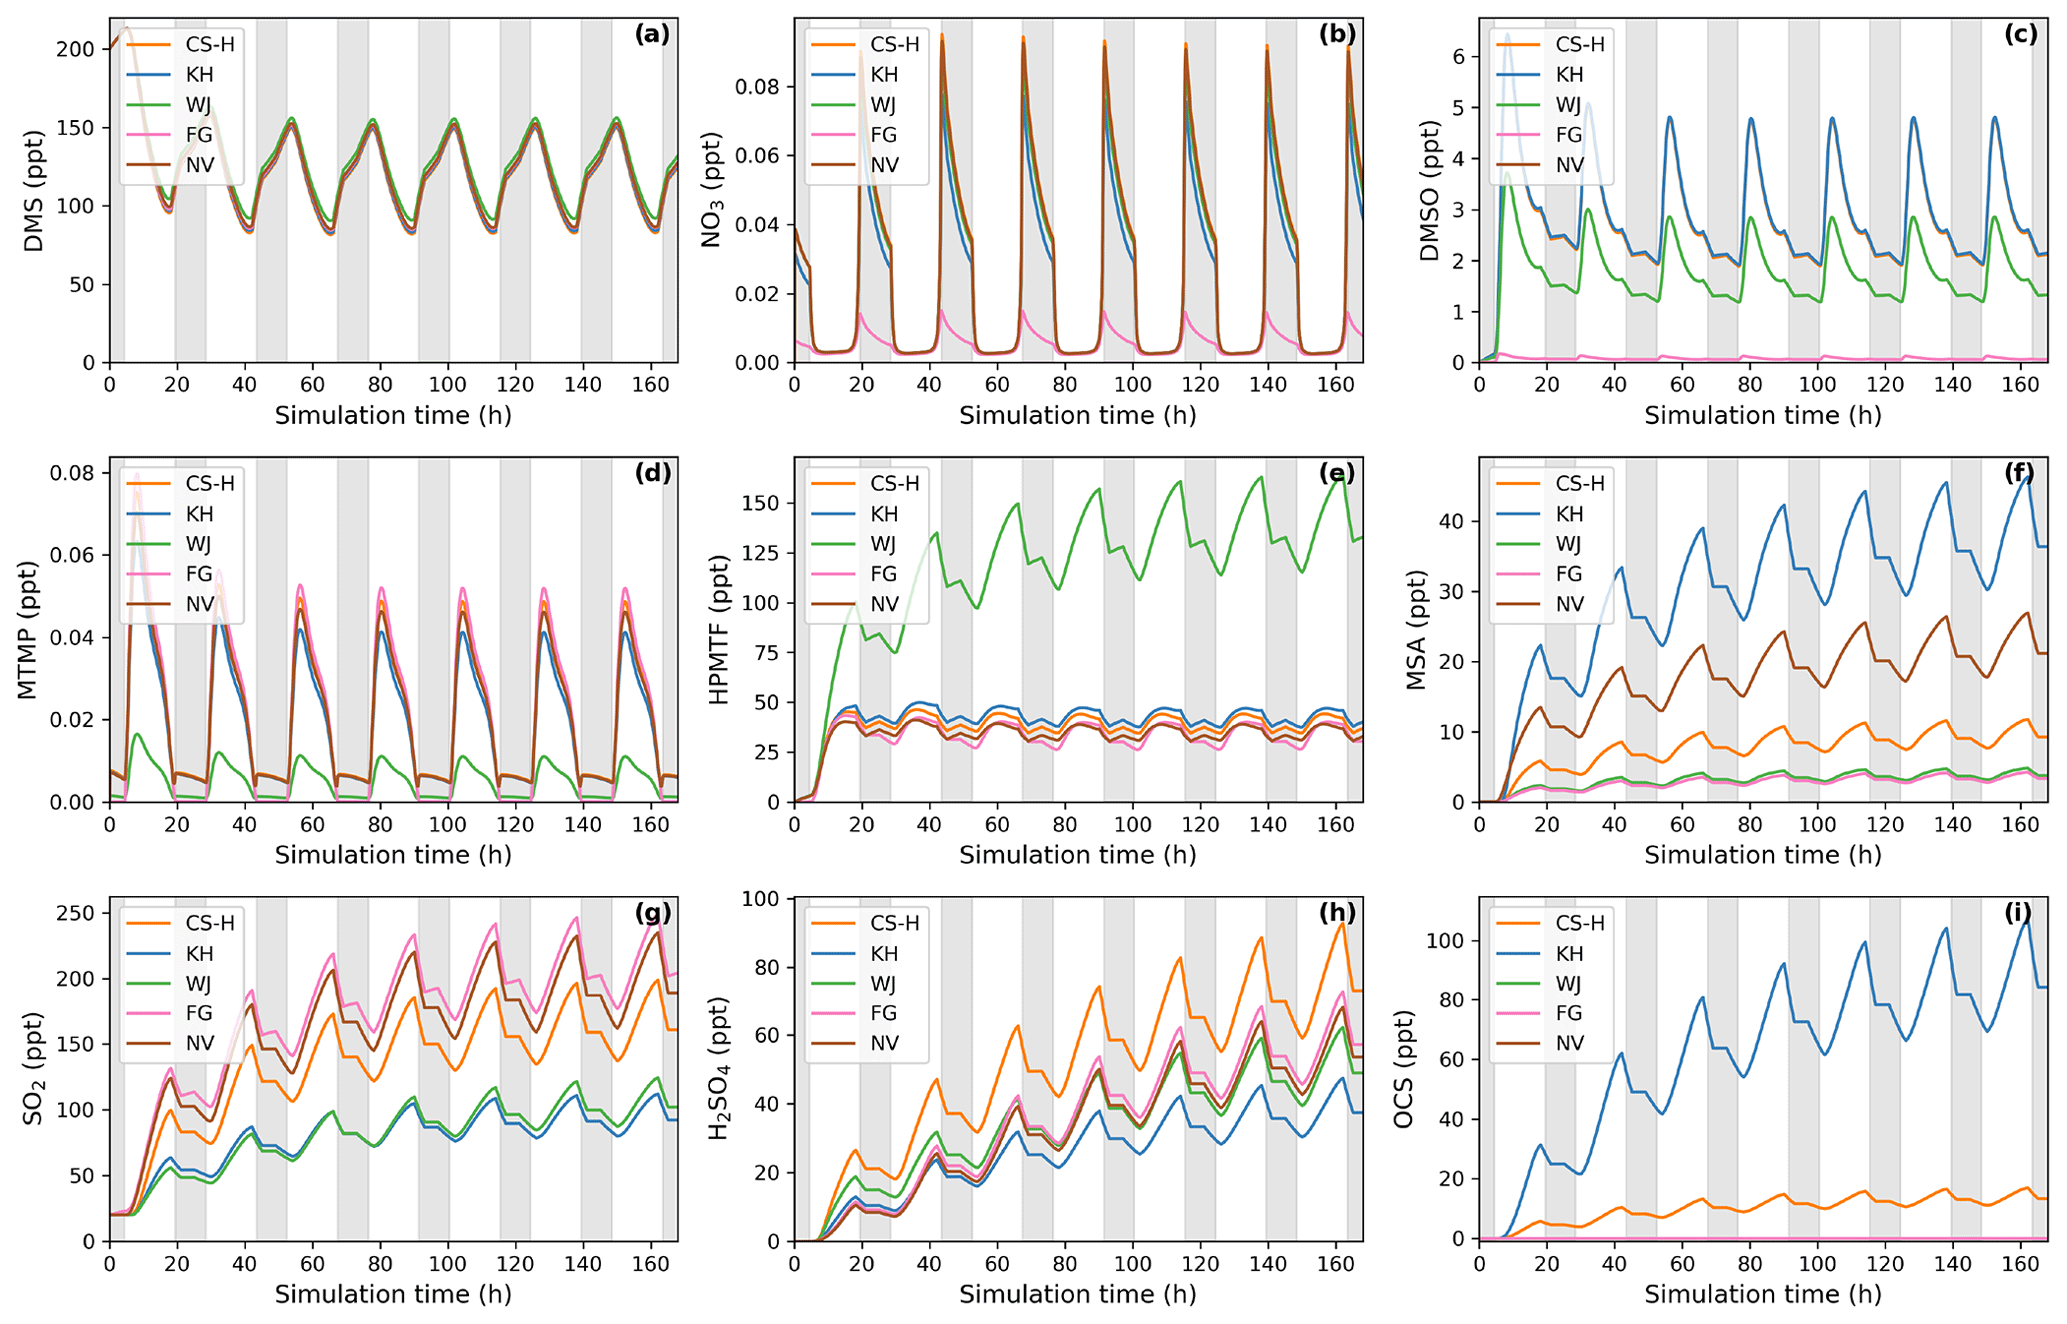
Figure 4Gas-phase concentrations as a function of time for different DMS gas-phase oxidation schemes (oxidation by OH and NO3). Average NOx concentration is approximately 10 ppt, with an average temperature of 293 K (range: 289–297 K). Grey areas denote nighttime, when no photolysis reactions are taking place.
Regarding the intermediate MTMP, WJ shows the greatest deviation from the ensemble (Fig. 4d). The MTMP concentration never exceeds 0.02 ppt in WJ, while the other mechanisms simulate concentrations over three times higher. WJ employs a faster isomerisation rate constant of MTMP to HPMTF. They scale the A factor by 5 to get a rate constant that is a combination of the theoretical calculations by Veres et al. (2020) and the experimental findings by Berndt et al. (2019). Additionally, they include more oxidation reactions of MTMP (such as oxidation by NO3), but since the isomerisation to HPMTF already outcompetes most oxidation reactions anyway (>97 %), we found them to play a negligible role (<0.1 %). In the FG scheme, DMS + NO3 leads to immediate SO2 formation without prior MTMP formation. Therefore, no MTMP is produced during the nighttime, when NO3 oxidation becomes relevant. Under conditions with low NOx (around 10 ppt in this experiment), this does not have significant impacts, but at higher NOx concentrations this leads to a major deviation from the other simulations (Fig. 5a, 100 ppt NOx). At night, CS-H, KH, and NV reach MTMP concentrations of 0.07 ppt, allowing nighttime HPMTF formation, while FG stays at zero.
All model simulations except WJ are very similar in HPMTF concentration (Fig. 4e). The fast isomerisation rate constant in WJ is one of the reasons HPMTF concentration is on average more than 3 times higher than the other model simulations. The other reason is a much slower oxidation of HPMTF by OH. While most models use a value of (or close to) cm3 molec.−1 s−1 recommended by Vermeuel et al. (2020), WJ use the much slower rate constant calculated by Wu et al. (2015), i.e. cm3 molec.−1 s−1. This rate constant is also used in the KH scheme, but it additionally includes HPMTF depletion by photolysis, which ultimately leads to the similar HPMTF concentration to in CS-H, FG, and NV. The addition of the photolysis reactions in KH does not affect the diel profile of HPMTF, even though those account for 81 % of chemical loss of HPMTF in their scheme. It is therefore unlikely that the observed diel profile of HPMTF by Vermeuel et al. (2020) and Khan et al. (2021) can be explained solely by considering loss of HPMTF to aldehyde and hydroperoxide photolysis. Reducing HPMTF formation to one isomerisation reaction without any side reactions, as is done in this work and NV, also does not affect the diel profile of HPMTF significantly.
The effect of higher NOx conditions on the diel profile of HPMTF varies significantly between the different schemes (10 ppt NOx in Fig. 4 vs. 100 ppt NOx in Fig. 5). Higher NOx concentration leads to more DMS oxidation by NO3 at night and the subsequent increase in MTMP concentration and therefore HPMTF concentration during the night hours in the CS-H, WJ, KH, and NV simulations. At low NOx, HPMTF concentration stayed more or less stable throughout the nighttime and increased in the morning, reaching a plateau in the afternoon, and dropping in the evening (Fig. 4e). Under higher NOx conditions, HPMTF increases in these mechanisms throughout the night and decreases throughout the day when it is oxidised by OH (Fig. 5b). In the WJ simulation, the diel profile has more plateaus and small deviances but the overall trend still fits the described pattern. This is not true for FG, where DMS oxidation by NO3 leads directly to SO2 formation.
While the diel profile of MSA looks similar for all simulations, the average concentrations do not (Fig. 4f). The highest average steady-state MSA concentration is reached in the KH simulation, which is a factor of 10 higher than the lowest average concentration in the FG simulation. In our experimental setup, most of the simulations we performed with the different mechanisms do not include any (significant) gas-phase chemical loss pathway for MSA; MSA is only lost through mixing and transport out of the “box”. Therefore, the concentration of MSA is a direct reflection of MSA production in the respective simulations.
KH simulates the highest production of MSA (similar to CS2), where MSA is formed through the addition (MSIA + OH → 0.05 MSA + 0.95 CH3SO2, Reaction 9b, c) and the abstraction channel (CH3SO + O3 → CH3SO2, reaction 7c_old) of DMS oxidation, with CH3SO2 partly being oxidised to CH3SO3 and then to MSA (Reactions 10b, c, 11a). The decomposition of CH3SO3 to H2SO4 in KH is slower than in other mechanisms, increasing the branching ratio for MSA formation in their mechanism. In NV, the simulation with the second-highest average MSA concentration, the only source of MSA is the direct production of MSA through OH oxidation through the addition channel, where 25 % of DMS forms MSA. In both CS-H and WJ, the abstraction pathway mostly produces SO2 and only contributes negligible amounts to CH3SO2 formation (hence MSA). Similar to KH, the oxidation of DMS through the addition pathway in CS-H and WJ yields CH3SO2, of which a part forms MSA. However, not all of the CH3SO2 results in MSA, as some of it also decomposes to SO2 or yields SO3. This explains the lower concentration of MSA in CS-H and WJ compared with NV. The reason why CS-H has a higher MSA concentration than WJ is because of the inclusion of Reaction (9b) (Table 2), which yields MSA directly and is not part of the WJ scheme.
The lowest MSA concentration is found in FG and WJ, where 60 % of the OH-addition pathway directly produces SO2. Out of the 40 % of DMS that forms DMSO in this pathway, only a fraction yields MSA.
To harmonise the results and aid interpretability, the same rates (based on CS2) are used for the loss processes of SO2 in all the mechanisms considered here; therefore, the concentration of SO2 can be used as a proxy for SO2 production, just as for MSA. The highest SO2 concentration can be seen in schemes that have the smallest number of intermediates or the most direct pathways from DMS to SO2 in NV and FG (Fig. 4g). Fewer intermediates result in fewer opportunities for the formation of side products or fewer long-lived species that can be lost through transport or deposition. For instance, in WJ HPMTF is lost through mixing with the background before it can form SO2. Likewise, KH has a higher ratio of MSA and OCS production, which lowers the SO2 yield. The diel profile of SO2 concentration is not affected by higher NOx concentrations in most simulations, with the general trend being an increase in SO2 concentration during the day and a decrease at night (Fig. 5c). The only exception is the FG simulation, where we see a clear increase through part of the night due to the reaction DMS + NO3 → SO2.
The H2SO4 concentration is influenced by SO2 production, CH3SO3 production, and the rate of decomposition of SO3 to H2SO4. CS-H has the highest average H2SO4 concentration and KH the lowest; all other models are very similar to each other (Fig. 4h). In general, higher SO2 concentration leads to more H2SO4, since SO2 is first oxidised to SO3 and then to H2SO4 with the same rates across all schemes. However, all models except NV include an additional pathway of H2SO4 formation: in KH and FG, H2SO4 is directly formed from CH3SO3, while in CS-H and WJ, CH3SO3 decomposes to SO3 first, which then instantly reacts to H2SO4. In KH, the rate constant for the decomposition of CH3SO3 at 295 K is a factor of 15 slower than in the other models. Since the SO2 concentration is also relatively low, it explains why KH has the lowest H2SO4 concentration of all schemes when reaching steady state. CS-H results in a higher H2SO4 concentration than FG or NV even though those models have a higher SO2 concentration. The reason is a higher production of CH3SO3 that is then decomposed to SO3 and H2SO4.
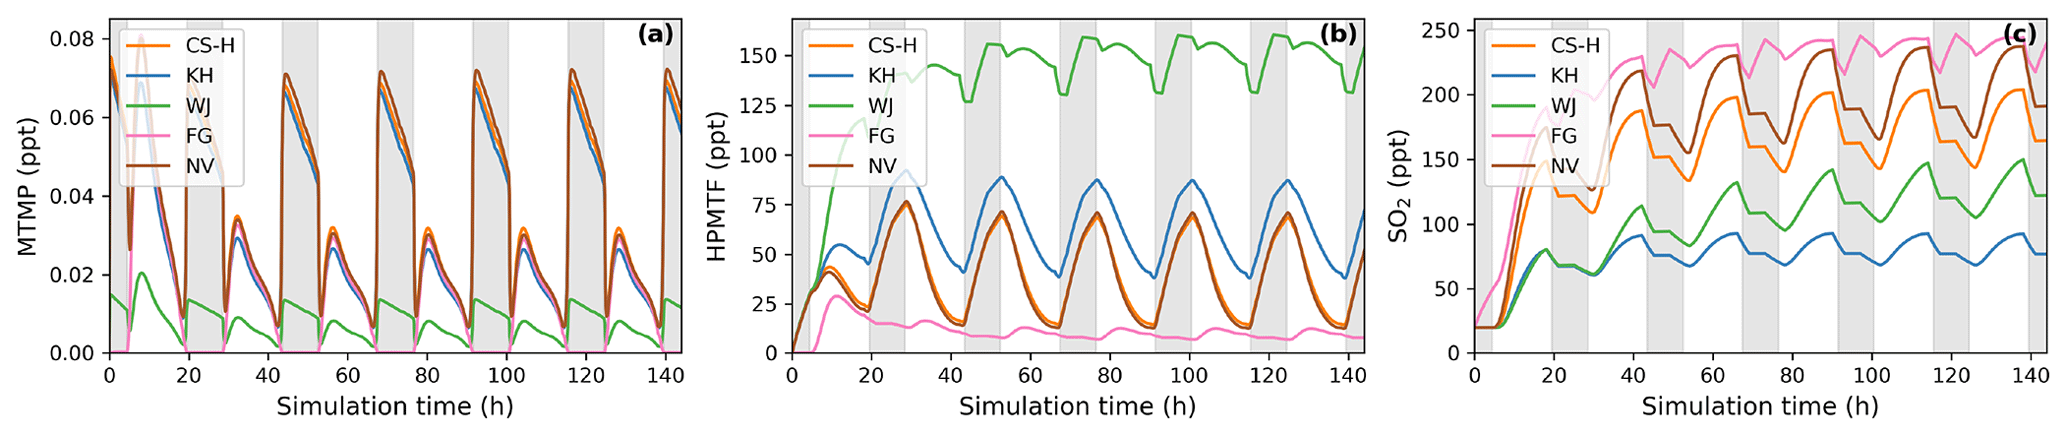
Figure 5BOXMOX simulations where the average NOx concentration is approximately 100 ppt (a factor 10 greater than for the results presented in Fig. 4). (a) MTMP, (b) HPMTF, and (c) SO2 concentration as a function of time for different DMS gas-phase oxidation schemes (oxidation by OH and NO3). Average temperature of 293 K (range: 289–297 K). Grey areas denote nighttime, when no photolysis reactions are taking place.
Similar to the other products of the DMS scheme, the concentration of OCS is a reflection of its production. OCS is only produced from oxidation of HPMTF by OH and, in the KH scheme, through photolysis of HPMTF. In KH, 60 % of HPMTF forms OCS, resulting in the highest OCS concentration (Fig. 4i). This stems mainly from the large contribution of the photolysis reactions. Potentially, the rate constant of OH oxidation of HPMTF in KH is too low and therefore OCS might be overestimated. In CS-H, 10 % of HPMTF is oxidised to OCS, resulting in an OCS concentration that is on average 5.5 times lower than KH. FG and WJ both use the theoretically determined branching ratio by Wu et al. (2020), which results in only 0.007 % of HPMTF being oxidised to OCS at 295 K. NV does not include this pathway. Very recent evidence suggests that there is a small (2 %) but prompt source of OCS following the formation (and decomposition) of HPMTF and a significant OCS yield (13 %) from the HPMTF + OH reaction (Jernigan et al., 2022). These new data were not assessed (or included) in this work, but we estimate that inclusion of these mechanistic pathways would result in OCS yields higher than CS-H and the other mechanisms (which have used a very small yield in the past) but consistently lower than that simulated by KH.
To summarise, the intercomparison of recent gas-phase DMS oxidation mechanisms complements and extends earlier studies on DMS (Karl et al., 2007). Recent gas-phase DMS oxidation schemes used in modelling studies lead to a wide range of results for key DMS oxidation products, with moderate NOx levels (∼0.1 ppb) leading to greater divergence than low NOx levels (∼10 of ppt). A similar situation was found for isoprene by Archibald et al. (2010), and significant efforts have been employed to improve our understanding of isoprene oxidation through theoretical and laboratory experiments (e.g. Jenkin et al., 2015; Wennberg et al., 2018). We now focus on the role of temperature in the divergences seen thus far.
3.2.2 Temperature dependence of different DMS-HPMTF schemes
Figure 6 shows that even though the temperature dependence of average DMS concentration is similar across all schemes, the temperature dependence of average SO2 and MSA concentration differs from scheme to scheme significantly. Most of the general trends were found to be similar and in line with the trends observed for the UKCA schemes and have been explained there (Sect. 3.1.2, Fig. 3).
While WJ has the highest absolute change in HPMTF concentration throughout the temperature range (+131 ppt, +380 %; Fig. 6b), CS-H, KH, and NV show higher relative change (+43–48 pp, +763 %–892 %). Since FG is missing the DMS oxidation by NO3 as a potential pathway to HPMTF (via MTMP), HPMTF in FG is the least affected by temperature (+34 ppt, +256 %).
MSA is even more affected by temperature than HPMTF (Fig. 6c). Its concentration shows a strong negative temperature dependence in all simulations (Fig. 6c). The magnitude of MSA temperature dependence differs from scheme to scheme. The smallest changes can be observed in NV (−47 ppt from 260–310 K), where only 25 % of DMS that is oxidised through the OH-addition pathway forms MSA. Similarly, in FG (−67 ppt from 260–310 K), only 40 % of the OH-addition pathway forms DMSO and then potentially MSA. The largest temperature dependence can be found in the KH simulation, with a change in MSA concentration of −282 ppt from 260 to 310 K, which is very similar to CS2 (Fig. 3c).
In almost all schemes, SO2 concentration increases with temperature (Fig. 6d). The greatest positive change happens between the atmospheric relevant temperatures 270 and 290 K. KH and CS-H show the greatest increase in this temperature range with +53 ppt (+160 %) and +69 ppt (+80 %), respectively (WJ: +34 ppt (51 %)). Starting at 295 K, SO2 concentration plateaus with further increasing temperature and even declines slightly in some simulations (Fig. 6d). NV and FG are the only models that show a decrease in SO2 throughout the entire temperature range of 260–310 K (NV: −24 ppt, −11 %, FG: −22 ppt, −10 %), similar to ST-CS2 in Fig. 2d. This could be due to previously mentioned simplifications in the DMS additional channel, where DMSO is either completely omitted or rapidly oxidised further.
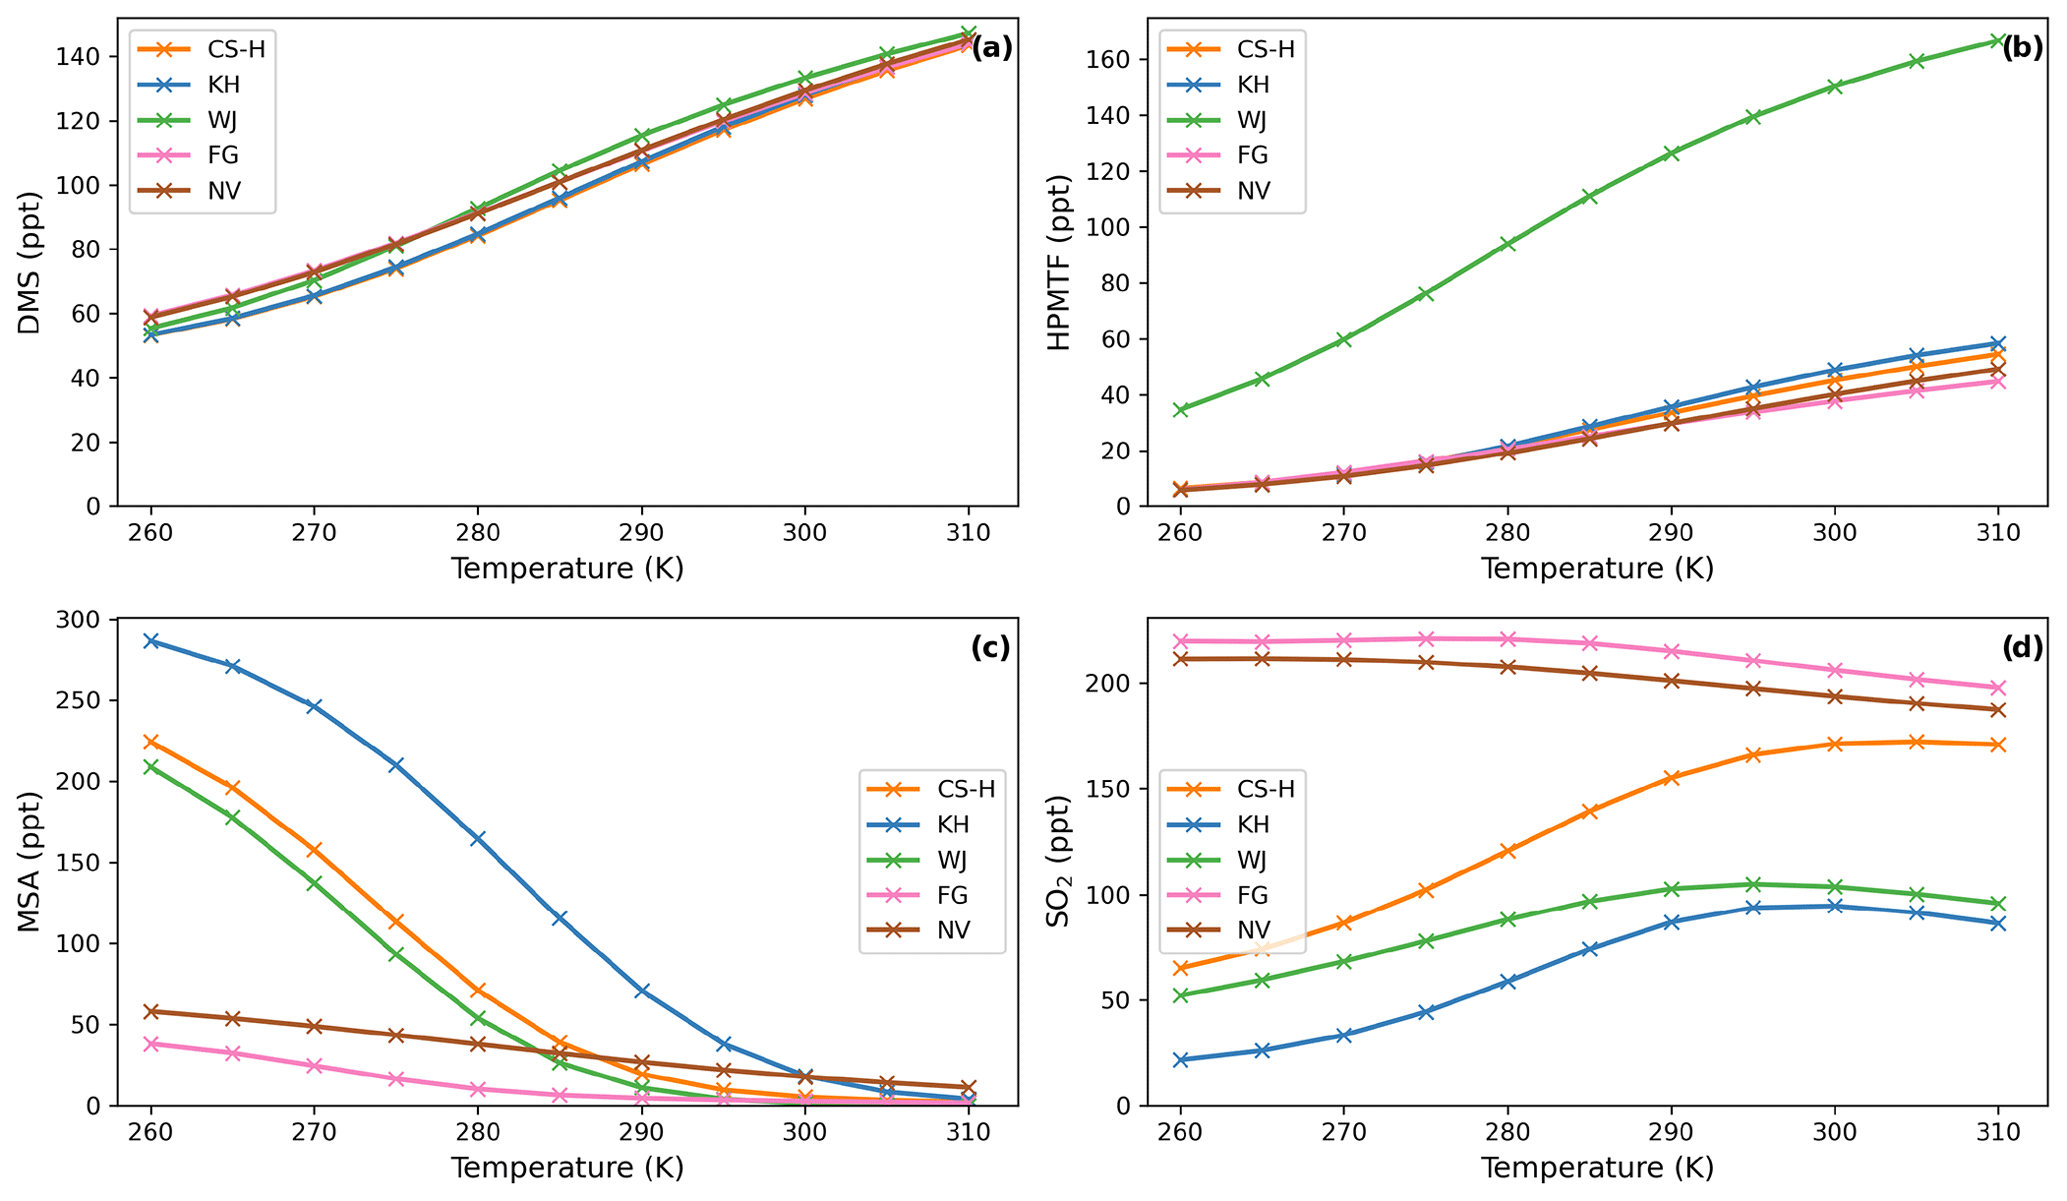
Figure 6Temperature dependence of average (a) DMS, (b) HPMTF, (c) MSA, and (d) SO2 concentration in different DMS oxidation schemes after a quasi-steady state is reached in the box model simulation. Average NOx is approximately 10 ppt.
These results demonstrate limited consensus on gas-phase DMS oxidation, similar to the earlier work of Karl et al. (2007). Importantly in the context of the role of DMS in chemistry–aerosol–climate feedbacks, we have further shown that this uncertainty across mechanisms is amplified when assessing temperature sensitivity of the products of DMS oxidation. Small uncertainties in the rate of reactions or the omission of intermediates can have significant effects on the resulting product concentrations, as we have shown through our systematic work updating the CRI-Strat DMS scheme. All models studied tend to agree on the rates of oxidation of DMS, largely controlled for by the fairly uniform treatment of the initial oxidation step. However, we saw (in Fig. 5) that there is large divergence at high NOx levels for MTMP and subsequently HPMTF and SO2. In part this divergence could be reduced by better constraining the MTMP self- and cross-reactions, but in the case of Fung et al. (2022) including MTMP as a product of the NO3 + DMS reaction would help it converge with the other models. The effects of climate change are that it is likely that global mean surface temperature will remain higher than the pre-industrial baseline for some time to come. As a result, the simulations would all suggest an increase in the amount of HPMTF formed relative to other major oxidation products, especially MSA, and most likely an overall increase in SO2. However, our box-modelling study highlights how uncertain the situation is within the context of the current literature. At present there is a need for more laboratory data and more focused sensitivity studies to isolate the major sources of uncertainty that are common across DMS oxidation mechanisms and constrain them. Strikingly, we see that the ST and CS2 mechanistic variants used for UKCA studies span the wide range of SO2 temperature and MSA temperature sensitivities as the recently reported updated DMS mechanisms. We now move on to discuss our work implementing the CS2-H mechanism into our global chemistry–climate model.
Here we present our results from the incorporation of the new CS2-H DMS mechanism described above in the 3D UKCA chemistry climate model. As described in Sect. 2.1, we performed a series of 12-month nudged simulations with UKCA for the year 2018 using six model simulations with different mechanistic variants (Table 1). As a reminder, we use the CS2 simulation (Archer-Nicholls et al., 2021) as the “base” simulation to which mechanistic improvements are made. More details can be found in Sect. S2.
4.1 Distribution of key sulfur species (DMS, HPMTF, SO2 and sulfate).
The annual mean global DMS burden was found to be between 63–66 Gg S in all model simulations. DMS concentration follows a seasonal modulation with maximums in the warmer months, which coincide with phytoplankton blooms (See Fig. S6a). Figure S6b, c show the annual mean vertical profiles in the central North Atlantic region and the Southern Ocean (see figure caption for bounding areas). These regions are focused on owing to the differences shown in the mixing ratios of key species and the importance of these two regions to global climate (e.g. Sutton et al., 2018; Caldeira and Duffy, 2000). In the Southern Ocean, DMS mixing ratios vary between 100 and >300 ppt. On the other hand, in the North Atlantic region analysed, DMS concentrations rarely reach over 50 ppt. Here, <1 ppt DMS is found above the boundary layer (above 1000 m), while in the Southern Ocean DMS decreases more slowly up to the tropopause (∼8000 m). These differences in DMS distribution are a complex function of the local heterogeneity of the DMS source from the ocean and differences in the lifetime of DMS due to different simulated cloud and oxidising environments (with the North Atlantic generally being a region of greater oxidising capacity than the Southern Ocean (Archer-Nicholls et al., 2021; Griffiths et al., 2021))
There is a significant bias in the simulated DMS mixing ratios compared with observations, which we note has been seen in several other modelling studies (e.g. Fung et al., 2022) and is driven not by the DMS chemistry but by the oceanic emissions, in our case by the bias in the UKESM-derived DMS emissions field (Bhatti et al., 2023). See the Supplement Sect. S2.1 for further details.
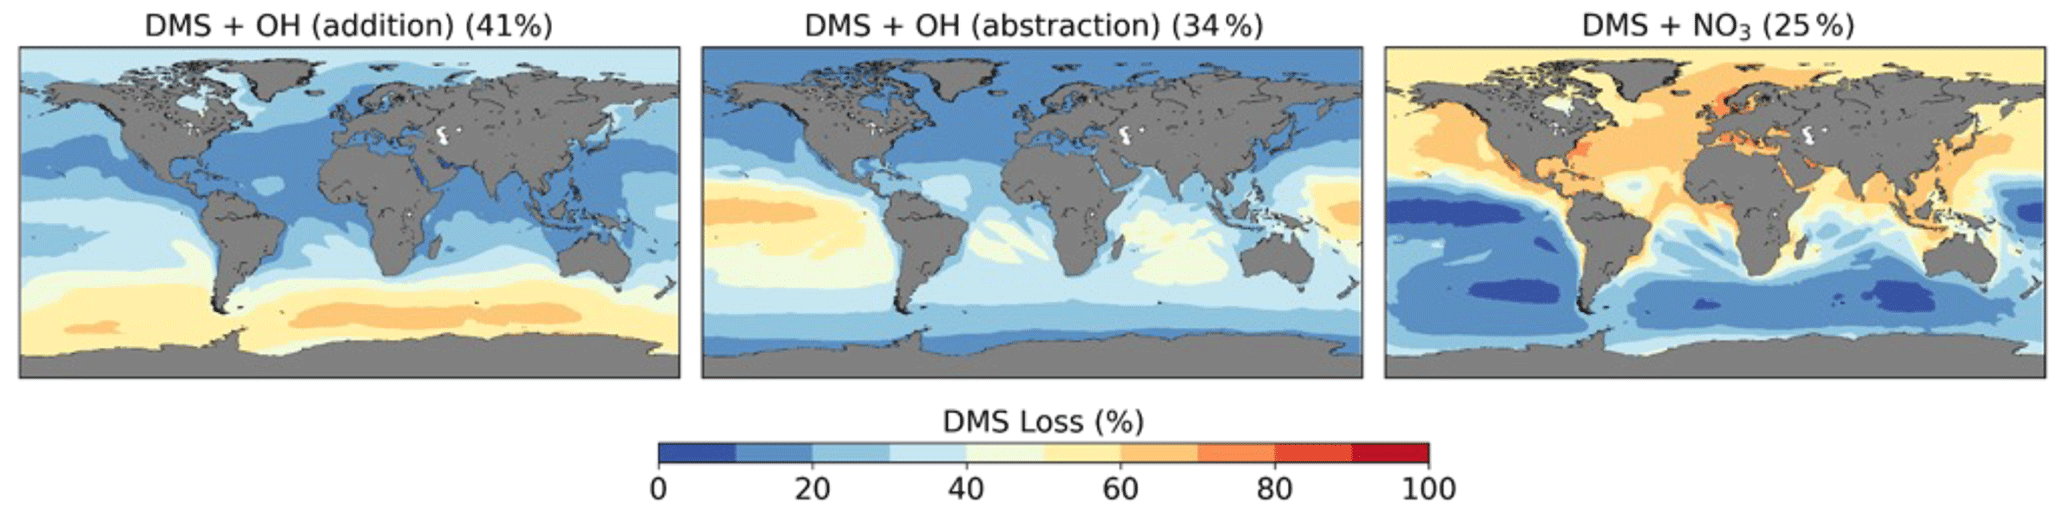
Figure 7Spatial distribution of mean percentage of DMS oxidation via DMS + OH (addition), DMS + OH (abstraction), and DMS + NO3 in the CS2 base run. The percentage in brackets denotes the contribution of this channel to the global chemical loss of DMS. Only values above the ocean are shown.
4.1.1 Oxidation of DMS
We calculate a global average tropospheric lifetime of 1.5 d for DMS. Figure 7 shows the global distribution of the different DMS oxidation pathways in the base run (these results are not affected by the different DMS mechanism variants we use as these reactions were not updated and there is only a weak feedback of DMS oxidation products on DMS oxidation itself). 75 % of DMS is oxidised by OH (41 % via the OH-addition channel and 34 % via the H-abstraction channel) and 25 % by NO3. Oxidation by NO3 is dominant in the Northern Hemisphere, especially close to the coast and over ship routes. In the Southern Hemisphere, where DMS emissions are highest, the contribution is less than 20 %. The addition pathway of OH oxidation is favoured at lower temperatures, explaining the trend of higher DMSO formation at high latitudes.
4.2 DMS oxidation products
A total of 59 % of DMS forms MTMP, the first intermediate of the abstraction pathway. In CS2, MTMP is oxidised by NO (51 %) or reacts with itself (49 %) to form CH3S (Fig. 8a), which is further oxidised to SO2, H2SO4, and MSA. This is clearly wrong and a failure of the CS2 scheme. With the updates implemented in CS2-HPMTF, 86 % of MTMP isomerises to HPMTF, while 8 % is oxidised by HO2 and only 6 % by NO (Fig. 8b). The self-reaction becomes negligible with the additional loss processes of MTMP, significantly lowering MTMP concentrations. The global tropospheric lifetime of MTMP is reduced from 26 min to less than 1 min.
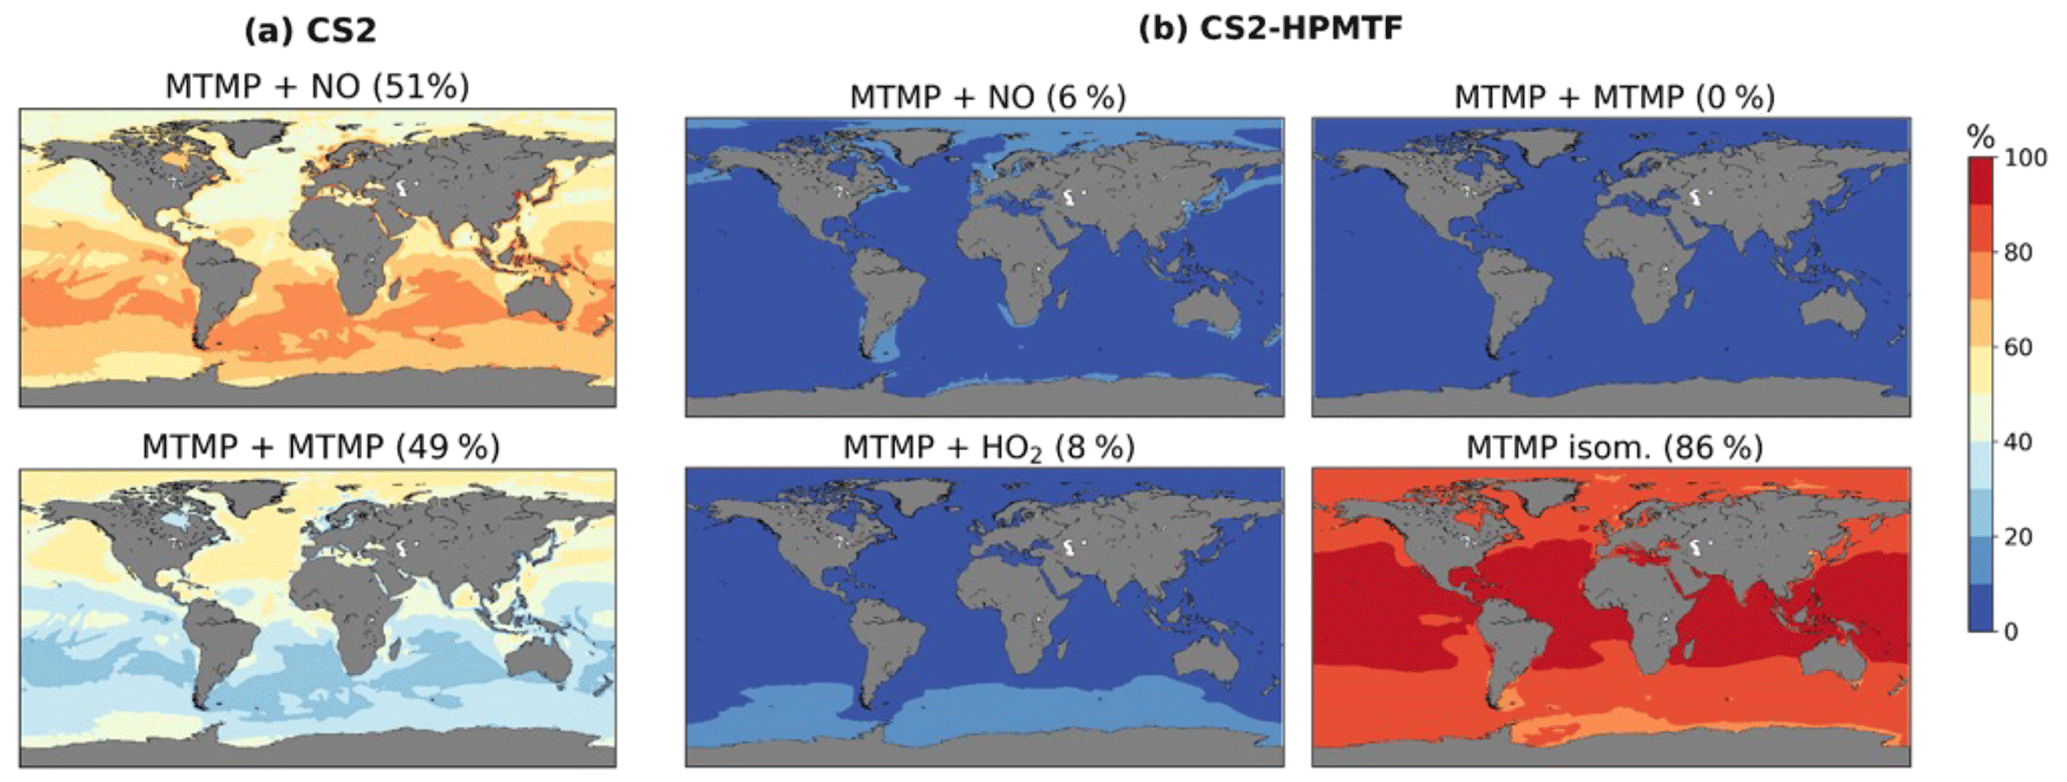
Figure 8Spatial distribution of annual mean percentage of MTMP depletion (<2 km) via MTMP + NO, its self-reaction, MTMP + HO2, and isomerisation to HPMTF in (a) CS2 and (b) CS2-HPMTF. The percentage in brackets denotes the contribution of this channel to the global chemical loss of MTMP. Only values above the ocean are shown.
4.2.1 Modelled HPMTF
In CS2-HPMTF, 51 % of DMS forms HPMTF. The general patterns of the global distribution of HPMTF are similar to those of DMS in Fig. 9, except that relatively higher concentrations of DMS are reached in the Southern Ocean. There, temperatures are lower and therefore the OH-abstraction pathway, as well as the strongly temperature-dependent isomerisation reaction from MTMP to HPMTF, are disfavoured. At the surface, the annual mean HPMTF concentration is similar in the North Atlantic and the Southern Ocean with approximately 20 ppt. However, in the North Atlantic, the variability throughout space and time is greater (bigger interquartile range). Further, the vertical profiles differ visibly. In the North Atlantic HPMTF concentration decreases in the boundary layer, and above 2500 m HPMTF concentration is virtually zero (Fig. 9b). In the Southern Ocean, the concentration decreases more slowly and only reaches zero at 10 000 m (Fig. 9c). The HPMTF burden in CS2-HPMTF is 24 Gg S and HPMTF has a lifetime of 26 h.
Comparison of HPMTF with observations
Since DMS in the model is likely overestimated, the same would be expected for HPMTF. Figure 10a shows that the implemented loss processes in CS2-HPMTF already lead to a diel profile of HPMTF that is similar to the one measured by Vermeuel et al. (2020) (where no DMS measurements were made), without the need to add aqueous loss or photolysis. While DMS at low altitudes was overestimated by a factor of 5 in the model (see Supplement), the maximum HPMTF is only 3.7 times higher than the highest measurement in the diel profile at Scripps Pier (Fig. 10a). For the comparison with ATom-4 data (Fig. 10b, c), the DMS and HPMTF are used to account for the discrepancy between DMS concentrations observed and in the model. The model generally underestimates the HPMTF/DMS ratio. For instance, up until 1000 m, the ratio in the model is half of the measured ratio. These results indicate that loss processes of HPMTF might still be too fast in the model or that the oxidation of DMS too slow. The CS2 oxidants have been evaluated before (Archer-Nicholls et al., 2021) and were found to be higher in the boundary layer than in ST simulations used in CMIP6 studies but well within the spread of other models (Griffiths et al., 2021; Stevenson et al., 2020).
4.2.2 Modelled SO2 and sulfate
In CS2-HPMTF the SO2 burden is increased by 5.6 % compared with CS2, to 391 Gg S (Table 4). While this percentage seems low, a significant contribution to the SO2 burden stems from anthropogenic sources and is mainly located above the land. The increase in SO2 over the remote ocean, especially over the Southern Ocean, can reach up to 400 % (Fig. S12). At high latitudes, the new chemistry implemented in CS2-HPMTF also introduces a stronger seasonality to SO2, whereby SO2 concentration is higher in respective warmer months than in CS2 (Figs. S11a, S12). Comparison of CS2-HPMTF with ST reveals that the SO2 burden is 9.2 % higher in the ST run, which uses a 100 % SO2 yield from DMS (Fig. S9). The global annual tropospheric sulfate burden is increased in CS2-HPMTF by 3.7 % compared with CS2 to 604 Gg S. However, the sulfate burden is 5.3 % higher in ST than in CS2-HPMTF (Table 4).
Comparison to observed SO2 and sulfate
Figure 11a shows the monthly means of observed non-sea-salt sulfate (nss-sulfate) concentration at Dumont d'Urville station (66∘ S, 140∘ E) between 1991 and 1995 (Minikin et al., 1998) and compares it to the sulfate concentration in the three different UKCA model runs. The seasonal changes in sulfate concentrations are reproduced by CS2-HPMTF and ST but not by CS2. From April to September all three runs match the observations adequately well. Earlier in the year, the results from the ST run match the observations best, while later in the year CS2-HPMTF reproduces the measurements better.
Figure 11b, c show SO2 measurements along the ATom-4 flight path in comparison with the modelled SO2 concentrations. In the boundary layer, all runs over-predict SO2 in comparison to the ATom-4 data (Fig. 11b). In addition to wet and dry deposition (Faloona, 2009; Ranjithkumar et al., 2021), vertical mixing has been identified as a major source of uncertainty in models (Gerbig et al., 2008) and could provide an explanation for the mismatch between the simulation results and observations. At altitudes above 1.8 km, CS2-HPMTF is able to reflect SO2 concentrations better than the other schemes. Above 9 km, the simulations underestimate SO2, potentially indicating issues with convective transport. Overall, in the ATom-4 observations, SO2 stays broadly constant with altitude, suggesting significant secondary sources or efficient vertical transport, while in the simulations it decreases. Additionally, the interquartile ranges of the concentrations in each bin are bigger, indicating a greater variance of model results than measured values. Overall, the mean SO2 concentrations by the models in each latitude bin predict the mean observation values well (Fig. 11c). However, the variation in values is again greater in the model, especially at low latitudes. The underestimation of SO2 at 70∘ N could be due to an underestimation of the influence of anthropogenic SO2 emissions or unrealistic deposition of SO2 (Hardacre et al., 2021). Alternatively, the SO2 production from DMS might be too slow still.
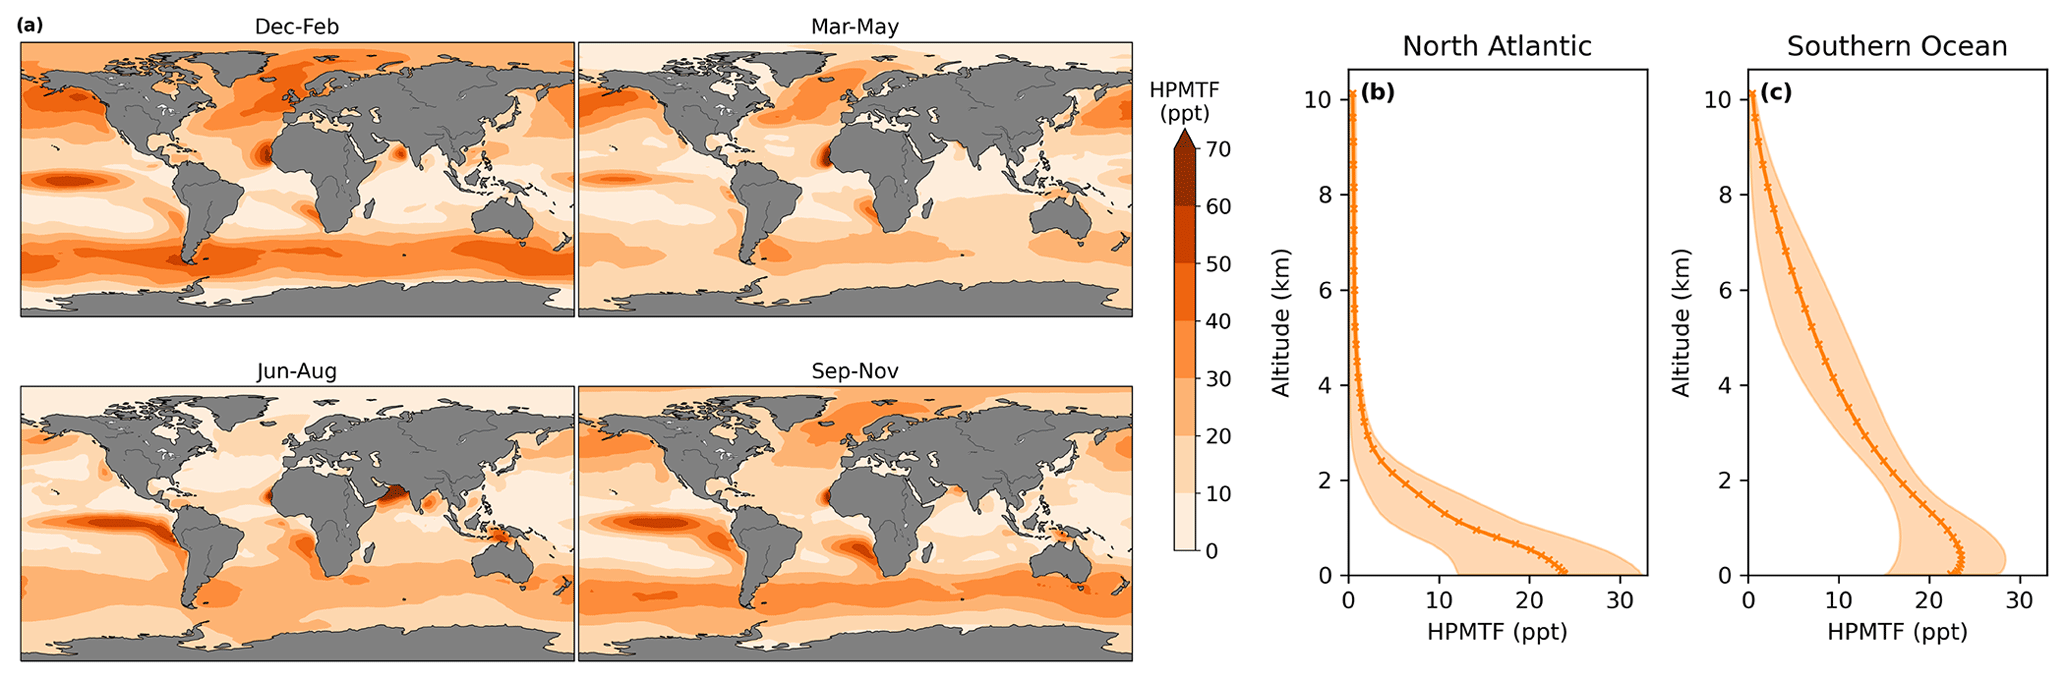
Figure 9Seasonal average (a) global distribution of HPMTF mixing ratios in the lower troposphere (<2 km) over the ocean in CS2-HPMTF. Annual means of the vertical distribution of HPMTF are shown in (b) the central North Atlantic (20–45∘ N, 30–50∘ E) and (c) the Southern Ocean (50–70∘ S). The envelopes represent the interquartile range of the model data.
4.3 Sensitivity runs
To improve our understanding of the variability of the model results, based on the uncertainties of HPMTF formation and loss, three sensitivity runs were conducted (CS2-HPMTF-CLD, CS2-HPMTF-FL, CS2-HPMTF-FP, Table 1). Loss of HPMTF to clouds was proposed to be a major loss pathway by Veres et al. (2020) and Vermeuel et al. (2020). CS2-HPMTF-CLD adds cloud and aqueous uptake of HPMTF with a reactive uptake coefficient, γ, of 0.01, as used in the study by Novak et al. (2021). Jernigan et al. (2022) recently established a rate constant for oxidation of HPMTF by OH of 1.4 (0.27–2.4) × 10−11 cm3 molec.−1 s−1 through constrained chamber modelling using a rate constant for the formation of HPMTF of 0.1 s−1. Ye et al. (2022) also measured the rate constant for this reaction. In their study they derived a rate constant of 2.1 × 10⁻¹¹ cm3 molec.−1 s−1 and an isomerisation rate constant, kisom, of 0.13±0.03 s−1 at 295 K. While further laboratory studies would be helpful in constraining the rate constant for OH + HPMTF, we recommend future work go into constraining the products of this reaction. Vermeuel et al. (2020) found the theoretically calculated rate constant 1.4 × 10⁻¹² cm3 molec.−1 s−1 by Wu et al. (2015) too slow and proposed a rate constant of 1.11 × 10⁻¹¹ cm3 molec.−1 s−1 instead based on structurally similar molecules and modelling of their ground-based observations, similar to what we used in CS2-HPMTF. They recommend an upper limit of 5.1 × 10⁻¹¹ cm3 molec.−1 s−1 for the HPMTF + OH rate constant. Khan et al. (2021) and Novak et al. (2021) use 5.5 × 10⁻¹¹ cm3 molec.−1 s−1 for sensitivity tests, which was also employed in CS2-HPMTF-FL. Further, the study by Ye et al. (2021) looked at the uncertainty of the HPMTF isomerisation rate. They estimate the isomerisation rate constant as 0.09 s−1 (0.03–0.3 s−1, 1σg geometric standard deviation at 293 K). Veres et al. (2020) are on the lower end of this range (0.041 s−1), and Berndt et al. (2019) are at the higher end (0.23 s−1). The CS2-HPMTF-FP simulation scales the rate constant of Veres et al. (2020) by a factor of 5 to match Berndt's measurements at 295 K to examine the effects of higher HPMTF production. This rate constant was also used by Wollesen de Jonge et al. (2021) in their study. The annual mean of global tropospheric burdens of relevant species in these sensitivity runs are compared in Table 4.
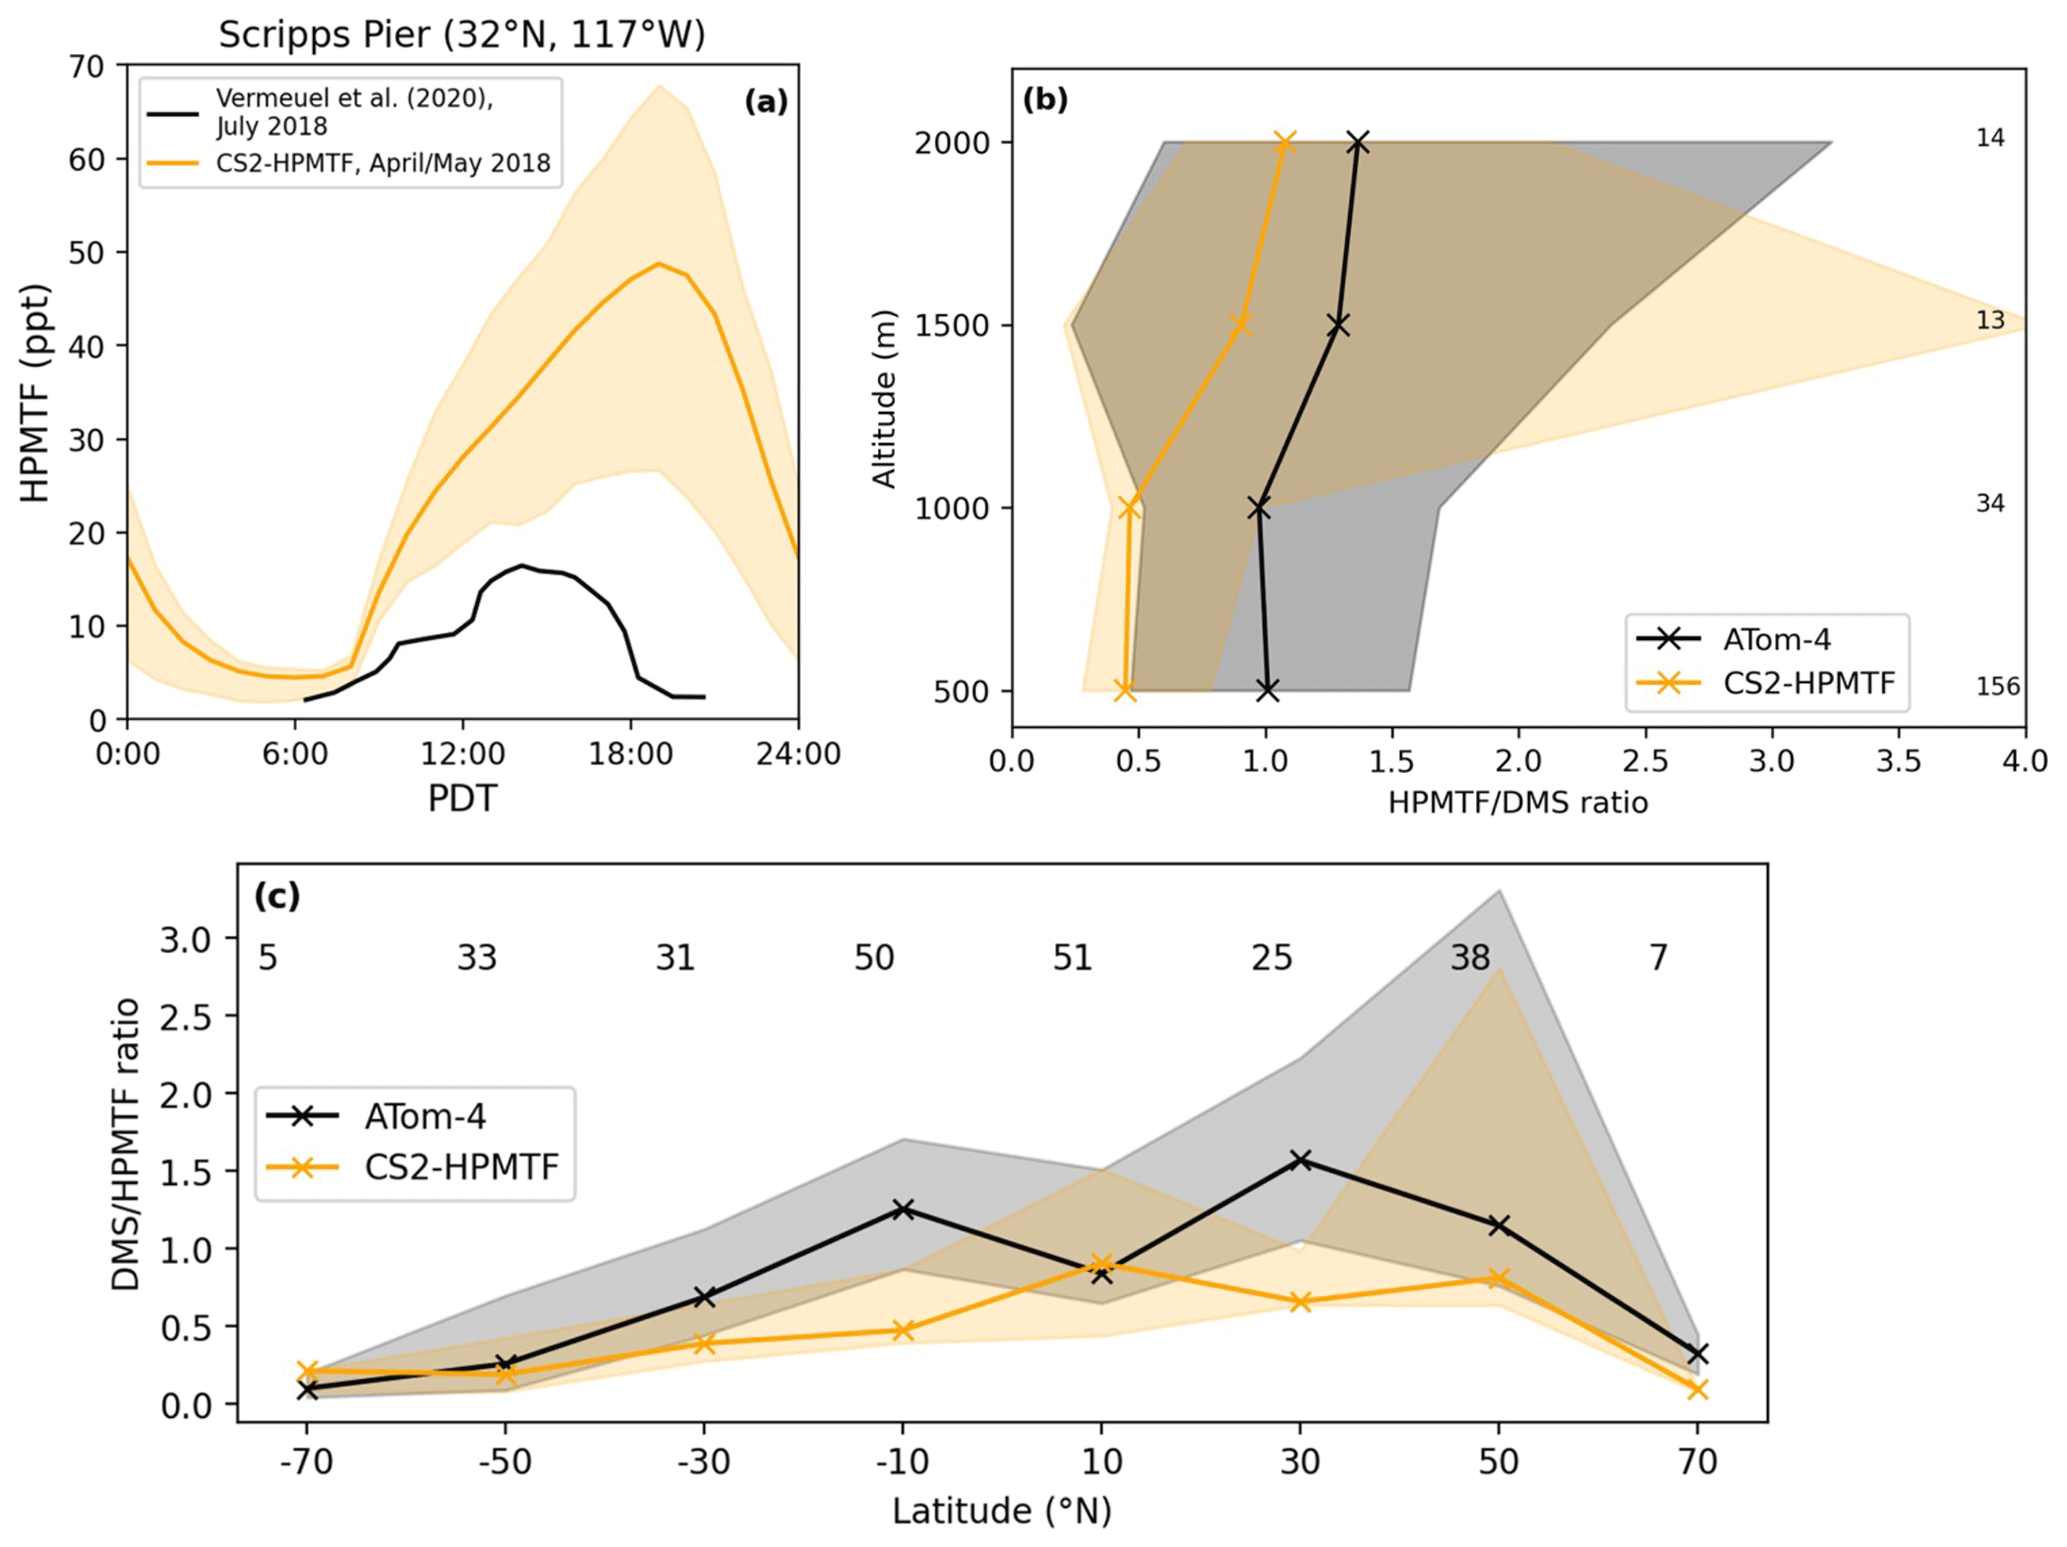
Figure 10(a) Comparison of the diel profile of HPMTF at the Scripps Pier on the coast of California (32∘ N, 117∘ W). The observational data (Vermeuel et al., 2020) are the mean of measurements from 26 July to 3 August 2018, while the model output is the mean from April and May 2018. (b) Vertically binned (500 m) and (c) latitudinally binned (20∘) median DMS HPMTF ratio along the ATom-4 flight path. The envelopes represent the interquartile range of the measurements and the respective model results, while the numbers on the side or on top give the number of measurements in the respective bin.
Table 4Global annual mean tropospheric burdens of atmospheric sulfur species in UKCA base and sensitivity runs (first half of the table) and comparison to literature values (second half of the table, same acronyms as in Sect. 3).
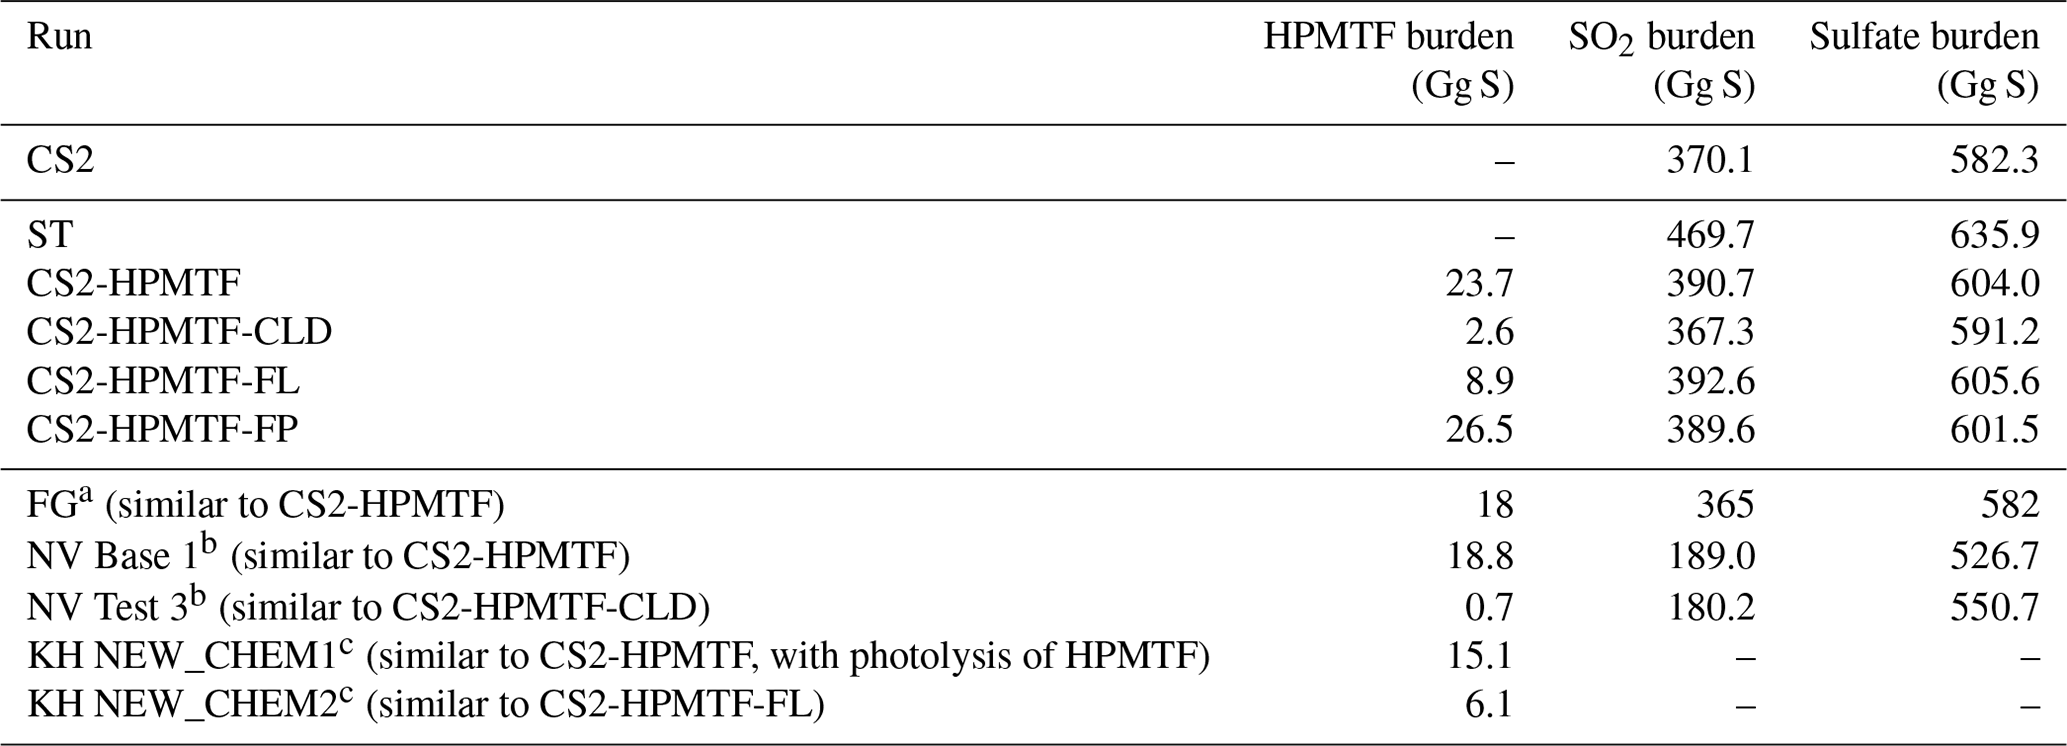
a Fung et al. (2022); b Novak et al. (2021); c Khan et al. (2021).
4.3.1 HPMTF
The HPMTF burden varies between 2.6 and 26.5 Gg S among the sensitivity runs (Table 4). Compared to CS2-HPMTF, faster OH oxidation reduces the HPMTF burden by −62 % to 8.9 Gg S, while the addition of cloud and aqueous uptake to the scheme reduces it by −91 % to only 2.6 Gg S. However, a factor of 5 higher production rate constant of HPMTF only leads to a 12 % increase of HPMTF burden to 26.5 Gg S, suggesting that the steady-state distribution of HPMTF is controlled by the loss rate and not the rate of production of HPMTF. With the isomerisation rate constant recommended by Veres et al. (2020), 51 % of DMS forms HPMTF (86 % of MTMP); with the faster rate in CS2-HPMTF-FP it is 57 % (96 % of MTMP). Since the use of the isomerisation rate from Veres et al. (2020) already outcompetes the bimolecular reactions of MTMP, scaling the A factor does not have a significant effect on the HPMTF yield from DMS. Overall, it can be estimated that globally 50 %–60 % of DMS forms HPMTF (however, if more DMS is oxidised through the addition channel by BrO or multiphase reactions, this ratio could be lower). Consequently, HPMTF formation seems to be well constrained, and the major uncertainties lie with the loss of HPMTF, which warrant additional measurements.

Figure 11(a) Comparison of nss-sulfate concentration at the Dumont d'Urville Station (66∘ S, 140∘ E) on the coast of Antarctica. The observational data stem from Minikin et al. (1998) and represent the monthly mean concentrations and their standard deviations for the years 1991–1995. (b) Vertically binned (500 m) and (c) latitudinally binned (20∘) median SO2 mixing ratio along the ATom-4 flight path. The envelopes represent the interquartile range of the measurements and the respective model results, while the numbers on the side and on top give the number of measurements in the respective bin.
Similar to Fig. 10, the HPMTF : DMS ratio is used in Fig. 12 to compare the results of the sensitivity model runs with ATom-4 observations. In general, schemes with a higher production and slower loss of HPMTF match the observations better; however, they still underestimate the measured ratios. A comparison was made to HPMTF : DMS ratios measured with no clouds present. Under these clear-sky conditions, when cloud uptake of HPMTF should not play a role in the measurements, observed ratios were even higher, leading to a greater difference between model results (which include clouds) and observations.
4.3.2 SO2
The SO2 burden varies between 367.3 Gg S in CS2-HPMTF-CLD and 392.6 Gg S in CS2-HPMTF-FL, suggesting that the SO2 burden is relatively unaffected by the chemical sensitives explored when compared with the much larger SO2 burden simulated with ST (469.7 Gg S), mainly due to the 100 % DMS-SO2 yield (Table 4).
CS2-HPMTF, CS2-HPMTF-FL, and CS2-HPMTF-FP have a higher SO2 burden than CS2 since the changes to the abstraction pathway (Reactions 6a, 7c) and the addition of the isomerisation pathway lead to more direct SO2 production. Faster OH oxidation of HPMTF in CS2-HPMTF-FL reduces the amount of HPMTF deposited and therefore increases the SO2 burden slightly (by 0.5 %) compared to CS2-HPMTF. The faster production of HPMTF in CS2-HPMTF-FP reduces SO2 burden marginally (−0.3 %) due to more sulfur now being deposited as HPMTF or forming OCS. The addition of cloud and heterogeneous loss in CS2-HPMTF-CLD leads to immediate sulfate production instead of SO2 formation, reducing the SO2 burden by −6 % compared to CS2-HPMTF, resulting in the lowest SO2 burden in all runs considered.
4.3.3 Sulfate
In the sensitivity runs, the sulfate burdens are all higher than in the CS2 run (582.3 Gg S) and lower than in the ST run (635.9 Gg S). The variation of approximately 15 Gg S, from 591.2 Gg S in CS2-HPMTF-CLD to 605.6 Gg S in CS2-HPMTF-FL, is smaller than the variation in sulfate burden simulated by similar mechanistic sensitivity tests by Novak et al. (2021) (∼24 Gg), suggesting some structural dependence on the results of the sensitivity tests (e.g. resolution, other model parameters). The sulfate burdens in CS2-HPMTF-FL and CS2-HPMTF-FP behave similarly to CS2-HPMTF. Since CS2-HPMTF-CLD added direct sulfate formation, a higher sulfate burden was expected. However, this was not seen in the experiments. Inspection of the sulfate aerosol distribution shows that CS2-HPMTF-CLD leads to an increase in the coarse-mode sulfate and a concomitant reduction in sulfate aerosol lifetime (through an increase in wet deposition).
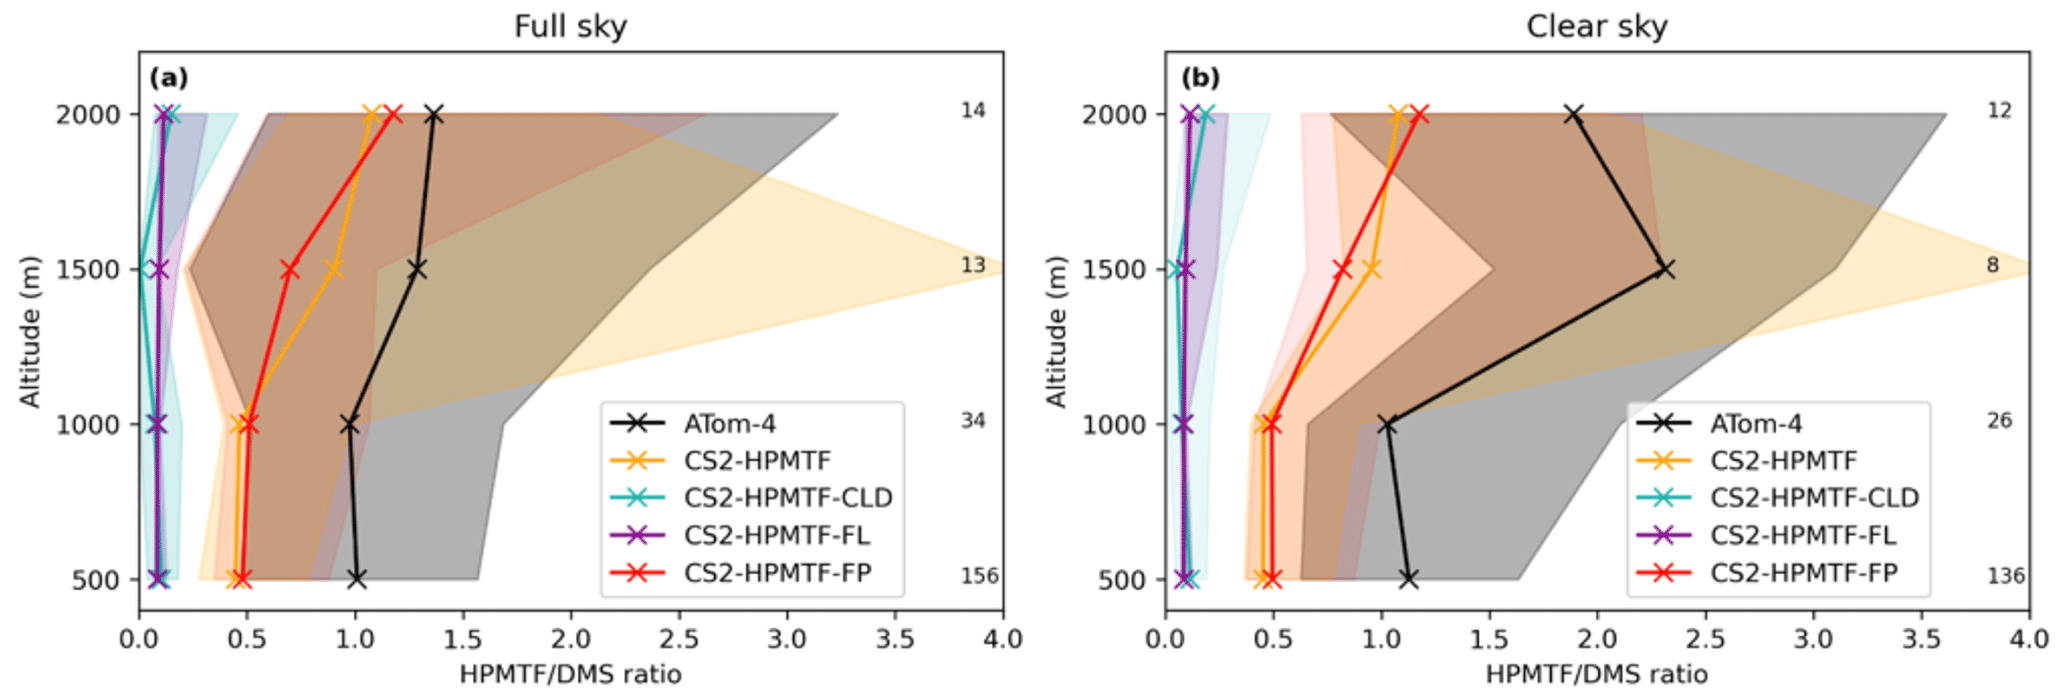
Figure 12Vertically binned (500 m) median HPMTF/DMS ratio along the ATom-4 flight path for (a) full sky and (b) clear sky, where measurements made in clouds are omitted. The envelopes represent the interquartile range of the measurements and the respective model results, while values on the side give the number of measurements in the respective bin. Note that the model data is the same in both panels.
The results described above demonstrate the global scale changes in the distribution of DMS and its oxidation products, through the incorporation of improved mechanistic updates into the UKCA model. Here we discuss our results in the context of the existing literature.
5.1 DMS
The DMS burden of 63–66 Gg S in this work is in good agreement with recent modelling studies (50 Gg S in Fung et al. (2022), 74 Gg S in Chen et al. (2018)). However, as shown in the Sect. S2.1.1, the modelled DMS concentrations do not match observational measurements. One explanation could be underestimation of DMS oxidation. Here, only oxidation by OH and NO3 is included. However, Fung et al. (2022), who include oxidation by BrO, O3, and Cl (accounting in total for 20 % of DMS depletion), also found that their model over-predicted DMS mixing ratios compared to the ATom-4 measurements. Inadequate representation of DMS concentrations in seawater and therefore emissions contribute to the largest uncertainties in the sulfur budget (Tesdal et al., 2016; Bock et al., 2021) and could explain most of the difference. Additionally, physical differences between model and observation, such as wind speed and temperature, and a poor space resolution of whole-air sampling might also play a role. Crucially, more long-term observations of DMS in the atmosphere are needed to complement works that have collated oceanic DMS observations (e.g. Lana et al., 2011).
Here, in all model runs 75 % of DMS is oxidised by OH and 25 % by NO3. Other studies found global contributions of OH between 50 %–70 % and NO3 between 15 %–30 % (Boucher et al., 2003; Berglen et al., 2004; Breider et al., 2010; Khan et al., 2016; Chen et al., 2018; Fung et al., 2022). The lower contribution of OH oxidation to DMS removal is explained by the addition of other pathways, such as oxidation by BrO, Cl, and multiphase reactions. Consequently, the lifetime of 1.5 d for DMS in this work is longer than some other studies including these reactions (e.g. 0.8 d in Fung et al. (2022) and 1.2 d in Chen et al. (2018)). Nonetheless, it is well within the range of 0.9 to 5 d (with a mean of 2 d) of the models examined in Faloona (2009).
5.2 HPMTF
In CS2-HPMTF, 51 % of DMS forms HPMTF. With a faster formation of HPMTF, found in laboratory experiments, this yield increases to 57 % in our model. The yield could possibly be lower if other oxidation reactions of DMS are included that follow the OH addition pathway (multiphase reactions, oxidation by BrO), which was omitted in this work. Veres et al. (2020), Novak et al. (2021), and Fung et al. (2022) estimated that at least 30 %–46 % of DMS was forming HPMTF based on observationally constrained modelling of in situ or laboratory data. Even though the rate of HPMTF formation is uncertain (Ye et al., 2021), it does not significantly affect the HPMTF yield from DMS since it already outcompetes most other reactions of MTMP. For HPMTF formation, uncertainty seems to lie mainly at the branching ratio of the addition and abstraction pathways of DMS. Indeed, the uncertainty in the HPMTF burden stems from the uncertainty in the loss pathways and their respective contribution to HPMTF loss. Our model results agree well with the HPMTF burdens obtained by other global modelling studies, both in absolute values but also the relative changes we find in the sensitivity study (Table 4) (e.g. Fung et al., 2022). In our sensitivity study a faster oxidation of HPMTF to OH led to a decrease of 62 % in the HPMTF burden; in Khan et al. (2021) it was 60 %. In this work the addition of aqueous uptake of HPMTF reduced the burden by 91 %, very similar to the reduction simulated in Novak et al. (2021) (96 %).
5.3 MSA
The tropospheric MSA burden is 40 Gg S in CS2-HPMTF with a lifetime of 6 d. This falls within the range of 13–40 Gg S and a lifetime of 5–7 d found in previous model studies (Pham et al., 1995; Chin et al., 1996, 2000; Cosme et al., 2002; Hezel et al., 2011). However, newer studies include more multiphase processes and usually tend to have shorter lifetimes and lower MSA burdens.The schemes in both Fung et al. (2022) and Chen et al. (2018) include the loss of MSA to aqueous OH oxidation, resulting in lifetimes of 0.6 d and 2.2 d and a burden of 8 and 20 Gg S, respectively.
5.4 SO2 and sulfate
Comparing SO2 and sulfate burdens with other modelling studies is more challenging, since those species can have other sources apart from DMS. That said, our SO2 obtained in the various runs based on the CS2 scheme are comparable to Fung et al. (2022), while the ST burden is significantly higher. However, the SO2 burden from Novak et al. (2021) is much lower. This difference cannot be explained solely by differences in the DMS oxidation mechanism; more likely, the difference is in anthropogenic SO2 emissions.
The sulfate burden in all our runs fall within the range found in other recent modelling studies (Chen et al., 2018; Novak et al., 2021; Fung et al., 2022). Considering the relative change due to the addition of the isomerisation pathway, the increase in sulfate burden from CS2 to CS2-HPMTF is only 3.7 % in our study; Fung et al. (2022) found an increase of 8.8 %, when they added HPMTF chemistry. However, unlike their results, we find strong seasonality in the additional sulfate produced, especially in the Southern Hemisphere. The addition of cloud uptake and direct sulfate formation in CS2-HPMTF-CLD decreased the sulfate burden in our study by (−)2.2 %; in Novak et al. (2021) this change in mechanism lead to an increase of sulfate by 4.5 %.
5.5 Comparison with BOXMOX results
In Sects. 3 and 4 we have shown the results of BOXMOX and UKCA simulations using different DMS mechanistic variants, respectively. While the same mechanistic variants have been assessed in both model setups, it is not possible to directly compare the results of the two sets of experiments because of the large differences in the model setups used. However, some qualitative comparisons can be made. For MSA, Sect. 3.1 (Fig. 2) suggests that the MSA simulated with CS2-HPMTF should be much lower than CS2; as is calculated in Sect. 4.2.2 (a 70 % reduction). For SO2, both the BOXMOX and UKCA results agree in the ordering of simulations, ST, CS2, and CS2-HPMTF, with ST simulating significantly more SO2 than the other mechanisms. However, whereas BOXMOX simulations suggest that H2SO4 is predicted to be higher in CS2 and CS2-HPMTF than ST, the UKCA model runs suggest that ST has the greatest burden of sulfate; highlighting the complexity of making inference on aerosols from gas-phase precursors in box model studies.
DMS remains an important molecule in our understanding of the background aerosol budget and the uncertainty of aerosols to climate change (Carslaw et al., 2013). In this study we have used a combination of box modelling experiments and global 3D model experiments to explore the sensitivities of the DMS oxidation mechanism in the UKCA model. This work has delivered a new DMS oxidation mechanism for use within the CRI-Strat framework of UKCA (Archer-Nicholls et al., 2021; Weber et al., 2021), which is a significant advancement and improvement over the mechanism used in CMIP6 studies (Archibald et al., 2020). Our new DMS mechanism includes many of the recently discovered and proposed oxidation pathways for DMS, and through the series of experiments we have performed, we have been able to benchmark this scheme against other recently reported schemes in the literature. Our results suggest that it should be a priority that laboratory studies are performed that address (1) the uptake of HPMTF onto aerosol surfaces and the products of this reaction and (2) the kinetics and products of the following reactions: CH3SO3 decomposition, CH3S + O2, CH3SOO decomposition, and CH3SO + O3.
However, while future work building on the ever-expanding database of laboratory studies (e.g. Ye et al., 2021; Jernigan et al., 2022) are required to refine the DMS oxidation mechanism further, with the current availability of observational data, it is not possible to fully constrain the these DMS oxidation mechanisms using ambient observations. Hence, there is a priority for more observation-based studies that combine ship, ground-based and aircraft platforms optimally. Fung et al. (2022) have shown that there are consequences for radiative forcing by updating the DMS mechanism in the CESM model, and follow-up work will investigate these changes with UKCA.
This study adds to the few other mechanism intercomparisons that exist in the literature, spanning back more than 25 years (Capaldo and Pandis 1997; Karl et al., 2007). Similar to these other studies we find that MSA is particularly uncertain when it comes to the results obtained using the range of mechanisms that we investigated. Further work should explicitly focus on reducing uncertainty in the MSA budget in the atmosphere, especially given its potential importance in reconstructing paleo-sea ice (Thomas et al., 2019).
In many ways, the recent advances in DMS oxidation chemistry are similar to isoprene chemistry, where over a decade ago the discovery of unimolecular isomerisation reactions resulted in a step change in our understanding of isoprene. As with isoprene, ever more complex and faithful descriptions of DMS chemistry will be delivered over the coming years. However, the biggest challenge (as for isoprene) will remain in reducing and accurately distilling down this complex chemistry for use in global model studies and in characterising the sources of DMS into the atmosphere (which for isoprene have only recently been possible directly, e.g. Wells et al., 2020).
Python notebooks for analysing the model data presented in this paper can be provided upon reasonable request to the lead authors. BOXMOX configuration files used for the box modelling work in Sect. 2 can be found at https://doi.org/10.5281/zenodo.10114476 (Archibald et al., 2023) Information on the UM–UKCA configuration has been described in Archibald et al. (2020). Due to intellectual property rights, we cannot provide the source code for the UM or the UKCA chemistry module. A number of research organizations and national meteorological services use the UM in collaboration with the UK Met Office to undertake basic atmospheric process research, produce forecasts, develop the UM code, and build and evaluate Earth system models. Further information on how to apply for a license can be found at https://www.metoffice.gov.uk/research/approach/modelling-systems/unified-model (last access: 11 November 2023). UM simulations are compiled in suites developed using the Rose suite engine (https://metomi.github.io/rose/doc/html/installation.html, Met Office and Contributors, 2020) and scheduled using the Cylc workflow engine (https://doi.org/10.5281/zenodo.7896205, Oliver et al., 2023). Both Rose and Cylc are available under version 3 of the GNU General Public License (GPL).
Data presented in this paper can be provided upon reasonable request to the lead authors.
The supplement related to this article is available online at: https://doi.org/10.5194/acp-23-14735-2023-supplement.
All authors participated in designing the study. JMW and SAN conducted the UKCA model simulations. BC performed all the BOXMOX runs and led the analysis of all model and observational data with input and discussions from ATA, JMW, and SAN. LJ helped with checking the BOXMOX simulations. PTG helped with the development of the aerosol and cloud uptake scheme for HPMTF. NLA and MS helped with setting up UKCA model configurations and emissions. LER and MW helped with suggestions for analysis. ATA and BC prepared the paper with contributions from all co-authors.
The contact author has declared that none of the authors has any competing interests.
Publisher's note: Copernicus Publications remains neutral with regard to jurisdictional claims made in the text, published maps, institutional affiliations, or any other geographical representation in this paper. While Copernicus Publications makes every effort to include appropriate place names, the final responsibility lies with the authors.
We would like to thank the UK Met Office JWCRP and Clean Air programmes and the National Centre for Atmospheric Science for funding the development of the UKCA model. Alexander T. Archibald thanks the University of Canterbury Erskine Programme for supporting a sabbatical visit to the University of Canterbury, Christchurch. This work used Monsoon2, a collaborative high performance computing facility funded by the Met Office and the Natural Environment Research Council. This work used JASMIN, the UK collaborative data analysis facility
This research has been supported by the Natural Environment Research Council (grant nos. NE/N018001/1 and 10 NE/W009412/1), the National Institute of Water and Atmospheric Research (grant no. C01X1901) and the Studienstiftung des Deutschen Volkes.
This paper was edited by John Orlando and reviewed by two anonymous referees.
Archibald, A., Cala, B., Archer-Nicholls, S., Weber, J., Abraham, N. L., Griffiths, P. T., Jacob, L., Shin, Y. M., Revell, L. E., and Woodhouse, M.: BOXMOX files for Cala et al. acp-2023-42 (Version 1), Zenodo [code], https://doi.org/10.5281/zenodo.10114476, 2023.
Assaf, E., Finewax, Z., Marshall, P., Veres, P. R., Neuman, J. A., and Burkholder, J. B.: Measurement of the Intramolecular Hydrogen-Shift Rate Coefficient for the CH3SCH2OO Radical between 314 and 433 K, J. Phys. Chem. A, 127, 2336–2350, 2023.
Andreae, M. O.: Ocean-atmosphere interactions in the global biogeochemical sulfur cycle, Mar. Chem., 30, 1–29, https://doi.org/10.1016/0304-4203(90)90059-L, 1990.
Archer-Nicholls, S., Abraham, N. L., Shin, Y. M., Weber, J., Russo, M. R., Lowe, D., Utembe, S. R., O'Connor, F. M., Kerridge, B., Latter, B., Siddans, R., Jenkin, M., Wild, O., and Archibald, A. T.: The Common Representative Intermediates Mechanism Version 2 in the United Kingdom Chemistry and Aerosols Model, J. Adv. Model. Earth Sy., 13, e2020MS002420, https://doi.org/10.1029/2020MS002420, 2021.
Archibald, A. T., Jenkin, M. E., and Shallcross, D. E.: An isoprene mechanism intercomparison, Atmos. Environ., 44, 5356–5364, https://doi.org/10.1016/j.atmosenv.2009.09.016, 2010.
Archibald, A. T., O'Connor, F. M., Abraham, N. L., Archer-Nicholls, S., Chipperfield, M. P., Dalvi, M., Folberth, G. A., Dennison, F., Dhomse, S. S., Griffiths, P. T., Hardacre, C., Hewitt, A. J., Hill, R. S., Johnson, C. E., Keeble, J., Köhler, M. O., Morgenstern, O., Mulcahy, J. P., Ordóñez, C., Pope, R. J., Rumbold, S. T., Russo, M. R., Savage, N. H., Sellar, A., Stringer, M., Turnock, S. T., Wild, O., and Zeng, G.: Description and evaluation of the UKCA stratosphere–troposphere chemistry scheme (StratTrop vn 1.0) implemented in UKESM1, Geosci. Model Dev., 13, 1223–1266, https://doi.org/10.5194/gmd-13-1223-2020, 2020.
Arsene, C., Barnes, I., and Becker, K. H.: FT-IR product study of the photo-oxidation of dimethyl sulfide: Temperature and O2 partial pressure dependence, Phys. Chem. Chem. Phys., 1, 5463–5470, https://doi.org/10.1039/A907211J, 1999.
Atkinson, R., Baulch, D. L., Cox, R. A., Crowley, J. N., Hampson, R. F., Hynes, R. G., Jenkin, M. E., Rossi, M. J., and Troe, J.: Evaluated kinetic and photochemical data for atmospheric chemistry: Volume I – gas phase reactions of Ox, HOx, NOx and SOx species, Atmos. Chem. Phys., 4, 1461–1738, https://doi.org/10.5194/acp-4-1461-2004, 2004.
Barnes, I., Hjorth, J., and Mihalopoulos, N.: Dimethyl Sulfide and Dimethyl Sulfoxide and Their Oxidation in the Atmosphere, Chem. Rev., 106, 940–975, https://doi.org/10.1021/cr020529+, 2006.
Barone, S., Turnipseed, A., and Ravishankara, A.: Role of adducts in the atmospheric oxidation of dimethyl sulfide, Faraday Discuss., 100, 39–54, https://doi.org/10.1039/FD9950000039, 1995.
Berglen, T. F., Berntsen, T. K., Isaksen, I. S. A., and Sundet, J. K.: A global model of the coupled sulfur/oxidant chemistry in the troposphere: The sulfur cycle, J. Geophys. Res.-Atmos., 109, D19310, https://doi.org/10.1029/2003JD003948, 2004.
Berndt, T., Scholz, W., Mentler, B., Fischer, L., Hoffmann, E. H., Tilgner, A., Hyttinen, N., Prisle, N. L., Hansel, A., and Herrmann, H.: Fast Peroxy Radical Isomerization and OH Recycling in the Reaction of OH Radicals with Dimethyl Sulfide, J. Phys. Chem. Lett., 10, 6478–6483, https://doi.org/10.1021/acs.jpclett.9b02567, 2019.
Bhatti, Y., Revell, L., Schuddeboom, A., McDonald, A., Archibald, A., Williams, J., Venugopal, A., Hardacre, C., and Behrens, E.: The sensitivity of Southern Ocean atmospheric dimethyl sulfide to modelled sources and emissions, EGUsphere [preprint], https://doi.org/10.5194/egusphere-2023-868, 2023.
Bock, J., Michou, M., Nabat, P., Abe, M., Mulcahy, J. P., Olivié, D. J. L., Schwinger, J., Suntharalingam, P., Tjiputra, J., van Hulten, M., Watanabe, M., Yool, A., and Séférian, R.: Evaluation of ocean dimethylsulfide concentration and emission in CMIP6 models, Biogeosciences, 18, 3823–3860, https://doi.org/10.5194/bg-18-3823-2021, 2021.
Boucher, O., Moulin, C., Belviso, S., Aumont, O., Bopp, L., Cosme, E., von Kuhlmann, R., Lawrence, M. G., Pham, M., Reddy, M. S., Sciare, J., and Venkataraman, C.: DMS atmospheric concentrations and sulphate aerosol indirect radiative forcing: a sensitivity study to the DMS source representation and oxidation, Atmos. Chem. Phys., 3, 49–65, https://doi.org/10.5194/acp-3-49-2003, 2003.
Breider, T. J., Chipperfield, M. P., Richards, N. a. D., Carslaw, K. S., Mann, G. W., and Spracklen, D. V.: Impact of BrO on dimethylsulfide in the remote marine boundary layer, Geophys. Res. Lett., 37, L02807, https://doi.org/10.1029/2009GL040868, 2010.
Butkovskaya, N. I. and Barnes, I.: Model Study of the Photooxidation of CH3SO2SCH3 at Atmospheric Pressure: Thermal Decomposition of the CH3SO2 Radical, in: Global Atmospheric Change and its Impact on Regional Air Quality, edited by: Barnes, I., Springer Netherlands, Dordrecht, 147–152, https://doi.org/10.1007/978-94-010-0082-6_ 22, 2002.
Butkovskaya, N. I. and LeBras, G.: Mechanism of the NO3 + DMS Reaction by Discharge Flow Mass Spectrometry, J. Phys. Chem., 98, 2582–2591, https://doi.org/10.1021/j100061a014, 1994.
Caldeira, K. and Duffy, P. B. The role of the Southern Ocean in uptake and storage of anthropogenic carbon dioxide, Science, 287, 620–622, 2000.
Campolongo, F., Saltelli, A., Jensen, N. R., Wilson, J., and Hjorth, J.: The Role of Multiphase Chemistry in the Oxidation of Dimethylsulphide (DMS), A Latitude Dependent Analysis, J. Atmos. Chem., 32, 327–356, https://doi.org/10.1023/A:1006154618511, 1999.
Cao, J., Wang, W. L., Gao, L. J., and Fu, F.: Mechanism and thermodynamic properties of CH3SO3 decomposition, Acta Phys. Chim. Sin., 29, 1161–1167, https://doi.org/10.3866/PKU.WHXB201304021, 2013.
Capaldo, K. P. and Pandis, S. N.: Dimethylsulfide chemistry in the remote marine atmosphere: Evaluation and sensitivity analysis of available mechanisms, J. Geophys. Res.-Atmos., 102, 23251–23267, 1997.
Carslaw, K. S., Lee, L. A., Reddington, C. L., Pringle, K. J., Rap, A., Forster, P. M., Mann, G. W., Spracklen, D. V., Woodhouse, M. T., Regayre, L. A., and Pierce, J. R.: Large contribution of natural aerosols to uncertainty in indirect forcing, Nature, 503, 67–71, https://doi.org/10.1038/nature12674, 2013.
Charlson, R. J., Lovelock, J. E., Andreae, M. O., and Warren, S. G.: Oceanic phytoplankton, atmospheric sulphur, cloud albedo and climate, Nature, 326, 655–661, https://doi.org/10.1038/326655a0, 1987.
Chen, H. and Finlayson-Pitts, B. J.: New Particle Formation from Methanesulfonic Acid and Amines/Ammonia as a Function of Temperature, Environ. Sci. Technol., 51, 243–252, https://doi.org/10.1021/acs.est.6b04173, 2017.
Chen, H., Ezell, M. J., Arquero, K. D., Varner, M. E., Dawson, M. L., Gerber, R. B., and Finlayson-Pitts, B. J.: New particle formation and growth from methanesulfonic acid, trimethylamine and water, Phys. Chem. Chem. Phys., 17, 13699–13709, https://doi.org/10.1039/C5CP00838G, 2015.
Chen, J., Berndt, T., Møller, K. H., Lane, J. R., and Kjaergaard, H. G.: Atmospheric Fate of the CH3SOO Radical from the CH3S + O2 Equilibrium, J. Phys. Chem. A, 125, 8933–8941, https://doi.org/10.1021/acs.jpca.1c06900, 2021.
Chen, Q., Sherwen, T., Evans, M., and Alexander, B.: DMS oxidation and sulfur aerosol formation in the marine troposphere: a focus on reactive halogen and multiphase chemistry, Atmos. Chem. Phys., 18, 13617–13637, https://doi.org/10.5194/acp-18-13617-2018, 2018.
Chin, M., Jacob, D. J., Gardner, G. M., Foreman-Fowler, M. S., Spiro, P. A., and Savoie, D. L.: A global three-dimensional model of tropospheric sulfate, J. Geophys. Res.-Atmos., 101, 18667–18690, https://doi.org/10.1029/96JD01221, 1996.
Chin, M., Savoie, D. L., Huebert, B. J., Bandy, A. R., Thornton, D. C., Bates, T. S., Quinn, P. K., Saltzman, E. S., and Bruyn, W. J. D.: Atmospheric sulfur cycle simulated in the global model GOCART: Comparison with field observations and regional budgets, J. Geophys. Res.-Atmos., 105, 24689–24712, https://doi.org/10.1029/2000JD900385, 2000.
Collins, W. J., Lamarque, J.-F., Schulz, M., Boucher, O., Eyring, V., Hegglin, M. I., Maycock, A., Myhre, G., Prather, M., Shindell, D., and Smith, S. J.: AerChemMIP: quantifying the effects of chemistry and aerosols in CMIP6, Geosci. Model Dev., 10, 585–607, https://doi.org/10.5194/gmd-10-585-2017, 2017.
Cosme, E., Genthon, C., Martinerie, P., Boucher, O., and Pham, M.: The sulfur cycle at high-southern latitudes in the LMD-ZT General Circulation Model, J. Geophys. Res.-Atmos., 107, 7–19, https://doi.org/10.1029/2002JD002149, 2002.
Dee, D. P., Uppala, S. M., Simmons, A. J., Berrisford, P., Poli, P., Kobayashi, S., Andrae, U., Balmaseda, M. A., Balsamo, G., Bauer, P., Bechtold, P., Beljaars, A. C. M., van de Berg, L., Bidlot, J., Bormann, N., Delsol, C., Dragani, R., Fuentes, M., Geer, A. J., Haimberger, L., Healy, S. B., Hersbach, H., Hólm, E. V., Isaksen, L., Kållberg, P., Köhler, M., Matricardi, M., McNally, A. P., Monge-Sanz, B. M., Morcrette, J.-J., Park, B.-K., Peubey, C., de Rosnay, P., Tavolato, C., Thépaut, J.-N., and Vitart, F.: The ERA-Interim reanalysis: configuration and performance of the data assimilation system, Q. J. Roy. Meteorol. Soc., 137, 553–597, https://doi.org/10.1002/qj.828, 2011.
Faloona, I.: Sulfur processing in the marine atmospheric boundary layer: A review and critical assessment of modeling uncertainties, Atmos. Environ., 43, 2841–2854, https://doi.org/10.1016/j.atmosenv.2009.02.043, 2009.
Fung, K. M., Heald, C. L., Kroll, J. H., Wang, S., Jo, D. S., Gettelman, A., Lu, Z., Liu, X., Zaveri, R. A., Apel, E. C., Blake, D. R., Jimenez, J.-L., Campuzano-Jost, P., Veres, P. R., Bates, T. S., Shilling, J. E., and Zawadowicz, M.: Exploring dimethyl sulfide (DMS) oxidation and implications for global aerosol radiative forcing, Atmos. Chem. Phys., 22, 1549–1573, https://doi.org/10.5194/acp-22-1549-2022, 2022.
Galí, M., Levasseur, M., Devred, E., Simó, R., and Babin, M.: Sea-surface dimethylsulfide (DMS) concentration from satellite data at global and regional scales, Biogeosciences, 15, 3497–3519, https://doi.org/10.5194/bg-15-3497-2018, 2018.
Griffiths, P. T., Murray, L. T., Zeng, G., Shin, Y. M., Abraham, N. L., Archibald, A. T., Deushi, M., Emmons, L. K., Galbally, I. E., Hassler, B., Horowitz, L. W., Keeble, J., Liu, J., Moeini, O., Naik, V., O'Connor, F. M., Oshima, N., Tarasick, D., Tilmes, S., Turnock, S. T., Wild, O., Young, P. J., and Zanis, P.: Tropospheric ozone in CMIP6 simulations, Atmos. Chem. Phys., 21, 4187–4218, https://doi.org/10.5194/acp-21-4187-2021, 2021.
Guenther, A. B., Jiang, X., Heald, C. L., Sakulyanontvittaya, T., Duhl, T., Emmons, L. K., and Wang, X.: The Model of Emissions of Gases and Aerosols from Nature version 2.1 (MEGAN2.1): an extended and updated framework for modeling biogenic emissions, Geosci. Model Dev., 5, 1471–1492, https://doi.org/10.5194/gmd-5-1471-2012, 2012.
Hezel, P. J., Alexander, B., Bitz, C. M., Steig, E. J., Holmes, C. D., Yang, X., and Sciare, J.: Modeled methanesulfonic acid (MSA) deposition in Antarctica and its relationship to sea ice, J. Geophys. Res.-Atmos., 116, D23214, https://doi.org/10.1029/2011JD016383, 2011.
Ho, S., Peng, L., Anthes, R. A., Kuo, Y.-H., and Lin, H.-C.: Marine Boundary Layer Heights and Their Longitudinal, Diurnal, and Interseasonal Variability in the Southeastern Pacific Using COSMIC, CALIOP, and Radiosonde Data, J. Climate, 28, 2856–2872, https://doi.org/10.1175/JCLI-D-14-00238.1, 2015.
Hoffmann, E. H., Tilgner, A., Schrödner, R., Bräuer, P., Wolke, R., and Herrmann, H.: An advanced modeling study on the impacts and atmospheric implications of multiphase dimethyl sulfide chemistry, P. Natl. Acad. Sci. USA, 113, 11776–11781, https://doi.org/10.1073/pnas.1606320113, 2016.
Hoffmann, E. H., Heinold, B., Kubin, A., Tegen, I., and Herrmann, H.: The Importance of the Representation of DMS Oxidation in Global Chemistry-Climate Simulations, Geophys. Res. Lett., 48, e2021GL094068, https://doi.org/10.1029/2021GL094068, 2021.
Hulswar, S., Simó, R., Galí, M., Bell, T. G., Lana, A., Inamdar, S., Halloran, P. R., Manville, G., and Mahajan, A. S.: Third revision of the global surface seawater dimethyl sulfide climatology (DMS-Rev3), Earth Syst. Sci. Data, 14, 2963–2987, https://doi.org/10.5194/essd-14-2963-2022, 2022.
Jenkin, M. E., Young, J. C., and Rickard, A. R.: The MCM v3.3.1 degradation scheme for isoprene, Atmos. Chem. Phys., 15, 11433–11459, https://doi.org/10.5194/acp-15-11433-2015, 2015.
Jenkin, M. E., Khan, M. A. H., Shallcross, D. E., Bergström, R., Simpson, D., Murphy, K. L. C., and Rickard, A. R.: The CRI v2.2 reduced degradation scheme for isoprene, Atmos. Environ., 212, 172–182, https://doi.org/10.1016/j.atmosenv.2019.05.055, 2019.
Jernigan, C. M., Fite, C. H., Vereecken, L., Berkelhammer, M. B., Rollins, A. W., Rickly, P. S., Novelli, A., Taraborrelli, D., Holmes, C. D., and Bertram, T. H.: Efficient Production of Carbonyl Sulfide in the Low-NOx Oxidation of Dimethyl Sulfide, Geophys. Res. Lett., 49, e2021GL096838, https://doi.org/10.1029/2021GL096838, 2022.
Karl, M., Gross, A., Leck, C., and Pirjola, L.: Intercomparison of dimethylsulfide oxidation mechanisms for the marine boundary layer: Gaseous and particulate sulfur constituents, J. Geophys. Res.-Atmos., 112, https://doi.org/10.1029/2006JD007914, 2007.
Khan, M. A. H., Gillespie, S. M. P., Razis, B., Xiao, P., Davies-Coleman, M. T., Percival, C. J., Derwent, R. G., Dyke, J. M., Ghosh, M. V., Lee, E. P. F., and Shallcross, D. E.: A modelling study of the atmospheric chemistry of DMS using the global model, STOCHEM-CRI, Atmos. Environ., 127, 69–79, https://doi.org/10.1016/j.atmosenv.2015.12.028, 2016.
Khan, M. A. H., Bannan, T. J., Holland, R., Shallcross, D. E., Archibald, A. T., Matthews, E., Back, A., Allan, J., Coe, H., Artaxo, P., and Percival, C. J.: Impacts of Hydroperoxymethyl Thioformate on the Global Marine Sulfur Budget, ACS Earth Space Chem., 5, 2577–2586, https://doi.org/10.1021/acsearthspacechem.1c00218, 2021.
Knote, C., Tuccella, P., Curci, G., Emmons, L., Orlando, J. J., Madronich, S., Baró, R., Jiménez-Guerrero, P., Luecken, D., Hogrefe, C., Forkel, R., Werhahn, J., Hirtl, M., Pérez, J. L., San José, R., Giordano, L., Brunner, D., Yahya, K., and Zhang, Y.: Influence of the choice of gas-phase mechanism on predictions of key gaseous pollutants during the AQMEII phase-2 intercomparison, Atmos. Environ., 115, 553–568, https://doi.org/10.1016/j.atmosenv.2014.11.066, 2015.
Lee, C., Martin, R. V., van Donkelaar, A., Lee, H., Dickerson, R. R., Hains, J. C., Krotkov, N., Richter, A., Vinnikov, K., and Schwab, J. J.: SO2 emissions and lifetimes: Estimates from inverse modeling using in situ and global, space-based (SCIAMACHY and OMI) observations, J. Geophys. Res.-Atmos., 116, D06304, https://doi.org/10.1029/2010JD014758, 2011.
McKee, M. L.: Theoretical study of thet CH3SOO radical, Chem. Phys. Lett., 211, 643–648, https://doi.org/10.1016/0009-2614(93)80157-K, 1993.
Minikin, A., Legrand, M., Hall, J., Wagenbach, D., Kleefeld, C., Wolff, E., Pasteur, E. C., and Ducroz, F.: Sulfur-containing species (sulfate and methanesulfonate) in coastal Antarctic aerosol and precipitation, J. Geophys. Res.-Atmos., 103, 10975–10990, https://doi.org/10.1029/98JD00249, 1998.
Mulcahy, J. P., Johnson, C., Jones, C. G., Povey, A. C., Scott, C. E., Sellar, A., Turnock, S. T., Woodhouse, M. T., Abraham, N. L., Andrews, M. B., Bellouin, N., Browse, J., Carslaw, K. S., Dalvi, M., Folberth, G. A., Glover, M., Grosvenor, D. P., Hardacre, C., Hill, R., Johnson, B., Jones, A., Kipling, Z., Mann, G., Mollard, J., O'Connor, F. M., Palmiéri, J., Reddington, C., Rumbold, S. T., Richardson, M., Schutgens, N. A. J., Stier, P., Stringer, M., Tang, Y., Walton, J., Woodward, S., and Yool, A.: Description and evaluation of aerosol in UKESM1 and HadGEM3-GC3.1 CMIP6 historical simulations, Geosci. Model Dev., 13, 6383–6423, https://doi.org/10.5194/gmd-13-6383-2020, 2020.
Novak, G. A., Fite, C. H., Holmes, C. D., Veres, P. R., Neuman, J. A., Faloona, I., Thornton, J. A., Wolfe, G. M., Vermeuel, M. P., Jernigan, C. M., Peischl, J., Ryerson, T. B., Thompson, C. R., Bourgeois, I., Warneke, C., Gkatzelis, G. I., Coggon, M. M., Sekimoto, K., Bui, T. P., Dean-Day, J., Diskin, G. S., DiGangi, J. P., Nowak, J. B., Moore, R. H., Wiggins, E. B., Winstead, E. L., Robinson, C., Thornhill, K. L., Sanchez, K. J., Hall, S. R., Ullmann, K., Dollner, M., Weinzierl, B., Blake, D. R., and Bertram, T. H.: Rapid cloud removal of dimethyl sulfide oxidation products limits SO2 and cloud condensation nuclei production in the marine atmosphere, P. Natl. Acad. Sci. USA 118, 1–7, https://doi.org/10.1073/pnas.2110472118, 2021.
Pacifico, F., Harrison, S. P., Jones, C. D., Arneth, A., Sitch, S., Weedon, G. P., Barkley, M. P., Palmer, P. I., Serça, D., Potosnak, M., Fu, T.-M., Goldstein, A., Bai, J., and Schurgers, G.: Evaluation of a photosynthesis-based biogenic isoprene emission scheme in JULES and simulation of isoprene emissions under present-day climate conditions, Atmos. Chem. Phys., 11, 4371–4389, https://doi.org/10.5194/acp-11-4371-2011, 2011.
Pham, M., Müller, J.-F., Brasseur, G. P., Granier, C., and Mégie, G.: A three-dimensional study of the tropospheric sulfur cycle, J. Geophys. Res.-Atmos., 100, 26061–26092, https://doi.org/10.1029/95JD02095, 1995.
Ranjithkumar, A., Gordon, H., Williamson, C., Rollins, A., Pringle, K., Kupc, A., Abraham, N. L., Brock, C., and Carslaw, K.: Constraints on global aerosol number concentration, SO2 and condensation sink in UKESM1 using ATom measurements, Atmos. Chem. Phys., 21, 4979–5014, https://doi.org/10.5194/acp-21-4979-2021, 2021.
Sander, R.: Compilation of Henry's law constants (version 4.0) for water as solvent, Atmos. Chem. Phys., 15, 4399–4981, https://doi.org/10.5194/acp-15-4399-2015, 2015.
Sandu, A. and Sander, R.: Technical note: Simulating chemical systems in Fortran90 and Matlab with the Kinetic PreProcessor KPP-2.1, Atmos. Chem. Phys., 6, 187–195, https://doi.org/10.5194/acp-6-187-2006, 2006.
Sciare, J., Mihalopoulos, N., and Dentener, F. J.: Interannual variability of atmospheric dimethylsulfide in the southern Indian Ocean, J. Geophys. Res., 105, 26369–26377, https://doi.org/10.1029/2000JD900236, 2000.
Sciare, J., Baboukas, E., and Mihalopoulos, N.: Short-Term Variability of Atmospheric DMS and Its Oxidation Products at Amsterdam Island during Summer Time, J. Atmos. Chem., 39, 281–302, https://doi.org/10.1023/A:1010631305307, 2001.
Sellar, A. A., Jones, C. G., Mulcahy, J. P., Tang, Y., Yool, A., Wiltshire, A., O'Connor, F. M., Stringer, M., Hill, R., Palmieri, J., Woodward, S., Mora, L. de, Kuhlbrodt, T., Rumbold, S. T., Kelley, D. I., Ellis, R., Johnson, C. E., Walton, J., Abraham, N. L., Andrews, M. B., Andrews, T., Archibald, A. T., Berthou, S., Burke, E., Blockley, E., Carslaw, K., Dalvi, M., Edwards, J., Folberth, G. A., Gedney, N., Griffiths, P. T., Harper, A. B., Hendry, M. A., Hewitt, A. J., Johnson, B., Jones, A., Jones, C. D., Keeble, J., Liddicoat, S., Morgenstern, O., Parker, R. J., Predoi, V., Robertson, E., Siahaan, A., Smith, R. S., Swaminathan, R., Woodhouse, M. T., Zeng, G., and Zerroukat, M.: UKESM1: Description and Evaluation of the U.K. Earth System Model, J. Adv. Model. Earth Sy., 11, 4513–4558, https://doi.org/10.1029/2019MS001739, 2019.
Sellar, A. A., Walton, J., Jones, C. G., Wood, R., Abraham, N. L., Andrejczuk, M., Andrews, M. B., Andrews, T., Archibald, A. T., de Mora, L., Dyson, H., Elkington, M., Ellis, R., Florek, P., Good, P., Gohar, L., Haddad, S., Hardiman, S. C., Hogan, E., Iwi, A., Jones, C. D., Johnson, B., Kelley, D. I., Kettleborough, J., Knight, J. R., Köhler, M. O., Kuhlbrodt, T., Liddicoat, S., Linova-Pavlova, I., Mizielinski, M. S., Morgenstern, O., Mulcahy, J., Neininger, E., O'Connor, F. M., Petrie, R., Ridley, J., Rioual, J.-C., Roberts, M., Robertson, E., Rumbold, S., Seddon, J., Shepherd, H., Shim, S., Stephens, A., Teixiera, J. C., Tang, Y., Williams, J., Wiltshire, A., and Griffiths, P. T.: Implementation of U.K. Earth System Models for CMIP6, J. Adv. Model. Earth Sy., 12, e2019MS001946, https://doi.org/10.1029/2019MS001946, 2020.
Stevenson, D. S., Zhao, A., Naik, V., O'Connor, F. M., Tilmes, S., Zeng, G., Murray, L. T., Collins, W. J., Griffiths, P. T., Shim, S., Horowitz, L. W., Sentman, L. T., and Emmons, L.: Trends in global tropospheric hydroxyl radical and methane lifetime since 1850 from AerChemMIP, Atmos. Chem. Phys., 20, 12905–12920, https://doi.org/10.5194/acp-20-12905-2020, 2020.
Sutton, R. T., McCarthy, G. D., Robson, J., Sinha, B., Archibald, A. T., and Gray, L. J.: Atlantic multidecadal variability and the UK ACSIS program, B. Am. Meteorol. Soc., 99, 415–425, 2018.
Telford, P. J., Abraham, N. L., Archibald, A. T., Braesicke, P., Dalvi, M., Morgenstern, O., O'Connor, F. M., Richards, N. A. D., and Pyle, J. A.: Implementation of the Fast-JX Photolysis scheme (v6.4) into the UKCA component of the MetUM chemistry-climate model (v7.3), Geosci. Model Dev., 6, 161–177, https://doi.org/10.5194/gmd-6-161-2013, 2013.
Tesdal, J.-E., Christian, J. R., Monahan, A. H., von Salzen, K., Tesdal, J.-E., Christian, J. R., Monahan, A. H., and von Salzen, K.: Evaluation of diverse approaches for estimating sea-surface DMS concentration and air–sea exchange at global scale, Environ. Chem., 13, 390–412, https://doi.org/10.1071/EN14255, 2015.
Thomas, E. R., Allen, C. S., Etourneau, J., King, A. C., Severi, M., Winton, V. H. L., Mueller, J., Crosta, X., and Peck, V. L.: Antarctic sea ice proxies from marine and ice core archives suitable for reconstructing sea ice over the past 2000 years, Geosciences, 9, 506, https://doi.org/10.3390/geosciences9120506, 2019.
Turnipseed, A. A., Barone, S. B., and Ravishankara, A. R.: Observation of methylthiyl radical addition to oxygen in the gas phase, J. Phys. Chem., 96, 7502–7505, https://doi.org/10.1021/j100198a006, 1992.
Urbanski, S. P., Stickel, R. E., and Wine, P. H.: Mechanistic and Kinetic Study of the Gas-Phase Reaction of Hydroxyl Radical with Dimethyl Sulfoxide, J. Phys. Chem. A, 102, 10522–10529, https://doi.org/10.1021/jp9833911, 1998.
Veres, P. R., Neuman, J. A., Bertram, T. H., Assaf, E., Wolfe, G. M., Williamson, C. J., Weinzierl, B., Tilmes, S., Thompson, C. R., Thames, A. B., Schroder, J. C., Saiz-Lopez, A., Rollins, A. W., Roberts, J. M., Price, D., Peischl, J., Nault, B. A., Møller, K. H., Miller, D. O., Meinardi, S., Li, Q., Lamarque, J.-F., Kupc, A., Kjaergaard, H. G., Kinnison, D., Jimenez, J. L., Jernigan, C. M., Hornbrook, R. S., Hills, A., Dollner, M., Day, D. A., Cuevas, C. A., Campuzano-Jost, P., Burkholder, J., Bui, T. P., Brune, W. H., Brown, S. S., Brock, C. A., Bourgeois, I., Blake, D. R., Apel, E. C., and Ryerson, T. B.: Global airborne sampling reveals a previously unobserved dimethyl sulfide oxidation mechanism in the marine atmosphere, P. Natl. Acad. Sci. USA, 117, 4505–4510, https://doi.org/10.1073/pnas.1919344117, 2020.
Vermeuel, M. P., Novak, G. A., Jernigan, C. M., and Bertram, T. H.: Diel Profile of Hydroperoxymethyl Thioformate: Evidence for Surface Deposition and Multiphase Chemistry, Environ. Sci. Technol., 54, 12521–12529, https://doi.org/10.1021/acs.est.0c04323, 2020.
von Glasow, R. and Crutzen, P. J.: Model study of multiphase DMS oxidation with a focus on halogens, Atmos. Chem. Phys., 4, 589–608, https://doi.org/10.5194/acp-4-589-2004, 2004.
Walters, D., Baran, A. J., Boutle, I., Brooks, M., Earnshaw, P., Edwards, J., Furtado, K., Hill, P., Lock, A., Manners, J., Morcrette, C., Mulcahy, J., Sanchez, C., Smith, C., Stratton, R., Tennant, W., Tomassini, L., Van Weverberg, K., Vosper, S., Willett, M., Browse, J., Bushell, A., Carslaw, K., Dalvi, M., Essery, R., Gedney, N., Hardiman, S., Johnson, B., Johnson, C., Jones, A., Jones, C., Mann, G., Milton, S., Rumbold, H., Sellar, A., Ujiie, M., Whitall, M., Williams, K., and Zerroukat, M.: The Met Office Unified Model Global Atmosphere 7.0/7.1 and JULES Global Land 7.0 configurations, Geosci. Model Dev., 12, 1909–1963, https://doi.org/10.5194/gmd-12-1909-2019, 2019.
Wang, X., Jacob, D. J., Downs, W., Zhai, S., Zhu, L., Shah, V., Holmes, C. D., Sherwen, T., Alexander, B., Evans, M. J., Eastham, S. D., Neuman, J. A., Veres, P. R., Koenig, T. K., Volkamer, R., Huey, L. G., Bannan, T. J., Percival, C. J., Lee, B. H., and Thornton, J. A.: Global tropospheric halogen (Cl, Br, I) chemistry and its impact on oxidants, Atmos. Chem. Phys., 21, 13973–13996, https://doi.org/10.5194/acp-21-13973-2021, 2021.
Weber, J., Archer-Nicholls, S., Griffiths, P., Berndt, T., Jenkin, M., Gordon, H., Knote, C., and Archibald, A. T.: CRI-HOM: A novel chemical mechanism for simulating highly oxygenated organic molecules (HOMs) in global chemistry–aerosol–climate models, Atmos. Chem. Phys., 20, 10889–10910, https://doi.org/10.5194/acp-20-10889-2020, 2020.
Weber, J., Archer-Nicholls, S., Abraham, N. L., Shin, Y. M., Bannan, T. J., Percival, C. J., Bacak, A., Artaxo, P., Jenkin, M., Khan, M. A. H., Shallcross, D. E., Schwantes, R. H., Williams, J., and Archibald, A. T.: Improvements to the representation of BVOC chemistry–climate interactions in UKCA (v11.5) with the CRI-Strat 2 mechanism: incorporation and evaluation, Geosci. Model Dev., 14, 5239–5268, https://doi.org/10.5194/gmd-14-5239-2021, 2021.
Wells, K. C., Millet, D. B., Payne, V. H., Deventer, M. J., Bates, K. H., de Gouw, J. A., Graus, M., Warneke, C., Wisthaler, A., and Fuentes, J. D.: Satellite isoprene retrievals constrain emissions and atmospheric oxidation, Nature, 585, 225–233, 2020.
Wennberg, P. O., Bates, K. H., Crounse, J. D., Dodson, L. G., McVay, R. C., Mertens, L. A., Nguyen, T. B., Praske, E., Schwantes, R. H., Smarte, M. D., St Clair, J. M., Teng, A. P., Zhang, X., and Seinfeld, J. H.: Gas-Phase reactions of isoprene and its major oxidation products, Chem. Rev., 118, 3337–3390, https://doi.org/10.1021/acs.chemrev.7b00439, 2018.
Wofsy, S. C., Afshar, S., Allen, H. M., Apel, E. C., Asher, E. C., Barletta, B., Bent, J., Bian, H., Biggs, B. C., Blake, D. R., Blake, N., Bourgeois, I., Brock, C. A., Brune, W. H., Budney, J. W., Bui, T. P., Butler, A., Campuzano-Jost, P., Chang, C. S., Chin, M., Commane, R., Corr, G., and Zeng, L. H.: ATom: merged atmospheric chemistry, trace gases, and aerosols, data set, ORNL DAAC, Oak Ridge, Tennessee, USA, https://doi.org/10.3334/ORNLDAAC/1581, 2018.
Wollesen de Jonge, R., Elm, J., Rosati, B., Christiansen, S., Hyttinen, N., Lüdemann, D., Bilde, M., and Roldin, P.: Secondary aerosol formation from dimethyl sulfide – improved mechanistic understanding based on smog chamber experiments and modelling, Atmos. Chem. Phys., 21, 9955–9976, https://doi.org/10.5194/acp-21-9955-2021, 2021
Wu, R., Wang, S., and Wang, L.: New Mechanism for the Atmospheric Oxidation of Dimethyl Sulfide. The Importance of Intramolecular Hydrogen Shift in a CH3SCH2OO Radical, J. Phys. Chem. A, 119, 112–117, https://doi.org/10.1021/jp511616j, 2015.
Ye, Q., Goss, M. B., Isaacman-VanWertz, G., Zaytsev, A., Massoli, P., Lim, C., Croteau, P., Canagaratna, M., Knopf, D. A., Keutsch, F. N., Heald, C. L., and Kroll, J. H.: Organic Sulfur Products and Peroxy Radical Isomerization in the OH Oxidation of Dimethyl Sulfide, ACS Earth Space Chem., 5, 8, https://doi.org/10.1021/acsearthspacechem.1c00108, 2021.
- Abstract
- Introduction
- Methods
- Comparison of DMS oxidation pathways (BOXMOX)
- Results from 3D model simulations using UKCA
- Discussion
- Conclusions
- Code availability
- Data availability
- Author contributions
- Competing interests
- Disclaimer
- Acknowledgements
- Financial support
- Review statement
- References
- Supplement