the Creative Commons Attribution 4.0 License.
the Creative Commons Attribution 4.0 License.
 | 28 Sep 2023
Exploring the amplified role of HCHO in the formation of HMS and O3 during the co-occurring PM2.5 and O3 pollution in a coastal city of southeast China
Youwei Hong
Keran Zhang
Dan Liao
Gaojie Chen
Min Zhao
Yiling Lin
Xiaoting Ji
Ke Xu
Yu Wu
Ruilian Yu
Gongren Hu
Sung-Deuk Choi
Likun Xue
Jinsheng Chen
To develop effective strategies for controlling both PM2.5 and O3 levels, it is crucial to understand their synergistic mechanisms and key precursors and the atmospheric physiochemical processes involved. In this study, a wintertime co-occurring O3 and PM2.5 pollution event in a coastal city in southeast China was investigated based on high-time-resolution measurements of criteria air pollutants and chemical compositions of PM2.5, and O3 precursors, such as NOx, HCHO, and volatile organic compounds (VOCs). The results of this study revealed the characteristics of positively correlated PM2.5 and MDA8 O3 concentrations, and an increase in atmospheric oxidation capacity (AOC) during the cold seasons. Strong correlations (R2= 0.415–0.477) between HCHO, Fe, Mn, and sulfate concentrations were observed, suggesting the influence of catalyzed oxidation processes in the coastal city. Through an observation-based model (OBM) analysis coupled with the Regional Atmospheric Chemistry Mechanism, version 2 (RACM2) and the Chemical Aqueous-Phase Radical Mechanism, version 3.0 (CAPRAM 3.0), we found that high concentrations of precursors (SO2 and HCHO), high relative humidity, and moderately acidic pH conditions enhanced the heterogeneous formation of hydroxymethanesulfonate (HMS) in PM2.5. Furthermore, by employing an OBM coupled to the Master Chemical Mechanism (OBM-MCM), we verified that disabling the HCHO mechanism could decrease daytime net O3 production rates by reducing the production rates of HO2 + NO. These results were consistent with the daily values of AOC, OH, HO2, and RO2 concentrations. This study contributes to a better understanding of the significance of HCHO in photochemical reactions and the formation of HMS in a coastal city.
- Article
(5257 KB) - Full-text XML
-
Supplement
(2446 KB) - BibTeX
- EndNote


Air pollution, dominated by fine particulate matter (PM2.5) and ground-level ozone (O3), is an important global environmental issue linked to climate change and human health, including cardiovascular and respiratory illnesses and mortality (Xiao et al., 2022; Vohra et al., 2022). To decrease global air pollution and associated mortality, the World Health Organization recently updated its air quality guideline for annual PM2.5 exposure from 10 to 5 µg m−3 and added the average O3 concentrations of no more than 60 µg m−3 during the peak season (WHO, 2021). To develop two-pollutant control strategies to decrease both PM2.5 and O3, there is a need to understand the synergistic mechanisms and spatiotemporal delineation between them (Ivatt et al., 2022; Li et al., 2019b).
There are complex synergistic effects between PM2.5 and O3, due to common precursors (e.g., NOx and volatile organic compounds, VOCs), atmospheric physiochemical processes, and weather systems (Li et al., 2019a; Shao et al., 2022; Jia et al., 2023; Zhang et al., 2022; Qin et al., 2021; Qu et al., 2023). An increase in O3 concentration will increase oxidizing substances, such as OH, H2O2, and RCHO, which promote the oxidation of SO2, NOx, and VOCs to secondary inorganic and organic components in PM2.5 (Feng et al., 2020; Lu et al., 2019). On the contrary, multiphase reactions occur on the surface of atmospheric particles, such as the uptake of HCHO and HO2 absorption, thus affecting the formation of O3 (Song et al., 2022; Lou et al., 2014).
Formaldehyde (HCHO) plays an important role in the photochemical reaction process and secondary aerosol formation (Kalashnikov et al., 2022; Ma et al., 2020; Song et al., 2021; Zong et al., 2021). Most studies have focused on pollution characteristics and sources, particle uptake of HCHO, and their impacts on atmospheric oxidation capacity (Liu et al., 2022b; Wu et al., 2023; Zhang et al., 2021). Recent studies have shown that HCHO can react with hydrogen peroxide (H2O2) to produce hydroxymethyl hydroperoxide (HMHP), which rapidly oxidizes dissolved sulfur dioxide (SO2, aqueous phase (aq)) to sulfate (Dovrou et al., 2022). Meanwhile, HCHO reacts with dissolved SO2 (aq) to produce hydroxymethanesulfonate (HMS, HOCH2SO), which, upon oxidation with the hydroxyl radical (OH), forms sulfate (Ma et al., 2020; Moch et al., 2018, 2020). In total, atmospheric HCHO contributes to sulfate formation in PM2.5 by producing HO2 radicals and HMHP or HMS (Wu et al., 2023; Dovrou et al., 2022; Campbell et al., 2022). However, these studies highlight the necessity for more observation research to obtain evidence of the contributions of HCHO to HMS formation. HMS is an important organosulfur compound in the atmosphere, not only in cloud and fog but also in atmospheric aerosols (Munger et al., 1986; Dixon and Aasen, 1999). The misidentification of HMS as inorganic sulfate caused the overestimation of the observed particulate sulfate (Ma et al., 2020; Dovrou et al., 2022). However, in subtropical coastal regions with apparent HCHO production, further studies are required to investigate the impacts of HCHO on the formation of HMS and ROx radicals.
Xiamen, a coastal city in southeast China, has frequently experienced PM2.5 pollution (with low O3 concentrations) in winter and O3 pollution in spring and autumn (Hong et al., 2022; Wu et al., 2019). Our previous studies mainly focused on the pollution characteristics of PM2.5 or O3 in different seasons and their sources associated with anthropogenic emissions and the East Asian monsoon (Liu et al., 2020, 2022a; Hong et al., 2021). At the end of winter and the beginning of spring in 2022, an outbreak of co-occurring O3 and PM2.5 pollution was observed in Xiamen. Therefore, it provided a unique opportunity to study the impacts of HCHO on the formation of HMS and ROx radicals. In the coastal region, there is an apparent alternation of polluted and clean air masses from continental and ocean areas and a local geographical environment, including relatively high humidity, dense vegetation, and strong atmospheric oxidation capacity (Hu et al., 2022; Wu et al., 2020). The potential roles and mechanisms of HCHO in the photochemical reaction process and HMS formation would differ from those in megacities of China, such as the Beijing–Tianjin–Hebei (BTH) area, the Yangtze River Delta (YRD), and the Pearl River Delta (PRD). Based on the observation-based model (OBM) analysis, the objectives of this study are to (1) characterize the wintertime co-occurring O3 and PM2.5 pollution process in a coastal city, (2) elaborate the influence of HCHO on the heterogeneous formation of HMS in PM2.5, and (3) explore the mechanisms of HCHO on O3 pollution and the photochemical reaction process.
2.1 Study area
The monitoring site (Institute of Urban Environment, Chinese Academy of Sciences; 24.61∘ N, 118.06∘ E) is located in Xiamen, a coastal city in southeast China (Fig. S2 in the Supplement). It is situated in a subtropical monsoon climate, with an average temperature of 18.5 ∘C and a relative humidity of 63.3 % during the wintertime observation. In autumn and winter, cold and dry air masses move northward from inland, while in late spring and summer, the prevailing air masses are southerly, characterized by warm air temperatures and high humidity. The air-monitoring supersite is located on the rooftop of a building, surrounded by residential buildings, educational institutions, a commercial zone, and freeways. The downtown area of Xiamen, with a high population density and frequent traffic jams, is located south of the monitoring site.
2.2 Observation
Gas and aerosol species, O3 precursors, the photolysis rate, and meteorological parameters were continuously measured online from 17 February to 17 March 2022. Hourly mass concentrations of PM2.5 and PM10 were measured using a tapered element oscillating microbalance (TEOM1405, Thermo Scientific Corp., MA, USA). , SO2, and O3 were monitored using continuous gas analyzers (TEI 42i, 43i, and 49i, Thermo Scientific Corp., MA, USA). A HCHO analyzer (FMS-100, Focused Photonics Inc., Hangzhou, China) was used to measure gaseous HCHO based on the Hantzsch reaction, according to our previous method (Liu et al., 2022b). Water-soluble inorganic ions (WSIIs) in PM2.5 (Cl−, , , Na+, K+, , Mg2+, and Ca2+) were measured hourly using the Monitor for AeRosols and Gases in ambient Air (MARGA 2080; Metrohm Applikon B.V.; Delft, the Netherlands). Simultaneously, organic carbon (OC) and elemental carbon (EC) in PM2.5 were measured using an analyzer (model RT-4; Sunset Laboratory Inc.; Tigard, USA). Black carbon (BC) was monitored using an aethalometer (AE31, Magee Scientific, USA) with a PM2.5 cutoff inlet. In addition, concentrations of 22 elements (Al, Si, S, Fe, K, Mn, Pb, Ca, Zn, Ba, V, Cu, Ni, As, Cr, Ag, Se, Br, Hg, Sn, Ti, and Sb) were measured using a multi-metal monitor (Xact™ 625, Cooper Environmental Services, LLT; Portland, USA). Strict quality assurance and quality control procedures were applied, and the maintenance and accuracy of all online instruments were validated (Hong et al., 2021). The detection limits, time resolutions, and measured uncertainties of air pollutants are shown in Table S3.
A gas chromatograph with flame-ionization coupled with a mass spectrometer (GC-FID/MS, TH-300B, Wuhan, China) was used to measure ambient VOCs with 1 h time resolution, following the method from our previous studies (Liu et al., 2020a, b). Briefly, the air sample was preconcentrated by cooling to −160 ∘C in a cryogenic trap, then heated to 100 ∘C, and subsequently transferred to the secondary trap using high-purity helium (He). The low-carbon (C2–C5) hydrocarbons were detected using a flame ionization detector (FID) with a PLOT () column (15 m × 0.32 mm × 6.0 µm), while other VOC species were quantified using a GC MS with a DB-624 column (60 m × 0.25 mm × 1.4 µm). The instrument can quantify 106 VOC species, including 29 alkanes, 11 alkenes, 1 alkyne, 17 aromatics, 35 halogenated hydrocarbons, and 13 OVOCs (oxygenated VOCs). Calibration was performed daily at 23:00 LT (local time) using the standard mixtures of US EPA PAMS and TO-15. The detection limits of the measured VOCs ranged from 0.02 to 0.30 ppbv.
Ambient meteorological parameters, including relative humidity (RH), temperature (T), wind speed (WS), and wind direction (WD), were obtained using an ultrasonic atmospherium (150WX, Airmar, USA). Photolysis frequencies and HCHO were measured using a photolysis spectrometer (PFS-100) and a formaldehyde monitor (FMS-100; Focused Photonics Inc., Hangzhou, China), respectively. The photolysis rate constants include J(O1D), J(NO2), J(H2O2), J(HONO), J(HCHO), and J(NO3). The distribution of fire spots during the observation periods was obtained from the Fire Information for Resource Management System (https://firms.modaps.eosdis.nasa.gov/map/, last access: 21 July 2022). The data for boundary layer height (BLH) were obtained from the European Centre for Medium-Range Weather Forecasts (ECMWF) ERA5 hourly reanalysis dataset (https://www.ecmwf.int/en/forecasts/datasets/reanalysis-datasets/era5, last access: 24 March 2023). The resolution of ERA-5 reanalysis is 0.25∘ × 0.25∘.
2.3 Positive matrix factorization (PMF) analysis
The PMF 5.0 model was applied to quantify high-time-resolution sources of PM2.5 during the observation periods. The details of the model analysis were described in our previous studies (Hong et al., 2021; Liu et al., 2020). Briefly, Eq. (1) demonstrates j compound species in the ith sample as the concentration from p independent sources.
where eij is the residual for each species, fkj is the fraction of the jth species from the kth source, gik is the species contribution of the kth source to the ith sample, xij is the jth species concentration measured in the ith sample, and p is the total number of independent sources. The Q value (Eq. 2), based on the uncertainties (μ), was used to evaluate the steadiness of the solution.
2.4 Observation-based model (OBM)
An OBM coupled to the Master Chemical Mechanism (OBM-MCM) is employed to simulate in situ atmospheric photochemical processes and quantify the O3 production rate, AOC, and OH reactivity. Details of the OBM-MCM were reported in our previous studies (Liu et al., 2022a, b). In summary, monitoring data with a 1 h time resolution of air pollutants (i.e., O3, CO, NO, NO2, HONO, SO2, and VOCs), meteorological parameters (i.e., T, P, and RH), and photolysis rate constants (J(O1D), J(NO2), J(H2O2), J(HONO), J(HCHO), and J(NO3)) were input into the OBM-MCM as constraints for the model simulation. The photolysis rates of other molecules were determined by solar zenith angle and scaled using measured JNO2 values (Saunders et al., 2003). According to our previous studies, the model incorporates the physical process of deposition within the boundary layer height (BLH), which varies from 300 m during nighttime to 1500 m during the daytime in winter (Li et al., 2018; Liu et al., 2022a, b). Therefore, dry deposition velocities were used to simulate the deposition loss of certain reactants in the atmosphere (Zhang et al., 2003; Xue et al., 2014).
To simulate the concentration of particulate HCHO and its role in the heterogeneous formation of hydroxymethanesulfonate (HMS), the observation-based zero dimensional multiphase chemical box model was used, of which the gas-phase chemistry is described by the Regional Atmospheric Chemistry Mechanism, version 2 (RACM2), and the aqueous-phase part of the mechanism is represented by the Chemical Aqueous-Phase Radical Mechanism, version 3.0 (CAPRAM 3.0). The mass transfer processes between the gas and aqueous phases are also considered in the current model according to Schwartz (1986). The Henry's law constant of HCHO was updated with a value of 0.31 × 10⁸ M atm−1, as estimated by Mitsuishi et al. (2018). Sensitivity analysis was conducted to evaluate the uncertainties introduced by the Henry's law constant; details can be found in the Supplement. For major production and loss paths of HMS, dissolved HCHO reacts with sulfite and bisulfite to form HMS (Eqs. 3–4), which can be further oxidized by aqueous OH radicals (Eq. 5); details about the HMS mechanisms and the corresponding reaction kinetics are documented on the CAPRAM website (https://capram.tropos.de/, last access: 4 May 2023).
For detailed modeling steps of HMS, firstly, the observation data of gaseous NO, NO2, O3, SO2, CO, NMHCs (non-methane hydrocarbons), HCHO, and 10 other carbonyls, particulate-phase , , and Cl−, along with meteorological parameters, were averaged or interpolated into a 1 h time resolution and classified into model recognized groups as model inputs, while the measured was used as the initial conditions. Liquid water content (LWC) and aqueous H+ concentrations, calculated using the ISORROPIA-II model (Hong et al., 2022), were also used as model inputs. Then, model calculations were conducted using the commercial FACSIMILE software; the modeling period was from 26 February to 16 March 2022, and each day was regarded as an independent simulation case. The model was constrained every hour by the input observation data for integral calculation. For each case, the integration ran three times in series to steady the unconstrained species (e.g., radicals), which was initiated at 00:00 LT and had a step of 1 h and a duration of 24 h. Finally, the modeled HMS concentrations of the third run were outputted with a 1 h time resolution for further analysis.
3.1 Overview of co-occurring O3 and PM2.5 pollution
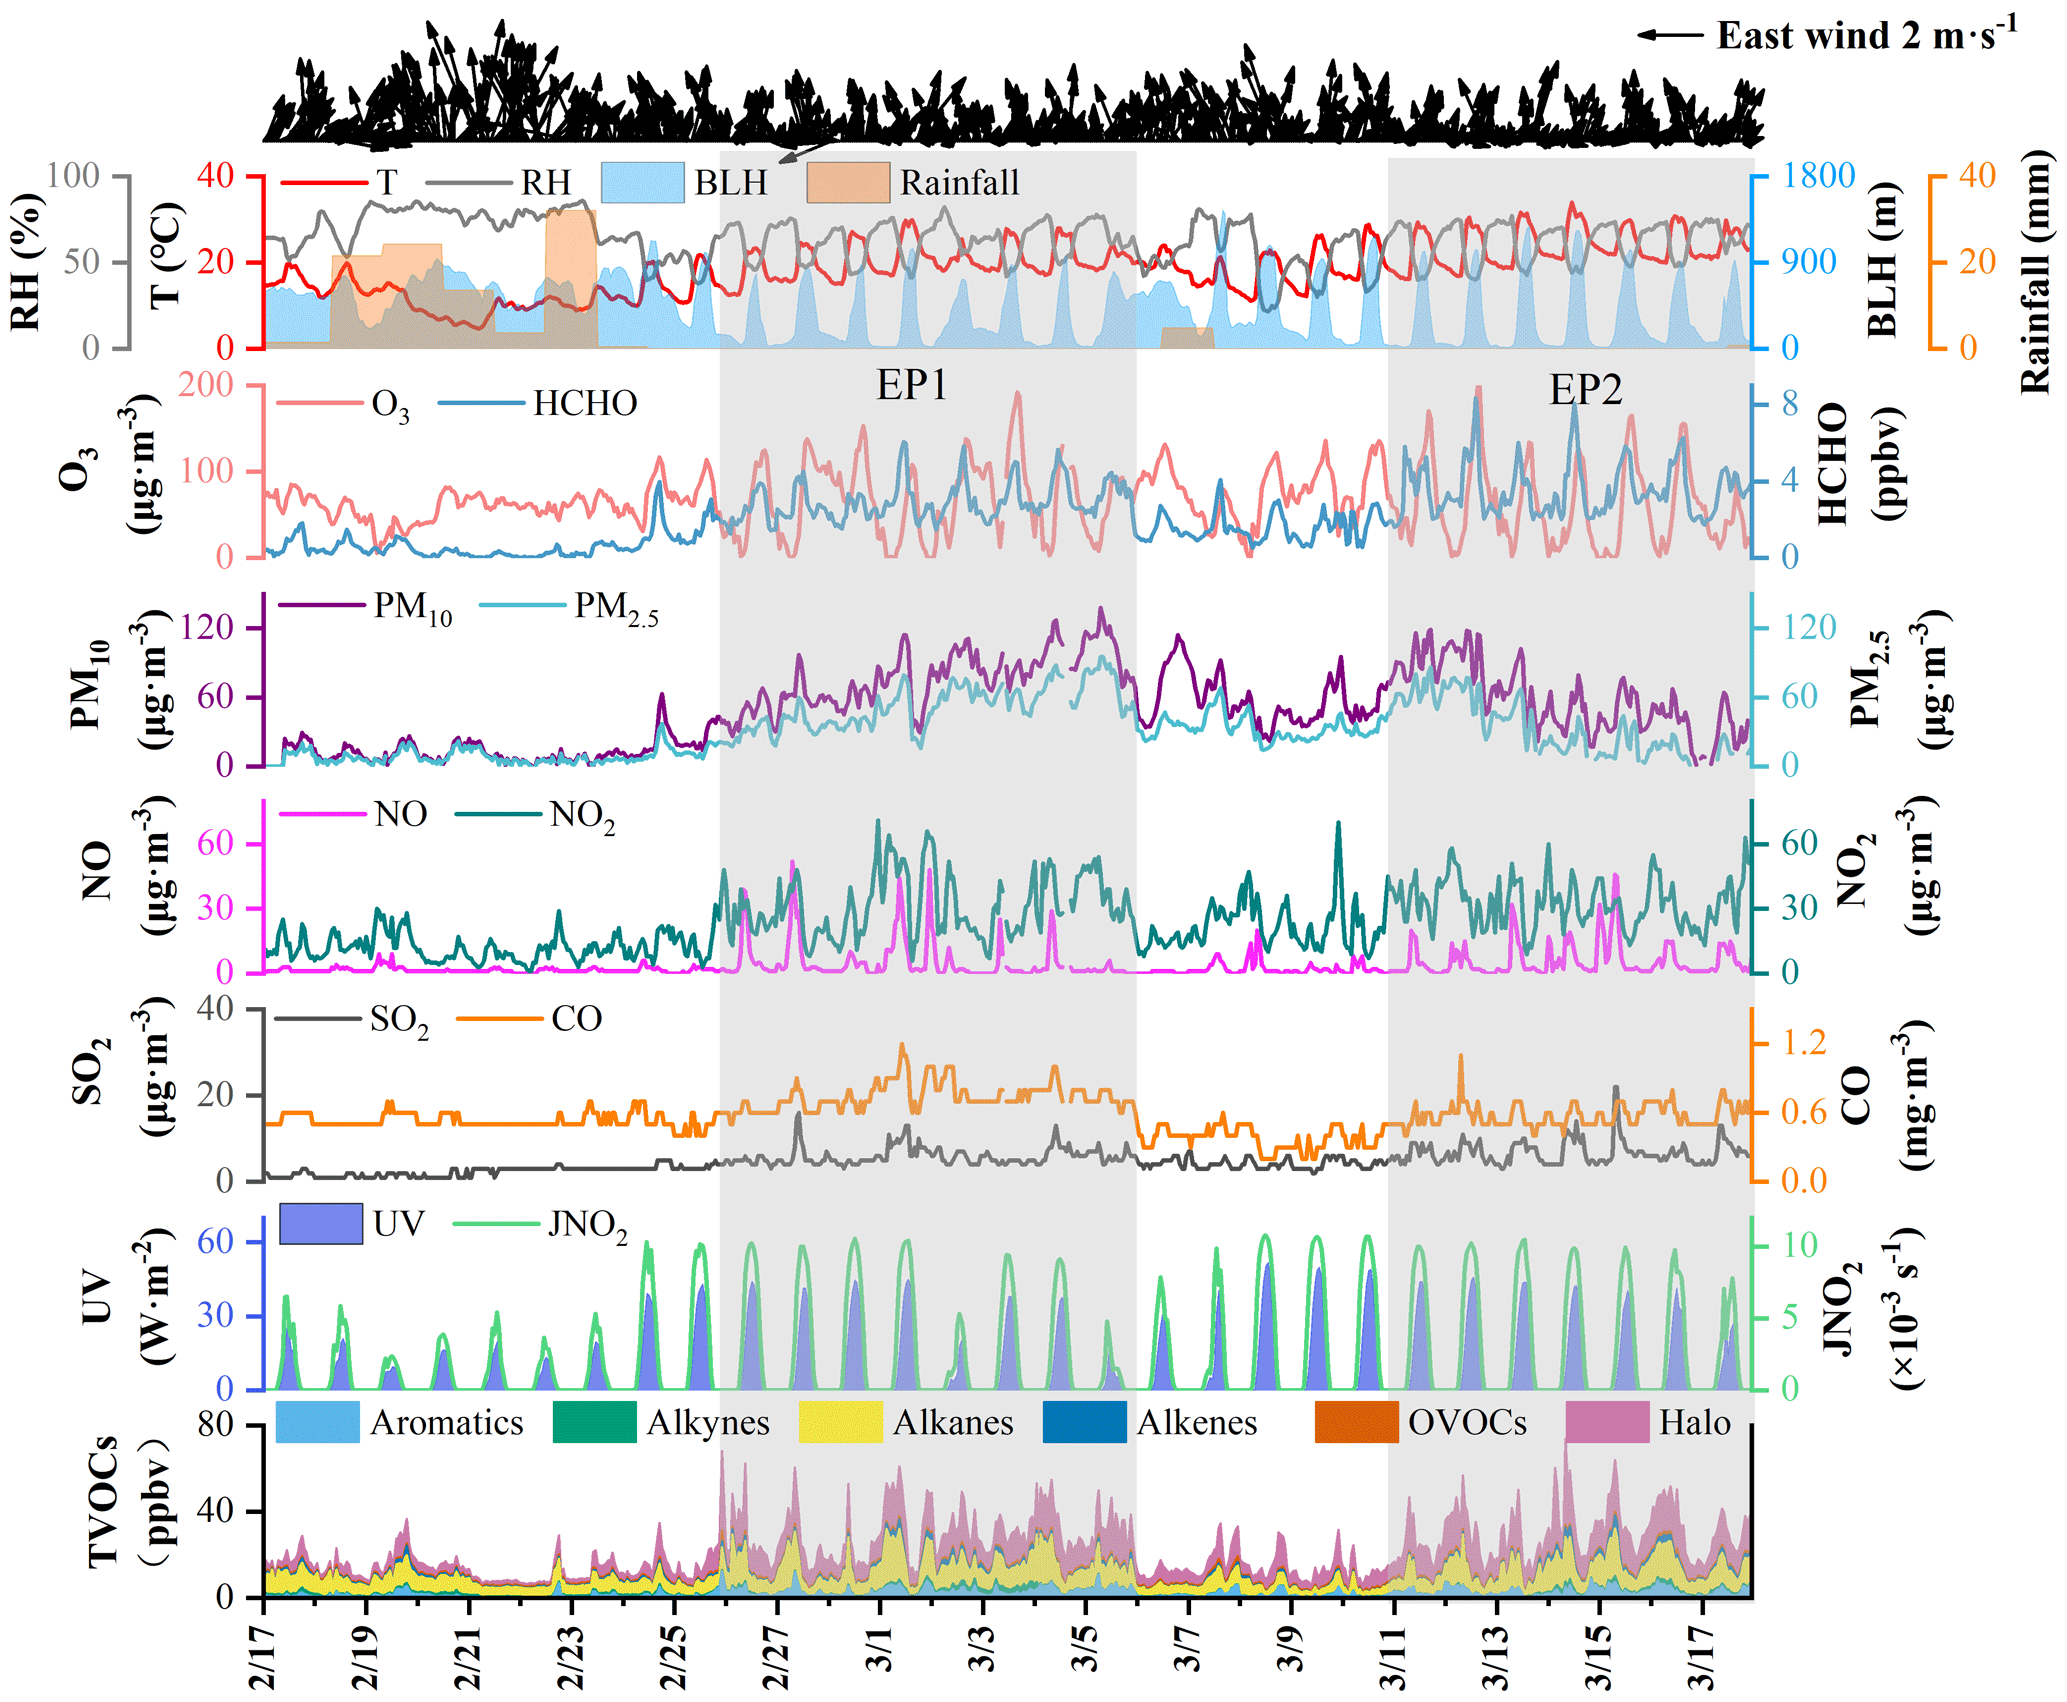
The time series of criteria air pollutants, O3 precursors, and meteorological parameters from 17 February to 17 March 2022 are shown in Fig. 1. Two typical PM2.5 and O3 pollution episodes (EP1 – 26 February to 5 March; EP2 – 11 to 17 March) were observed, compared to the other periods (Pre-EP1 – 11 to 25 February; Pre-EP2 – 16 to 10 March) affected by rainfall. The mean concentrations of PM2.5 during EP1 and EP2 were 51.9 and 35.3 µg m−3, respectively, compared to 9.03 µg m−3 during Pre-EP1 (Table S1). The concentrations of other air pollutants, such as O3, SO2, NO2, PM10, OC, EC, BC, HCHO, and VOCs, showed a significant increasing trend during EP1 and EP2. During the monitoring periods, the concentrations of measured HCHO ranged from 0.68 and 3.59 ppbv (Table S1). According to our previous studies (Liu et al., 2023), the average levels of the measured HCHO in spring and autumn in Xiamen were 2.9 ± 0.3 and 3.2 ± 1.4 ppbv, respectively. In total, the HCHO level in Xiamen was lower than that in megacities (Table S2), such as Beijing (summer: 11.39 ± 5.58 ppbv), Hong Kong (summer: 8.07 ± 1.94 ppbv), and Guangzhou (summer: 6.69 ± 1.98 ppbv), while it was comparable to the coastal cities, including Shenzhen (spring: 3.4 ± 1.6 ppbv), Yantai (summer: 3.90 ± 1.12 ppbv), and Shanghai (summer: 3.31 ± 1.43 ppbv). In the coastal cities of southeastern China, halogenated VOCs are one of the most important VOC species, which originate from industrial emissions and solvent usage (Chen et al., 2022; Ji et al., 2022; Liu et al., 2022b). In this study, during the monitoring period, backward trajectories showed air mass transport from the northeast, which brought halogenated VOCs from the city of Quanzhou, an industrial city adjacent to Xiamen.
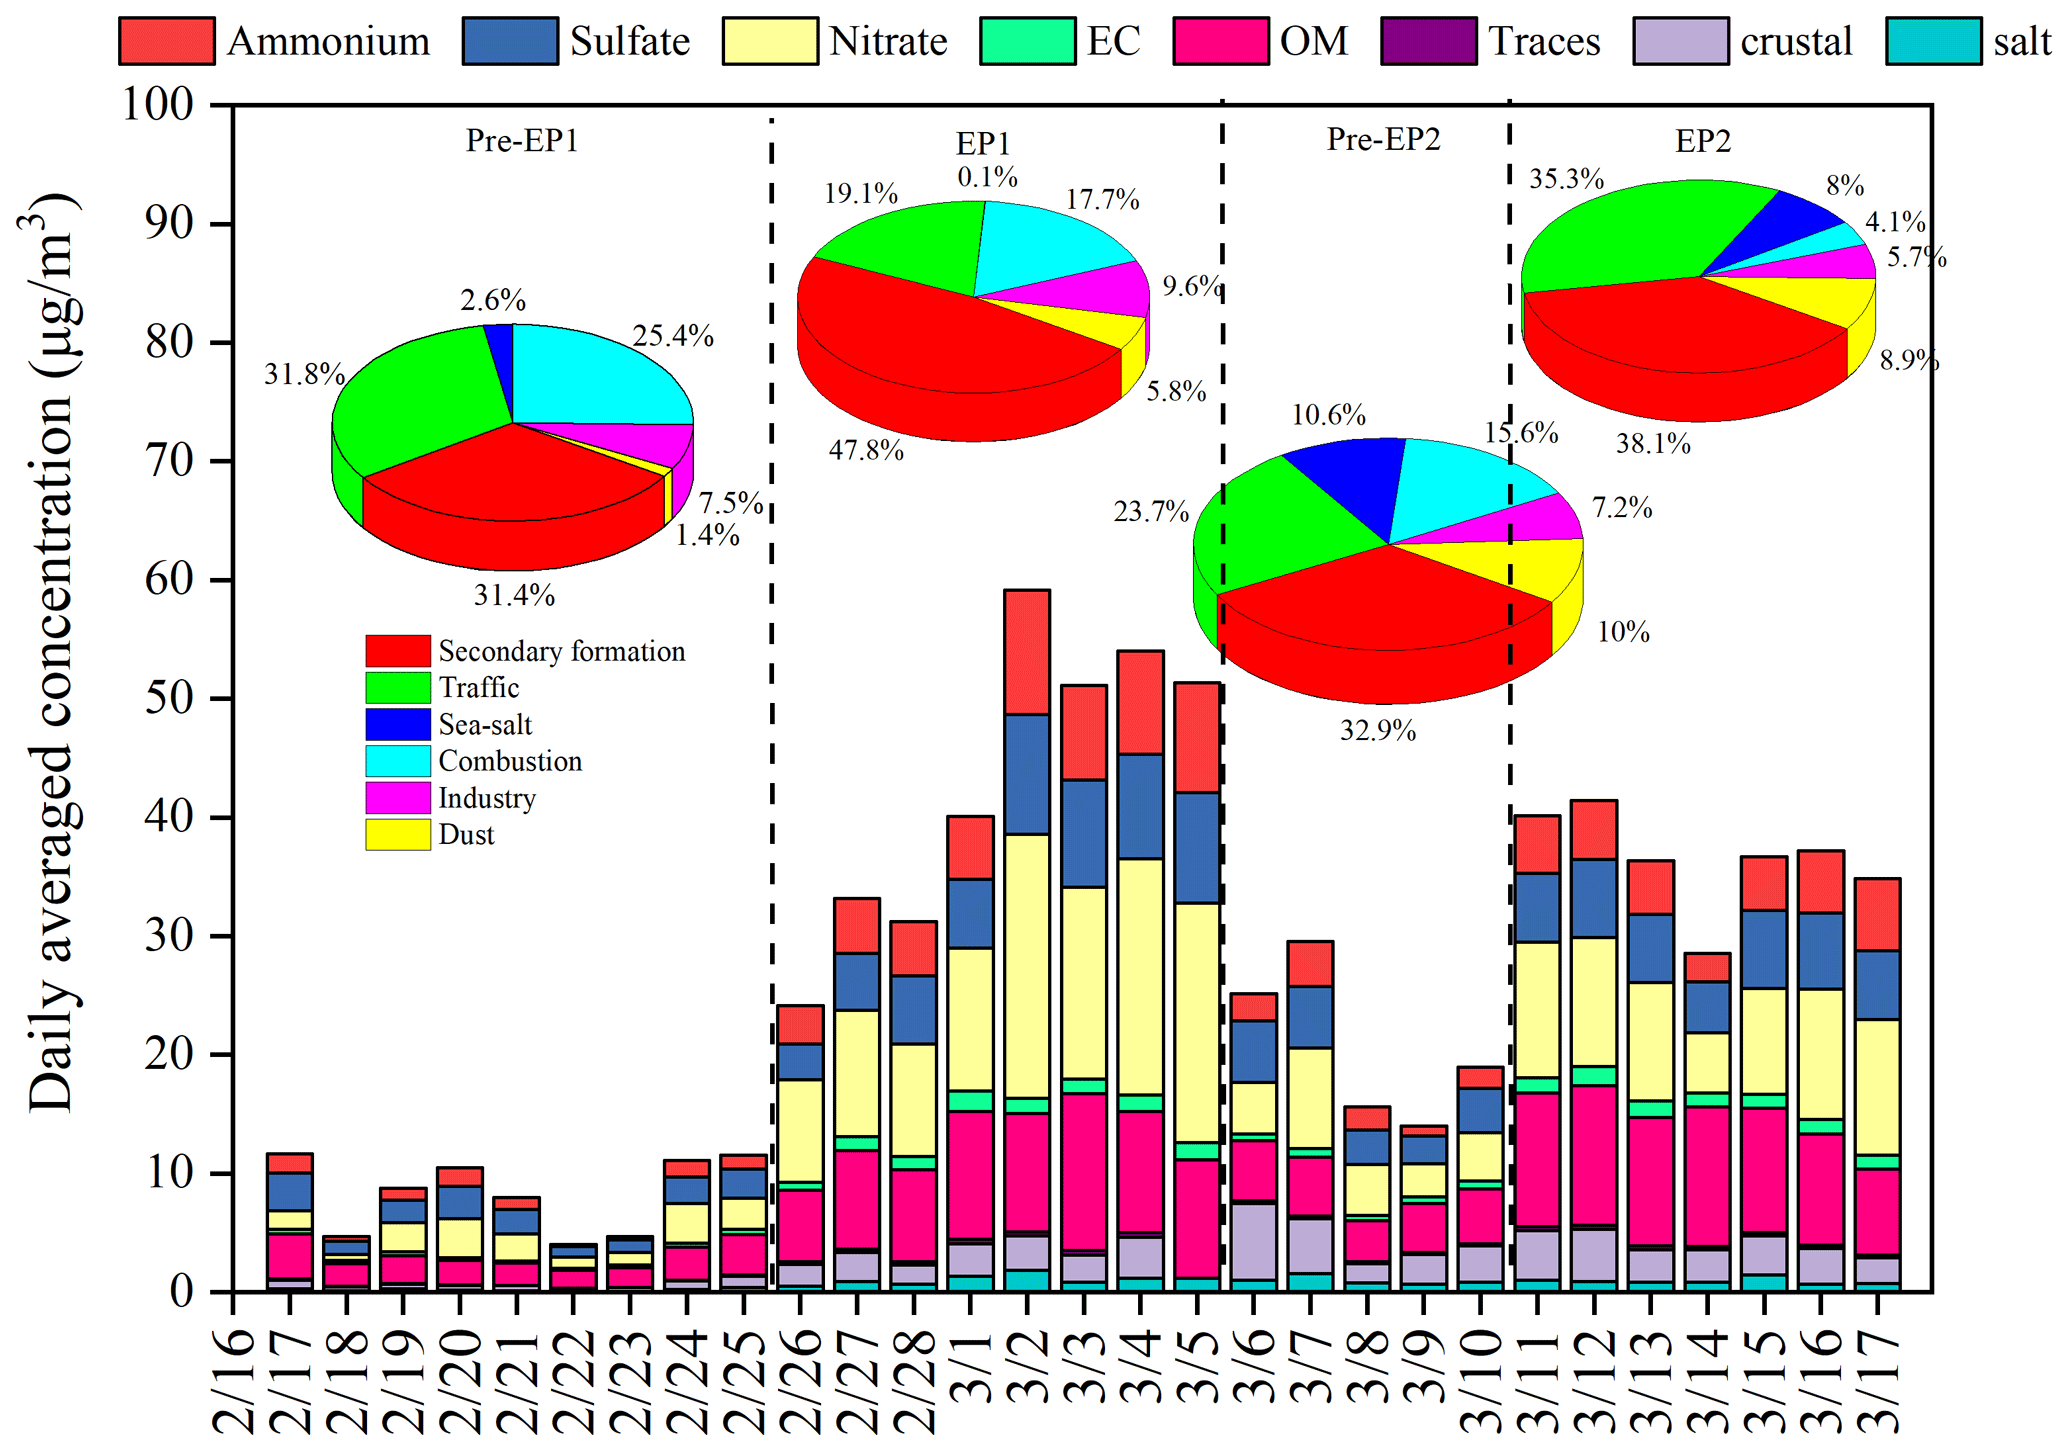
Figure 2Time series of PM2.5 chemical composition and sources apportionment by the PMF model. In the legends, OM refers to organic matter, calculated as 1.4 × OC; “Traces” includes elements other than Na, Cl, S, K, Al, Si, Ca, and Fe; “crustal” represents crustal materials, calculated as 1.89 × Al + 2.14 × Si + 1.4 × Ca + 1.43 × Fe; and “salt” includes Na+ and Cl−.
The maximum PM2.5 and O3 concentrations were approximately 100 and 200 µg m−3, respectively. The maximum daily 8 h average (MDA8) O3 concentrations were calculated according to the Ambient Air Quality Standard of China. Figure S3 shows the positive correlation between PM2.5 and MDA8 O3 concentrations during the whole period. In Xiamen, a coastal city in southeast China, the annual mean concentrations of criteria air pollutants from 2015 to 2021 were significantly lower than in other Chinese cities (Fig. S4) (Li et al., 2022; Shao et al., 2022). Meanwhile, inter-annual averaged concentrations of O3 and Ox in winter were shown in Fig. S4, suggesting an increase in atmospheric oxidation capacity (AOC) during the cold seasons. Therefore, these two typical PM2.5 and O3 pollution episodes (EP1 and EP2) are worth exploring in terms of the formation mechanisms and synergistic effects of PM2.5 and O3 in the coastal city.
3.2 Chemical compositions and sources of PM2.5
As shown in Fig. 2, an overall increasing trend is clearly observed in both bulk PM2.5 and its major components during EP1 and EP2. Nitrate and organic matter (OM) remain the top two dominant PM2.5 components, followed by sulfate and ammonium. The mean concentrations of , , and during EP1 and EP2 were 7.07 and 5.87 µg m−3, 14.95 and 9.69 µg m−3, and 6.77 and 4.46 µg m−3, respectively (Table S1). The increase in EC indicates the contributions of local anthropogenic emission sources, such as vehicle exhausts (Fig. 2). The concentrations and percentages of OC and EC during different periods are illustrated in Fig. S5 and Table S1. The average OC and EC concentrations during EP1 and EP2 were 6.36 and 7.48 µg m−3 and 1.23 and 1.29 µg m−3, respectively, which were notably higher than those during Pre-EP1 and Pre-EP2. These results are consistent with the increase in primary emissions and secondary formation contributing to complex air pollution during the rapid urbanization and industrialization stages in China (Xiao et al., 2022; Jiang et al., 2022).
The PMF model was applied to conduct high-time-resolution source apportionment of PM2.5 based on online hourly measurement data (Hong et al., 2021; Chow et al., 2022). The factor profiles and the contributions of various sources to PM2.5 are shown in Figs. 2 and S6. Previous studies have indicated that construction and road dust is characterized by high loadings of Al, Si, Ca2+, Na+, Mg2+, and Zn (Rienda and Alves, 2021). In this study, the factor of dust (Factor 1) was identified by the high contributions of Si (Fig. S6). The PMF analysis revealed that the contribution of dust to PM2.5 ranged from 5.8 % to 8.9 % during EP1 and EP2, compared to 1.4 % during Pre-EP1 (Fig. 2). Factor 2, contributing to the high loading of metal elements (Mn, Zn, Fe, Pb, and As), was characterized by industrial emissions (Belis et al., 2019). The contributions from the industry during EP1 and EP2 remained constant. In factor 3, K+ was dominant, and it was identified as coming from combustion sources (Watson et al., 2001). Biomass burning could change the contribution of combustion to PM2.5 at the monitoring site through long-range transport. During EP2, the influence of combustion sources (e.g., biomass burning) significantly decreased, due to reduced anthropogenic emissions and the arrival of clean air masses from the ocean (Figs. S7 and S8). Factor 4, with the highest proportion of Na+ and Mg2+ loadings, was associated with the influence of sea-salt aerosol (Polissar et al., 1998). The percentages of sea salt (8 %–10 %) during Pre-EP2 and EP2 were relatively high. Factor 5 exhibited high contributions of EC, OM, and Pb, which are general indicators of vehicle exhaust (Belis et al., 2019). During EP2, the contribution of traffic increased up to 35.3 %. Factor 6 was associated with secondary aerosol, characterized by high loadings of , , and . The increased contributions of secondary formation during EP1 and EP2 accounted for 47.8 % and 38.1 %, respectively.
3.3 Formation mechanism of PM2.5
As shown in Fig. S9, was correlated with (R2= 0.72–0.88), and the line fit of and showed a slope of 1.78–2.67, suggesting the dominant form of (NH4)2SO4. Similarly, was also correlated with (R2= 0.77–0.93), indicating the presence of NH4NO3. In addition, the ratio of to the sum of and was close to 1, indicating complete neutralization of sulfate and nitrate by ammonium (Fig. 8c). However, there was no significant difference in the existing form of SNA (sulfate, nitrate and ammonium) in PM2.5 during EP1 and EP2.
The variations of sulfur oxidation rate (SOR) and nitrogen oxidation rate (NOR) under different periods are shown in Table S1. It should be noted that SOR (0.38 ± 0.18) and NOR (0.32 ± 0.08) during EP1 were the highest, indicating a high oxidation rate of SO2 and NO2. According to RH, T, and UV (Table S1), noticeable differences in meteorological conditions were observed under different periods. In this study, LWC was positively correlated with , , and (known as the secondary inorganic aerosol, SIA) (Fig. S10), suggesting the influence of the aqueous-phase process, including reactions with O3, OH, H2O2, and organic peroxides (Gen et al., 2019; Wang et al., 2023).
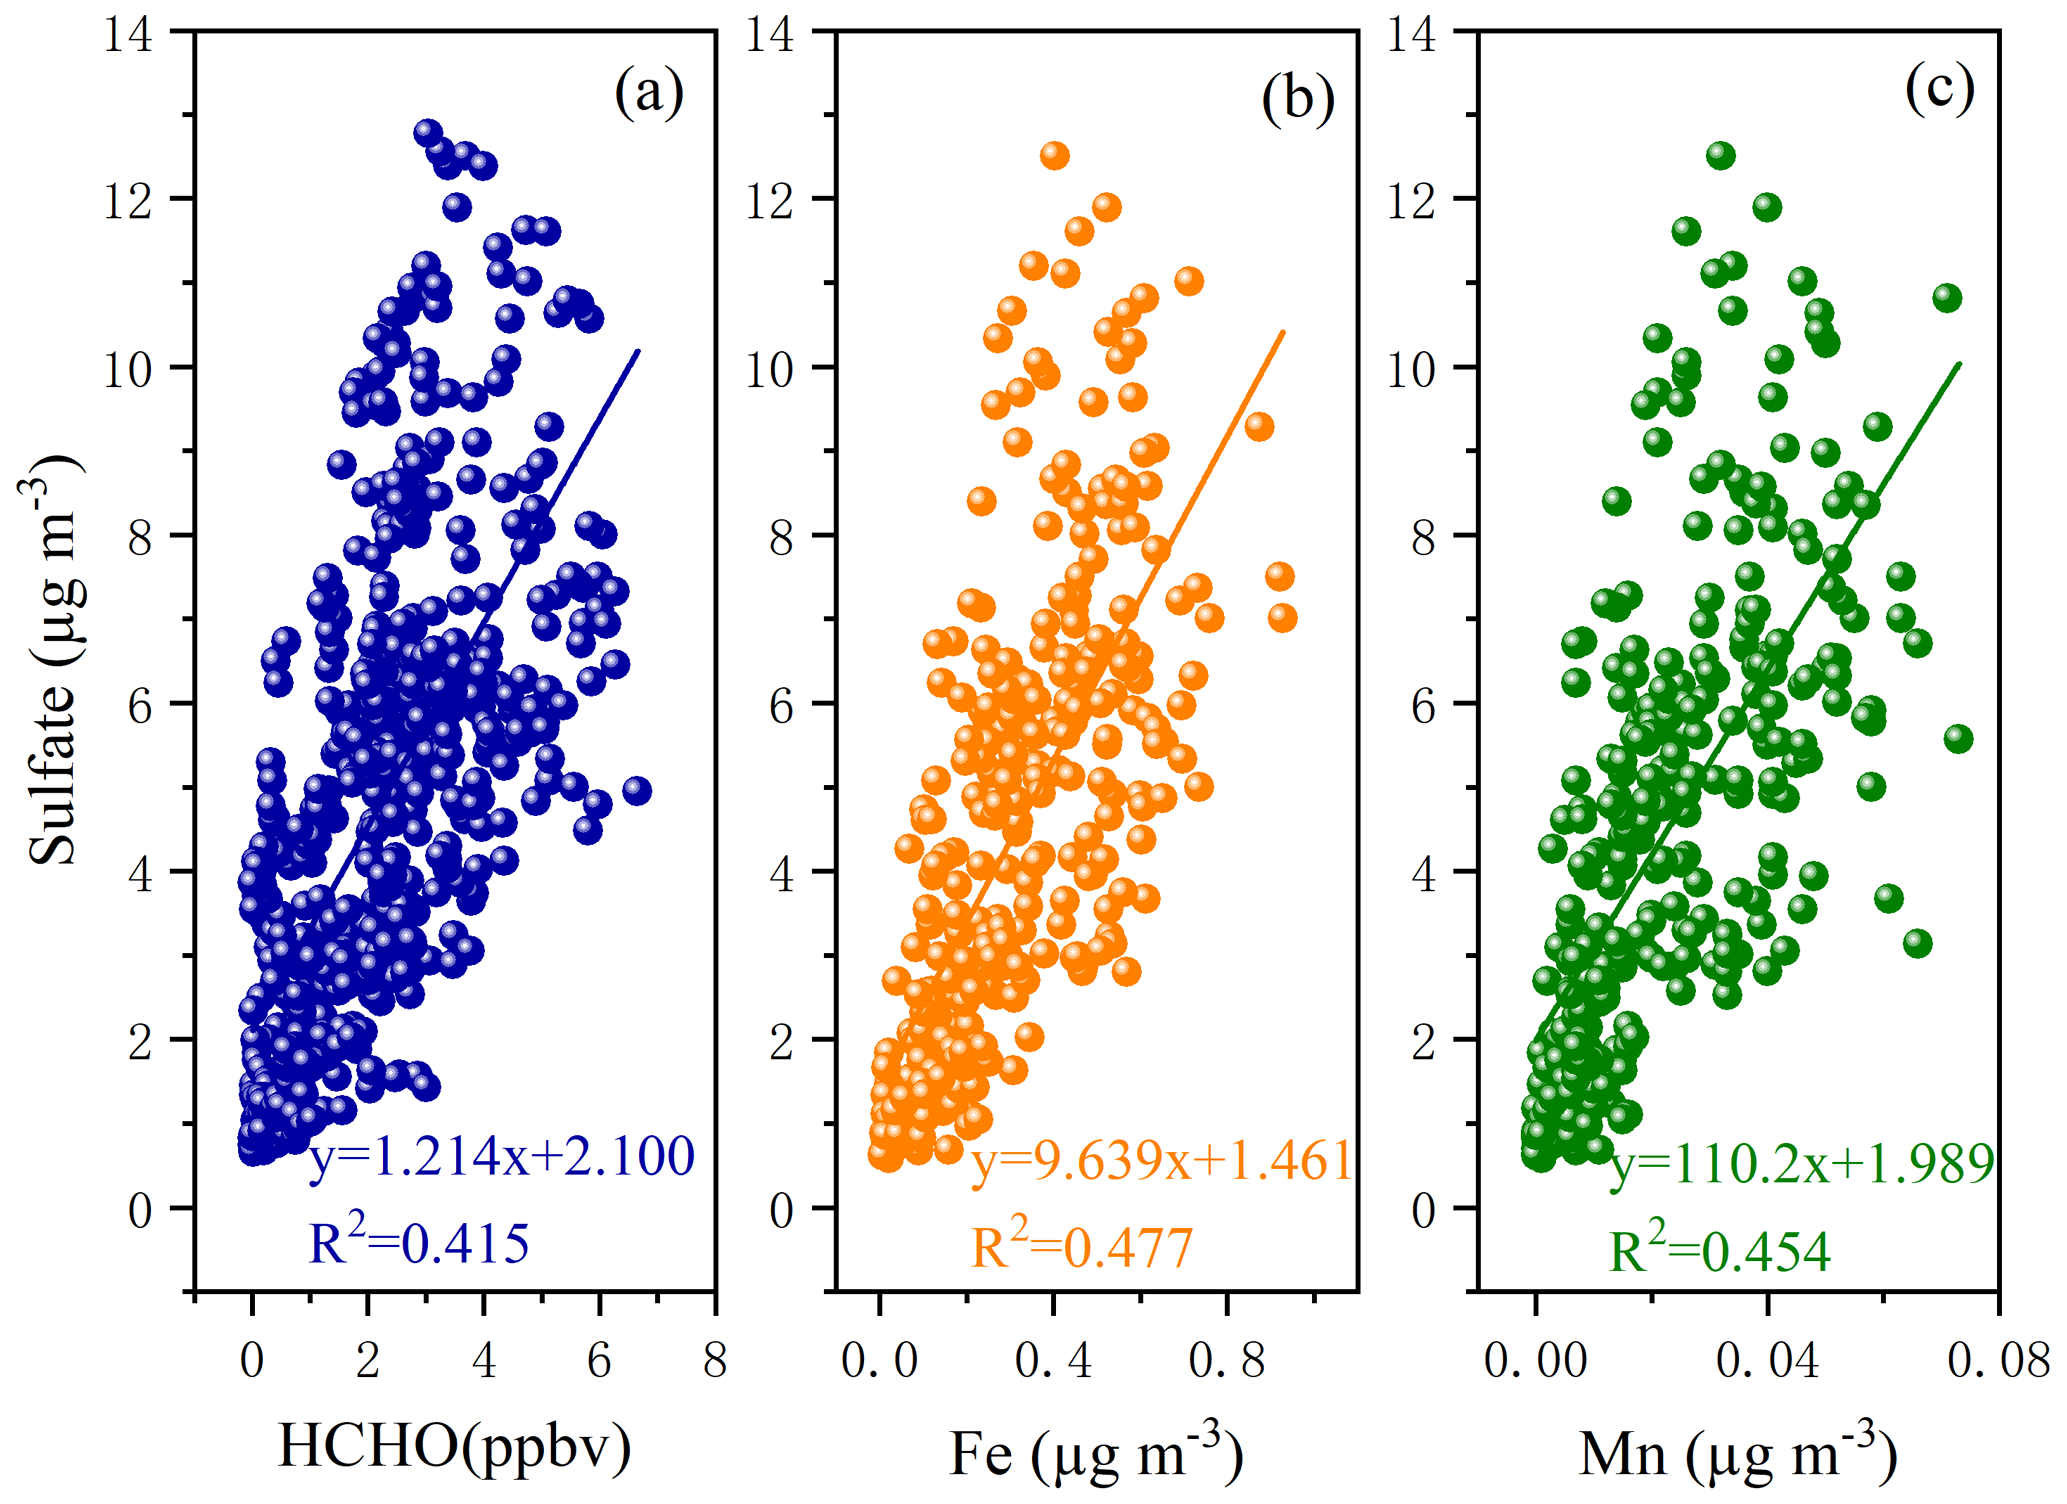
Figure 3Correlations between the concentrations of sulfate and HCHO (a), Fe (b), and Mn (c).
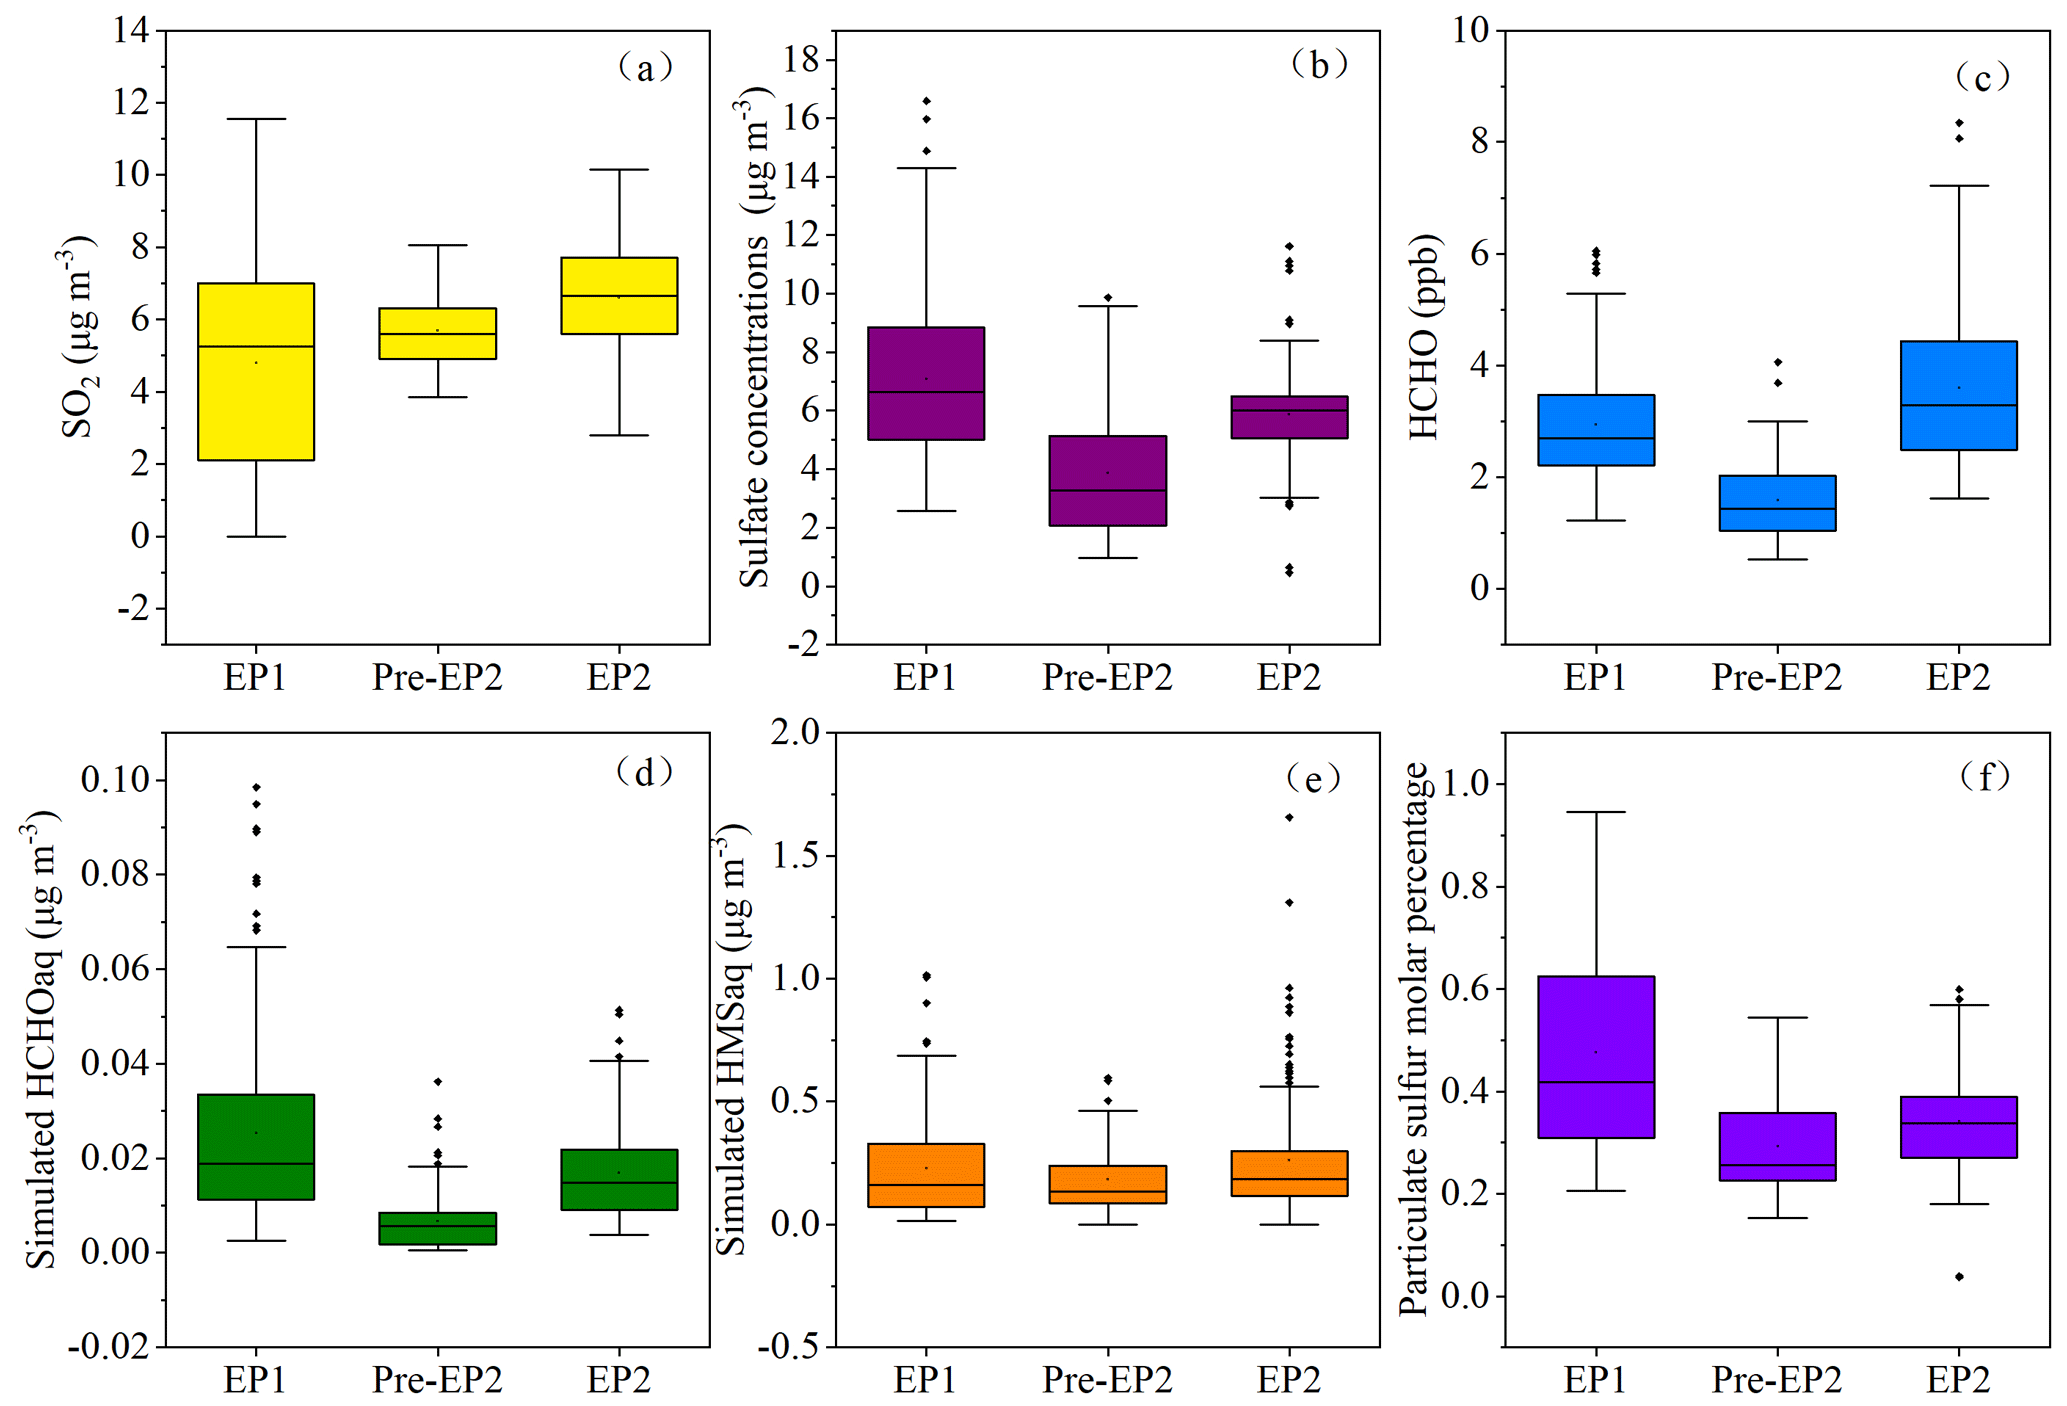
Figure 4Concentrations of SO2, , and HCHO observed at different pollution stages. The simulated HCHO (aq) and HMS (aq) were also presented. The particulate sulfur molar percentage was calculated as . In the box–whisker plots, the whiskers, boxes, and points indicate the 5th–95th, 25th–75th, and 50th percentiles and mean values.
Current studies have found that O3, H2O2, OH, and transition metal ion (TMI)-catalyzed oxidation can trigger the secondary formation of (Hong et al., 2021; Gen et al., 2019). However, the relative importance of these oxidants in enhancing the formation of is still a topic of debate. As shown in Fig. 3b and c, a good correlation was found between SO and Fe and Mn. The TMI-catalyzed oxidation contributed to the formation of , which occurred in both cloud processes and during haze episodes (Li et al., 2020) because the Mn catalytic reaction rapidly occurred at the aerosol surface and could oxidize S(IV) through the production of intermediate Mn(III) (Wang et al., 2021). Even at very low concentrations of Mn, the Mn catalytic reaction, consuming oxygen and SO2, could produce sulfate. Under low aerosol pH conditions, the catalytic reaction of TMIs plays an important role in the oxidation of S(IV). In this study, a low aerosol pH ranging from 2 to 4 was observed, indicating the potential influence of TMI-catalyzed oxidation. In the future, it is vital to further evaluate the interaction of sulfate formation and and to elucidate the main pathway of the S(IV) oxidation in the coastal areas. In addition, as an important intermediate product in atmospheric photochemical reactions, the formation and removal of HCHO are closely related to OH and HO2 radicals, which directly affect atmospheric reactivity and oxidation ability (Wu et al., 2023; Zhang et al., 2021). In this study, the correlations (R2= 0.415) between HCHO and sulfate concentrations were also examined, as displayed in Fig. 3a. Recent studies have shown that HCHO can react with hydrogen peroxide (H2O2) to produce hydroxymethyl hydroperoxide, which rapidly oxidizes dissolved sulfur dioxide (SO2, aq) to sulfate (Dovrou et al., 2022).
3.4 Effects of HCHO on HMS in PM2.5
To calculate the particulate concentrations of HCHO and its contributions to the heterogeneous formation of HMS, we conducted the in situ multiphase chemical simulations by combining the zero dimensional multiphase chemical box model with RACM2 and CAPRAM 3.0. During EP1 and EP2, the concentrations of HCHO (aq) and HMS (aq), as well as the particulate sulfur molar percentage, increased with the rise of SO2, , and HCHO concentrations (Fig. 4). Also, particulate sulfur molar percentage was higher during the pollution periods, which may be due to the high concentrations of gaseous precursors (SO2, HCHO) and favorable aerosol properties (i.e., pH and aerosol water content) promoting the heterogeneous processes. Previous studies have modeled that 1 ppb of gas-phase HCHO could yield up to ∼ 5 µg m−3 HMS and identified that HCHO emissions were one of the key factors controlling HMS formation during winter haze (Moch et al., 2018). All of the above signifies the important contributions of HCHO to the heterogeneous formation of HMS and particulate sulfur chemistry, especially during pollution periods.
However, the molar ratios of HMS to sulfate were very low, suggesting the limited contributions of HMS concentrations to inorganic sulfate concentrations. The potential role of HCHO in HMS formation in a coastal city of southeast China differed from that in megacities of China. Previous studies found that HCHO reacts with dissolved SO2 (aq) to produce hydroxymethanesulfonate (HMS), which, upon oxidation with the hydroxyl radical (OH), forms sulfate (Ma et al., 2020; Moch et al., 2020). Ma et al. (2020) reported that heterogeneous formation of HMS accounted for 15 % of OM and resulted in 36 % overestimates of sulfate during winter haze in Beijing.
High concentrations of HMS were captured under high RH and moderately acidic pH conditions (Fig. 5). Previous studies have also indicated that high RH promotes rapid HMS formation during winter haze, as the aerosol water content could provide numerous reaction interfaces for HMS formation (Ma et al., 2020). Meanwhile, atmospheric sulfur tended to distribute into the particle phase with increasing RH. Figure 5 shows that HMS formation is favored under pH conditions close to 4.0. Previous studies reported that high HMS concentrations were found under moderate-pH conditions, as low pH inhibits HMS formation, and high pH is unsuitable for its preservation (Ma et al., 2020; Campbell et al., 2022). Therefore, the combination of high precursor concentrations (SO2 and HCHO), high RH, and moderately acidic pH enhanced the heterogeneous formation of HMS in the coastal city.
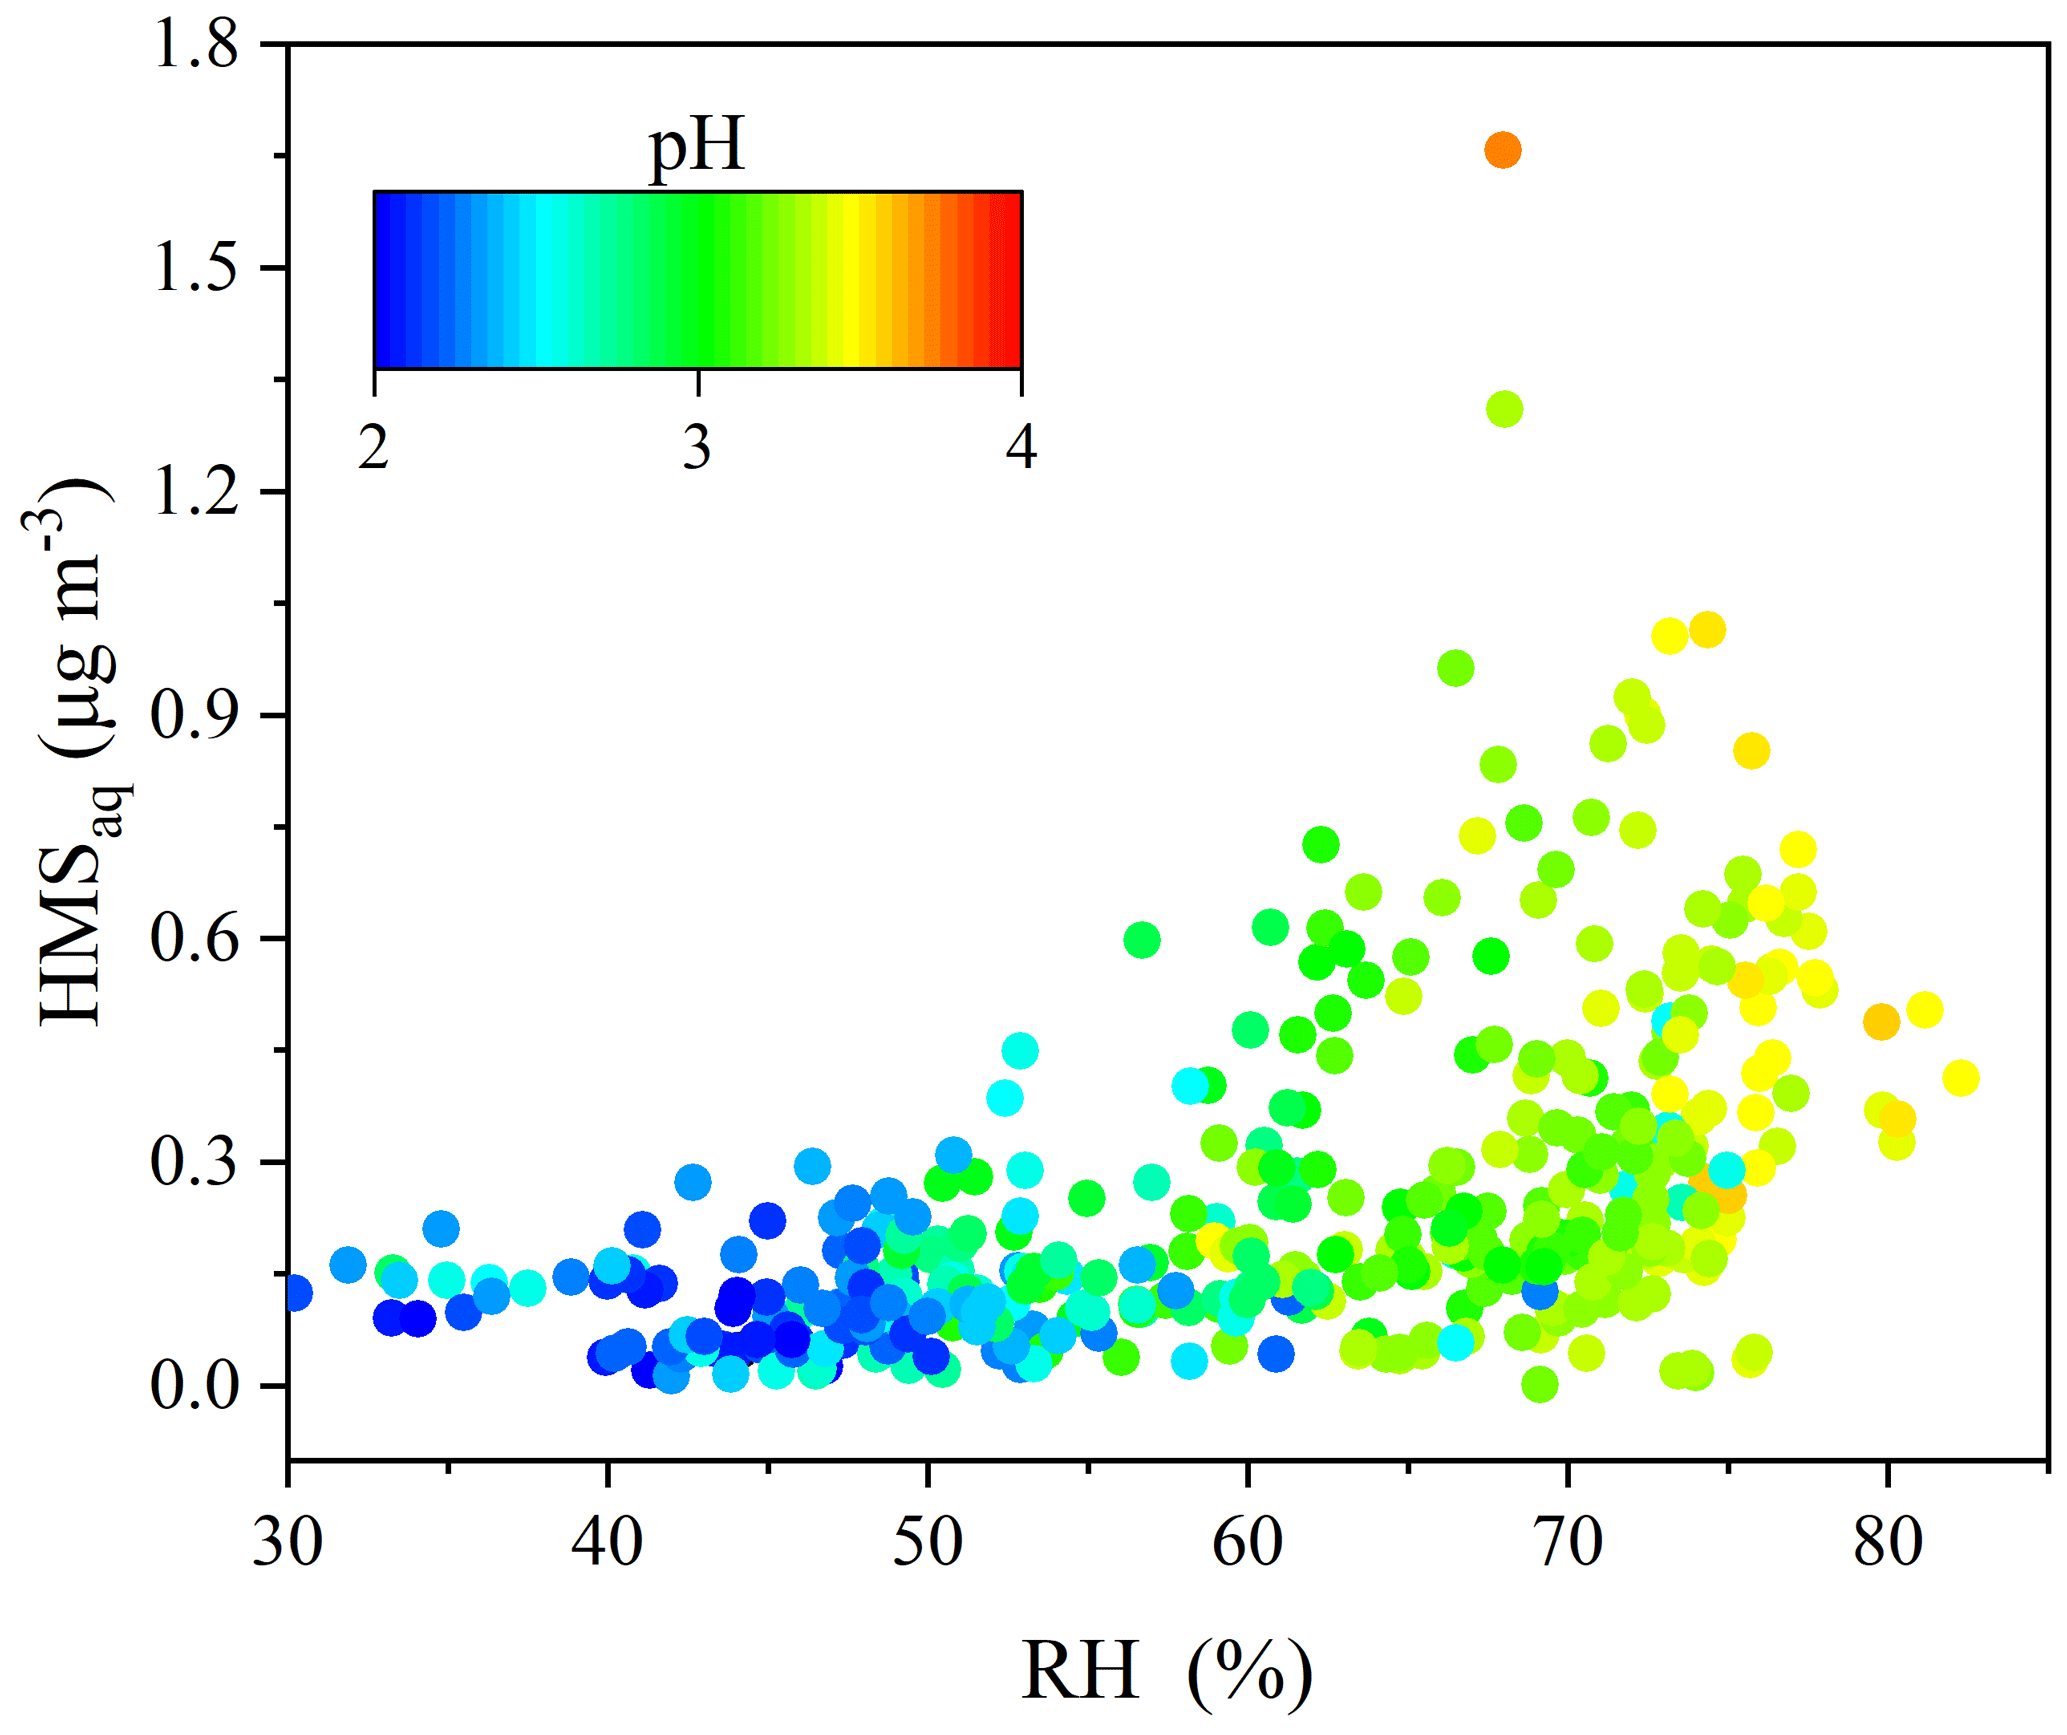
Figure 5Evolution of HMS (aq) distribution with increasing RH, colored according to aerosol pH.
3.5 Effects of HCHO on O3 formation
To investigate the effects of HCHO on O3 formation during the co-occurring O3 and PM2.5 pollution period, the OBM was used to quantify the detailed O3 production and loss pathways in both scenarios: input HCHO (IH) and non-input HCHO (NIH) (Figs. 6 and S10). The daytime production rates of HO2 + NO and RO2 + NO in the IH scenario were calculated to be 6.84 and 1.25 ppbv h−1 for EP1 and 9.91 and 2.17 ppbv h−1 for EP2, respectively. Meanwhile, the predominant O3 loss reaction in this scenario was OH + NO2, with rates of 2.26 ppbv h−1 for EP1 and 3.17 ppbv h−1 for EP2, followed by O3 photolysis with rates of 0.77 and 1.10 ppbv h−1. In contrast, the daytime production rates of HO2 + NO and RO2 + NO in the NIH scenario were 4.03 and 0.85 ppbv h−1 for EP1 and 4.86 and 1.29 ppbv h−1 for EP2, respectively. These results indicate that disabling the HCHO mechanism reduced the production rates of HO2 + NO by 41 % for EP1 and 51 % for EP2. In addition, the average maximum net O3 production rate with the IH scenario was 5.02 ppb h−1 for EP1 and 7.93 ppb h−1 for EP2, approximately 2 times higher than the values of 2.48 and 3.14 ppb h−1 with the NIH scenario. The results showed that the daytime net O3 production rates decreased by 50 %–60 % when the HCHO mechanism was disabled, probably due to the decrease in ROx concentrations and radical propagation rates (Wu et al., 2023; Zhang et al., 2021).
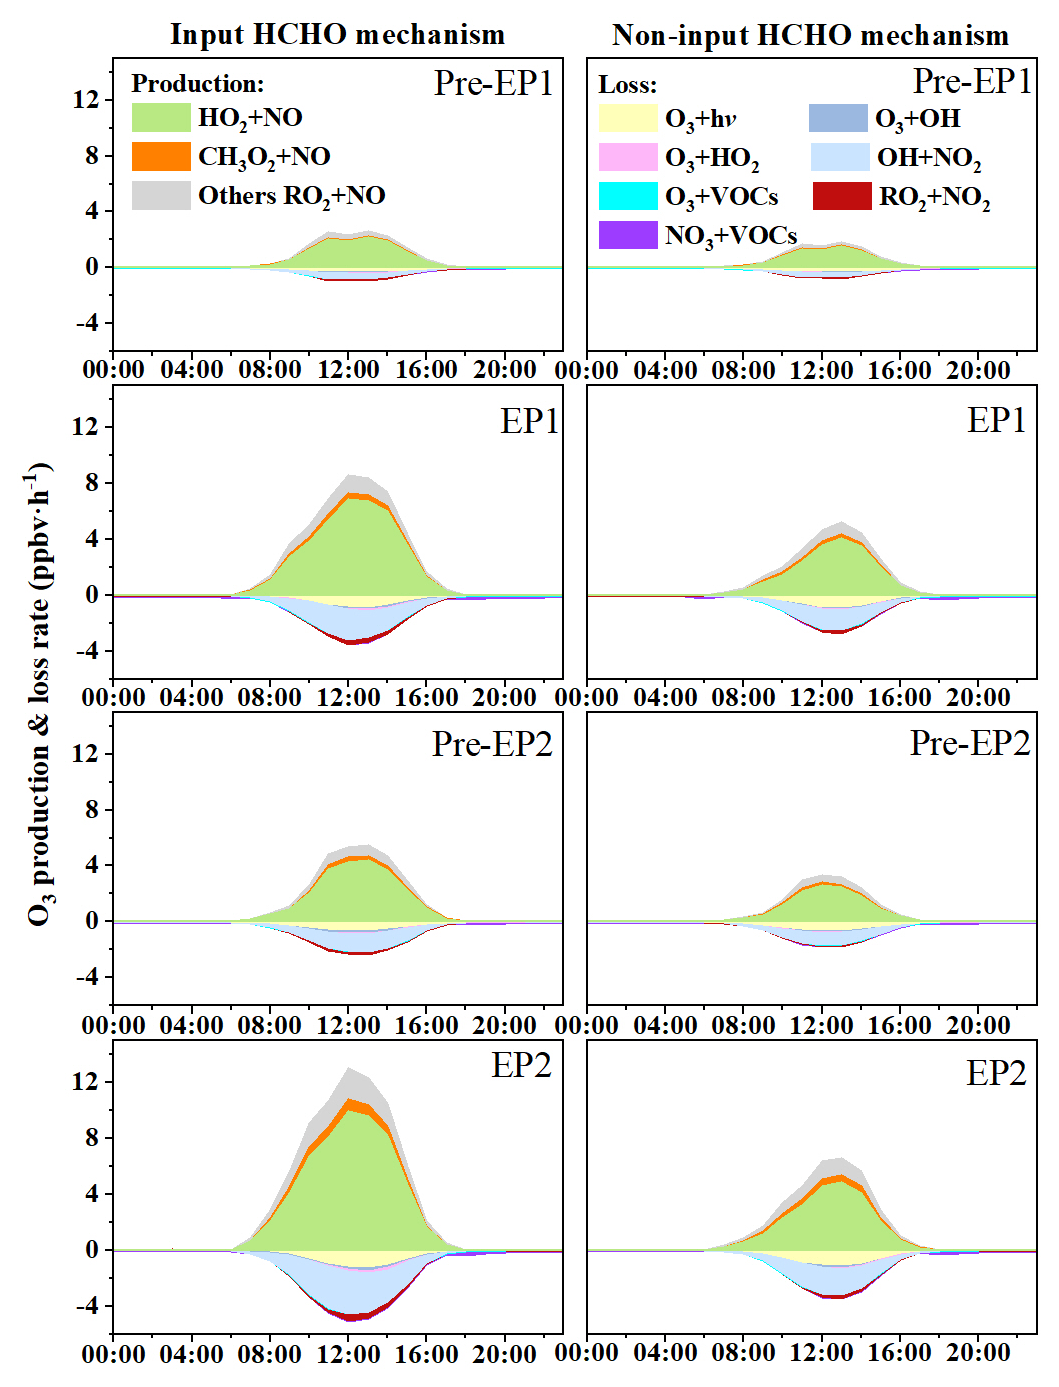
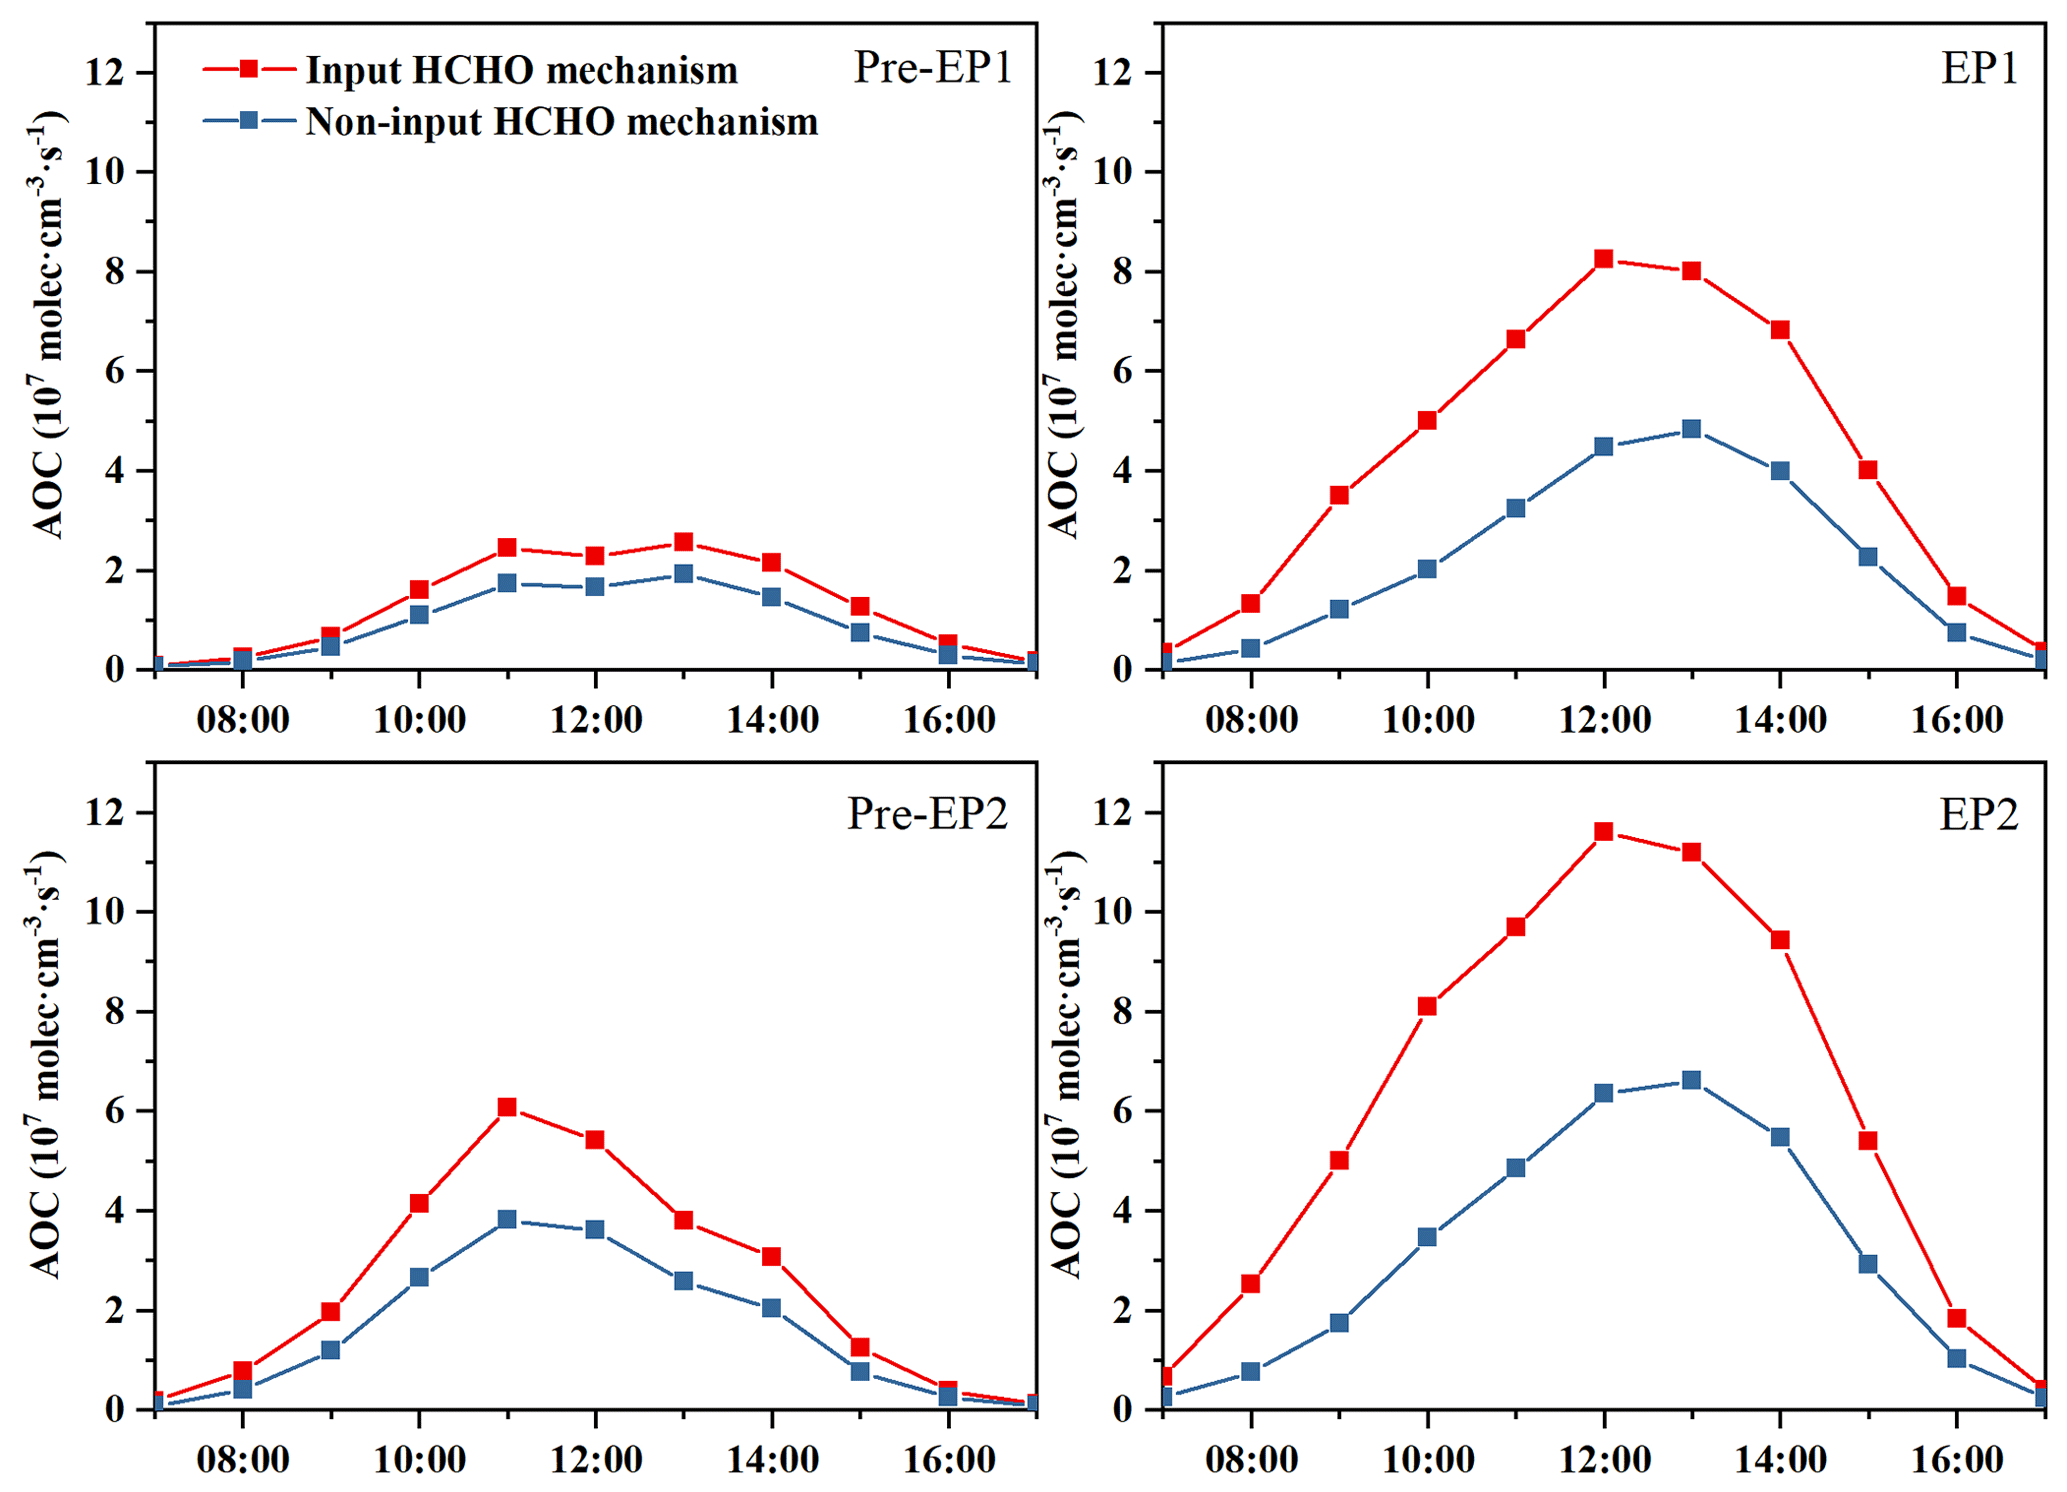
Figure 7Atmospheric oxidation capacity (AOC) calculated by the OBM with and without the HCHO mechanism.
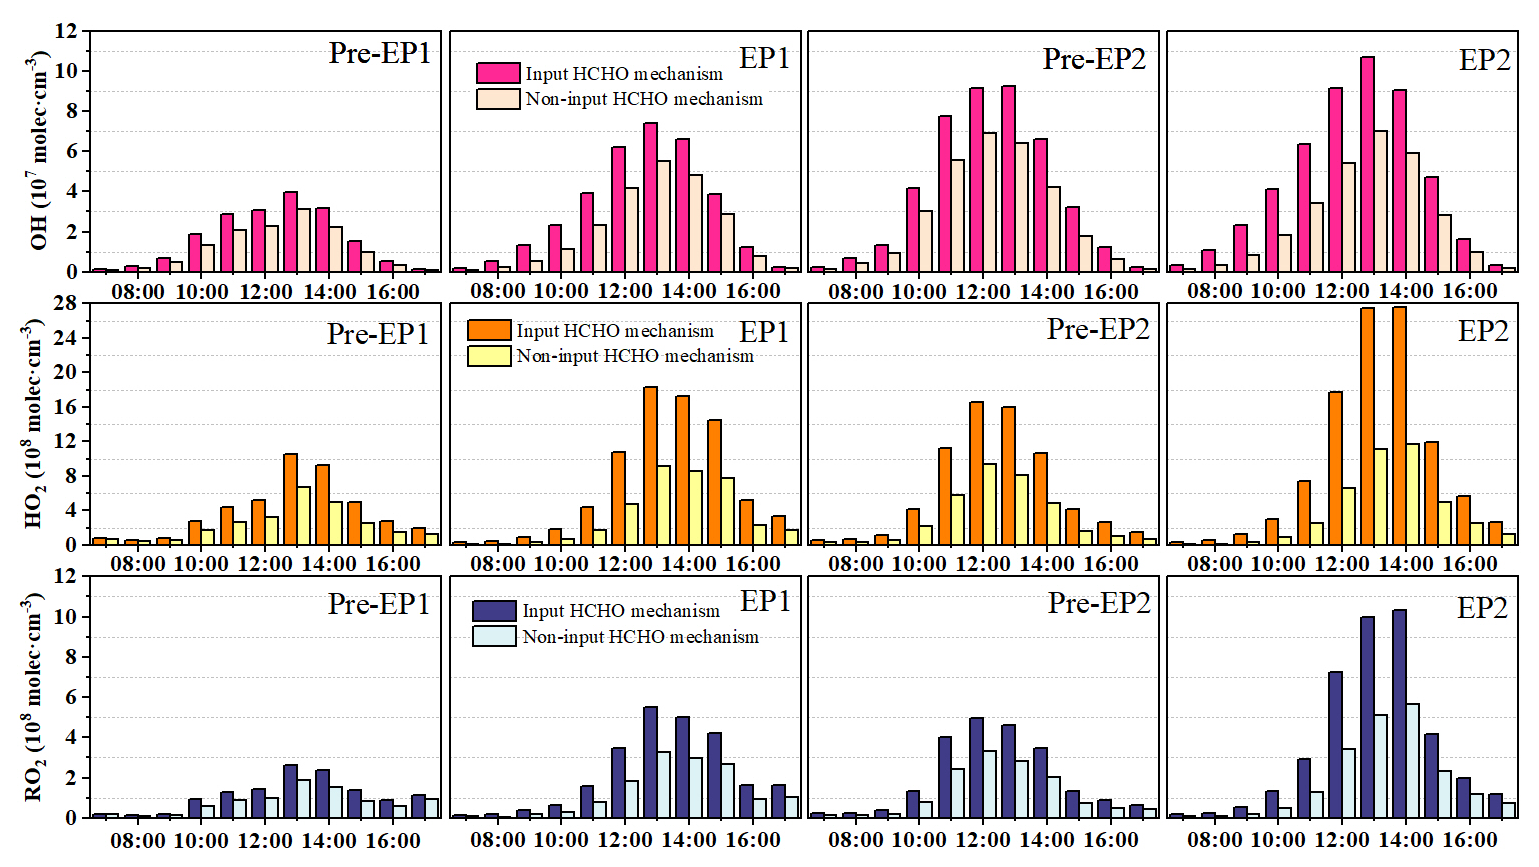
Figure 8OH, HO2, and RO2 concentrations modeled by the OBM with and without the HCHO mechanism.
The atmospheric oxidation capacity (AOC) is a critical factor in determining the production rate of secondary pollutants and atmospheric photochemical pollution (Jia et al., 2023; Qin et al., 2022). In this study, AOC is calculated as the sum of the oxidation rates of various primary pollutants (e.g., CO, NOx, and VOCs) by major oxidants (i.e., OH, O3, and NO3). The model-simulated AOC, OH, HO2, and RO2 under different periods are shown in Figs. 7 and 8. The daily maximum AOC during EP1 and EP2 was 8.24 × 10⁷ and 11.6 × 10⁷ molec. cm−3 s−1, respectively, which is higher than values (2.56 × 10⁷ and 5.39 × 10⁷ molec. cm−3 s−1) in other periods. However, when the HCHO mechanism was disabled, the daily maximum AOC during different stages decreased significantly. In particular, HCHO played a very important role in AOC during the co-occurring PM2.5 and O3 pollution periods. All these results are comparable to rural sites in Hong Kong (6.2 × 10⁷) and Berlin (1.4 × 10⁷ molec. cm−3 s−1) but lower than those observed in highly polluted cities, such as Santiago (3.2 × 10⁸ molec. cm−3 s−1) and Shanghai (1.0 × 10⁸ molec. cm−3 s−1) (Li et al., 2018; Xue et al., 2016; Liu et al., 2022a). These studies have reported that the variations in AOC are related to precursor concentrations/types and photochemical conditions.
In addition, the maximum daily concentrations of OH, HO2, and RO2 exhibited a similar pattern to that of AOC in both the IH and NIH scenarios (Fig. 8). Therefore, the O3 production rate during EP1 and EP2 was consistent with the maximum daily values of AOC, OH, HO2, and RO2. The differences in ROx levels between the IH and NIH model scenarios were also calculated (Fig. S11). In this study, disabling the HCHO mechanism led to decreased ROx concentrations, affecting the O3 formation. These results highlight the significance of HCHO in the photochemical reactions occurring in the coastal city during the co-occurring O3 and PM2.5 pollution events.
A wintertime co-occurring O3 and PM2.5 pollution event was selected to investigate the synergistic effects between PM2.5 and O3 in a coastal city in southeast China. The results demonstrated a positive correlation between PM2.5 and MDA8 O3 concentrations during the whole period, indicating the enhancement of atmospheric oxidation capacity (AOC) during cold seasons. The result of positive matrix factorization (PMF) analysis suggested that the contribution of secondary formation to PM2.5 increased during the pollution events, implying that the elevated AOC promoted the oxidation of SO2, NOx, and VOCs, leading to the formation of secondary inorganic and organic components. We also found significant correlations (R2= 0.415–0.477) between HCHO, Fe, Mn, and sulfate concentrations, suggesting the influence of catalyzed oxidation in the coastal city. Through OBM analysis, we demonstrated that high concentrations of precursors (SO2 and HCHO), high RH, and moderately acidic pH conditions enhanced the heterogeneous formation of hydroxymethanesulfonate (HMS). Meanwhile, we verified that the input HCHO mechanism increased the concentrations of ROx and net O3 production rates. Moreover, the production rates of HO2 + NO and RO2 + NO were enhanced, indicating that HCHO affected O3 formation by controlling the efficiencies of radical propagation. This study highlighted the influence of the HCHO mechanism on photochemical reactions and the formation of HMS in PM2.5 in coastal cities and was beneficial for improving air quality and protecting public health.
The dataset related to this work can be accessed via https://doi.org/10.5281/zenodo.7799302 (Hong, 2023). Details are also available upon request from the corresponding author (ywhong@iue.ac.cn).
The supplement related to this article is available online at: https://doi.org/10.5194/acp-23-10795-2023-supplement.
YH designed and wrote the manuscript. YL and DL collected the data. GC and MZ contributed to the modeling analyses. KZ, XJ, KX, and YW performed data analysis. SDC, LX, RY, and GH contributed to revision of the manuscript. JC supported the funding of observations and research.
The contact author has declared that none of the authors has any competing interests.
Publisher’s note: Copernicus Publications remains neutral with regard to jurisdictional claims in published maps and institutional affiliations.
The authors gratefully acknowledge Yanting Chen and Zhiqian Shao (Institute of Urban Environment, Chinese Academy of Sciences) for their guidance and assistance during the observation and Lingling Xu, Mengren Li, and Xiaolong Fan for the discussion of this paper. This research was supported by the Xiamen Atmospheric Environment Observation and Research Station of Fujian Province.
This research was financially supported by the National Natural Science Foundation of China (grant nos. 42277091 and U22A20578), the foreign cooperation project of Fujian Province (grant no. 2020I0038), the Xiamen Youth Innovation Fund Project (grant no. 3502Z20206094), the FJIRSM&IUE Joint Research Fund (grant no. RHZX-2019-006), and the Center for Excellence in Regional Atmospheric Environment project (grant no. E0L1B20201).
This paper was edited by Dantong Liu and reviewed by three anonymous referees.
Belis, C. A., Pikridas, M., Lucarelli, F., Petralia, E., Cavalli, F., Calzolai, G., Berico, M., and Sciare, J.: Source apportionment of fine PM by combining high time resolution organic and inorganic chemical composition datasets, Atmos. Environ., 3, 100046, https://doi.org/10.1016/j.aeaoa.2019.100046, 2019.
Campbell, J. R., Battaglia, M., Dingilian, K., Cesler-Maloney, M., St Clair, J. M., Hanisco, T. F., Robinson, E., DeCarlo, P., Simpson, W., Nenes, A., Weber, R. J., and Mao, J.: Source and Chemistry of Hydroxymethanesulfonate (HMS) in Fairbanks, Alaska, Environ. Sci. Technol., 56, 7657–7667, https://doi.org/10.1021/acs.est.2c00410, 2022.
Chen, G., Liu, T., Ji, X., Xu, K., Hong, Y., Xu, L., Li, M., Fan, X., Chen, Y., Yang, C., Lin, Z., Huang, W., and Chen, J.: Source Apportionment of VOCs and O3 Production Sensitivity at Coastal and Inland Sites of Southeast China, Aerosol Air Qual. Res., 22, 220289, https://doi.org/10.4209/aaqr.220289, 2022.
Chow, W. S., Liao, K., Huang, X. H. H., Leung, K. F., Lau, A. K. H., and Yu, J. Z.: Measurement report: The 10-year trend of PM2.5 major components and source tracers from 2008 to 2017 in an urban site of Hong Kong, China, Atmos. Chem. Phys., 22, 11557–11577, https://doi.org/10.5194/acp-22-11557-2022, 2022.
Dixon, R. W. and Aasen, H.: Measurement of hydroxymethanesulfonate in atmospheric aerosols, Atmos. Environ., 33, 2023–2029, https://doi.org/10.1016/s1352-2310(98)00416-6, 1999.
Dovrou, E., Bates, K. H., Moch, J. M., Mickley, L. J., Jacob, D. J., and Keutsch, F. N.: Catalytic role of formaldehyde in particulate matter formation, P. Natl. Acad. Sci. USA, 119, e2113265119, https://doi.org/10.1073/pnas.2113265119, 2022.
Feng, T., Zhao, S., Zhang, X., Wang, Q., Liu, L., Li, G., and Tie, X.: Increasing wintertime ozone levels and secondary aerosol formation in the Guanzhong basin, central China, Sci. Total Environ., 745, 140961, 10.1016/j.scitotenv.2020.140961, 2020.
Gen, M., Zhang, R., Huang, D. D., Li, Y., and Chan, C. K.: Heterogeneous SO2 Oxidation in Sulfate Formation by Photolysis of Particulate Nitrate, Environ. Sci. Technol., 6, 86–91, https://doi.org/10.1021/acs.estlett.8b00681, 2019.
Hong, Y., Xu, X., Liao, D., Zheng, R., Ji, X., Chen, Y., Xu, L., Li, M., Wang, H., Xiao, H., Choi, S.-D., and Chen, J.: Source apportionment of PM2.5 and sulfate formation during the COVID-19 lockdown in a coastal city of southeast China, Environ. Pollut., 286, 117577, https://doi.org/10.1016/j.envpol.2021.117577, 2021.
Hong, Y., Xu, X., Liao, D., Liu, T., Ji, X., Xu, K., Liao, C., Wang, T., Lin, C., and Chen, J.: Measurement report: Effects of anthropogenic emissions and environmental factors on the formation of biogenic secondary organic aerosol (BSOA) in a coastal city of southeastern China, Atmos. Chem. Phys., 22, 7827–7841, https://doi.org/10.5194/acp-22-7827-2022, 2022.
Hong, Y.: Dataset for ACP by Hong et al., 2023, Zenodo [data set], https://doi.org/10.5281/zenodo.7799302, 2023.
Hu, B., Duan, J., Hong, Y., Xu, L., Li, M., Bian, Y., Qin, M., Fang, W., Xie, P., and Chen, J.: Exploration of the atmospheric chemistry of nitrous acid in a coastal city of southeastern China: results from measurements across four seasons, Atmos. Chem. Phys., 22, 371–393, https://doi.org/10.5194/acp-22-371-2022, 2022.
Ivatt, P. D., Evans, M. J., and Lewis, A. C.: Suppression of surface ozone by an aerosol-inhibited photochemical ozone regime, Nat. Geosci., 15, 536–540, https://doi.org/10.1038/s41561-022-00972-9, 2022.
Ji, X., Xu, K., Liao, D., Chen, G., Liu, T., Hong, Y., Dong, S., Choi, S.-D., and Chen, J.: Spatial-temporal Characteristics and Source Apportionment of Ambient VOCs in Southeast Mountain Area of China, Aerosol Air Qual. Res., 22, 220016, https://doi.org/10.4209/aaqr.220016, 2022.
Jia, C., Tong, S., Zhang, X., Li, F., Zhang, W., Li, W., Wang, Z., Zhang, G., Tang, G., Liu, Z., and Ge, M.: Atmospheric oxidizing capacity in autumn Beijing: Analysis of the O3 and PM2.5 episodes based on observation-based model, J. Environ. Sci., 124, 557–569, https://doi.org/10.1016/j.jes.2021.11.020, 2023.
Jiang, Y., Wang, S., Xing, J., Zhao, B., Li, S., Chang, X., Zhang, S., and Dong, Z.: Ambient fine particulate matter and ozone pollution in China: Synergy in anthropogenic emissions and atmospheric processes, Environ. Res. Lett., 17, 123001, https://doi.org/10.1088/1748-9326/aca16a, 2022.
Kalashnikov, D. A., Schnell, J. L., Abatzoglou, J. T., Swain, D. L., and Singh, D.: Increasing co-occurrence of fine particulate matter and ground-level ozone extremes in the western United States, Sci. Adv., 8, 1–12, https://doi.org/10.1126/sciadv.abi9386, 2022.
Li, J., Zhang, Y.-L., Cao, F., Zhang, W., Fan, M., Lee, X., and Michalski, G.: Stable Sulfur Isotopes Revealed a Major Role of Transition-Metal Ion-Catalyzed SO2 Oxidation in Haze Episodes, Environ. Sci. Technol., 54, 2626–2634, https://doi.org/10.1021/acs.est.9b07150, 2020.
Li, K., Jacob, D. J., Liao, H., Shen, L., Zhang, Q., and Bates, K. H.: Anthropogenic drivers of 2013–2017 trends in summer surface ozone in China, P. Natl. Acad. Sci. USA, 116, 422–427, https://doi.org/10.1073/pnas.1812168116, 2019a.
Li, K., Jacob, D. J., Liao, H., Zhu, J., Shah, V., Shen, L., Bates, K. H., Zhang, Q., and Zhai, S.: A two-pollutant strategy for improving ozone and particulate air quality in China, Nat. Geosci., 12, 906–910, https://doi.org/10.1038/s41561-019-0464-x, 2019b.
Li, Y., Zhang, Z., and Xing, Y.: Long-Term Change Analysis of PM2.5 and Ozone Pollution in China's Most Polluted Region during 2015–2020, Atmosphere, 13, 104, https://doi.org/10.3390/atmos13010104, 2022.
Li, Z., Xue, L., Yang, X., Zha, Q., Tham, Y. J., Yan, C., Louie, P. K. K., Luk, C. W. Y., Wang, T., and Wang, W.: Oxidizing capacity of the rural atmosphere in Hong Kong, Southern China, Sci. Total Environ., 612, 1114–1122, https://doi.org/10.1016/j.scitotenv.2017.08.310, 2018.
Liu, T., Clegg, S. L., and Abbatt, J. P. D.: Fast oxidation of sulfur dioxide by hydrogen peroxide in deliquesced aerosol particles, P. Natl. Acad. Sci. USA, 117, 1354–1359, https://doi.org/10.1073/pnas.1916401117, 2020a.
Liu, T., Hu, B., Yang, Y., Li, M., Hong, Y., Xu, X., Xu, L., Chen, N., Chen, Y., Xiao, H., and Chen, J.: Characteristics and source apportionment of PM2.5 on an island in Southeast China: Impact of sea-salt and monsoon, Atmos. Res., 235, 104786, https://doi.org/10.1016/j.atmosres.2019.104786, 2020.
Liu, T., Hong, Y., Li, M., Xu, L., Chen, J., Bian, Y., Yang, C., Dan, Y., Zhang, Y., Xue, L., Zhao, M., Huang, Z., and Wang, H.: Atmospheric oxidation capacity and ozone pollution mechanism in a coastal city of southeastern China: analysis of a typical photochemical episode by an observation-based model, Atmos. Chem. Phys., 22, 2173–2190, https://doi.org/10.5194/acp-22-2173-2022, 2022a.
Liu, T., Lin, Y., Chen, J., Chen, G., Yang, C., Xu, L., Li, M., Fan, X., Zhang, F., and Hong, Y.: Pollution mechanisms and photochemical effects of atmospheric HCHO in a coastal city of southeast China, Sci. Total Environ., 160210, https://doi.org/10.1016/j.scitotenv.2022.160210, 2022b.
Lou, S., Liao, H., and Zhu, B.: Impacts of aerosols on surface-layer ozone concentrations in China through heterogeneous reactions and changes in photolysis rates, Atmos. Environ., 85, 123–138, https://doi.org/10.1016/j.atmosenv.2013.12.004, 2014.
Lu, K., Guo, S., Tan, Z., Wang, H., Shang, D., Liu, Y., Li, X., Wu, Z., Hu, M., and Zhang, Y.: Exploring atmospheric free-radical chemistry in China:the self-cleansing capacity and the formation of secondary air pollution, Nat. Sci. Rev., 6, 579–594, 2019.
Ma, T., Furutani, H., Duan, F., Kimoto, T., Jiang, J., Zhang, Q., Xu, X., Wang, Y., Gao, J., Geng, G., Li, M., Song, S., Ma, Y., Che, F., Wang, J., Zhu, L., Huang, T., Toyoda, M., and He, K.: Contribution of hydroxymethanesulfonate (HMS) to severe winter haze in the North China Plain, Atmos. Chem. Phys., 20, 5887–5897, https://doi.org/10.5194/acp-20-5887-2020, 2020.
Mitsuishi, K., Iwasaki, M., Takeuchi, M., Okochi, H., Kato, S., Ohira, S. I., and Toda, K.: Diurnal Variations in Partitioning of Atmospheric Glyoxal and Methylglyoxal between Gas and Particles at the Ground Level and in the Free Troposphere, ACS Earth Space Chem., 2, 915–924, 2018.
Moch, J. M., Dovrou, E., Mickley, L. J., Keutsch, F. N., Cheng, Y., Jacob, D. J., Jiang, J. K., Li, M., Munger, J. W., Qiao, X. H., and Zhang, Q.: Contribution of Hydroxymethane Sulfonate to Ambient Particulate Matter: A Potential Explanation for High Particulate Sulfur During Severe Winter Haze in Beijing, Geophys. Res. Lett., 45, 11969–11979, 2018.
Moch, J. M., Dovrou, E., Mickley, L. J., Keutsch, F. N., Liu, Z., Wang, Y., Dombek, T. L., Kuwata, M., Budisulistiorini, S. H., Yang, L., Decesari, S., Paglione, M., Alexander, B., Shao, J., Munger, J. W., and Jacob, D. J.: Global Importance of Hydroxymethanesulfonate in Ambient Particulate Matter: Implications for Air Quality, J. Geophys. Res.-Atmos., 125, e2020JD032706, https://doi.org/10.1029/2020jd032706, 2020.
Munger, J. W., Tiller, C., and Hoffmann, M. R.: Identification of hydroxymethanesulfonate in fog water, Science, 231, 247–249, https://doi.org/10.1126/science.231.4735.247, 1986.
Polissar, A. V., Hopke, P. K., and Paatero, P.: Atmospheric aerosol over Alaska – 2. Elemental composition and sources, J. Geophys. Res.-Atmos., 103, 19045–19057, https://doi.org/10.1029/98jd01212, 1998.
Qin, Y., Li, J., Gong, K., Wu, Z., Chen, M., Qin, M., Huang, L., and Hu, J.: Double high pollution events in the Yangtze River Delta from 2015 to 2019: Characteristics, trends, and meteorological situations, Sci. Total Environ., 792, 148349, https://doi.org/10.1016/j.scitotenv.2021.148349, 2021.
Qin, M., Hu, A., Mao, J., Li, X., Sheng, L., Sun, J., Li, J., Wang, X., Zhang, Y., and Hu, J.: PM2.5 and O3 relationships affected by the atmospheric oxidizing capacity in the Yangtze River Delta, China, Sci. The Total Environ., 810, 152268, https://doi.org/10.1016/j.scitotenv.2021.152268, 2022.
Qu, Y., Wang, T., Yuan, C., Wu, H., Gao, L., Huang, C., Li, Y., Li, M., and Xie, M.: The underlying mechanisms of PM2.5 and O3 synergistic pollution in East China: Photochemical and heterogeneous interactions, Sci. Total Environ., 873, 162434, https://doi.org/10.1016/j.scitotenv.2023.162434, 2023.
Rienda, I. C. and Alves, C. A.: Road dust resuspension: A review, Atmos. Res., 261, 105740, https://doi.org/10.1016/j.atmosres.2021.105740, 2021.
Saunders, S. M., Jenkin, M. E., Derwent, R. G., and Pilling, M. J.: Protocol for the development of the Master Chemical Mechanism, MCM v3 (Part A): tropospheric degradation of nonaromatic volatile organic compounds, Atmos. Chem. Phys., 3, 161–180, https://doi.org/10.5194/acp-3-161-2003, 2003.
Schwartz, S. E.: In Mass-Transport Considerations Pertinent to Aqueous Phase Reactions of Gases in Liquid-Water Clouds, Chemistry of Multiphase Atmospheric Systems, edited by: Jaeschke, W., Springer Berlin Heidelberg, Berlin, Heidelberg, 415–471, 1986.
Shao, M., Yang, J., Wang, J., Chen, P., Liu, B., and Dai, Q.: Co-Occurrence of Surface O3, PM2.5 Pollution, and Tropical Cyclones in China, J. Geophys. Res.-Atmos., 127, e2021JD036310, https://doi.org/10.1029/2021JD036310, 2022.
Song, H., Lu, K., Dong, H., Tan, Z., Chen, S., Zeng, L., and Zhang, Y.: Reduced Aerosol Uptake of Hydroperoxyl Radical May Increase the Sensitivity of Ozone Production to Volatile Organic Compounds, Environ. Sci. Technol. Lett., 9, 22–29, https://doi.org/10.1021/acs.estlett.1c00893, 2022.
Song, S., Ma, T., Zhang, Y., Shen, L., Liu, P., Li, K., Zhai, S., Zheng, H., Gao, M., Moch, J. M., Duan, F., He, K., and McElroy, M. B.: Global modeling of heterogeneous hydroxymethanesulfonate chemistry, Atmos. Chem. Phys., 21, 457–481, https://doi.org/10.5194/acp-21-457-2021, 2021.
Vohra, K., Marais, E. A., Bloss, W. J., Schwartz, J., Mickley, L. J., Van Damme, M., Clarisse, L., and Coheur, P.-F.: Rapid rise in premature mortality due to anthropogenic air pollution in fast-growing tropical cities from 2005 to 2018, Sci. Adv., 8, eabm4435, https://doi.org/10.1126/sciadv.abm4435, 2022.
Wang, S., Zhao, Y., Chan, A. W. H., Yao, M., Chen, Z., and Abbatt, J. P. D.: Organic Peroxides in Aerosol: Key Reactive Intermediates for Multiphase Processes in the Atmosphere, Chem. Rev., 123, 1635–1679, https://doi.org/10.1021/acs.chemrev.2c00430, 2023.
Wang, W., Liu, M., Wang, T., Song, Y., Zhou, L., Cao, J., Hu, J., Tang, G., Chen, Z., Li, Z., Xu, Z., Peng, C., Lian, C., Chen, Y., Pan, Y., Zhang, Y., Sun, Y., Li, W., Zhu, T., Tian, H., and Ge, M.: Sulfate formation is dominated by manganese-catalyzed oxidation of SO2 on aerosol surfaces during haze events, Nat. Commun., 12, 1993–2002, https://doi.org/10.1038/s41467-021-22091-6, 2021.
Watson, J. G., Chow, J. C., and Houck, J. E.: PM2.5 chemical source profiles for vehicle exhaust, vegetative burning, geological material, and coal burning in Northwestern Colorado during 1995, Chemosphere, 43, 1141–1151, https://doi.org/10.1016/s0045-6535(00)00171-5, 2001.
World Health Organization: WHO global air quality guidelines: particulate matter (PM2.5 and PM10), ozone, nitrogen dioxide, sulfur dioxide and carbon monoxide, ISBN 978-92-4-003422-8, 2021.
Wu, X., Xu, L. L., Hong, Y. W., Chen, J. F., Qiu, Y. Q., Hu, B. Y., Hong, Z. Y., Zhang, Y. R., Liu, T. T., Chen, Y. T., Bian, Y. H., Zhao, G. Q., Chen, J. S., and Li, M. R.: The air pollution governed by subtropical high in a coastal city in Southeast China: Formation processes and influencing mechanisms, Sci. Total Environ., 692, 1135–1145, https://doi.org/10.1016/j.scitotenv.2019.07.341, 2019.
Wu, X., Li, M., Chen, J., Wang, H., Xu, L., Hong, Y., Zhao, G., Hu, B., Zhang, Y., Dan, Y., and Yu, S.: The characteristics of air pollution induced by the quasi-stationary front: Formation processes and influencing factors, Sci. Total Environ., 707, 136194, https://doi.org/10.1016/j.scitotenv.2019.136194, 2020.
Wu, Y., Huo, J., Yang, G., Wang, Y., Wang, L., Wu, S., Yao, L., Fu, Q., and Wang, L.: Measurement report: Production and loss of atmospheric formaldehyde at a suburban site of Shanghai in summertime, Atmos. Chem. Phys., 23, 2997–3014, https://doi.org/10.5194/acp-23-2997-2023, 2023.
Xiao, Q., Geng, G., Xue, T., Liu, S., Cai, C., He, K., and Zhang, Q.: Tracking PM2.5 and O3 Pollution and the Related Health Burden in China 2013–2020, Environ. Sci. Technol., 56, 6922–6932, https://doi.org/10.1021/acs.est.1c04548, 2022.
Xue, L., Wang, T., Wang, X., Blake, D. R., Gao, J., Nie,W., Gao, R., Gao, X., Xu, Z., Ding, A., Huang, Y., Lee, S., Chen, Y., Wang, S., Chai, F., Zhang, Q., and Wang, W.: On the use of an explicit chemical mechanism to dissect peroxy acetyl nitrate formation, Environ. Pollut., 195, 39–47, https://doi.org/10.1016/j.envpol.2014.08.005, 2014.
Xue, L., Gu, R., Wang, T., Wang, X., Saunders, S., Blake, D., Louie, P. K. K., Luk, C. W. Y., Simpson, I., Xu, Z., Wang, Z., Gao, Y., Lee, S., Mellouki, A., and Wang, W.: Oxidative capacity and radical chemistry in the polluted atmosphere of Hong Kong and Pearl River Delta region: analysis of a severe photochemical smog episode, Atmos. Chem. Phys., 16, 9891–9903, https://doi.org/10.5194/acp-16-9891-2016, 2016.
Zhang, K., Duan, Y., Huo, J., Huang, L., Wang, Y., Fu, Q., Wang, Y., and Li, L.: Formation mechanism of HCHO pollution in the suburban Yangtze River Delta region, China: A box model study and policy implementations, Atmos. Environ., 267, 118755, https://doi.org/10.1016/j.atmosenv.2021.118755, 2021.
Zhang, L., Brook, J. R., and Vet, R.: A revised parameterization for gaseous dry deposition in air-quality models, Atmos. Chem. Phys., 3, 2067–2082, https://doi.org/10.5194/acp-3-2067-2003, 2003.
Zhang, N., Guan, Y., Jiang, Y., Zhang, X., Ding, D., and Wang, S.: Regional demarcation of synergistic control for PM2.5 and ozone pollution in China based on long-term and massive data mining, Sci. Total Environ., 838, 155975, https://doi.org/10.1016/j.scitotenv.2022.155975, 2022.
Zong, L., Yang, Y., Gao, M., Wang, H., Wang, P., Zhang, H., Wang, L., Ning, G., Liu, C., Li, Y., and Gao, Z.: Large-scale synoptic drivers of co-occurring summertime ozone and PM2.5 pollution in eastern China, Atmos. Chem. Phys., 21, 9105–9124, https://doi.org/10.5194/acp-21-9105-2021, 2021.