the Creative Commons Attribution 4.0 License.
the Creative Commons Attribution 4.0 License.
 | 26 Sep 2023
Future dust concentration over the Middle East and North Africa region under global warming and stratospheric aerosol intervention scenarios
Seyed Vahid Mousavi
Khalil Karami
Simone Tilmes
Helene Muri
Abolfazl Rezaei
The Middle East and North Africa (MENA) region is the dustiest region in the world, and understanding the projected changes in the dust concentrations in the region is crucial. Stratospheric aerosol injection (SAI) geoengineering aims to reduce global warming by increasing the reflection of a small amount of the incoming solar radiation to space, hence reducing the global surface temperatures. Using the output from the Geoengineering Large Ensemble Project (GLENS), we show a reduction in the dust concentration in the MENA region under both the global warming (RCP8.5) and GLENS-SAI scenarios compared to the present-day climate. This reduction in dust over the whole MENA region is stronger under the SAI scenario, except over dust hotspots and for the dry season. In other words, in the summer, with the strongest dust events, more reduction has been projected for the global warming scenario compared to the SAI scenario. The maximum reduction in the dust concentrations in the MENA region (under both global warming and SAI) is due to the weakening of the dust hotspot emissions from the sources of the Middle East. Further analysis of the differences in the surface temperature, soil water, precipitation, leaf area index and near-surface wind speed provides some insights into the underlying physical mechanisms that determine the changes in the future dust concentrations in the MENA region. Detailed correlation analysis over dust hotspots indicates that lower future dust concentrations are controlled by lower wind speed and higher precipitation in these regions under both the RCP8.5 and SAI scenarios.
- Article
(9963 KB) - Full-text XML
-
Supplement
(565 KB) - BibTeX
- EndNote


Dust aerosols have great potential to influence the Earth's climate system (Alpert et al., 1998; Middleton, 2017; Wang et al., 2017; Kok et al., 2018), for example through direct scattering of shortwave radiation, absorption of longwave radiation (Dufresne et al., 2002; Albani et al., 2014; Mahowald et al., 2014; Kok et al., 2017), and indirect changing of cloud properties and precipitation rates through aerosol–cloud interaction (Atkinson et al., 2013; Sagoo and Storelvmo, 2017). Furthermore, dust deposition in different environments (particularly on ice and snow) may affect the surface albedo (Krinner et al., 2006; Painter et al., 2013; Albani et al., 2018; Sarangi et al., 2020). Mineral dust may also be transported a long distance and affects areas apart from the emission source, such as the biogeochemistry of the oceans, and hence induces feedbacks within the climate system (Jickells, 2005; Cao et al., 2005; Gasso et al., 2010; Wang et al., 2017; Kok et al., 2018). The dust storms can further influence the human health, agriculture and transport sectors, particularly in arid and semiarid regions (Alboghdady and El-Hendawy, 2016; Sternberg and Edwards, 2017). The Northern Hemisphere (NH) and the Middle East and North Africa (MENA) regions, including the Sahara, are important sources for dust emission. The MENA region is part of the NH “dust belt”, which extends from North Africa to East Asia, as is evident from satellite observations (Ginoux et al., 2012). Generally, the MENA region is dry with weak and scattered vegetation coverage, partially because it is away from the storm-track regions and cannot receive humidity transferred from source regions (Karami, 2019). The MENA region is the dustiest region in the world (i.e., northern Chad) and is home to the largest warm desert (Sahara) (Giles, 2005). Therefore, it is essential to understand dust concentration changes in this region under different future climate scenarios.
Previous research using different methods and approaches indicates great uncertainty in determining the future changes in the global dustiness. As an example, using the HADCM3 and ECHAM4 models with the IS92a Intergovernmental Panel on Climate Change (IPCC) scenario, Tegen et al. (2004) demonstrated that future dust emissions may increase or decrease. Using the HadAM3 atmospheric general circulation model (AGCM) with the IS92a scenario, Woodward et al. (2005) indicated an increase in the future global dust emissions, while Mahowald and Luo (2003) suggested a 20 %–60 % reduction in future dust emissions under six scenarios using the Climate System Model (CSM) 1.0 from the National Center of Atmospheric Research. Under the Representative Concentration Pathway (RCP8.5) scenario and using a regional climate model (RegCM4.0) (Giorgi et al., 2012), regional predictions over West Africa projected an increase in mineral dust with a significant increase over the Sahel and Sahara in the warm season (Ji et al., 2018). Liu et al. (2020) projected a reduction in the dust events over northern China under the RCP8.5 scenario using the fifth Climate Model Intercomparison Project (CMIP5). The incorporated dust emission, transport, and both dry and wet depositions (collectively called the dust cycle) are incorporated into climate models and Earth system models which greatly differ in terms of dust emission scheme, vegetation cover for dust emission (either prescribed or prognostic) and assumptions about dust sizes (Wu et al., 2020). While most models have the skill to generate the general patterns of global dust distribution (Liu et al., 2012; Huneeus et al., 2011), large uncertainties still exist in the simulated global dust budgets estimated by the model results (Huneeus et al., 2011; Textor et al., 2006), which impedes the interpretation of the evolution of dust storms under future climate projections (Boucher et al., 2013; Yue et al., 2010). For example, the recent study of Wu et al. (2020) analyzed 15 models which participated in the CMIP5 project and compared them with an aerosol reanalysis as well as station observations and concluded that while the models generally agree with each other as well as observations in producing the NH dust belt, the models greatly differ in terms of spatial extent of the dust belt and have large biases in dust deposition regions for some models.
Slow progress in decoupling anthropogenic emissions from economic growth and negative emission technologies is the main reasons for continuation of the increase in the global atmospheric greenhouse gas concentration (Fuss et al., 2014; Rozenberg et al., 2015; Sanderson et al., 2016). Moreover, previous research indicates that the current pledges to reduce greenhouse gas emissions would not be sufficient to limit temperature rise beyond 1.5–2 ∘C (compared to the pre-industrial period) (Millar et al., 2017; Pasztor and Turner, 2018). Geoengineering is considered to be the third pillar of climate change policy (alongside mitigation and adaptation efforts) to compensate for anthropogenic warming (e.g., Nurse, 2011; Macnaghten and Szerszynski, 2013), and stratospheric aerosol injection (SAI) geoengineering is one of the most discussed strategies. In other words, SAI is an interim measure to offset warming while the emissions are reduced. Among various geoengineering approaches, SAI has received particular attention for mainly two reasons: (a) volcano eruptions may serve as a natural analogy for this strategy, and (b) all modeling studies show an efficient global cooling effect with the SAI strategy (e.g., Caldeira and Matthews, 2007; Robock, 2008; McClellan et al., 2010; Tilmes et al., 2018; Simpson et al., 2019; Visioni et al., 2020). Climate models may simulate SAI by injecting sulfate aerosols or their precursor (sulfur dioxide, SO2) into the stratosphere, which reflects some of the incoming sunlight back to space (Crutzen, 2006; Rasch et al., 2008). Other types of aerosols are also being investigated; e.g., the sensitivity of the chemistry–climate models to injection of H2SO4 instead of SO2 has been investigated (Keith et al., 2019; Vattioni et al., 2019).
There are many unknowns regarding the SAI and its modeling, particularly its potential side effects at regional and local scales. While some of the debates are focused on the technical, financial and even political feasibility of such climate intervention scenarios, the lack of knowledge about the potential impacts, including dust concentration change, of such interventions at the local scale is still a main cause for concern (Karami et al., 2020). Therefore, there is an immediate need for knowledge about the dust concentration's response to the possible future climate change scenarios in the MENA region. This might assist in informing the local governments and public of the potential impacts of such climate intervention scenarios. Here, we use the data generated by the Geoengineering Large Ensemble Project (GLENS; Tilmes et al., 2018) to (1) examine the future changes in dust concentration in the MENA region under RCP8.5 and SAI and (2) demonstrate dust's relationship with hydroclimate variables of temperature, soil water, precipitation, leaf area index and near-surface wind. The paper is structured as follows: the method and data are presented in Sect. 2, the results are shown in Sect. 3, the discussion is in Sect. 4, and the conclusions are finally drawn in Sect. 5.
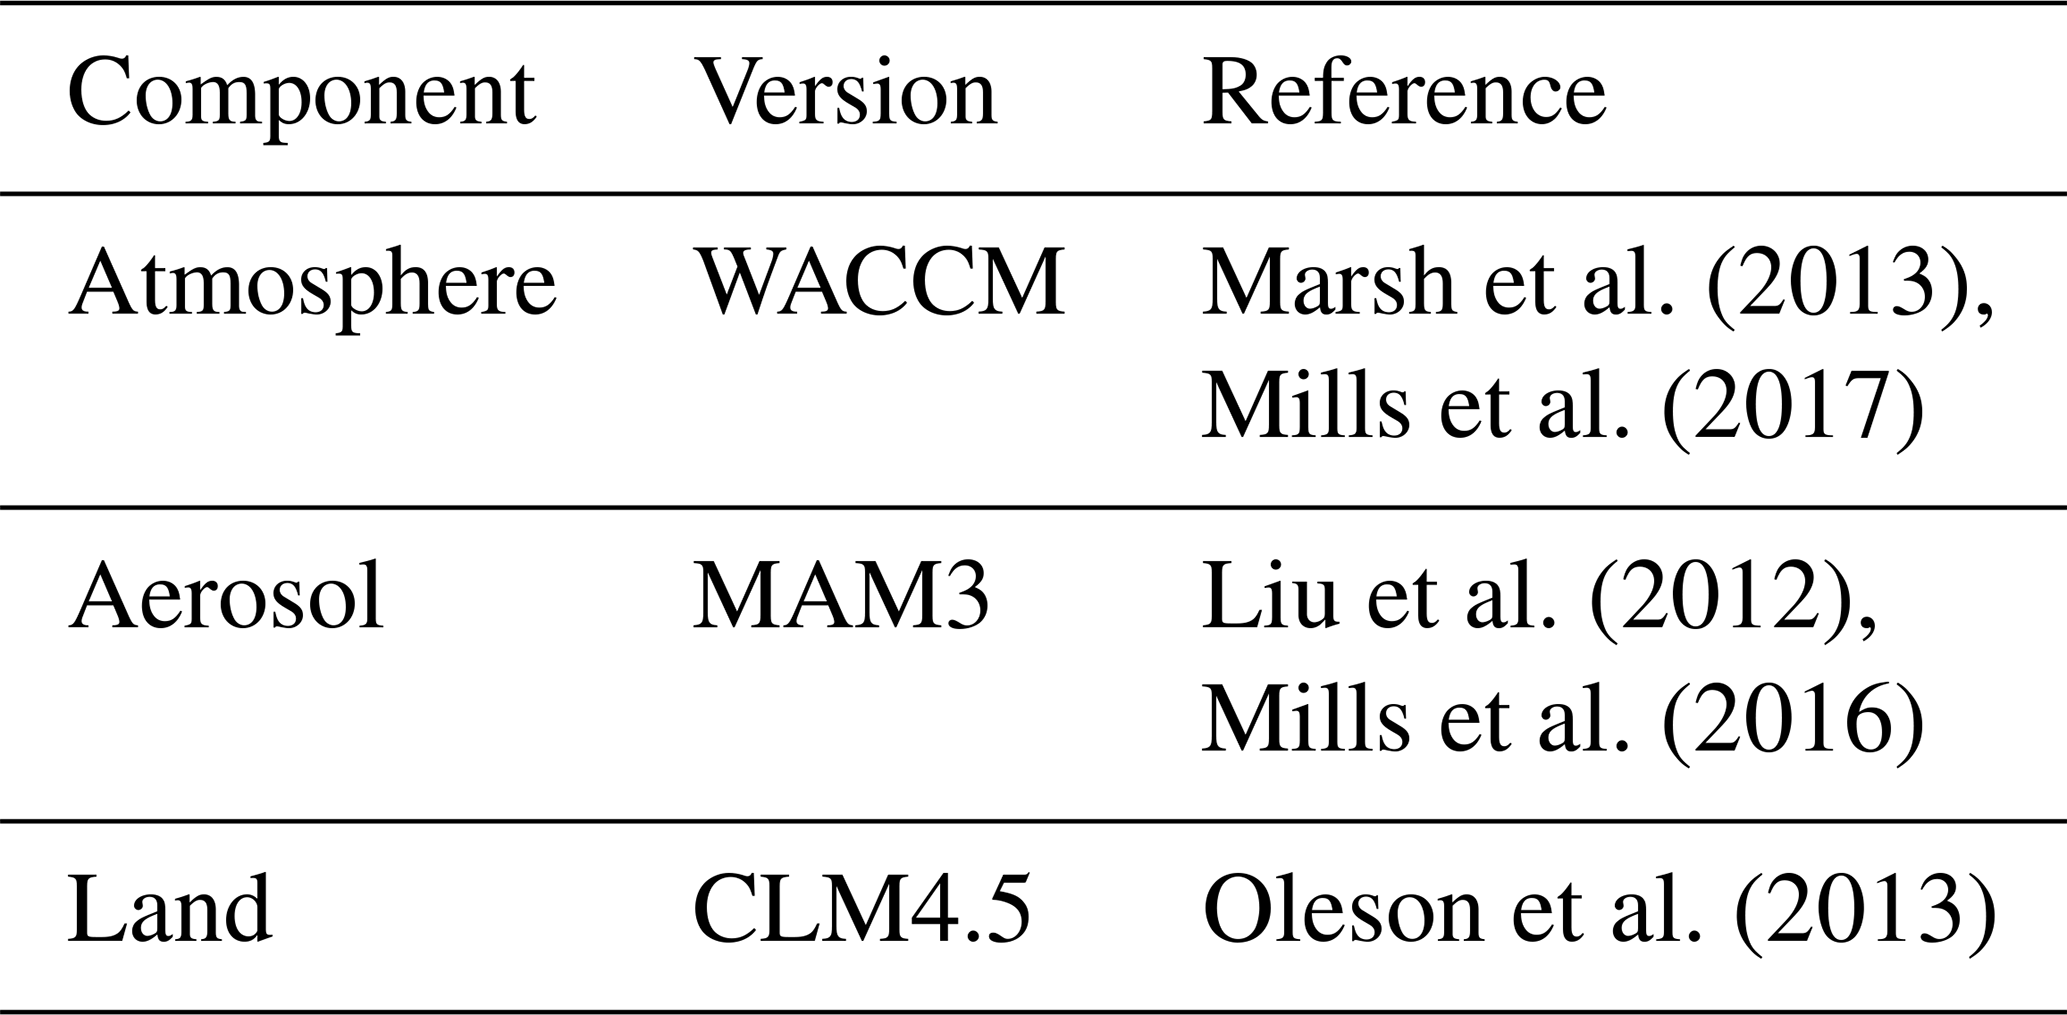
In this study, we use the GLENS output. The GLENS investigates the impacts of SAI within the climate variability at the global and regional scale with large ensemble members to reach multiple temperature targets using a feedback algorithm (Tilmes et al., 2018). The GLENS includes a 20-member ensemble of the baseline RCP8.5 scenario for the period 2010–2030, which serves as a control dataset (hereafter the present-day climate, or CTL, simulation). Three of the control simulations were continued until 2097, which serves as the baseline simulation. For each ensemble member, the atmospheric state is initialized with 1 January conditions taken from different years between 2008 and 2012 of the reference simulation and a round-off (order of 10−14 K) air temperature perturbation, while the land, sea ice and ocean start from the same initial conditions for each ensemble member. In addition, there are 20 ensemble members of the SAI simulations from 2020 to 2097. Annually varying SO2 injections into the stratosphere (roughly 5 km above the tropopause) were performed at four locations (30∘ N, 30∘ S, 15∘ N and 15∘ S) (Kravitz et al., 2017). Sulfur injection amounts for the GLENS simulations are shown in Fig. 2 of Tilmes et al. (2018) (BAMS paper). The feedback control algorithm calculates the needed amount of sulfur injection per year for each of the four injection locations, as illustrated in Fig. 2 of Tilmes et al. (2018). To counter the warming of RCP8.5, injections amounting to over 50 Tg of SO2 will be needed in total by the end of the 21st century. The amount of injection annually is adjusted using a feedback control algorithm to keep (a) the global surface temperature and (b) interhemispheric and (c) Equator-to-pole temperature gradients close to the year 2020 conditions. The interhemispheric surface temperature gradient is defined in Eq. (1) of Kravitz et al. (2017). It is simply the difference between the mean surface temperature in the Northern Hemisphere and Southern Hemisphere. In the study of Tilmes et al. (2018), the values for the interhemispheric differences for the different periods and scenarios are presented in Table 3 (T1). In the GLENS, an updated version of the Community Earth System Model CESM Version 1 (Hurrell et al., 2013) with the Whole Atmosphere Community Model (WACCM) as its atmospheric component (Mills et al., 2017) is used. The baseline scenario is the Representative Concentration Pathway 8.5 (RCP8.5) (2010–2097). The SAI scenario (2020–2097) is based on the same baseline emission pathway and uses sulfur dioxide injections to keep surface temperatures at 2020 conditions. The model simulations are performed with a horizontal resolution of 0.9∘ latitude by 1.25∘ longitude and 70 vertical layers up to 140 km (∼ 10−6 hPa). The three-mode version of the Modal Aerosol Module (MAM3) is used to simulate microphysical processes of the aerosols in the troposphere and stratosphere (Liu et al., 2012) and include prognostic stratospheric aerosols (Mills et al., 2016). WACCM is fully coupled with the Community Land Model, version 4.5 (CLM4.5) (Oleson et al., 2013) as well as with other CESM1 components, which are listed in the Table 1. Details of simulations, coupled models and parametrization are further described by previous researchers (e.g., Danabasoglu et al., 2012; Holland et al., 2012; Guenther et al., 2012; Marsh et al., 2013; Milles et al., 2016, 2017; Tilmes et al., 2018). In the CLM, the Dust Entrainment and Deposition model (DEAD) (Zender et al., 2003) is used for the atmospheric dust mobilization scheme (Mahowald et al., 2006; Oleson et al., 2013). Based on the DEAD, the total vertical mass flux of dust (Fj) from the ground into transport bin j is computed by
where T is a global factor, S the source erodibility factor, fm the grid cell fraction of exposed bare soil suitable for dust mobilization, α the sandblasting mass efficiency, Qs the total horizontally saltating mass flux of “large” particles and Mi,j the mass fraction of each source mode i carried in each of the J=4 transport bins j.
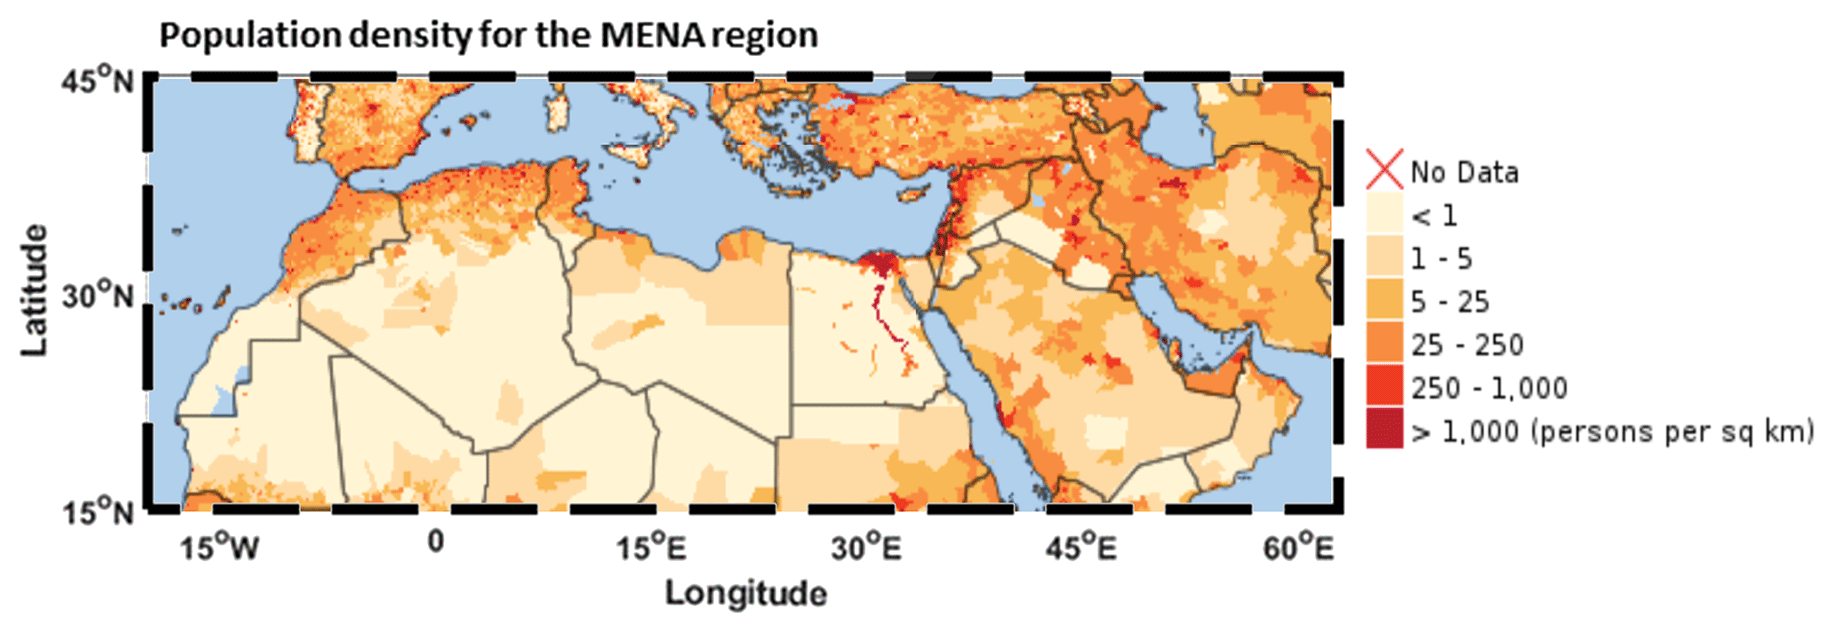
Figure 1Population density in the MENA region (SEDECA: https://sedac.ciesin.columbia.edu/, last access: June 2023). Publisher's remark: please note that the above figure contains disputed territories.
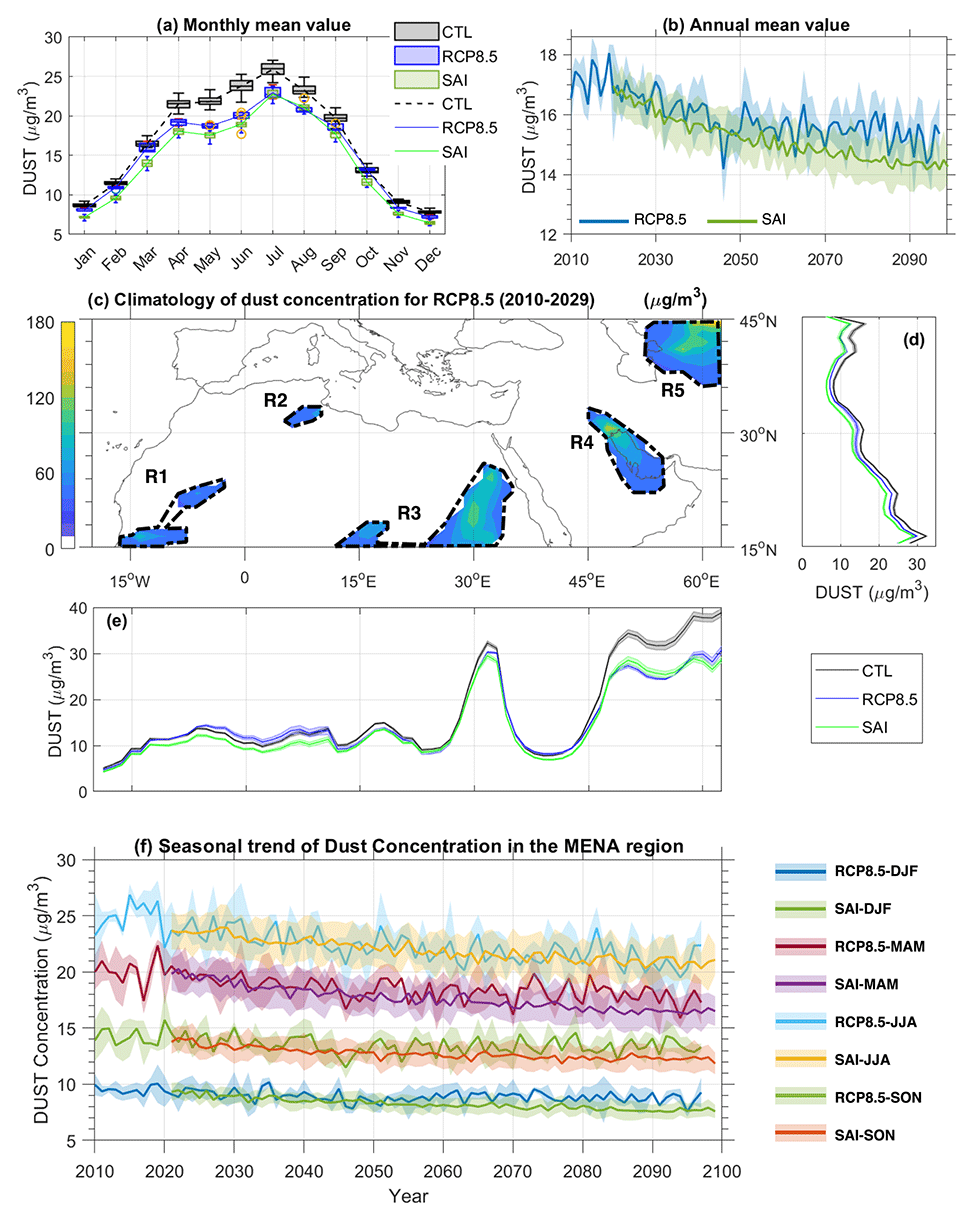
Figure 2The monthly (a) and annual (b) mean values of the dust concentration for different scenarios. The box plots in (a) are depicted with the median (horizontal line), the 25th–75th percentile (box), the 5th–95th percentile (horizontal line) and outlier data (circle). The shaded region in (b) indicates the standard deviation of all available ensemble members. (c) Climatology of dust concentration of RCP8.5 (2010–2029); mean values are calculated for all available ensemble members in the GLENS dataset. In (c), the dashed black contour lines show the dust concentration hotspots. Mean values of annual dust concentration over different latitudes (d) and different longitudes (e) and their standard deviation in the MENA region of CTL (2010–2029), RCP8.5 and SAI (2010–2029). (f) The seasonal-mean dust concentration in the MENA region with the SAI and RCP8.5 simulations.
The value of the fm factor and ability of dust to mobilize are highly decreased by increasing the total water content (including lakes, wetlands and soil moisture) as well as the fraction of vegetation cover in each grid cell (Oleson et al., 2013), based on , where flake, fwetl, fsno and fv are the grid cell fractions of lakes, wetlands, snow cover and vegetation cover, respectively; wliq,1 and wice,1 represent the top-soil-layer liquid water and ice contents, respectively. In practice, soil moisture controls the threshold wind friction speed for saltation. Further, the total horizontally saltating mass flux (Qs) is related to the third power of the wind speed; thus, any changes in wind speed could affect the dust emissions (Tegen and Fung, 1994; Tegen et al., 2002; Zender et al., 2003; Oleson et al., 2013) with a positive correlation. Previous studies also show that a higher vegetation coverage leads to lower dust emissions as the vegetation coverage can trap soil moisture through its roots and shade and also reduce soil erosion by reducing wind friction (Hillel, 1982; Raupach, 1994; Nicholson et al., 1998; Zender et al., 2003). In other words, the total leaf area index (TLAI) has a negative correlation with dust emissions and subsequently with atmospheric dust, which is also depicted in the Result section. The dust model also consists of removing mineral dust from the atmosphere through dry deposition and wet deposition. Wet deposition removes dust aerosols through in-cloud and below-cloud precipitation processes (Albani et al., 2014; Zender et al., 2003). In practice, precipitation has a negative correlation with atmospheric dust concentration, as discussed below. Although the temperature does not directly contribute to the dust flux equation in the CLM, increasing the temperature leads to lower soil moisture (Seneviratne et al., 2010) and a higher possibility for dust emission. For more details about parametrizations and calculations, the readers are encouraged to see Zender et al. (2003) and Oleson et al. (2013).
From the model outputs, we derived all available columnar dust burden values from datasets (ranging from 0.058 to 3.65 µm) by the summation of the mean monthly values of the accumulation mode (particle size of 0.058 to 0.27 µm) and the coarse mode (particle size of 0.8 to 3.65 µm). The geographical focus of the current study's latitude and longitude is 15 to 45∘ N and 20∘ W to 62.5∘ E (hereafter referred to as the MENA region). Figure 1 shows the population density map over the MENA region (available from the Socioeconomic Data and Applications Center, SEDECA, a data center of the National Aeronautics and Space Administration, NASA: https://sedac.ciesin.columbia.edu/, last access: June 2023). We further focus on the Middle East region (20 to 45∘ N and 45 to 62.5∘ E) since it has a higher population and is sensitive to changes in the dust events, as discussed in the Introduction. Furthermore, we focus on the regions with higher dust concentrations as dust hotspots. Here, we use the regionally and temporally averaged monthly surface temperature, near-surface wind speed, precipitation, soil water and total leaf area index between 2010 and 2097 to investigate the possible changes in the dust concentrations. The dust concentration is controlled by the above-mentioned variables. Here, we calculated the differences between the CTL, RCP8.5 and SAI simulations to identify the important factors that influence the temporal and spatial changes in the dust concentration under the above-mentioned scenarios. In this study, all available ensemble members of the GLENS are used to represent the present-day climate or CTL (2010–2029 period), the global warming climate or RCP8.5 (2078–2097 period), and the future climate under GLENS-SAI (2078–2097 period). Table 2 represents the different simulations, abbreviations, number of ensemble members and periods of the analyses used in this study. We also carried out the t test (99.9 % confidence level) to determine whether the differences between the RCP8.5, SAI and CTL simulations are significant. In all contour plots, regions with a confidence level of more than 99.9 % are indicated with hatched lines (i.e., differences in these regions are significant). In this study, independent t-test analysis was used for comparing the statistical difference between scenarios for the considered parameters; the t test is a statistical test that is used to determine the statistically significant difference. Depending on the confidence level, the obtained t value can be lower or higher than the statistical analysis threshold (t value). If the t value is lower than the critical value, there is no statistically significant difference between samples, and if it is higher than the critical value there is a statistically significant difference between them. The t value depends on the means and variabilities in the two datasets (i.e., means, variances and the number of samples in different scenarios). In this investigation, the t test is performed for 20 years (60 months for the seasonal and 240 months for the annual difference). The t-test formula is given in Eq. (1), where X1 and X2 are the means, and are the variances, and n1 and n2 are the number of samples:
For more detail about statistical analysis, readers are encouraged to see Miller and Miller (2010). Furthermore, the spatial average of annual time series over dust hotspots is used to visualize the annual trends by the end of this century.
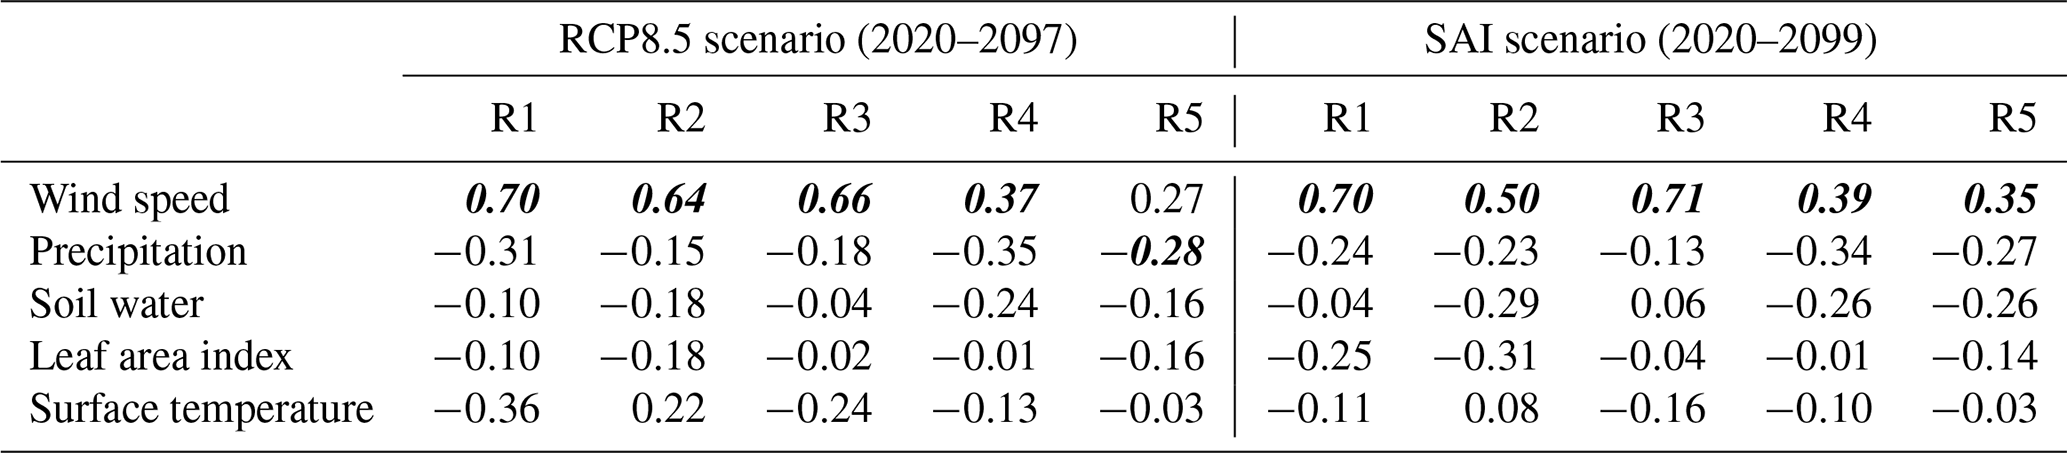
We also calculate the correlation coefficient of dust with other considered parameters for all grids (i.e., cells with a horizontal resolution of 0.9∘ latitude by 1.25∘ longitude) over the MEAN region for both the RCP8.5 and SAI scenarios. Moreover, the spatial average of the annual time series over dust hotspots is used to calculate the correlation coefficients of atmospheric dust concentration with surface temperature, near-surface wind speed, total leaf area index, precipitation and soil water for both the RCP8.5 (2010–2097) and SAI (2020–2099) scenarios, which are listed in Table 3.
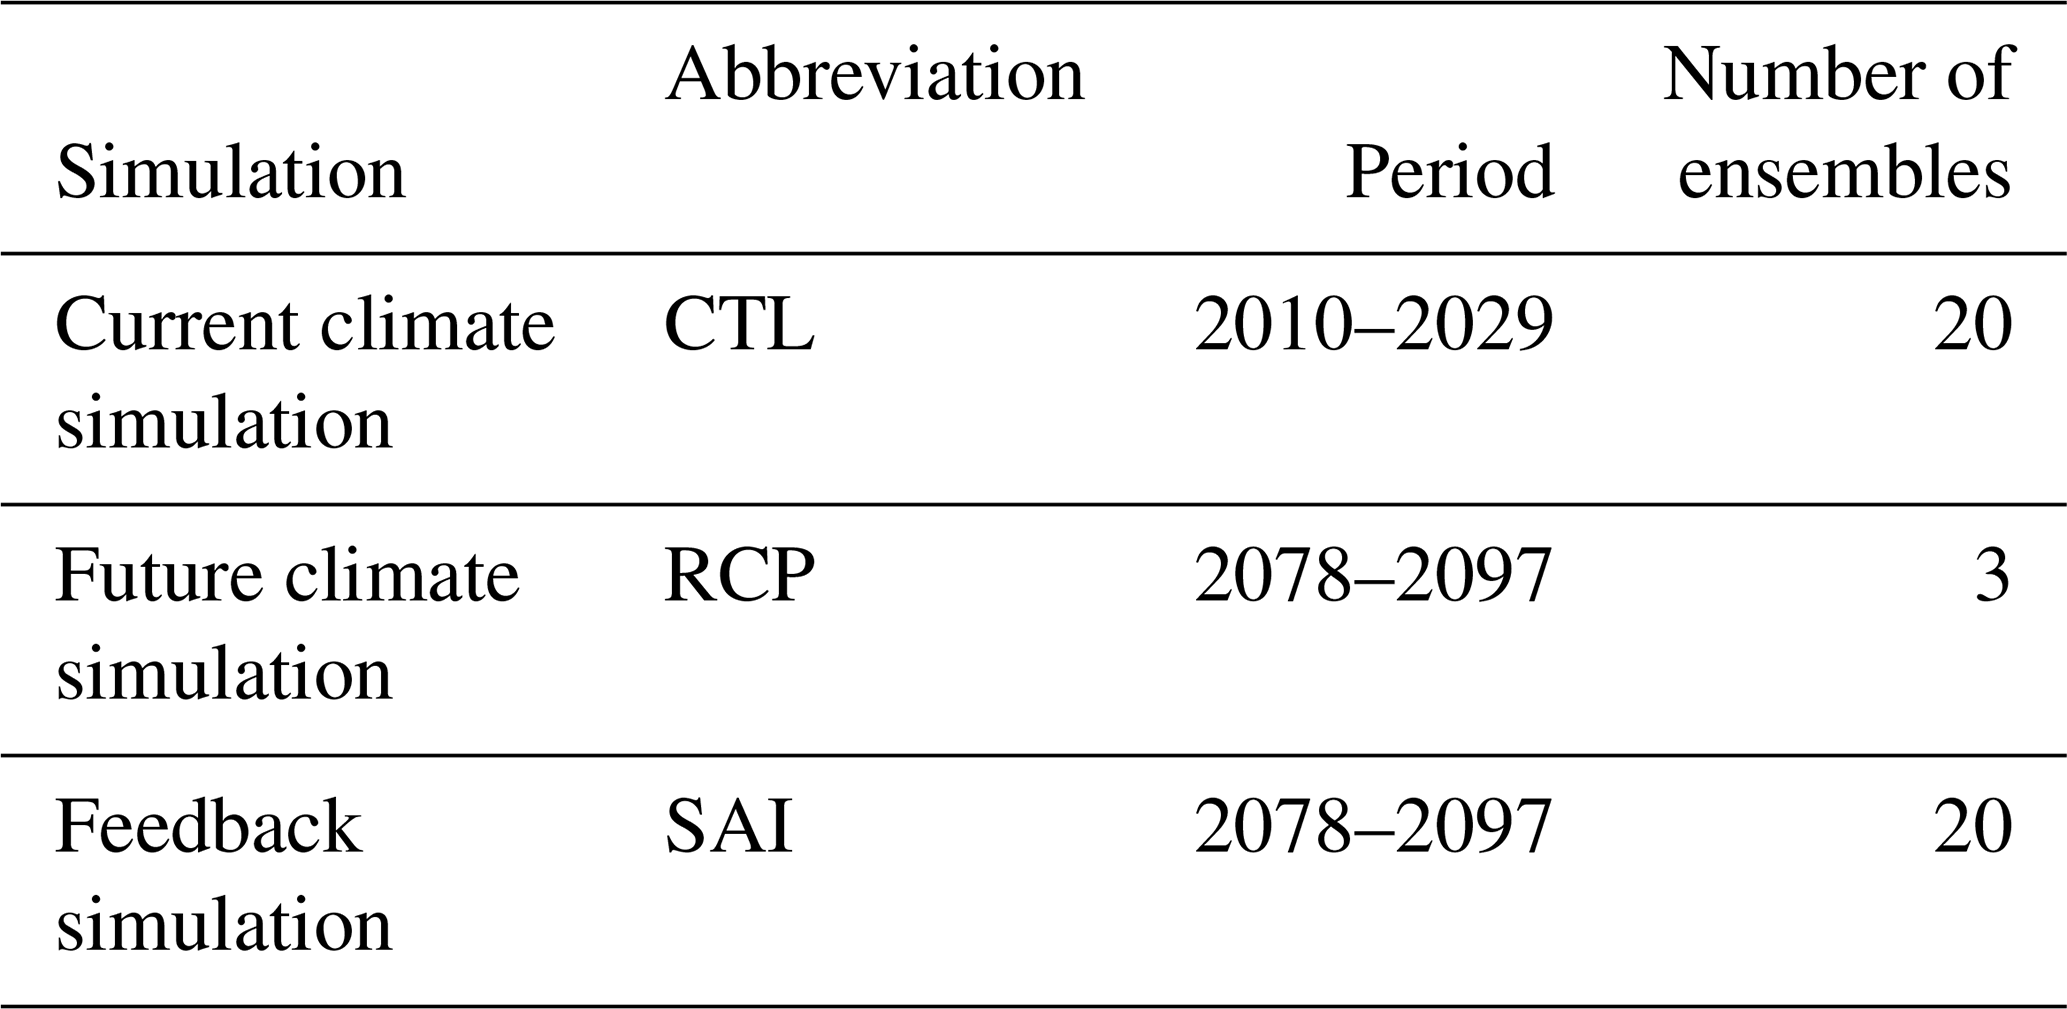
Table 3The correlation coefficient of dust with considered parameters for all dust hotspots over the MEAN region. The most important variables for each region are highlighted by italic bold font. The correlation coefficients are calculated using detrended annual-mean time series resulting from the average of all ensemble members and spatially averaged over the corresponding dust hotspot region.
3.1 Atmospheric dust concentration change under different scenarios
Figure 2a shows the seasonal cycle of monthly regional-mean values. The dust reduction in the MENA region for both the SAI and RCP8.5 scenarios (compared to the CTL simulation) is stronger during the spring and summer seasons (i.e., about 15 %). Figure 2b shows the annual-mean trends of dust concentrations across the MENA region for RCP8.5 (2010–2097) and SAI (2020–2099). This figure shows that dust mass concentrations tend to decrease in MENA under both the global warming and SAI scenarios by the end of this century, and under the SAI scenario, dust mass concentration reduction is about 5 % stronger than that in RCP8.5. The climatology of columnar dust mass concentration over the MENA region is derived from all 20 ensembles for the control simulation from 2010 to 2029 (Fig. 2c), which suggests that there are five sub-regions in the MENA region with the highest dust concentrations: northwestern Africa (R1), North Africa (R2), northeastern Africa (R3), the southwest of the Iranian Plateau (R4) and the northeast of the Iranian Plateau (R5). Figure 2d and e show the meridional- and zonal-mean annual dust concentration for the CTL, RCP8.5 and SAI scenarios, which are averaged over the whole MENA region, respectively. Overall, in Fig. 2e, the highest dust concentrations (up to 37 µg m−3) are found across northeastern Africa (i.e., 30–32∘ E) and the Middle East (i.e., 48–62.5∘ E), while in Fig. 2d, the lower latitudes of 15–20∘ N (i.e., North Africa) have the highest dust (up to 30 µg m−3). Notably, these high dust concentrations coincide with the five major dust hotspots of R1 to R5 (Fig. 2c), where among them, R5 is the largest and strongest. Figure 2c shows only a portion of the R5 region, while R5 in combination with R4 constitutes a major dust source for the Middle East. The seasonal-mean values of dust concentration under both the SAI and RCP8.5 scenarios are shown for the MENA region (Fig. 2f). Figure 2f illustrates that summer and, to a lesser extent, spring have higher dust concentrations than autumn and winter under both the SAI and RCP8.5 scenarios across the whole MENA region.
Figure 3a–o show seasonal and annual changes in dust mass concentration mean value in the MENA region under different climate scenarios. The differences are represented by the percentage of change relative to the maximum value of the annual dust concentration in the MENA region (DUSTMAX=185.75 µg m−3) in the current climate (CTL). The dashed contour lines show dust hotspots (R1 to R5) in the current climate, and the regions with hatched lines indicate where the changes exceed the 99.9 % significant level based on Student's t-test analysis. The reduction for the SAI scenario is generally larger than that for the RCP8.5 (Figs. 2b and 3o), although 5 %–15 % reduction is found in each dry season under the RCP8.5 scenario compared to the SAI scenario (Fig. 3g, h and i). Detailed analysis suggests that the maximum reduction in the dust concentrations in the MENA region (in both the global warming and SAI scenarios) mostly results from the weakening of the dust concentration in the Middle East, rather than from North Africa (Fig. 3d, e, g and h).
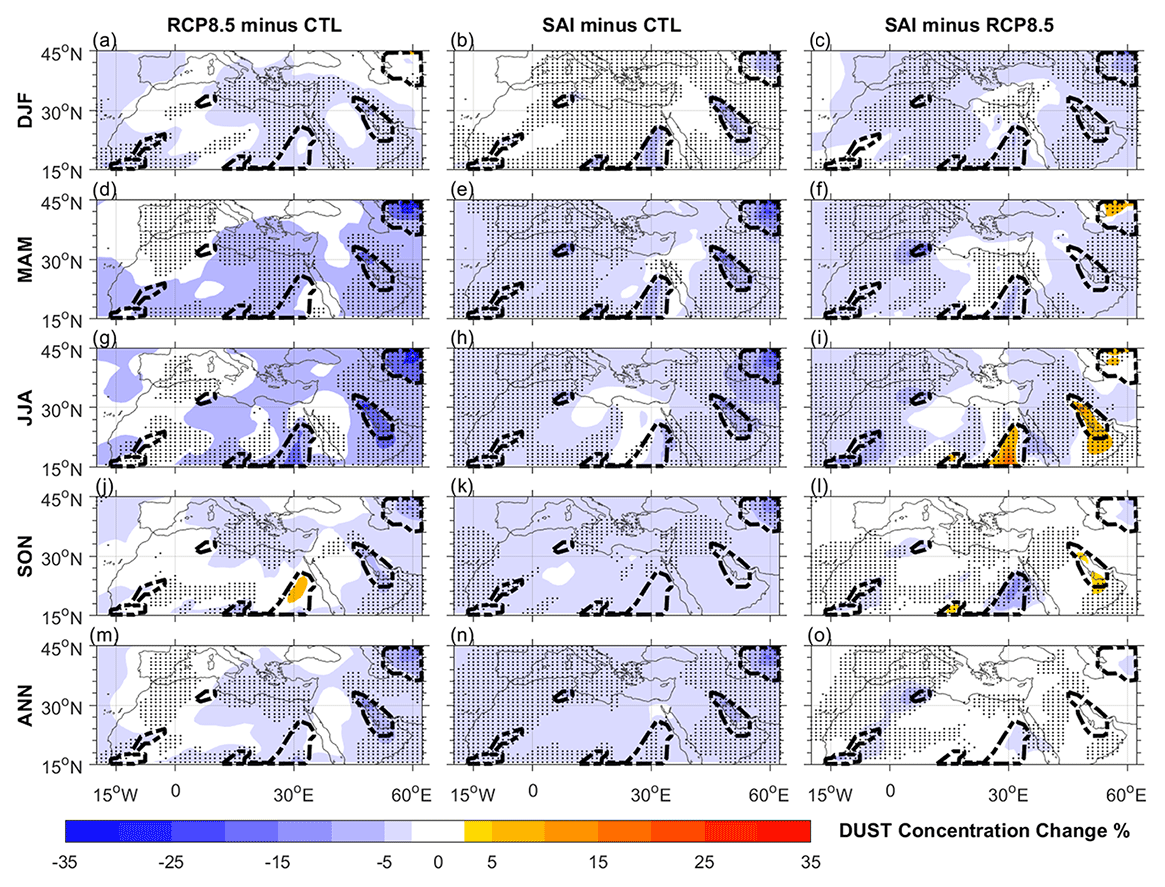
Figure 3(a–o) Seasonal and annual changes (in percent) in the mean value of dust mass concentration in the MENA region under different climate scenarios. All available ensemble members of the GLENS are used to calculate the mean value of dust concentration for CTL (2010–2029), RCP8.5 (2078–2097) and SAI (2078–2097). The dashed contour lines show dust hotspots, and the regions with hatched lines show Student's t-test analysis with the 99.9 % significance level. The percentage of change has been calculated relative to the maximum value of dust concentration in the CTL scenario over the whole MENA region (i.e., 185.75 µg m−3).
3.2 Candidate variable change under different scenarios
In the following, we determine the contributions from climate changes to dust concentration under different scenarios over the entire MENA region. The annual-mean temperature responses to the different scenarios are shown in Fig. 4a–c. As expected, in the whole MENA region, surface temperature increases 20 %–30 % (4.5–6.5 ∘C) under the high-emission scenario (RCP8.5), while under the SAI scenario, there is no statistically significant changes (Fig. 4), (as also shown in Kravitz et al., 2017; Tilmes et al., 2018; MacMartin et al., 2019). Furthermore, the annual-mean surface temperature with its standard deviation (indicated by the shaded envelope) for the RCP8.5 and SAI scenarios are shown in Fig. 4d from 2010 to 2099. RCP8.5 shows strong temperature increasing, while SAI successfully maintain the average temperature as the level of CTL.
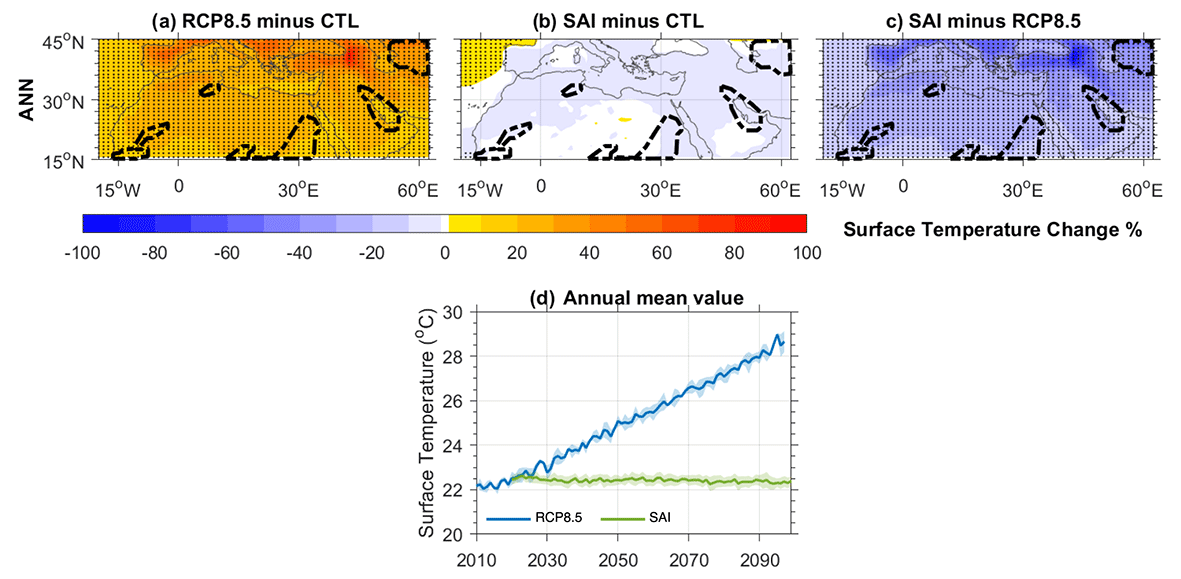
Figure 4Annual changes in surface temperature mean value in the MENA region under different climate scenarios (a–c). All available ensemble members of the GLENS are used to calculate the mean value of surface temperature for CTL (2010–2029), RCP8.5 (2078–2097) and SAI (2078–2097). The percentage of change has been calculated relative to the current climate (CTL scenario). The dashed contour lines show dust hotspots, and the regions with hatched lines show Student's t-test analysis with the 99.9 % significance level. (d) The annual-mean values of the surface temperature for different scenarios are shown. The shaded envelope in (d) shows the standard deviation of annual surface temperature for the RCP8.5 and SAI scenarios.
Figure 5 shows the spatiotemporal anomalies of TLAI for the different scenarios of CTL, RCP8.5 and SAI. The leaf area index (LAI) is a quantity to characterize the plant canopies (e.g., the aboveground portion of trees, crops, etc.). LAI is a dimensionless quantity and is defined by LAI = one-sided leaf area (m2)ground area (m2) The TLAI under the RCP8.5 scenario shows 5 %–30 % reduction compared to the CTL across the different areas of the MENA region, except the region between the Mediterranean and Caspian seas (Fig. 5a, d, g and j). The percentage of change was calculated relative to the maximum value of the TLAI in the current climate (TLAIMAX=7.34). Seasonal cycle plots of TLAI over the whole MENA region (Fig. 5p) show that the TLAI slightly increases during the winter and spring seasons, up to 20 % (i.e., mostly wet seasons) for the RCP8.5 scenario. This increase in the monthly TLAI, despite the decrease in TLAI over the large geographical coverage of the MENA region, reveals that the averaged TLAI is determined by the values from the northern MENA region. Over the summer and autumn, there are no statistically significant changes in the mean value of TLAI under the RCP8.5 scenario (Fig. 5p). In contrast, under the SAI scenario compared to the CTL, the TLAI shows a 20 %–35 % increase both spatially and temporally (Fig. 5b, e, h, k, p and q). The mean annual TLAI time series with its standard deviation (indicated by the shaded envelope) (Fig. 5q and r) also confirms these results, where TLAI has a positive trend under the SAI scenario, while it has no change under the RCP8.5. Figure 5r reveals the annual number of grid cells in the studied region with a TLAI of larger than 0.3 for both the SAI and RCP8.5 scenarios. This number is a threshold in the dust module for dust emission. Figure 5r indicates an almost 15 % increase in TLAI with SAI simulations and approximately no change in TLAI with RCP8.5; the shaded envelope depicts the standard deviation of different ensemble members.
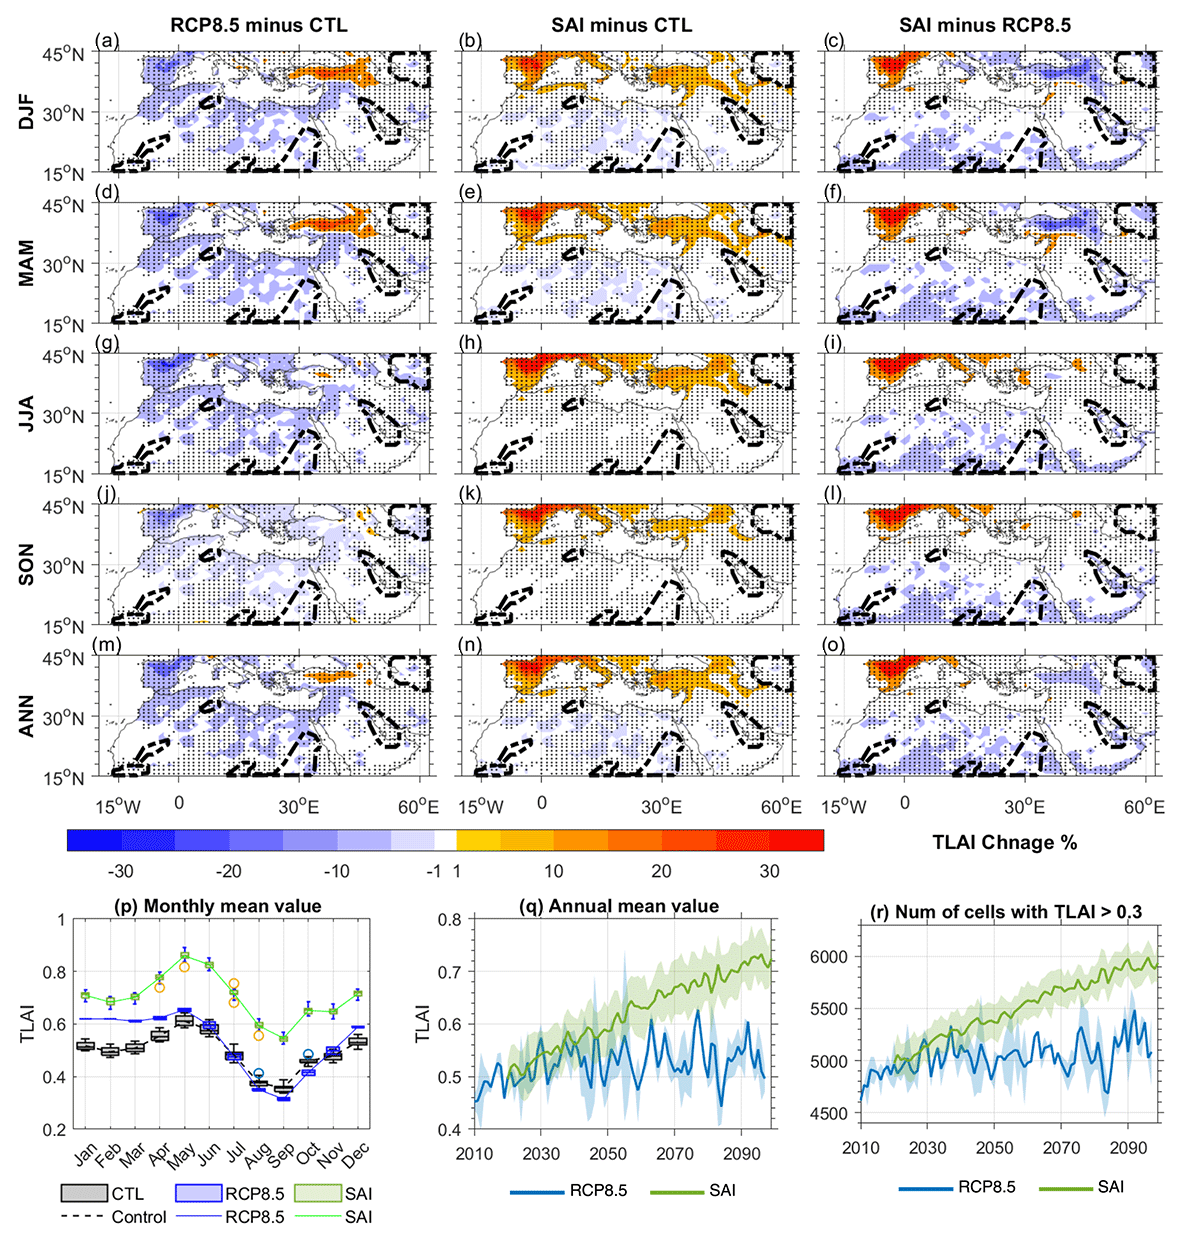
Figure 5The same as Fig. 3 but for the total leaf area index (TLAI) differences (TLAI is a unitless parameter). The percentage of change for total leaf area index has been calculated relative to the maximum value of TLAI in the CTL scenario over the whole MENA region (TLAIMAX=7.33). The monthly mean values of the TLAI for different scenarios (p). The box plots in (p) are depicted with the median (horizontal line), the 25th–75th percentile (box), the 5th–95th percentile (horizontal line) and outlier data (circle). Figure 6q shows the annual-mean value with its standard deviation (indicated by the shaded region) of TLAI for different scenarios. (r) The time series of the annual-mean total leaf area index higher than 0.3 (which is considered to be the minimum threshold for the dust emission) in the MENA region.
The 10 m wind speed responses to different scenarios are shown in Fig. 6. In general, the wind speed tends to decrease under the global warming (RCP8.5) scenario compared to CTL across the whole region (Fig. 6p and q). Despite this reduction across the whole region, during summer there is an increase in the wind speed (up to 20 %) under global warming compared to the CTL across 15–30∘ N, containing the two major dust hotspots of R1 and R3 (Fig. 6g). SAI also shows reductions in the wind speed compared to the CTL during all the seasons; notably, in the Middle East, with two major dust hotspots, it shows a 5 % to 20 % reduction (Fig. 6b, e, h, k, n). Figure 6q further shows that the wind speed with its standard deviation for both the SAI and RCP8.5 scenarios is reduced compared to the CTL, and under SAI this reduction becomes gradually stronger than RCP8.5 starting from 2050. Figure 6p show that the decrease in the wind speed under the SAI scenario is larger than that from the global warming scenario over the whole MENA region. Figure 6r shows the annual mean of the near-surface wind for all scenarios for different latitudes. Furthermore, it is evident that the regions with higher latitudes (> 32∘ N) are indicated by a reduction in their wind speed under both RCP8.5 and SAI compared to CTL (Fig. 6r).
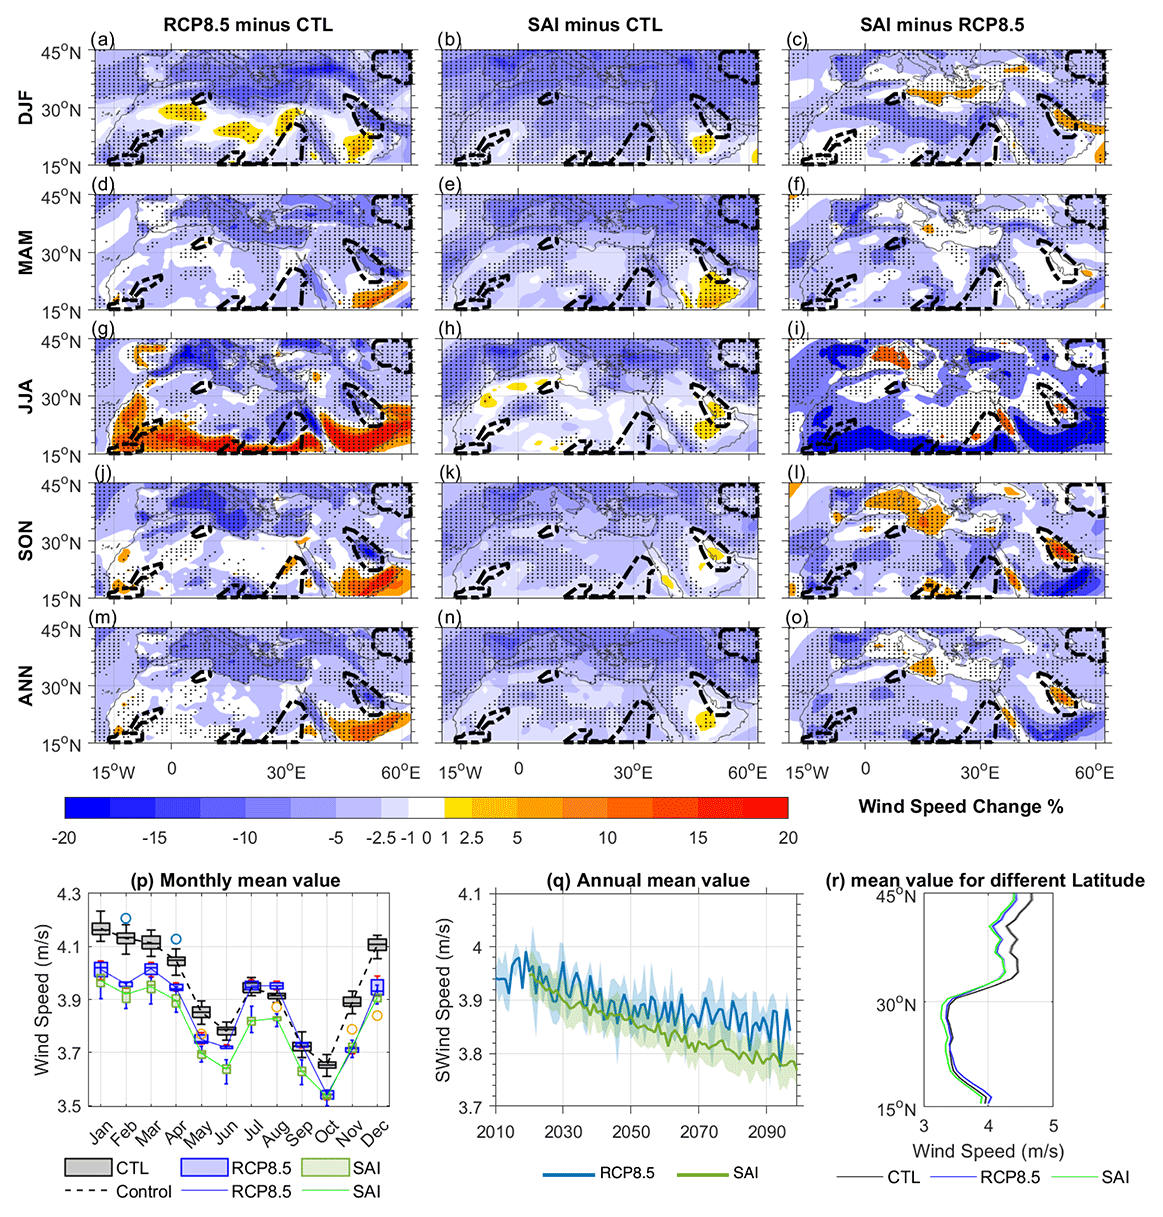
Figure 6The same as Fig. 5 but for the wind speed differences. The percentage of change has been calculated relative to the current climate (CTL scenario). Panel (r) shows the mean value of annual wind speed over different latitudes with its standard deviation for the MENA region.
Figure 7 displays the spatiotemporal differences between the CTL precipitation and those obtained from the RCP8.5 and SAI scenarios. The results suggest that under the RCP8.5 scenario compared to the CTL, the precipitation increases across North Africa by up to 25 % (relative to the maximum precipitation of the CTL scenario in the MENA region: PrecipitationMAX=4.70 mm d−1) in summer and fall (Fig. 7g and j). With the SAI simulation compared to the CTL, the Middle East experiences higher precipitation in winter and spring by 10 % to 25 % (Fig. 7b and e). Comparison of the precipitation changes between the SAI and RCP8.5 simulations reveals that during the spring season, there is about 20 % enhancement in the precipitation with the SAI simulation compared to the RCP8.5 in parts of the Middle East region (Fig. 7f). The box plot and monthly mean values of the precipitation from different scenarios (Fig. 7p) show that under the RCP8.5 scenario (compared to the CTL), precipitation is projected to increase by almost 20 % during the summer season, and under the SAI scenario (compared to the CTL), this region would experience 5 % to 25 % more precipitation during the spring and summer. The time series of the annual-mean precipitation with its standard deviation (indicated by the shaded region) is presented in Fig. 7q. It suggests that the mean annual precipitation across the whole MENA region has few significant differences under the SAI and RCP8.5 scenarios by the end of this century. Furthermore, Fig. 7r shows that the increased precipitation rates for the RCP8.5 and SAI scenarios are about 25 % higher compared to CTL over the Middle East.
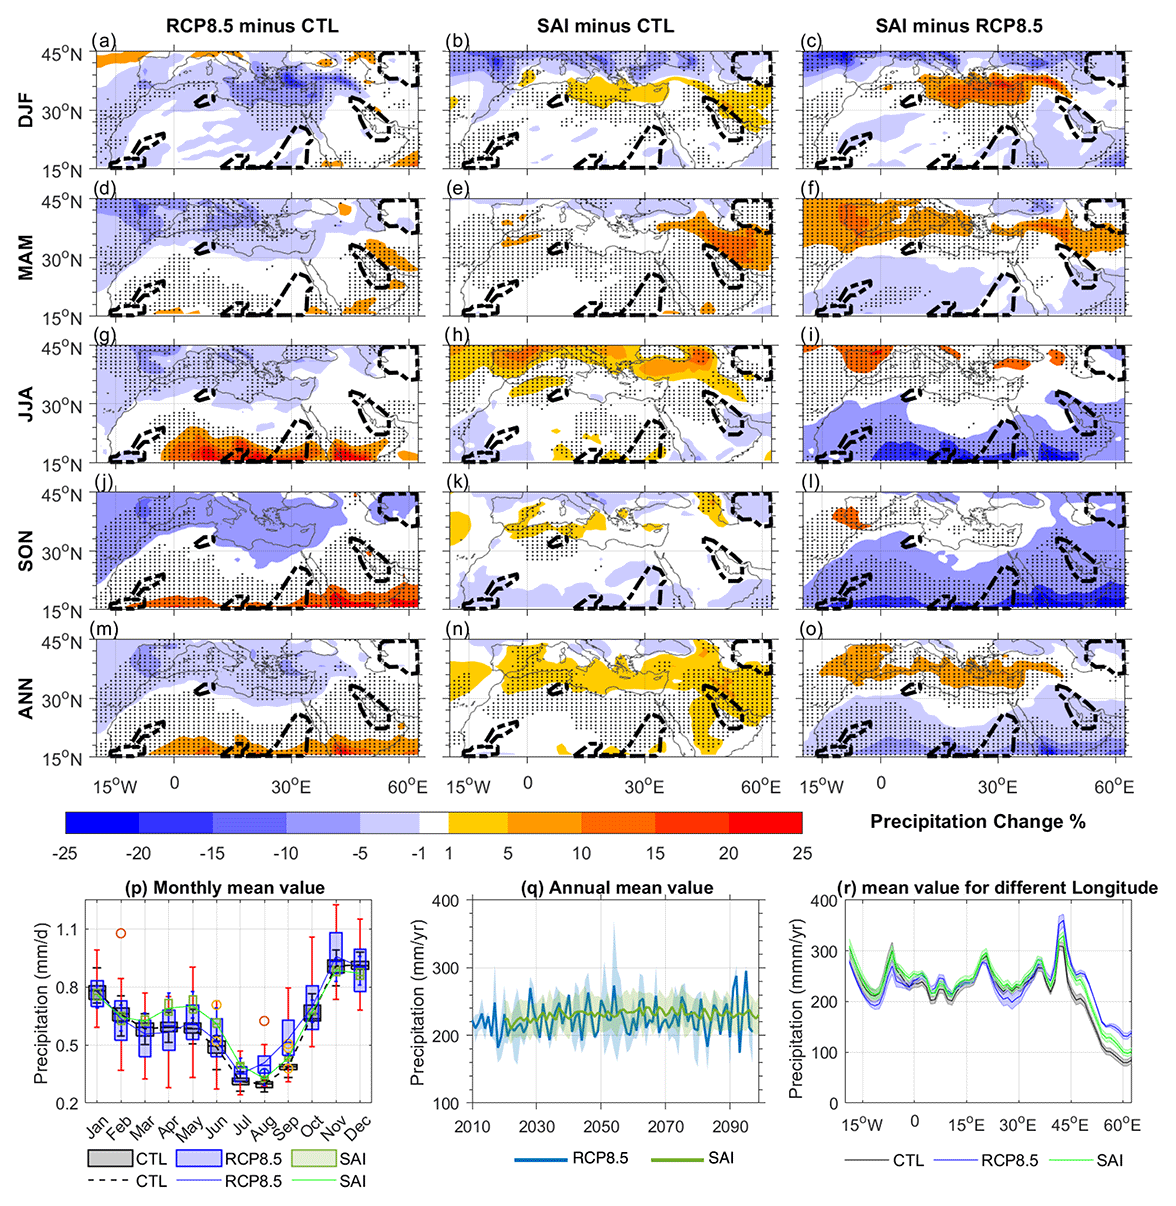
Figure 7The same as Fig. 5 but for precipitation. The percentage of change for precipitation has been calculated relative to the maximum value of precipitation in the CTL scenario over the whole MENA region (PrecipitationMAX=4.70 mm d−1). Panel (r) shows the mean value of annual precipitation over different longitudes with its standard deviation for the MENA region.
The temporal and spatial differences in the top 10 cm of soil water for different scenarios are shown in Fig. 8. In general, Fig. 8a, d, g, j and m depict an increase in the soil water over North Africa and a decrease across the Middle East under the RCP8.5 scenario (compared to the CTL). In contrast, with the SAI simulation (compared to RCP8.5), the soil water demonstrates a decrease (i.e., about 30 %) over North Africa and an increase of up to 30 % across the Middle East (particularly during the spring season). Figure 8p and q show the box plots with monthly mean values and annual trends with standard deviation of the soil water for different scenarios. In the wet seasons (winter and spring), the soil water for RCP8.5 is 5 % lower than the CTL, while the SAI simulation shows up to 5 % higher values of soil water compared to the CTL (Fig. 8p). Furthermore, Fig. 8q shows that a moderate positive trend and a slightly negative trend of the annual-mean value exists in the soil water under the SAI and RCP scenarios, respectively, for whole MENA region.
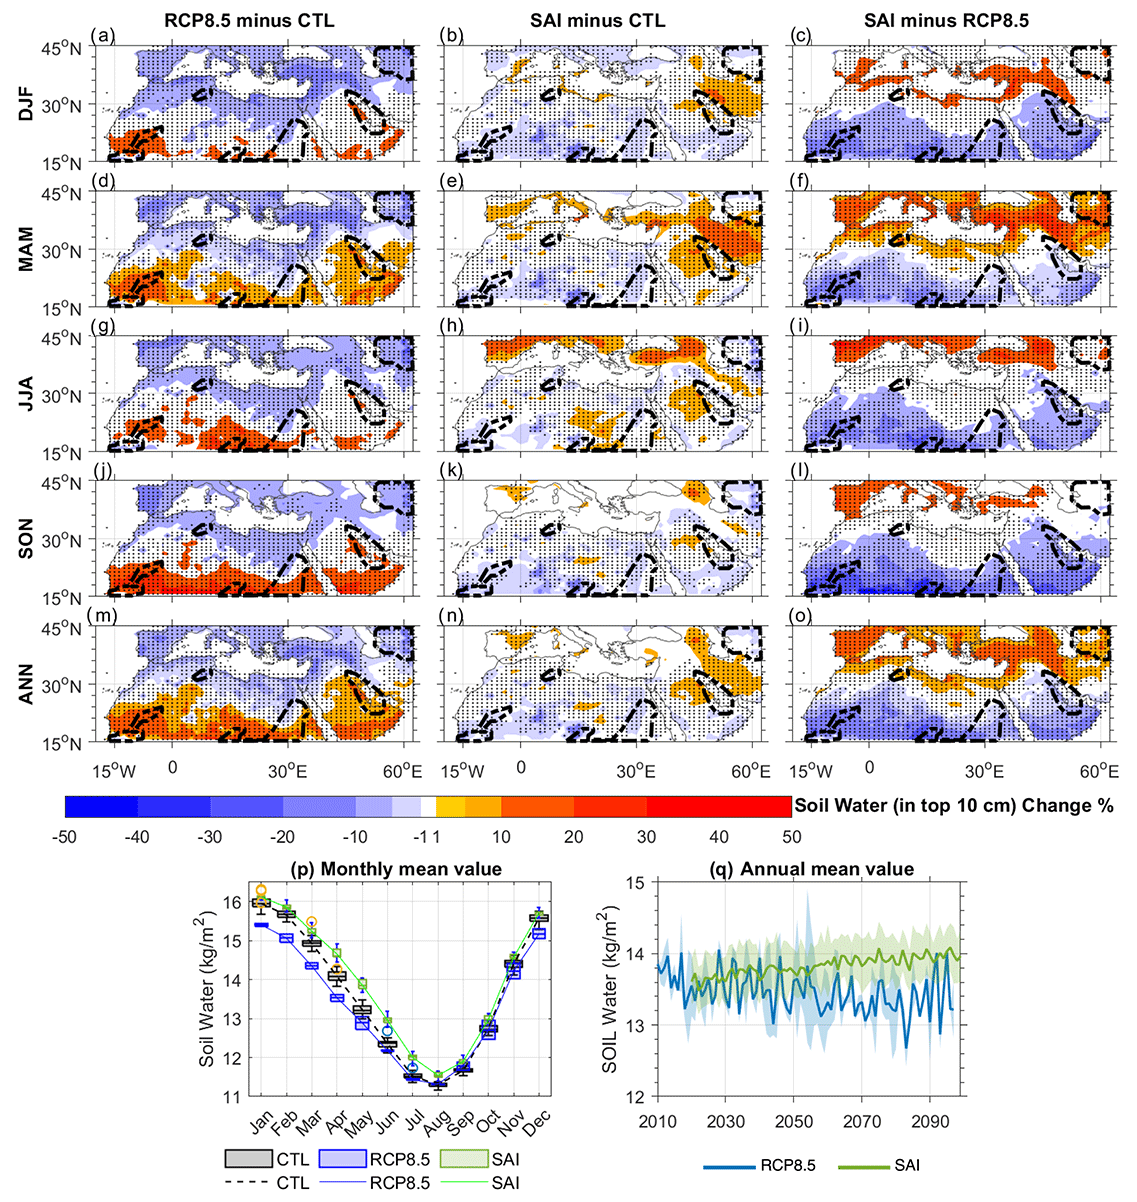
Figure 8The same as Fig. 5 but for the top 10 cm of soil water. The percentage of change has been calculated relative to the current climate (CTL scenario).
3.3 Correlation of atmospheric dust concentrations with candidate variables
Finally, to find the most efficient factors for reducing columnar dust concentration over hotspots, we calculated the correlation coefficient of dust with other considered parameters for all grids (i.e., cells with a horizontal resolution of 0.9∘ latitude by 1.25∘ longitude) over the MEAN region (Fig. 9). The positive and negative correlations are depicted as a contour plot for both RCP8.5 (2010–2097) (Fig. 9, left column) and SAI (2020–2099) (Fig. 9, right column). The detrended annual-mean time series is used to calculate the correlation coefficient between dust concentration with other considered parameters. Moreover, the statistical analysis performed for the time series and regions with a confidence level of more than 99.5 % is shown with hatched lines in Fig. 9. In Fig. 9a and b, the correlation between dust and wind speed is presented, and positive correlations (i.e., +0.7) are shown over the dust hotspots. The correlations of dust concentration with precipitation (Fig. 9c and d) and with soil water (Fig. 9e and f) show negative mean values (i.e., up to −0.35) for the R4 region. Furthermore, negative correlations (i.e., 0.1 to −0.3) between dust and TLAI can be seen for some parts of the hotspots in both scenarios (Fig. 9g and h). The correlations between dust and surface temperature are depicted in Fig. 9i and j. Moreover, the spatially averaged correlation coefficients between dust and the considered parameters for five dust hotspots over the MEAN region and under both the RCP8.5 and SAI scenarios are calculated using detrended annual-mean time series and listed in Table 3. In this table, the most important variables for each region are highlighted by italic bold font. According to this table, for all dust hotspots (i.e., R1 to R5), the wind speed is the main parameter that affects dust concentration change under both the RCP8.5 and SAI scenarios. It seems that the increase in precipitation under both the RCP8.5 and SAI scenarios is the other important factor that could affect the reduction in dust concentration in the R5 region.
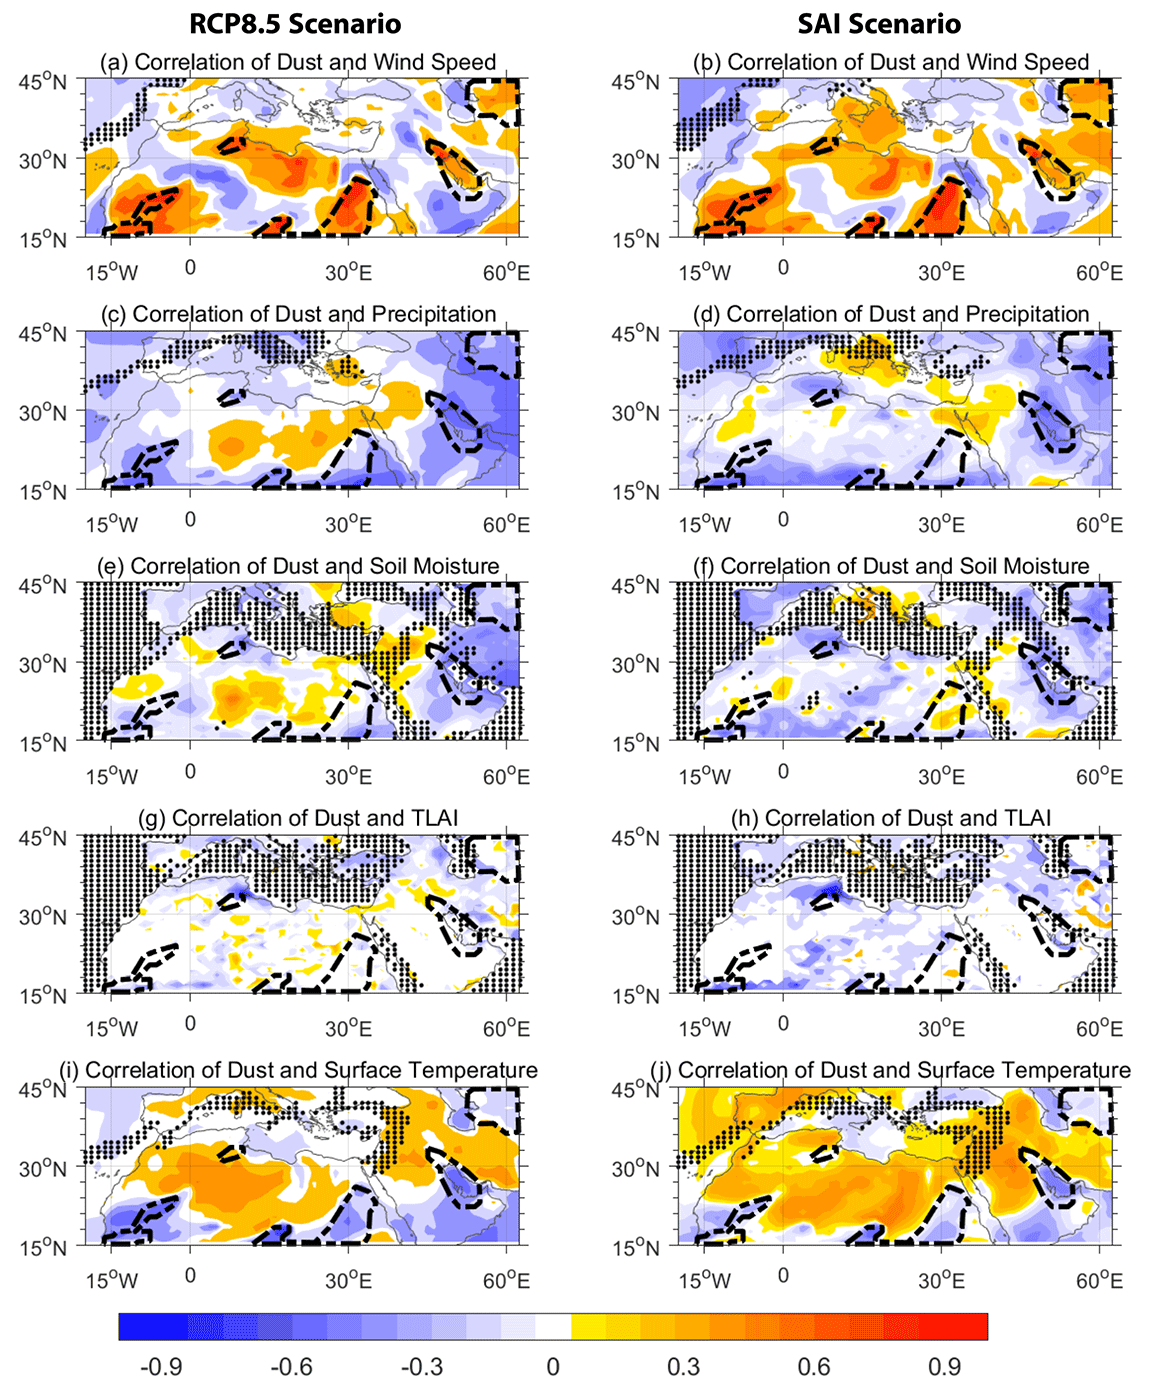
Figure 9The correlation coefficient of dust with other considered parameters for RCP8.5 (left column) and for SAI (right column) for all grids (i.e., cells with a horizontal resolution of 0.9∘ latitude by 1.25∘ longitude) over the MEAN region. The correlation is calculated using the detrended annual-mean time series of all grids. The dashed contour lines show dust hotspot regions (R1 to R5). Furthermore, the regions without hatched lines are statistically significant regions at the 99.5 % confidence level.
Moreover, to explore the annual trends of parameters over the dust hotspots and to compare the annual-mean values of different variables, we depicted the regional annual mean of the considered parameters under both the RCP8.5 and SAI scenarios over different hotspot regions (Fig. 10). Figure 10 shows the modeled reduction in dust concentration for R4 (i.e., about 15 %) and R5 (i.e., about 20 %) under both the RCP8.5 and SAI scenarios (Fig. 10a4 and a5). Although the dust concentration over the R2 hotspot has no considerable change by the end of the century for RCP8.5, an approximately 20 % reduction is projected for the SAI scenario over the R2 hotspot (Fig. 10a2). Corresponding to the reduction (i.e., about 15 %) in dust in the R4 region (Fig. 10a4) under both the RCP8.5 and SAI scenarios, an increase (i.e., about 50 %) in precipitation (Fig. 10c4) and a decrease (i.e., about 5 % for RCP8.5) in wind speed (Fig. 10b4) are seen. Detailed analysis of annual trends for the R5 region indicates that the reduction in dust concentration in this region (i.e., about 20 %) would be affected by the decrease (i.e., about 5 %) in wind speed and the considerable increase (i.e., about 50 %) in leaf area index under both the RCP8.5 and SAI scenarios (Fig. 10a5, b5 and e5).
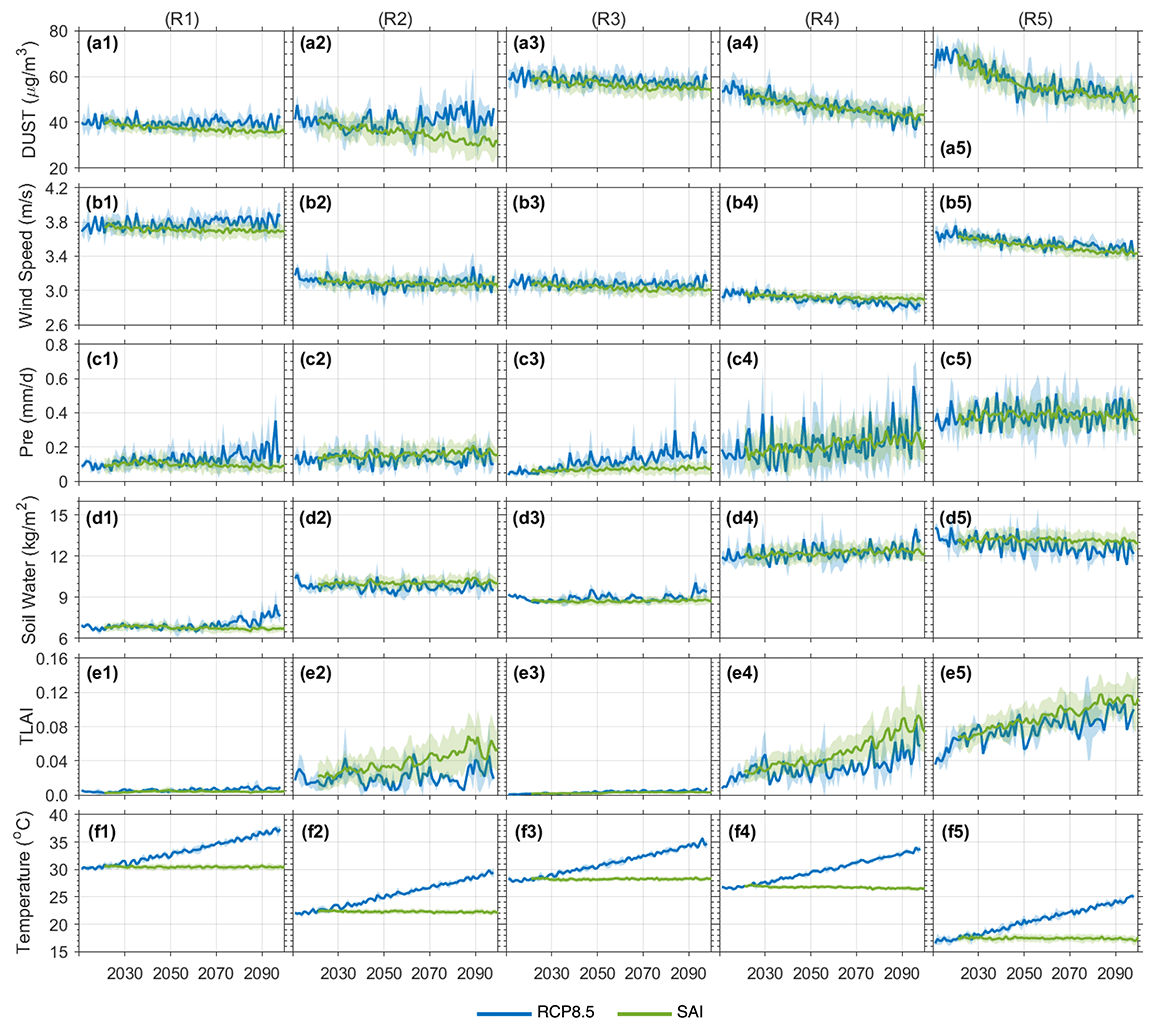
Figure 10The annual-mean values of the considered parameters for the RCP8.5 and SAI scenarios. The different columns (i.e., columns 1 to 5) represent the dust hotspot regions R1 to R5, respectively, and the different rows depict the annual-mean trends for different parameters with their standard deviation for all ensemble members.
Figure 11 includes error bars for monthly mean values of all considered parameters for the R4 and R5 regions and shows a reduction in dust concentration between the control and the two future scenarios (up to 25 %) for R4 and (up to 35 %) for R5 from spring to fall (Fig. 11a and b). Differences between RCP.85 and SAI are however not statistically significant. The monthly mean values with error bars of all considered parameters for R1, R2 and R3 are also shown in Fig. S1 in the Supplement. It seems that the reduction in dust concentration over the R4 region (Fig. 11a) has been affected by the lower wind speed (Fig. 11c) and higher precipitation (Fig. 11d) and leaf area index (Fig. 11j) under both the RCP8.5 and SAI scenarios. Furthermore, the reduction in the monthly mean value of dust concentration over the R5 region (Fig. 11b) could be a result of the decrease in wind speed (Fig. 11d) and increase in leaf area index (Fig. 11j). The results of Figs. 10 and 11 are in good agreement with the results and correlation coefficients in Table 3.
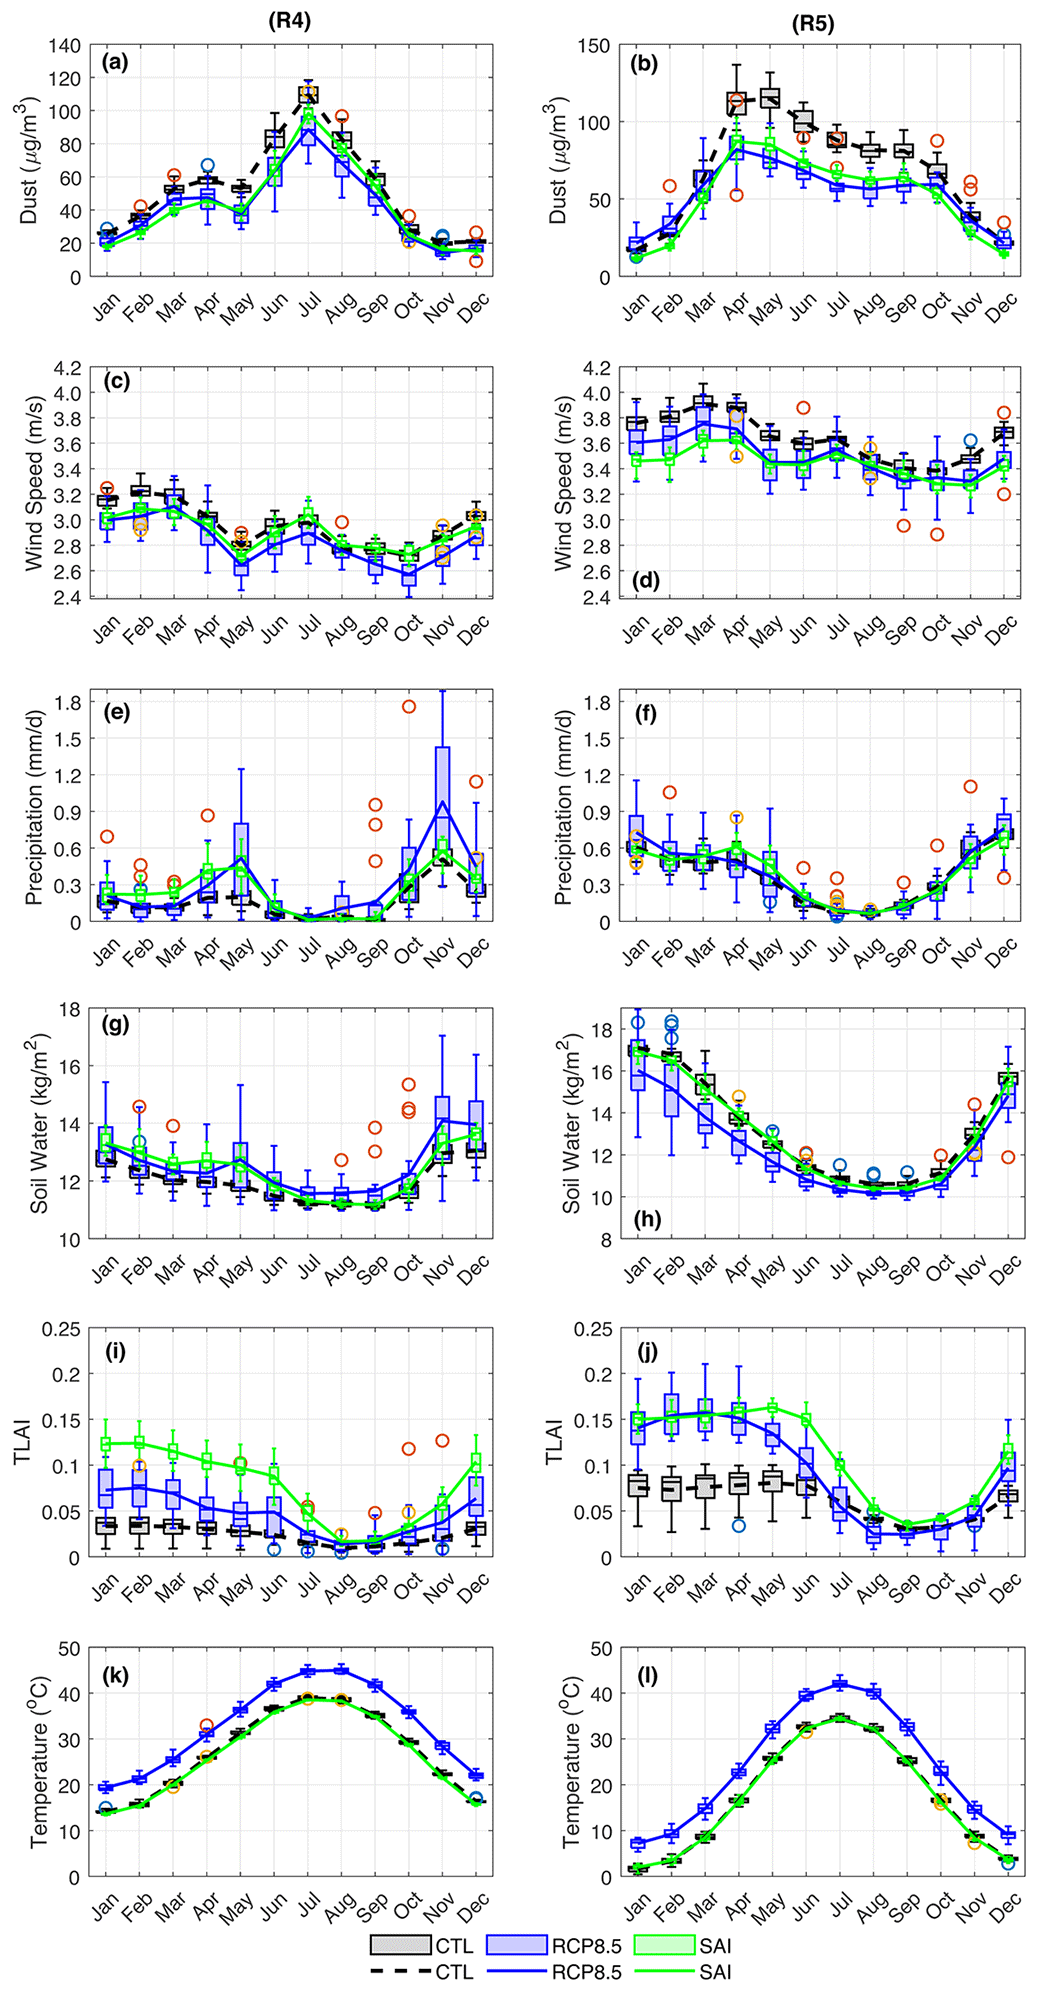
Figure 11The multi-monthly mean values of the considered parameters with percentile values as error bars for the R4 dust hotspot (left column) and R5 dust hotspot (right column) for different scenarios. The box plots are depicted with the median (horizontal line), the 25th–75th percentile (box), the 5th–95th percentile (horizontal line) and outlier data (circle).
Based on the CTL simulation, the regions that are highlighted with the dashed contour line in Fig. 2c (i.e., R1, R2, R3, R4 and R5) are introduced as hotspots of the columnar dust concentration over the MENA region, and this is in agreement with the global-scale atmospheric dust sources determined by previous studies (e.g., Prospero, 2002; Ginoux et al., 2012; Middleton, 2017). The Saharan desert, as the largest warm desert in the world, encompasses R1, R2 and R3. Notably, R3 is consistent with the Bodélé Depression in northern Chad, as the region with the highest dust concentrations in the world (Giles, 2005). Region R4 also covers some part of Iraq and Iran, and this region accounts for one of the important sources of dust emissions in the Middle East region (Prospero, 2002; WMO and UNEP, 2013; Cao et al., 2005). Finally, Central Asia and the Karakum and Kyzylkum deserts are the main sources of dust storm generation (Orlovsky et al., 2005), corresponding to region R5 in Fig. 2c. In general, it is found that the locations and concentrations in the dust hotspot regions are realistically simulated by the GLENS. The changes in the dust concentration over the Middle East might be considered even more important than those in North Africa due to its higher population, although the future patterns of the population density may also change. Also, dust activities are more important in the area of interest during summertime, with drier and warmer conditions (Figs. 2 and 3). As our analysis reveals, the reduction in the future dust mass concentration over the MENA region (in both the RCP8.5 and SAI scenarios) is mostly due to the weakening of the Middle East dust hotspots (Figs. 2 and 3). Moreover, the highest dust concentration of each year over the MENA region occurs during summertime (Fig. 2f). The reduction in the dust concentration is about 5 %–35 % for the RCP8.5 scenario (compared to CTL), where it is stronger from March to September, especially for the dust hotspots in the Middle East region (Fig. 3d, g and j). Similarly, the dust concentration is also found to decline by 5 %–30 % under the SAI scenario compared to CTL over the dust hotspots in the MENA region (Fig. 3b, e, h and k). Dust concentrations in the summer in the R3, R4 and R5 hotspot regions under the SAI scenario are approximately 5 %–15 % higher than in the RCP8.5 scenario (Fig. 3i).
As depicted in the Results section, the increase in the monthly mean TLAI for the RCP8.5 and SAI scenarios (compared to the CTL) is mostly determined by the values of the quantity in the northern MENA region. This increase is probably because of CO2 fertilization, the northern MENA being covered with vegetation, and higher CO2 in RCP8.5 and SAI boosting plant growth (Ueyama et al., 2020). Figure 5p demonstrates that the TLAI in the SAI scenario has increased by up to 30 % compared to the CTL. In the spatial maps, this increase is projected in the northern MENA region (i.e., southern Europe), with higher annual precipitation (i.e., tropical climate), which contains no dust hotspot. In the Community Land Model, 0.3 is considered to be a threshold of the leaf area index (LAI) for dust emission, and for a region with LAI of less than 0.3, dust may be emitted (Mahowald et al., 1999; Zender et al., 2003; Mahowald et al., 2010; Kok et al., 2014). Overall, the total leaf area index is found to increase over the whole MENA region (Fig. 5q and p) and also over the R2, R4 and R5 hotspot regions with higher latitude (Figs. 10, 11 and S1) under both the RCP8.5 and SAI scenarios, whereas the increase under SAI is higher compared to the RCP8.5 scenario. Under RCP8.5, extreme heat and potential extreme drought will prohibit the TLAI from increasing (compared to SAI), but under SAI, lower temperature will benefit some plants and also reduce latent heat, which will increase soil water. Although an increase of more than 100 % in TLAI is projected in R4 and R5 for both the RCP8.5 and SAI scenarios (Figs. 10e4, e5, 11i and j), the TLAI mean values over R4 and R5 are still lower than the threshold of the dust emission in the dust generation model (i.e., TLAImean<0.3). However, this small increase may help to decrease the dust concentrations, since based on correlation coefficients in Fig. 9 and Table 3, there is a negative correlation between the dust and TLAI in these regions.
Our results show that over the whole MENA region, the wind speed is generally weaker with the SAI simulation compared to RCP8.5 throughout the year (Fig. 6p and q). Figure 6r demonstrates that the wind speed at the higher latitudes considered here (> 32∘ N), such as the R4 and R5 dust hotspots, would decreases to a larger degree (i.e., about 5 %) under both the SAI and RCP8.5 scenarios. This could be a possible reason for the larger reduction in the dust concentrations over the Middle East compared to North Africa under the SAI and RCP8.5 scenarios compared to the CTL (Figs. 2, 3, 10 and 11). Such a wind change under different climate change scenarios is expected to affect the sub-seasonal variability and circulation (Žagar et al., 2020).
The R4 dust hotspot will encounter an enhancement in the annual precipitation (i.e., about 100 % and 65 % with both the RCP8.5 and SAI simulations, respectively), consistent with an increased TLAI index (i.e., more than 100 % under both scenarios) (Fig. 10). In other words, the R4 region, with a semiarid climate, would undergo more precipitation under both the RCP8.5 and SAI scenarios (compared to the CTL), which is an important factor of how the dust concentration is determined. In detail, for longitudes > 40 ∘E (i.e., in the vicinity of R4 and R5), the precipitation differences between the CTL and the RCP8.5 and SAI scenarios are about 20–50 mm yr−1 (Fig. 7r). This means that the mentioned region receives 20 %–50 % more precipitation in the future climate, and this is a considerable amount for this semiarid region.
Based on the above analysis, dust emission physically reduces with cooler temperatures, weaker winds and wetter climates through increasing precipitation and soil water and, in turn, denser and broader vegetation coverage. As explained using Eq. (1), the ability of dust to mobilize highly reduces with greater total water content (Oleson et al., 2013). The results demonstrate that the dust concentrations in the dust hotspots are substantially affected by wind speed and precipitation more than other parameters. Nonetheless, there are some limitations associated with the present work. First, the GLENS is based on only one model and a specific SAI injection scenario and applied injection strategy. We suggest also considering other model results in future studies to reduce the possible uncertainties associated with just using a single one. Moreover, neither the current study nor the GLENS suggests the SAI as an alternative to emission reductions and mitigation efforts. We also point out that the results presented in the current study should not be used as an indication of the real-world large-scale deployment of aerosols in the atmosphere.
This study projects the changes in atmospheric dust mass concentrations in the MENA region under the stratospheric aerosol injection (SAI) and high-emission global warming (RCP8.5) scenarios compared to the current climate (CTL). Our results show that the future dust mass concentration would be reduced by up to 35 % under both the RCP8.5 and SAI scenarios compared to the CTL in the different areas of the MENA region, although this reduction is slightly stronger for the SAI simulations compared to RCP8.5 over the whole MENA region. However, a more detailed analysis of regions in the vicinity of dust hotspots in the summer of northeastern Africa (R3) and the Middle East (R4 and R5) shows 5 %–15 % higher dust concentrations under the SAI scenario compared to RCP8.5. With the SAI simulations, the more densely populated Middle East area would encounter higher dust concentrations (i.e., about 5 %–15 %) than under the RCP8.5 scenario after 2060, but still, a lower (i.e., about 5 %–30 %) dust concentration would occur compared to the present day. We further conclude that, over the coming 80 years, the dust mass concentration generally decreases under both the RCP8.5 and SAI scenarios with an increase in precipitation, soil water and leaf area index and a decrease in 10 m wind speed over the MENA region, particularly across the Middle East; furthermore, over the dust hotspots, the near-surface wind speed and precipitation have the greatest impact on this reduction.
The data from the GLENS simulations are publicly available via its website: http://www.cesm.ucar.edu/projects/community-projects/GLENS/ (Tilmes et al., 2023a) (https://doi.org/10.5065/D6JH3JXX; Tilmes et al., 2023b). The data for population density are publicly available via the website of the Socioeconomic Data and Applications Center, SEDECA, a data center of the National Aeronautics and Space Administration, NASA: https://sedac.ciesin.columbia.edu/ (de Sherbinin, et al., 2023).
The supplement related to this article is available online at: https://doi.org/10.5194/acp-23-10677-2023-supplement.
SVM analyzed the data and prepared figures. SVM, KK, ST, HM and LX contributed to writing and interpreting the results and preparing the manuscript. ST and LX provided expert advice on specific aspects of the work. KK, ST, LX, HM and AR reviewed and edited the manuscript.
At least one of the (co-)authors is a member of the editorial board of Atmospheric Chemistry and Physics. The peer-review process was guided by an independent editor, and the authors also have no other competing interests to declare.
Publisher’s note: Copernicus Publications remains neutral with regard to jurisdictional claims in published maps and institutional affiliations.
This article is part of the special issue “Dust aerosol measurements, modeling and multidisciplinary effects (AMT/ACP inter-journal SI)”. It is not associated with a conference.
Khalil Karami and Seyed Vahid Mousavi are partially supported by The World Academy of Sciences (TWAS) (grant no. A-097-FR3240304784). Lili Xia is supported by a grant from SilverLining's Safe Climate Research Initiative and NSF grant nos. AGS-2017113 and ENG-2028541. The CESM project is supported by the National Science Foundation. The authors are also grateful to Hamidreza Khalesifard and the members of the IASBS remote sensing lab for valuable discussions and comments on the manuscript.
This research has been supported by the World Academy of Sciences (grant no. A-097-FR3240304784) and also by SilverLining’s Safe Climate Research Initiative and the National Science Foundation (grant nos. AGS-2017113 and ENG-2028541).
This paper was edited by Jianping Huang and reviewed by two anonymous referees.
Albani, S., Mahowald, N. M., Perry, A. T., Scanza, R. A., Zender, C. S., Heavens, N. G., Maggi, V., Kok, J. F., and Otto Bliesner, B. L.: Improved dust representation in the Community Atmosphere Model, J. Adv. Model. Earth Syst., 6, 541–570, https://doi.org/10.1002/2013MS000279, 2014.
Albani, S., Balkanski, Y., Mahowald, N., Winckler, G., Maggi, V., and Delmonte, B.: Aerosol-Climate Interactions During the Last Glacial Maximum, Curr. Clim. Change Rep., 4, 99–114, https://doi.org/10.1007/s40641-018-0100-7, 2018.
Alboghdady, M. and El-Hendawy, S. E.: Economic impacts of climate change and variability on agricultural production in the Middle East and North Africa region, IJCCSM, 8, 463–472, https://doi.org/10.1108/ijccsm-07-2015-0100, 2016.
Alpert, P., Kaufman, Y., Shay-El, Y., Tanre, D., da Silva, A., Schubert, S., and Joseph, J. H.: Quantification of dust-forced heating of the lower troposphere, Nature, 395, 367–370, https://doi.org/10.1038/26456, 1998.
Atkinson, J. D., Murray, B. J., Woodhouse, M. T., Whale, T. F., Baustian, K. J., Carslaw, K. S., Dobbie, S., O'Sullivan, D., and Malkin, T. L.: The importance of feldspar for ice nucleation by mineral dust in mixed-phase clouds, Nature, 498, 355–358, https://doi.org/10.1038/nature12278, 2013.
Boucher, O., Randall, D., Artaxo, P., Bretherton, C., Feingold, G., Forster, P., Kerminen, V. M., Kondo, Y., Liao, H., Lohmann, U., Rasch, P., Satheesh, S. K., Sherwood, S., Stevens, B., and Zhang, X. Y.: Clouds and aerosols, in: Climate change 2013: the physical science basis. Contribution of Working Group I to the Fifth Assessment Report of the Intergovernmental Panel on Climate Change, edited by: Stocker, T. F., Qin, D., Plattner, G.-K., Tignor, M., Allen, S. K., Boschung, J., Nauels, A., Xia, Y., Bex, V., and Midgley, P. M., Cambridge University Press, Cambridge, UK, 571–657, https://doi.org/10.1017/CBO9781107415324.016, 2013.
Caldeira, K. and Matthews, H.D.: Transient climate-carbon simulations of planetary geoengineering, P. Natl. Acad. Sci. USA, 104, 9949–9954, https://doi.org/10.1073/pnas.0700419104, 2007.
Cao, J. J., Lee, S. C., Zhang, X. Y., Chow, J. C., An, Z. S., Ho, K. F., Watson, J. G., Fung, K., Wang, Y. Q., and Shen, Z. X.: Characterization of airborne carbonate over a site near Asian dust source regions during spring 2002 and its climatic and environmental significance, J. Geophys. Res., 110, D03203, https://doi.org/10.1029/2004JD005244, 2005.
Crutzen, P. J.: Albedo Enhancement by Stratospheric Sulfur Injections: A Contribution to Resolve a Policy Dilemma?, Clim. Change, 77, 211–219, https://doi.org/10.1007/s10584-006-9101-y, 2006.
de Sherbinin, A., Balk, D., Yager, K., Jaiteh, M., Pozzi, F., Giri, C., and Wannebo, A.: the Socioeconomic Data and Applications Center (SEDECA), CIESIN Columbia University [data set], https://sedac.ciesin.columbia.edu/ (last access: June 2023), 2023.
Dufresne, J.-L., Gautier, C., Ricchiazzi, P., and Fouquart, Y.: Longwave Scattering Effects of Mineral Aerosols, J. Atmos. Sci., 59, 1959–1966, https://doi.org/10.1175/1520-0469(2002)059<1959:lseoma>2.0.co;2, 2002.
Gasso, S., Grassian, V. H., and Miller, R. L.: Interactions between Mineral Dust, Climate, and Ocean Ecosystems, Elements, 6, 247–252, https://doi.org/10.2113/gselements.6.4.247, 2010.
Giles, J.: The dustiest place on Earth, Nature, 434, 816–819, https://doi.org/10.1038/434816a, 2005.
Ginoux, P., Prospero, J. M., Gill, T. E., Hsu, N. C., and Zhao, M.: Global-scale attribution of anthropogenic and natural dust sources and their emission rates based on MODIS Deep Blue aerosol products, Rev. Geophys., 50, RG3005, https://doi.org/10.1029/2012RG000388, 2012.
Giorgi, F., Coppola, E., Solmon, F., Mariotti, L., Sylla, M. B., Bi, X. Q., Elguindi, N., Diro, G. T., Nair, V., Giuliani, G., Turuncoglu, U. U., Cozzini, S., Güttler, I., O'Brien, T. A., Tawfik, A. B., Shalaby, A., Zakey, A. S., Steiner, A. L., Stordal, F., Sloan, L. C., and Brankovic, C.: RegCM4: model description and preliminary tests over multiple CORDEX domains, Clim. Res., 52, 7–29, https://doi.org/10.3354/cr01018, 2012.
Hillel, D.: Introduction to Soil Physics, Academic, San Diego, Calif., 353 pp., ISBN 978-0-08-091869-3, 0-12-348520-7, 1982.
Holland, M.: The great sea-ice dwindle. Nat. Geosci., 6, 10–11, https://doi.org/10.1038/ngeo1681, 2013.
Huneeus, N., Schulz, M., Balkanski, Y., Griesfeller, J., Prospero, J., Kinne, S., Bauer, S., Boucher, O., Chin, M., Dentener, F., Diehl, T., Easter, R., Fillmore, D., Ghan, S., Ginoux, P., Grini, A., Horowitz, L., Koch, D., Krol, M. C., Landing, W., Liu, X., Mahowald, N., Miller, R., Morcrette, J.-J., Myhre, G., Penner, J., Perlwitz, J., Stier, P., Takemura, T., and Zender, C. S.: Global dust model intercomparison in AeroCom phase I, Atmos. Chem. Phys., 11, 7781–7816, https://doi.org/10.5194/acp-11-7781-2011, 2011.
Hurrell, J. W., Holland, M. M., Gent, P. R., Ghan, S., Kay, J. E., Kushner, P. J., Lamarque, J.-F., Large, W. G., Lawrence, D., Lindsay, K., Lipscomb, W. H., Long, M. C., Mahowald, N., Marsh, D. R., Neale, R. B., Rasch, P., Vavrus, S., Vertenstein, M., Bader, D., Collins, W. D., Hack, J. J., Kiehl, J., and Marshall, S.: The Community Earth System Model: A framework for collaborative research, B. Am. Meteorol. Soc., 94, 1339–1360, https://doi.org/10.1175/BAMS-D-12-00121.1, 2013.
Ji, Z., Wang, G., Yu, M., and Pal, J. S.: Potential climate effect of mineral aerosols over West Africa: Part II – contribution of dust and land cover to future climate change, Clim. Dynam., 50, 2335–2353, https://doi.org/10.1007/s00382-015-2792-x, 2018.
Jickells, T. D.: Global Iron Connections Between Desert Dust, Ocean Biogeochemistry, and Climate, Science, 308, 67–71, https://doi.org/10.1126/science.1105959, 2005.
Karami, K.: Upper tropospheric Rossby wave packets: long-term trends and variability, Theor. Appl. Climatol., 138, 527–540, 2019.
Karami, K., Tilmes, S., Muri, H., and Mousavi, S. V.: Storm track changes in the Middle East and North Africa under stratospheric aerosol geoengineering, Geophys. Res. Lett., 47, e2020GL086954, https://doi.org/10.1029/2020GL086954, 2020.
Keith, D., Weisenstein, D., Vattioni, S., Feinberg, A., Peter, T., and Stenke, A. (2019): GeoMIP Test Bed Experiment: Injection of accumulation mode H2SO4 particles in chemistry-climate models, 2019 Fall Meeting, AGU, San Francisco, CA, 9–13 December, GC33G-1416, https://doi.org/10.1002/essoar.10501967.1, 2019.
Kok, J. F., Albani, S., Mahowald, N. M., and Ward, D. S.: An improved dust emission model – Part 2: Evaluation in the Community Earth System Model, with implications for the use of dust source functions, Atmos. Chem. Phys., 14, 13043–13061, https://doi.org/10.5194/acp-14-13043-2014, 2014.
Kok, J. F., Ridley, D. A., Zhou, Q., Miller, R. L., Zhao, C., Heald, C. L., Ward, D. S., Albani, S., and Haustein, K.: Smaller desert dust cooling effect estimated from analysis of dust size and abundance, Nat. Geosci., 10, 274–278, https://doi.org/10.1038/ngeo2912, 2017.
Kok, J. F., Ward, D. S., Mahowald, N. M., and Evan, A. T.: Global and regional importance of the direct dust-climate feedback, Nat. Commun., 9, 241, https://doi.org/10.1038/s41467-017-02620-y, 2018.
Kravitz, B., MacMartin, D. G., Mills, M. J., Richter, J. H., Tilmes, S., Lamarque, J.-F., Tribbia, J. J., and Vitt, F.: First Simulations of Designing Stratospheric Sulfate Aerosol Geoengineering to Meet Multiple Simultaneous Climate Objectives, J. Geophys. Res.-Atmos., 122, 12616–12634, https://doi.org/10.1002/2017jd026874, 2017.
Krinner, G., Boucher, O., and Balkanski, Y.: Ice-free glacial northern Asia due to dust deposition on snow, Clim. Dynam., 27, 613–625, https://doi.org/10.1007/s00382-006-0159-z, 2006.
Liu, J., Wu, D., Liu, G., Mao, R., Chen, S., Ji, M., Fu, P., Sun, Y., Pan, X., Jin, H., Zhou, Y., Wang, X..: Impact of Arctic amplification on declining spring dust events in East Asia, Clim. Dynam., 54, 1913–1935, https://doi.org/10.1007/s00382-019-05094-4, 2020.
Liu, X., Easter, R. C., Ghan, S. J., Zaveri, R., Rasch, P., Shi, X., Lamarque, J.-F., Gettelman, A., Morrison, H., Vitt, F., Conley, A., Park, S., Neale, R., Hannay, C., Ekman, A. M. L., Hess, P., Mahowald, N., Collins, W., Iacono, M. J., Bretherton, C. S., Flanner, M. G., and Mitchell, D.: Toward a minimal representation of aerosols in climate models: description and evaluation in the Community Atmosphere Model CAM5, Geosci. Model Dev., 5, 709–739, https://doi.org/10.5194/gmd-5-709-2012, 2012.
MacMartin, D. G., Wang, W., Kravitz, B., Tilmes, S., Richter, J. H., and Mills, M. J.: Timescale for detecting the climate response to stratospheric aerosol geoengineering, J. Geophys. Res.-Atmos., 124, 1233–1247, https://doi.org/10.1029/2018JD028906, 2019
Macnaghten, P. and Szerszynski, B.: Living the global social experiment: An analysis of public discourse on solar radiation management and its implications for governance, Global Environ. Change, 23, 465–474, https://doi.org/10.1016/j.gloenvcha.2012.12.008, 2013.
Mahowald, N., Kohfeld, K., Hansson, M., Balkanski, Y., Harrison, S. P., Printice, I. C., Schulz, M., and Rodhe, H.: Dust sources and deposition during the last glacial maximum and current climate: A comparison of model results with paleodata from ice cores and marine sediments, J. Geophys. Res., 104, 15895–15916, https://doi.org/10.1029/1999JD900084, 1999.
Mahowald, N., Albani, S., Kok, J. F., Engelstaeder, S., Scanza, R., Ward, D. S., and Flanner, M. G.: The size distribution of desert dust aerosols and its impact on the Earth system, Aeolian Res., 15, 53–71, https://doi.org/10.1016/j.aeolia.2013.09.002, 2014.
Mahowald, N. M. and Luo, C.: A less dusty future?, Geophys. Res. Lett., 30, 1903, https://doi.org/10.1029/2003GL017880, 2003.
Mahowald, N. M., Muhs, D. R., Levis, S., Rasch, P. J., Yoshioka, M., Zender, C. S., and C. Luo: Change in atmospheric mineral aerosols in response to climate: Last glacial period, preindustrial, modern, and doubled carbon dioxide climates, J. Geophys. Res., 111, D10202, https://doi.org/10.1029/2005JD006653, 2006.
Mahowald, N. M., Kloster, S., Engelstaedter, S., Moore, J. K., Mukhopadhyay, S., McConnell, J. R., Albani, S., Doney, S. C., Bhattacharya, A., Curran, M. A. J., Flanner, M. G., Hoffman, F. M., Lawrence, D. M., Lindsay, K., Mayewski, P. A., Neff, J., Rothenberg, D., Thomas, E., Thornton, P. E., and Zender, C. S.: Observed 20th century desert dust variability: impact on climate and biogeochemistry, Atmos. Chem. Phys., 10, 10875–10893, https://doi.org/10.5194/acp-10-10875-2010, 2010.
Marsh, D. R., Mills, M. J., Kinnison, D. E., Lamarque J.-F., Calvo N., and Polvani L. M.: Climate change from 1850 to 2005 simulated in CESM1(WACCM), J. Climate, 26, 7372–7391, https://doi.org/10.1175/JCLI-D-12-00558.1, 2013.
McClellan, J., Sisco, J., Suarez, B., and Keogh, G.: Geoengineering cost analysis. Final report, Aurora Flight Sciences Corporation, Cambridge, Massachusetts, 86 pp., UC01-001, AR10-182, 2010.
Middleton, N. J.: Desert dust hazards: A global review, Aeolian Res., 24, 53–63, https://doi.org/10.1016/j.aeolia.2016.12.001, 2017.
Millar, R. J., Fuglestvedt, J. S., Friedlingstein, P., Rogelj, J., Grubb, M. J., Matthews, H. D., Skeie, R. B., Forster, P. M., Frame, D. J., and Allen, M. R.: Emission budgets and pathways consistent with limiting warming to 1.5 ∘C, Nat. Geosci., 10, 741–747, https://doi.org/10.1038/ngeo3031, 2017.
Miller, J. N. and Miller, J. C..: Statistics and Chemometrics for Analytical Chemistry, Sixth edition, Pearson, 297 pp., ISBN 978-0-273-73042-2, 2010.
Mills, M. J., Schmidt, A., Easter, R., Solomon, S., Kinnison, D. E., Ghan, S. J., Neely, R. R., Marsh, D. R., Conley, A., Bardeen, Ch. G., and Gettelman, A.: Global volcanic aerosol properties derived from emissions, 1990–2014, using CESM1(WACCM), J. Geophys. Res. Atmos., 121, 2332–2348, https://doi.org/10.1002/2015JD024290, 2016.
Mills, M. J., Richter, J. H., Tilmes, S., Kravitz, B., MacMartin, D. G., Glanville, A. A., Tribbia, J. J., Lamarque, J. F., Vitt, F., Schmidt, A., Gettelman, A., Hannay, C., Bacmeister, J. T., and Kinnison, D. E.: Radiative and Chemical Response to Interactive Stratospheric Sulfate Aerosols in Fully Coupled CESM1(WACCM), J. Geophys. Res.-Atmos., 122, 13061–13078, https://doi.org/10.1002/2017JD027006, 2017.
Nicholson, S. E., Tucker, C. J., and Ba, M. B.: Desertification, drought, and surface vegetation: An example from the West African Sahel, B. Am. Meteorol. Soc., 79, 815–829, https://doi.org/10.1175/1520-0477(1998)079<0815:DDASVA>2.0.CO;2, 1998.
Nurse, P.: I hope we never need geoengineering, but we must research it. The Guardian 08 September, http://www.guardian.co.uk/environment/2011/sep/08/geoengineering-research-royal-society (last access: 9 February 2020), 2011.
Oleson, K., Lawrence, D. M., Bonan, G. B., Drewniak, B., Huang, M., Koven, C. D., Levis, S., Li, F., Riley, J. P., Subin, M. Ch., Swenson, S. C., Thornton, E., Bozbiyik, A., Fisher, R. A., Heald, L., Kluzek, E., Lamarque, J. F., Lawrence, J., Leung, R., Lipscomb, W. H., Muszala, P., Ricciuto, M., Sacks, J., Sun, Y., Tang, J., and Yang, Z. L.: Technical description of version 4.5 of the Community Land Model (CLM) (No. NCAR/TN-503+STR), https://doi.org/10.5065/D6RR1W7M, 2013.
Orlovsky, L., Orlovsky, N., and Durdyev, A.: Dust storms in Turkmenistan, J. Arid Environ, 60, 83–97, https://doi.org/10.1016/j.jaridenv.2004.02.008, 2005.
Painter, T. H., Flanner, M. G., Kaser, G., Marzeion, B., VanCuren, R. A., and Abdalati, W.: End of the Little Ice Age in the Alps forced by industrial black carbon, P. Natl. Acad. Sci. USA, 110, 15216–15221, https://doi.org/10.1073/pnas.1302570110, 2013.
Pasztor, J. and Turner, M.: Optimism and prudence in geoengineering governance, Carnegie Climate Geoengineering Governance Initiative, https://www.c2g2.net/optimism-vs-prudence-geo-governance (last access: September 2023), 2018.
Prospero, J. M.: Environmental characterization of global sources of atmospheric soil dust identified with the NIMBUS 7 Total Ozone Mapping Spectrometer (TOMS) absorbing aerosol product, Rev. Geophys., 40, 1002, https://doi.org/10.1029/2000rg000095, 2002.
Rasch, P. J., Tilmes, S., Turco, R., Robock, A., Oman, L., Chen, C.-C., Stenchikov, G., and Garcia, R.: An overview of geoengineering of climate using stratospheric sulphate aerosols, Phil. Trans. R. Soc. A, 366, 4007–4037, https://doi.org/10.1098/rsta.2008.0131, 2008.
Raupach, M. R.: Simplified expressions for vegetation roughness length and zero-plane displacement as functions of canopy height and area index, Bound.-Lay. Meteorol., 71, 211–216, https://doi.org/10.1007/BF00709229, 1994.
Robock, A.: 20 reasons why geoengineering may be a bad idea, Bull. At. Sci., 64, 14–18, https://doi.org/10.2968/064002006, 2008.
Rozenberg, J., Davis, S. J., Narloch, U., and Hallegatte, S.: Climate constraints on the carbon intensity of economic growth, Environ. Res. Lett., 10, 095006, https://doi.org/10.1088/1748-9326/10/9/095006, 2015.
Sagoo, N. and Storelvmo, T.: Testing the sensitivity of past climates to the indirect effects of dust, Geophys. Res. Lett, 44, 5807–5817, https://doi.org/10.1002/2017gl072584, 2017.
Sanderson, M.-B., O'Neill, B., and Tebaldi, B.: What would it take to achieve the Paris temperature targets?, Geophys. Res. Lett, 43, 7133–7142, https://doi.org/10.1002/2016GL069563, 2016.
Sarangi, C., Qian, Y., Rittger, K., Leung, L. R., Chand, D., Bormann, K. J., and Painter, T. H.: Dust dominates high-altitude snow darkening and melt over high-mountain Asia, Nat. Clim. Change, 10, 1045–1051, https://doi.org/10.1038/s41558-020-00909-3, 2020.
Seneviratne, S. I., Corti, T., Davin, E. L., Hirschi, M., Jaeger, E. B., Lehner, I., Orlowsky, B., and Teuling, A. J.: Investigating soil moisture–climate interactions in a changing climate: A review, Earth-Sci. Rev., 99, 125–161, https://doi.org/10.1016/j.earscirev.2010.02.004, 2010.
Simpson, I. R., Tilmes, S., Richter, J. H., Kravitz, B., MacMartin, D. G., Mills, M. J., Fasullo, J. T., and Pendergrass, A. G.: The regional hydroclimate response to stratospheric sulfate geoengineering and the role of stratospheric heating, J. Geophys. Res.-Atmos., 124, 12587–12616, https://doi.org/10.1029/2019jd031093, 2019.
Sternberg, T. and Edwards, M.: Desert Dust and Health: A Central Asian Review and Steppe Case Study, IJERPH, 14, 1342 https://doi.org/10.3390/ijerph14111342, 2017.
Tegen, I. and Fung, I.: Modeling of mineral dust in the atmosphere: Sources, transport, and optical thickness, J. Geophys. Res.-Atmos., 99, 22897–22914, https://doi.org/10.1029/94JD01928, 1994.
Tegen, I., Harrison, S. P., Kohfeld, K., Prentice, I. C., Coe, M., and Heimann, M.: Impact of vegetation and preferential source areas on global dust aerosol: results from a model study, J. Geophys. Res., 107, 1–36, 4576, https://doi.org/10.1029/2001JD000963, 2002.
Tegen, I., Werner, M., Harrison, S. P., and Kohfeld, K. E.: Relative importance of climate and land use in determining present and future global soil dust emission, Geophys. Res. Lett., 31, L05105, https://doi.org/10.1029/2003GL019216, 2004.
Textor, C., Schulz, M., Guibert, S., Kinne, S., Balkanski, Y., Bauer, S., Berntsen, T., Berglen, T., Boucher, O., Chin, M., Dentener, F., Diehl, T., Easter, R., Feichter, H., Fillmore, D., Ghan, S., Ginoux, P., Gong, S., Grini, A., Hendricks, J., Horowitz, L., Huang, P., Isaksen, I., Iversen, I., Kloster, S., Koch, D., Kirkevåg, A., Kristjansson, J. E., Krol, M., Lauer, A., Lamarque, J. F., Liu, X., Montanaro, V., Myhre, G., Penner, J., Pitari, G., Reddy, S., Seland, Ø., Stier, P., Takemura, T., and Tie, X.: Analysis and quantification of the diversities of aerosol life cycles within AeroCom, Atmos. Chem. Phys., 6, 1777–1813, https://doi.org/10.5194/acp-6-1777-2006, 2006.
Tilmes, S., Richter, J. H., Kravitz, B., MacMartin, D. G., Mills, M. J., Simpson, I. R., Glanville, A. S., Fasullo, J. T., Phillips, A. S., Lamarque, J.-F., Tribbia, J., Edwards, J., Mickelson, S., and Ghosh, S.: CESMI (WACCM) stratospheric aerosol geoengineering large ensemble project, B. Am. Meteorol. Soc., 99, 2361–2371, https://doi.org/10.1175/bams-d-17-0267.1, 2018.
Tilmes, S., Richter, J. H., Mills, M., Kravitz, B., and MacMartin, D. G.: Stratospheric Aerosol Geoengineering Large Ensemble Project – GLENS, UCAR [data set], https://www.cesm.ucar.edu/projects/community-projects/GLENS/ (last access: September 2023), 2023a.
Tilmes, S., Richter, J. H., Kravitz, B., MacMartin, D. G., Mills, M. J., Simpson, I. R., Glanville, A. S., Fasullo, J. T., Phillips, A. S., Lamarque, J.-F., Tribbia, J., Edwards, J., Mickelson, S., and Ghosh, S.: Stratospheric Aerosol Geoengineering Large Ensemble project (GLENS), NCAR [data set], https://doi.org/10.5065/D6JH3JXX, 2023b.
Ueyama, M., Ichii, K., Kobayashi, H., Kumagai, T., Beringer, J., Merbold, L., Euskirchen, E. S., Hirano, T., Marchesini, L. B., Baldocchi, D., Saitoh, T. M., Mizoguchi, Y., Ono, K., Kim, J., Varlagin, A., Kang, M., Shimizu, T., Kosugi, Y., Bret-Harte, M. S., Machimura, T., Matsuura, Y., Ohta, T., Takagi, K., Takanashi, S., Yasuda, Y.: Inferring CO2 fertilization effect based on global monitoring land-atmosphere exchange with a theoretical model, Environ. Res. Lett., 15, 084009, https://doi.org/10.1088/1748-9326/ab79e5, 2020.
Vattioni, S., Weisenstein, D., Keith, D., Feinberg, A., Peter, T., and Stenke, A.: Exploring accumulation-mode H2SO4 versus SO2 stratospheric sulfate geoengineering in a sectional aerosol–chemistry–climate model, Atmos. Chem. Phys., 19, 4877–4897, https://doi.org/10.5194/acp-19-4877-2019, 2019.
Visioni, D., MacMartin, D. G., Kravitz, B., Richter, J. H., Tilmes, S., and Mills, M. J., Seasonally modulated stratospheric aerosol geoengineering alters the climate outcomes, Geophys. Res. Lett., 47, e2020GL088337, https://doi.org/10.1029/2020GL088337, 2020.
Wang, F., Zhao, X., Gerlein-Safdi, C., Mu, Y., Wang, D., and Lu, Q.: Global sources, emissions, transport and deposition of dust and sand and their effects on the climate and environment: a review Front, Environ. Sci. Eng., 11, 13, https://doi.org/10.1007/s11783-017-0904-z, 2017
WMO and UNEP: Establishing a WMO sand and dust storm warning advisory and assessment system regional node for West Asia: current capabilities and needs, in: WMO Technical Report, 1121, 18 pp., https://doi.org/10.25607/OBP-1569, 2013.
Woodward, S., Roberts, D. L., and Betts, R. A.: A simulation of the effect of climate change-induced desertification on mineral dust aerosol, Geophys. Res. Lett., 32, 18, https://doi.org/10.1029/2005gl023482, 2005.
Wu, C., Lin, Z., and Liu, X.: The global dust cycle and uncertainty in CMIP5 (Coupled Model Intercomparison Project phase 5) models, Atmos. Chem. Phys., 20, 10401–10425, https://doi.org/10.5194/acp-20-10401-2020, 2020.
Yue, X., Wang, H., Liao, H., and Fan, K.: Simulation of dust aerosol radiative feedback using the GMOD: 2, Dust-climate interactions, J. Geophys. Res., 115, D04201, https://doi.org/10.1029/2009jd012063, 2010.
Žagar, N., Zaplotnik, Z., Karami, K.: Atmospheric Subseasonal Variability and Circulation Regimes: Spectra, Trends, and Uncertainties, J. Climate, 33, 9375–9390, https://doi.org/10.1175/JCLI-D-20-0225.1, 2020.
Zender, C. S., Bian, H., and Newman, D.: Mineral dust entrainment and deposition (DEAD) model: Description and 1990s dust climatology, J. Geophys. Res., 108, 4416, https://doi.org/10.1029/2002JD002775, 2003.