the Creative Commons Attribution 4.0 License.
the Creative Commons Attribution 4.0 License.
 | 21 Jan 2022
Extension of the AIOMFAC model by iodine and carbonate species: applications for aerosol acidity and cloud droplet activation
Liviana Klein
Ulrich K. Krieger
Alison Bain
Brandon J. Wallace
Thomas C. Preston
Iodine and carbonate species are important components in marine and dust aerosols, respectively. The non-ideal interactions between these species and other inorganic and organic compounds within aqueous particle phases affect hygroscopicity, acidity, and gas–particle partitioning of semivolatile components. In this work, we present an extended version of the Aerosol Inorganic–Organic Mixtures Functional groups Activity Coefficients (AIOMFAC) model by incorporating the ions I−, , , , OH−, and CO2(aq) as new species. First, AIOMFAC ion interaction parameters for aqueous solutions were determined based on available thermodynamic data, such as water activity, mean molal activity coefficients, solubility, and vapor–liquid equilibrium measurements. Second, the interaction parameters for the new ions and various organic functional groups were optimized based on experimental data or, where data are scarce, alternative estimation methods such as multiple linear regression or a simple substitution by analogy approach. Additional bulk water activity and electrodynamic balance measurements were carried out to augment the database for the AIOMFAC parameter fit. While not optimal, we show that the use of alternative parameter estimation methods enables physically sound predictions and offers the benefit of a more broadly applicable model. Our implementation of the aqueous carbonate–bicarbonate–CO2(aq) system accounts for the associated temperature-dependent dissociation equilibria explicitly and enables closed- or open-system computations with respect to carbon dioxide equilibration with the gas phase. We discuss different numerical approaches for solving the coupled equilibrium conditions and highlight critical considerations when extremely acidic or basic mixtures are encountered.
The fitted AIOMFAC model performance for inorganic aqueous systems is considered excellent over the whole range of mixture compositions where reference data are available. Moreover, the model provides physically meaningful predictions of water activity under highly concentrated conditions. For organic–inorganic mixtures involving new species, the model–measurement agreement is found to be good in most cases, especially at equilibrium relative humidities above ∼ 70 %; reasons for deviations are discussed. Several applications of the extended model are shown and discussed, including the effects of ignoring the auto-dissociation of water in carbonate systems, the effects of mixing bisulfate and bicarbonate compounds in closed- or open-system scenarios on pH and solution speciation, and the prediction of critical cloud condensation nucleus activation of NaI or Na2CO3 particles mixed with suberic acid.
- Article
(7352 KB) - Full-text XML
-
Supplement
(1277 KB) - BibTeX
- EndNote


Atmospheric aerosols constitute a wide range of organic compounds, inorganic salts or acids, and water (e.g., Murphy and Thomson, 1997; Lee et al., 2002; Zhang et al., 2007). The semivolatile organics or electrolytes cause gas–particle partitioning which affects the physical state of the condensed phase. The presence of dissolved and/or solid phases of inorganic salts/acids (i.e., electrolytes) and their interplay with organic compounds may lead to a polar aqueous phase and a less polar organic phase (Marcolli and Krieger, 2006). For industrial applications, inorganic salts are often chosen as purifying agents between organic compounds and water. In tropospheric aerosol particles, non-ideal interaction between electrolytes and organics may result in complex aerosol morphologies such as liquid–liquid phase separation shown by various experiments (Smith et al., 2011; Bertram et al., 2011; Song et al., 2012; Veghte et al., 2013; Altaf and Freedman, 2017; Gorkowski et al., 2017; Huang et al., 2021) and modeling results (Zuend et al., 2010; Renbaum-Wolff et al., 2016; Ovadnevaite et al., 2017; Rastak et al., 2017; Pye et al., 2018). To understand the non-ideal mixing of a wide range of inorganic and organic aerosol constituents, reliable thermodynamic models have to be developed.
Historically, a Pitzer-based approach has been shown to describe the thermodynamics in aqueous electrolyte solutions very well up to high ionic strength (i.e., 10 mol kg−1) (Pitzer, 1991; Clegg et al., 1998a, b; Zuend et al., 2008). Substance-specific UNIQUAC (universal quasichemical) (Abrams and Prausnitz, 1975) or the group-contribution version UNIFAC (UNIQUAC functional group activity coefficients) (Fredenslund et al., 1975) is widely used in characterizing non-ideal mixing in aqueous organic systems. LIQUAC (Li et al., 1994) and its group-contribution version LIFAC (Yan et al., 1999) use a combination of a Pitzer ion interaction model and UNIQUAC/UNIFAC to describe the thermodynamics of mixing in systems containing aqueous electrolytes and organic compounds. Since UNIQUAC/UNIFAC and LIFAC were originally developed for chemical engineering purposes, the selection of organic compounds and the temperature range of interest differ from those of relevance for atmospheric aerosols. Based on LIFAC, a thermodynamic model AIOMFAC (Aerosol Inorganic–Organic Mixtures Functional groups Activity Coefficients) has been developed to describe non-ideal mixing in atmospheric aerosols (Zuend et al., 2008, 2011). In this study, an extension of AIOMFAC is presented with interactions of newly introduced cations ↔ anions and ions ↔ organic main groups. Hereafter, we use the symbol ↔ to denote an interaction between two species (it does not refer to resonance structures). The extension focuses on the inclusion of iodine, carbonate electrolytes, and the associated equilibria in water and organic compound mixtures due to these species' relevance in specific environments such as the marine boundary layer or specific atmospheric condensed phases such as cloud water.
The abundance of iodine species in atmospheric aerosols is generally very small in the range from < 0.1 to approximately 20 ng m−3 (Saiz-Lopez et al., 2012). It is well established that the oceans are the dominant aerosol iodine source based on direct aerosol iodine concentration measurements in different coastal and marine locations (Saiz-Lopez et al., 2012). High elemental iodine-to-chlorine () or iodine-to-sodium () ratios in aerosol particles in the marine atmospheric boundary layer compared to those ratios in seawater are strong evidence of oceans as the main source of iodine as well (Duce et al., 1967; Baker et al., 2000). The observed enrichment of iodine in marine particulate matter is likely the result of the material exchange between volatile iodine species such as I2 in the gas phase and marine aerosols. Also, the bubble bursting process of sea spray aerosol formation can contribute to iodine species in the aerosol phase (Seto and Duce, 1972). Both inorganic and organic iodine (e.g., ) contribute to total iodine in the aerosol phase; although, which form dominates may vary and is at present unclear. Dissolved iodide (I−) and iodate () are considered the most important inorganic forms in the aqueous phase (Saiz-Lopez et al., 2012). From measurements across various sites, the ratio between I− and is highly variable in different marine rainwater and aerosol samples (Saiz-Lopez et al., 2012). To date, no clear chemical pathway has been proposed to explain this variability. Although, the low ratio between and I−, especially in fine aerosols, may be partially attributed to inorganic reactions in an acidic medium or the production of I− through HOI reaction with dissolved organic matter (Pechtl et al., 2007). Other studies have shown that insoluble iodine also constitutes a significant fraction of marine aerosols (Tsukada et al., 1987; Baker et al., 2000; Xu et al., 2010; Gilfedder et al., 2010). It is likely that part of the insoluble portion is in the form of organic species (Baker et al., 2000) or as material adsorbed to mineral or black carbon surfaces (Gilfedder et al., 2010). Moreover, there is increased interest in the iodine chemistry in the Arctic as iodine species are involved in ozone depletion and new particle formation (NPF) events (Allan et al., 2015; Raso et al., 2017; Dall´Osto et al., 2018; Baccarini et al., 2020). Different iodine species like , IO, and I2 have been detected in the Arctic marine boundary layer. Among them, gaseous iodic acid (HIO3) has been identified as the primary driver for NPF events in the central Arctic Ocean during summer and fall seasons (Baccarini et al., 2020). Such events can potentially influence the number concentration and hygroscopicities of cloud condensation nuclei (CCN) and the cloud microphysical properties in the region. Since the CCN number concentration is typically limited in the Arctic, the cloud radiative effect is extremely sensitive to any perturbation in NPF events. Thus, a better understanding of the iodine chemistry would better constrain the Arctic cloud radiative forcing. In addition, Koenig et al. (2020) have managed to quantitatively detect the presence of iodine in the stratosphere. Previously, Kim et al. (2016) investigated the thermodynamic properties in a number of alkali halide aqueous solutions including some iodide salts using a modified UNIFAC method. Other groups like Al-Sahhaf and Jabbar (1993) and Iliuta and Thyrion (1995) only studied the specific UNIQUAC interaction parameters in organic solvent + iodide salts of their interest. Through the addition of I− in AIOMFAC, we provide a first step to describing and exploring the thermodynamics in different mixtures of water + organics + iodide electrolytes in marine aerosols. Currently, no attempts have been made on the inclusion of ion in any thermodynamic models due to the limited availability of experimental data in aqueous iodate salts. For the same reason, only a selection of species have been included in AIOMFAC based on experimental data at the moment as further discussed in Sect. 3.1.
Dust storms have various environmental impacts and are important sources of tropospheric aerosols (e.g., Sviridenkov et al., 1993; Gomes and Gillette, 1993). The arid and semi-arid regions of Asia and North America plus the Sahara desert are the three major sources of mineral dust in the Northern Hemisphere (Gomes and Gillette, 1993). Field measurements have reported that rich alkaline elements mainly in the form of carbonate species like CaCO3, MgCO3, and K2CO3 are present in collected aerosol samples (Gillette et al., 1992; Andronova et al., 1993; Gomes and Gillette, 1993). Interestingly, the alkalinity of Sahara dust may also contribute to the relatively high concentration of in mineral dust aerosols (Baker, 2004, 2005; Allan et al., 2009). The dust originating from the Sahara desert can be lofted and transported over large distances, with impacts on clouds and precipitation far away from the source, such as on precipitation events in Europe (Loÿe-Pilot et al., 1986). On the local scale, construction sites and vehicular movement can be major contributors to carbonate-containing airborne dust particles (Clarke and Karani, 1992). Due to the various chemical equilibria involving carbonate species in solid or aqueous aerosol phases, the capacity of carbonate salts to neutralize acidity affects atmospheric chemical reactions and, via deposition, surface ocean alkalinity. For example, the heterogeneous conversion process of sulfur and nitrogen oxides to particulate sulfate and nitrate is facilitated by the presence of carbonate (Dentener et al., 1996). Additionally, dust aerosols affect the global radiation budget by absorbing or scattering solar and terrestrial radiation (Tegen et al., 1996).
In previous work, Harvie et al. (1984) and Wexler and Clegg (2002) developed a section of the thermodynamic model E-AIM covering aqueous carbonate species (, , CO2(aq)) and a set of other important ions (e.g., Na+, K+, , ), based on the Pitzer ion interaction approach. Another gas–aerosol equilibrium model, SCAPE 2 (Meng et al., 1995), has been developed using the Kusik–Meissner method (Kusik and Meissner, 1978), the Pitzer ion interaction approach, and the Zdanovskii–Stokes–Robinson (ZSR) method (Zdanovskii, 1948; Stokes and Robinson, 1966). In addition to carbonates, crustal species like K+, Mg2+, and Ca2+ have been also included in SCAPE 2. To date, only a few groups (e.g., Xie et al., 2018; Fu et al., 2019) have investigated the liquid–liquid equilibrium thermodynamics of systems composed of a carbonate salt + water + organic; also, the organic compound selection in previous work was limited to specific systems of interest in chemical purification processes. By adding carbonates to AIOMFAC, the model allows the description of multi-ion aqueous organic–inorganic systems and acidity effects of , , and dissolved carbon dioxide (CO2(aq)). A further motivation for including the outlined new inorganic species in the AIOMFAC model is to enable model–measurement comparisons, including recent cloud condensation nuclei (CCN) activation experiments by Davies et al. (2019). Such model applications are discussed in Sect. 5.2.
2.1 AIOMFAC model framework
The degree of non-ideality in a multicomponent system is represented by the activity coefficients of all components within the system's (liquid) phases. To describe the concentration of each constituent in a system, mole fraction, , is often used. Here, nj is the molar amount of species j, the summation index s covers all non-ion (“solvent”) components, and i covers inorganic ions; therefore, this definition of mole fraction is with respect to partially or completely dissociated ions (in other cases the definition may differ). For ions, concentration is often expressed in terms of molality (moles of ion i per unit mass of solvent or solvent mixture), , with Ms (kg mol−1) being the molar mass of compound s. Within AIOMFAC, molality is defined on the basis of the solvent mixture (water and organic compounds). In AIOMFAC, water and organic compound activities are defined on a mole fraction basis (as denoted here by superscript (x)), a typical choice for non-ionic species. In contrast, ion activity and activity coefficient are defined on a molality basis (superscript (m)), with pure water as the reference solvent. For simplicity of notation, these superscripts will be omitted hereafter. In experiments, it is impossible to determine the activity coefficient of a single ion. Hence, the mean molal activity coefficient (γ±) of an electrolyte is used instead:
where v+ and v− are the stoichiometric numbers of the charge-balanced electrolyte's cations (+) and anions (−), respectively. In the case of aqueous CO2(aq), unlike other non-electrolytes, its activity coefficient is also defined on a molality basis within our AIOMFAC extension, as described in Sect. 3.2.1.
The deviation from mixing ideality within a thermodynamic system is characterized by the Gibbs excess energy (Gex), from which expressions for activity coefficients can be derived. In AIOMFAC, Gex is composed of long-range (LR), middle-range (MR), and short-range (SR) contributions effectively accounting for the various Coulombic and van der Waals interactions among solution species. The hydrated relative group volume and the relative surface area parameters used in the short-range part describing the physical properties of the newly introduced ions are listed in Table 1. The theoretical framework of the AIOMFAC model has been discussed in detail in prior work (Zuend et al., 2008, 2011). In the following, we focus on selected model expressions of relevance for the implementation and parameterization of the new species, which mainly concerns the middle-range contributions and associated interactions among water, organic main groups, and inorganic ions. The middle-range contribution to Gex in a mixture of n moles of main groups k and of ions i is (Zuend et al., 2008)
Table 1Physical properties of the new ions introduced in the study.
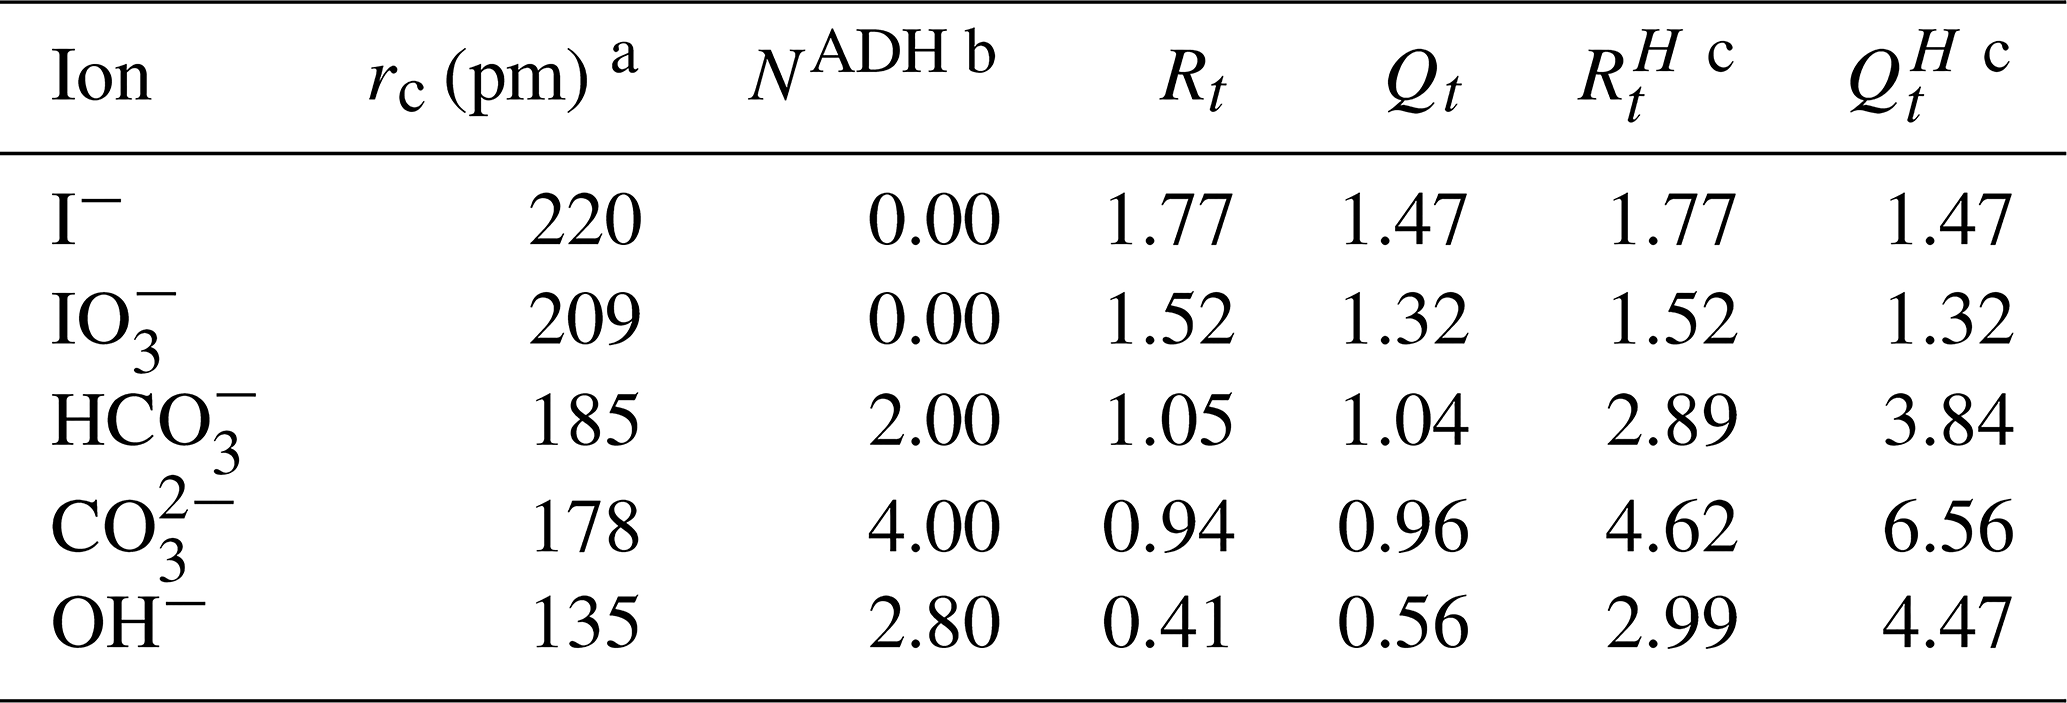
a The unhydrated radius of OH− is taken from Kiriukhin and Collins (2002), while the other radii are from Marcus (1994). b The apparent dynamic hydration number (NADH) of OH− is taken from Kiriukhin and Collins (2002) with and from Marcus (1994). c Detailed description of the calculation process was discussed in Zuend et al. (2008).
Here, the subscripts c and a stand for cations and anions, respectively, and I (mol kg−1) is the molal ionic strength of the phase. Bk,i(I) represents ionic-strength-dependent functions describing interactions among (solvent) main groups and ions. Bc,a(I) and Cc,a(I) are parameters accounting for interactions among specific cation–anion pairs in aqueous solution. and were introduced to account for binary cation–cation or ternary cation–cation–anion interactions in the presence of , H+ or , H+, specifically. Without those additional interaction terms considered, the AIOMFAC model would be unable to match measured aw and dissociation degree data at low water contents; see discussion in Zuend et al. (2008). In the case of other systems, explicit consideration of such interactions, while present, is considered unnecessary. Since the reference solvent (for ions) in AIOMFAC is water, the Bk,i contributions are defined to be zero for all water–ion interactions. The first three ionic-strength-dependent functions in Eq. (2) are parameterized by a functional form typical for Pitzer-like models (Zuend et al., 2008):
with b and c being adjustable AIOMFAC parameters. The parameters are always kept as 1.2 , while are set to 0.8 by default and only changed in a few cases to achieve better agreement between the model and experimental data. All binary MR interaction functions are symmetric, i.e., . Introduction of new ions or organic functional groups into the AIOMFAC model requires the determination of the relevant parameters from Eqs. (3)–(5), usually via a AIOMFAC model fit to adequate experimental data.
2.2 Objective function
To obtain the relevant parameters, an objective function is derived to allow the direct comparison between experimental data and model calculations. The objective function, subject to minimization during the simultaneous fitting process concerning parameters for either a cation–anion pair or ion–organic main group, is
Here, u is a specific data point in the dataset d of assigned weight wd,u. and are model predicted and experimentally determined thermodynamic quantities accordingly. is the tolerance quantity, which represents the estimated model sensitivity for the targeted quantity, as described by Zuend et al. (2011). During the fitting process, an additional constraint is applied on the resulting model curve of water activity. Consequently, the water activity is forced to decrease monotonically with increasing ionic strength for reasonable extrapolation at supersaturation conditions. The treatment of different data types and associated constraints is discussed in Zuend et al. (2011), and those procedures were also adopted for this study.
As described previously by Zuend et al. (2008, 2011), all the inorganic salts and acids are assumed to dissociate completely into ions in the liquid mixture, except for the diprotic sulfuric and carbonic acids and related bisulfate/bicarbonate salts. The relevant equilibria and dissociation steps concerning sulfuric and carbonic acids are dealt with explicitly. We note that in reality some degree of ion association (such as temporary or permanent ion pairs in aqueous solutions) is likely present, especially in solutions of higher electrolyte concentrations. In the AIOMFAC approach, such ion association effects are implicitly factored (fitted) into the activity coefficients of the solvents and solutes.
3.1 Inorganic iodine system
3.1.1 Data sources
For the mixture of inorganic iodide (I−) salts or acids with water, a large number of data sources are available covering the water activity and mean molal activity coefficient of the ions from low to high ionic strength. In contrast, only very few datasets are available for iodate () electrolytes, and most of them cover only the very dilute aqueous concentration range (i.e., 0.3 mol kg−1). Some ternary solubility data for relatively low molalities in solutions dominated by other salts (of total ionic strength 3 mol kg−1) are also present. To validate and complement the existing iodate data sources, we performed our own bulk water activity measurements for binary aqueous NaIO3, KIO3, and HIO3 solutions, as well as aqueous solutions of a selection of ternary salt mixtures, which are tabulated in Sect. S5 in the Supplement. Table 2 lists the aqueous iodide or iodate electrolytes, data types, and references that were used in fitting associated AIOMFAC parameters. Most of the experiments were conducted at room temperature, i.e., around 298.15 ± 5 K. Since activity coefficients (and activities) are weak functions of temperature, the exact temperature of the experiment is not critical for determining AIOMFAC parameters. The initial weightings of the datasets for the fitting process were set to unity unless otherwise specified (see footnote in Table 2).
Gregoriou et al. (1979)Hamer and Wu (1972)Harned (1929)Pan (1981)Robinson (1935)Robinson and Stokes (1949)Zaytsev and Aseyev (1992)Hamer and Wu (1972)Pan (1981)Robinson and Stokes (1949)Gelbach (1933)Hamer and Wu (1972)Harned (1929)Pan (1981)Partanen (2010)Pearce and Nelson (1932)Robinson (1935)Robinson and Stokes (1949)Robinson et al. (1940)Zaytsev and Aseyev (1992)Hamer and Wu (1972)Pan (1981)Partanen (2010)Pearce and Nelson (1932)Robinson and Stokes (1949)Hamer and Wu (1972)Harned (1929)Hetzer et al. (1964)Kielland (1937)Pan (1981)Robinson and Stokes (1949)Hamer and Wu (1972)Harned (1929)Pan (1981)Robinson and Stokes (1949)Bonner (1976)Robinson and Stokes (1949)Zaytsev and Aseyev (1992)Revie and Uhlig (2008)Bonner (1976)Hamer and Wu (1972)Pan (1981)Robinson and Sinclair (1934)Robinson and Stokes (1949)Hamer and Wu (1972)Pan (1981)Patil et al. (1990)Robinson and Stokes (1949)Goldberg and Nuttall (1978)Mullin (2001)Robinson and Harned (1941)Robinson et al. (1940)Stokes (1948)Zaytsev and Aseyev (1992)Goldberg and Nuttall (1978)Robinson et al. (1940)Goldberg and Nuttall (1978)Mullin (2001)Stokes (1948)Zaytsev and Aseyev (1992)Goldberg and Nuttall (1978)Stokes (1948)Durig et al. (1965)Durig et al. (1965)Bonner and Prichard (1979)Bonner and Prichard (1979)Apelblat and Korin (1998)Bonner and Prichard (1979)Bonner and Prichard (1979)Abel et al. (1934)Pethybridge and Prue (1967)Durig et al. (1965)Goldman et al. (1974)Durig et al. (1965)Goldman et al. (1974)Kumar et al. (2010)Murray et al. (2012)Ricci (1934)Ricci (1934)Ricci (1937)Hill and Ricci (1931)Hill and Ricci (1931)Table 2Experiment temperature (T), data type, molal ionic strength (I) range, number of points (Nd), and references for data used to fit the MR interaction parameters of cation–anion pairs in aqueous iodide or iodate systems.
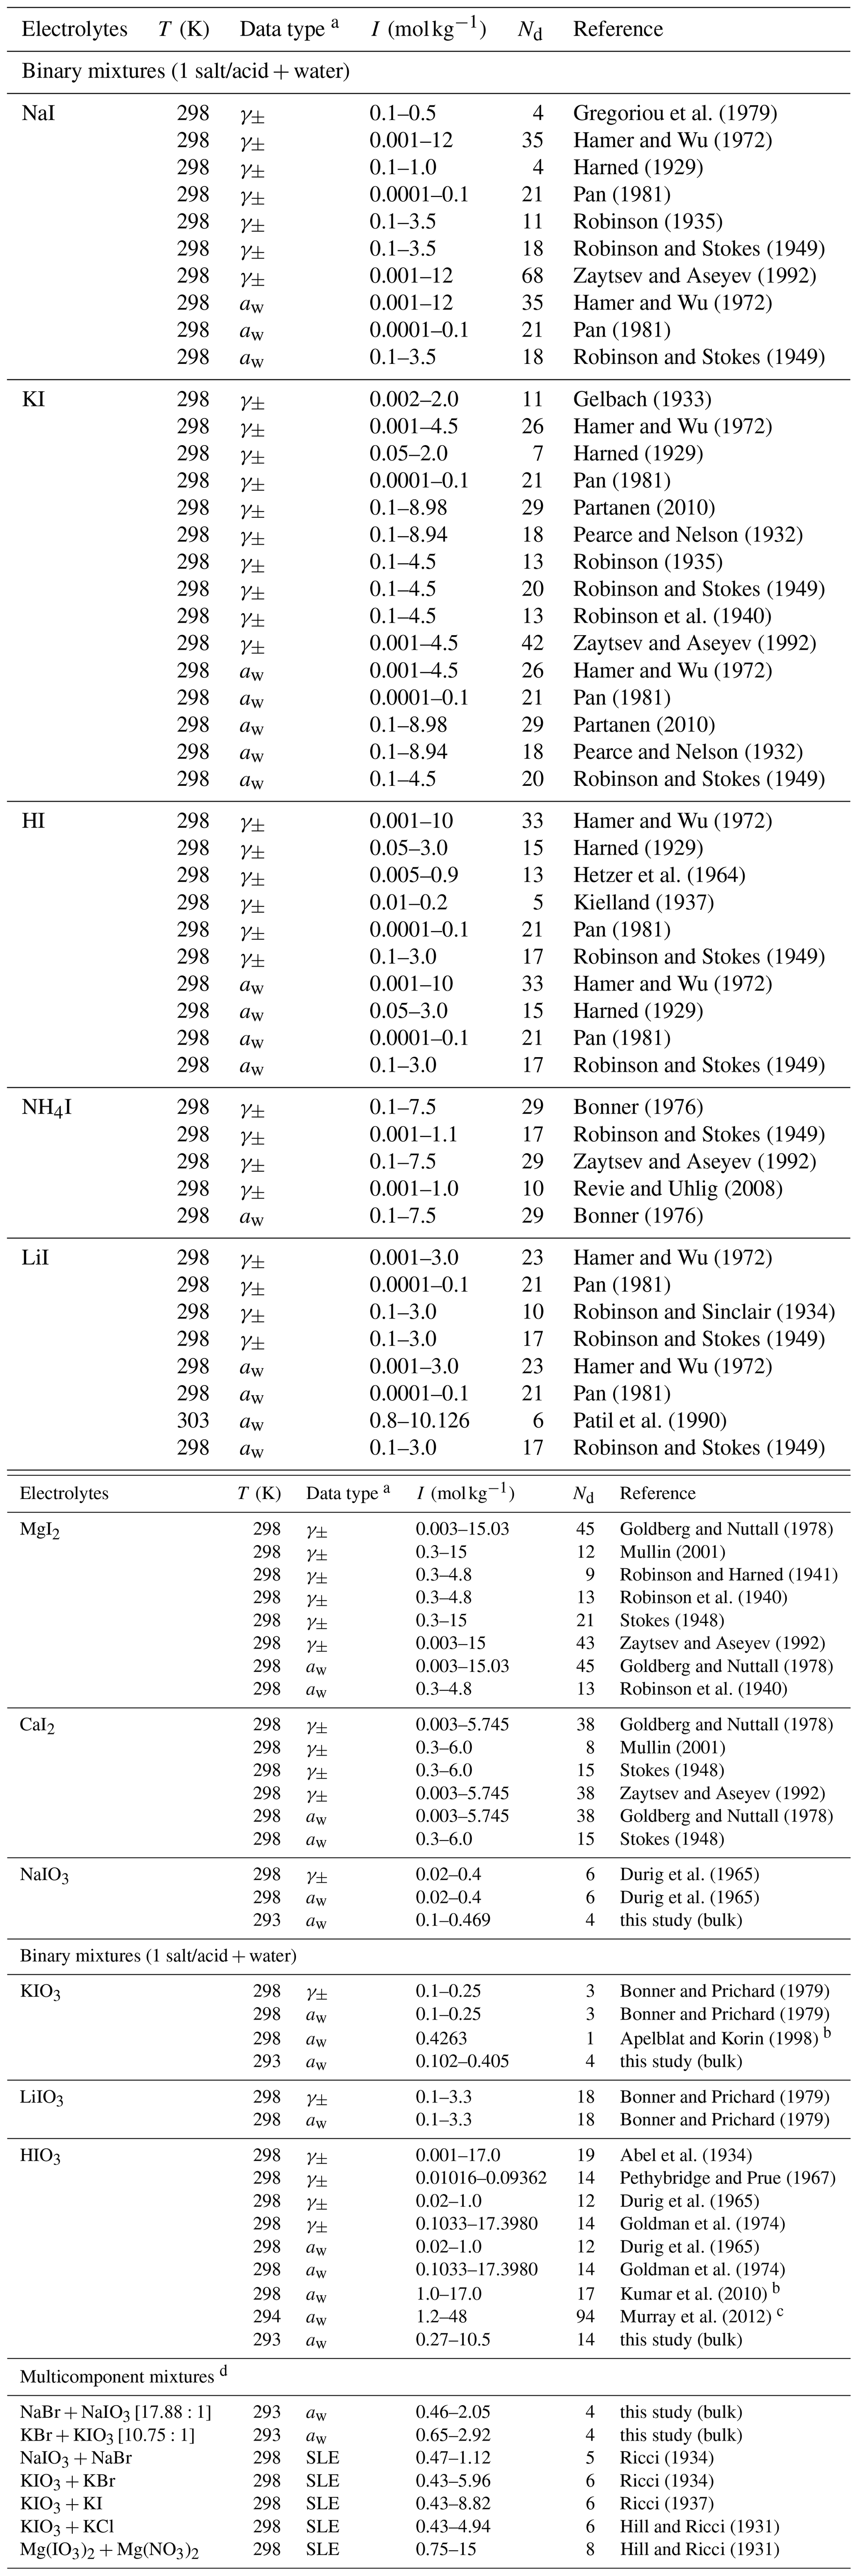
a Water activity (aw) data were calculated from osmotic coefficients or vapor pressure if not provided by the reference. b The weighting is set to zero for the fitting of model parameters due to large disagreement with our own measurement. c The weighting is reduced for the fitting of model parameters due to its composition calibration to that from Kumar et al. (2010). d Stated in the brackets are the corresponding molar ratios of the salt mixtures.
In terms of organic compounds and their interaction with iodides, several groups (e.g., Nasehzadeh et al., 2004; Mato and Cocero, 1988) have investigated the mixing thermodynamics of inorganic iodide salts and alcohols. After the initial data comparison, we decided to dismiss the data reported by Yamamoto et al. (1997), since their vapor–liquid equilibrium (VLE) composition data contain some ambiguity and show significant deviation from other measurements. Measurements covering carboxylic acids are scarce; we found only data on the hygroscopicity of internally mixed NaI + succinic acid particles by Miñambres et al. (2011). By comparing some of their binary salt + water experimental mass growth factor data to our AIOMFAC predictions (considered to be accurate and well determined by other data), it is evident that there are unexplained deviations in their reported mass growth factors. Therefore, we performed several sets of bulk or electrodynamic balance (EDB) water activity measurements for systems composed of sodium iodide, water, and different carboxylic acids, with the associated measurement data tabulated in Sect. S5 in the Supplement. In our EDB measurement on water + citric acid + NaI particles, when the RH was decreased to below 40 %, complete equilibration of the droplet with the gas phase inside the EDB trap may have been substantially impeded due to the high viscosity of citric acid at low water contents. Hence, only data for RH > 40 % were considered for the AIOMFAC fit.
Safarov (2005)Nasehzadeh et al. (2004)Zafarani-Moattar and Jahanbin-Sardroodi (1999)Mato and Cocero (1988)Barthel and Lauermann (1986)Pawar et al. (2012)Kacperska (1994)Pawar et al. (2012)Yang et al. (2004)Yang et al. (2004)Zhuo et al. (2008)Burns and Furter (1979)Sun (1996)Chen and Zhang (2003)Chen and Zhang (2003)Yin et al. (2018)Kacperska (1994)Pawar et al. (2010)Chen and Zhang (2003)Il'In and Cherkasov (2016)Al-Sahhaf and Kapetanovic (1997)Iliuta and Thyrion (1995)Macy and Thomas (1926)Al-Sahhaf and Jabbar (1993)Iliuta and Thyrion (1995)Al-Sahhaf et al. (1999)Liu et al. (1998)Altshuller and Everson (1953)Glasstone et al. (1926)Al-Sahhaf et al. (1999)Altshuller and Everson (1953)Yang et al. (2007)Sun (1985)Janado et al. (1983)Goeller and Osol (1937)Sun et al. (2000)Janado et al. (1983)Goeller and Osol (1937)Sugunan and Thomas (1995)Table 3Data summary of iodide salts mixed with organic compounds and thereby various organic main groups in aqueous solutions (unless specified otherwise).

In the past, measurements involving methanol were generally excluded from the AIOMFAC parameter optimization procedure. Being the shortest chain alcohol, methanol tends to behave differently than a simple extrapolation from longer-chain alcohols would suggest (e.g., well known for saturation vapor pressures (Donahue et al., 2011)). This may affect the determined parameter describing interactions between the hydroxyl group OH and I−, meant to be applicable to a wide range of alcohols/polyols and other compounds. However, due to the scarcity of experimental data, available data for components containing organic main groups like aromatic hydrocarbon (ACH) are mainly present in water-free ternary systems involving methanol, e.g., benzene + methanol + KI. To have a wider coverage of data supporting the fit of I− ↔ organic main group parameters, we included some datasets with methanol. Table 3 lists all the datasets used in the simultaneous fit of new AIOMFAC parameters. The initial weightings of individual datasets were first determined based on an estimated relative uncertainty associated with the experimental method. For example, water activity measurements from bulk solutions were generally assigned with weighting value units higher than those from EDB measurements. After a first round of the fitting process, the relative contributions from different datasets to the total objective fit function value were evaluated. Datasets which indicated potential inconsistencies with other datasets for a certain system, as assessed from their large (or contradicting) contributions to the objective function, were carefully checked for potential errors in input files and associated data. For datasets considered valid but of high objective function contribution, we lowered the initial weighting such that their contribution became more similar to the median objective function value contribution of different datasets. Such manual, iterative inspections of fit progress, associated graphical data comparison, and dataset weighting adjustments aid in avoiding potential issues of large biases in parameter estimation, which may occur when the fit error is dominated by only a small subset of datasets.
3.2 Carbonic acid system
In the presence of carbonic acid, there are four relevant equilibria to consider:
Unlike aqueous sulfuric acid, whose first dissociation step is essentially complete (Young et al., 1959; Seinfeld and Pandis, 1998), carbonic acid's first (Reaction R1) and second (Reaction R2) dissociation steps have to be taken into account explicitly. Since carbonic acid is a strong buffer agent at nearly neutral conditions, the effects from the auto-dissociation of water (Reaction R3) on acidity are of interest as well. Finally, a Henry's law constant characterizes the partial pressure of CO2(g) in equilibrium with dissolved CO2(aq) (Reaction R4).
A thermodynamic equilibrium constant can be expressed as
where aj and vj are the activity and the stoichiometric coefficient of species j in an associated reaction equilibrium. Therefore, the equilibrium constants (which are functions of temperature and pressure) of the Reactions (R1)–(R4) are
Table 4Parameterization of the temperature-dependent equilibrium constants for the aqueous dissociation equilibria (Reactions R1–R4), applicable in the stated temperature range at pressures near 1 atm (∼ 105 Pa).
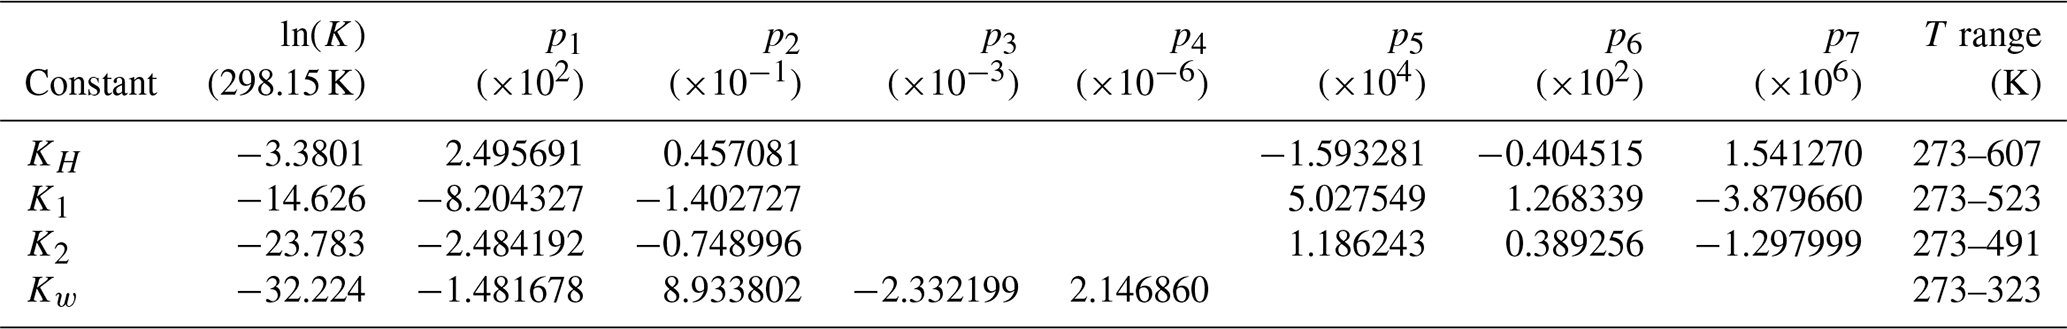
Constants pi are for the equation ln (K) = .
Here, (atm) is the partial pressure of CO2, is the reference pressure in the same units (here 1 atm), and aw is the mole-fraction-based water activity. mi and γi are the molality and corresponding activity coefficient on the molality scale of ion i or CO2(aq). The unit molality, , is included in the above equations to highlight that equilibrium constants are dimensionless quantities (although they are scale-dependent). Since the reference values of K are temperature-dependent, a parameterization of the following functional form at a total pressure of 1 atm is often used
with the parameters () listed in Table 4 for each chemical equilibrium based on data from Marion (2001). Similar to the treatment of the partial dissociation in the AIOMFAC model (Zuend et al., 2008), the degree of dissociation of the ion, , can be expressed by
where or are the molality or molar amount of the ion and the superscript max indicates the maximum possible amount of this ion being formed within the system for a given overall liquid-phase composition. From the equilibrium relation (Reaction R1), under the assumption that water is always more abundant in molar amount than CO2(aq), the molar balances of the system can be formulated as
The OH− ion is not part of the original AIOMFAC model, and while insignificant in amount and effect in acidic aerosol solutions, it was added to the model for explicit treatment in the context of the bicarbonate system and other systems of neutral to high pH. In our implementation, not only represents the maximum amount of the OH− but also the fraction (r) of present water considered for potential OH−, H+ contributions via the auto-dissociation of H2O:
To ensure that a complete neutralization of the cumulative positive charges of cations is possible, is usually set as 3.5 times the sum of the initial amount of cations. Based on Eqs. (14) and (15), the maximum molar amount of the bicarbonate ion is
The equilibrium constant expressions for K1,K2, and Kw (right-hand sides of Eqs. 8–10) in AIOMFAC are then solved by iteratively adjusting the molar amounts of all species until the known temperature-dependent values for different reactions as well as the molar balances (Eqs. 14 and 15) are fulfilled simultaneously. Two different numerical solving procedures were developed with their own advantages and challenges discussed in detail in Sect. S3 in the Supplement.
In a system of H2CO3 + Na2CO3 + H2O, there are five ions present: H+, Na+, , , and OH−. Therefore, the AIOMFAC computation is affected by the interaction parameters of the six cation–anion pairs involved. Using first a few binary systems, each only containing one cation and one anion in substantial amounts (e.g., aqueous Na2CO3 assumed to only contain Na+ and ions), the fits of the model parameters for H+ ↔ OH−, Na+ ↔ , and Na+ ↔ OH− were carried out independently. The remaining 12 middle-range interaction parameters affecting the mentioned five-ion system, including those for H+ ↔ and H+ ↔ interactions, had to be fitted simultaneously while fulfilling the equilibria (Reactions R1–R4). Aqueous mixtures of H2CO3 + Na2CO3 of different mixing ratios were selected to better constrain the model fit.
In the presence of both dissolved carbonic acid and sulfuric acid, the bisulfate ion needs to be accounted for when the maximum possible molar amount of H+ is computed:
One additional equilibrium relationship to account for the incomplete bisulfate dissociation is solved simultaneously with Reactions (R1)–(R4):
After an equilibrium composition has been established for a given input of mixture components, the acidity (pH) of the solution can be calculated as
Some input compositions require additional considerations for meaningful calculations. For example, most computations outlined above are carried out assuming that all components are mixed in a liquid phase and the potential precipitation of crystalline solids (e.g., salts) is ignored (i.e., metastable, supersaturated salt solutions allowed) unless specific solid–liquid equilibria are targeted. However, there is one exception: when Ca2+ and ions are present in a system, complete precipitation of solid CaSO4 (or associated hydrates) is typically assumed to occur. This treatment of CaSO4 is due to its very low solubility in water. Also, assuming that the maximum possible amount of CaSO4 forms a solid instead of solving the actual solid–liquid equilibrium of this salt allows for a more efficient AIOMFAC calculation without any loss of accuracy under most RH conditions. For systems involving Ca2+ and ions at high RH in gas–particle equilibrium computations, the treatment of CaSO4 can be modified by introducing a RH threshold, e.g., 98 %, above which the CaSO4 is assumed to be fully dissolved in an aqueous phase. Such an approach was adopted for AIOMFAC-based equilibrium calculations in the study by Pye et al. (2020).
3.2.1 Activity coefficients of CO2(aq)
Harvie et al. (1984) have shown that the inclusion of CO2(aq) is essential to describe the thermodynamic behavior of the carbonic system. Following the approach taken in previous studies (Harvie et al., 1984; Clegg et al., 1991; Meng et al., 1995), the activity coefficient of the neutral inorganic species CO2(aq) is given by
where λ is the specific parameter for the interaction between CO2(aq) and a cation or an anion. Since ions are present in cation–anion pairs in overall neutral electrolyte solutions, it is impossible to determine the interaction parameter between a single ion and a neutral species in isolation. Therefore, an arbitrary value has to be set for one selected ion. By convention, the value of is set to zero, forming a reference interaction against which all other ion ↔ CO2(aq) interactions in aqueous solution can be calibrated. All CO2(aq) ↔ ion interaction parameters used in this study were evaluated by Harvie et al. (1984) and Meng et al. (1995) from solubility data with the values listed in Table 5. When there are no reliable data from the literature, the interaction between the ion of interest and CO2(aq) is assumed to be zero (i.e., ). Similarly, as there is almost no data on CO2(aq) with pure water and organic compounds, it is assumed that the interaction between those species is negligible ().
Table 5Summary of CO2(aq) ↔ ion interaction parameters.
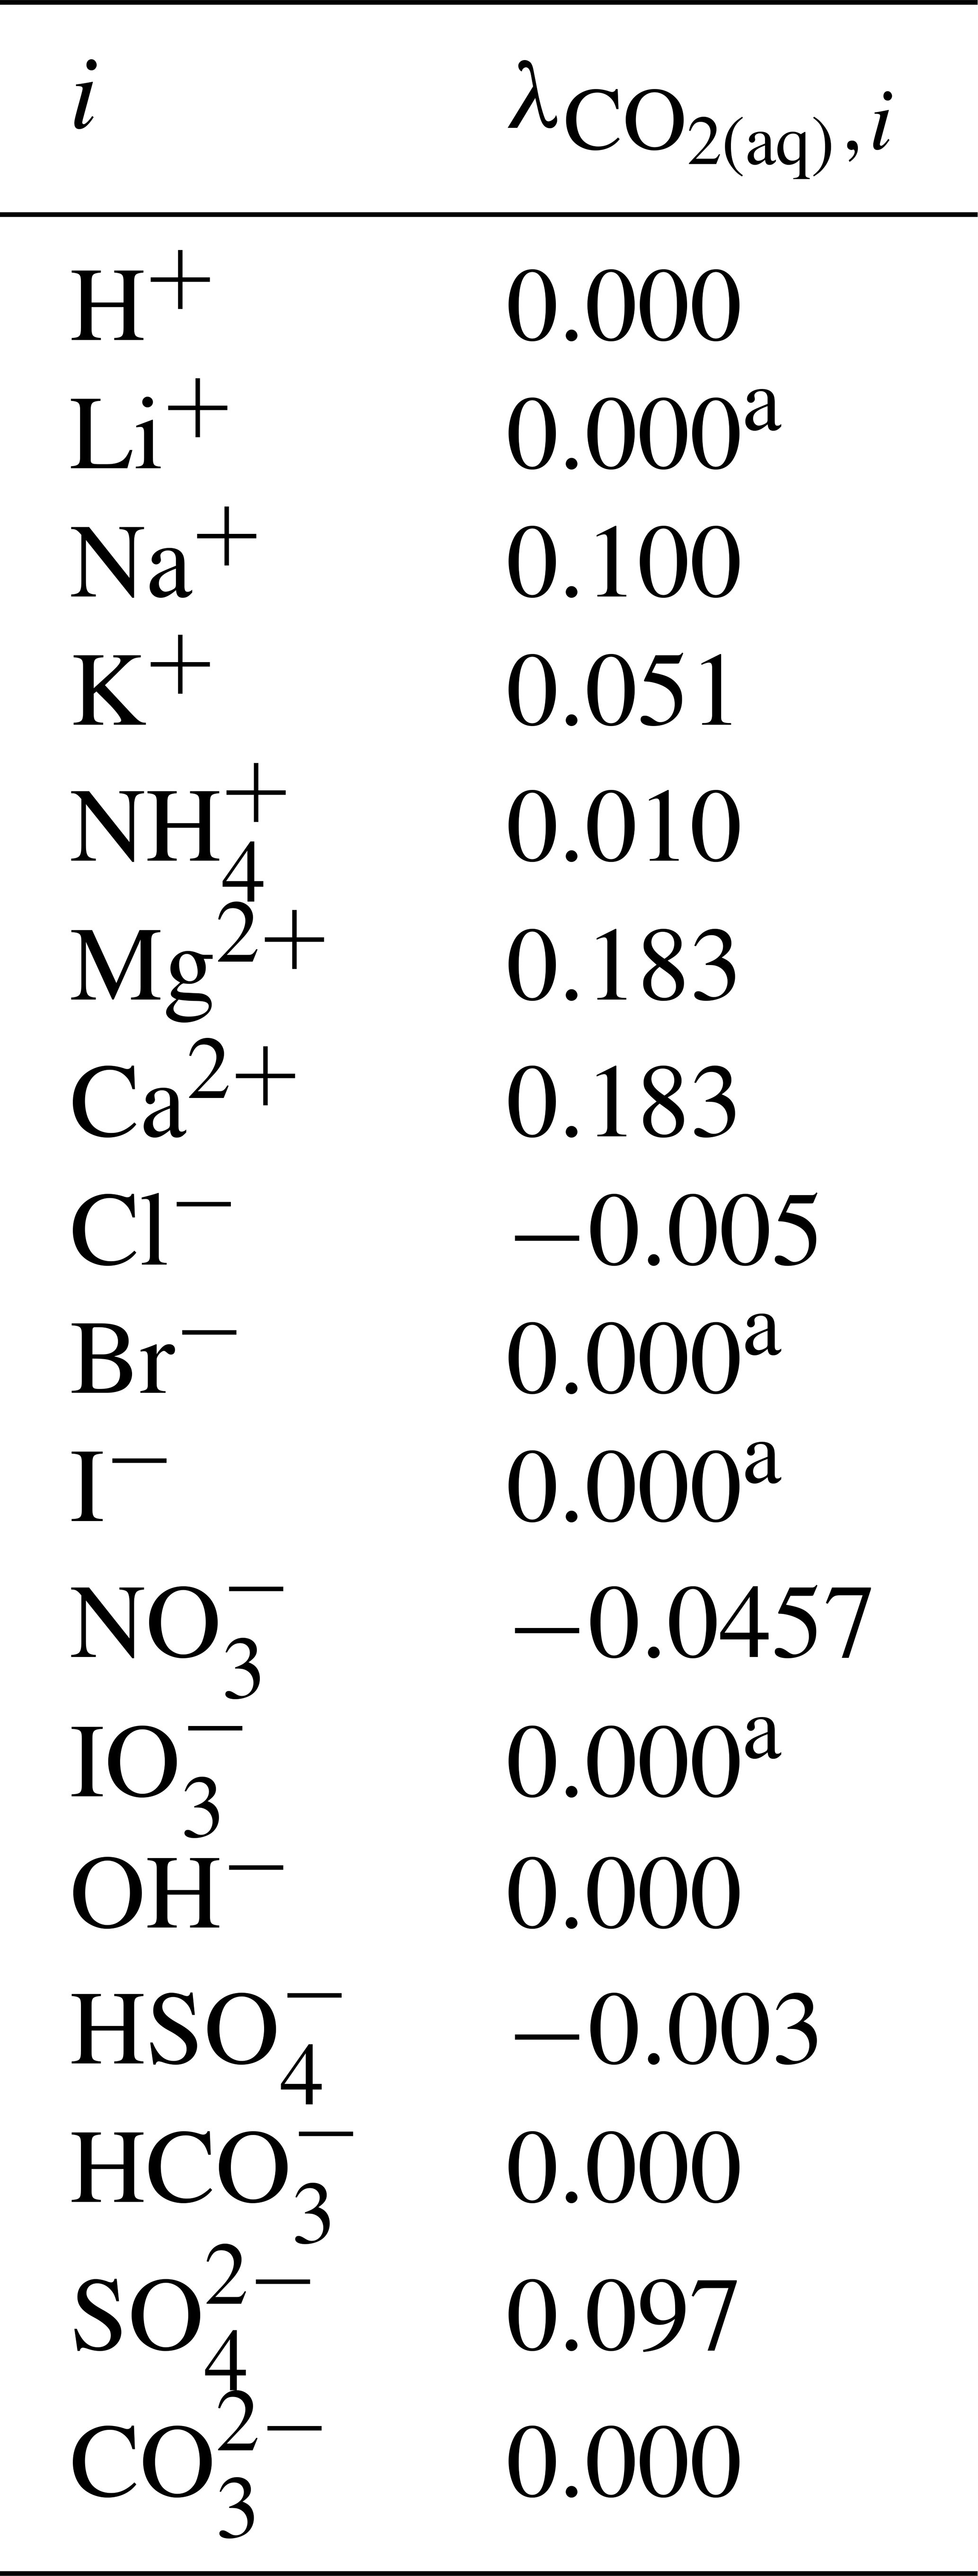
a Due to the lack of reliable data on the interaction between the designated ion and CO2(aq), the influence is considered negligible or similar to that of H+ on CO2(aq) in water (i.e., = 0.000).
3.3 Reference thermodynamic models
3.3.1 Extended Aerosol Inorganics Model (E-AIM)
The Extended Aerosol Inorganics Model (E-AIM) is a thermodynamic model that calculates various equilibria between water and inorganic species. The specific E-AIM subset referenced in this study was developed by Harvie et al. (1984) and Wexler and Clegg (2002) based on the Pitzer method, which includes ions H+, , Na+, K+, Ca2+, Mg2+, , , , Cl−, , , and OH−, as well as neutral species NH3 and CO2(aq). The equilibria solved in that model cover Reactions (R1) to (R5). Due to the scarcity of data involving carbonates and the high validity of E-AIM against various experimental data, we chose this E-AIM model as a benchmark and source of comparison data (in addition to measurements) in this study. The online version of E-AIM is accessible at http://www.aim.env.uea.ac.uk/aim/accent4/main.php (last access: 27 March 2021).
3.3.2 Simulating Composition of Atmospheric Particles at Equilibrium (SCAPE 2)
The Simulating Composition of Atmospheric Particles at Equilibrium (SCAPE 2) model is an atmospheric gas–aerosol equilibrium model. It covers ions , , , H+, Na+, , K+, Ca2+, Mg2+, and CO2(aq) (Meng et al., 1995). The two dissociation steps of carbonic acid (Reactions R1 and R2) are solved explicitly without the inclusion of water auto-dissociation (Reaction R3). The binary and multicomponent activity coefficients of electrolytes in SCAPE 2 are estimated by the Kusik–Meissner method and Pitzer method, respectively. Water activity in a multicomponent system is estimated by the ZSR method based on polynomial fits of available binary water activity data. We refer to these polynomial fits as Meng et al. (1995) data when used as input for the AIOMFAC fit/comparison. Due to the lack of a stated validity range for some of the salts, we only used polynomial fits with defined ones for bicarbonate salts. The complete list of the data types and sources involving carbonate salts and carbonic acid can be found in Table 6. For model-derived data with a notable discrepancy between those from E-AIM and Meng et al. (1995), the weightings of the concerned data were both lowered.
Mamontov and Gorbachev (2020)Hamer and Wu (1972)Robinson and Stokes (2002)Zaytsev and Aseyev (1992)Hamer and Wu (1972)Robinson and Stokes (2002)Nasirzadeh et al. (2005)Robinson and Macaskill (1979)Goldberg (1981)Vanderzee (1982)Zaytsev and Aseyev (1992)Peiper and Pitzer (1982)Sarbar et al. (1982a)Sharygin and Wood (1998)Stokes (1945)Hamer and Wu (1972)Stokes (1945)Hamer and Wu (1972)Sarbar et al. (1982b)Zaytsev and Aseyev (1992)Roy et al. (1984)Roy et al. (1984)Meng et al. (1995)Hamer and Wu (1972)Hamer and Wu (1972)Roy et al. (1988)Meng et al. (1995)Meng et al. (1995)Cheng et al. (2013)Cheng et al. (2013)Wang et al. (2018)Cheng et al. (2013)Wang et al. (2018)Ji et al. (2001)Ji et al. (2001)Roy et al. (1984)Dong et al. (2009)Dong et al. (2008)De Visscher et al. (2012)De Visscher et al. (2012)De Visscher et al. (2012)Dong et al. (2008)Dong et al. (2009)Dong et al. (2009)Onasch et al. (2000)Millero et al. (1984)Table 6Experiment temperature (T), data type, molal ionic strength (I) range, number of data points (Nd), initial weightings (wd), and references used to fit the MR interaction parameters for cation–anion pairs in the carbonate system.
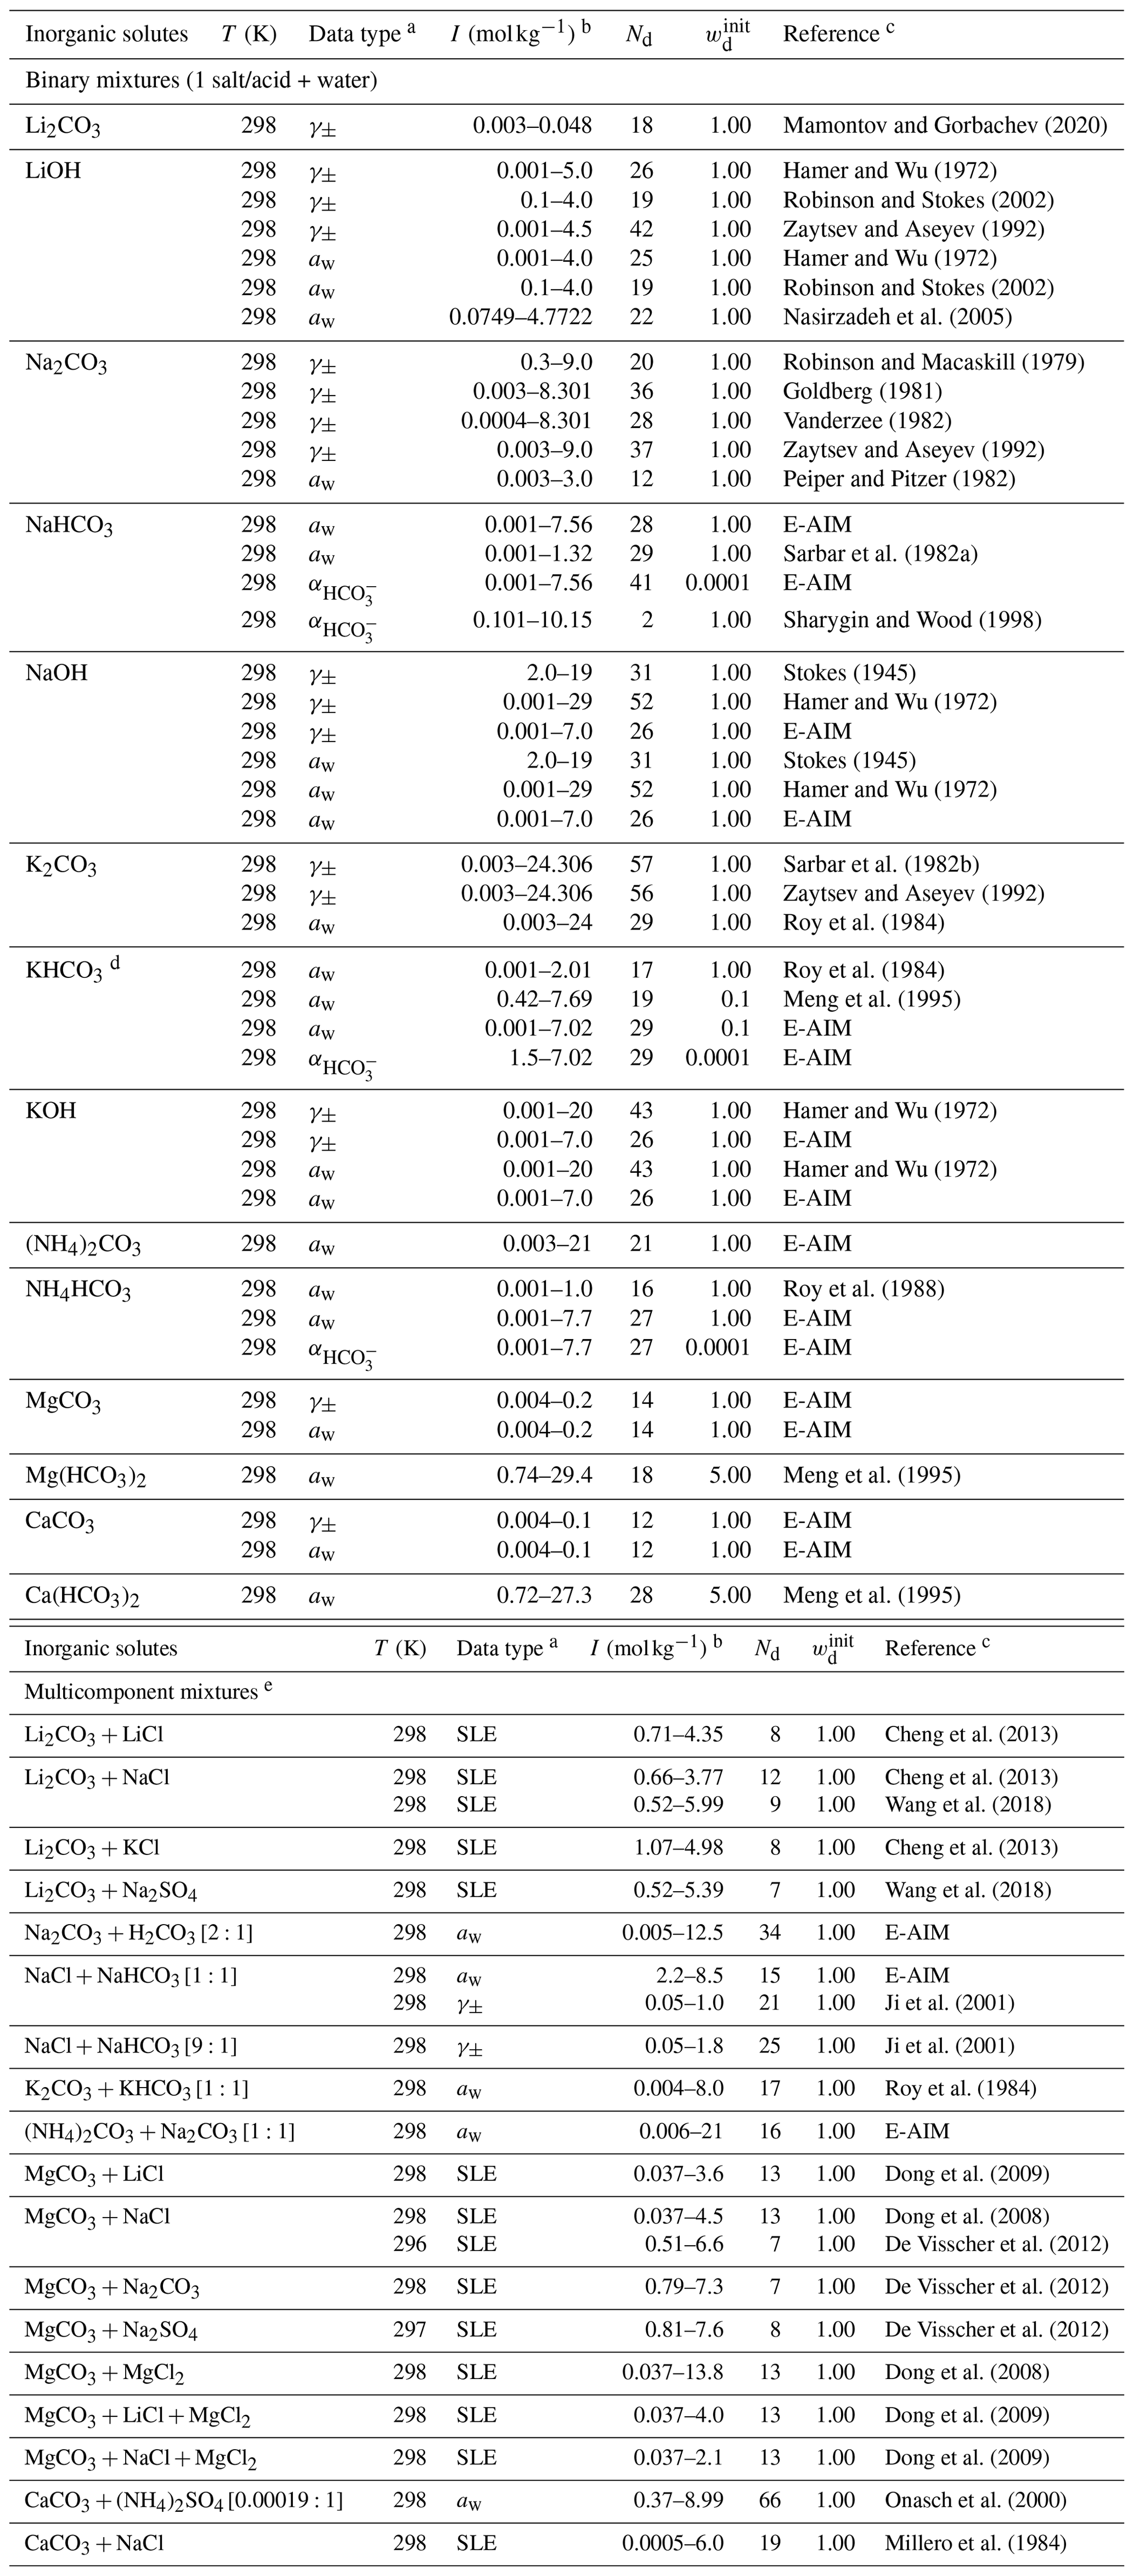
a Water activity (aw) data were calculated from osmotic coefficients or vapor pressure if not provided by the reference. b For the bicarbonate mixture, the ionic strength is computed from AIOMFAC after considering partial dissociation. c Data points from Meng et al. (1995) were generated by using the polynomials in their model parameterization. d As there is major discrepancy between the aw data, the weighting was reduced. e In the brackets are the corresponding molar ratios of the salts or acids.
3.4 Experimental data for AIOMFAC fit
Different data types, including measurements of water activity (aw) or mean molal ion activity coefficients of the electrolytes (γ±) at known solution compositions, determined phase compositions at vapor–liquid equilibrium (VLE), liquid–liquid equilibrium (LLE), or solid–liquid equilibrium (SLE), are useful for establishing adjustable middle-range parameters in AIOMFAC (Eqs. 3–5). For water activity data, measurements are usually carried out using macroscopic bulk solutions or microscopic aqueous droplets. For equilibrium (bulk) measurements, assuming water is the only volatile component, its activity on the mole fraction scale can be determined from
with pw being the water vapor pressure in equilibrium with the solution and the saturation vapor pressure of pure water at the measurement temperature. To access the regime beyond saturation of the electrolyte in solvent mixture, an aqueous droplet can be trapped in an electrodynamic balance (EDB) under controlled relative humidity (RH). When a supermicron-sized droplet is in equilibrium with the gas phase, RH is equivalent to aerosol water activity (i.e., RH = aw). The composition is then evaluated from the droplet's radius or mass change in response to a change in RH relative to the initial dry particle (e.g., Zardini et al., 2008; Krieger et al., 2012). The uncertainty associated with an EDB measurement is generally larger than that of a bulk water activity measurement due to the combined errors in determining RH and droplet water content reliably from the EDB sensors and raw data conversion (Krieger et al., 2012).
The electromotive force (EMF) method is used to determine the mean activity coefficients of an electrolyte at known concentration. By measuring the electric potential difference between two different electrodes in an electrochemical cell, the mean activity coefficients are derived from the modified Nernst equation and the use of a system-specific thermodynamic model (e.g., Hamer and Wu, 1972). VLE is measured under either isobaric or isothermal conditions; in the latter case the temperature is typically higher than room temperature (i.e., 298 K). For the fitting of AIOMFAC parameters, and to establish the salt influence on the VLE of the components from the effects of other constituents, the activity coefficient difference of water or organic component j is calculated from data for salt-containing (sc) and salt-free (sf) conditions at the same salt-free mole fraction of j in the solvent mixture as
Table 7Coefficients for the Duhem–Margules excess Gibbs energy model (McGlashan, 1963; Soonsin et al., 2010) fitted to salt-free binary organic solvent mixture data.
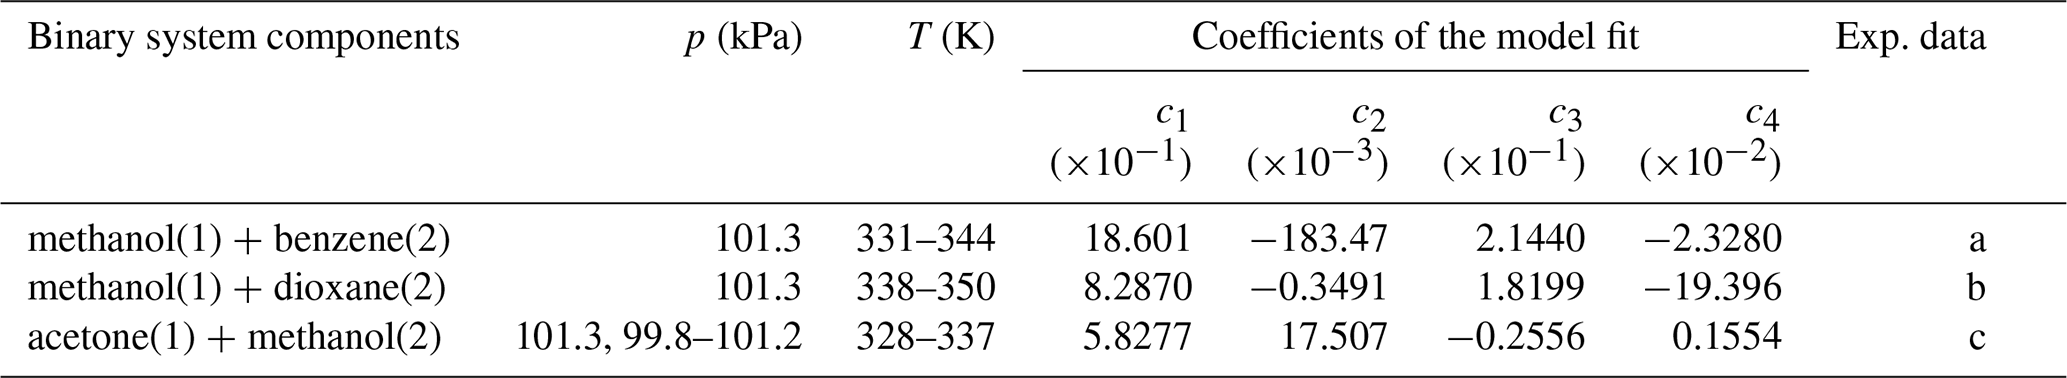
Coefficients and model expressions are as those of Soonsin et al. (2010); see their Appendix A.
Experimental data sources: (a) Hiaki and Kawai (1999) and Li et al. (2019); (b) Liu et al. (1998); (c) Iliuta and Thyrion (1995), Chen et al. (2015), Tu et al. (1997), and Li et al. (2014).
We use a mixture-specific fit of a Duhem–Margules model (McGlashan, 1963; Soonsin et al., 2010) to compute the composition-dependent . The newly fitted parameters are tabulated in Table 7; the complete description of this method is given in Zuend et al. (2011). Experimental LLE data describe the mass or mole fraction phase compositions of coexisting liquid phases, which typically represent a more polar aqueous phase and a less polar organic-rich phase. For our model fit, the measured composition data are compared with those from the corresponding AIOMFAC-based LLE phase composition predictions, which enable the computation of the cumulative Euclidean distance between the model and measurement points in the phase composition space.
Finally, the SLE data report the liquid phase composition when in equilibrium with a specific solid (crystalline) phase. Under isothermal conditions, the solubility limit of the electrolyte or the organic compound is measured for different mixing compositions. At equilibrium, the liquid phase activity of the organic (if it is the solid) or the molal ion activity product of the electrolyte (for a salt as solid) should be at a constant value (for constant temperature), while the liquid phase concentration may vary (for ternary and higher mixtures). Therefore, the use of SLE data involves the comparison of the solution mass fractions predicted by AIOMFAC after solving for SLE with those from the measurements.
3.5 Alternative methods for the determination of interaction parameters
Due to the general lack of experimental data for mixtures of iodide, iodate, or carbonate electrolytes with organic compounds, alternative methods were adopted for the determination of AIOMFAC interaction parameters between those ions and the organic main groups. A linear regression analysis is chosen to have a broader coverage of the interaction parameters for I− and organic compounds. Based on the similarities in physical properties and interaction parameter patterns of other ions in the model, the interaction parameters for Br− ↔ organic main group and Mg2+ ↔ organic main group are selected as the independent variables for the analysis (i.e., to predict pertinent parameters for I−). Parameters for organic main group CHn, , OH and COOH with Br− and Mg2+ are used to determine and/or validate parameters for the same organic main groups with I−. The relationship is then used to estimate the interaction parameters for I− and other organic main groups that lack experimental data. The regression is performed separately for the and values, with additional comparison of the combined Bk,i values (Eq. 3) using binary solutions of the following ionic strengths: 0.001, 0.1, 10, and 100 mol kg−1, which cover a broad range of electrolyte concentrations.
Because there is no thermodynamic data for the mixture of iodate electrolytes with organic compounds, we make the crude estimation of the interaction parameters for ↔ organic main group based on the comparison of water activity or mean molal activity coefficients in binary iodate and other electrolyte solutions. The selection of the replacement anion is based on the similarities in thermodynamic data and ions' physical properties.
Since the main type of experimental data covering the mixture of carbonate salts + water + organic compounds is LLE data, the associated relatively large uncertainty and the limited number of data sources make it unfeasible for the optimization method to determine parameters in a reasonable value range (based on experience for other salts). Instead, we estimate the interaction parameters for carbonate ions and organic compounds based on those for sulfate ions due to the similar ion size and electric charge:

Figure 1Revised AIOMFAC interaction matrix indicating available and missing binary interaction parameters. Parameters available based on regression analysis are depicted by symbol (≈); those based on substitution are depicted by symbol (∼). Figure adapted based on original Fig. 4 from https://aiomfac.lab.mcgill.ca/about.html (last access: 5 November 2021).
In short, methods like those described in this section can be adopted as a first-order estimation approach for interactions lacking support by high-quality experimental data for a more sophisticated model parameter determination. The updated AIOMFAC group interaction matrix indicating all available binary interactions in the model is shown in Fig 1.
4.1 Aqueous inorganic iodine electrolytes
Using the outlined optimization procedure in Sect. 2.2, we determined the five parameters , , , , and describing the middle-range interaction between cations and anions in water; the fitted parameter sets are listed in Table 8. Here, we included the inorganic iodide electrolytes associated with all cations in the model, namely NaI, KI, HI, LiI, NH4I, MgI2, and CaI2. Figure 2 shows a model–measurement comparison of the various binary aqueous iodide solutions. It is clear that AIOMFAC is able to fully capture the mixing behavior in the measurement range. Beyond the concentration range covered by the measurements, our model is able to make physically reasonable extrapolations of solution water activity to zero water content. Figure 2h and i show the comparison of predicted water activity and mean molal activity coefficient curves for all iodide systems. The dashed diagonal line denotes the water activity in an ideal mixture. Electrolytes like LiI, HI, CaI2, and MgI2 deviate more from ideal mixing behavior than NH4I and KI. This pattern has been observed in chloride, nitrate, and other electrolyte series as well (Zuend et al., 2008). A likely reason is that the smaller and/or divalent cations Li+, Mg2+, and Ca2+ contain a higher relative surface charge density than and K+ (Zuend et al., 2008). While error bars are not reported for most experimental data sources, based on the good agreement between different experimental datasets, it is safe to assume that the measurement errors are within the range of the symbol size.
Table 8Determined middle-range interaction parameters between cation–anion pairs for iodide and iodate electrolytesa.
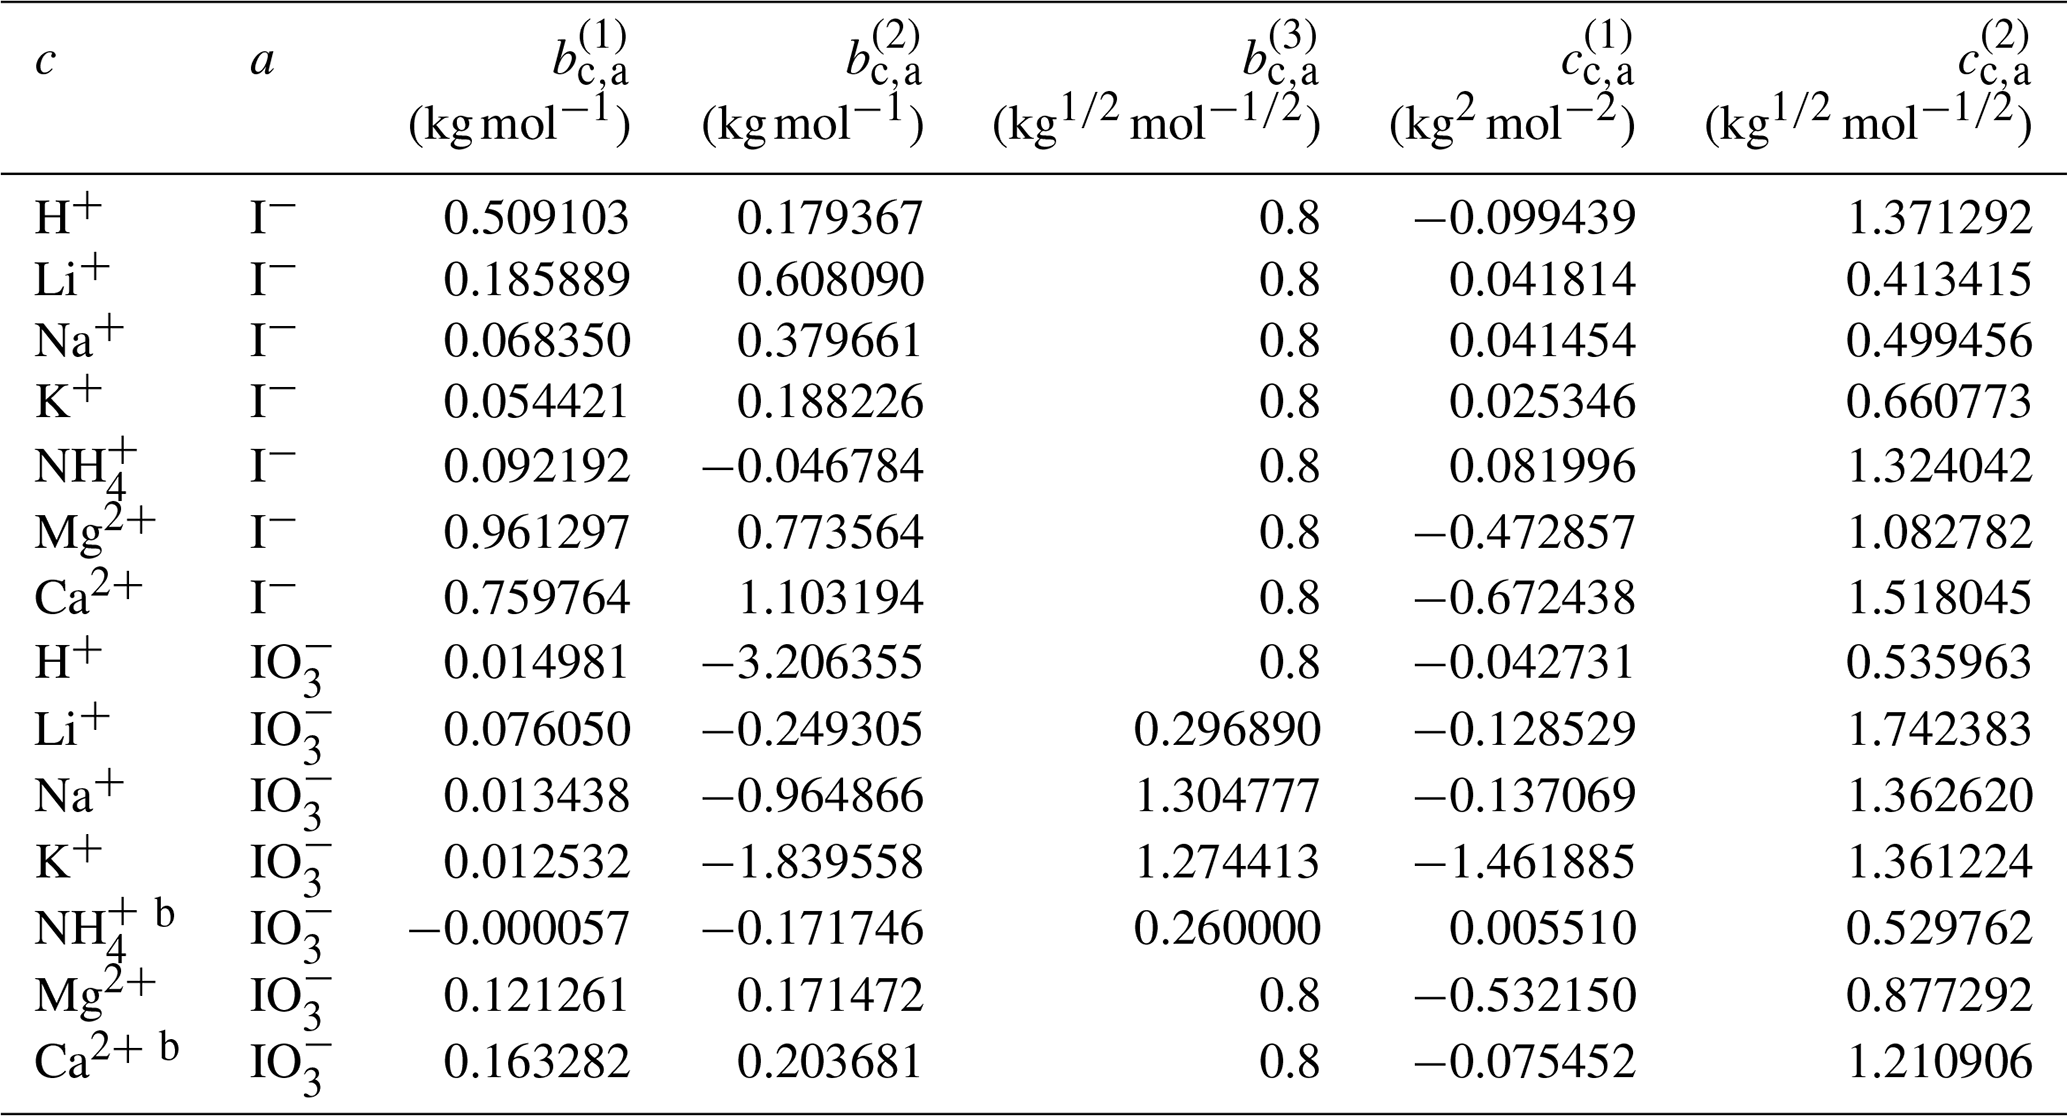
a The number of digits listed reflects the approximate precision used in the model code and does not imply that all digits are significant figures. b Estimated from the interaction parameters for designated cations ↔ .
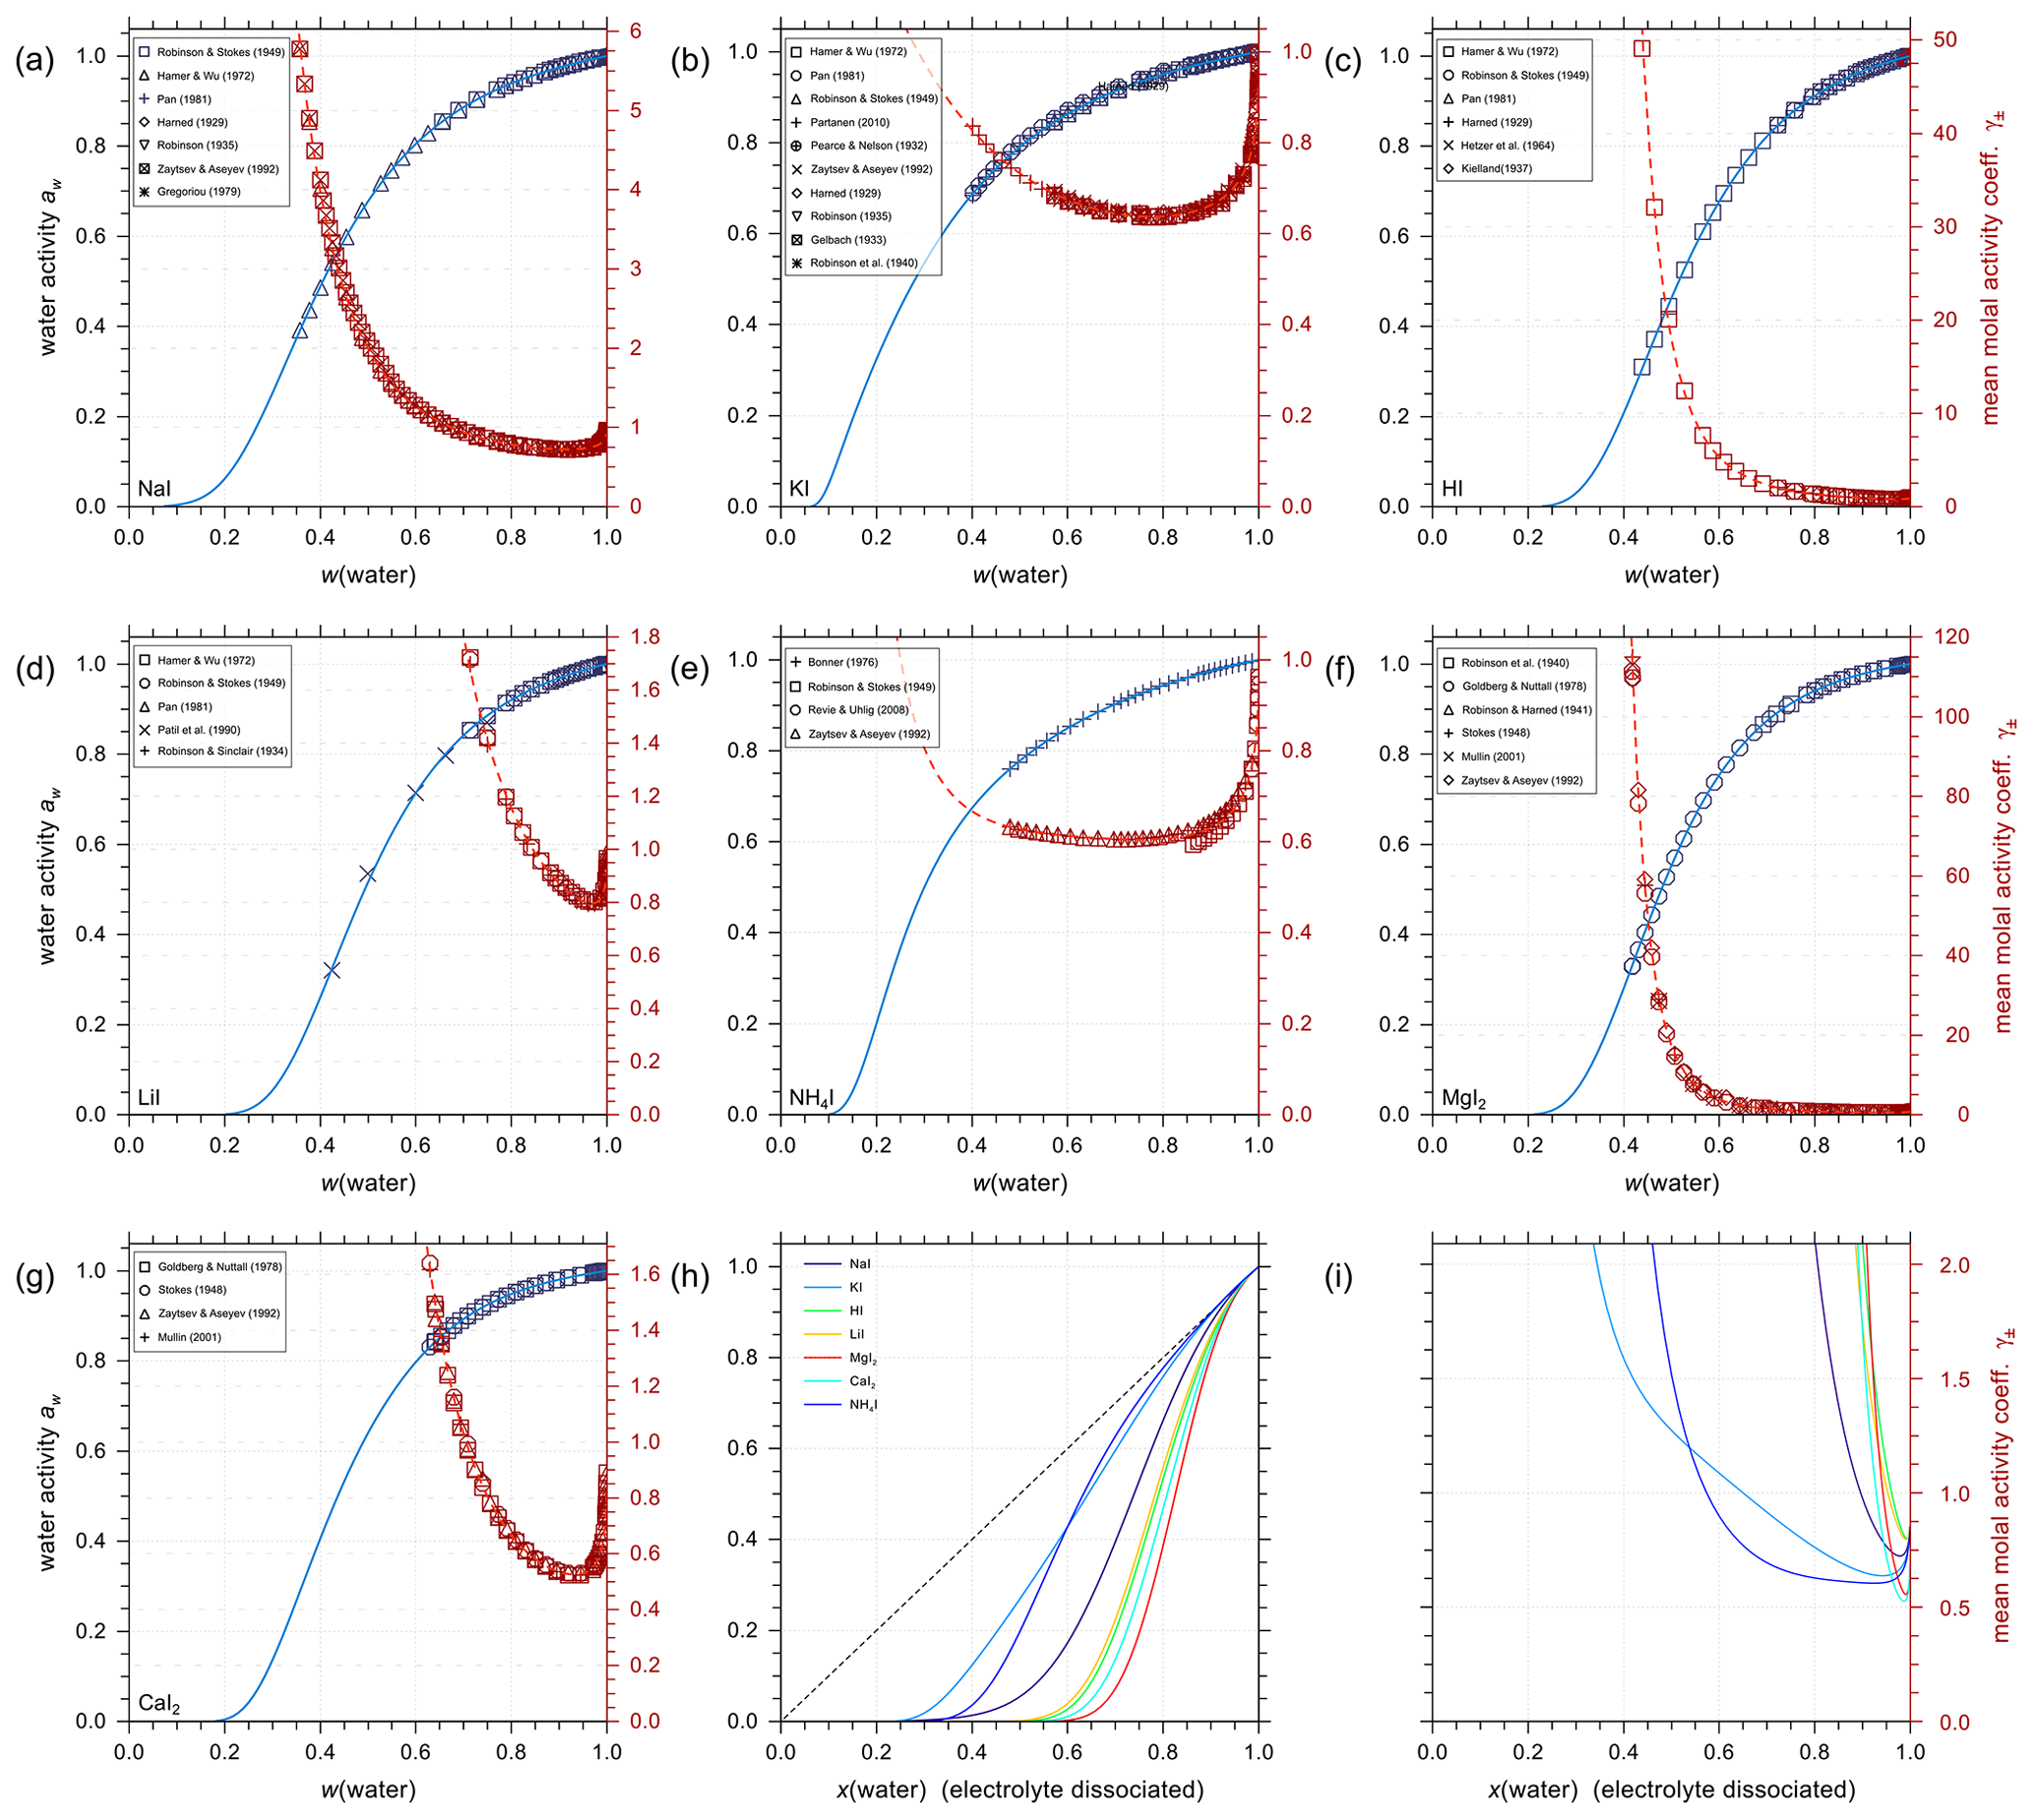
Figure 2Water activities and mean molal activity coefficients of the electrolytes in binary aqueous iodide solutions near 298.15 K. The symbols represent the experimental data and the solid curves show the AIOMFAC predictions. The panels (a) to (g) show as x axis the mass fraction of water, w(water), while panels (h) and (i) show the mixture composition in terms of x(water), the mole fraction of water defined with respect to dissociated electrolytes. The left y axis (blue curves, symbols) indicates water activity, and the right y axis (red curves, symbols) indicates the mean molal activity coefficients. Electrolytes: (a) NaI, (b) KI, (c) HI, (d) LiI, (e) NH4I, (f) MgI2, and (g) CaI2. (h) AIOMFAC-calculated water activity curves of all the iodide electrolytes implemented; the dashed black line indicates the water activity of an ideal mixture. (i) Corresponding mean molal activity coefficient curves.
Given the lack of reliable aqueous iodate solution data, especially at the concentrated range, aqueous NaIO3, KIO3, LiIO3, HIO3, and Mg(IO3)2 solutions were implemented based on experimental data in AIOMFAC in this model extension. Aqueous NH4IO3 and Ca(IO3)2 solutions were added based on an alternative method instead as discussed in Sect. 4.4. Figure 3 shows the experimental data and corresponding AIOMFAC predictions of water activity and the mean molal activity coefficients of NaIO3, KIO3, LiIO3, and HIO3 electrolytes at room temperature. The agreement between the experiments and the model predictions is very good, except for one data point at the solubility limit of KIO3 reported by Apelblat and Korin (1998) and part of the aw measurements of HIO3 solutions. Since our own measurements of the KIO3 water activity close to the solubility limit at 293 K are considered to be of high quality (see Sect. S5 in the Supplement), it is very likely that the reported water activity value by Apelblat and Korin (1998) is erroneous. Given HIO3 water activity data reported by Goldman et al. (1974) agree quite well with our own measurements (see Sect. S5 in the Supplement), the weightings of the bulk measurements by Kumar et al. (2010) and the subsequent EDB measurements by Murray et al. (2012) were lowered during the parameter fitting process. The reason for such disagreement between different datasets is unclear, and the focus of this work is not to explain the discrepancies. Additionally, due to the low solubility of NaIO3 and KIO3 in water, the validity of the AIOMFAC predictions of binary aqueous NaIO3 and KIO3 solutions may be compromised at high ionic strength (e.g., in supersaturated salt solutions) due to a lack of data for model fit/validation.

Figure 3Water activities and mean molal ion activity coefficients of the electrolytes in binary aqueous iodate solutions at room temperature. Symbols: experimental data (see legend); solid blue and dashed red curves: fitted AIOMFAC model. (a) NaIO3, (b) KIO3, (c) LiIO3, and (d) HIO3.
4.2 Parameterization of iodide salt interactions with organic compounds
The resulting parameters of the model optimization for I− ↔ organic main group interactions (to calculate Bk,i), using two different methods, are provided in Table 9. Since there are many data types and sources involved, we will focus on the discussion of a selection of systems containing carboxylic acids and alcohols in the following. Plots depicting some additional systems are provided in Fig. S1 in the Supplement.
Table 9Determined middle-range interaction parameters (kg mol−1) and (kg mol−1) between I− and organic main groups. The values were either determined from a AIOMFAC model fit to experimental data or by using a regression method to predict the values based on the known parameters of other ions interacting with the listed organic main groups a.
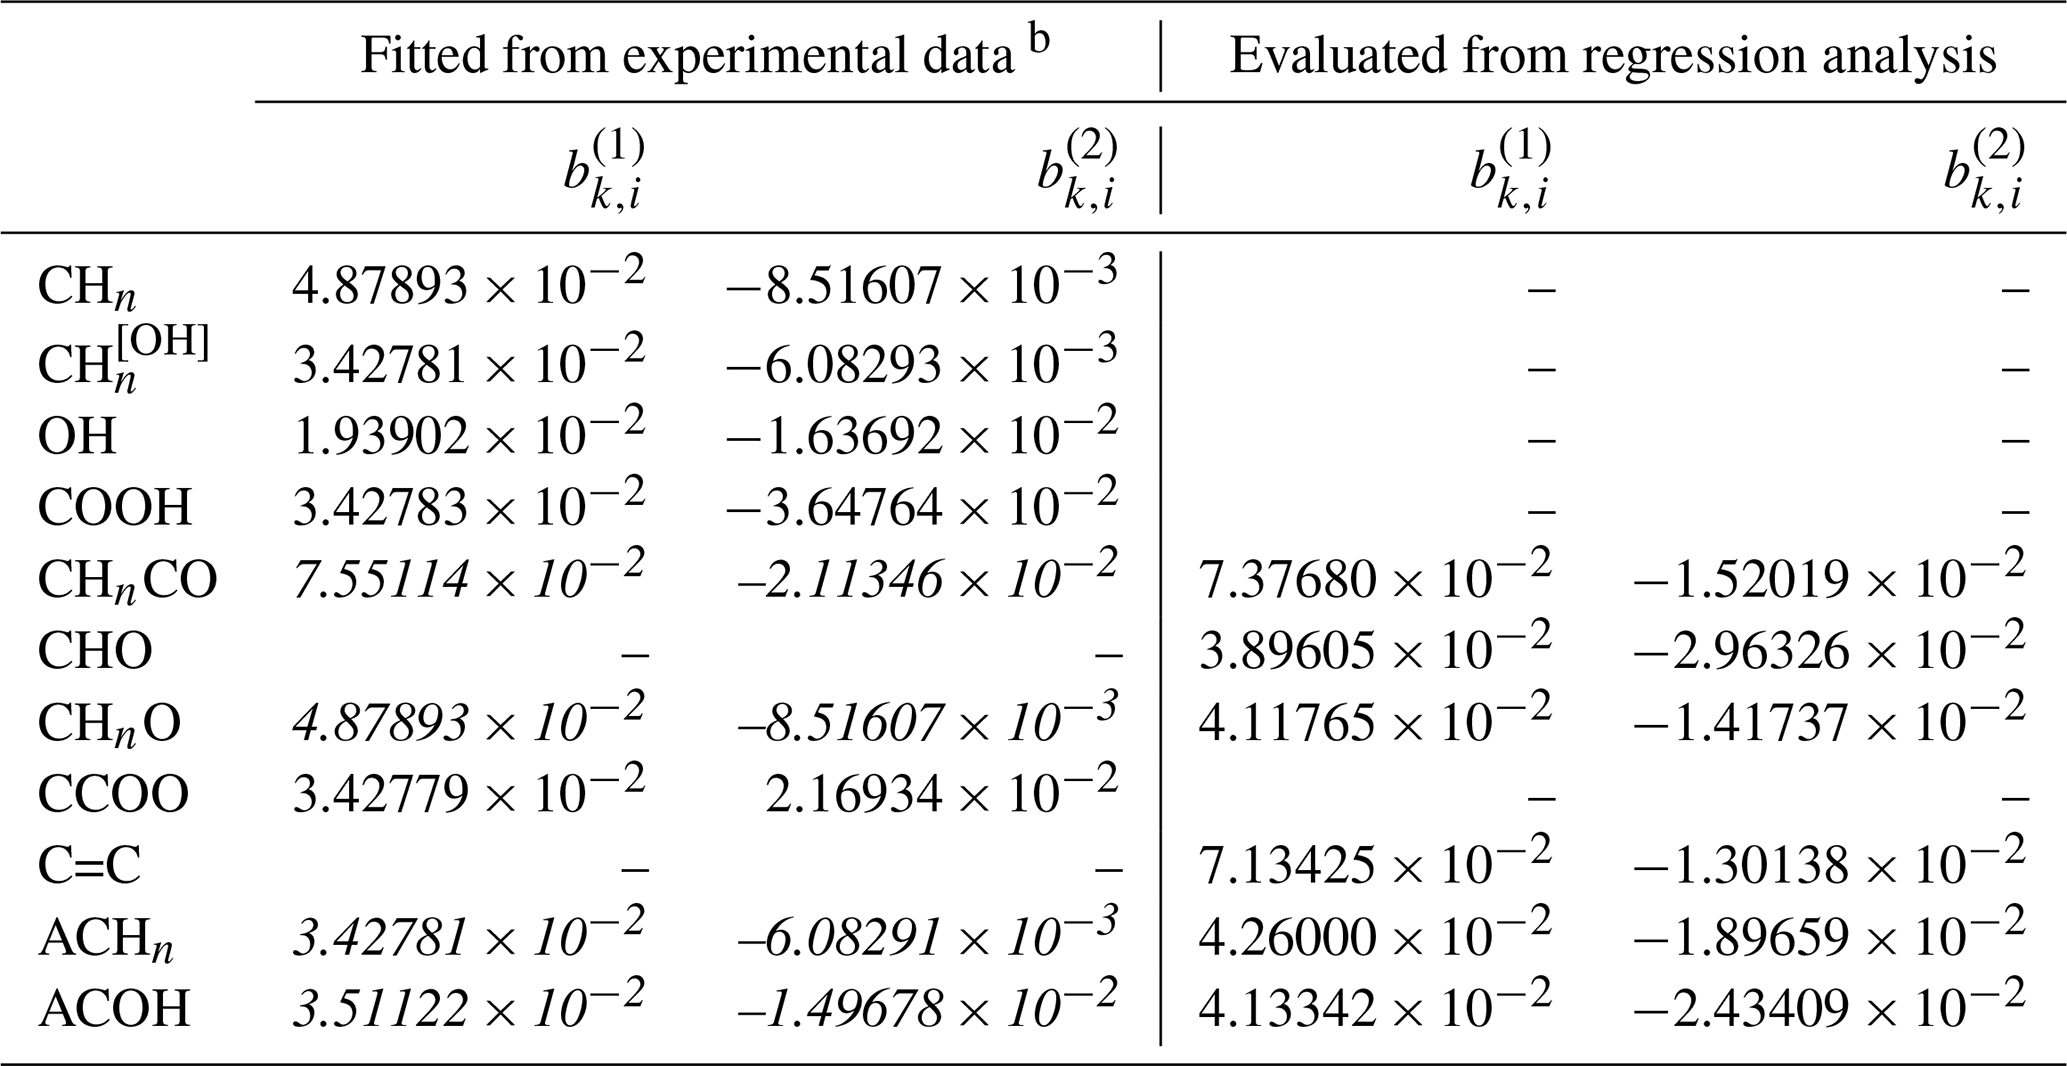
a The number of digits listed reflects the approximate precision used in the model code and does not imply that all digits are significant figures. b Parameters in standard font are used in the revised AIOMFAC model, while those in italic font are shown here for comparison/validation purposes only.
4.2.1 Iodide–organic acid interactions
Organic compounds such as carboxylic acids contribute a large fraction of the water-soluble organic aerosol mass, including in marine environments (e.g., Saxena and Hildemann, 1996; Decesari et al., 2000). It is thus important to accurately predict the activity coefficients in iodide electrolytes + organic acid mixtures and to evaluate the potential for liquid–liquid phase separation. Figure 4 shows experimental water activity data and AIOMFAC predictions of ternary systems NaI + water + different carboxylic acids: malonic acid (Fig. 4a), citric acid (Fig. 4b), and glutaric acid (Fig. 4c and d). The mass ratio between NaI and the organic acid in each set of the experiments is kept constant, allowing for a direct comparison with the shown model curves. The dashed curves show the water activities of the corresponding salt-free solvent mixture to highlight the effect of adding salt to the solution. It is this difference between salt-free and salt-containing solutions that should be explained by the interactions among ions with water and the organic functional groups present (at least within AIOMFAC). In general, the model–measurement agreement is good especially at high water content (aw>0.8). In the case of water + citric acid + NaI, AIOMFAC slightly overpredicts the water activity compared to the EDB measurements for aw<0.8. This deviation is largely attributed to AIOMFAC's group-contribution approach with further discussion provided in Sect. 4.2.3.
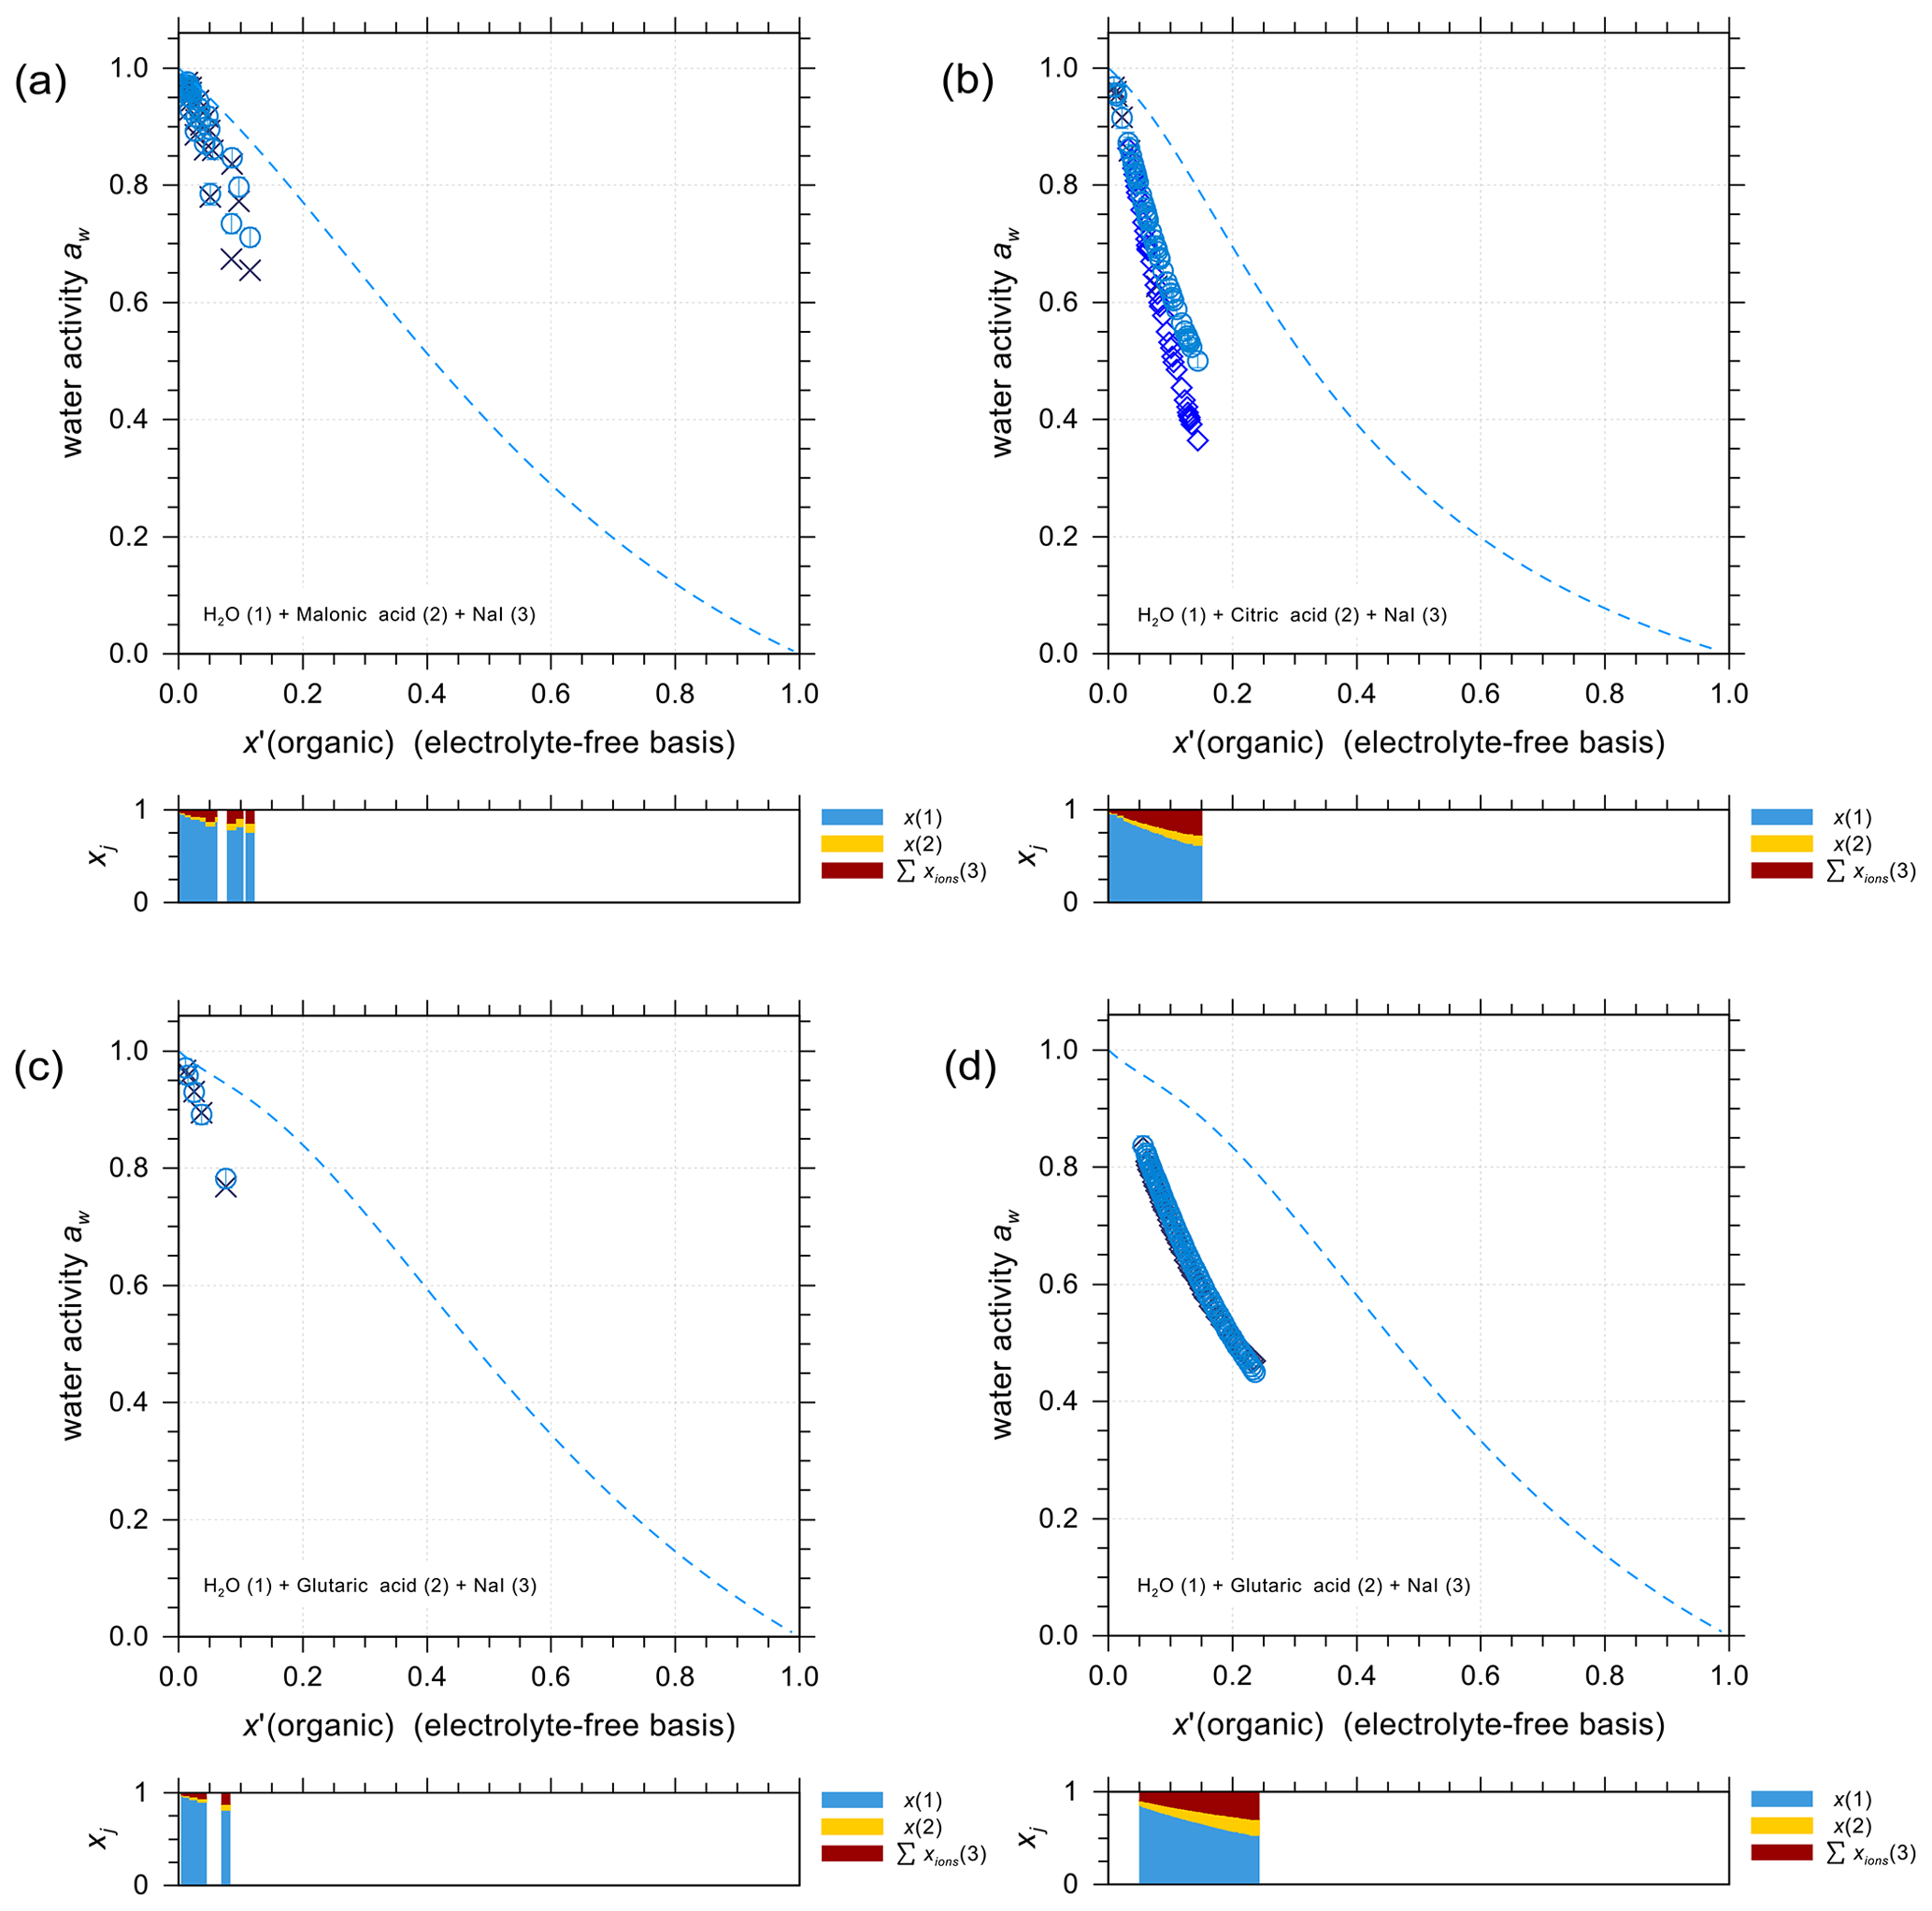
Figure 4Water activities of NaI + water + carboxylic acid systems. Symbols: (×) bulk solution measurements at 298.15 K; (⋄) EDB measurements at various temperatures (see details in Sect. S5 in the Supplement); (∘) AIOMFAC predictions at the corresponding experimental temperatures including estimated model sensitivity shown as error bars. (a) Water (1) + malonic acid (2) + NaI (3); experiments at various mixing ratios (this study). (b) Water (1) + citric acid (2) + NaI (3); experiments at 1:1 mass ratio of citric acid : NaI (this study). (c, d) Water (1) + glutaric acid (2) + NaI (3); experiments at 1:1 mass ratio of glutaric acid : NaI (this study). The dashed curves indicate the water activities of the corresponding salt-free systems. The composition bar panels show the stacked mole fractions of the three components with respect to dissociated NaI.
4.2.2 Iodide–alcohol/polyol interactions
Figure 5 shows a selection of vapor–liquid equilibrium (VLE), water activity (aw), liquid–liquid equilibrium (LLE), and solubility (SLE) experimental data and pertaining model calculations for iodide salt + water + alcohol mixtures. Figure 5a is VLE system of water + ethanol + KI under isobaric condition in the temperature range from 351 to 366 K. The salting-out effect on the organic (large positive activity coefficient deviation of ethanol) is most prominent for small mole fractions of ethanol. Note that the scatter among data points in such figures is also due to measurements of ternary solutions of different salt contents while at similar electrolyte-free mole fractions of the organic. Surprisingly, experimental data show some strong salting-out behavior on water in water-rich regimes which may come from experimental uncertainties and/or AIOMFAC fits not being perfect. The water activity measurements and AIOMFAC predictions for the ternary system water + sorbitol + NaI at 288 K are shown in Fig. 5b. The mass ratio of sorbitol to NaI is kept as 1:1 in the experiments. AIOMFAC predictions are substantially lower, by about 0.1 units, than EDB measurements at lower water activity, while they are much better at higher water contents. Figure 5c shows a LLE phase diagram of water + 1-butanol + KI at 298.15 K, where the compositions of the two coexisting phases are connected by tie-lines. Since the potential errors associated with this type of measurements are high, even with slight deviations, AIOMFAC is considered to be in very good agreement with the experiments. Figure 5d shows the solubility limit of KI for different mixing ratios of water + 2-propanol at 298.15 K. In the water-rich composition range, AIOMFAC underpredicts the salt solubilities slightly, while it overpredicts solubility when the system enters the organic-rich regime, e.g., for x′(water) <0.6. The different directions of model deviations are a typical result of the optimization trade-off when using a group-contribution approach to simultaneously represent many compounds/systems. Since we have a rather big data collection (28 sets in total) for systems covering I− + organic acids and I− + aliphatic alcohols, the achieved fitting quality of the two targeted sets of parameters, I− ↔ COOH and I− ↔ OH, is considered high. In addition, the fitting quality of interaction parameters for I− ↔ and I− ↔ CHn may benefit from this diversity in datasets. However, the validity of other parameters (covering a range of other organic main groups) may be limited since either the measurement data only cover very dilute concentration ranges or the number of datasets is small. Hence, this motivated the adoption of alternative approaches for determining interaction parameters for iodide interactions with such organic main groups. The results from those approaches are further discussed in Sect. 4.4.
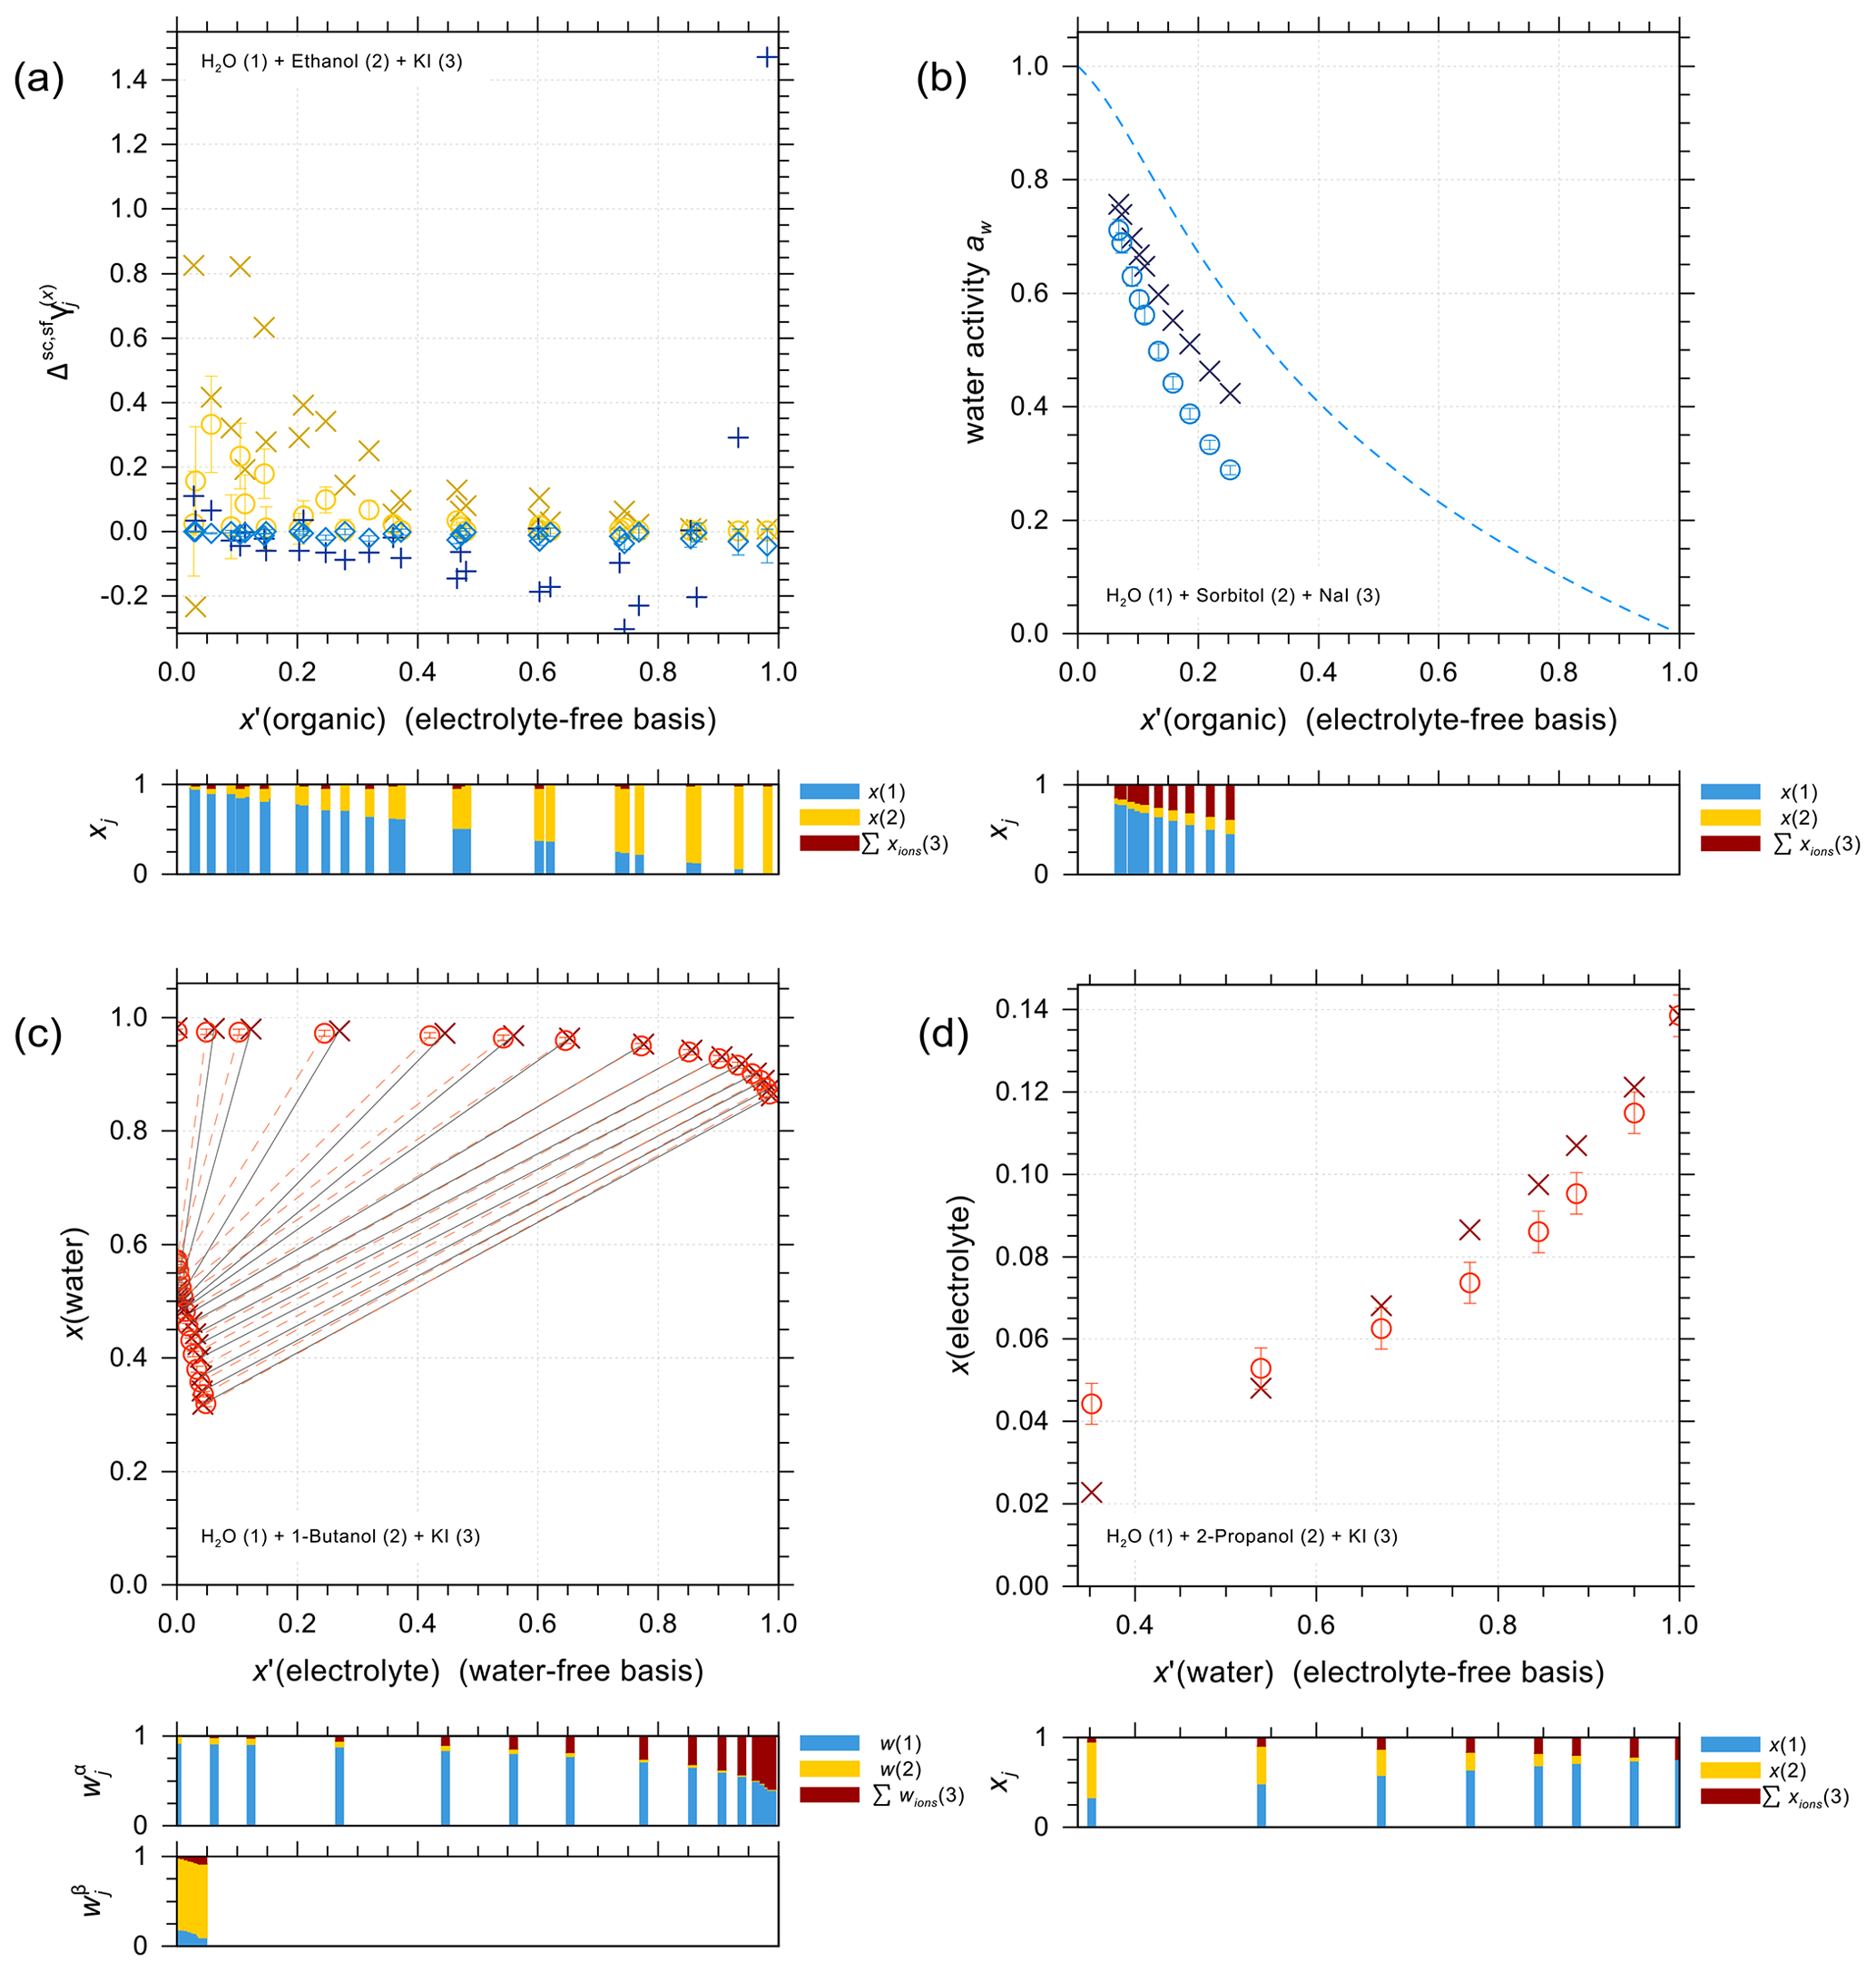
Figure 5Different types of experimental data (×, +) and AIOMFAC predictions (∘, ⋄) for water + alcohol + iodide salt systems with model sensitivity indicated by error bars. (a) Isobaric VLE data of water (1) + ethanol (2) + KI (3) at 351–366 K; experiments by Chen and Zhang (2003). (b) Water activity of water (1) + sorbitol (2) + NaI (3) at 288 K; experimental data (this study) for 1:1 mass ratio of sorbitol : NaI. (c) LLE of water (1) + 1-butanol (2) + KI (3) at 298 K; experiments by Al-Sahhaf and Kapetanovic (1997). (d) SLE of water (1) + 2-propanol (2) + KI (3) at 298 K; experiments by Pawar et al. (2012). The composition bar graphs show the mass fractions (in c) or the mole fractions (a, b, d) of the components with respect to dissociated salts.
4.2.3 Discussion of uncertainties in determining I− interaction parameters with organic main groups
The determination of interactions for I− ↔ organic main groups is based on the previously known parameters between cations and organic main groups from Zuend et al. (2011) and those between I− and other cations from this study. Unlike binary solutions involving inorganic electrolytes and water, for which the AIOMFAC calculations of water activity and mean molal activity coefficients are in excellent agreement with the experimental findings, there is typically notable model–measurement deviations when the group-contribution approach is applied to organic–inorganic systems, including the systems involving iodide ions. Several reasons could explain the above phenomenon. First, uncertainties already exist in the parameterization of mixtures of water and organic compounds, represented by the UNIFAC-based group-contribution mixing model within AIOMFAC (Zuend et al., 2011; Ganbavale et al., 2015). Hence, an observed model–measurement deviation in a certain iodide-containing mixture should not be expected to be explained solely (or completely) by the interactions among I− and organic main groups (i.e., the parameters to be determined via optimization). Since most measurements available and used in this study involve either NaI or KI as iodide salts, the I− ↔ organic main group interactions of interest become potentially biased by the involved counterions (Na+, K+). This is the case because the parameters of those cations with organic main groups typically may also be affected by a degree of uncertainty, which could be systematic, i.e., dependent on ionic strength and organic main group amounts. However, given that a large number of datasets were involved in optimizing the interactions of both Na+ and K+ with organic main groups in past work (Zuend et al., 2011), the bias from the use of these cations together with I− should be relatively small. In addition, considering the same class of organic compounds (e.g., carboxylic acids), the model–measurement agreement for some systems is sufficiently good (e.g., glutaric acid + NaI), yet clearly less than optimal for other systems (e.g., citric acid + NaI). This is largely a result of imperfection (or lack of specificity) in AIOMFAC's group-contribution approach when applied to certain organic compounds, since the model has not been fitted to perform optimally for each specific system. While system-specific parameterizations of AIOMFAC are possible, likely leading to improvements in problematic cases, such specificity is not the goal of AIOMFAC, since one would lose the predictability feature of the group-contribution model, which is clearly of importance for applications to atmospheric aerosol systems. Thus, the deviations between the presented model results and the experiments should not be solely attributed to the I− ↔ main group interactions. If one were to fit AIOMFAC only to achieve better agreement with a subset of experiments, issues of overfitting or unbalanced parameter constraints would be expected. The group-contribution approach and complexity of the underlying AIOMFAC expressions present a trade-off between a wider representation of organic compounds using a limited set of parameters and higher accuracy in specific systems. Ideally, the database of measurements used for the optimization of model parameters would include thousands of datasets covering a wide range of organic compounds (thereby many main groups in different ratios), different counterions, mixture compositions from dilute to highly concentrated, a broad range of temperatures, and small standard deviations in measurements. At present, the situation for constraining inorganic ion ↔ organic main group interactions is quite far from the outlined ideal one.
4.3 Aqueous inorganic carbonate electrolytes
The complete set of middle-range interaction parameters involving carbonic acid and salts is listed in Table 10. Some OH− electrolytes are poorly soluble in water; therefore, in the case of difficulty in fitting Ca2+ ↔ OH− and Mg2+ ↔ OH− interactions due to insufficient data coverage over a range of water activities, the relevant parameters were estimated based on those of cation ↔ I− (analogy approach). Since the concentration of OH− is generally very small compared to other ions in an aqueous solution, such an estimation is justifiable. In the following, we first discuss results for carbonate salts () and then highlight mixing behavior in H2CO3 and NaHCO3 solutions. In addition, the results for selected bicarbonate salts () are discussed to show the model's capability in solving the coupled equilibria.
Table 10Determined middle-range interaction parameters between cation–anion pairs in aqueous carbonate electrolytesa.
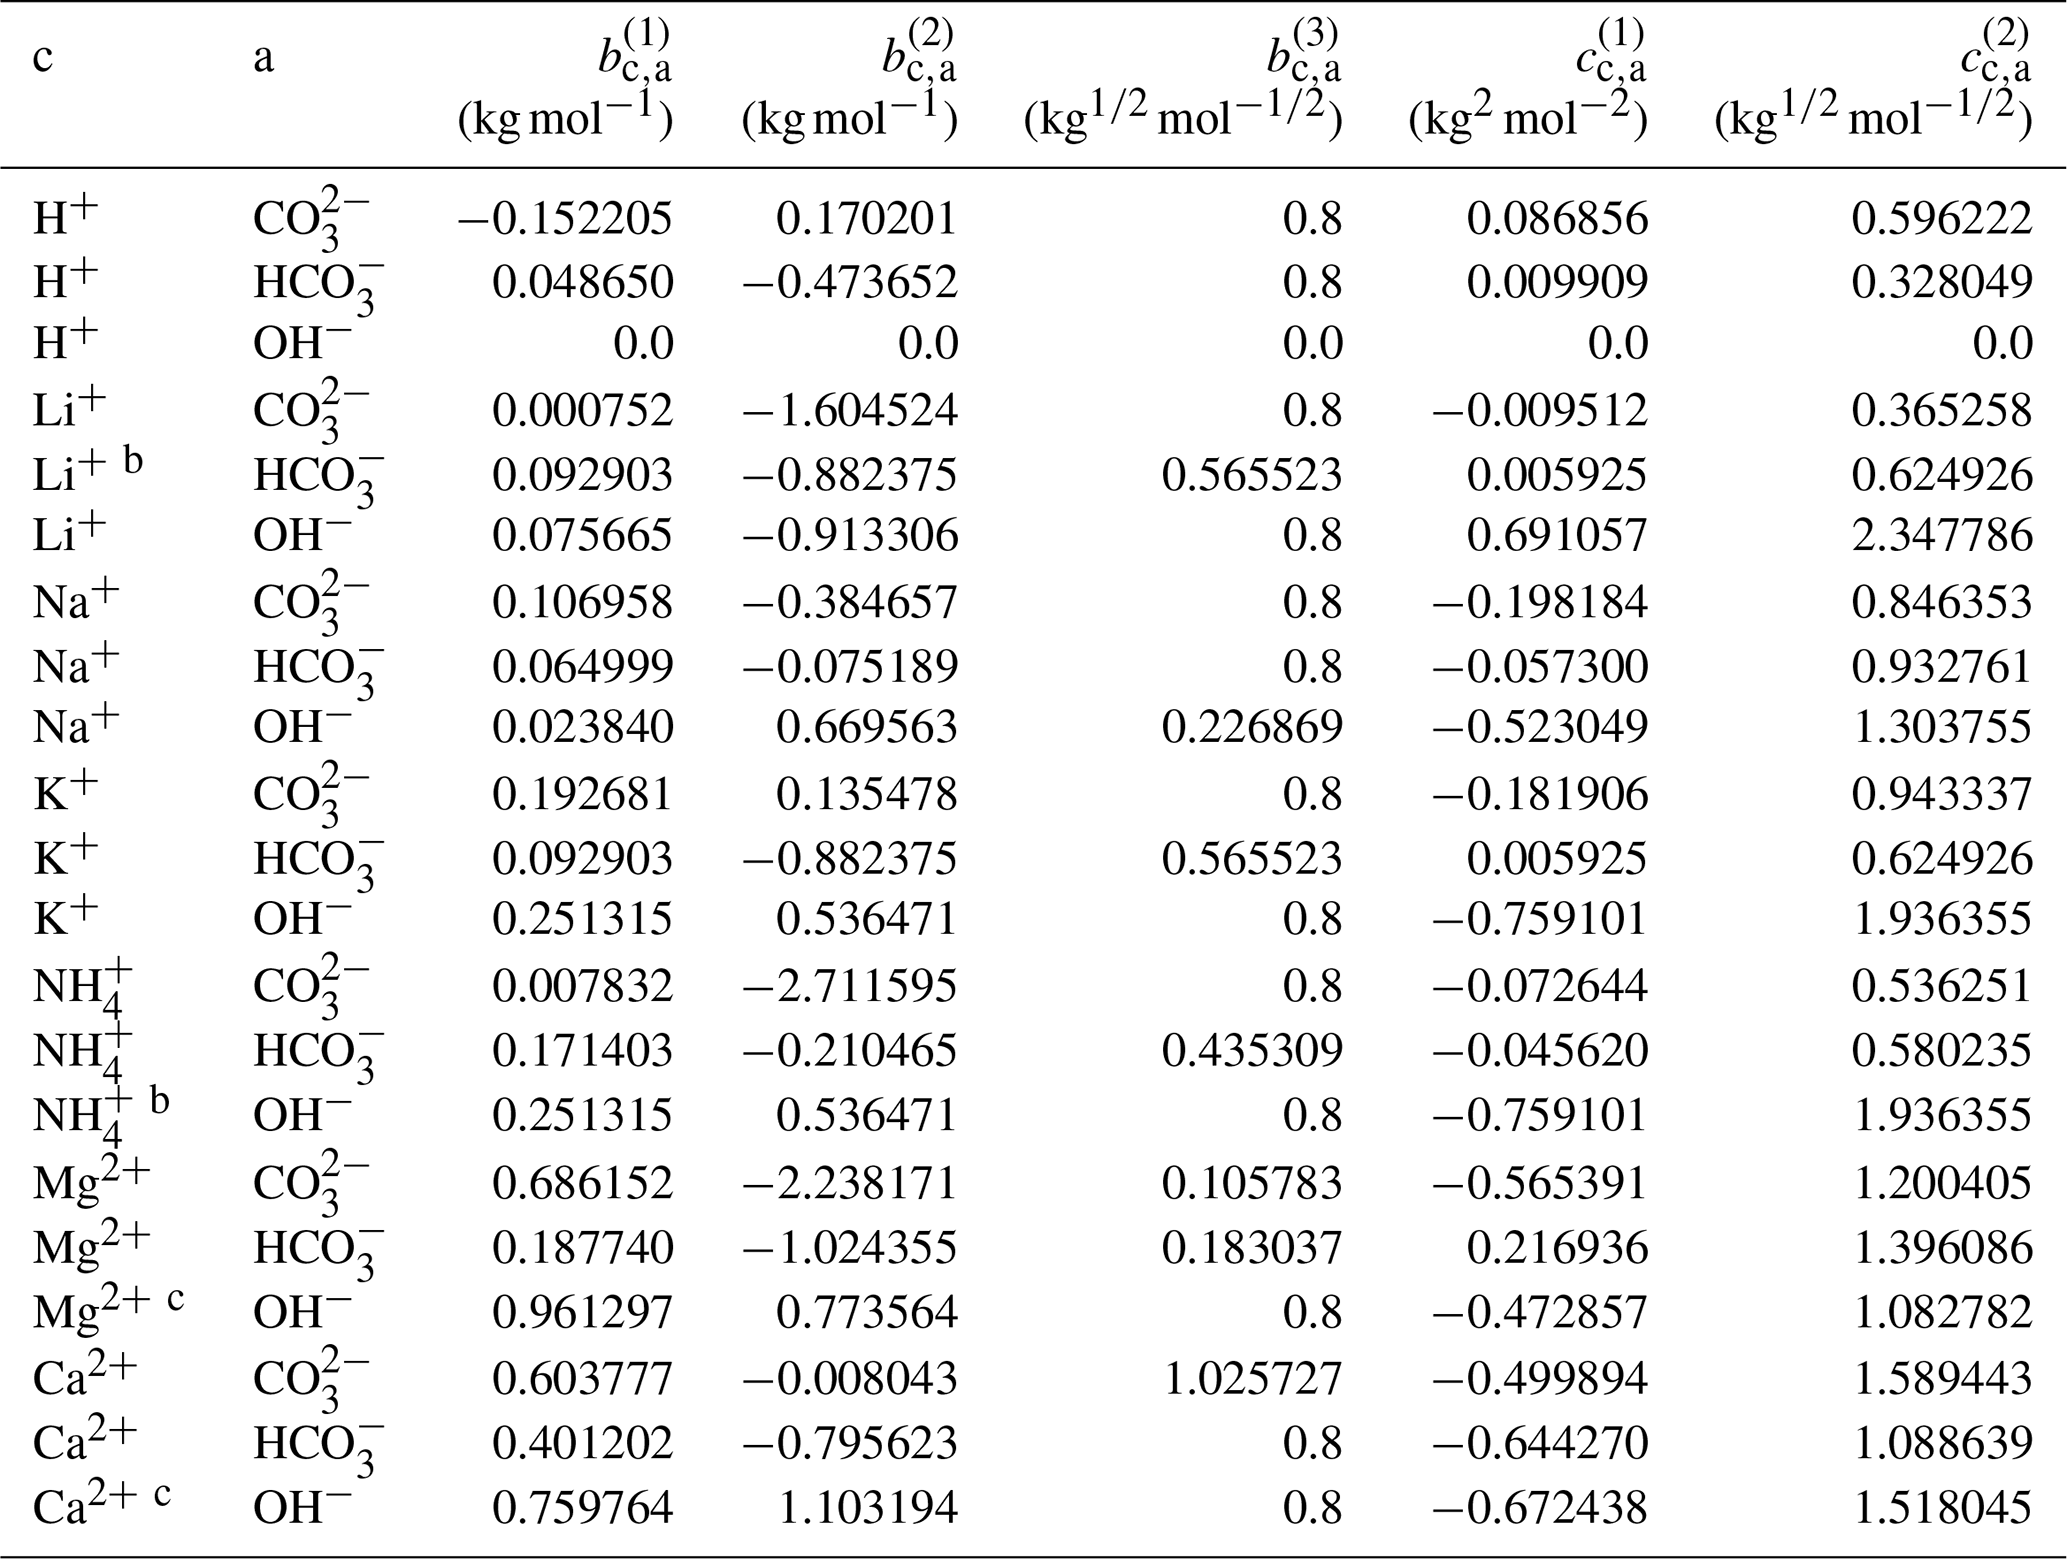
a The number of digits listed reflects the approximate precision used in the model code and does not imply that all digits are significant figures. b Estimated from the interaction parameters for K+ ↔ designated anions. c Estimated from the interaction parameters for designated cations ↔ I−.
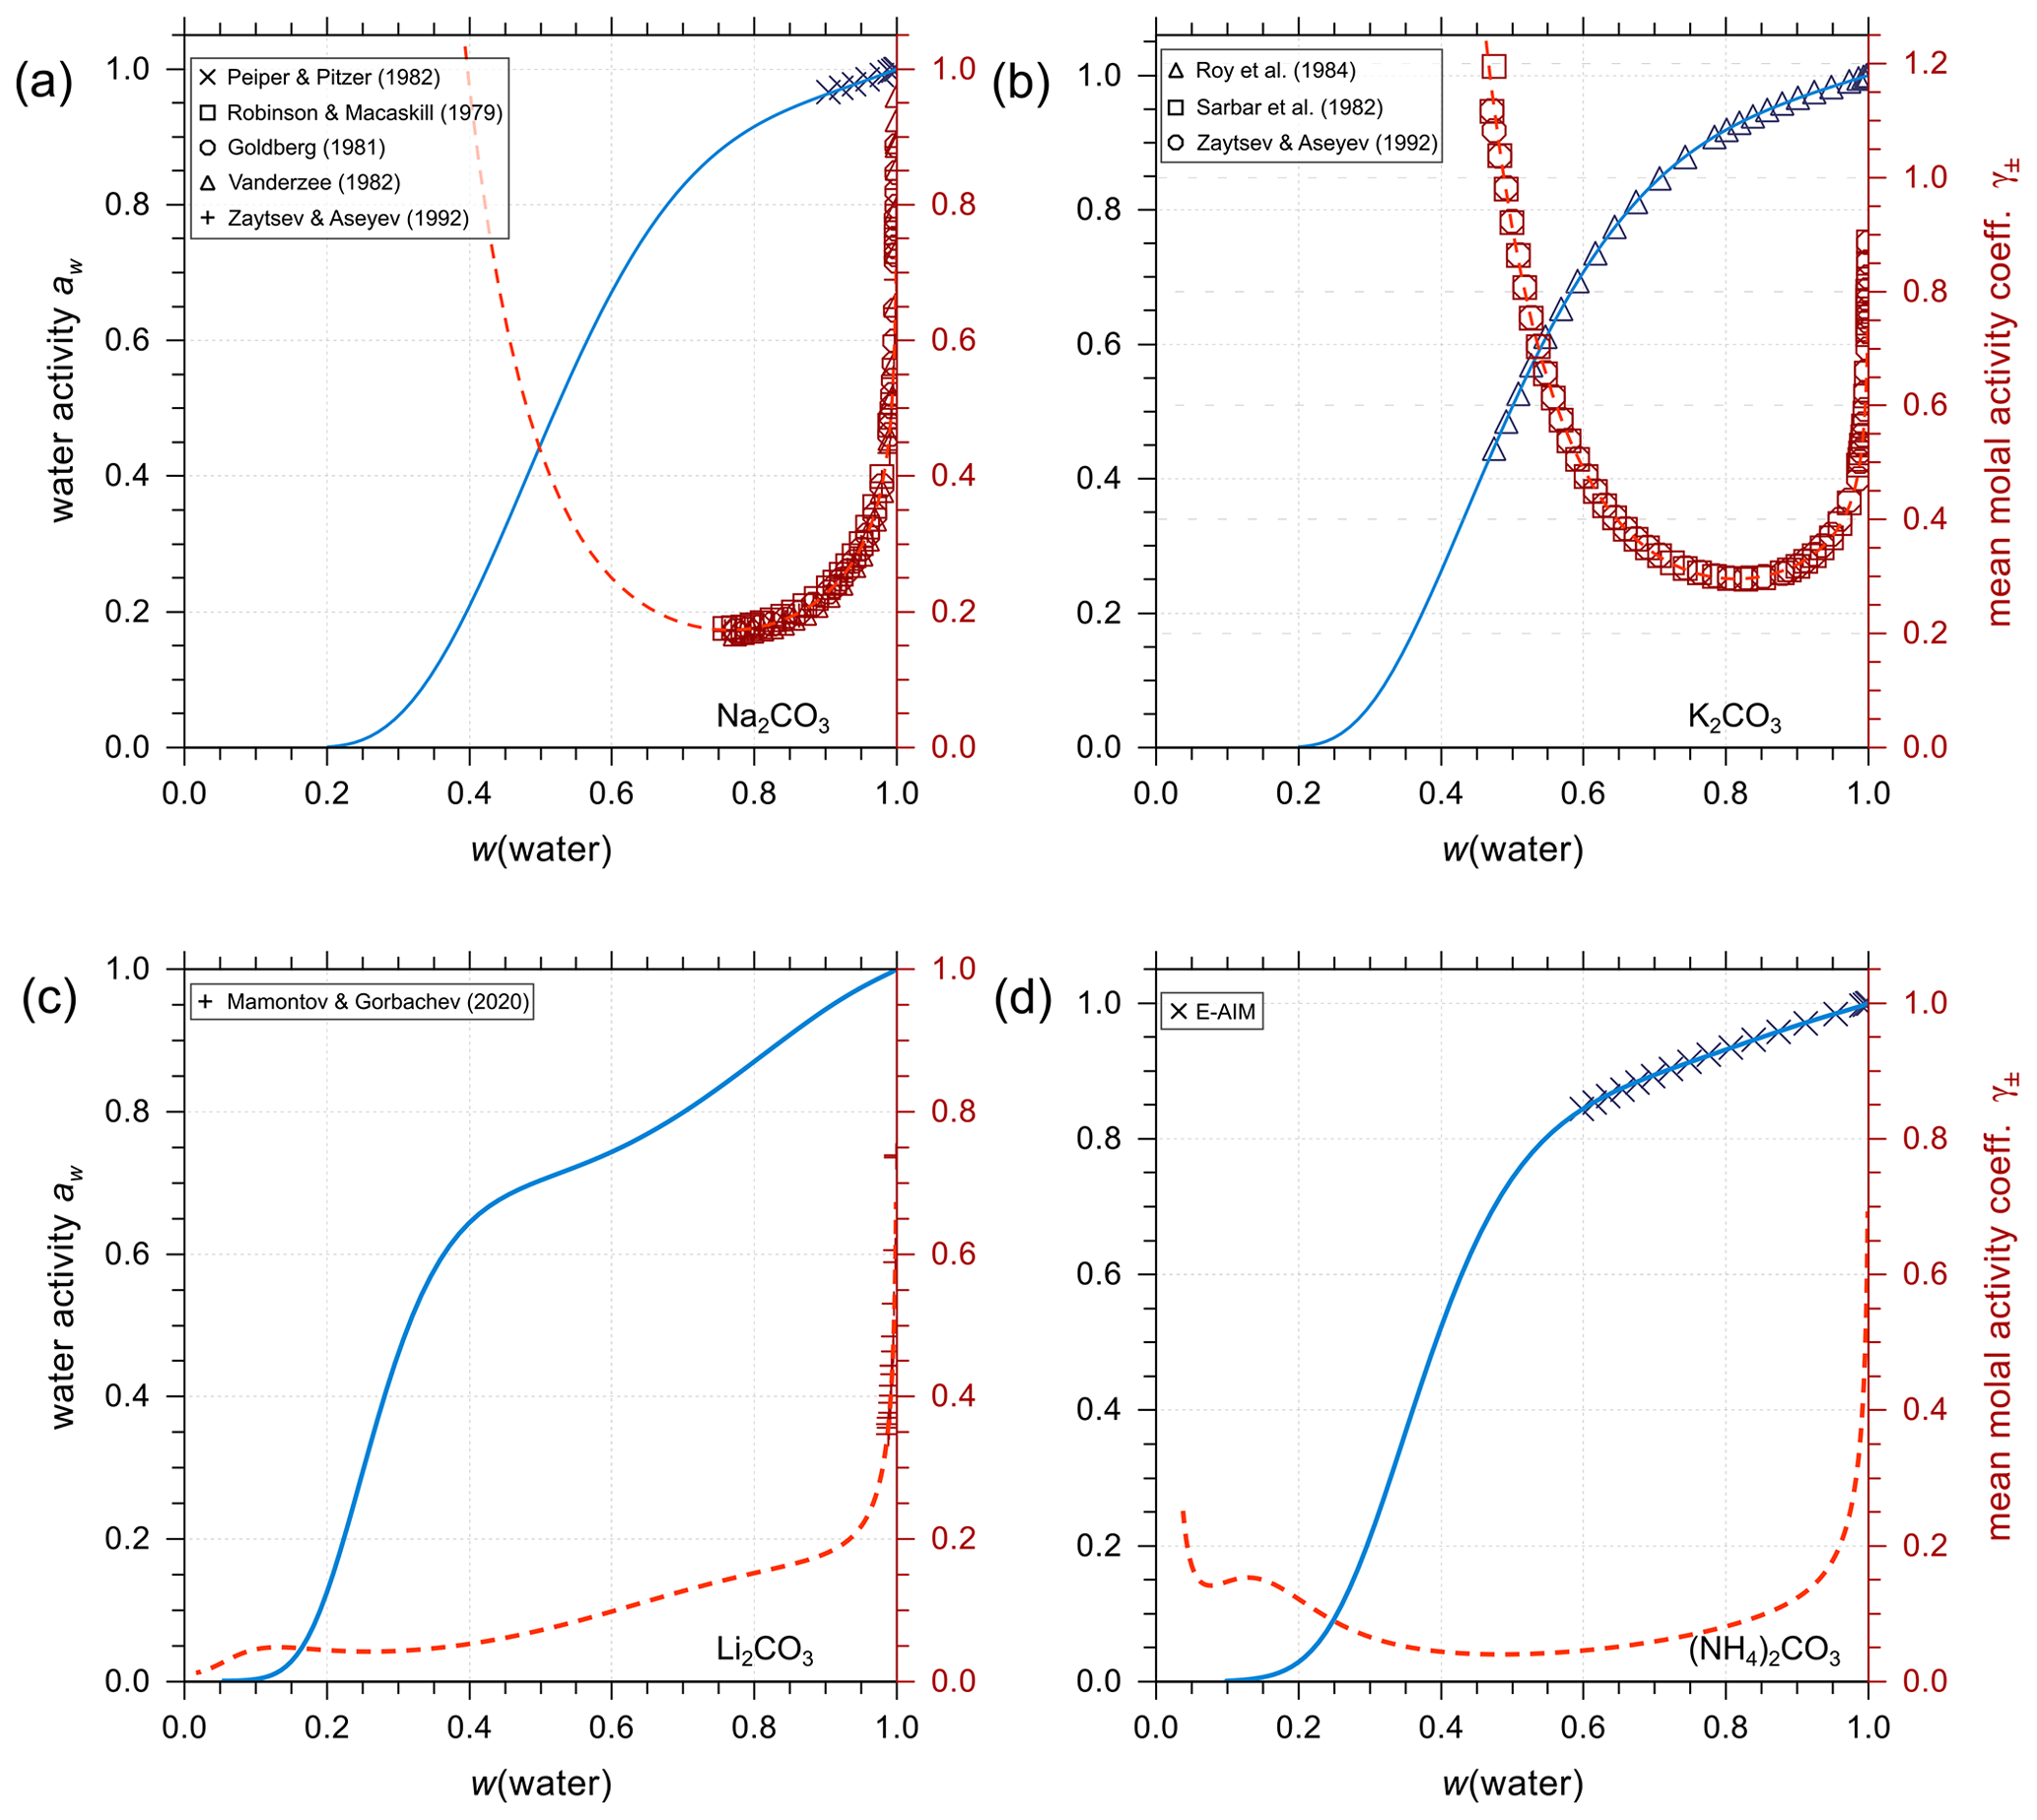
Figure 6Experimental or reference model data (symbols) and AIOMFAC predictions (curves) of water activity and mean molal activity coefficients of the carbonate electrolytes (a) Na2CO3, (b) K2CO3, (c) Li2CO3, and (d) (NH4)2CO3 in binary aqueous solutions at 298.15 K.
Analogous to the treatment of iodine salts, all carbonate salts are assumed to be completely dissociated (in the absence of significant amounts of bicarbonate). As shown in Fig. 6, AIOMFAC predictions are in excellent agreement with either experimental data or E-AIM predictions (generated data within the applicable range of that model). Using such data, we established the set of interaction parameters for different cations and the anion in the absence of bicarbonate and other ions. This enables a level of separation in terms of quantifying the influence prior to conducting the AIOMFAC parameter estimation for mixtures containing substantial amounts of the other ions of the bicarbonate–carbonic acid system, like H+ and .
4.3.1 Closed-system scenario
Figure 7a and b show AIOMFAC predictions of water activity and corresponding degree of dissociation in aqueous H2CO3 and NaHCO3 solutions. Figure 7c and d are the pH and partial pressure of CO2(g) of the same system as in the panels above them, plotted against mass fraction of water. In the case of H2CO3, both water activity and the dissociation degree data agree very well among the two models (E-AIM and AIOMFAC). The degree of dissociation is close to 1.0 except for extreme dilution in water, meaning presence of a low ratio of after the system reaches equilibrium. The composition bar panels indicate that the (closed, liquid) system is mainly composed of H2O (x(1)) and CO2(aq) (x(2)) with seemingly negligible amounts of ions across the whole concentration range. This phenomenon validates the assumption that given a lack of experimental data, assuming negligible interactions between water and CO2(aq) (see Sect. 3.2.1) is accurate. It is also noticeable that the water activity of an aqueous H2CO3 solution never reaches aw values below 0.6. This is the case because of the involved mass balance/exchange among all the solute species during the dissociation process. The backward reaction of (Reaction R1) makes the amount of CO2(aq) at high acid input comparable to that of water, which lowers the ionic strength consequently at equilibrium. Because the activity coefficient and activity are parameterized as functions of ionic strength in AIOMFAC, the low concentration of ionic species at equilibrium with initially high acid input makes low water activity in such systems unreachable. Moreover, even as a weak acid, the pH of the carbonic acid system remains below 4.0 until very high dilution in water. This outcome could only occur under the assumption that all the species remain in a single aqueous phase. However, when the (equilibrium) partial pressure of CO2(g) becomes extremely high (i.e., > 500 ppmv, parts per million by volume), the single phase scenario of a closed liquid system may not occur under normal atmospheric conditions where is near 400 ppmv. Hence, when the predicted CO2(g) partial pressure is higher than the typical ambient atmospheric value of about 415 ppmv presently in 2021 (Dlugokencky and Tans, 2021), this would be an indication that a potentially large fraction of the dissolved CO2(aq) would partition to the gas phase, if allowed (i.e., if treated as an open system) as discussed in Sect. 4.3.2.
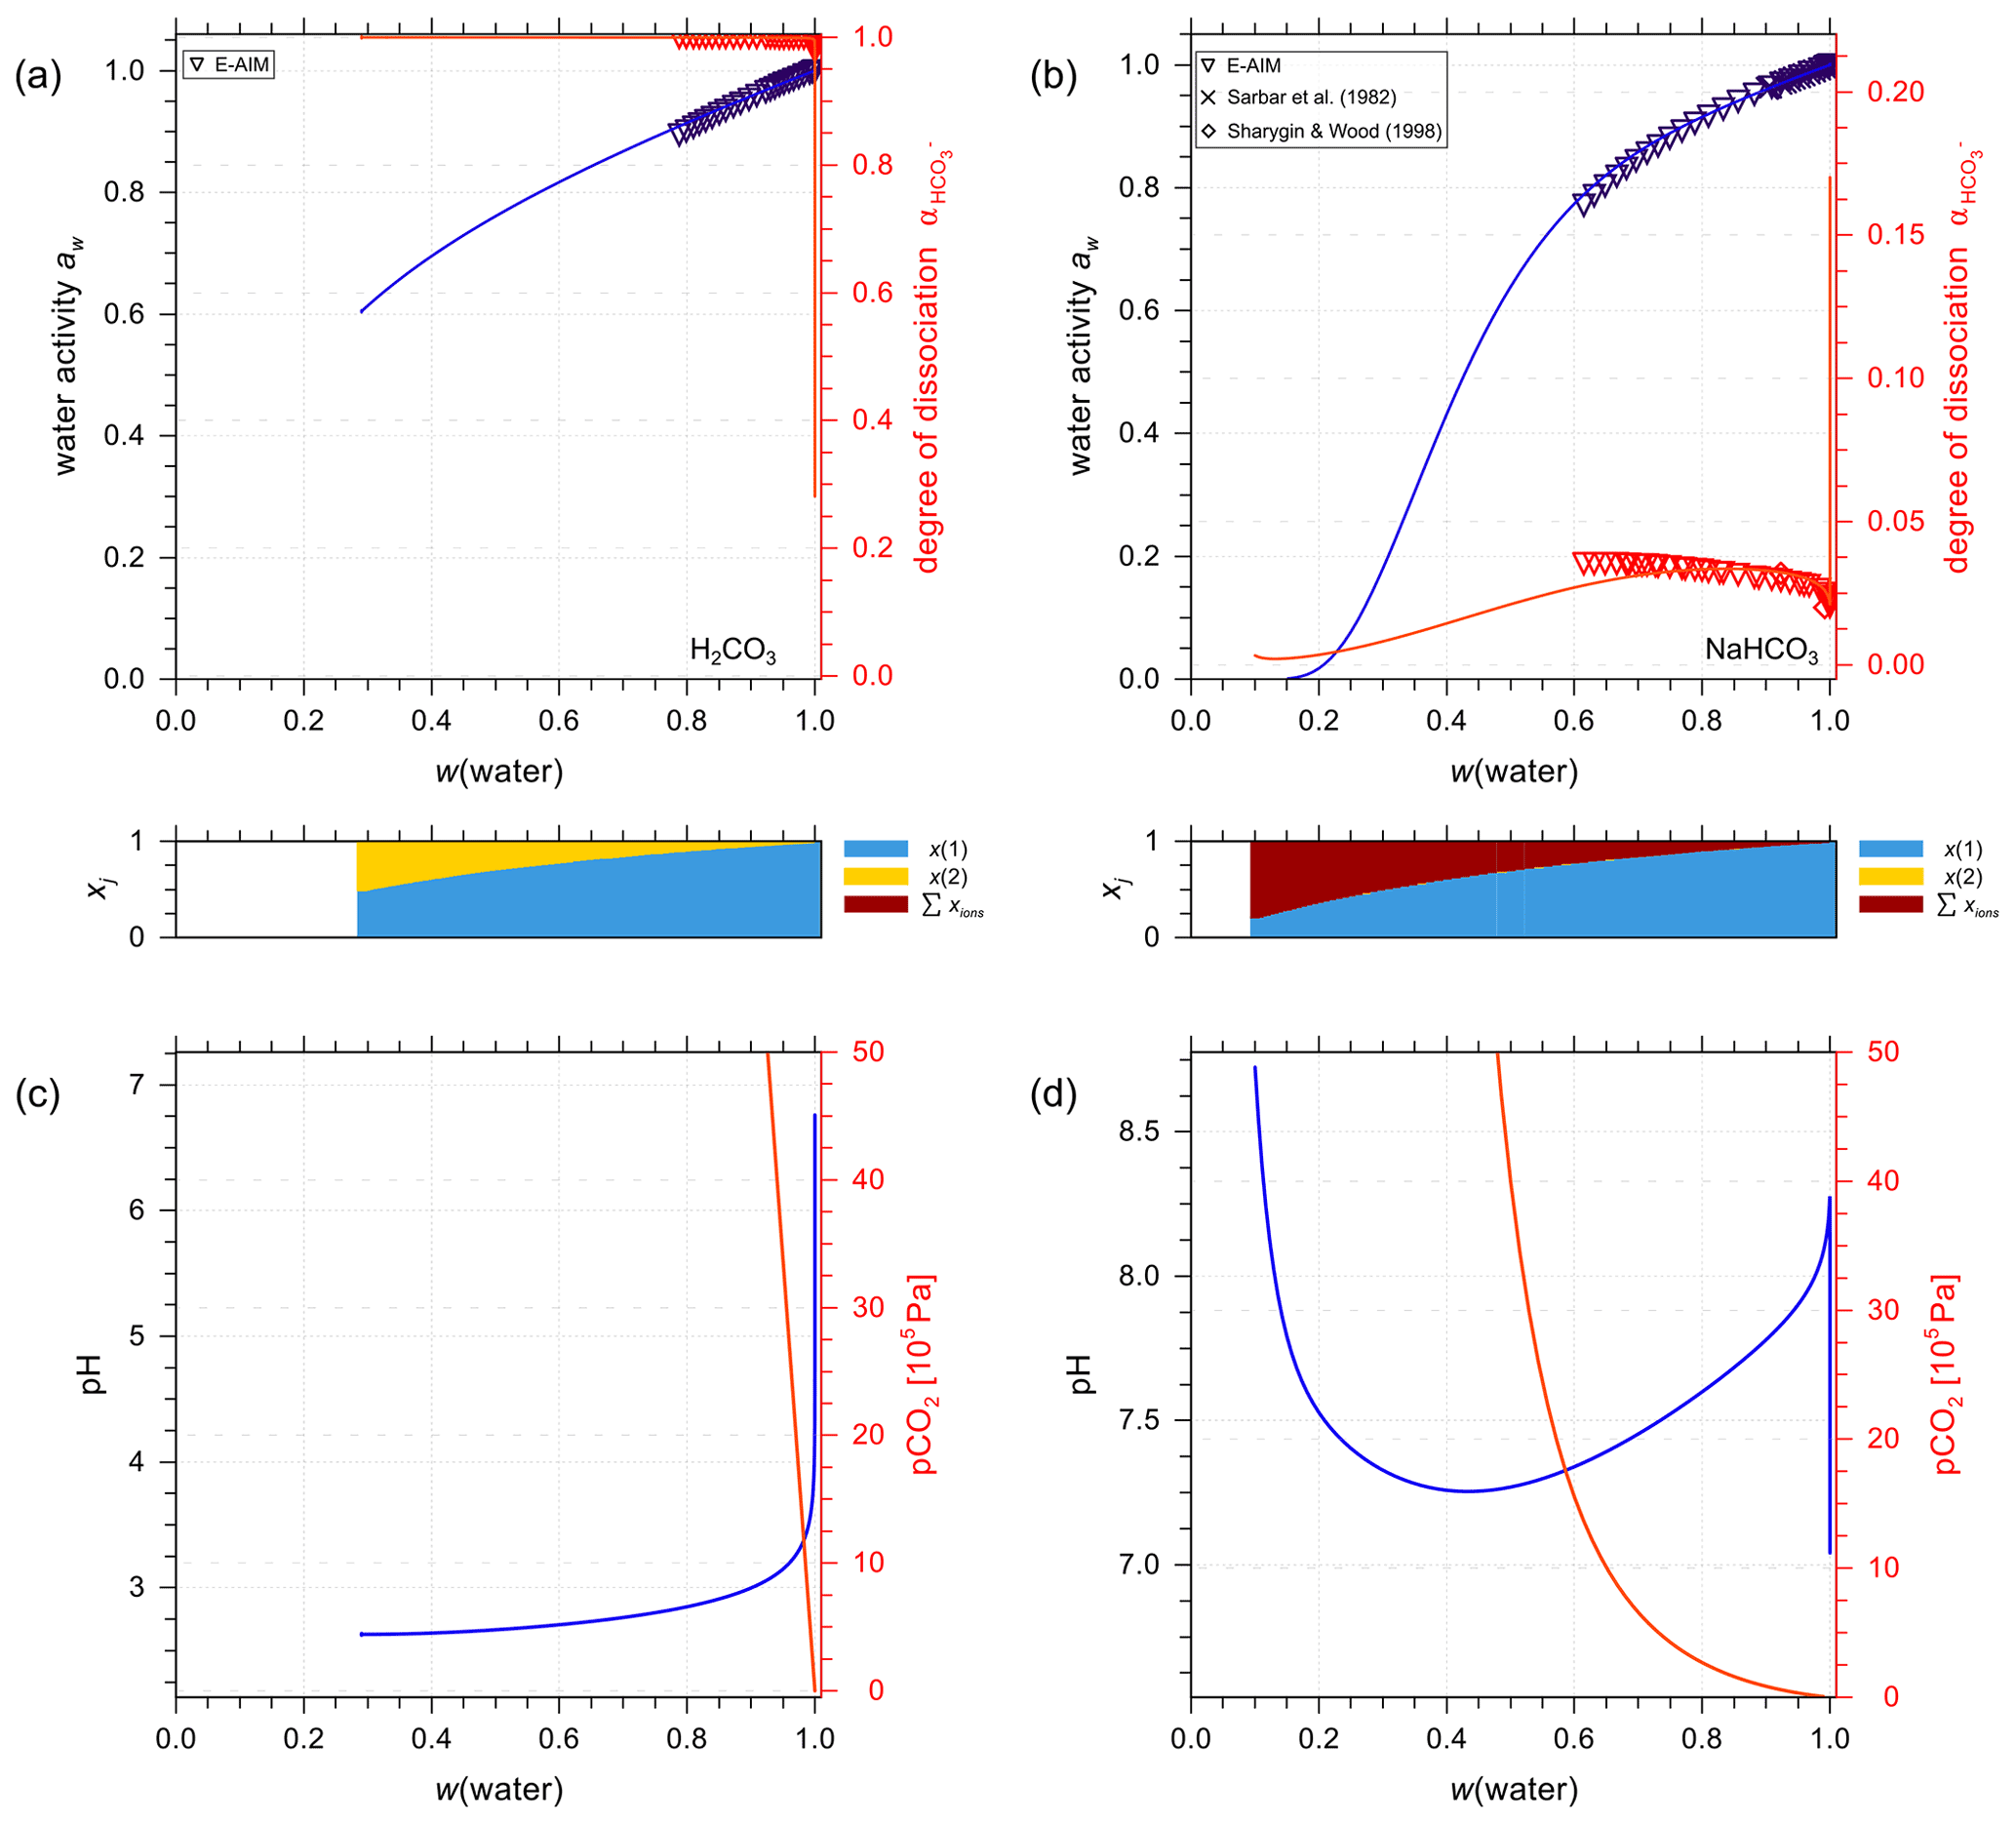
Figure 7Experimental or reference (symbols) and AIOMFAC predictions (curves) of water activity and dissociation degree of in aqueous (a) H2CO3 (mixture species: water + CO2(aq) + H+ + + + OH− ) and (b) NaHCO3 (mixture species: water + CO2(aq) + Na+ + H+ + + + OH− ) solutions at 298.15 K. pH and partial pressure of CO2(g) in (c) H2CO3 and (d) NaHCO3 (closed) systems.
The agreement between AIOMFAC predictions and the experimental data from Sarbar et al. (1982a) for aqueous NaHCO3 water activity covering the dilute range is excellent (see Fig. 7b). There is a slight deviation in the dissociation degree between the two models, which is expected as the weighting of the dissociation degree data from E-AIM is set as very small intentionally (i.e., 0.0001). The goal of the AIOMFAC optimization for bicarbonate interactions is to make our dissociation degree comparable but not identical to that in E-AIM. This is justified because the activities involved in the associated equilibria are similar but not necessarily the same. In contrast to H2CO3 solutions, the degree of dissociation is generally below 0.05 in NaHCO3 solutions. This makes sense since the latter solution is predicted to be of a pH value between 7.3 and 8.3; thus, a large fraction of carbonate would remain in the associated form of . Due to the smaller concentration of CO2(aq) at equilibrium compared to H2CO3, the increase in the equilibrium partial pressure of CO2(g) for NaHCO3 solutions is much more gradual than that for aqueous H2CO3.
Compared to the E-AIM online model for carbonate systems, which reports an error due to the exceedance of the supported input ion molalities, AIOMFAC is still able to solve the system of equations using the constraints on the equilibria at higher input concentrations of electrolytes. However, unlike the cases for other aqueous solutions of inorganic electrolytes for which AIOMFAC is able to perform well at very high ionic strengths, the validity in systems involving bicarbonate electrolytes becomes numerically limited to some degree. This is the case because the three equilibria and the mass balance equations have to be fulfilled simultaneously; it becomes numerically challenging to solve the system of equations reliably for highly concentrated conditions. Furthermore, the high partial pressure of CO2(g) at acidic conditions may violate the applicability of the thermodynamic equilibrium constant, which in strict terms is only valid near 1 atm total pressure. However, exceedingly high CO2(g) partial pressures are only relevant for situations involving extremely high total pressures. In conclusion, AIOMFAC performs very well even in a closed system when the ionic strength becomes very large and when the associated equilibrium partial pressure of CO2 exceeds atmospheric pressure by far. The highly concentrated bicarbonate solutions, under immense CO2 partial pressure and hence total pressure (for which no validation data exists), correspond to the condition far from any application in Earth's atmosphere. As a result, for the conditions relevant to tropospheric aerosols, the model is considered to perform well.
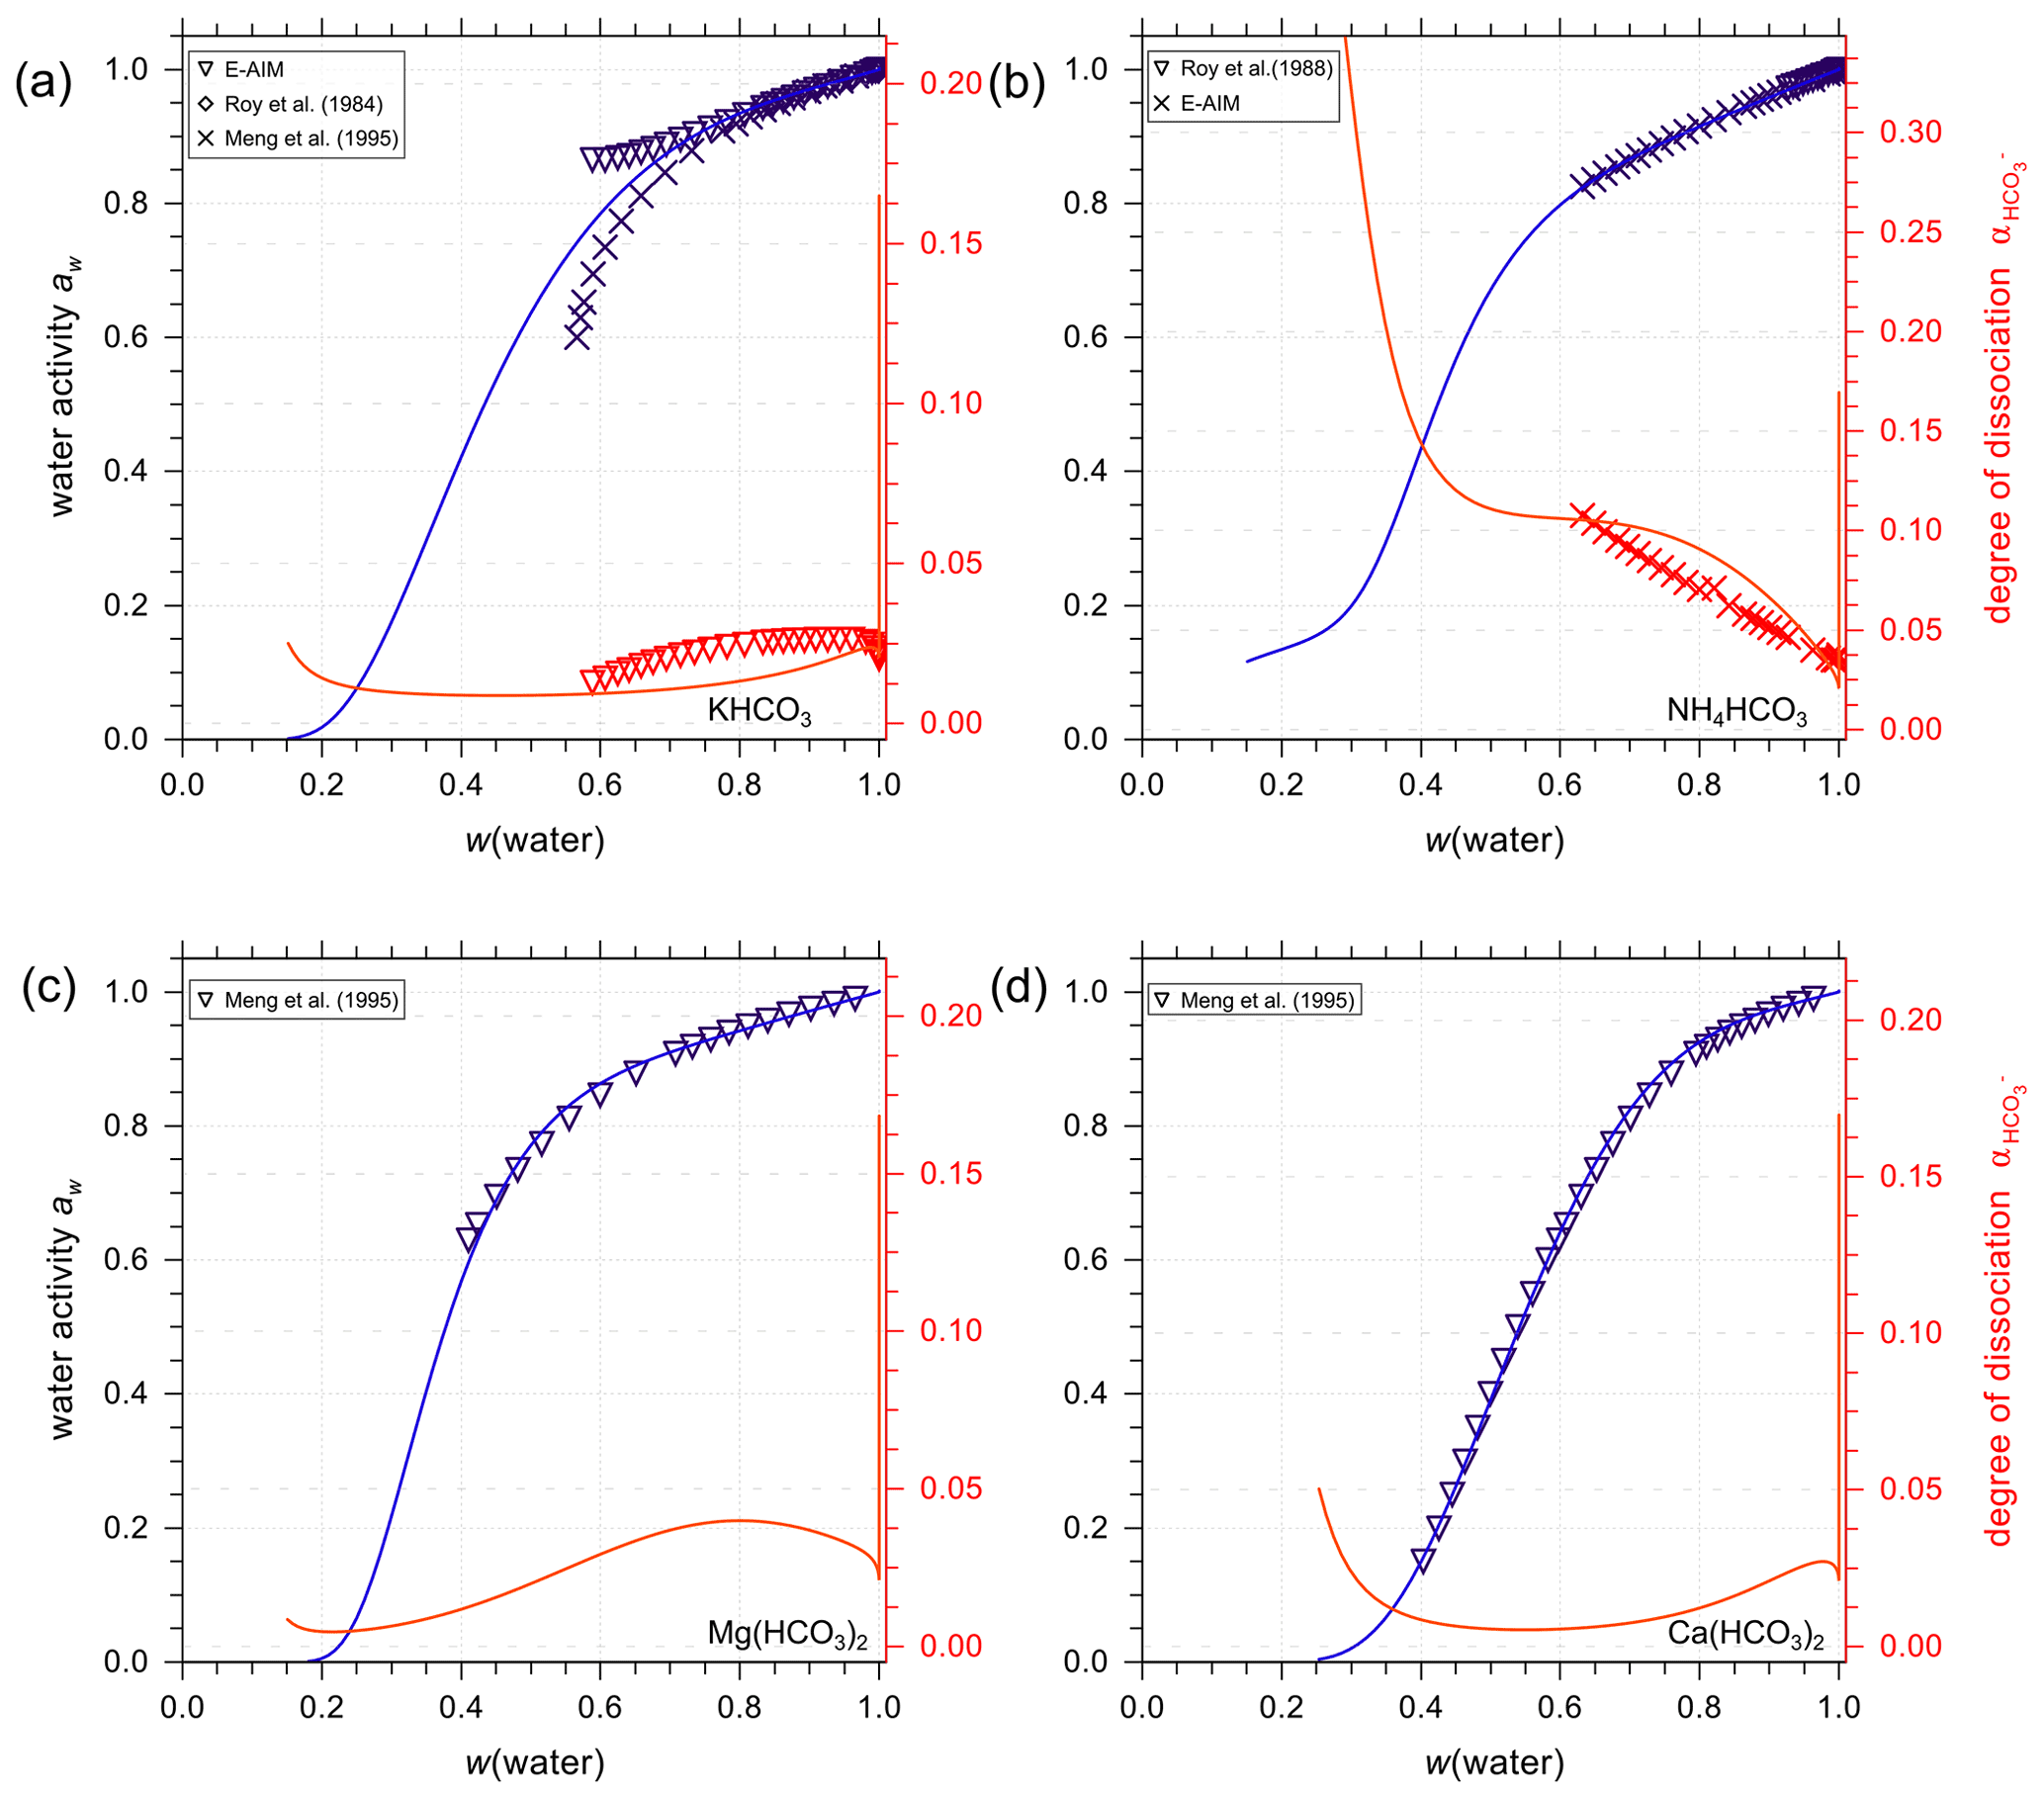
Figure 8Experimental or reference (symbols) and AIOMFAC predictions (curves) of water activity and degree of dissociation of in aqueous (a) KHCO3, (b) NH4HCO3, (c) Mg(HCO3)2, and (d) Ca(HCO3)2 solutions at 298.15 K (closed systems).
Figure 8 presents AIOMFAC predictions and reference water activity alongside dissociation degree data for aqueous KHCO3, NH4HCO3, Mg(HCO3)2, and Ca(HCO3)2 solutions to showcase a selection of other bicarbonate salt systems. In the data range covered by experiments of KHCO3 in water, E-AIM, the model by Meng et al. (1995) and AIOMFAC agree very well with each other. However, there are major discrepancies in water activity data generated by E-AIM and Meng et al. (1995) beyond the experimentally accessible range. In this range (where the disagreement occurs), the AIOMFAC model parameter fit was not forced to match well with either of the model-generated reference data. Hence, the AIOMFAC curve in Fig. 8a represents a distinct interpretation of the equilibrium solution behavior at lower water contents. In other cases, such as Fig. 8b–d where the reference water activity data are used to fit AIOMFAC ion interaction parameters, such as Mg2+ interacting with and , the good agreement between AIOMFAC output and the reference aw data is as expected. Similar to the case of aqueous NaHCO3, AIOMFAC offers its own reasonable prediction of the speciation and the bicarbonate dissociation degree in the bicarbonate salt solutions.
One might argue that the closed-system scenario is unlikely to occur in the real atmosphere when water activity or relative humidity is below a certain threshold; however, the consideration of such cases is to fit the AIOMFAC interaction parameters between cations and carbonate/bicarbonate ions following the same method as E-AIM and SCAPE 2 (i.e., a closed-system treatment).
4.3.2 Open-system scenario
We further performed a set of calculation scenarios for an open system, in which CO2(aq) is always in equilibrium with a target gas-phase CO2(g) mixing ratio of 400 ppmv, approximately equivalent to 40.5 Pa at 1013.25 hPa total pressure. The equilibrium computation is initialized with 1 kg of water and 400 ppmv of CO2(g) in 1 m3 of air. This setup is just a means to solve the system and not necessarily to be representative of aerosol mass concentration. Reactions (R1) to (R4) are solved simultaneously with the equilibrium volume of the air being treated as adjustable, such that the CO2(g) partial pressure matches the target value. The results for aqueous NaHCO3 solutions following this scenario are shown in Fig 9. For the system to reach equilibrium, the final volume of the air can be very large in contrast to the initial 1 m3, because of the relatively large amount of solvent/solution used in these scenarios. Compared to a closed-system scenario (e.g., Fig. 7b), the degree of dissociation is much higher, indicating a higher concentration of at equilibrium at the same mass fraction of water. In general, the open thermodynamic system is more basic in terms of pH than the closed one due to the shift in Reaction (R4) with smaller concentration of H+ at equilibrium. Also, the substantially lower concentration of CO2(aq) present in the liquid phase affects the degree of dissociation strongly. The open system assumption serves the purpose of illustrating a more realistic atmospheric scenario compared to the closed system (which is essentially a system of a single aqueous phase in a closed container with a comparably small gas phase).
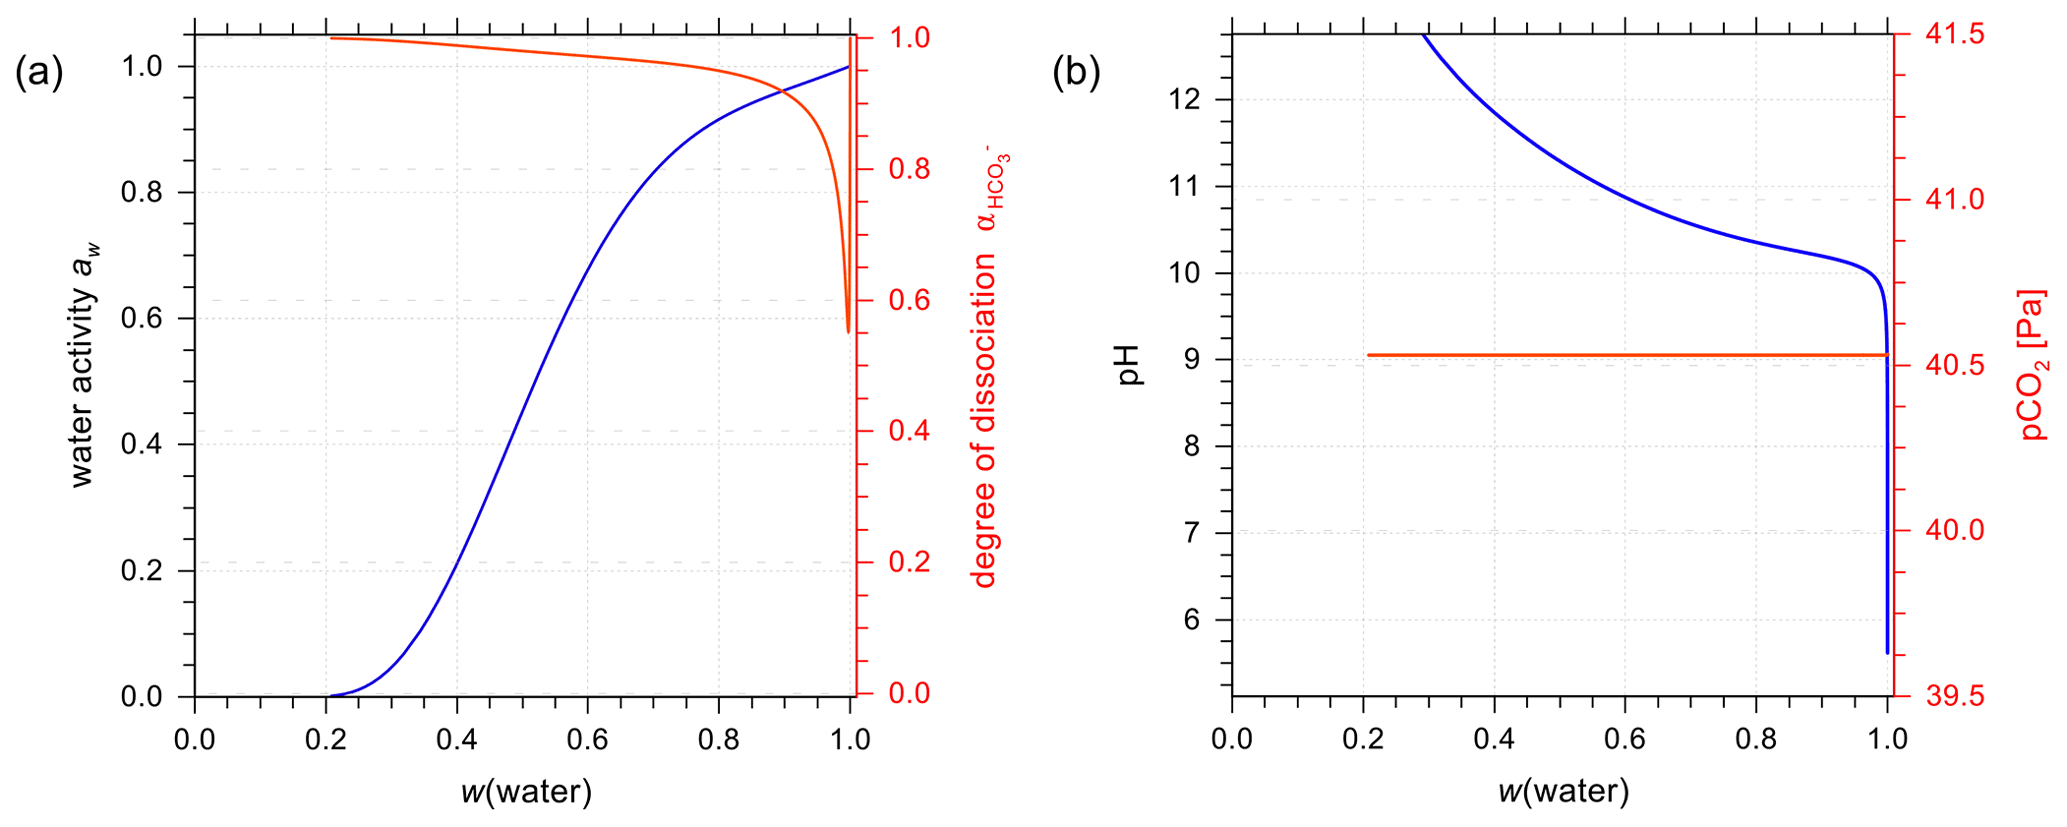
Figure 9Open-system scenario with constant partial pressure of CO2(g) at 298.15 K. The liquid phase is an aqueous NaHCO3 solution. (a) AIOMFAC predictions of water activity and degree of dissociation; (b) pH and partial pressure of CO2.
4.3.3 Comparison with the exclusion of water dissociation
Unlike E-AIM, which makes the auto-dissociation of water a default equilibrium reaction to solve in the presence of carbonic acid, we implemented the option of including/excluding it to accommodate solving a simpler set of equations for systems/cases in which this reaction can be neglected. When consideration of the water dissociation process is switched off, there is one variable less () and one equilibrium less (Reaction R3) to solve. In this case, the contribution of to the maximum H+ expression in Eqs. (15) and (18) vanishes. Figure 10 shows a direct comparison of computed pH values when the auto-dissociation of H2O is either included or excluded. The examples shown are for aqueous (a) NaHCO3 and (b) H2CO3 solutions covering the water activity range from about 0.65 to 1.0. The effect of water dissociation on pH is demonstrated to be negligible at most water contents since the concentrations of both H+ and OH− contributed by water dissociation are small compared to the buffering effect on pH by other species in the system. Therefore, the simplification of omitting the auto-dissociation of water in standard AIOMFAC is justified under most conditions. An exception to this conclusion applies at very high water activity (i.e., aw > 0.99994) where the pH of the solution with consideration of water dissociation tends to be closer to neutral (pH ≈ 7 at 298 K) due to the buffering capacity of water becoming important at extreme levels of dilution (see Fig. 10a). Hence, accounting for water auto-dissociation may have some impact on the activation of cloud condensation nuclei and/or the pH of cloud droplets; although, the water activity values at the point of CCN activation are usually smaller than 0.9999 (typically between 0.996 and 0.9998 depending on CCN dry size (e.g., Ovadnevaite et al., 2017)). It is also evident that the effect of water dissociation becomes most relevant for solutions existing within about 1 pH unit above/below neutral pH.

Figure 10Comparison of calculated pH for the same input solution compositions but with (x axis) or without (y axis) the consideration of the equilibrium auto-dissociation of water (). (a) Aqueous NaHCO3 and (b) aqueous H2CO3 solutions at 298.15 K. Color axis: equilibrium water activity.
4.3.4 Exploration of aqueous mixtures: open vs. closed system
In the special occasion when both sulfuric and carbonic acids are present in a solution, the incomplete dissociation of the ion has to be taken into account as well. An example is shown in Fig. 11a for water activity predictions from the E-AIM and AIOMFAC models for 1:1 molar mixing of aqueous H2CO3 to H2SO4 in a closed system. Since the two models have been parameterized independently, the general agreement in terms of predicted water activity indicates that both models are capable of characterizing this multi-acid system. The dissociation degree of is close to 1.0 due to the solution's high acidity. Whereas the dissociation degree of shows a sharp decrease in the dilute concentration range and a mild fluctuation with increasing acid input, similar to that of a pure aqueous H2SO4 solution. This is expected since the bisulfate–sulfate equilibrium is mainly buffering the acidity of this mixture until very high dilution in water.
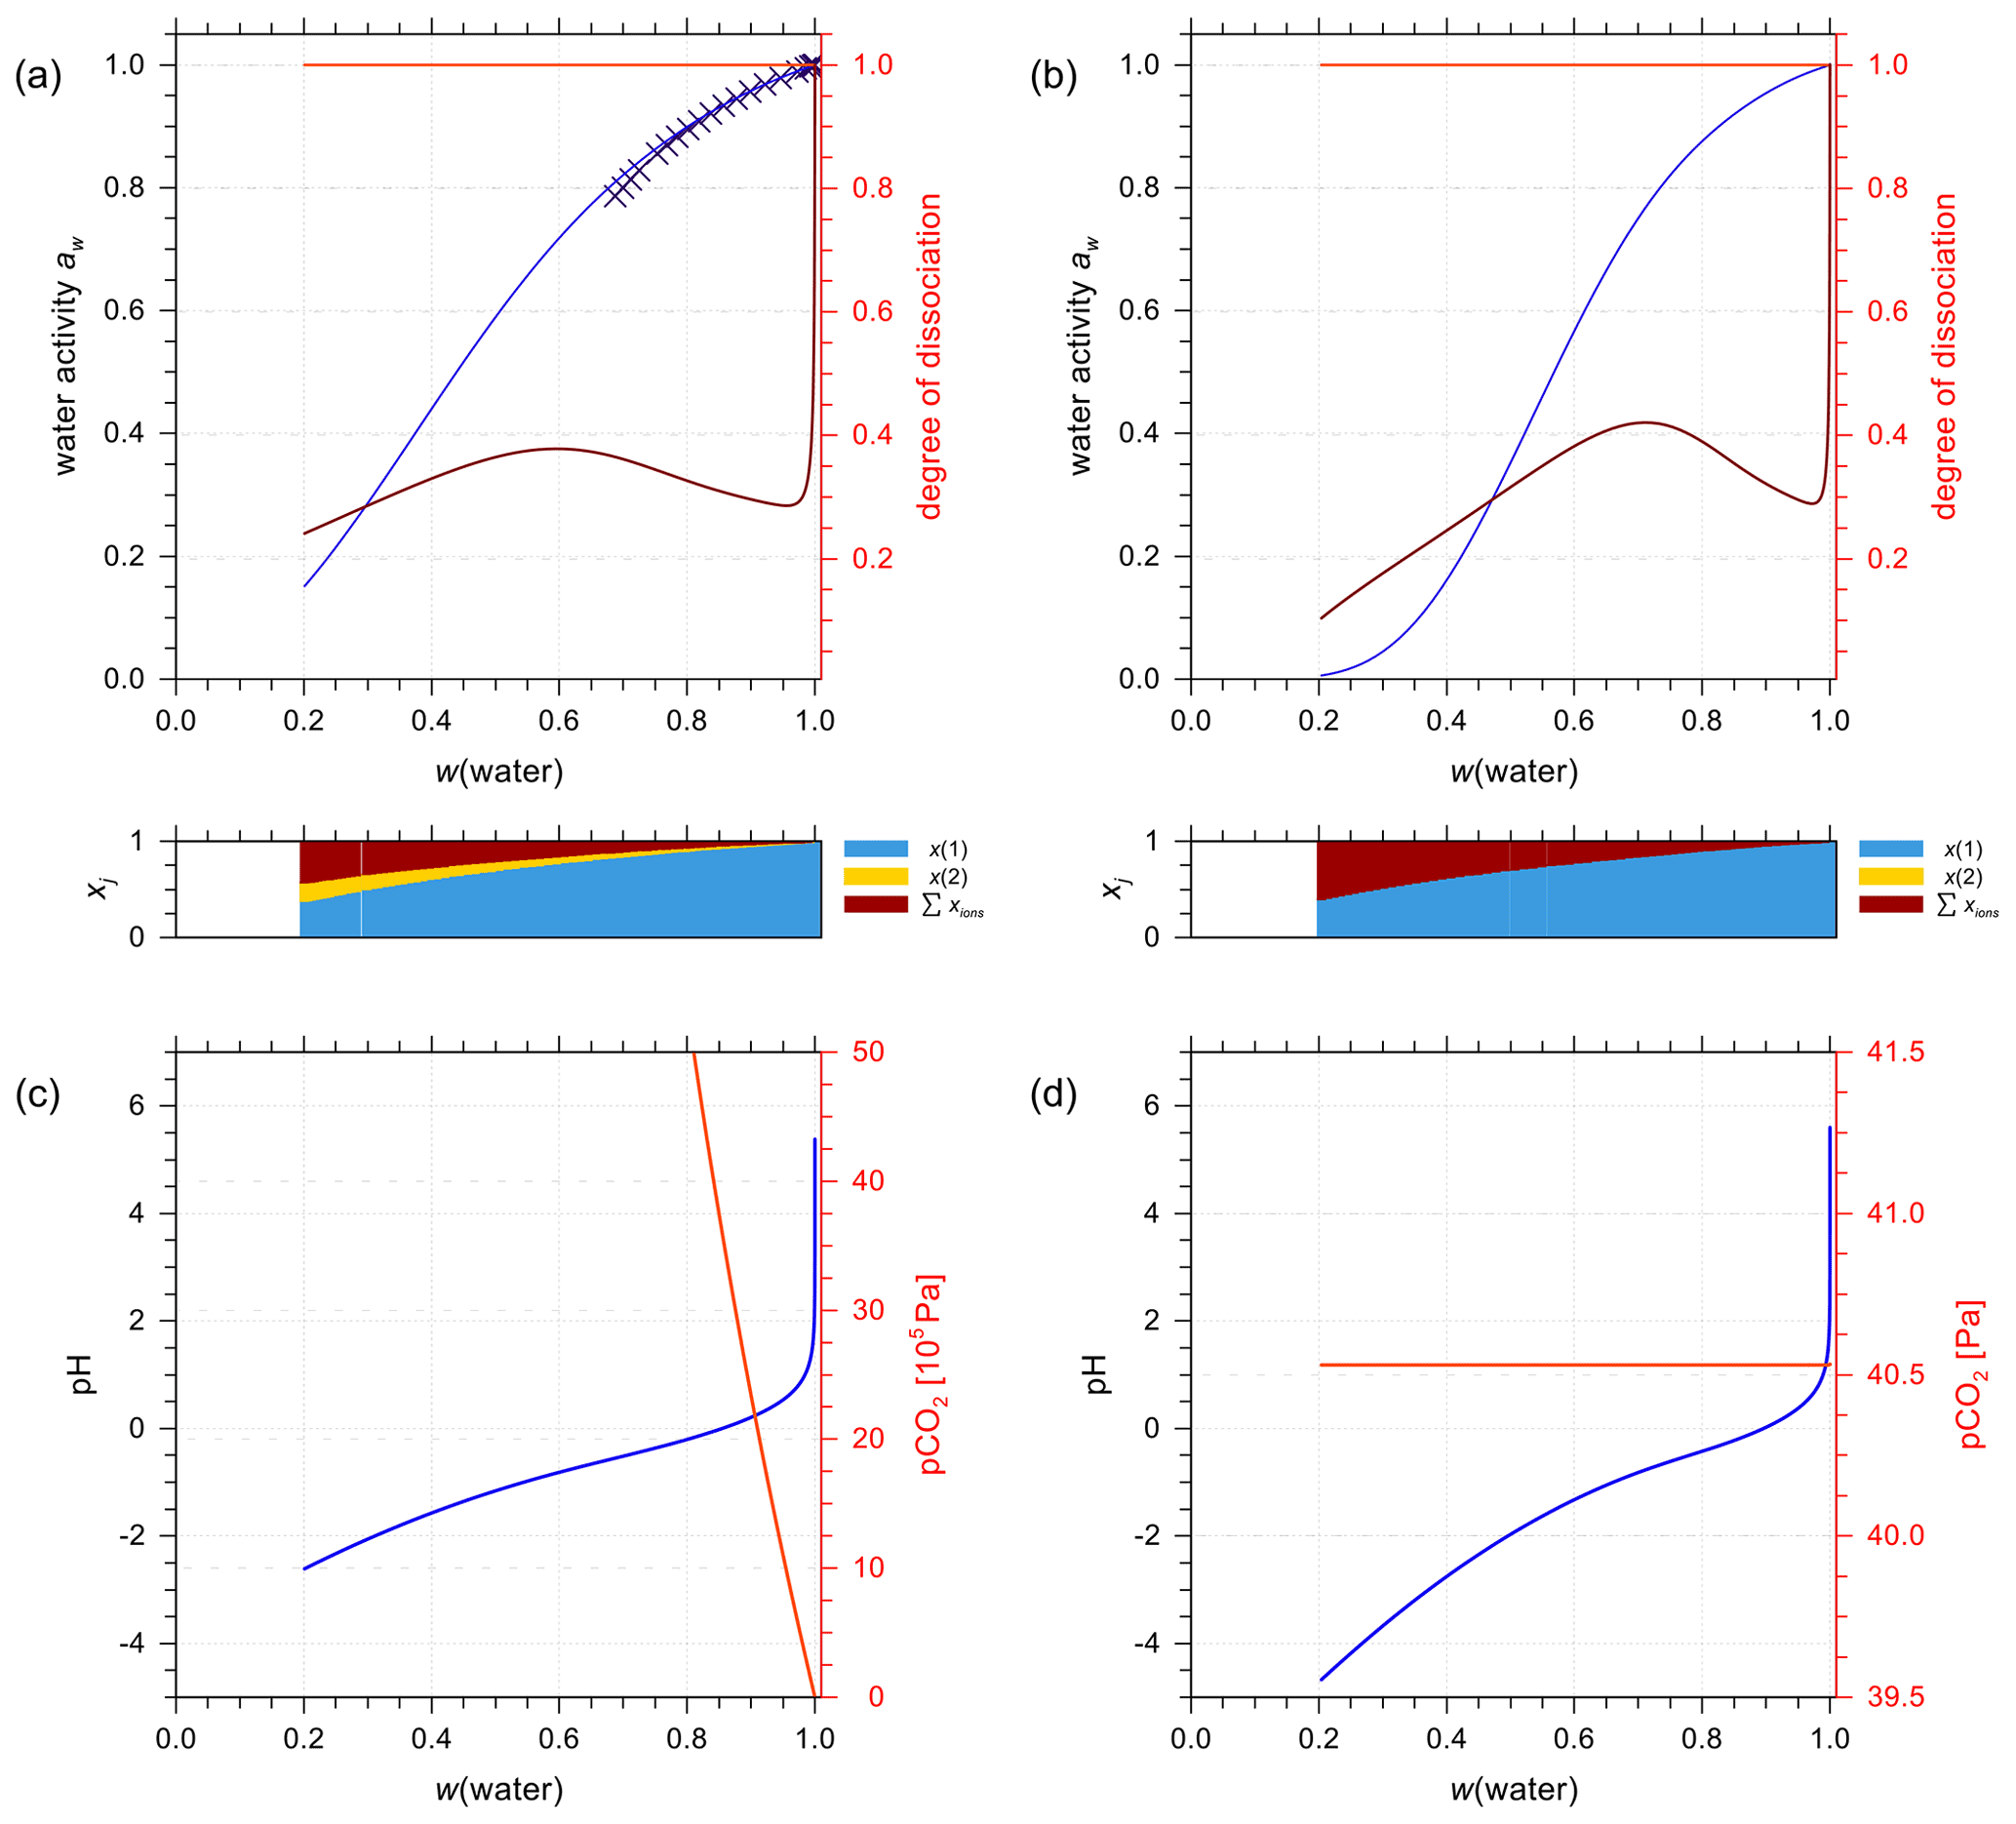
Figure 11E-AIM (symbols) and AIOMFAC predictions (curves) of water activity for an aqueous solution containing H2CO3 + H2SO4 mixed 1:1 by moles at 298.15 K (mixture species: water + CO2(aq) + H+ + + + + + OH−). (a) Closed and (b) open system conditions. The AIOMFAC prediction of the degrees of dissociation are shown on the right y axis for (light red curve) and (brown curve). (c, d) pH and partial pressure of CO2(g) for (c) closed-system and (d) open-system scenarios (400 ppmv CO2(g)). Note the different axis scales.
Analogous to the treatment discussed in Sect. 4.3.2, the solution is placed in an open system where CO2(aq) is set to be in equilibrium with a fixed partial pressure of CO2(g). Figures 11b and d show the predicted water activity, dissociation degrees, pH, and the partial pressure of CO2 of the same H2CO3+H2SO4 mixture in the open system case. At the same mass fraction of water, water activity in the open system is considerably lower than that in the closed system, especially in the concentrated electrolyte range. This is largely due to the difference in speciation of the carbonate species, since in the open system the fraction of CO2(aq) is considerably less than that in the closed system. In addition, the solution in the open system is predicted to be much more acidic than in the closed-system case when w(water) < 0.8. These results demonstrate that the equilibrium composition of will no longer be 1:1 in the open system, and the aerosol is likely almost carbonate-free in comparison to sulfate. Thus, under typical conditions in the atmosphere, sulfate-rich aerosols are expected to contain only very small amounts of dissolved carbonate species. Aerosol thermodynamic models like ISORROPIA II (Fountoukis and Nenes, 2007) or MOSAIC (Zaveri et al., 2008) then often neglect carbonate species and various equilibria involved in the choice of model design due to computational efficiency and targeted applications.
4.4 Systems determined by alternative approaches
As discussed in Sect. 3.5, the interaction parameters for Br− and Mg2+ with CHn, , COOH, and OH alongside calculated Bk,i at selected ionic strengths are used as independent variables in the regression analysis to predict the unknown parameters for I− interacting with designated organic main groups. The regression resulted in an estimation of the parameters for I− with CHnCO, CHO, CHnO, C=C, ACHn, and ACOH from the expressions
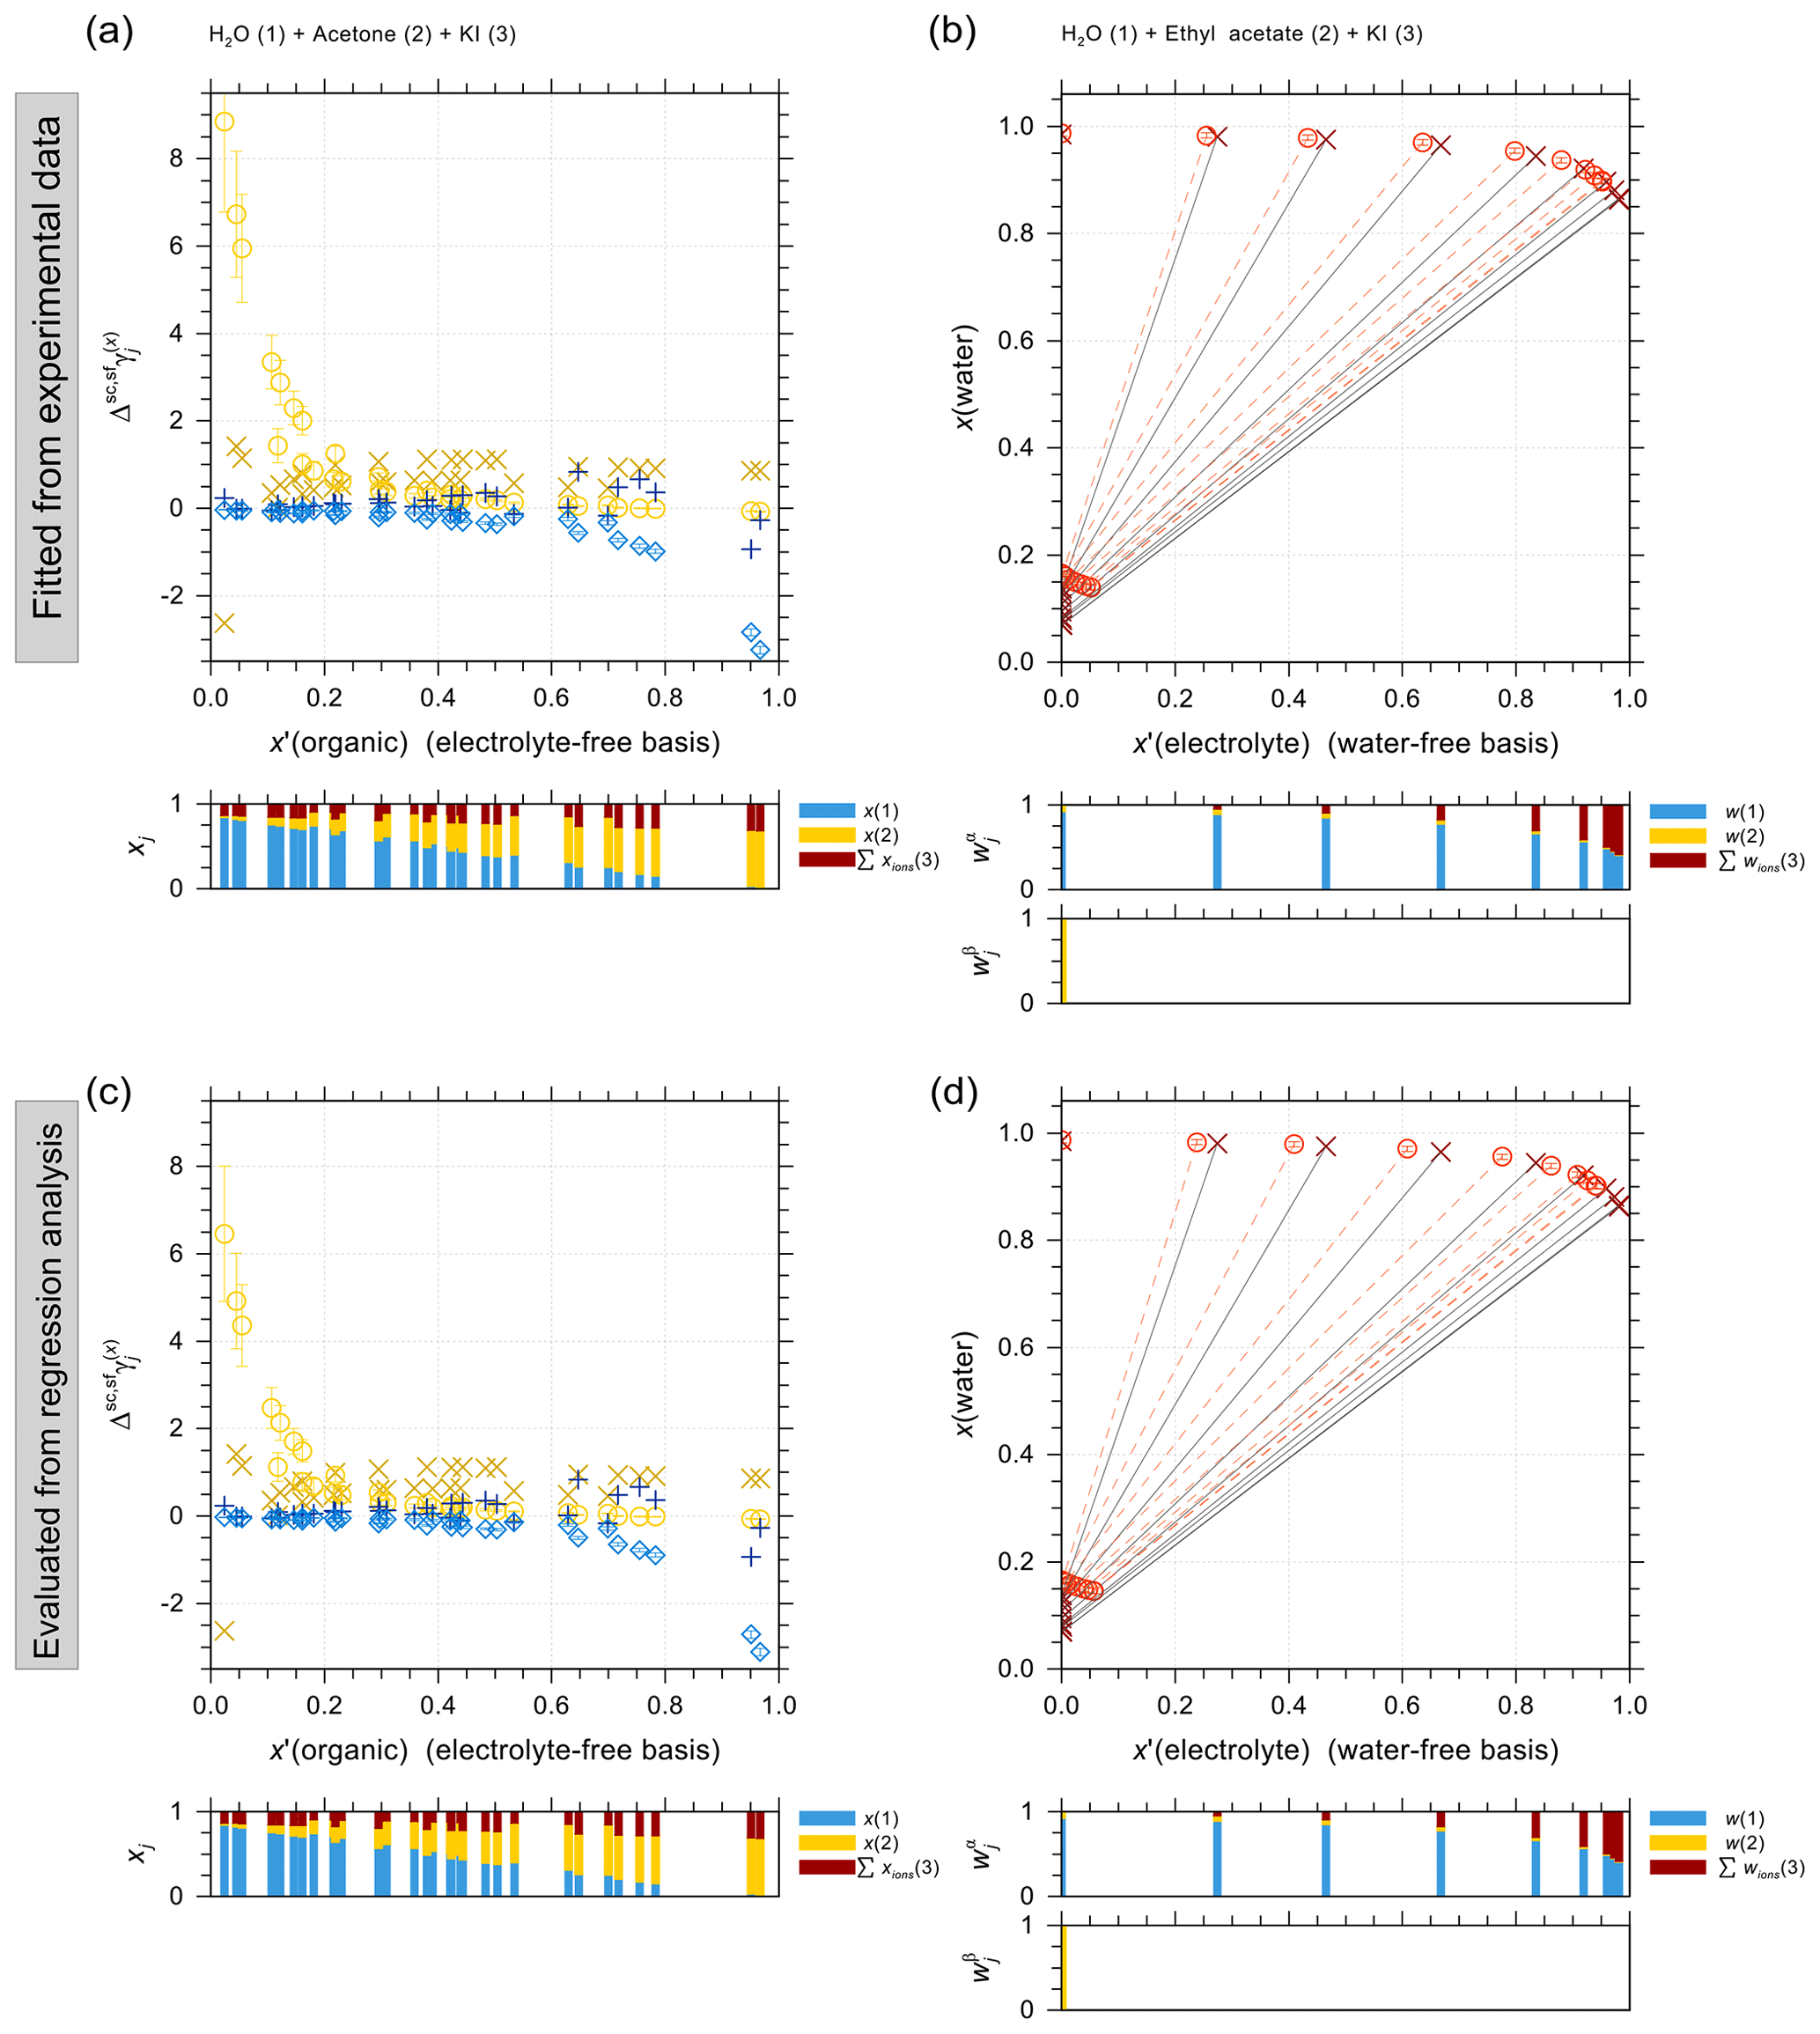
Figure 12Comparison of experimental data (×, +) and predicted (∘, ⋄) values for ternary systems using two different approaches for the iodide interaction parameters within AIOMFAC. Predictions from the left and right panels are based on fitted parameters from experiments (top) and our regression approach (bottom). (a, c) VLE of water (1) + acetone (2) + KI (3) at 322–360 K; experiments by Al-Sahhaf and Jabbar (1993). (b, d) LLE of water (1) + ethyl acetate (2) + KI (3) at 298 K; experiments by Al-Sahhaf et al. (1999). The composition bars show the mass fractions (b, d) or the mole fractions (a, c) of the components with respect to dissociated salts.
The correlation coefficients R2 are 0.795 and 0.826, respectively, implying relatively high correlations as evaluated based on the training data. The resulting Fobj values using fitted parameters based on experimental data and regression analysis are 3.359 and 3.690, respectively. Thus, AIOMFAC predictions of various experimental data when using the interaction parameters from the regression analysis are within 10 % error in comparison to those using parameters fitted from experimental results. Figure 12 shows the comparison of two selected systems: the VLE of KI + water + acetone and the LLE of KI + water + ethyl acetate, when using parameters fitted from experimental data and evaluated from regression analysis. AIOMFAC predictions from the two methods show a similar level of deviation compared to the experimental data. In the case of water + acetone + KI, AIOMFAC predictions from the regression analysis actually agree better with the experimental data in the water-rich regime, therefore justifying the method as a suitable alternative in the absence of measurement data for the fit of model parameters.
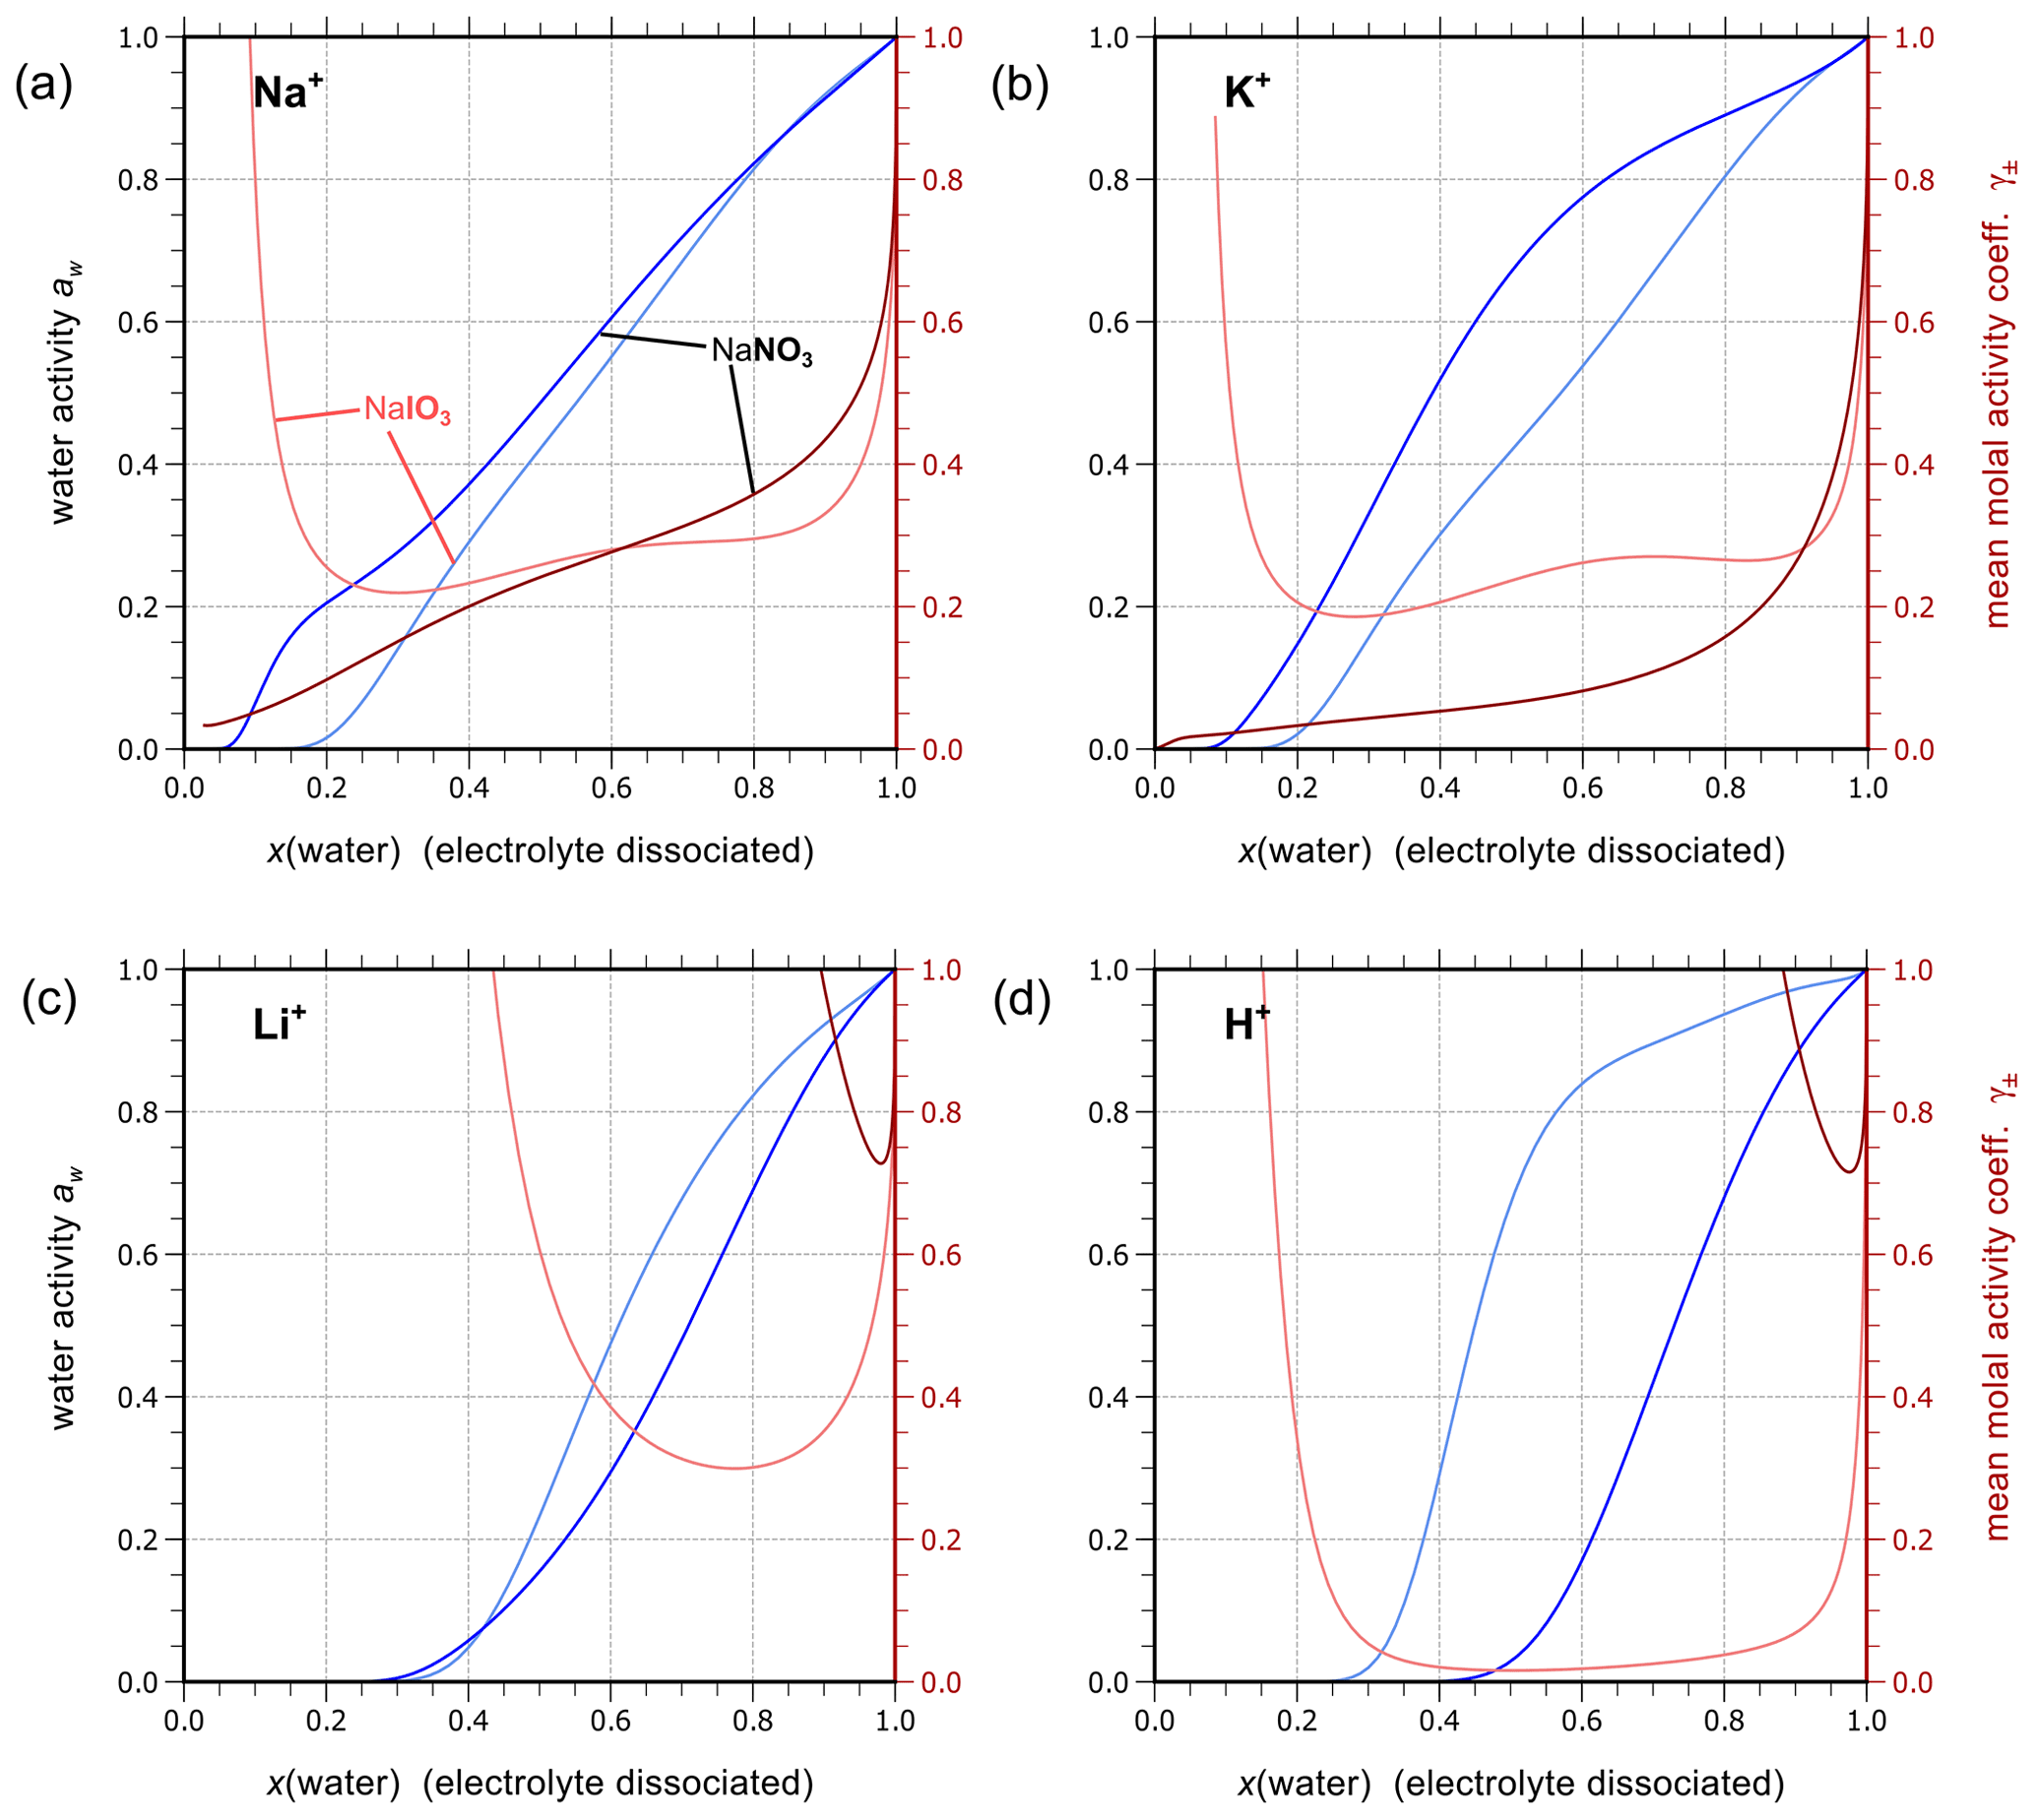
Figure 13Comparison of AIOMFAC predictions of water activity and mean molal activity coefficients at 298.15 K for different binary aqueous solutions of either iodate or nitrate electrolytes with a common cation. Light-colored curves show the iodate case, while darker shades denote the nitrate solutions. (a) NaIO3, NaNO3; (b) KIO3, KNO3; (c) LiIO3, LiNO3; (d) HIO3, HNO3.
Since no experimental data are available to determine the interaction parameters for iodate and main organic groups, aqueous solutions with different anions were compared to those with iodate to find the best substitution anion of iodate. Figure 13 shows a comparison between AIOMFAC calculations for binary aqueous iodate () and nitrate () solutions, where the two electrolytes have the cation in common (different panels for the cations Na+, K+, Li+, and H+). Due to the similarities in ion size and thermodynamic behavior between the two anions, the ↔ organic main group interaction parameters can be estimated as a simple approximation, by
For the same reason, aqueous NH4IO3 and Ca(IO3)2 solutions, which cannot be added based on experimental data, adopted this substitution as well (e.g., Ca2+ ↔ ≈ Ca2+ ↔ ). We refer to such parameter substitutions based on similarity in behavior as the analogy approach. Although simpler and likely less reliable than the regression-based approach, the analogy approach is the best option when there are not sufficient sets of experimental data available to determine the linear regression coefficients.
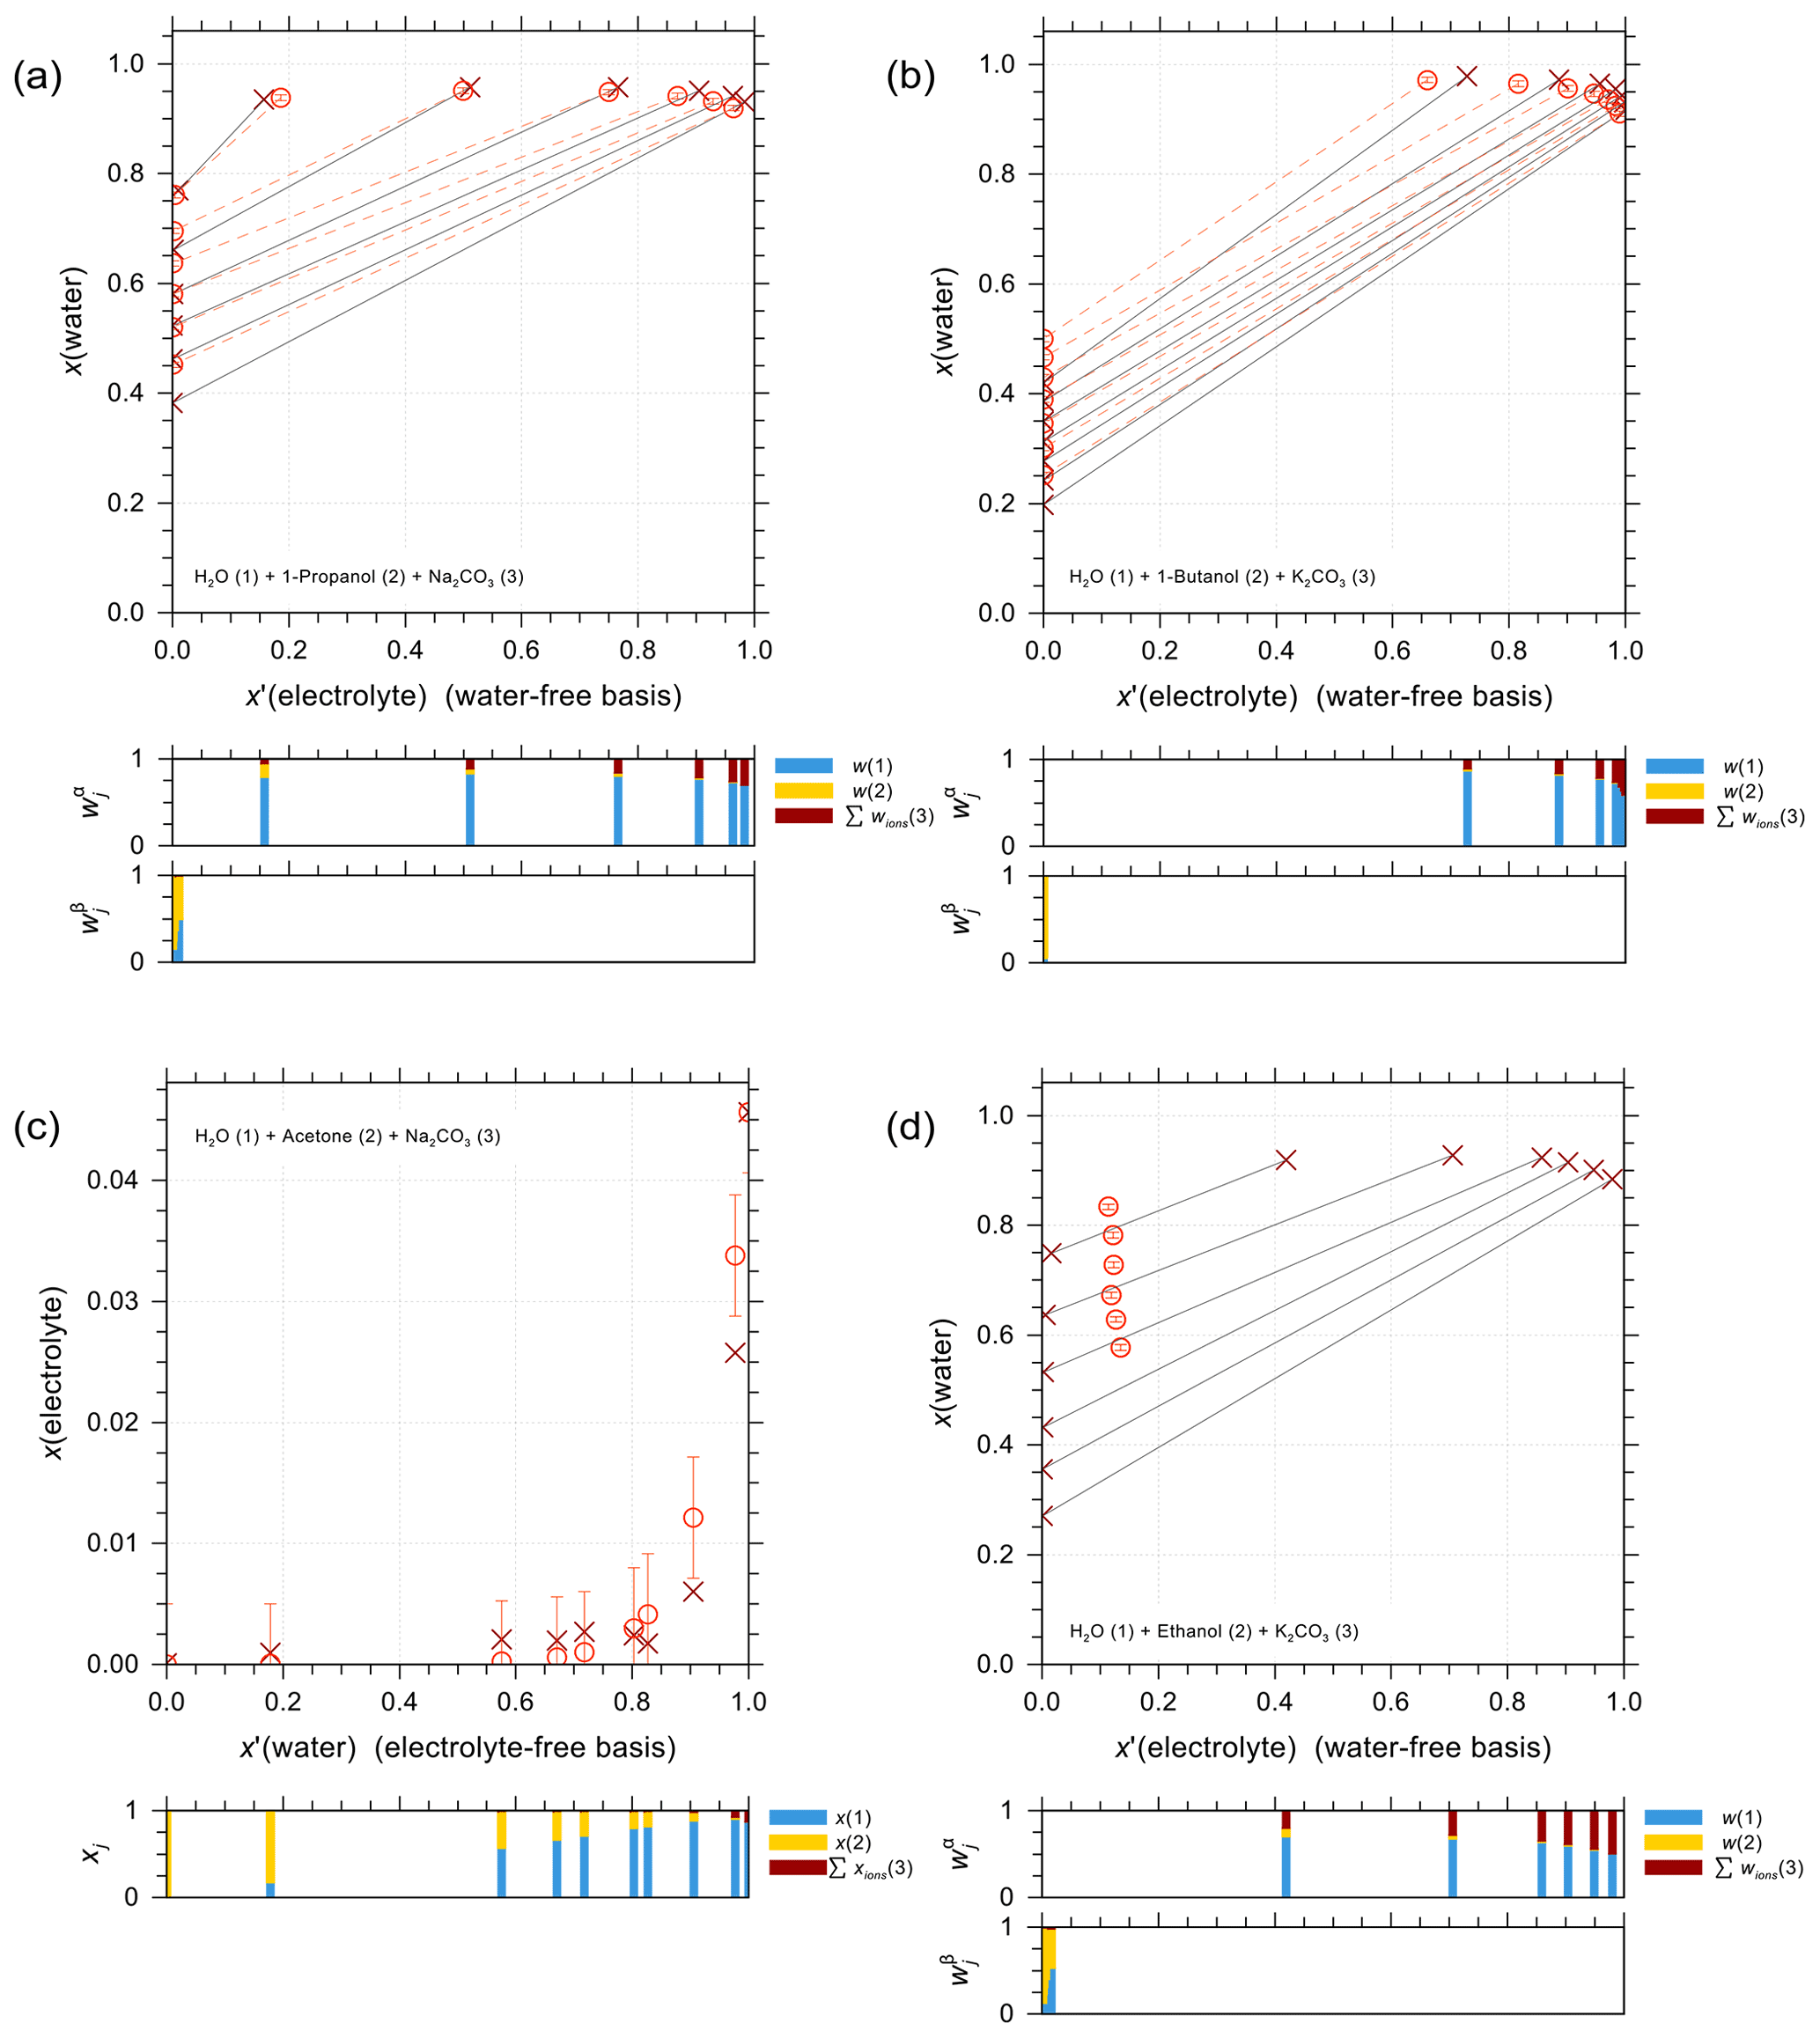
Figure 14Experimental (×) and AIOMFAC-predicted (∘) equilibrium phase compositions of water + organic compound + carbonate salt systems with model sensitivity shown as error bars. (a) LLE of water (1) + 1-propanol (2) + Na2CO3 (3) at 313 K; experiments by Gerlach and Smirnova (2016). (b) LLE of water (1) + 1-butanol (2) + K2CO3 (3) at 298 K; experiments by Fu et al. (2020). (c) SLE of Na2CO3 in a water (1) + acetone (2) + Na2CO3 (3) system at 295 K; experiments by Ellingboe and Runnels (1966). (d) LLE of water (1) + ethanol (2) + K2CO3 (3) at 298 K; experiments by Salabat and Hashemi (2007). The AIOMFAC-LLE model predicts no phase separation for this system (d). The composition bars show the mass fractions (or mole fractions in c) of the components with respect to dissociated salts.
Based on the analogy approach, the parameters for organic main groups interacting with are substituted by those of the same organic main groups interacting with due to the lack of experimental data. Figure 14 shows the estimated LLE and SLE calculations for carbonate salts + water + organic compounds using substituted parameters for ↔ organic main group interactions alongside the experimental data. Figure 14a shows the LLE of water + 1-propanol + Na2CO3 at 315.15 K, and Fig. 14b presents the model–measurement comparison of phase composition for a LLE system of water + 1-butanol + K2CO3 at 298.15 K. AIOMFAC performs very well in these cases considering the large sensitivity to ion/salting-out effects in predicting liquid–liquid equilibria. Figure 14c shows the model prediction of the Na2CO3 mole fraction at the salt solubility limit in this ternary mixture of water + acetone + Na2CO3 at 295.15 K. The model prediction agrees quite well with the measurement, especially with the sharp decrease in the salt solubility at lower water content. Figure 14d shows another example of a LLE phase composition diagram, in this case the LLE of water + ethanol + K2CO3 at 298.15 K. The experiments indicate the existence of liquid–liquid phase separation in this system, as shown by the tie-lines connecting coexisting phases, but the model predicts a single liquid phase to remain stable for the same overall mixture compositions. This may be attributed to the use of ion ↔ main group interaction parameters from sulfate here, since similar predictions were made for LLE cases of sulfate salts interacting with ethanol (Zuend et al., 2011). The mostly satisfying results achieved for the calculation of aqueous carbonate or iodide salts mixed with organics justify the use of such analogy-based parameter substitutions when other means for determining the interaction parameters are not possible. Such cases are sometimes found even if a few measurement datasets are available, as is, e.g., the case for the carbonate salt systems shown in Fig. 14. Given the lack of a sufficiently diverse database in terms of organic main groups and their relative abundances in molecules of measurement data, constraining the model parameters based on only a few datasets will often lead to a substantially biased set of parameters that would likely result in weak predictability for systems not covered by the training data, hence the necessity for using alternative estimation methods. However, the parameters determined from the alternative methods may be subject to revision once more experimental data pertaining to the ions/organic groups in question become available in future.
The hygroscopic growth behavior and cloud droplet activation ability of aerosol particles are two (among many) important composition-dependent properties of ambient particles. These properties are directly dependent on the mixing and gas/liquid/solid phase equilibrium thermodynamics of aerosols (e.g., Seinfeld and Pandis, 1998; Pankow, 2003; Hersey et al., 2013). Hence, there is a need for (predictive) thermodynamic aerosol models to serve as key components in box models and chemical transport models for the simulation of atmospheric chemistry and physics (e.g., Zaveri et al., 2008; Pye et al., 2020). Importantly, ambient aerosols are typically multicomponent organic–inorganic mixtures containing several types of inorganic ions and hundreds to millions of different organic compounds (Goldstein and Galbally, 2007; Kroll et al., 2011). Such complex systems may exhibit phase separation or otherwise non-ideal mixing, critically affecting the gas–particle partitioning of semivolatile components, including water (e.g., Zuend and Seinfeld, 2012; Ovadnevaite et al., 2017; Pye et al., 2018). By extending the AIOMFAC model with new species and revised interaction parameters, a wider variety of atmospherically relevant species can be covered, enabling more detailed multi-phase box model calculations. In turn, improvements in predicted aerosol and cloud droplet acidity, aerosol mass concentrations, and phase behavior serve the interpretation of laboratory and field measurements (Pye et al., 2018, 2020) as well as the development and assessment of reduced-complexity aerosol treatments in air quality and climate models (Rastak et al., 2017).
5.1 Iodine and carbonate species in aerosols or cloud droplets
With the newly implemented parameters describing the interactions between aqueous iodine or carbonate electrolytes and organic compounds, the AIOMFAC model is capable of predicting the mixing behavior within aerosol phases containing these species (among many others). Furthermore, while the uncertainty of parameters determined using the substitution method might be relatively large, such method adoption allows for the completion of AIOMFAC's interaction parameter matrix (Fig. 1), improving the model range of applicability. Moreover, for iodine and carbonate systems, specific atmospheric physical or chemical processes can be explored using the extended AIOMFAC modeling framework.
Recent measurements have shown different soluble iodine speciation in fine-mode and coarse-mode aerosol particles (Baker and Yodle, 2021). Generally, higher proportions of iodide and soluble organic iodine (SOI) are associated with fine-mode aerosols, while coarse-mode aerosols are dominated by iodate instead. In terms of acidity influence, alkaline sea spray or mineral dust aerosols contain higher ratios of iodate, while acidic particles are rich in iodide and SOI. However, due to the lack of direct pH measurements of the sample aerosols, the new findings are not sufficient to explain the possible links between acidity and speciation results. With the addition of iodine system into AIOMFAC, detailed iodine speciation modeling can be done by coupling AIOMFAC with a kinetic chemistry and mass transfer model. This, together with field measurements on gas and aerosol phase composition and pH, can have the potential of explaining atmospheric iodine speciation.
We also show that if an aerosol particle is composed of both bicarbonate and bisulfate, at equilibrium, the effects of sulfate are mostly dominating over carbonate as shown in Fig. 11. However, in a cloud droplet, when the relative humidity is close to 1.0, it is important to consider the effects of carbonic acid or relevant carbonate/bicarbonate salts. The addition of the carbonate system and the associated equilibria to AIOMFAC can serve as a more comprehensive thermodynamic model to couple with aerosol and cloud-water chemistry models for better activity and reaction rate simulation quality.
5.2 Computations of CCN activation properties
A key atmospheric impact of fine- and ultrafine-mode aerosol particles stems from their ability to act as cloud condensation nuclei. The number–size distribution and hygroscopic properties of sufficiently large aerosol particles impact cloud droplet number concentrations during cloud formation, ensuing cloud microphysics and aerosol–cloud–radiation effects (e.g., Lohmann and Feichter, 2005; Carslaw et al., 2013; Gettelman, 2015). Clouds in marine or other pristine environments characterized by relatively low aerosol mass and number concentrations are typically more sensitive to the hygroscopicity and CCN activation properties of the present particles (e.g., Carslaw et al., 2013; Fossum et al., 2018, 2020). Iodide and iodate ions are expected to be more prevalent in marine boundary layer aerosols (on pmol m−3 levels), although their concentrations and speciations are only infrequently measured in the field (Baker, 2004; Baker and Yodle, 2021).
Based on the introduced AIOMFAC model extension, thermodynamic CCN activation calculations for systems containing iodine or carbonate species are now possible. This includes computations of Köhler curves and associated CCN activation properties for sodium iodide or sodium carbonate particles mixed/coated with suberic acid at 293 K to compare with corresponding measurement reported by Davies et al. (2019). Such computations involve predictions of particle size at different RH levels, which requires knowledge or estimations of apparent molar volumes or densities of the corresponding aqueous solutions. The density of pure crystalline NaI is 3670 kg m−3 (Yaws, 2009). Since it is not possible to measure the density of pure liquid NaI, an apparent liquid-state density of 4230 kg m−3 is used, which is derived from the apparent molar volume extrapolation by Zhuo et al. (2008). The solid-state density of pure Na2CO3 is 2540 kg m−3 (Yaws, 2009). The pure liquid-state density of Na2CO3 is assumed to be of the same value, since liquid-state data are unavailable. Other relevant physical parameters used in the AIOMFAC calculation are the same as those listed in Table 1 of Davies et al. (2019). Similar to the AIOMFAC-based predictions for CCN activation properties carried out in the study by Davies et al. (2019), three different model variants are adopted here. The full gas–particle and liquid–liquid equilibrium calculation (AIOMFAC-EQUIL) allows all components to partition between the gas phase and up to two liquid phases to determine the equilibrium state. In contrast, the variants described as AIOMFAC-CLLPS assume that the inorganic ions and the organic components always reside in different liquid phases. AIOMFAC-CLLPS is further split into two variants, both assuming a core–shell particle morphology. One is labeled “with org. film” in which water is not allowed in the organic-rich shell for the purpose of hygroscopic growth and surface tension computations. This leaves the surface of the particle as an organic film phase, strongly affecting the particles' surface tension when full surface coverage is possible. The other variant is denoted as AIOMFAC-CLLPS (without org. film), which allows water to partition into the organic-rich shell phase (in addition to the aqueous inorganic core phase); see Davies et al. (2019) for further details.
AIOMFAC predictions of the critical supersaturation for CCN activation, SScrit, under different conditions in aqueous particle systems containing suberic acid and NaI or Na2CO3 as the particle core are listed in Tables S1 and S2 in the Supplement. In the case of NaI-containing particles, among the different model variants, it is evident that the SScrit predictions based on AIOMFAC-CLLPS (with org. film) lead to lower SScrit values with increasing organic dry volume fractions (forg) compared to the other two model variants as shown in Fig 15a. This finding is consistent with those for similar particles containing ammonium sulfate as inorganic salt (Davies et al., 2019). However, none of our AIOMFAC-based model variants are able to simulate the zigzag behavior of the measured SScrit data near forg=0.5, a robust feature in this system, as confirmed by repeated measurements. Capturing such an intriguing SScrit curve phenomenon may require a more sophisticated treatment of composition-dependent particle morphology and related surface tension.
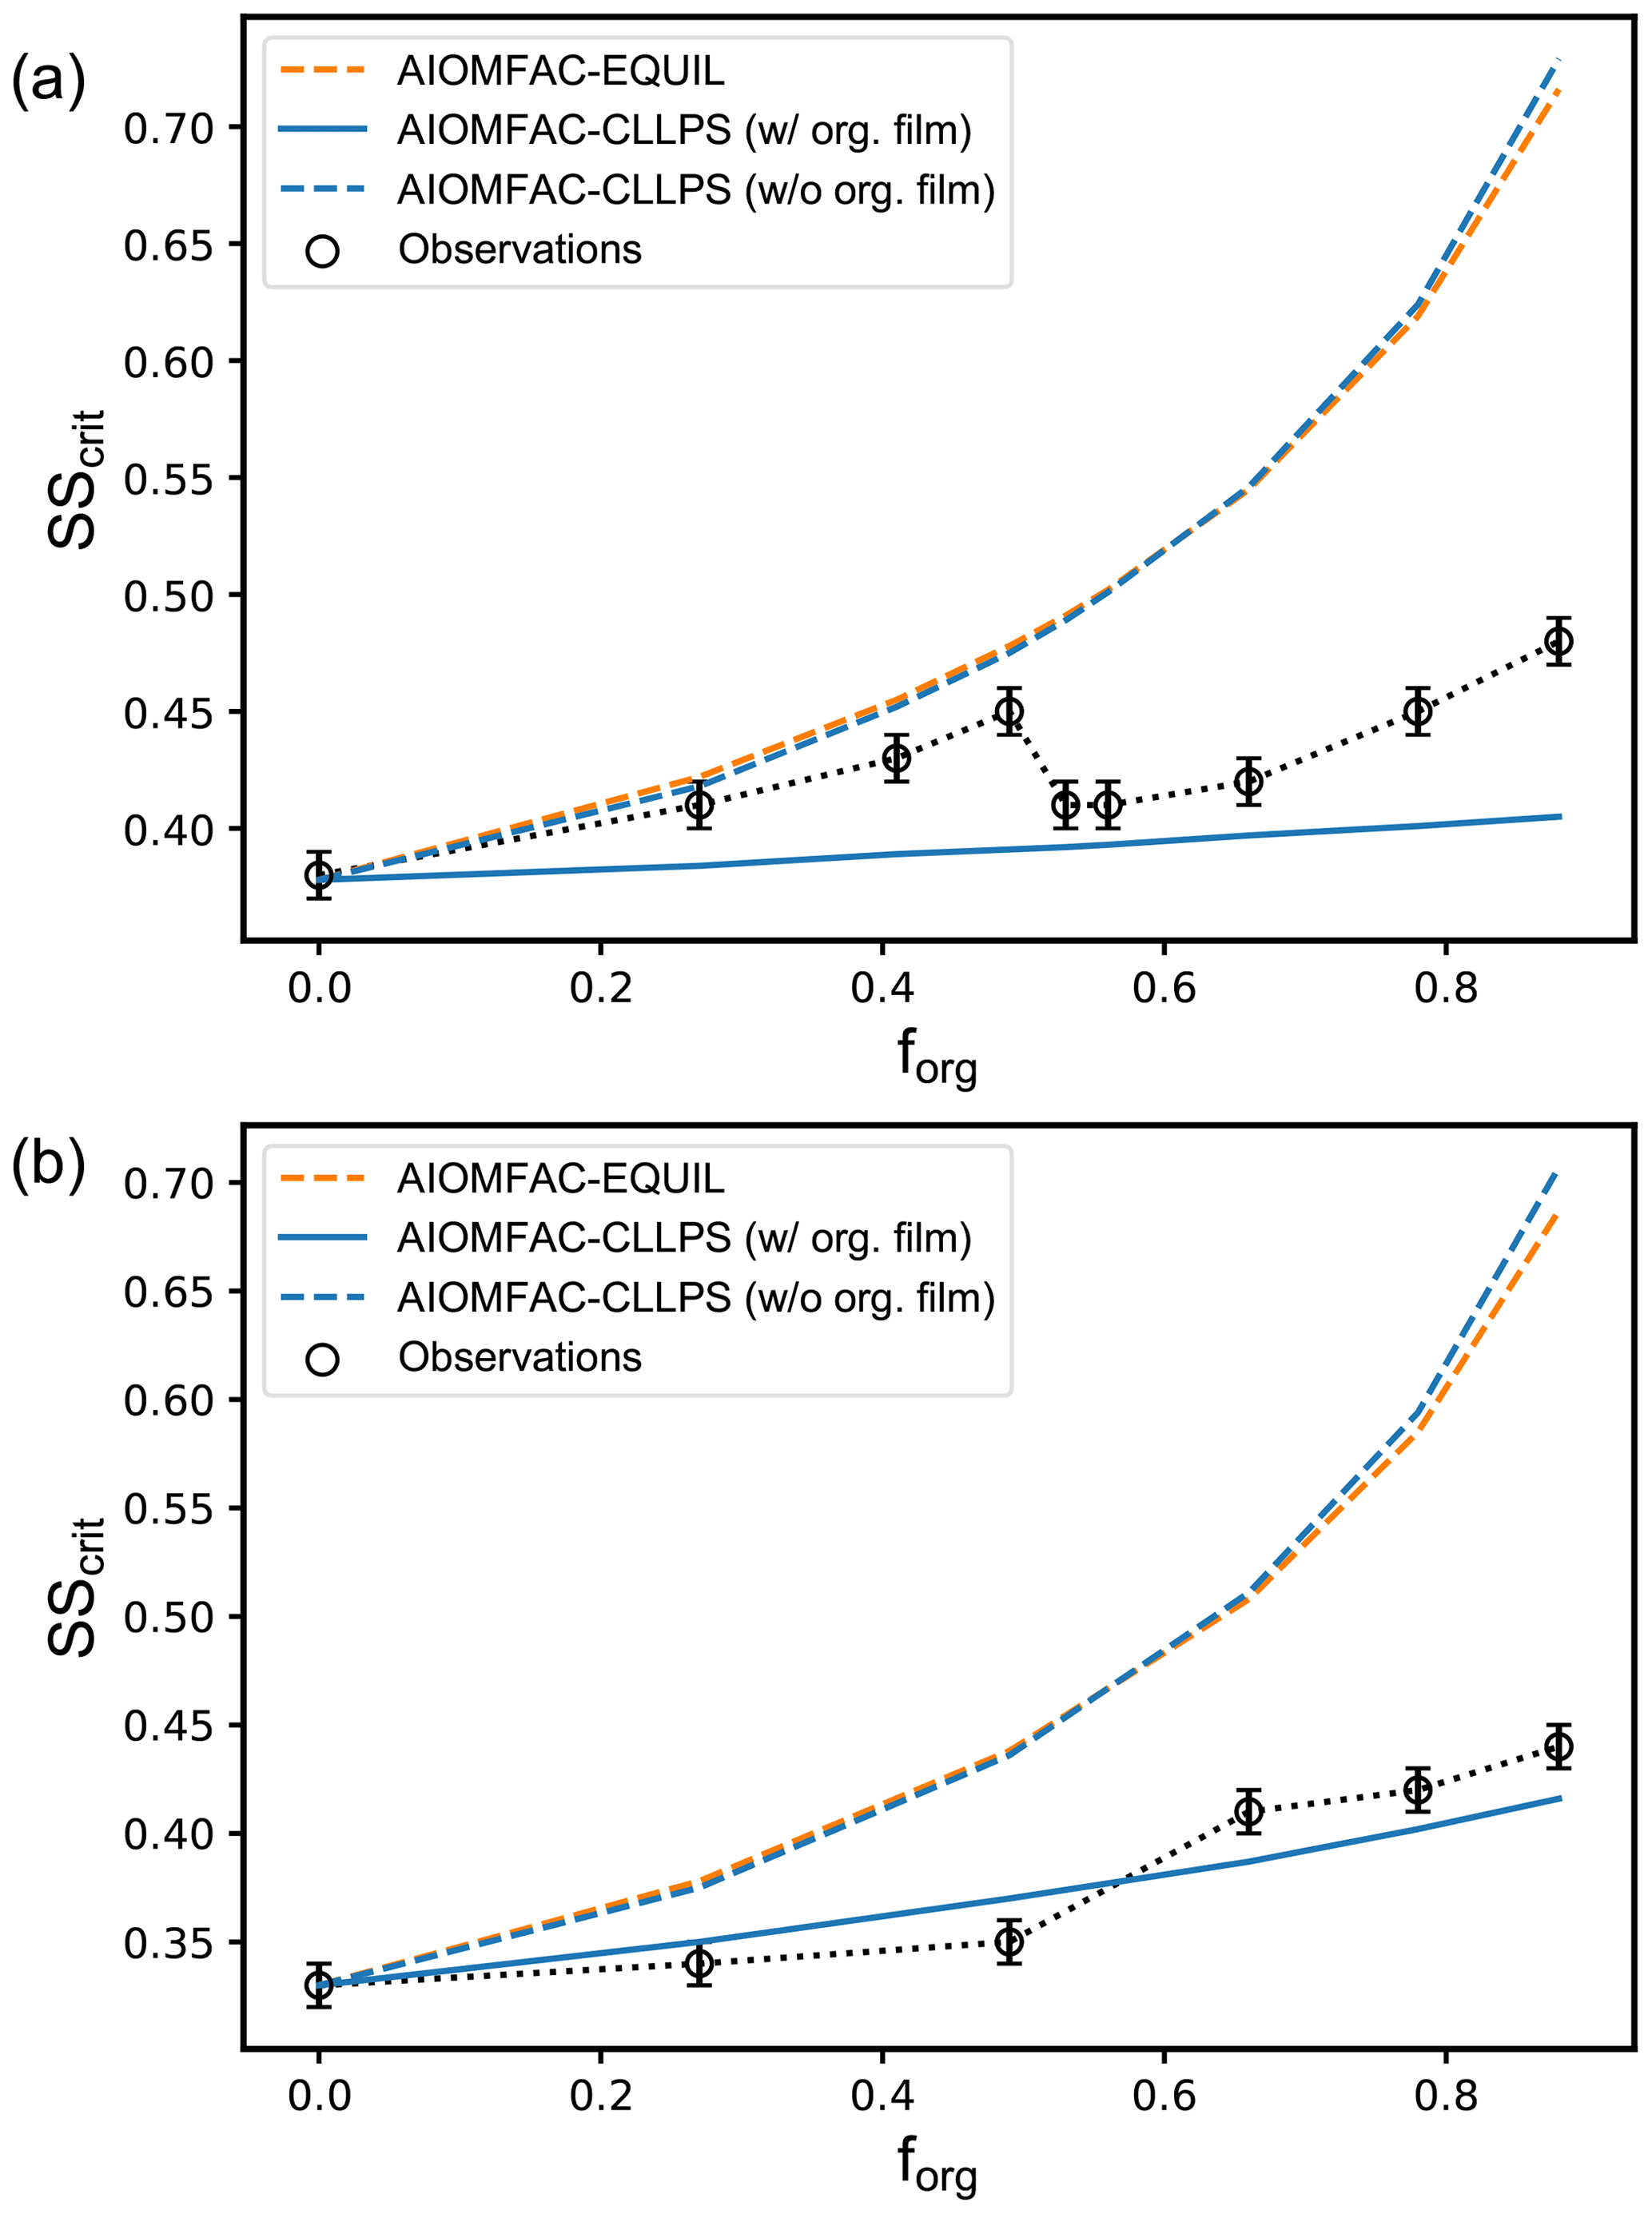
Figure 15Comparison of critical supersaturation (SScrit) data between measurements and predictions from different AIOMFAC-based model variants. (a) Measured data (∘, black line) and AIOMFAC predictions (curves) of SScrit for cloud droplet activation of NaI particles coated/mixed with suberic acid for Ddry = 50 nm containing different volume fractions of suberic acid (forg). (b) Similar to panel (a) but with Na2CO3 as inorganic component for Ddry = 50 nm. Experimental data by Davies et al. (2019).
As stated previously, the parameters for ↔ organic main group interactions are adopted via substitution from those for ↔ organic main group interactions. In the case of the binary aqueous Na2CO3 system, the AIOMFAC prediction of the critical supersaturation for Ddry = 50 nm is 0.330 %, which is in excellent agreement with the reported SScrit = 0.33 % value from the experiment. Among the three different model variants, the AIOMFAC-CLLPS (with org. film) prediction agrees best with the measurements, as shown in Fig. 15b. The same conclusion was also made for a similar system of suberic-acid-coated (NH4)2SO4 particles in the work by Davies et al. (2019). At first glance, this result seems to be the least intuitive, as one may expect that some amount of water would likely partition into the organic film phase. At present, none of the model variants accounts fully for the process of bulk–surface partitioning in the absence of liquid–liquid phase separation at high relative humidity (which is the case in these suberic acid containing systems). Accounting for composition and size-dependent bulk–surface partitioning alongside phase separation may aid in explaining the observed behavior in future work.
Notwithstanding the remaining challenges in modeling CCN activation properties of rather peculiar systems (such as those of Fig. 15), the coverage of several carbonate and iodine species by AIOMFAC has further extended the thermodynamic modeling capabilities of relevant mixed organic–inorganic aerosol systems. It provides the community with a predictive tool for the mixing thermodynamics and hygroscopicity of relevant laboratory systems as well as more complex samples of iodine- and carbonate-containing tropospheric aerosols.
The latest extension of the AIOMFAC model, developed and introduced in this work, adds the ions I−, , , , OH−, and CO2(aq) in mixtures containing water and a variety of organic compounds. The thermodynamic conditions necessary to be considered for systems containing the added carbonate species involve coupled equilibria and material constraints. We discussed how solving numerically the associated system of algebraic equations can be challenging under highly acidic or highly basic pH conditions, under which the molalities of certain ions, such as OH− or H+, become negligibly tiny. Approaches to navigate those conditions were implemented, enabling the use of AIOMFAC for computations of carbonate–bicarbonate–CO2 equilibria in open- or closed-system scenarios, applicable to a wide range of concentrations relevant to atmospheric aerosols, cloud droplets, and/or other aqueous environments.
During the simultaneous fitting of AIOMFAC cation–anion and ion–organic main group interaction parameters, numerous experimental datasets were accessed and compared with the model predictions. The agreement between AIOMFAC calculations and the majority of experiments ranges from satisfactory to excellent. Relatively large deviation exists in some cases, for which we discussed potential reasons related to the use of a group-contribution method. Due to the lack of experimental data covering certain aqueous cation–iodate systems, as well as the interactions of the newly introduced ions with several organic functional groups, alternative approaches for parameter estimation were explored. Among those approaches are the use of linear regression to determine iodide ion interactions with certain organic functional groups based on the interaction coefficients of a set of other ions with those groups. Adoption of such methods in practice means that we were able to provide estimates for model parameters describing most of the possible binary interactions involving the new species. This is considered very useful to close otherwise existing gaps in the model's interaction matrix (Fig. 1). It enables the AIOMFAC model to provide predictions for a wide range of multicomponent, multifunctional systems of interest in atmospheric chemistry – even when suboptimal in terms of the underlying experimental database. In addition to the adoption of such estimation methods, we also conducted new bulk water activity and EDB measurements to cover systems involving iodide or iodate electrolytes in greater detail. Nevertheless, the current parameterization of AIOMFAC for certain carbonate and iodine species is limited and uncertain to some extent, offering the potential for improvements in future work – subject to the availability of suitable new thermodynamic equilibrium data. In total, 285 new interaction parameters were determined, describing interactions for 35 cation–anion and 55 ion–organic main group pairs.
As an example of an application of AIOMFAC using the newly determined interaction parameters, we computed the critical supersaturation as a function of dry particle size and organic fraction for suberic-acid-coated salt particles. The AIOMFAC predictions of SScrit for Na2CO3 particles were found to be in good agreement with available measurements. Similar predictions for NaI-containing particles show very good agreement at low organic volume fractions but larger deviations at higher organic fractions. The combination of different AIOMFAC-based model variants employed for those critical supersaturation calculations provides upper and lower limits enveloping the measured SScrit data. Advanced thermodynamic mixing models with size-dependent bulk–surface partitioning considered may aid in more accurate predictions of the CCN properties of ultrafine organic–inorganic particles. Future work will focus on incorporating partial dissociation of various organic acid species in AIOMFAC.
The source code of AIOMFAC is available as part of the AIOMFAC-web model code repository (version 3.00) on GitHub (https://github.com/andizuend/AIOMFAC, Zuend et al., 2021; https://doi.org/10.5281/zenodo.5866756, Zuend, 2022). AIOMFAC predictions are also available as part of the AIOMFAC web model at https://aiomfac.lab.mcgill.ca (Zuend et al., 2012).
The supplement related to this article is available online at: https://doi.org/10.5194/acp-22-973-2022-supplement.
AZ conceptualized the project. HY and AZ developed the methodology, evaluated the data, and wrote the software. HY carried out a part of the water activity measurements at McGill University with the assistance of AB, BJW, and TCP. JD, LK, and UKK performed the EDB and water activity measurements at ETH Zurich. HY analyzed the data and created the visualizations. HY wrote the manuscript with contributions from all co-authors.
The contact author has declared that neither they nor their co-authors have any competing interests.
Publisher's note: Copernicus Publications remains neutral with regard to jurisdictional claims in published maps and institutional affiliations.
This project was undertaken with the financial support of the Government of Canada through the federal Department of Environment and Climate Change (ECCC). Liviana Klein acknowledges funding support by the Swiss National Science Foundation (SNSF).
This research has been supported by the Fonds de recherche du Québec – Nature et technologies (grant no. PR-286433), the Natural Sciences and Engineering Research Council of Canada (grant nos. RGPIN-2014-04315 and RGPIN-2021-02688), the Government of Canada through the federal Department of Environment and Climate Change (grant no. GCXE20S049), and the Schweizerischer Nationalfonds zur Förderung der Wissenschaftlichen Forschung (grant no. CRSII5-189939).
This paper was edited by James Allan and reviewed by two anonymous referees.
Abel, E., Redlich, O., and Hersch, F.: Freezing-point measurements. III Activity coefficients and dissociation of iodic acid, Z. Phys. Chem. A, 170A, 112–122, https://doi.org/10.1515/zpch-1934-17010, 1934. a
Abrams, D. S. and Prausnitz, J. M.: Statistical thermodynamics of liquid mixtures: A new expression for the excess Gibbs energy of partly or completely miscible systems, AIChE J., 21, 116–128, https://doi.org/10.1002/aic.690210115, 1975. a
Al-Sahhaf, T. A. and Jabbar, N. J.: Vapor-liquid equilibrium of the acetone-water-salt system, J. Chem. Eng. Data, 38, 522–526, https://doi.org/10.1021/je00012a010, 1993. a, b, c
Al-Sahhaf, T. A. and Kapetanovic, E.: Salt Effects of Lithium Chloride, Sodium Bromide, or Potassium Iodide on Liquid-Liquid Equilibrium in the System Water + 1-Butanol, J. Chem. Eng. Data, 42, 74–77, https://doi.org/10.1021/je960234r, 1997. a, b
Al-Sahhaf, T. A., Kapetanovic, E., and Kadhem, Q.: Salt effects on liquid-liquid equilibria in the partially miscible systems water + 2-butanone and water + ethyl acetate, Fluid Phase Equilibr., 157, 271–283, https://doi.org/10.1016/S0378-3812(99)00040-0, 1999. a, b, c
Allan, J. D., Topping, D. O., Good, N., Irwin, M., Flynn, M., Williams, P. I., Coe, H., Baker, A. R., Martino, M., Niedermeier, N., Wiedensohler, A., Lehmann, S., Müller, K., Herrmann, H., and McFiggans, G.: Composition and properties of atmospheric particles in the eastern Atlantic and impacts on gas phase uptake rates, Atmos. Chem. Phys., 9, 9299–9314, https://doi.org/10.5194/acp-9-9299-2009, 2009. a
Allan, J. D., Williams, P. I., Najera, J., Whitehead, J. D., Flynn, M. J., Taylor, J. W., Liu, D., Darbyshire, E., Carpenter, L. J., Chance, R., Andrews, S. J., Hackenberg, S. C., and McFiggans, G.: Iodine observed in new particle formation events in the Arctic atmosphere during ACCACIA, Atmos. Chem. Phys., 15, 5599–5609, https://doi.org/10.5194/acp-15-5599-2015, 2015. a
Altaf, M. B. and Freedman, M. A.: Effect of Drying Rate on Aerosol Particle Morphology, J. Phys. Chem. Lett., 8, 3613–3618, https://doi.org/10.1021/acs.jpclett.7b01327, 2017. a
Altshuller, A. P. and Everson, H. E.: The Solubility of Ethyl Acetate in Aqueous Electrolyte Solutions, J. Am. Chem. Soc., 75, 4823–4827, https://doi.org/10.1021/ja01115a059, 1953. a, b
Andronova, A. V., Gomes, L., Smirnov, V. V., Ivanov, A. V., and Shukurova, L. M.: Physico-chemical characteristics of dust aerosols deposited during the Soviet-American experiment (Tadzhikistan, 1989), Atmos. Environ. A-Gen., 27, 2487–2493, https://doi.org/10.1016/0960-1686(93)90020-Y, 1993. a
Apelblat, A. and Korin, E.: The vapour pressures of saturated aqueous solutions of sodium chloride, sodium bromide, sodium nitrate, sodium nitrite, potassium iodate, and rubidium chloride at temperatures from 227 K to 323 K, J. Chem. Thermodyn., 30, 59–71, https://doi.org/10.1006/jcht.1997.0275, 1998. a, b, c
Baccarini, A., Karlsson, L., Dommen, J., Duplessis, P., Vüllers, J., Brooks, I. M., Saiz-Lopez, A., Salter, M., Tjernström, M., Baltensperger, U., Zieger, P., and Schmale, J.: Frequent new particle formation over the high Arctic pack ice by enhanced iodine emissions, Nat. Commun., 11, 4924, https://doi.org/10.1038/s41467-020-18551-0, 2020. a, b
Baker, A. R.: Inorganic iodine speciation in tropical Atlantic aerosol, Geophys. Res. Lett., 31, L23S02, https://doi.org/10.1029/2004GL020144, 2004. a, b
Baker, A. R.: Marine Aerosol Iodine Chemistry: The Importance of Soluble Organic Iodine, Environ. Chem., 2, 295–298, https://doi.org/10.1071/EN05070, 2005. a
Baker, A. R. and Yodle, C.: Measurement report: Indirect evidence for the controlling influence of acidity on the speciation of iodine in Atlantic aerosols, Atmos. Chem. Phys., 21, 13067–13076, https://doi.org/10.5194/acp-21-13067-2021, 2021. a, b
Baker, A. R., Thompson, D., Campos, M. L. A. M., Parry, S. J., and Jickells, T. D.: Iodine concentration and availability in atmospheric aerosol, Atmos. Environ., 34, 4331–4336, https://doi.org/10.1016/S1352-2310(00)00208-9, 2000. a, b, c
Barthel, J. and Lauermann, G.: Vapor pressure measurements on non-aqueous electrolyte solutions. Part 3: Solutions of sodium lodide in ethanol, 2-propanol, and acetonitrile, J. Solution Chem., 15, 869–877, https://doi.org/10.1007/BF00646093, 1986. a
Bertram, A. K., Martin, S. T., Hanna, S. J., Smith, M. L., Bodsworth, A., Chen, Q., Kuwata, M., Liu, A., You, Y., and Zorn, S. R.: Predicting the relative humidities of liquid-liquid phase separation, efflorescence, and deliquescence of mixed particles of ammonium sulfate, organic material, and water using the organic-to-sulfate mass ratio of the particle and the oxygen-to-carbon elemental ratio of the organic component, Atmos. Chem. Phys., 11, 10995–11006, https://doi.org/10.5194/acp-11-10995-2011, 2011. a
Bonner, O. D.: The osmotic and activity coefficients of some salts having relatively large molar volumes, J. Chem. Eng. Data, 21, 498–499, https://doi.org/10.1021/je60071a020, 1976. a, b
Bonner, O. D. and Prichard, P. R.: The ionization of trichloroacetic acid and evidence for an unusual type of ion pairing, J. Solution Chem., 8, 113, https://doi.org/10.1007/BF00650511, 1979. a, b, c, d
Burns, J. A. and Furter, W. F.: Salt Effect in Vapor–Liquid Equilibrium at Fixed Liquid Composition, Adv. Chem. Ser., 177, 11–26, 1979. a
Carslaw, K. S., Lee, L. A., Reddington, C. L., Pringle, K. J., Rap, A., Forster, P. M., Mann, G. W., Spracklen, D. V., Woodhouse, M. T., Regayre, L. A., and Pierce, J. R.: Large contribution of natural aerosols to uncertainty in indirect forcing, Nature, 503, 67–71, https://doi.org/10.1038/nature12674, 2013. a, b
Chen, W.-M. and Zhang, Y.-M.: Vapor-Liquid Equilibria for Alcohol-Water-KI/NaAc Systems, J. Chem. Eng. Chin. Univ., 17, 123–127, https://doi.org/10.3321/j.issn:1003-9015.2003.02.002, 2003. a, b, c, d
Chen, X., Yang, B., Abdeltawab, A. A., Al-Deyab, S. S., Yu, G., and Yong, X.: Isobaric Vapor–Liquid Equilibrium for Acetone + Methanol + Phosphate Ionic Liquids, J. Chem. Eng. Data, 60, 612–620, https://doi.org/10.1021/je5007373, 2015. a
Cheng, W., Li, Z., and Cheng, F.: Solubility of Li2CO3 in Na–K–Li–Cl brines from 20 to 90 ∘C, J. Chem. Thermodyn., 67, 74–82, https://doi.org/10.1016/j.jct.2013.07.024, 2013. a, b, c
Clarke, A. G. and Karani, G. N.: Characterisation of the carbonate content of atmospheric aerosols, J. Atmos. Chem., 14, 119–128, https://doi.org/10.1007/BF00115228, 1992. a
Clegg, S., Whitfield, M., and Pitzer, K.: Activity coefficients in electrolyte solutions, edited by: Pitzer, K. S., CRC Press, 279–434, ISBN 9781351069472, 1991. a
Clegg, S. L., Brimblecombe, P., and Wexler, A. S.: Thermodynamic model of the system H+––––H2O at tropospheric temperatures, J. Phys. Chem. A, 102, 2137–2154, https://doi.org/10.1021/jp973042r, 1998a. a
Clegg, S. L., Brimblecombe, P., and Wexler, A. S.: Thermodynamic model of the system H+––Na+–––Cl−–H2O at 298.15 K, J. Phys. Chem. A, 102, 2155–2171, https://doi.org/10.1021/jp973043j, 1998b. a
Dall´Osto, M., Simo, R., Harrison, R. M., Beddows, D. C. S., Saiz-Lopez, A., Lange, R., Skov, H., Nøjgaard, J. K., Nielsen, I. E., and Massling, A.: Abiotic and biotic sources influencing spring new particle formation in North East Greenland, Atmos. Environ., 190, 126–134, https://doi.org/10.1016/j.atmosenv.2018.07.019, 2018. a
Davies, J. F., Zuend, A., and Wilson, K. R.: Technical note: The role of evolving surface tension in the formation of cloud droplets, Atmos. Chem. Phys., 19, 2933–2946, https://doi.org/10.5194/acp-19-2933-2019, 2019. a, b, c, d, e, f, g, h
De Visscher, A., Vanderdeelen, J., Königsberger, E., Churagulov, B. R., Ichikuni, M., and Tsurumi, M.: IUPAC-NIST Solubility Data Series. 95. Alkaline Earth Carbonates in Aqueous Systems. Part 1. Introduction, Be and Mg, J. Phys. Chem. Ref. Data, 41, 013105–013105, https://doi.org/10.1063/1.3675992, 2012. a, b, c
Decesari, S., Facchini, M. C., Fuzzi, S., and Tagliavini, E.: Characterization of water-soluble organic compounds in atmospheric aerosol: A new approach, J. Geophys. Res.-Atmos., 105, 1481–1489, https://doi.org/10.1029/1999JD900950, 2000. a
Dentener, F. J., Carmichael, G. R., Zhang, Y., Lelieveld, J., and Crutzen, P. J.: Role of mineral aerosol as a reactive surface in the global troposphere, J. Geophys. Res.-Atmos., 101, 22869–22889, https://doi.org/10.1029/96JD01818, 1996. a
Dlugokencky, E. and Tans, P.: Trends in Atmospheric Carbon Dioxide, National Oceanic & Atmospheric Administration, Earth System Research Laboratory (NOAA/ESRL), available at: https://gml.noaa.gov/ccgg/trends/, last access: 6 July 2021. a
Donahue, N. M., Epstein, S. A., Pandis, S. N., and Robinson, A. L.: A two-dimensional volatility basis set: 1. organic-aerosol mixing thermodynamics, Atmos. Chem. Phys., 11, 3303–3318, https://doi.org/10.5194/acp-11-3303-2011, 2011. a
Dong, M., Cheng, W., Li, Z., and Demopoulos, G. P.: Solubility and Stability of Nesquehonite (MgCO3 ⋅ 3H2O) in NaCl, KCl, MgCl2, and NH4Cl Solutions, J. Chem. Eng. Data, 53, 2586–2593, https://doi.org/10.1021/je800438p, 2008. a, b
Dong, M., Li, Z., Mi, J., and Demopoulos, G. P.: Solubility and Stability of Nesquehonite (MgCO3 ⋅ 3H2O) in Mixed NaCl + MgCl2, NH4Cl + MgCl2, LiCl, and LiCl + MgCl2 Solutions, J. Chem. Eng. Data, 54, 3002–3007, https://doi.org/10.1021/je900054j, 2009. a, b, c
Duce, R. A., Woodcock, A. H., and Moyers, J. L.: Variation of ion ratios with size among particles in tropical oceanic air, Tellus, 19, 369–379, https://doi.org/10.3402/tellusa.v19i3.9806, 1967. a
Durig, J. R., Bonner, O. D., and Breazeale, W. H.: Raman Studies of Iodic Acid and Sodium Iodate, J. Phys. Chem., 69, 3886–3892, https://doi.org/10.1021/j100895a041, 1965. a, b, c, d
Ellingboe, J. L. and Runnels, J. H.: Solubilities of Sodium Carbonate and Sodium Bicarbonate in Acetone–Water and Methanol–Water Mixtures, J. Chem. Eng. Data, 11, 323–324, https://doi.org/10.1021/je60030a009, 1966. a
Fossum, K. N., Ovadnevaite, J., Ceburnis, D., Dall'Osto, M., Marullo, S., Bellacicco, M., Simó, R., Liu, D., Flynn, M., Zuend, A., and O'Dowd, C.: Summertime Primary and Secondary Contributions to Southern Ocean Cloud Condensation Nuclei, Sci. Rep.-UK, 8, 13844, https://doi.org/10.1038/s41598-018-32047-4, 2018. a
Fossum, K. N., Ovadnevaite, J., Ceburnis, D., Preißler, J., Snider, J. R., Huang, R.-J., Zuend, A., and O'Dowd, C.: Sea-spray regulates sulfate cloud droplet activation over oceans, npj Clim. Atmos. Sci., 3, 14, https://doi.org/10.1038/s41612-020-0116-2, 2020. a
Fountoukis, C. and Nenes, A.: ISORROPIA II: a computationally efficient thermodynamic equilibrium model for K+–Ca2+–Mg2+––Na+–––Cl−–H2O aerosols, Atmos. Chem. Phys., 7, 4639–4659, https://doi.org/10.5194/acp-7-4639-2007, 2007. a
Fredenslund, A., Jones, R. L., and Prausnitz, J. M.: Group-contribution estimation of activity coefficients in nonideal liquid mixtures, AIChE J., 21, 1086–1099, https://doi.org/10.1002/aic.690210607, 1975. a
Fu, C., Song, W., Yi, C., and Xie, S.: Creating efficient novel aqueous two-phase systems: Salting-out effect and high solubility of salt, Fluid Phase Equilibr., 490, 77–85, https://doi.org/10.1016/j.fluid.2019.03.002, 2019. a
Fu, C., Li, Z., Song, W., Yi, C., and Xie, S.: A new process for separating biofuel based on the salt + 1-butanol + water system, Fuel, 278, 118402, https://doi.org/10.1016/j.fuel.2020.118402, 2020. a
Ganbavale, G., Zuend, A., Marcolli, C., and Peter, T.: Improved AIOMFAC model parameterisation of the temperature dependence of activity coefficients for aqueous organic mixtures, Atmos. Chem. Phys., 15, 447–493, https://doi.org/10.5194/acp-15-447-2015, 2015. a
Gelbach, R. W.: The Activity Coefficients and Transference Numbers of Potassium Iodide, J. Am. Chem. Soc., 55, 4857–4860, https://doi.org/10.1021/ja01339a020, 1933. a
Gerlach, T. and Smirnova, I.: Liquid–Liquid Equilibria of Quaternary Systems Composed of 1,3-Propanediol, Short-Chain Alcohol, Water, and Salt, J. Chem. Eng. Data, 61, 3548–3558, https://doi.org/10.1021/acs.jced.6b00472, 2016. a
Gettelman, A.: Putting the clouds back in aerosol–cloud interactions, Atmos. Chem. Phys., 15, 12397–12411, https://doi.org/10.5194/acp-15-12397-2015, 2015. a
Gilfedder, B. S., Chance, R., Dettmann, U., Lai, S. C., and Baker, A. R.: Determination of total and non-water soluble iodine in atmospheric aerosols by thermal extraction and spectrometric detection (TESI), Anal. Bioanal. Chem., 398, 519–526, https://doi.org/10.1007/s00216-010-3923-1, 2010. a, b
Gillette, D. A., Stensland, G. J., Williams, A. L., Barnard, W., Gatz, D., Sinclair, P. C., and Johnson, T. C.: Emissions of alkaline elements calcium, magnesium, potassium, and sodium from open sources in the contiguous United States, Global Biogeochem. Cy., 6, 437–457, https://doi.org/10.1029/91GB02965, 1992. a
Glasstone, S., Dimond, D. W., and Jones, E. C.: CCCXCI.–Solubility influences. Part II. The effect of various salts on the solubility of ethyl acetate in water, J. Chem. Soc., 129, 2935–2939, https://doi.org/10.1039/JR9262902935, 1926. a
Goeller, G. M. and Osol, A.: The Salting-out of Molecular Benzoic Acid in Aqueous Salt Solutions at 35∘, J. Am. Chem. Soc., 59, 2132–2134, https://doi.org/10.1021/ja01290a013, 1937. a, b
Goldberg, R. N.: Evaluated activity and osmotic coefficients for aqueous solutions: thirty-six uni-bivalent electrolytes, J. Phys. Chem. Ref. Data, 10, 671–764, https://doi.org/10.1063/1.555646, 1981. a
Goldberg, R. N. and Nuttall, R. L.: Evaluated activity and osmotic coefficients for aqueous solutions: The alkaline earth metal halides, J. Chem. Eng. Data, 7, 263–310, https://doi.org/10.1063/1.555569, 1978. a, b, c, d
Goldman, S., Bates, R. G., and Robinson, R. A.: Osmotic coefficients and activity coefficients of lodic acid at high concentrations, J. Solution Chem., 3, 593–602, https://doi.org/10.1007/BF00650403, 1974. a, b, c
Goldstein, A. H. and Galbally, I. E.: Known and Unexplored Organic Constituents in the Earth's Atmosphere, Environ. Sci. Technol., 41, 1514–1521, https://doi.org/10.1021/es072476p, 2007. a
Gomes, L. and Gillette, D. A.: A comparison of characteristics of aerosol from dust storms in Central Asia with soil-derived dust from other regions, Atmos. Environ. A-Gen., 27, 2539–2544, https://doi.org/10.1016/0960-1686(93)90027-V, 1993. a, b, c
Gorkowski, K., Donahue, N. M., and Sullivan, R. C.: Emulsified and Liquid–Liquid Phase-Separated States of α-Pinene Secondary Organic Aerosol Determined Using Aerosol Optical Tweezers, Environ. Sci. Technol., 51, 12154–12163, https://doi.org/10.1021/acs.est.7b03250, 2017. a
Gregoriou, G. A., Ioannou-Kakouri, H., Dais, P. J., and Scordou-Matinopoulos, A.: The question of the measure of electrolytes in organic reactions. Calculation of activity coefficients of electrolytes in solvolytic media, J. Chem. Soc. Perk. T. 2, p. 1552, https://doi.org/10.1039/p29790001552, 1979. a
Hamer, W. J. and Wu, Y.: Osmotic coefficients and mean activity coefficients of uni-univalent electrolytes in water at 25 ∘C, J. Phys. Chem. Ref. Data, 1, 1047–1099, https://doi.org/10.1063/1.3253108, 1972. a, b, c, d, e, f, g, h, i, j, k, l, m, n, o
Harned, H. S.: The Electromotive Forces of Uni-univalent Halides in Concentrated Aqueous Solutions, J. Am. Chem. Soc., 51, 416–427, https://doi.org/10.1021/ja01377a011, 1929. a, b, c, d
Harvie, C. E., Møller, N., and Weare, J. H.: The prediction of mineral solubilities in natural waters: The Na-K-Mg-Ca-H-Cl-SO4-OH-HCO3-CO3-CO2-H2O system to high ionic strengths at 25 ∘C, Geochim. Cosmochim. Ac., 48, 723–751, https://doi.org/10.1016/0016-7037(84)90098-X, 1984. a, b, c, d, e
Hersey, S. P., Craven, J. S., Metcalf, A. R., Lin, J., Lathem, T., Suski, K. J., Cahill, J. F., Duong, H. T., Sorooshian, A., Jonsson, H. H., Shiraiwa, M., Zuend, A., Nenes, A., Prather, K. A., Flagan, R. C., and Seinfeld, J. H.: Composition and hygroscopicity of the Los Angeles Aerosol: CalNex, J. Geophys. Res.-Atmos., 118, 3016–3036, https://doi.org/10.1002/jgrd.50307, 2013. a
Hetzer, H. B., Robinson, R. A., and Bates, R. G.: Thermodynamics of Aqueous Solutions of Hydriodic Acid from Electromotive Force Measurements of Hydrogen-Silver Iodide Cells, J. Phys. Chem., 68, 1929–1933, https://doi.org/10.1021/j100789a043, 1964. a
Hiaki, T. and Kawai, A.: Vapor–liquid equilibria determination for a hydrofluoroether with several alcohols, Fluid Phase Equilibr., 158–160, 979–989, https://doi.org/10.1016/S0378-3812(99)00064-3, 1999. a
Hill, A. E. and Ricci, J. E.: Ternary Systems. XI. Magnesium Iodate, Sodium Iodate and Water. XII. Sodium Iodate, Potassium Iodate and Water. XIII. Potassium Iodate, Potassium Chloride and Water. XIV. Potassium Iodate, Potassium Sulfate and Water, J. Am. Chem. Soc., 53, 4305–4315, https://doi.org/10.1021/ja01363a007, 1931. a, b
Huang, Y., Mahrt, F., Xu, S., Shiraiwa, M., Zuend, A., and Bertram, A. K.: Coexistence of three liquid phases in individual atmospheric aerosol particles, P. Natl. Acad. Scie. USA, 118, e2102512118, https://doi.org/10.1073/pnas.2102512118, 2021. a
Il'In, K. K. and Cherkasov, D. G.: Solid–Liquid and Solid–Liquid–Liquid Equilibria in the KI + H2O + i-C3H7OH Ternary System within 10–120 ∘C, Chem. Eng. Commun., 203, 642–648, https://doi.org/10.1080/00986445.2015.1076802, 2016. a
Iliuta, M. C. and Thyrion, F. C.: Vapour–liquid equilibrium for the acetone–methanol–inorganic salt system, Fluid Phase Equilibr., 103, 257–284, https://doi.org/10.1016/0378-3812(94)02586-P, 1995. a, b, c, d
Janado, M., Yano, Y., Doi, Y., and Sakamoto, H.: Peculiar effects of alkali thiocyanates on the activity coefficients of aromatic hydrocarbons in water, J. Solution Chem., 12, 741–754, https://doi.org/10.1007/BF00647385, 1983. a, b
Ji, X., Lu, X., Lin, W., Zhang, L., Wang, Y., Shi, J., and Lu, B. C. Y.: Mean activity coefficients of NaCl in (sodium chloride + sodium bicarbonate + water) from T = (293.15 to 308.15) K, J. Chem. Thermodyn., 33, 1107–1120, https://doi.org/10.1006/jcht.2000.0827, 2001. a, b
Kacperska, A.: Solubilities of Sodium and Potassium Iodides in Water-n-Propyl Alcohol Mixtures at 25 ∘C, Phys. Chem. Liq., 26, 273–280, https://doi.org/10.1080/00319109408029500, 1994. a, b
Kielland, J.: Individual Activity Coefficients of Ions in Aqueous Solutions, J. Am. Chem. Soc., 59, 1675–1678, https://doi.org/10.1021/ja01288a032, 1937. a
Kim, S. H., Anantpinijwatna, A., Kang, J. W., and Gani, R.: Analysis and modeling of alkali halide aqueous solutions, Fluid Phase Equilibr., 412, 177–198, https://doi.org/10.1016/j.fluid.2015.12.008, 2016. a
Kiriukhin, M. Y. and Collins, K. D.: Dynamic hydration numbers for biologically important ions, Biophys. Chem., 99, 155–168, https://doi.org/10.1016/S0301-4622(02)00153-9, 2002. a, b
Koenig, T. K., Baidar, S., Campuzano-Jost, P., Cuevas, C. A., Dix, B., Fernandez, R. P., Guo, H., Hall, S. R., Kinnison, D., Nault, B. A., Ullmann, K., Jimenez, J. L., Saiz-Lopez, A., and Volkamer, R.: Quantitative detection of iodine in the stratosphere, P. Natl. Acad. Scie. USA, 117, 1860–1866, https://doi.org/10.1073/pnas.1916828117, 2020. a
Krieger, U. K., Marcolli, C., and Reid, J. P.: Exploring the complexity of aerosol particle properties and processes using single particle techniques, Chem. Soc. Rev., 41, 6631–6662, https://doi.org/10.1039/C2CS35082C, 2012. a, b
Kroll, J. H., Donahue, N. M., Jimenez, J. L., Kessler, S. H., Canagaratna, M. R., Wilson, K. R., Altieri, K. E., Mazzoleni, L. R., Wozniak, A. S., Bluhm, H., Mysak, E. R., Smith, J. D., Kolb, C. E., and Worsnop, D. R.: Carbon oxidation state as a metric for describing the chemistry of atmospheric organic aerosol, Nat. Chem., 3, 133–139, https://doi.org/10.1038/nchem.948, 2011. a
Kumar, R., Saunders, R. W., Mahajan, A. S., Plane, J. M. C., and Murray, B. J.: Physical properties of iodate solutions and the deliquescence of crystalline I2O5 and HIO3, Atmos. Chem. Phys., 10, 12251–12260, https://doi.org/10.5194/acp-10-12251-2010, 2010. a, b, c
Kusik, C. L. and Meissner, H. P.: Electrolytic activity coefficients in inorganic processing, AIChE Sym. S., 74, 14–20, 1978. a
Lee, S. H., Murphy, D. M., Thomson, D. S., and Middlebrook, A. M.: Chemical components of single particles measured with Particle Analysis by Laser Mass Spectrometry (PALMS) during the Atlanta SuperSite Project: Focus on organic/sulfate, lead, soot, and mineral particles, J. Geophys. Res.-Atmos., 107, 4003, https://doi.org/10.1029/2000JD000011, 2002. a
Li, J. D., Polka, H. M., and Gmehling, J.: A gE model for single and mixed-solvent electrolyte systems. 1. Model and results for strong electrolytes, Fluid Phase Equilibr., 94, 89–114, https://doi.org/10.1016/0378-3812(94)87052-7, 1994. a
Li, W., Sun, D., Zhang, T., Dai, S., Pan, F., and Zhang, Z.: Separation of acetone and methanol azeotropic system using ionic liquid as entrainer, Fluid Phase Equilibr., 383, 182–187, https://doi.org/10.1016/j.fluid.2014.10.011, 2014. a
Li, W., Yin, H., Guo, H., Li, J., and Zhang, T.: Separation abilities of three acetate-based ionic liquids for benzene-methanol mixture through vapor-liquid equilibrium experiment at 101.3 kPa, Fluid Phase Equilibr., 492, 80–87, https://doi.org/10.1016/j.fluid.2019.03.022, 2019. a
Liu, W., Wang, J., Zhuo, K., Wang, C., and Lu, J.: Salt effect in nonaqueous mixed solvent systems, Acta Chim. Sinica, 56, 21–31, https://doi.org/10.3321/j.issn:0567-7351.1998.01.004, 1998. a, b
Lohmann, U. and Feichter, J.: Global indirect aerosol effects: a review, Atmos. Chem. Phys., 5, 715–737, https://doi.org/10.5194/acp-5-715-2005, 2005. a
Loÿe-Pilot, M. D., Martin, J. M., and Morelli, J.: Influence of Saharan dust on the rain acidity and atmospheric input to the Mediterranean, Nature, 321, 427–428, https://doi.org/10.1038/321427a0, 1986. a
Macy, R. and Thomas, E. W.: The System: Sodium Iodide–Acetone–Water, J. Am. Chem. Soc., 48, 1547–1550, https://doi.org/10.1021/ja01417a015, 1926. a
Mamontov, M. N. and Gorbachev, A. V.: The thermodynamic properties of lithium carbonate aqueous solution studied by the potentiometric method, J. Chem. Thermodyn., 148, 106146, https://doi.org/10.1016/j.jct.2020.106146, 2020. a
Marcolli, C. and Krieger, U. K.: Phase changes during hygroscopic cycles of mixed organic/inorganic model systems of tropospheric aerosols, J. Phys. Chem. A, 110, 1881–1893, https://doi.org/10.1021/jp0556759, 2006. a
Marcus, Y.: A simple empirical model describing the thermodynamics of hydration of ions of widely varying charges, sizes, and shapes, Biophys. Chem., 51, 111–127, https://doi.org/10.1016/0301-4622(94)00051-4, 1994. a, b
Marion, G. M.: Carbonate mineral solubility at low temperatures in the Na-K-Mg-Ca-H-Cl-SO4-OH-HCO3-CO3-CO2-H2O system, Geochim. Cosmochim. Ac., 65, 1883–1896, https://doi.org/10.1016/S0016-7037(00)00588-3, 2001. a
Mato, F. and Cocero, M. J.: Measurement of vapor pressures of electrolyte solutions by vapor pressure osmometry, J. Chem. Eng. Data, 33, 38–39, https://doi.org/10.1021/je00051a013, 1988. a, b
McGlashan, M. L.: Deviations from Raoult's law, J. Chem. Educ., 40, 516–518, https://doi.org/10.1021/ed040p516, 1963. a, b
Meng, Z., Seinfeld, J. H., Saxena, P., and Kim, Y. P.: Atmospheric Gas-Aerosol Equilibrium: IV. Thermodynamics of Carbonates, Aerosol Sci. Technol., 23, 131–154, https://doi.org/10.1080/02786829508965300, 1995. a, b, c, d, e, f, g, h, i, j, k, l
Miñambres, L., Méndez, E., Sánchez, M. N., Castaño, F., and Basterretxea, F. J.: Water uptake properties of internally mixed sodium halide and succinic acid particles, Atmos. Environ., 45, 5896–5902, https://doi.org/10.1016/j.atmosenv.2011.06.062, 2011. a
Millero, F. J., Milne, P. J., and Thurmond, V. L.: The solubility of calcite, strontianite and witherite in NaCl solutions at 25 ∘C, Geochim. Cosmochim. Ac., 48, 1141–1143, https://doi.org/10.1016/0016-7037(84)90205-9, 1984. a
Mullin, J. W.: Crystallization, 4th edn., Butterworth-Heinemann, Oxford, 2001. a, b
Murphy, D. M. and Thomson, D. S.: Chemical composition of single aerosol particles at Idaho Hill: Negative ion measurements, J. Geophys. Res.-Atmos., 102, 6353–6368, https://doi.org/10.1029/96JD00858, 1997. a
Murray, B. J., Haddrell, A. E., Peppe, S., Davies, J. F., Reid, J. P., O'Sullivan, D., Price, H. C., Kumar, R., Saunders, R. W., Plane, J. M. C., Umo, N. S., and Wilson, T. W.: Glass formation and unusual hygroscopic growth of iodic acid solution droplets with relevance for iodine mediated particle formation in the marine boundary layer, Atmos. Chem. Phys., 12, 8575–8587, https://doi.org/10.5194/acp-12-8575-2012, 2012. a, b
Nasehzadeh, A., Noroozian, E., and Omrani, H.: Experimental and theoretical studies of thermodynamics of lithium halide solutions – ethanol mixtures, J. Chem. Thermodyn., 36, 245–252, https://doi.org/10.1016/j.jct.2003.12.002, 2004. a, b
Nasirzadeh, K., Neueder, R., and Kunz, W.: Vapor Pressures and Osmotic Coefficients of Aqueous LiOH Solutions at Temperatures Ranging from 298.15 to 363.15 K, Ind. Eng. Chem. Res., 44, 3807–3814, https://doi.org/10.1021/ie0489148, 2005. a
Onasch, T. B., McGraw, R., and Imre, D.: Temperature-Dependent Heterogeneous Efflorescence of Mixed Ammonium Sulfate/Calcium Carbonate Particles, J. Phys. Chem. A, 104, 10797–10806, https://doi.org/10.1021/jp0024064, 2000. a
Ovadnevaite, J., Zuend, A., Laaksonen, A., Sanchez, K. J., Roberts, G., Ceburnis, D., Decesari, S., Rinaldi, M., Hodas, N., Facchini, M. C., Seinfeld, J. H., and O' Dowd, C.: Surface tension prevails over solute effect in organic-influenced cloud droplet activation, Nature, 546, 637–641, https://doi.org/10.1038/nature22806, 2017. a, b, c
Pan, C.-F.: Activity and osmotic coefficients in dilute aqueous solutions of uni-univalent electrolytes at 25 ∘C, J. Chem. Eng. Data, 26, 183–184, https://doi.org/10.1021/je00024a028, 1981. a, b, c, d, e, f, g, h
Pankow, J. F.: Gas/particle partitioning of neutral and ionizing compounds to single and multi-phase aerosol particles. 1. Unified modeling framework, Atmos. Environ., 37, 3323–3333, https://doi.org/10.1016/S1352-2310(03)00346-7, 2003. a
Partanen, J. I.: Re-evaluation of the Thermodynamic Activity Quantities in Aqueous Alkali Metal Iodide Solutions at 25 ∘C, J. Chem. Eng. Data, 55, 3708–3719, https://doi.org/10.1021/je100250n, 2010. a, b
Patil, K. R., Tripathi, A. D., Pathak, G., and Katti, S. S.: Thermodynamic properties of aqueous electrolyte solutions. 1. Vapor pressure of aqueous solutions of LICI, LiBr, and LiI, J. Chem. Eng. Data, 35, 166–168, https://doi.org/10.1021/je00060a020, 1990. a
Pawar, R. R., Golait, S. M., Hasan, M., and Sawant, A. B.: Solubility and Density of Potassium Iodide in a Binary Propan-1-ol–Water Solvent Mixture at (298.15, 303.15, 308.15, and 313.15) K, J. Chem. Eng. Data, 55, 1314–1316, https://doi.org/10.1021/je9006426, 2010. a
Pawar, R. R., Aher, C. S., Pagar, J. D., Nikam, S. L., and Hasan, M.: Solubility, Density and Solution Thermodynamics of NaI in Different Pure Solvents and Binary Mixtures, J. Chem. Eng. Data, 57, 3563–3572, https://doi.org/10.1021/je300754n, 2012. a, b, c
Pearce, J. N. and Nelson, A. F.: The vapor pressures of aqueous solutions of lithium nitrate and the activity coefficients of some alkali salts in solutions at high concentrations at 25 ∘C, J. Am. Chem. Soc., 54, 3544–3555, https://doi.org/10.1021/ja01348a008, 1932. a, b
Pechtl, S., Schmitz, G., and von Glasow, R.: Modelling iodide – iodate speciation in atmospheric aerosol: Contributions of inorganic and organic iodine chemistry, Atmos. Chem. Phys., 7, 1381–1393, https://doi.org/10.5194/acp-7-1381-2007, 2007. a
Peiper, J. C. and Pitzer, K. S.: Thermodynamics of aqueous carbonate solutions including mixtures of sodium carbonate, bicarbonate, and chloride, J. Chem. Thermodyn., 14, 613–638, https://doi.org/10.1016/0021-9614(82)90078-7, 1982. a
Pethybridge, A. D. and Prue, J. E.: Equilibria in aqueous solutions of iodic acid, T. Faraday Soc., 63, 2019–2033, https://doi.org/10.1039/TF9676302019, 1967. a
Pitzer, K. S.: Activity Coefficients in Electrolyte Solutions, CRC Press, Roca Raton, FL, USA, 1991. a
Pye, H. O. T., Zuend, A., Fry, J. L., Isaacman-VanWertz, G., Capps, S. L., Appel, K. W., Foroutan, H., Xu, L., Ng, N. L., and Goldstein, A. H.: Coupling of organic and inorganic aerosol systems and the effect on gas–particle partitioning in the southeastern US, Atmos. Chem. Phys., 18, 357–370, https://doi.org/10.5194/acp-18-357-2018, 2018. a, b, c
Pye, H. O. T., Nenes, A., Alexander, B., Ault, A. P., Barth, M. C., Clegg, S. L., Collett Jr., J. L., Fahey, K. M., Hennigan, C. J., Herrmann, H., Kanakidou, M., Kelly, J. T., Ku, I.-T., McNeill, V. F., Riemer, N., Schaefer, T., Shi, G., Tilgner, A., Walker, J. T., Wang, T., Weber, R., Xing, J., Zaveri, R. A., and Zuend, A.: The acidity of atmospheric particles and clouds, Atmos. Chem. Phys., 20, 4809–4888, https://doi.org/10.5194/acp-20-4809-2020, 2020. a, b, c
Raso, A. R. W., Custard, K. D., May, N. W., Tanner, D., Newburn, M. K., Walker, L., Moore, R. J., Huey, L. G., Alexander, L., Shepson, P. B., and Pratt, K. A.: Active molecular iodine photochemistry in the Arctic, P. Natl. Acad. Scie. USA, 114, 10053–10058, https://doi.org/10.1073/pnas.1702803114, 2017. a
Rastak, N., Pajunoja, A., Acosta Navarro, J. C., Ma, J., Song, M., Partridge, D. G., Kirkevåg, A., Leong, Y., Hu, W. W., Taylor, N. F., Lambe, A., Cerully, K., Bougiatioti, A., Liu, P., Krejci, R., Petäjä, T., Percival, C., Davidovits, P., Worsnop, D. R., Ekman, A. M. L., Nenes, A., Martin, S., Jimenez, J. L., Collins, D. R., Topping, D. O., Bertram, A. K., Zuend, A., Virtanen, A., and Riipinen, I.: Microphysical explanation of the RH-dependent water affinity of biogenic organic aerosol and its importance for climate, Geophys. Res. Lett., 44, 5167–5177, https://doi.org/10.1002/2017GL073056, 2017. a, b
Renbaum-Wolff, L., Song, M., Marcolli, C., Zhang, Y., Liu, P. F., Grayson, J. W., Geiger, F. M., Martin, S. T., and Bertram, A. K.: Observations and implications of liquid–liquid phase separation at high relative humidities in secondary organic material produced by α-pinene ozonolysis without inorganic salts, Atmos. Chem. Phys., 16, 7969–7979, https://doi.org/10.5194/acp-16-7969-2016, 2016. a
Revie, R. W. and Uhlig, H. H.: Corrosion and Corrosion Control – An Introduction to Corrosion Science and Engineering, 4th edn., John Wiley & Sons, available at: https://app.knovel.com/hotlink/toc/id:kpCCCAICSK/corrosion-corrosion-control/corrosion-corrosion-control (last access: 6 May 2021), 2008. a
Ricci, J. E.: The Ternary Systems KIO3-KBr-H2O and NaIO3-NaBr-H2O, J. Am. Chem. Soc., 56, 290–295, https://doi.org/10.1021/ja01317a007, 1934. a, b
Ricci, J. E.: The Ternary Systems KClO3-KBr-H2O, KClO3-KI-H2O and KIO3-KI-H2O at 25∘, J. Am. Chem. Soc., 59, 866–867, https://doi.org/10.1021/ja01284a029, 1937. a
Robinson, R. A.: The Activity Coefficients of the Alkali Bromides and Iodides in Aqueous Solution from Vapor Pressure Measurements, J. Am. Chem. Soc., 57, 1161–1165, https://doi.org/10.1021/ja01310a004, 1935. a, b
Robinson, R. A. and Harned, H. S.: Some Aspects of the Thermodynamics of Strong Electrolytes from Electromotive Force and Vapor Pressure Measurements, Chem. Rev., 28, 419–476, https://doi.org/10.1021/cr60091a001, 1941. a
Robinson, R. A. and Macaskill, J. B.: Osmotic coefficients of aqueous sodium carbonate solutions at 25 ∘C, J. Solution Chem., 8, 35–40, https://doi.org/10.1007/BF00646807, 1979. a
Robinson, R. A. and Sinclair, D. A.: The Activity Coefficients of the Alkali Chlorides and of Lithium Iodide in Aqueous Solution from Vapor Pressure Measurements, J. Am. Chem. Soc., 56, 1830–1835, https://doi.org/10.1021/ja01324a003, 1934. a
Robinson, R. A. and Stokes, R. H.: Tables of osmotic and activity coefficients of electrolytes in aqueous solution at 25 ∘C, T. Faraday Soc., 45, 612–624, https://doi.org/10.1039/TF9494500612, 1949. a, b, c, d, e, f, g, h, i
Robinson, R. A. and Stokes, R. H.: Electrolyte Solutions, 2nd, revised edn., Dover Publications Inc., New York, USA, 2002. a, b
Robinson, R. A., Stokes, R. H., and Wilson, J. M.: A thermodynamic study of bivalent metal halides in aqueous solution, T. Faraday Soc., 36, 733–748, https://doi.org/10.1039/TF9403600733, 1940. a, b, c
Roy, R. N., Gibbons, J. J., Williams, R., Godwin, L., Baker, G., Simonson, J. M., and Pitzer, K. S.: The thermodynamics of aqueous carbonate solutions II. Mixtures of potassium carbonate, bicarbonate, and chloride, J. Chem. Thermodyn., 16, 303–315, https://doi.org/10.1016/0021-9614(84)90170-8, 1984. a, b, c
Roy, R. N., Hufford, K., Lord, P. J., Mrad, D. R., Roy, L. N., and Johnson, D. A.: The first acidity constant of carbon dioxide in solutions of ammonium chloride from e.m.f. measurements at 278.15 to 318.15 K, J. Chem. Thermodyn., 20, 63–77, https://doi.org/10.1016/0021-9614(88)90210-8, 1988. a
Safarov, J. T.: Vapor Pressure Measurements of LiI + C2H5OH Solutions, Z. Phys. Chem., 219, 1133–1144, https://doi.org/10.1524/zpch.2005.219.8.1133, 2005. a
Saiz-Lopez, A., Plane, J. M., Baker, A. R., Carpenter, L. J., von Glasow, R., Martín, J. C., McFiggans, G., and Saunders, R. W.: Atmospheric Chemistry of Iodine, Chem. Rev., 112, 1773–804, https://doi.org/10.1021/cr200029u, 2012. a, b, c, d
Salabat, A. and Hashemi, M.: Liquid–liquid equilibria for aliphatic alcohols + water + potassium carbonate systems; experiment and correlation, Phys. Chem. Liq., 45, 231–239, https://doi.org/10.1080/10683160500520502, 2007. a
Sarbar, M., Covington, A. K., Nuttall, R. L., and Goldberg, R. N.: The activity and osmotic coefficients of aqueous sodium bicarbonate solutions, J. Chem. Thermodyn., 14, 967–976, https://doi.org/10.1016/0021-9614(82)90006-4, 1982a. a, b
Sarbar, M., Covington, A. K., Nuttall, R. L., and Goldberg, R. N.: Activity and osmotic coefficients of aqueous potassium carbonate, J. Chem. Thermodyn., 14, 695–702, https://doi.org/10.1016/0021-9614(82)90085-4, 1982b. a
Saxena, P. and Hildemann, L.: Water-soluble organics in atmospheric particles: A critical review of the literature and application of thermodynamics to identify candidate compounds, J. Atmos. Chem., 24, 57–109, https://doi.org/10.1007/BF00053823, 1996. a
Seinfeld, J. H. and Pandis, S. N.: Atmospheric Chemistry and Physics: From Air Pollution to Climate Change, J. Wiley & Sons, New York, USA, 1998. a, b
Seto, F. Y. B. and Duce, R. A.: A laboratory study of iodine enrichment on atmospheric sea-salt particles produced by bubbles, J. Geophys. Res., 77, 5339–5349, https://doi.org/10.1029/JC077i027p05339, 1972. a
Sharygin, A. V. and Wood, R. H.: Densities of aqueous solutions of sodium carbonate and sodium bicarbonate at temperatures from (298 to 623) K and pressures to 28 MPa, J. Chem. Thermodyn., 30, 1555–1570, https://doi.org/10.1006/jcht.1998.0426, 1998. a
Smith, M. L., Kuwata, M., and Martin, S. T.: Secondary Organic Material Produced by the Dark Ozonolysis of α-Pinene Minimally Affects the Deliquescence and Efflorescence of Ammonium Sulfate, Aerosol Sci. Technol., 45, 244–261, https://doi.org/10.1080/02786826.2010.532178, 2011. a
Song, M., Marcolli, C., Krieger, U. K., Zuend, A., and Peter, T.: Liquid-liquid phase separation and morphology of internally mixed dicarboxylic acids/ammonium sulfate/water particles, Atmos. Chem. Phys., 12, 2691–2712, https://doi.org/10.5194/acp-12-2691-2012, 2012. a
Soonsin, V., Zardini, A. A., Marcolli, C., Zuend, A., and Krieger, U. K.: The vapor pressures and activities of dicarboxylic acids reconsidered: the impact of the physical state of the aerosol, Atmos. Chem. Phys., 10, 11753–11767, https://doi.org/10.5194/acp-10-11753-2010, 2010. a, b, c
Stokes, R. H.: Isopiestic Vapor Pressure Measurements on Concentrated Solutions of Sodium Hydroxide at 25∘, J. Am. Chem. Soc., 67, 1689–1691, https://doi.org/10.1021/ja01226a022, 1945. a, b
Stokes, R. H.: A thermodynamic study of bivalent metal halides in aqueous solution. Part XVII–revision of data for all 2:1 and 1:2 electrolytes at 25∘, and discussion of results, T. Faraday Soc., 44, 295–307, https://doi.org/10.1039/TF9484400295, 1948. a, b, c
Stokes, R. H. and Robinson, R. A.: Interactions in aqueous nonelectrolyte solutions, I. Solute-solvent equilibria, J. Phys. Chem., 70, 2126–2130, https://doi.org/10.1021/j100879a010, 1966. a
Sugunan, S. and Thomas, B.: Salting coefficient of hydroxybenzoic acids, Indian J. Chem. A, 34, 134–136, 1995. a
Sun, R.: Effect of Salt on Relative Volatility of Binary Solution, J. Chem. Ind. Eng. (China), 36, 204–214, 1985. a
Sun, R.: Molecular thermodynamics of salt effect in vapor-liquid equilibrium–calculation of isobaric VLE salt effect parameters for ethanol-water-1-1 type electrolytic systems, J. Chem. Ind. Eng. (China), 47, 401–409, 1996. a
Sun, X., Sun, Q., and Sun, R.: Determination and calculation of salt effect parameters in vapor – liquid equilibrium of polar – nonpolar binary solution, Chem. Res., 11, 17–22, https://doi.org/10.14002/j.hxya.2000.02.005, 2000. a
Sviridenkov, M. A., Gillette, D. A., Isakov, A. A., Sokolik, I. N., Smirnov, V. V., Belan, B. D., Pachenko, M. V., Andronova, A. V., Kolomiets, S. M., Zhukov, V. M., and Zhukovsky, D. A.: Size distributions of dust aerosol measured during the Soviet-American experiment in Tadzhikistan, 1989, Atmos. Environ. A-Gen., 27, 2481–2486, https://doi.org/10.1016/0960-1686(93)90019-U, 1993. a
Tegen, I., Lacis, A. A., and Fung, I.: The influence on climate forcing of mineral aerosols from disturbed soils, Nature, 380, 419–422, https://doi.org/10.1038/380419a0, 1996. a
Tsukada, H., Hara, H., Iwashima, K., and Yamagata, N.: The Iodine Content of Atmospheric Aerosols as Determined by the Use of a Fluoropore Filter for Collection, B. Chem. Soc. Jpn., 60, 3195–3198, https://doi.org/10.1246/bcsj.60.3195, 1987. a
Tu, C.-H., Wu, Y.-S., and Liu, T.-L.: Vapor-liquid equilibria of the binary systems formed by methanol, acetone and methyl vinyl ketone at 100.0 ± 0.2 kPa, Fluid Phase Equilibr., 129, 129–137, https://doi.org/10.1016/S0378-3812(96)03183-4, 1997. a
Vanderzee, C. E.: Thermodynamic properties of solutions of a hydrolyzing electrolyte: relative partial molar enthalpies and heat capacities, solvent activities, osmotic coefficients, and solute activity coefficients of aqueous sodium carbonate, J. Chem. Thermodyn., 14, 1051–1067, https://doi.org/10.1016/0021-9614(82)90149-5, 1982. a
Veghte, D. P., Altaf, M. B., and Freedman, M. A.: Size Dependence of the Structure of Organic Aerosol, J. Am. Chem. Soc., 135, 16046–16049, https://doi.org/10.1021/ja408903g, 2013. a
Wang, J., Wu, X., and Zhang, S.: Development of a thermodynamic model for the Li2CO3-NaCl-Na2SO4-H2O system and its application, J. Chem. Thermodyn., 123, 62–73, https://doi.org/10.1016/j.jct.2018.03.027, 2018. a, b
Wexler, A. S. and Clegg, S. L.: Atmospheric aerosol models for systems including the ions H+, , Na+, , , Cl−, Br−, and H2O, J. Geophys. Res.-Atmos., 107, 14–1, https://doi.org/10.1029/2001JD000451, 2002. a, b
Xie, S., Song, W., Fu, C., Yi, C., and Qiu, X.: Separation of acetone: From a water miscible system to an efficient aqueous two-phase system, Sep. Purif. Technol., 192, 55–61, https://doi.org/10.1016/j.seppur.2017.09.056, 2018. a
Xu, S., Xie, Z., Li, B., Liu, W., Sun, L., Kang, H., Yang, H., and Zhang, P.: Iodine speciation in marine aerosols along a 15 000-km round-trip cruise path from Shanghai, China, to the Arctic Ocean, Environ. Chem., 7, 406–412, https://doi.org/10.1071/EN10048, 2010. a
Yamamoto, H., Fukase, K., and Shibata, J.: Vapor–Liquid Equilibria for Alcohol + Alcohol + Sodium Iodide at 298.15 K, J. Chem. Eng. Data, 42, 414, https://doi.org/10.1021/je9603640, 1997. a
Yan, W. D., Topphoff, M., Rose, C., and Gmehling, J.: Prediction of vapor–liquid equilibria in mixed-solvent electrolyte systems using the group contribution concept, Fluid Phase Equilibr., 162, 97–113, https://doi.org/10.1016/S0378-3812(99)00201-0, 1999. a
Yang, L., Zhuo, K., Zhao, Y., and Wang, J.: Thermodynamics of the Interaction between Electrolyte (CaCl2, NaCl, NaBr, NaI) and Monosaccharide (D-mannose, D-ribose) in Water at 298.15 K, Z. Phys. Chem., 218, 349–362, https://doi.org/10.1524/zpch.218.3.349.26494, 2004. a, b
Yang, M., Leng, C., Li, S., and Sun, R.: Study of activity coefficients for sodium iodide in (methanol + benzene) system by (vapour + liquid) equilibrium measurements, J. Chem. Thermodyn., 39, 49–54, https://doi.org/10.1016/j.jct.2006.06.002, 2007. a
Yaws, C. L.: Yaws handbook of thermodynamic properties for hydrocarbons and chemicals, Knovel, New York, 2009. a, b
Yin, L., Zhao, H., Chen, G., Xu, Y., Chen, Y., and Li, Y.: Experimental results for fluid phase equilibria of (n-propanol + water + salt) and comparison with predictions, Desalin. Water Treat., 132, 144–149, https://doi.org/10.5004/dwt.2018.23128, 2018. a
Young, T. F., Maranville, L. F., and Smith, H. M.: Raman Spectral Investigations of Ionic Equilibria in Solutions of Strong Electrolytes, in: The Structure of Electrolytic Solutions, Wiley, New York, USA, 441 pp., ISBN 9780598639080, 1959. a
Zafarani-Moattar, M. T. and Jahanbin-Sardroodi, J.: Isopiestic determination of osmotic coefficients and evaluation of vapor pressures for electrolyte solutions of some lithium salts in ethanol, Fluid Phase Equilibr., 166, 207–223, https://doi.org/10.1016/S0378-3812(99)00293-9, 1999. a
Zardini, A. A., Sjogren, S., Marcolli, C., Krieger, U. K., Gysel, M., Weingartner, E., Baltensperger, U., and Peter, T.: A combined particle trap/HTDMA hygroscopicity study of mixed inorganic/organic aerosol particles, Atmos. Chem. Phys., 8, 5589–5601, https://doi.org/10.5194/acp-8-5589-2008, 2008. a
Zaveri, R. A., Easter, R. C., Fast, J. D., and Peters, L. K.: Model for Simulating Aerosol Interactions and Chemistry (MOSAIC), J. Geophys. Res.-Atmos., 113, D13204, https://doi.org/10.1029/2007JD008782, 2008. a, b
Zaytsev, I. D. and Aseyev, G. G.: Properties of aqueous solutions of electrolytes, CRC Press, 1729 pp., ISBN 9780849393143, 1992. a, b, c, d, e, f, g, h
Zdanovskii, A. B.: Novyi metod rascheta rastvorimostei elektrolitov v mnogokomponentny sistema. 1. (New methods of calculating solubilities of electrolytes in multicomponent systems, 1.), Zh. Fiz. Khim.+, 22, 1478–1485, 1948. a
Zhang, Q., Jimenez, J. L., Canagaratna, M. R., Allan, J. D., Coe, H., Ulbrich, I., Alfarra, M. R., Takami, A., Middlebrook, A. M., Sun, Y. L., Dzepina, K., Dunlea, E., Docherty, K., DeCarlo, P. F., Salcedo, D., Onasch, T., Jayne, J. T., Miyoshi, T., Shimono, A., Hatakeyama, S., Takegawa, N., Kondo, Y., Schneider, J., Drewnick, F., Borrmann, S., Weimer, S., Demerjian, K., Williams, P., Bower, K., Bahreini, R., Cottrell, L., Griffin, R. J., Rautiainen, J., Sun, J. Y., Zhang, Y. M., and Worsnop, D. R.: Ubiquity and dominance of oxygenated species in organic aerosols in anthropogenically-influenced Northern Hemisphere midlatitudes, Geophys. Res. Lett., 34, L13801, https://doi.org/10.1029/2007GL029979, 2007. a
Zhuo, K., Liu, H., Zhang, H., Liu, Y., and Wang, J.: Activity Coefficients and Volumetric Properties for the NaI + Maltose + Water System at 298.15 K, J. Chem. Eng. Data, 53, 57–62, https://doi.org/10.1021/je700366w, 2008. a, b
Zuend, A.: andizuend/AIOMFAC: AIOMFAC-web v3.02 (v3.02), Zenodo [code], https://doi.org/10.5281/zenodo.5866756, 2022. a
Zuend, A. and Seinfeld, J. H.: Modeling the gas-particle partitioning of secondary organic aerosol: the importance of liquid-liquid phase separation, Atmos. Chem. Phys., 12, 3857–3882, https://doi.org/10.5194/acp-12-3857-2012, 2012. a
Zuend, A., Marcolli, C., Luo, B. P., and Peter, T.: A thermodynamic model of mixed organic-inorganic aerosols to predict activity coefficients, Atmos. Chem. Phys., 8, 4559–4593, https://doi.org/10.5194/acp-8-4559-2008, 2008. a, b, c, d, e, f, g, h, i, j, k
Zuend, A., Marcolli, C., Peter, T., and Seinfeld, J. H.: Computation of liquid-liquid equilibria and phase stabilities: implications for RH-dependent gas/particle partitioning of organic-inorganic aerosols, Atmos. Chem. Phys., 10, 7795–7820, https://doi.org/10.5194/acp-10-7795-2010, 2010. a
Zuend, A., Marcolli, C., Booth, A. M., Lienhard, D. M., Soonsin, V., Krieger, U. K., Topping, D. O., McFiggans, G., Peter, T., and Seinfeld, J. H.: New and extended parameterization of the thermodynamic model AIOMFAC: calculation of activity coefficients for organic-inorganic mixtures containing carboxyl, hydroxyl, carbonyl, ether, ester, alkenyl, alkyl, and aromatic functional groups, Atmos. Chem. Phys., 11, 9155–9206, https://doi.org/10.5194/acp-11-9155-2011, 2011. a, b, c, d, e, f, g, h, i, j
Zuend, A., Levac, N., and Seinfeld, J. H.: AIOMFAC-web website and online model, available at: https://aiomfac.lab.mcgill.ca (last access: 6 December 2021), 2012. a
Zuend, A., Yin, H., and Lilek, J.: AIOMFAC-web v3.00 – Public model code repository, GitHub [code], available at: https://github.com/andizuend/AIOMFAC, last access: 6 December 2021. a
- Abstract
- Introduction
- Methods
- New systems: properties, chemical equilibria, and data types
- Results and discussion
- Atmospheric implications
- Conclusions
- Code and data availability
- Author contributions
- Competing interests
- Disclaimer
- Acknowledgements
- Financial support
- Review statement
- References
- Supplement