the Creative Commons Attribution 4.0 License.
the Creative Commons Attribution 4.0 License.
 | 22 Jul 2022
Distribution of hydrogen peroxide over Europe during the BLUESKY aircraft campaign
Zaneta T. Hamryszczak
Andrea Pozzer
Florian Obersteiner
Birger Bohn
Benedikt Steil
Jos Lelieveld
Horst Fischer
In this work we present airborne in situ trace gas observations of hydrogen peroxide (H2O2) and the sum of organic hydroperoxides over Europe during the Chemistry of the Atmosphere – Field Experiments in Europe (CAFE-EU, also known as BLUESKY) aircraft campaign using a wet chemical monitoring system, the HYdrogen Peroxide and Higher Organic Peroxide (HYPHOP) monitor. The campaign took place in May–June 2020 over central and southern Europe with two additional flights dedicated to the North Atlantic flight corridor. Airborne measurements were performed on the High Altitude and LOng-range (HALO) research operating out of Oberpfaffenhofen (southern Germany). We report average mixing ratios for H2O2 of 0.32 ± 0.25, 0.39 ± 0.23 and 0.38 ± 0.21 ppbv in the upper and middle troposphere and the boundary layer over Europe, respectively. Vertical profiles of measured H2O2 reveal a significant decrease, in particular above the boundary layer, contrary to previous observations, most likely due to cloud scavenging and subsequent rainout of soluble species. In general, the expected inverted C-shaped vertical trend with maximum hydrogen peroxide mixing ratios at 3–7 km was not found during BLUESKY. This deviates from observations during previous airborne studies over Europe, i.e., 1.64 ± 0.83 ppbv during the HOOVER campaign and 1.67 ± 0.97 ppbv during UTOPIHAN-ACT II/III. Simulations with the global chemistry–transport model EMAC partly reproduce the strong effect of rainout loss on the vertical profile of H2O2. A sensitivity study without H2O2 scavenging performed using EMAC confirms the strong influence of clouds and precipitation scavenging on hydrogen peroxide concentrations. Differences between model simulations and observations are most likely due to difficulties in the simulation of wet scavenging processes due to the limited model resolution.
- Article
(5528 KB) - Full-text XML
-
Supplement
(3384 KB) - BibTeX
- EndNote


Hydrogen peroxide (H2O2) and related organic hydroperoxide (ROOH) species have been investigated as atmospheric trace gases for many decades, and in the 1970s hydrogen peroxide was identified as a key agent in the acidification of clouds and rain through its oxidation of sulfur dioxide into sulfuric acid (Hoffmann and Edwards, 1975; Penkett et al., 1979; Robbin Martin and Damschen, 1981; Kunen et al., 1983; McArdle and Hoffmann, 1983; Calvert et al., 1985). Related studies confirmed the role of H2O2 as an oxidizing agent in clouds where it accelerates the conversion of NO2 to HNO3 (Damschen and Martin, 1983; Lee and Lind, 1986). Efforts have also been made to characterize and analyze the amount and the chemical pathways of hydrogen peroxide in clouds (Kelly et al., 1985; Olszyna et al., 1988; Sakugawa et al., 1990, 1993). Furthermore, gas-phase hydroperoxides are a reservoir of hydrogen oxide and hydrogen peroxide radicals (HOx), which are well known for their contribution to the self-cleaning properties of the atmosphere (Levy, 1971; Lelieveld and Crutzen, 1990; Crutzen et al., 1999).
The main source of gaseous hydrogen peroxide is the self-reaction of HO2 radicals derived from the oxidation of carbon monoxide (CO) and other trace gases by OH radicals, which are formed during photolysis of ozone and the subsequent reaction of the formed O1D with water vapor (Crutzen, 1973; Logan et al., 1981; Kleinman, 1986; Lightfoot et al., 1992; Reeves and Penkett, 2003). The formation of the most prominent organic hydroperoxide, methyl hydroperoxide (MHP), results from the reaction of HO2 with the methyl peroxy radical (CH3OO) derived from methane oxidation by OH (Levy, 1971).
The formation of gaseous hydroperoxides strongly depends on the chemical composition of the troposphere as well as on meteorological conditions. Thus, mixing ratios of H2O2 and CH3OOH are primarily controlled by the mixing ratios of O3, H2O, CO, CH4 and NOx (NO + NO2 = NOx) as well as by UV radiation. Hydroperoxide levels depend to a large extent on available peroxy radicals and therefore on O3 and NOx species as the key promoters and suppressors of hydroperoxide synthesis, since peroxy radicals generally react faster with NO than they recombine. Consequently, the budget of available peroxides is influenced by the levels of ambient NOx (Campbell et al., 1979; Jaeglé et al., 1999; Lee et al., 2000). The amount of available H2O2 in the troposphere further depends on the presence of water vapor.
With increasing altitudes and latitudes, the concentration of water vapor becomes the most prominent limiting factor for precursor production. With increasing altitude, the concentration of water vapor decreases, while photolytic activity simultaneously increases, and the role of hydroperoxides as a source of HOx becomes more prominent, leading to a decrease in hydrogen peroxide (Heikes et al., 1996b; Jaeglé et al., 1997; Faloona et al., 2000; Jaeglé et al., 2000). With increasing latitude, the zenith angle decreases, resulting in reduced UV radiation, while the amount of water is also reduced. Therefore, the availability of hydroperoxide precursors and consequently of hydroperoxides decreases towards the poles (Jacob and Klockow, 1992; Perros, 1993; Slemr and Tremmel, 1994; Snow, 2003; Snow et al., 2007).
Due to the strong sensitivity of hydrogen peroxide to deposition processes, its high solubility and pronounced mixing within the boundary layer, levels of H2O2 are limited at low altitudes where dry deposition and rainout remove the species from the troposphere. Consequently, the maximum mixing ratio can be expected above the boundary layer at 2–5 km, resulting in a characteristic inverted C-shaped vertical profile with increasing altitude (Hall and Claiborn, 1997; Hall et al., 1999).
An analogous but less pronounced vertical profile, due to lower sensitivity towards deposition processes, is expected for organic hydroperoxides (Palenik et al., 1987; Weinstein-Lloyd et al., 1998; Snow, 2003; Snow et al., 2007).
Clouds play a significant role in the budget of hydroperoxides in the atmosphere. Cloud uptake and subsequent rainout of hydroperoxides in the aqueous phase have a considerable impact on the distribution of hydrogen peroxide. H2O2 is taken up by water droplets, dissociated and partially consumed by aqueous-phase reactions within clouds (Sakugawa et al., 1990). Previous studies have reported that despite the low volume fraction of clouds in the troposphere, levels of hydroperoxides and their precursors are decreased by clouds, leading to reduced oxidation processes and therefore diminished self-cleaning efficiency of the atmosphere. Moreover, cloud-mediated upward transport processes as well as precipitation-induced downward transport of soluble trace gases and particulate matter play key roles in the vertical distribution of many species (Lelieveld and Crutzen, 1994). Additionally, scattering, reflection and diffusion of solar radiation, which take place within, above and below clouds, lead to modification of photolysis rates. Therefore, changes in soluble species as well as influences on the chemical processes and the tropospheric redistribution caused by clouds have to be considered (Madronich, 1987; Edy et al., 1996). Finally, the effective separation of soluble and insoluble gases and the consecutive perturbation of the gas-phase chemistry balance have a great impact on the budget of the species (Lelieveld and Crutzen, 1991).
The amount and fate of H2O2 in the dynamic multi-phase cloud system are determined by the distribution of its precursors as well as by the partitioning of H2O2 between gas and liquid phases. Here, the balance between H2O2 and HOx (OH + HO2 = HOx) in both cloud phases is determined by the Henry coefficient and the presence of other interacting species (Brimblecombe and Dawson, 1984; Warneck, 1991, 1994). Generally, gas-phase production of OH is suppressed within clouds due to a significant pH-dependent uptake of HO2 into the aqueous cloud phase. Further, due to its high Henry's law constant, a critical amount of hydrogen peroxide itself is transferred into the aqueous phase as well. On the other hand, the aqueous phase of clouds can be an efficient source of these species as a result of cloud evaporation, droplet elevation and freezing. Earlier studies report mixing ratios of hydrogen peroxide in the gaseous cloud phase between 0.1 and 0.2 ppbv and concentrations of 10−7–10−4 mol L−1 in the aqueous phase (Zuo and Hoigné, 1993). The budget of hydrogen peroxide within clouds further depends on conditions such as solar radiation, temperature, concentrations of volatile organic compounds (VOC) and the liquid water content that impact the mixing ratio of the trace gas. Enhanced levels of NOx and SO2 have a negative effect on the total hydrogen peroxide concentration (Kelly et al., 1985; Sakugawa et al., 1990). The cloud scavenging effect on MHP has to be considered as well. Despite the relatively low uptake of the species and its direct precursor CH3OO by cloud droplets, the production of MHP is reduced as a result of the reduced availability of OH. Thus, overall clouds lead to a loss of MHP, but to a far lesser extent than for hydrogen peroxide. Numerous reactions within the aqueous phase of clouds have to be distinguished from comparable processes in the gas phase. Here, a variety of reaction paths depending on cloud water pH and the presence of transition metals as well as related ionic species (especially in continental clouds) derived from anthropogenic and mineral sources have to be considered (Kormann et al., 1988; Zuo and Hoigne, 1992; Anastasio et al., 1994; Zuo and Deng, 1997).
The following sections (Sects. 2 and 3) introduce the BLUESKY project and give a brief description of the experimental and modeling techniques as well as the measurement framework. In Sect. 4 we present the results and discuss the measurements in comparison with simulated data and with former campaigns and examine hydrogen peroxide uptake and release processes in clouds based on a case study over Frankfurt airport. Here we will show that although the BLUESKY campaign was performed under lockdown conditions, we find that reduced H2O2 mixing ratios in comparison to the HOOVER and UTOPIHAN-ACT campaigns as well as the EMAC simulations are not explained by chemical but rather by meteorological conditions. This study gives a general overview of the distribution of the species in mostly clouded environments. Hence, the presented work highlights the impact of cloud scavenging and rainout processes on the budget of the species in the troposphere.
The purpose of the airborne BLUESKY campaign was to investigate how reduced emissions from anthropogenic sources due to the COVID-19 pandemic and the related shutdown impacted the chemistry and physics of the atmosphere over Europe. To this end, the campaign obtained an overview of the distribution of a large suite of trace gases and aerosols. The decrease in air pollution and aircraft emissions provided a unique opportunity for analysis of the resulting changes in the atmosphere. The reduced pollution levels gave rise to anomalous blue skies, hence the name “BLUESKY” (Voigt et al., 2022). The project was carried out in May and June 2020 covering an area from the Mediterranean region in southern Europe (approximately 35∘ N) up to the North Atlantic flight corridor (approximately 60∘ N). During the measurement period, eight measurement flights were carried out with the German High Altitude and LOng-range research aircraft (HALO). The entirety of the flight tracks of HALO during the campaign color-coded by flight altitude is presented in Fig. 1. Flights over the North Atlantic flight corridor were not included in this study, since they were performed entirely in the lower stratosphere.
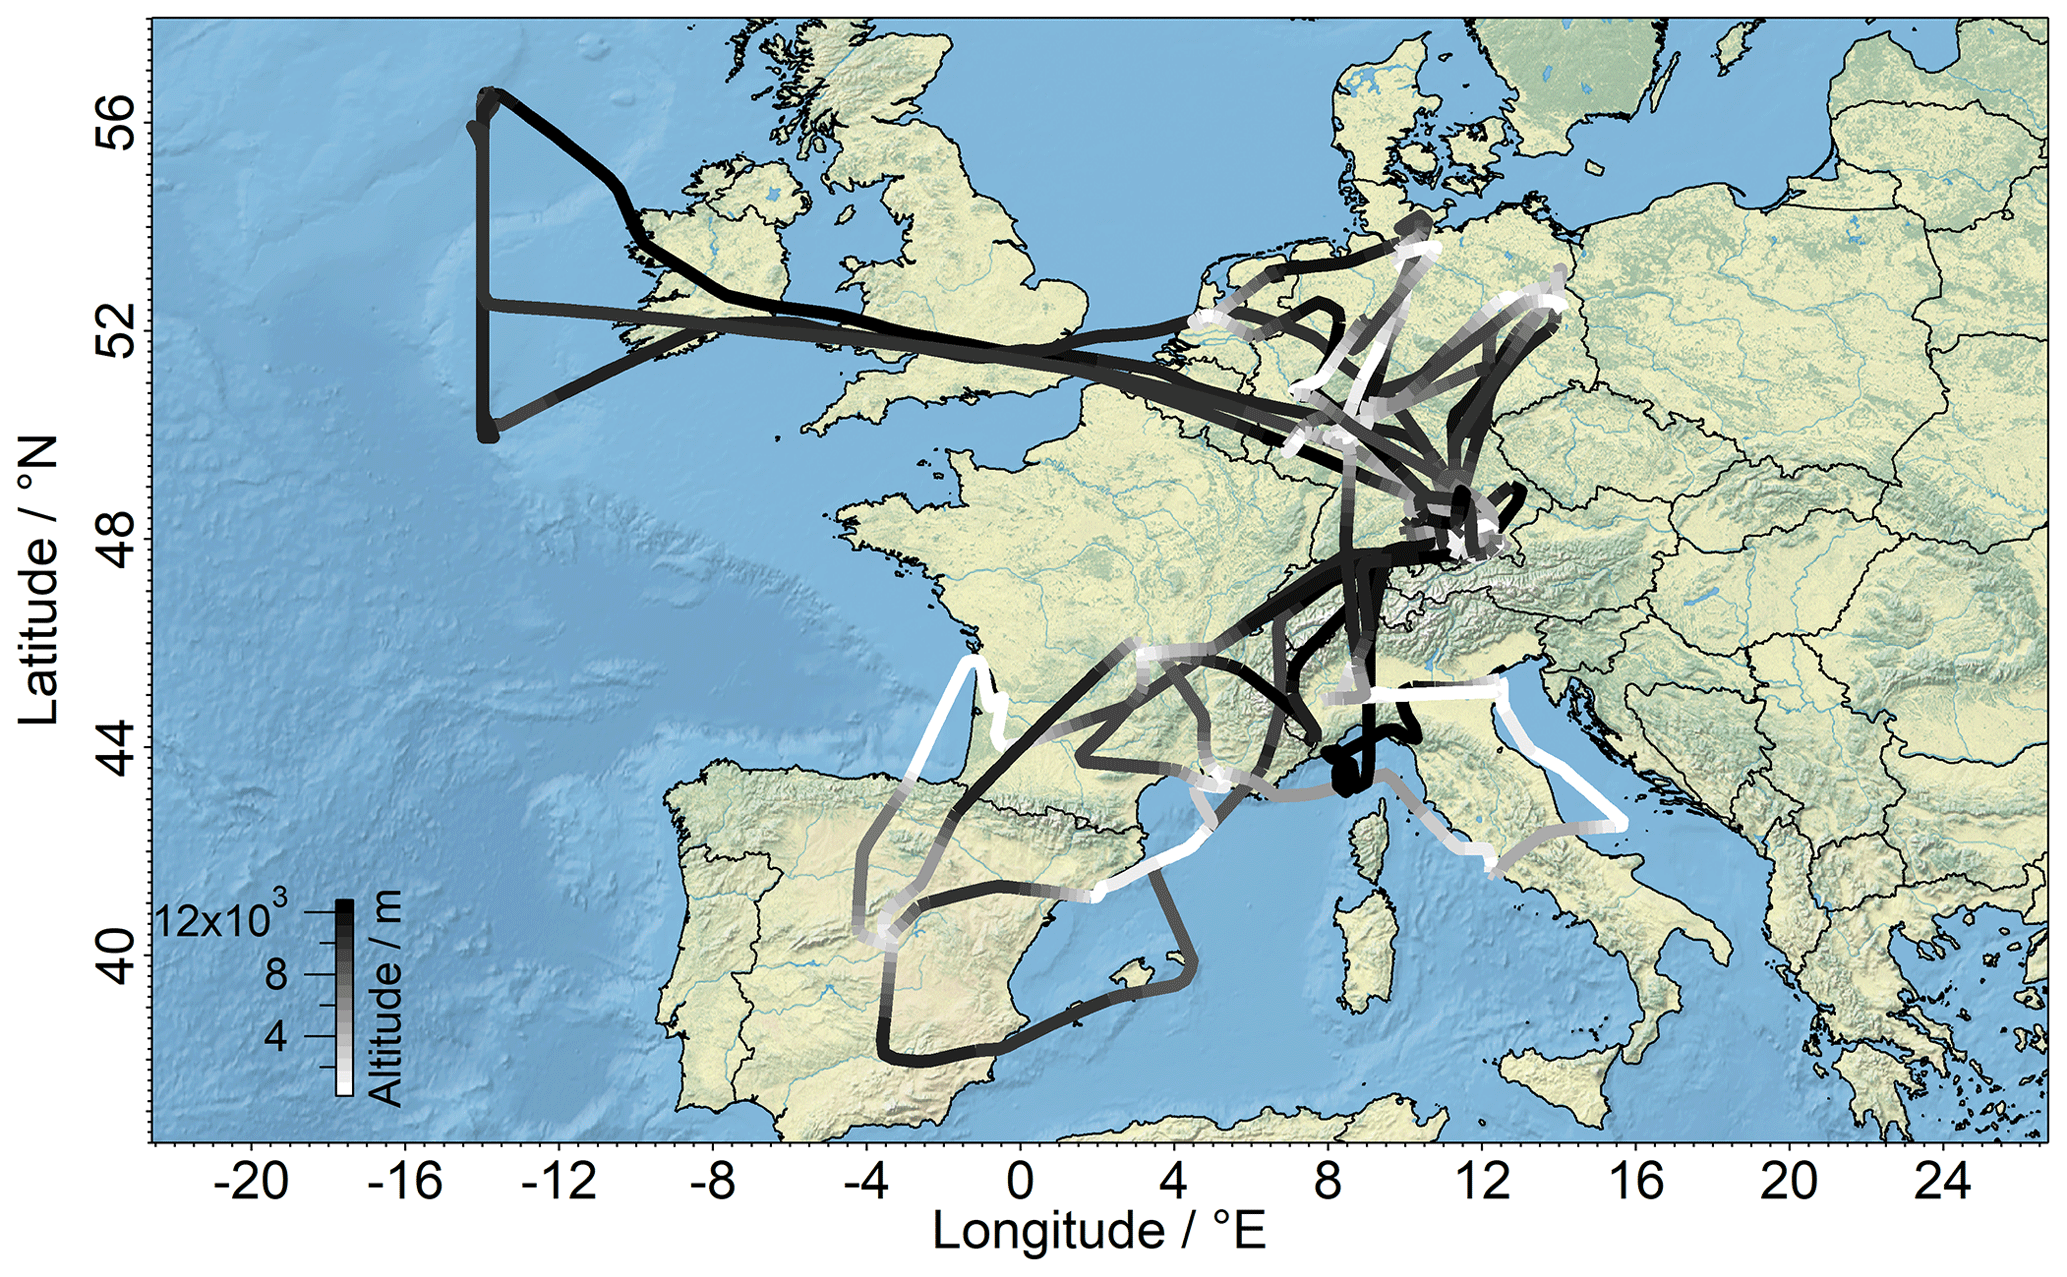
Figure 1Flight tracks of the BLUESKY measurement campaign over Europe color-coded by GPS altitude. All flights were performed from the flight base in Oberpfaffenhofen, Germany (48∘ N, 11∘ E).
The measurement flights ranged in altitude from a few tens of meters above the earth's surface to approximately 14 km, i.e., reaching beyond the tropopause into the lower stratosphere. Individual flights were performed between 07:00 and 17:00 UTC on eight different days, with at least one maintenance day between flights. Vertical profiles were generally obtained during flybys near main European airports and urban areas in order to sample air from emission sources from the earth's surface up to the tropopause region. The flights were performed from the flight base of the German Aerospace Center (Deutsches Zentrum für Luft- und Raumfahrt), DLR, in Oberpfaffenhofen, Germany.
The Monthly Bulletin on the Climate in WMO Region IV (Europe and the Middle East) for the months of May and June 2020 published by DWD (Deutscher Wetterdienst) indicates a regional monthly averaged cloud coverage span of 37.5 %–75 %. The total precipitation in May and June varied locally between 100–200 mm per month and 100–150 mm per month, respectively, which amounts to 80 %–125 % of the values relative to the reference period from 1981 until 2010. The average air temperature at 2 m above the surface was approximately 2 ∘C higher than during the reference period of 1981–2010. An overview of the average meteorological conditions based on ERA5 reanalysis data generated by the Copernicus Climate Change Service (Hersbach et al., 2019) is presented in the Supplement (Fig. S1). Additionally, meteorological conditions for single flight days, which show cloud cover fractions of approximately 60 % and higher, with many rain events along the flight tracks at altitudes of 2–7 km, are also presented in the Supplement (Fig. S2).
3.1 Hydrogen peroxide measurement
Hydrogen peroxide and the sum of organic hydroperoxides were measured using a wet chemical monitoring system, the HYdrogen Peroxide and Higher Organic Peroxide monitor (HYPHOP; Stickler et al., 2006; Klippel et al., 2011; Bozem et al., 2017; Hottmann et al., 2020), based on the work of Lazrus et al. (1985, 1986). Ambient air was probed via in. PFA tubing installed in a stainless-steel inlet setup (TGI; trace gas inlet). From the inlet, the peroxide species were sampled via a bypass. In order to avoid any pressure and therefore airflow inconsistencies a constant pressure inlet (CPI) setup was used, which consists of a Teflon-coated membrane pump (type MD 1C; Vacuubrand, Wertheim, Germany) and a pressure control unit that adjusts the pump speed to a line pressure of 1000 hPa. The sampling efficiency of the inlet for H2O2 was determined to be 0.52. After passing through the CPI, ambient air enters the instrument and passes through a sampling coil with a buffered sampling solution (potassium hydrogen phthalate–NaOH; pH 6) with a stripping efficiency of 1 for hydrogen peroxide and 0.6 for MHP (Lee et al., 2000). The resulting peroxide solution was separated into two channels, to which p-hydroxyphenyl acetic acid (POPHA) and horseradish peroxidase (HRP) were added. The stoichiometric reaction yields the chemiluminescent compound 6,6′-dihydroxy-3,3′-biphenyldiacetic acid, which is measured by means of fluorescence spectroscopy with a Cd pen ray lamp at 326 nm. The resulting hydroperoxide-specific fluorescence (Guilbault et al., 1968) at 400–420 nm was detected using a photomultiplier tube for each channel. In order to specifically measure hydrogen peroxide, this species was selectively destroyed by catalase in one channel (channel B). H2O2 can then be calculated as the difference between the sum of all hydroperoxides (channel A) and the entirety of the remaining organic hydroperoxides (channel B). This measurement technique does not provide mixing ratios for individual organic hydroperoxides. Previous studies indicate that methyl hydroperoxide is the most prominent free-tropospheric component of organic hydroperoxides (90 %–100 %; Heikes et al., 1996a; Jackson and Hewitt, 1996; Walker et al., 2006; Hua et al., 2008). For this study we assumed that MHP is the sole component of organic hydroperoxides that passes the inlet and is unaffected by any further losses, and we scaled the signal of channel B with the sampling efficiency for MHP based on the stripping efficiency by a precooled buffered sampling solution at a flow rate of 0.000508 L min−1 in accordance with previously reported sampling efficiencies. Thus, ROOH used in this paper is an upper limit for the actual MHP in the free troposphere. In particular, in the boundary layer other organic hydroperoxide species are expected to contribute to the signal in channel B. Based on previous studies, HMHP (hydroxymethyl hydroperoxide) and extent PAA (peroxyacetic acid) and EHP (ethyl hydroperoxide) significantly contribute to the total organic hydroperoxide mixing ratios at low altitudes (Fels and Junkermann, 1994; Slemr and Tremmel, 1994; Valverde-Canossa et al., 2005; Hua et al., 2008).
The catalase efficiency for the destruction of H2O2 in channel B was determined via liquid calibration of the instrument at 0.95–0.98. For the simultaneous liquid calibration of both channels, an H2O2 standard (0.98 µmol L−1) produced in a serial dilution from a stock solution was used. In order to estimate the sampling efficiency, a calibration gas was analyzed every second day during the field campaign. The calibration gas was created by an LDPE (low-density polyethylene) permeation source filled with 30 % hydrogen peroxide embedded in a temperature-controlled oven at 35 ∘ C and flushed with synthetic air at a rate of 60 standard cubic centimeters per minute (sccm). The defined amount of hydrogen peroxide gas was diluted with approximately 2300 sccm purified ambient air. The sampling efficiency was calculated based on the difference between the measured hydrogen peroxide levels with and without the CPI implemented into the calibration gas flow. The permeation gas can be calibrated by bubbling the gas through a water-filled flask followed by photometric examination via UV spectroscopy using the TiCl4 method described by Pilz and Johann (1974). The in-flight background measurements were performed using peroxide-free air generated by a cartridge filled with hopcalite (type IAC-330) and silica gel (type IAC-502; Infiltec, Speyer, Germany).
To account for the sensitivity of hydrogen peroxide to metal ions in the Fenton reaction (Graedel et al., 1986; Zepp et al., 1992; Weinstein-Lloyd et al., 1998) as well as to sulfur dioxide (SO2), ethylene diamine tetra acetic acid (EDTA) and formaldehyde (HCHO) were added to the stripping solution. Further, the data were corrected for existing positive ozone interference by subtraction of 0.016 ppbv H2O2 100 ppbv O3. The interference was derived by plotting hydrogen peroxide mixing ratios vs. ozone mixing ratios in the lower stratosphere, assuming that ambient H2O2 is close to zero above the tropopause based on the decreased availability of water vapor for the H2O2 precursor production and simultaneously increased photolytic activity of H2O2. Due to instrumental issues caused by hopcalite contamination during the campaign, the uncertainty of the ozone interference was further extended by the hopcalite interference and estimated as 27 % at 0.16 ppbv hydrogen peroxide.
The total measurement uncertainty (TMU) of the instrument was calculated as
and was derived by considering the instrument's precision (P), uncertainty of the standard and of the inlet efficiency (US; UIE), and uncertainty of the ozone interference (UOI). The precision was determined as 0.3 % at 5.1 ppbv for hydrogen peroxide and 0.2 % at 5.4 ppbv for organic peroxides. The uncertainty of the standard was included in instrument precision calculations. The uncertainty of the inlet efficiency was calculated to be 5 %. The calculated total measurement uncertainty was therefore determined at 28 % for hydrogen peroxide and 40 % for the sum of organic peroxides. Moreover, the time resolution of the instrument was determined to be 2 min based on the signal rise time from 10 % to 90 %. Based on the average cruise speed of the research aircraft of 179 ± 51 m s−1 the spatial resolution of the 2 min sample was estimated as 21.5 km. The detection limit, derived from 2σ uncertainty of 37 background measurements, was 0.035 ppbv for hydrogen peroxide and 0.013 ppbv for organic peroxides. For the purposes of this study, the obtained peroxide data were limited to measurements within the troposphere by removing all data points with ozone mixing ratios higher than 100 ppbv.
3.2 Measurement of other species
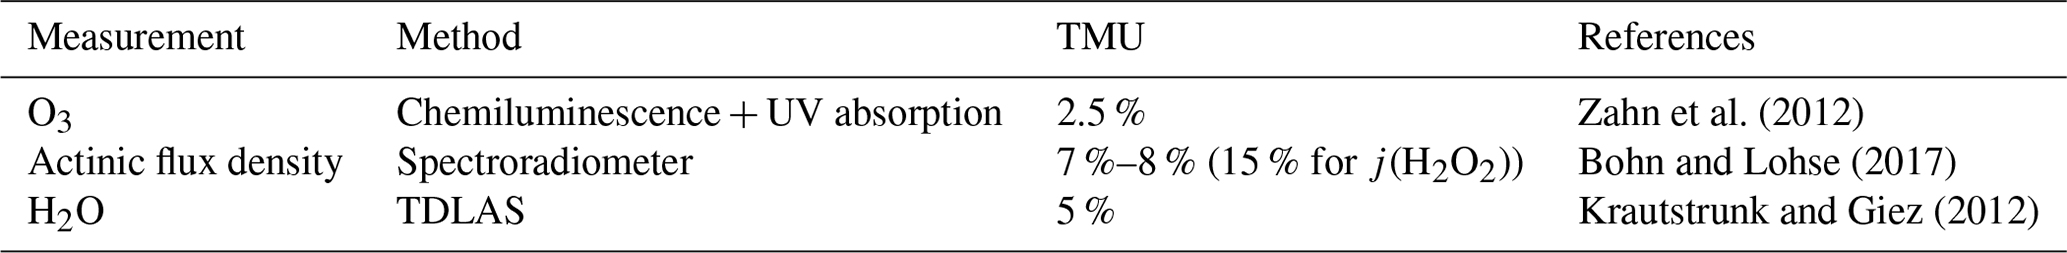
The measurements of ozone were carried out with a chemiluminescence detector calibrated by a UV photometer of the Fast AIrborne Ozone instrument, FAIRO (Zahn et al., 2012). Upward and downward spectral actinic flux density was recorded with two spectroradiometers (Bohn and Lohse, 2017). Water vapor mixing ratios and humidity measurements were obtained with the Sophisticated Hygrometer for Atmospheric ResearCh (SHARC) based on a tunable diode laser (TDL) setup (Krautstrunk and Giez, 2012). GPS data as well as temperature, pressure, wind speed and true air speed were obtained using the BAsic HALO Measurement And Sensor System, BAHAMAS. The list of campaign instrumentation as well as the complementary measurement method, TMU, and references regarding the use of each technique are given in Table 1.
Table 1Overview of other observed species with corresponding measurement method, total measurement uncertainty (TMU) and references regarding the supplementary instrumentation.
3.3 ECHAM/MESSy Atmospheric Chemistry (EMAC) model
In this study, we used the global numerical 3-D model EMAC (ECHAM/MESSy for Atmospheric Chemistry, Jöckel et al., 2010), which numerically simulates the chemistry and dynamics of the troposphere and the stratosphere. EMAC incorporates a variety of submodels addressing chemical and metrological processes and their interactions with marine, continental and anthropogenic environments (Jöckel et al., 2006). The basis atmospheric model is the 5th generation of the European Centre HAMburg general circulation model (ECHAM5; Roeckner et al., 2003, 2006). For standardized data exchange between submodels and the base model, the Modular Earth Submodel System (MESSy; Jöckel et al., 2005, 2006, 2016) was used. The Module for Efficiently Calculating the Chemistry of the Atmosphere (MECCA) submodel was used to simulate stratospheric and tropospheric gaseous and heterogeneous chemistry (Sander et al., 2005, 2011, 2019). For the simulation of aqueous-phase chemistry in clouds and wet scavenging processes the Scavenging of Tracers (SCAV; Tost et al., 2006) submodel was applied. Primary emissions as well as dry deposition of atmospheric trace gases and aerosols were simulated by submodels ONLEM, OFFLEM, TNUDGE and DRYDEP (Kerkweg et al., 2006a, b). The simulations of anthropogenic emissions were based on CAMS-GLOB-ANTv4.2 (Granier et al., 2019), which uses emission data provided by the EDGARv4.3.3 inventory developed by the European Joint Research Centre (JRC; Crippa et al., 2018) and CEDS emissions (Hoesly et al., 2018). Emission reduction coefficients were additionally adapted to lockdown conditions in Europe based on the work of Guevara et al. (2021). A detailed description of the emission submodels as well as their modifications are presented in the work of Reifenberg et al. (2022). The horizontal resolution of the model in this study is T63 (i.e., roughly 1.8∘ × 1.8∘) and the vertical resolution consists of 47 levels up to 0.01 hPa. The simulated data has a time resolution of 5 min. Importantly, for the purpose of comparison with the observations, the model results were interpolated along the GPS flight tracks with the S4D submodel (Jöckel et al., 2010).
4.1 Distribution of hydrogen peroxide and comparison with previous observations over Europe
During the previous field campaigns UTOPIHAN-ACT (Upper Tropospheric Ozone: Processes Involving HOx And NOx: The Impact of Aviation and Convectively Transported Pollutants in the Tropopause Region) and HOOVER (HOx OVer EuRope), numerous measurement flights were performed in 2002–2004 and 2006–2007 over Europe (Colomb et al., 2006; Stickler et al., 2006; Klippel et al., 2011). The flight tracks during the two campaigns covered a similar latitudinal and altitudinal range. Thus, parts of both campaigns performed during spring and summer seasons within the latitudinal range 40–55∘ N can be compared with the outcomes of our measurements. The comparison described below is restricted to HOOVER II (July 2007) and UTOPIHAN-ACT II (March 2003) and III (July 2003) to ensure overlap with the late spring and early summer measurements presented here. The latitudinal distribution of hydrogen peroxide during the three campaigns is presented in Fig. 2 as a function of latitude for three altitude ranges within the troposphere (boundary layer – BL – from 0 < 2 km, middle troposphere – MT – from 2 < 6 km and upper troposphere – UT – from 6–14 km). The presented mean values of the datasets with 2 min resolution are binned into subsets of 2.5∘ of latitude for the entirety of each tropospheric layer. The datasets can be further studied by comparing the vertical profiles of all campaigns, as displayed in Fig. 3a. The mean values of the data are binned into subsets of 0.5 km of altitude. The medians and means (±1σ) of hydrogen peroxide mixing ratios calculated with 2 min resolution within the range 37.5–52.5∘ N for each campaign are listed in Table S1 (Supplement).

Figure 2Latitudinal dependence of hydrogen peroxide concentrations (mean ± 1σ) compared to former campaigns (red: BLUESKY; black: HOOVER II; blue: UTOPIHAN-ACT). The data with 2 min time resolution were subdivided into three atmospheric layers of the upper troposphere, middle troposphere and boundary layer (from top to bottom), with mean values binned for 2.5∘ of latitude for each tropospheric layer. The corresponding numbers indicate the total number of data points per bin.
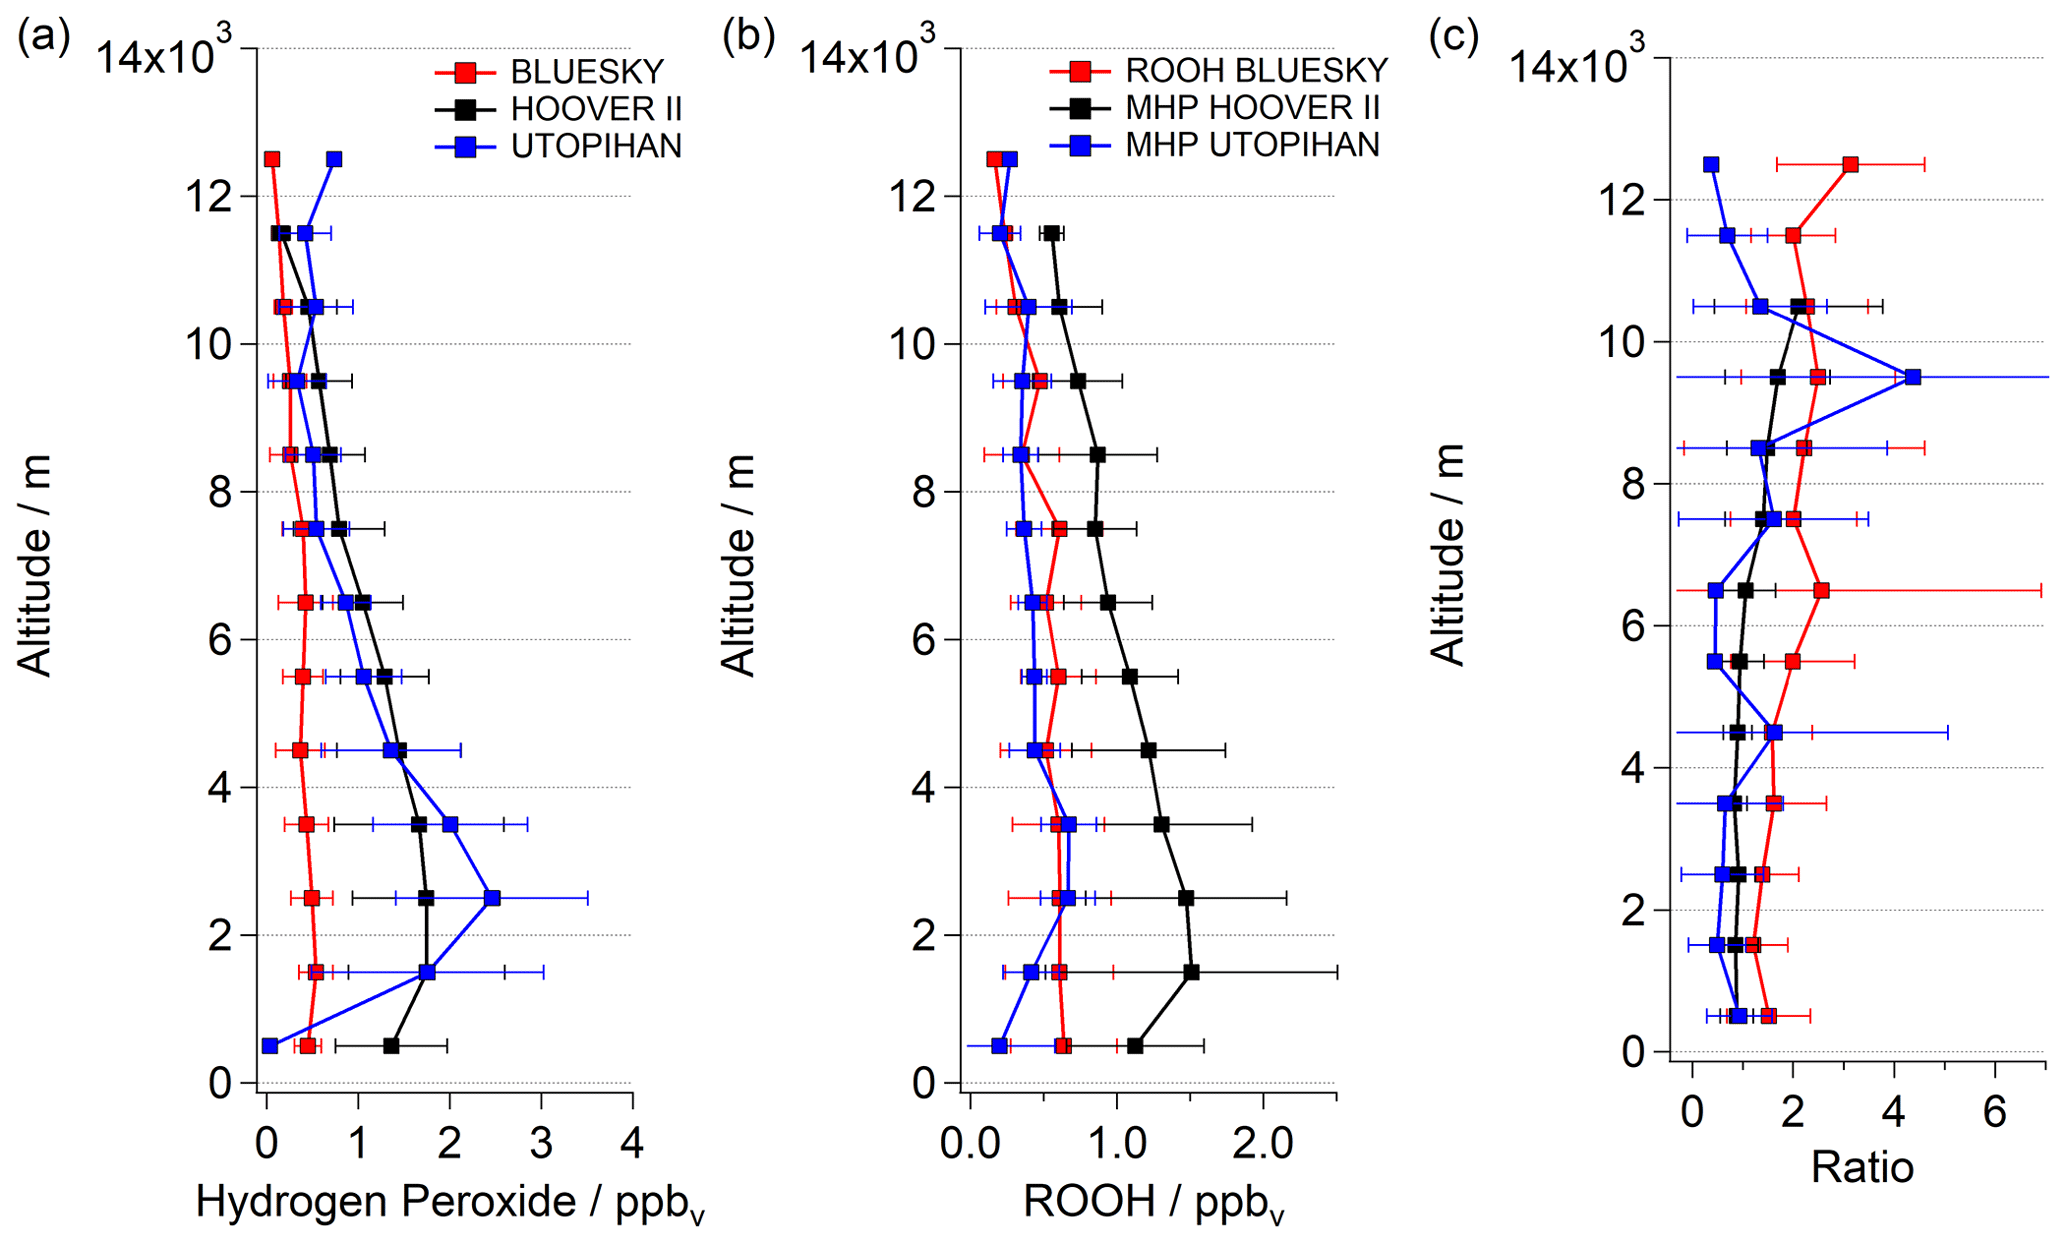
Figure 3Comparison of vertical hydrogen peroxide profiles (a), ROOH (b) and ratio (c) during BLUESKY (red) with outcomes of the earlier campaigns, HOOVER II (black) and UTOPIHAN-ACT II/III (blue). The data were plotted as mean ± 1σ.
The observed distribution within the UT and the latitudinal range 37.5–52.5∘ N amount to a mean (median) mixing ratio of 0.28 ± 0.22 (0.24) ppbv for BLUESKY, which is lower in comparison to the previously measured 0.67 ± 0.43 (0.56) ppbv during HOOVER II and 0.47 ± 0.36 (0.47) ppbv during UTOPIHAN-ACT. In both lower tropospheric layers (0–6 km) the hydrogen peroxide mixing ratios during BLUESKY differed significantly from those measured previously. The mean mixing ratios for hydrogen peroxide show further pronounced reductions with values up to 72 % and 76 % lower compared to HOOVER and UTOPIHAN-ACT for both lower tropospheric layers. Mixing ratios of 0.42 ± 0.25 (0.37) ppbv within the MT and 0.48 ± 0.17 (0.48) ppbv in the BL were determined. During previous campaigns much higher hydrogen peroxide mixing ratios of 1.49 ± 0.71 (1.33) ppbv during HOOVER and 1.74 ± 0.97 (1.80) ppbv during UTOPIHAN were measured at altitudes of 2–6 km. Also, the results within the boundary layer display a significant discrepancy with the previously measured 1.59 ± 0.78 (1.48) ppbv for HOOVER and 1.65 ± 0.16 (1.32) ppbv during UTOPIHAN. The observed mixing ratios are only in approximately 30 % agreement with previous results.
A significant tendency towards lower mixing ratios for hydrogen peroxide during the BLUESKY project was observed, in particular at altitudes below approximately 7 km (Fig. 3a). The altitude profile does not agree very well with the described inverted C-shaped distribution trend in the literature (Klippel et al., 2011; Bozem et al., 2017). The most striking feature of the BLUESKY observations is the absence of a local maximum of H2O2 above the BL. Instead, the mixing ratio is rather constant in the 3–7 km range. We hypothesize that these differences between the campaigns predominately originate from differences in the meteorological rather than chemical conditions. We will show that the low observed mixing ratios of hydrogen peroxide during BLUESKY are most likely caused by enhanced wet scavenging processes due to a pronounced presence of clouds at altitudes of 3–7 km. An analysis of hourly cloud coverage at altitudes of 2–7 km based on ERA5 reanalysis generated using Copernicus Climate Change Service information (Hersbach et al., 2018; Fig. S2) for single flights (BLUESKY) shows high average values. Further, based on log book information for all campaigns, there was a pronounced presence of clouds during BLUESKY in comparison with previous airborne measurements. We have observed a high number of cloud and rain events along the flight tracks during the BLUESKY campaign compared to the mostly cloud-free measurement conditions during HOOVER and UTOPIHAN-ACT.
Generally, the presence of clouds has a marked impact on H2O2 but a much smaller effect on the majority of organic peroxides. ROOHs are less sensitive to wet deposition due to lower Henry's law coefficients (2.2×10⁴ mol L−1 atm−1 at 298 K for MHP in contrast to 7.4×10⁴ mol L−1 atm−1 at 298 K for H2O2). Therefore, the concentration ratio of both species can be an indicator of cloud presence (Heikes et al., 1996b; O'Sullivan et al., 1999; Snow, 2003; Snow et al., 2007; Klippel et al., 2011). The assumption of cloud processing via ratio comparison is derived from the fact that highly soluble species are transferred into the aqueous phase of clouds, wherein they are removed by reactions with other soluble species or by precipitation (Crutzen and Lawrence, 2000). Consequently, an increase in the ratio between ROOH and hydrogen peroxide of ≥1 can ensue as a result of deposition processes within clouds. Please note that due to the characteristics of the measurement technique, which derives the estimated ROOH mixing ratio as its tropospheric upper limit (Sect. 3.1), the vertical trend of ROOH and therefore also the ratio are expressed as qualitative comparisons. Vertical profiles of ROOH measured during the BLUESKY and UTOPIHAN-ACT projects are comparable, while HOOVER II found higher values (Fig. 3b). However, the vertical trends of peroxides during HOOVER II can be assumed to be about equal, leading to an ROOH vs. H2O2 ratio of approximately 1. Thus, the two previous campaigns over Europe show corresponding trends with decreasing ratios above the boundary layer, where H2O2 mixing ratios are at their maxima (Fig. 3c). In contrast, increasing ratios of ROOH vs. hydrogen peroxide at altitudes of 3–7 km were observed during the BLUESKY campaign. These increases during the BLUESKY campaign can be attributed to the lower mixing ratio of H2O2 and are indicative of more pronounced cloud scavenging.
4.2 Comparison with the EMAC model
In order to test the hypothesis that hydrogen peroxide is depleted at altitudes of 3–7 km due to cloud scavenging, a comparison of in situ data with the output of the EMAC model was performed. The analysis of the EMAC and in situ results for different latitudinal distribution subdivided into three main tropospheric air layers is presented in the Supplement (Fig. S3). The comparison between the model results and observations shows generally good agreement for the UT as well as for the majority of data in the BL. Discrepancies here at low latitudes can be seen for Mediterranean areas strongly influenced by marine air masses (Barcelona at 41∘24′ N and Rome at 41∘53′ N), where the model tends to overestimate the mixing ratio of hydrogen peroxide by up to a factor of 3. This is most likely related to model resolution (∼ 180 km × 180 km), which makes it difficult to differentiate marine from continental air masses in coastal areas. The difference between observed and modeled data for both tropospheric regions is not significant and good agreement between the simulated and measured sources and sinks within the top and bottom tropospheric layers can be assumed (latitudinal distribution at 0–2 and 6–12 km; Fig. S3). In contrast, the model tends to overestimate H2O2 concentrations in the 2–6 km range. As stated above, the observed mixing ratios are generally low at 3–7 km, most likely related to the high impact of deposition processes within clouds. An analysis of the impact of emissions from anthropogenic sources on modeled H2O2 data shows an average difference of approximately 2.5 % between mixing ratios with and without the lockdown emissions reductions within lower tropospheric layers (1–7 km; Fig. S4). Thus, emission reduction is not considered to be responsible for the strong deviation between the simulated and observed hydrogen peroxide mixing ratios (Reifenberg et al., 2022).
In order to investigate potential causes for the observed difference between observations and model simulations, we calculate the hydrogen peroxide budget based on photostationary steady-state conditions using model-simulated radical and photolysis rate data. In the free troposphere, the production rate P of hydrogen peroxide can be calculated from Eq. (2) and the photochemical loss rate L due to photolysis and reaction with OH from Eq. (3).
Neglecting deposition and transport processes impacting the hydrogen peroxide budget, the maximum concentration of H2O2 can be calculated as presented in Eq. (4).
Vertical profiles of observed, simulated and calculated H2O2 under the assumption of photostationary state conditions are displayed in Fig. 4a. Additionally, a model sensitivity study in which the scavenging of H2O2 in clouds was omitted has been incorporated.
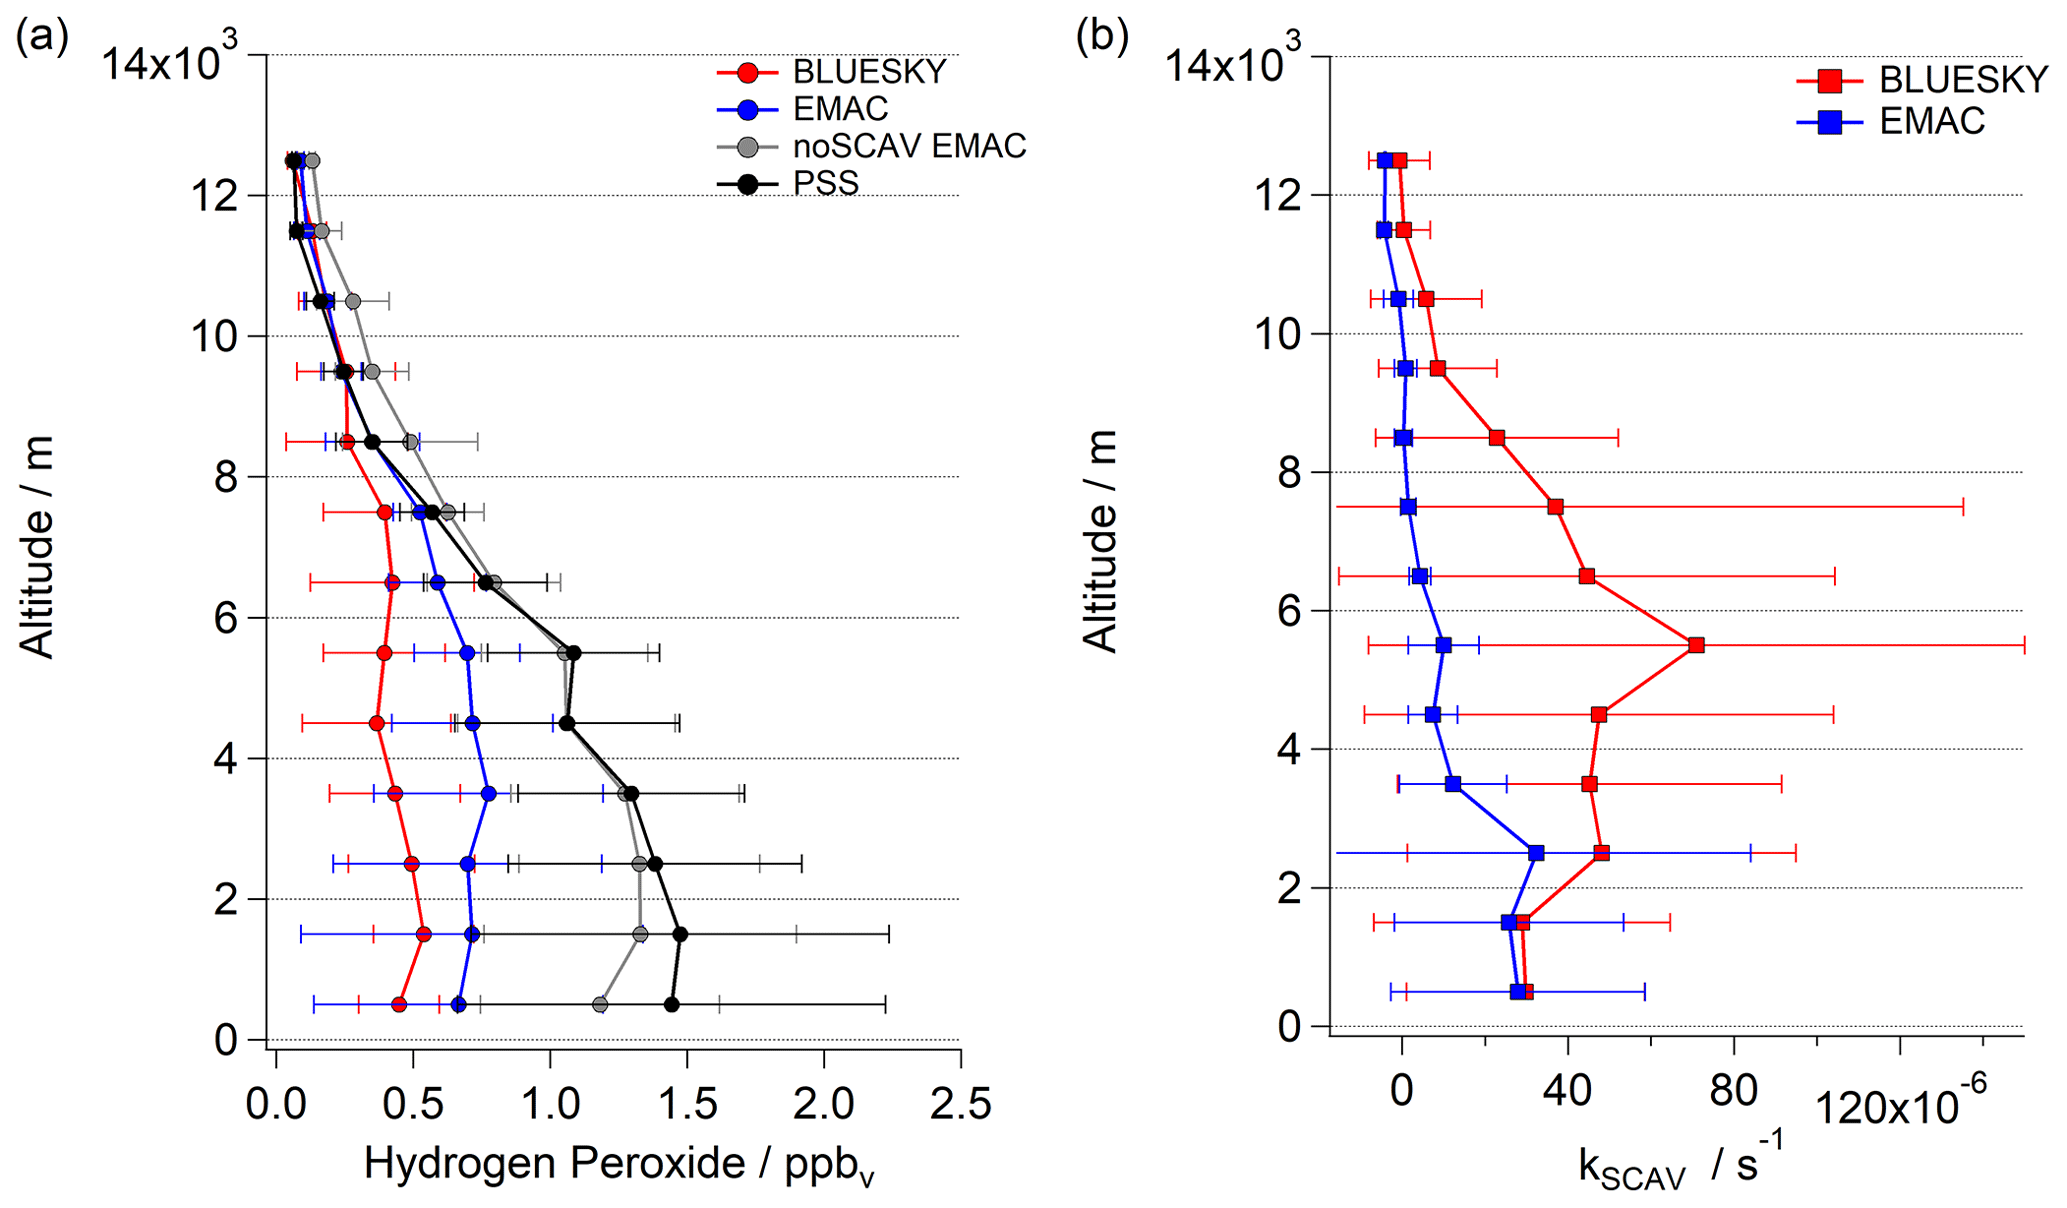
Figure 4Vertical profiles of observed (red), simulated (blue), reduced simulated (gray) and calculated under the assumption of PSS (photostationary steady-state) conditions (black) for hydrogen peroxide (a) and the calculated loss rate constant kSCAV by scavenging (b); red lines show observed values, while blue lines show modeled H2O2.
The comparison of all datasets shows that no significant hydrogen peroxide loss occurs within the cloud-free layers of the upper troposphere (above 10 km), where the resulting mixing ratios show a similar vertical trend (Fig. 4a). Both the sensitivity study and the PSS calculation further indicate that wet scavenging in clouds followed by rainout as the ultimate removal process forms a substantial sink for H2O2, in particular in the middle and lower troposphere. Please note that this sink is not always associated with in-cloud conditions along the flight paths. Due to the photochemical lifetime of H2O2, which is on the order of several days, local H2O2 mixing ratios will also depend on upwind cloud processing (Cohan et al., 1999; Hua et al., 2008). Although EMAC reproduces this cloud processing, the absolute mixing ratios are still overestimated, indicating a potential underestimation of the deposition rate in the model.
Based on the deposition loss rate constant was calculated by comparing to and ,
The total modeled loss rate constant due to deposition kSCAV based on PSS conditions (Eqs. 2 and 3) shows an underestimation of 2.2 compared to the observationally derived constant. The vertical profile of the simulated deposition rates is in good agreement with the observations at low altitudes (below 2 km), where dry deposition plays a key role in the removal of H2O2 species (Fig. 4b). At high altitudes (UT) EMAC loss rate results agree well with the observations. The majority of the loss processes take place within the MT (2–8 km). Here, EMAC underestimates the deposition impact most prominently, which corresponds to the discrepancies between observed and modeled hydroperoxide mixing ratios (Fig. 4a).
Since the loss of hydrogen peroxide in the atmosphere strongly depends on the presence of clouds, the temporal uptake and loss of the species within cloud droplets, and the permanent loss by rainout, it is important that the model correctly reproduces cloud coverage, liquid water content (LWC) and precipitation rates. In Fig. 5a, a histogram of the average total cloud coverage over all measurement days based on EMAC and ERA5 (containing modified Copernicus Climate Change Service information; Hersbach et al., 2018), respectively, indicates an underestimation of cloud coverage by EMAC in comparison with ERA5. The discrepancy is most pronounced over central Europe (47 to 55∘ N, 6 to 15∘ E) and smaller over the North Atlantic (approximately 30 to 40∘ N, −50 to −30∘ E; Fig. S5). The comparison of the average liquid water path (LWP) based on LWC of the measurement days shows a difference of approximately 2 % by EMAC in comparison to ERA5, which indicates a minor deficit in the simulated species uptake (Fig. S6). The main difference between EMAC and ERA5 arises from the comparison of the total precipitation. As shown in Fig. 5b, the model underestimates heavy rain events (>0.5 mm s−1) in comparison with the ERA5 reanalysis model (modified Copernicus Climate Change Service information; Hersbach et al., 2018). With respect to ERA5, a difference by a factor of 2.2 was estimated for the entirety of the region compared to EMAC, which agrees well with the calculated ratio of the loss rates. Further, a less pronounced impact of scavenging on the hydrogen peroxide budget and therefore higher mixing ratios are simulated by the model.
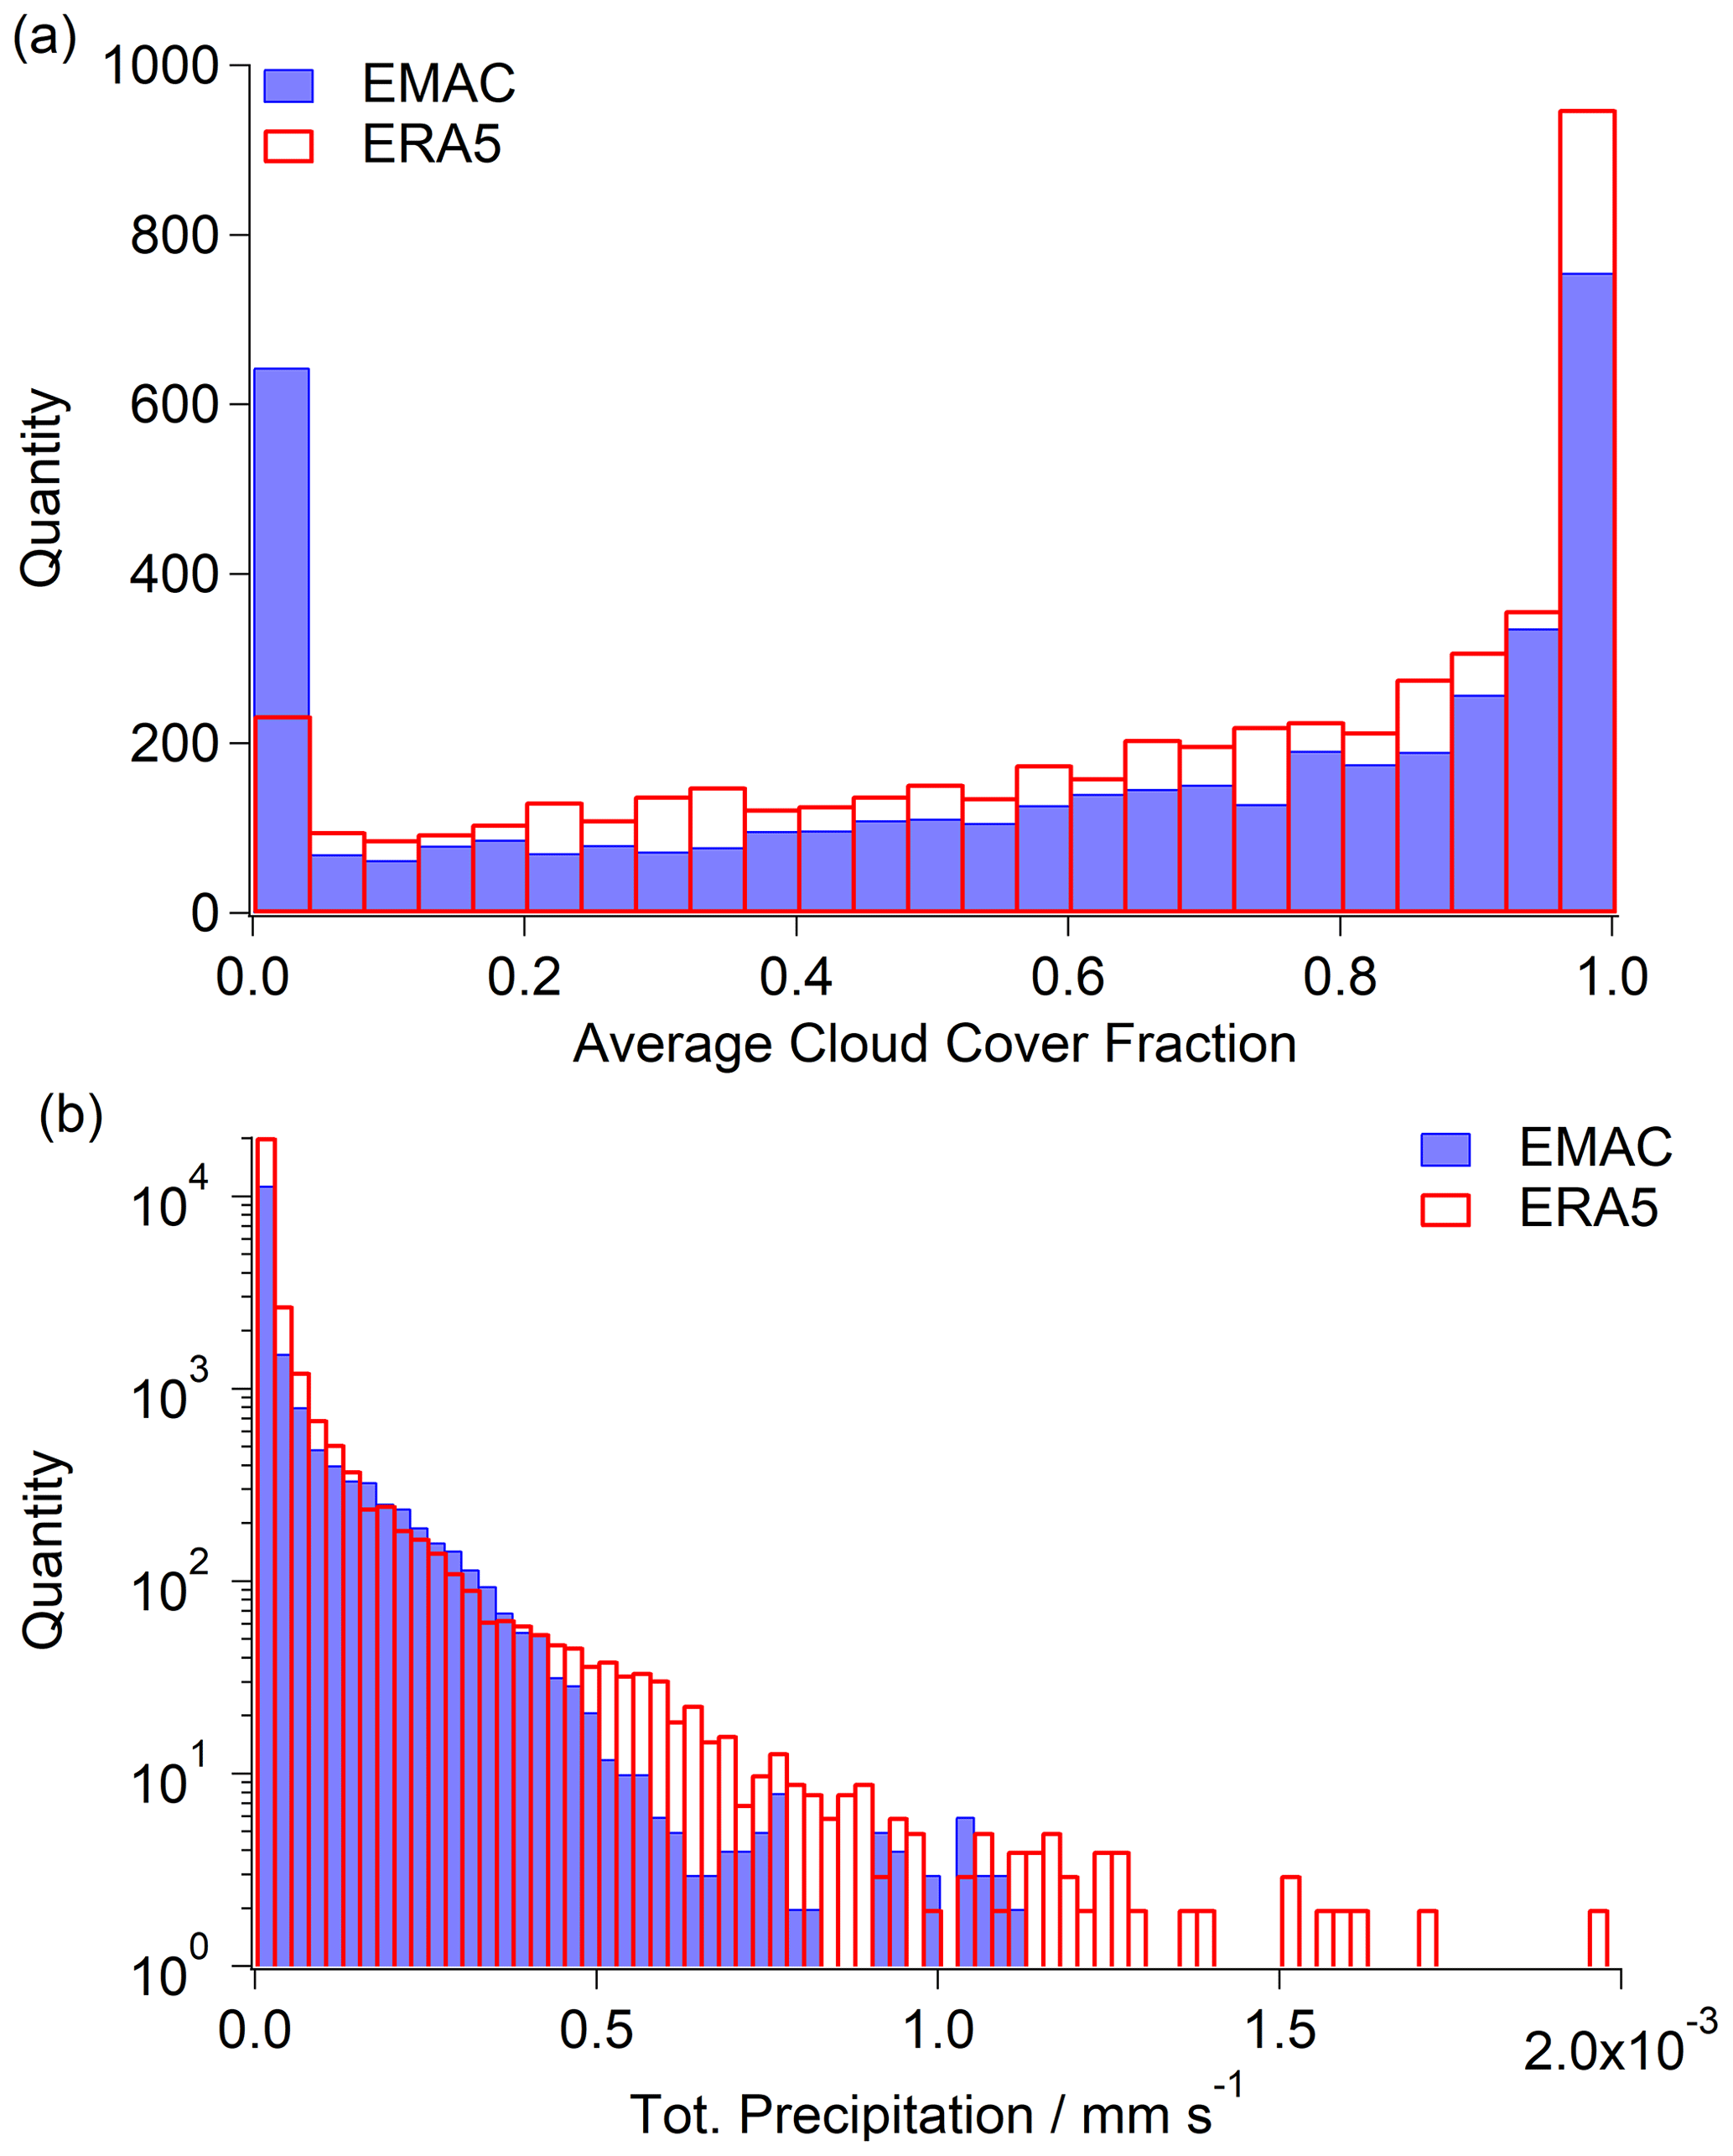
Figure 5Histograms of average cloud cover fraction (a) and total precipitation (b) over the North Atlantic and Europe (73 to 28∘ N, −50 to 15∘ E) based on ERA5 (red; modified Copernicus Climate Change Service information; Hersbach et al., 2018) and EMAC simulation (blue).
As shown based on the difference in total precipitation between EMAC and ERA5, EMAC appears to underestimate the majority of the rainout events at the location of the flight tracks (Fig. 6). Detailed comparison of the average total precipitation between EMAC and ERA5 during the campaign can be found in the Supplement of this work (Fig. S7).
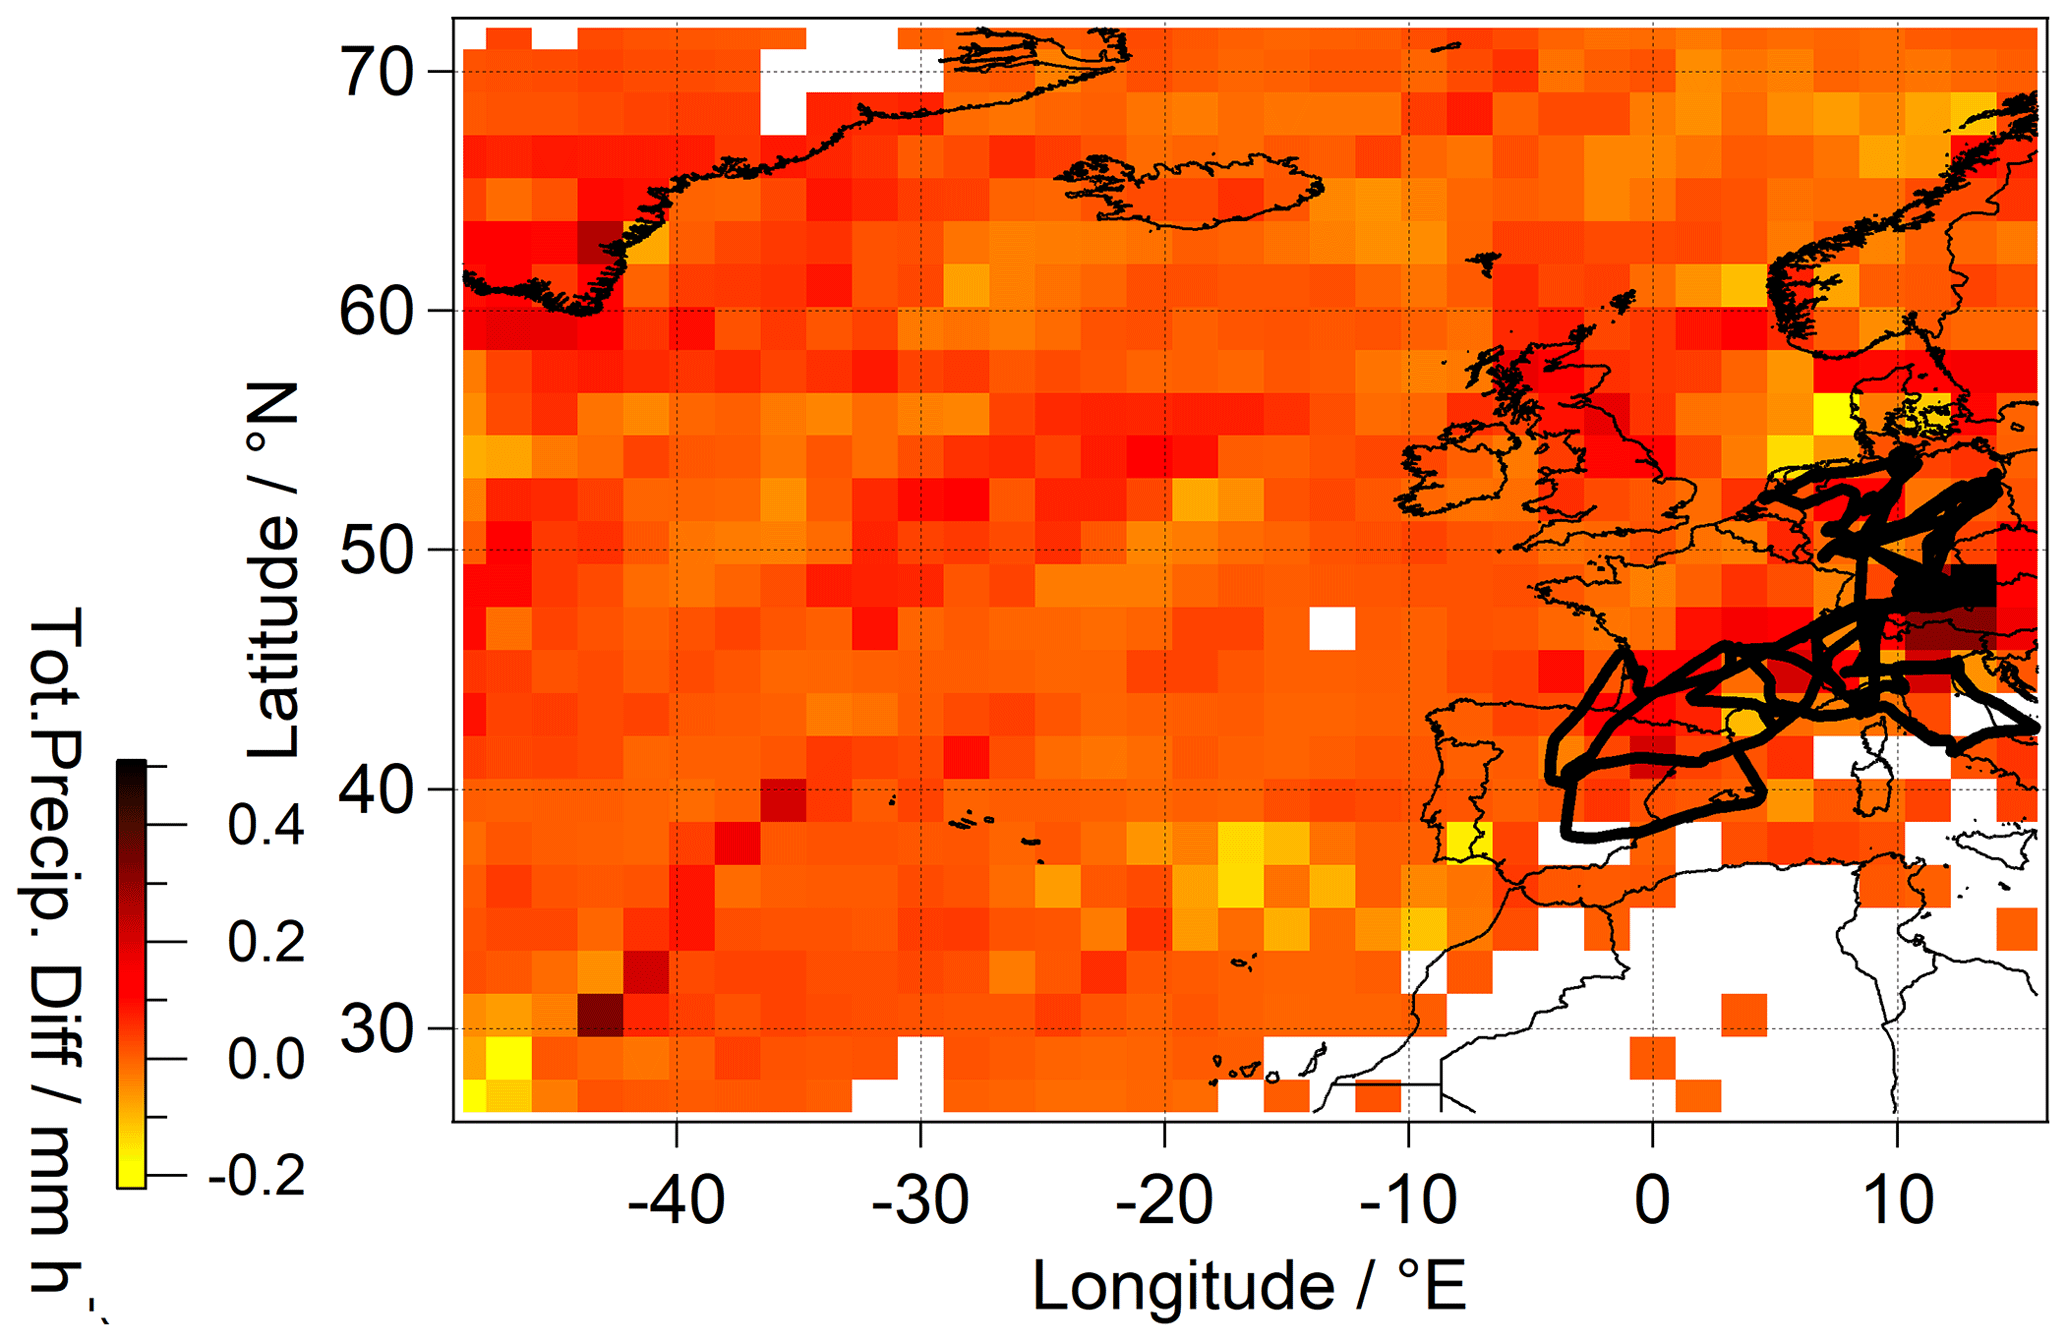
Figure 6Average total precipitation difference between ERA5 and EMAC over Europe and the North Atlantic (73 to 28∘ N, −50 to 15∘ E; contains modified Copernicus Climate Change Service information; Hersbach et al., 2018). The North Atlantic region was included in view of the H2O2 lifetime in the atmosphere and the air mass origins based on backward trajectories. The performed flights are indicated in black.
Assuming a linear dependence between ultimate removal of H2O2 in cloud droplets and precipitation as given by EMAC simulations, total large-scale scavenging was estimated based on precipitation given by ERA5. The prediction is based on extrapolating the linear relationship between EMAC scavenging and simulated total precipitation. The simulated scavenging by EMAC falls short by 7.6×10¹³ molec. m−2 s−1 relative to the scavenging prediction based on ERA5 output (Fig. S8). The differences between hydrogen peroxide mixing ratios obtained using EMAC and the observations (Fig. 4a) estimated as the integral between the observed and simulated mixing ratios over the entire troposphere for the total measurement time in molec. m−2 s−1 are comparable (7.3×10¹³ molec. m−2 s−1). This indicates that the underestimation of the rain rate by EMAC relative to ERA5 is responsible for the overestimation of H2O2 in the model. As indicated by the rainout discrepancy between EMAC and ERA5, higher variability in scavenging can be expected along the flight tracks (Fig. 6).
Other major causes leading to the observed discrepancy might be an overestimation of peroxide sources as well as an underestimation of its photochemical sinks. The analysis of the photolysis frequencies for both datasets showed a discrepancy by a factor of approximately 1.5. However, the underestimation of the photolysis frequencies by the model can be partly explained by the use of additional extrapolated absorption cross sections of H2O2 in order to reproduce the entire photolytic activity range of the species (Hottmann et al., 2020). Calculations of hydrogen peroxide mixing ratios under PSS conditions based on simulated and observed photolysis frequencies are in good agreement (Fig. S9). Therefore, the impact of photochemical loss processes on the hydrogen peroxide budget is considered to be minor. An impact of peroxide precursor discrepancies cannot be determined due to the lack of HOx measurement, although the study of Reifenberg et al. (2022) demonstrates good agreement between observations and model results for those species affecting H2O2, i.e., NOx, O3 and H2O. Thus, the overestimation of hydrogen peroxide in the model is most likely due to underestimation of scavenging processes.
4.3 The fate of hydrogen peroxide below clouds
The distribution of hydrogen peroxide above, in and below clouds at Frankfurt airport (50∘1′59′′ N and 8∘34′14′′ O) was measured during BLUESKY flight no. 1 and showed untypical increases in hydrogen peroxide mixing ratios at low altitudes.
Based on NOAA HYSPLIT backward trajectory analysis (model duration of 24 h), the probed air masses originated from the North Atlantic, passing northern France, and were nearly uniformly affected by rainout during 6 h prior to the measurement time. During the measurement the aircraft passed a cloud layer at approximately 2–6 km during descending and ascending legs of the vertical profile. The descent and ascent into and out of Frankfurt took place between 09:00 and 11:00 UTC. Figure 7 displays the time series of the approach to Frankfurt. Mixing ratios of H2O2 from observations and EMAC are shown.

Figure 7Temporal series of BLUESKY flight no. 1 over Frankfurt (50∘1′59′′ N and 8∘34′14′′ O; a) and vertical distribution (b) of hydrogen peroxide impacted by cloud and rain scavenging. Data were plotted for observed (red) and simulated (black) hydrogen peroxide mixing ratios as well as the observed ROOH mixing ratio (blue) in relation to altitude (top black) and relative humidity (light gray). Cloud scavenging and precipitation are highlighted in gray and light blue shading, respectively. Please note that the displayed peroxide data have a temporal resolution of 1 s in contrast to the model resolution of 5 min.
The relative humidity (RH) of 100 % (gray areas in Fig. 7) indicates the presence of clouds. Rain was mainly observed below the clouds at low altitudes (light blue areas) at slightly lower RH. ERA5 reanalysis (Fig. S11a) confirmed the presence of clouds at altitudes of 2–6 km (flight no. 1). Based on local meteorological reports, light rain started approximately 1 h prior to the vertical profile measurement and lasted approximately half an hour. The average mixing ratio of H2O2 over Frankfurt (Fig. 7) was 0.646 ± 0.229 ppbv. Above the tops of the clouds, no significant increase in mixing ratios could be observed. An increase in observed hydrogen peroxide mixing ratios occurred after exiting the clouds during the descending part of the vertical profile track. Here, the H2O2 concentration exceeded 0.7 ppbv and dropped again within a short time (10 min) to 0.567 ppbv. The maximum measured hydrogen peroxide mixing ratio was 0.8 ppbv. The observed hydrogen peroxide mixing ratio peak might be caused by cloud scavenging, which is strongest at the bottom, where the liquid water content is also highest. However, this assumption is not supported by the simultaneous ROOH mixing ratio observations (Fig. 7b). In contrast to hydrogen peroxide, ROOH mixing ratios display a decreasing trend below 2 km. It seems that the increase in hydrogen peroxide concentrations was caused by an additional source of this species below clouds. An analogous phenomenon was observed for measurements taken over Bordeaux (Figs. S10 and S11b).
Previous studies on the possibility of mass transfer of H2O2 from rainwater to the surrounding air indicate a possible release of hydrogen peroxide to the atmosphere (Hua et al., 2008; Huang and Chen, 2010; Xuan et al., 2020). Raindrops are affected by the temperature gradient between the earth's surface and the cloud base. The negative dependence of hydrogen peroxide solubility on temperature derived from the Henry's law constant means that an impact on the aqueous-gas phase equilibrium can be assumed. Moreover, the mass transfer coefficient is dependent on the surface-to-volume ratio of the raindrops and is diminished for large raindrops due to a smaller contact surface between the liquid and gas phase (Xuan et al., 2020). The size of the raindrops can be derived from the rain intensity, as shown by Kumar (1985). During the vertical profile flights light rain (drizzle) was reported, consistent with rain sum measurements (approximately 10−4 mm h−1) and ERA5 reanalysis plots provided by the Copernicus Climate Change Service (Hersbach et al., 2018; Fig. S11). It seems that evaporation of small raindrops releases hydrogen peroxide, causing elevated hydrogen peroxide mixing ratios at low altitudes.
A comparison of hydrogen peroxide mixing ratios during the BLUESKY campaign with the previous HOOVER and UTOPIHAN-ACT campaigns shows significant differences within the middle troposphere and the boundary layer. The measurements are only in 30 % agreement with previous observations within the lower tropospheric layers. Hydrogen peroxide does not exhibit the expected local maximum at altitudes of 3–7 km. The rather constant vertical distribution of the mixing ratio is most likely related to the enhanced presence of clouds and the subsequent wet scavenging during the measurement period relative to previous airborne studies.
The measured hydrogen peroxide mixing ratios agree with those simulated by EMAC within the upper troposphere and the boundary layer. The model simulations partly reproduce the strong effect of cloud uptake and rainout loss of the species in the middle troposphere. The calculated deposition loss rates based on EMAC reveal an underestimation relative to the observations, indicating difficulties in the simulation of wet scavenging by the model. This was confirmed by the discrepancies between the rain rates and H2O2 scavenging values simulated by EMAC and ERA5 meteorological reanalysis data.
While the BLUESKY campaign was performed under lockdown conditions, with substantially reduced anthropogenic emissions, particularly of NOx, we find that reduced H2O2 mixing ratios compared to the HOOVER and UTOPIHAN-ACT campaigns are not explained by chemical but rather by meteorological conditions. The importance of rain as an H2O2 sink, but potentially also in vertically redistributing H2O2, was shown in a case study based on aircraft measurements over central Germany. While precipitation scavenging removed H2O2 from the cloud layer, the evaporation of drizzle droplets in the boundary layer beneath locally increased H2O2 mixing ratios.
The data presented in this paper are available from the contact authors under request.
The supplement related to this article is available online at: https://doi.org/10.5194/acp-22-9483-2022-supplement.
JL and HF planned the campaign; ZTH, FO and BB performed the measurements; ZTH and HF designed the study; ZTH, FO, BB and BS analyzed the data; AP developed the model code and performed the simulation; ZTH wrote the paper draft with contributions of all co-authors; JL, HF, AP, BB, FO and BS reviewed and edited the paper.
At least one of the (co-)authors is a member of the editorial board of Atmospheric Chemistry and Physics. The peer-review process was guided by an independent editor, and the authors also have no other competing interests to declare.
Publisher's note: Copernicus Publications remains neutral with regard to jurisdictional claims in published maps and institutional affiliations.
This article is part of the special issues “BLUESKY atmospheric composition measurements by aircraft during the COVID-19 lockdown in spring 2020” and “The Modular Earth Submodel System (MESSy) (ACP/GMD inter-journal SI)”. It is not associated with a conference.
The authors are very grateful to the BLUESKY team, the Forschungszentrum Jülich, Karlsruhe Institute of Technology and Deutsches Zentrum für Luft- und Raumfahrt (DLR) in Oberpfaffenhofen for their great support. Their work was essential for the BLUESKY project. Special thanks to Ovid Oktavian Krüger, Department of Multiphase Chemistry, Max Planck Institute for Chemistry, for providing the trajectories and the rain rates along the flight tracks.
Birger Bohn was supported by the DFG priority program HALO-SPP 1294 under
grant BO 1580/5-1.
The article processing charges for this open-access publication were covered by the Max Planck Society.
This paper was edited by Robert McLaren and reviewed by two anonymous referees.
Anastasio, C., Faust, B. C., and Allen, J. M.: Aqueous phase photochemical formation of hydrogen peroxide in authentic cloud waters, J. Geophys. Res., 99, 8231, https://doi.org/10.1029/94JD00085, 1994.
Bohn, B. and Lohse, I.: Calibration and evaluation of CCD spectroradiometers for ground-based and airborne measurements of spectral actinic flux densities, Atmos. Meas. Tech., 10, 3151–3174, https://doi.org/10.5194/amt-10-3151-2017, 2017.
Bozem, H., Pozzer, A., Harder, H., Martinez, M., Williams, J., Lelieveld, J., and Fischer, H.: The influence of deep convection on HCHO and H2O2 in the upper troposphere over Europe, Atmos. Chem. Phys., 17, 11835–11848, https://doi.org/10.5194/acp-17-11835-2017, 2017.
Brimblecombe, P. and Dawson, G. A.: Wet removal of highly soluble gases, J. Atmos. Chem., 2, 95–107, https://doi.org/10.1007/BF00127265, 1984.
Calvert, J. G., Lazrus, A., Kok, G. L., Heikes, B. G., Walega, J. G., Lind, J., and Cantrell, C. A.: Chemical mechanisms of acid generation in the troposphere, Nature, 317, 27–35, https://doi.org/10.1038/317027a0, 1985.
Campbell, M. J., Sheppard, J. C., and Au, B. F.: Measurement of hydroxyl concentration in boundary layer air by monitoring CO oxidation, Geophys. Res. Lett., 6, 175–178, https://doi.org/10.1029/GL006i003p00175, 1979.
Cohan, D. S., Schultz, M. G., Jacob, D. J., Heikes, B. G., and Blake, D. R.: Convective injection and photochemical decay of peroxides in the tropical upper troposphere: Methyl iodide as a tracer of marine convection, J. Geophys. Res., 104, 5717–5724, https://doi.org/10.1029/98JD01963, 1999.
Colomb, A., Williams, J., Crowley, J., Gros, V., Hofmann, R., Salisbury, G., Klüpfel, T., Kormann, R., Stickler, A., Forster, C., and Lelieveld, J.: Airborne Measurements of Trace Organic Species in the Upper Troposphere Over Europe: the Impact of Deep Convection, Environ. Chem., 3, 244–259, https://doi.org/10.1071/EN06020, 2006.
Crippa, M., Guizzardi, D., Muntean, M., Schaaf, E., Dentener, F., van Aardenne, J. A., Monni, S., Doering, U., Olivier, J. G. J., Pagliari, V., and Janssens-Maenhout, G.: Gridded emissions of air pollutants for the period 1970–2012 within EDGAR v4.3.2, Earth Syst. Sci. Data, 10, 1987–2013, https://doi.org/10.5194/essd-10-1987-2018, 2018.
Crutzen, P.: A discussion of the chemistry of some minor constituents in the stratosphere and troposphere, Pure Appl. Geophys., 106–108, 1385–1399, https://doi.org/10.1007/BF00881092, 1973.
Crutzen, P. J. and Lawrence, M. G.: The Impact of Precipitation Scavenging on the Transport of Trace Gases: A 3-Dimensional Model Sensitivity Study, J. Atmos. Chem., 37, 81–112, https://doi.org/10.1023/A:1006322926426, 2000.
Crutzen, P. J., Lawrence, M. G., and Pöschl, U.: On the background photochemistry of tropospheric ozone, Tellus B, 51, 123–146, https://doi.org/10.3402/tellusb.v51i1.16264, 1999.
Damschen, D. E. and Martin, L. R.: Aqueous aerosol oxidation of nitrous acid by O2, O3 AND H2O2, Atmos. Environ., 17, 2005–2011, https://doi.org/10.1016/0004-6981(83)90357-8, 1983.
Edy, J., Cautenet, S., and Brémaud, P.: Modeling ozone and carbon monoxide redistribution by shallow convection over the Amazonian rain forest, J. Geophys. Res., 101, 28671–28681, https://doi.org/10.1029/96JD01867, 1996.
Faloona, I., Tan, D., Brune, W. H., Jaeglé, L., Jacob, D. J., Kondo, Y., Koike, M., Chatfield, R., Pueschel, R., Ferry, G., Sachse, G., Vay, S., Anderson, B., Hannon, J., and Fuelberg, H.: Observations of HO x and its relationship with NOx in the upper troposphere during SONEX, J. Geophys. Res., 105, 3771–3783, https://doi.org/10.1029/1999JD900914, 2000.
Fels, M. and Junkermann, W.: The occurrence of organic peroxides in air at a mountain site, Geophys. Res. Lett., 21, 341–344, https://doi.org/10.1029/93GL01892, 1994.
Graedel, T. E., Mandich, M. L., and Weschler, C. J.: Kinetic model studies of atmospheric droplet chemistry: 2. Homogeneous transition metal chemistry in raindrops, J. Geophys. Res., 91, 5205, https://doi.org/10.1029/JD091iD04p05205, 1986.
Granier, C., Darras, S., Denier van der Gon, H., Doubalova, J., Elguindi, N., Galle, B., Gauss, M., Guevara, M., Jalkanen, J.-P., Kuenen, J., Liousse, C., Quack, B., Simpson, D., and Sindelarova, K.: The Copernicus Atmosphere Monitoring Service global and regional emissions (April 2019 version), Copernicus Atmosphere Monitoring Service [Research Report], https://doi.org/10.24380/d0bn-kx16, 2019.
Guevara, M., Jorba, O., Soret, A., Petetin, H., Bowdalo, D., Serradell, K., Tena, C., Denier van der Gon, H., Kuenen, J., Peuch, V.-H., and Pérez García-Pando, C.: Time-resolved emission reductions for atmospheric chemistry modelling in Europe during the COVID-19 lockdowns, Atmos. Chem. Phys., 21, 773–797, https://doi.org/10.5194/acp-21-773-2021, 2021.
Guilbault, G. G., Brignac, P. J., and Juneau, M.: New substrates for the fluorometric determination of oxidative enzymes, Anal. Chem., 40, 1256–1263, https://doi.org/10.1021/ac60264a027, 1968.
Hall, B. D. and Claiborn, C. S.: Measurements of the dry deposition of peroxides to a Canadian boreal forest, J. Geophys. Res., 102, 29343–29353, https://doi.org/10.1029/97JD01113, 1997.
Hall, B., Claiborn, C., and Baldocchi, D.: Measurement and modeling of the dry deposition of peroxides, Atmos. Environ., 33, 577–589, https://doi.org/10.1016/S1352-2310(98)00271-4, 1999.
Heikes, B., Lee, M., Jacob, D., Talbot, R., Bradshaw, J., Singh, H., Blake, D., Anderson, B., Fuelberg, H., and Thompson, A. M.: Ozone, hydroperoxides, oxides of nitrogen, and hydrocarbon budgets in the marine boundary layer over the South Atlantic, J. Geophys. Res., 101, 24221–24234, https://doi.org/10.1029/95JD03631, 1996a.
Heikes, B. G., Lee, M., Bradshaw, J., Sandholm, S., Davis, D. D., Crawford, J., Rodriguez, J., Liu, S., McKeen, S., Thornton, D., Bandy, A., Gregory, G., Talbot, R., and Blake, D.: Hydrogen peroxide and methylhydroperoxide distributions related to ozone and odd hydrogen over the North Pacific in the fall of 1991, J. Geophys. Res., 101, 1891–1905, https://doi.org/10.1029/95JD01364, 1996b.
Hersbach, H., Bell, B., Berrisford, P., Biavati, G., Horányi, A., Muñoz Sabater, J., Nicolas, J., Peubey, C., Radu, R., Rozum, I., Schepers, D., Simmons, A., Soci, C., Dee, D., and Thépaut, J.-N.: ERA5 hourly data on single levels from 1979 to present, CDS [data set], https://doi.org/10.24381/cds.adbb2d47, 2018.
Hersbach, H., Bell, B., Berrisford, P., Biavati, G., Horányi, A., Muñoz Sabater, J., Nicolas, J., Peubey, C., Radu, R., Rozum, I., Schepers, D., Simmons, A., Soci, C., Dee, D., and Thépaut, J-N.: ERA5 monthly averaged data on single levels from 1959 to present, CDS [data set] https://doi.org/10.24381/CDS.F17050D7, 2019.
Hoesly, R. M., Smith, S. J., Feng, L., Klimont, Z., Janssens-Maenhout, G., Pitkanen, T., Seibert, J. J., Vu, L., Andres, R. J., Bolt, R. M., Bond, T. C., Dawidowski, L., Kholod, N., Kurokawa, J.-I., Li, M., Liu, L., Lu, Z., Moura, M. C. P., O'Rourke, P. R., and Zhang, Q.: Historical (1750–2014) anthropogenic emissions of reactive gases and aerosols from the Community Emissions Data System (CEDS), Geosci. Model Dev., 11, 369–408, https://doi.org/10.5194/gmd-11-369-2018, 2018.
Hoffmann, M. R. and Edwards, J. O.: Kinetics of the oxidation of sulfite by hydrogen peroxide in acidic solution, J. Phys. Chem., 79, 2096–2098, https://doi.org/10.1021/j100587a005, 1975.
Hottmann, B., Hafermann, S., Tomsche, L., Marno, D., Martinez, M., Harder, H., Pozzer, A., Neumaier, M., Zahn, A., Bohn, B., Stratmann, G., Ziereis, H., Lelieveld, J., and Fischer, H.: Impact of the South Asian monsoon outflow on atmospheric hydroperoxides in the upper troposphere, Atmos. Chem. Phys., 20, 12655–12673, https://doi.org/10.5194/acp-20-12655-2020, 2020.
Hua, W., Chen, Z. M., Jie, C. Y., Kondo, Y., Hofzumahaus, A., Takegawa, N., Chang, C. C., Lu, K. D., Miyazaki, Y., Kita, K., Wang, H. L., Zhang, Y. H., and Hu, M.: Atmospheric hydrogen peroxide and organic hydroperoxides during PRIDE-PRD'06, China: their concentration, formation mechanism and contribution to secondary aerosols, Atmos. Chem. Phys., 8, 6755–6773, https://doi.org/10.5194/acp-8-6755-2008, 2008.
Huang, D. and Chen, Z.: Reinvestigation of the Henry's law constant for hydrogen peroxide with temperature and acidity variation, J. Environ. Sci., 22, 570–574, https://doi.org/10.1016/S1001-0742(09)60147-9, 2010.
Jackson, A. V. and Hewitt, C. N.: Hydrogen peroxide and organic hydroperoxide concentrations in air in a eucalyptus forest in central Portugal, Atmos. Environ., 30, 819–830, https://doi.org/10.1016/1352-2310(95)00348-7, 1996.
Jacob, P. and Klockow, D.: Hydrogen peroxide measurements in the marine atmosphere, J. Atmos. Chem., 15, 353–360, https://doi.org/10.1007/BF00115404, 1992.
Jaeglé, L., Jacob, D. J., Wennberg, P. O., Spivakovsky, C. M., Hanisco, T. F., Lanzendorf, E. J., Hintsa, E. J., Fahey, D. W., Keim, E. R., Proffitt, M. H., Atlas, E. L., Flocke, F., Schauffler, S., McElroy, C. T., Midwinter, C., Pfister, L., and Wilson, J. C.: Observed OH and HO2 in the upper troposphere suggest a major source from convective injection of peroxides, Geophys. Res. Lett., 24, 3181–3184, https://doi.org/10.1029/97GL03004, 1997.
Jaeglé, L., Jacob, D. J., Brune, W. H., Faloona, I. C., Tan, D., Kondo, Y., Sachse, G. W., Anderson, B., Gregory, G. L., Vay, S., Singh, H. B., Blake, D. R., and Shetter, R.: Ozone production in the upper troposphere and the influence of aircraft during SONEX: approach of NOx-saturated conditions, Geophys. Res. Lett., 26, 3081–3084, https://doi.org/10.1029/1999GL900451, 1999.
Jaeglé, L., Jacob, D. J., Brune, W. H., Faloona, I., Tan, D., Heikes, B. G., Kondo, Y., Sachse, G. W., Anderson, B., Gregory, G. L., Singh, H. B., Pueschel, R., Ferry, G., Blake, D. R., and Shetter, R. E.: Photochemistry of HOx in the upper troposphere at northern midlatitudes, J. Geophys. Res., 105, 3877–3892, https://doi.org/10.1029/1999JD901016, 2000.
Jöckel, P., Sander, R., Kerkweg, A., Tost, H., and Lelieveld, J.: Technical Note: The Modular Earth Submodel System (MESSy) – a new approach towards Earth System Modeling, Atmos. Chem. Phys., 5, 433–444, https://doi.org/10.5194/acp-5-433-2005, 2005.
Jöckel, P., Tost, H., Pozzer, A., Brühl, C., Buchholz, J., Ganzeveld, L., Hoor, P., Kerkweg, A., Lawrence, M. G., Sander, R., Steil, B., Stiller, G., Tanarhte, M., Taraborrelli, D., van Aardenne, J., and Lelieveld, J.: The atmospheric chemistry general circulation model ECHAM5/MESSy1: consistent simulation of ozone from the surface to the mesosphere, Atmos. Chem. Phys., 6, 5067–5104, https://doi.org/10.5194/acp-6-5067-2006, 2006.
Jöckel, P., Kerkweg, A., Pozzer, A., Sander, R., Tost, H., Riede, H., Baumgaertner, A., Gromov, S., and Kern, B.: Development cycle 2 of the Modular Earth Submodel System (MESSy2), Geosci. Model Dev., 3, 717–752, https://doi.org/10.5194/gmd-3-717-2010, 2010.
Jöckel, P., Tost, H., Pozzer, A., Kunze, M., Kirner, O., Brenninkmeijer, C. A. M., Brinkop, S., Cai, D. S., Dyroff, C., Eckstein, J., Frank, F., Garny, H., Gottschaldt, K.-D., Graf, P., Grewe, V., Kerkweg, A., Kern, B., Matthes, S., Mertens, M., Meul, S., Neumaier, M., Nützel, M., Oberländer-Hayn, S., Ruhnke, R., Runde, T., Sander, R., Scharffe, D., and Zahn, A.: Earth System Chemistry integrated Modelling (ESCiMo) with the Modular Earth Submodel System (MESSy) version 2.51, Geosci. Model Dev., 9, 1153–1200, https://doi.org/10.5194/gmd-9-1153-2016, 2016.
Kelly, T. J., Daum, P. H., and Schwartz, S. E.: Measurements of peroxides in cloudwater and rain, J. Geophys. Res., 90, 7861–7871, https://doi.org/10.1029/JD090iD05p07861, 1985.
Kerkweg, A., Buchholz, J., Ganzeveld, L., Pozzer, A., Tost, H., and Jöckel, P.: Technical Note: An implementation of the dry removal processes DRY DEPosition and SEDImentation in the Modular Earth Submodel System (MESSy), Atmos. Chem. Phys., 6, 4617–4632, https://doi.org/10.5194/acp-6-4617-2006, 2006a.
Kerkweg, A., Sander, R., Tost, H., and Jöckel, P.: Technical note: Implementation of prescribed (OFFLEM), calculated (ONLEM), and pseudo-emissions (TNUDGE) of chemical species in the Modular Earth Submodel System (MESSy), Atmos. Chem. Phys., 6, 3603–3609, https://doi.org/10.5194/acp-6-3603-2006, 2006b.
Kleinman, L. I.: Photochemical formation of peroxides in the boundary layer, J. Geophys. Res., 91, 10889, https://doi.org/10.1029/JD091iD10p10889, 1986.
Klippel, T., Fischer, H., Bozem, H., Lawrence, M. G., Butler, T., Jöckel, P., Tost, H., Martinez, M., Harder, H., Regelin, E., Sander, R., Schiller, C. L., Stickler, A., and Lelieveld, J.: Distribution of hydrogen peroxide and formaldehyde over Central Europe during the HOOVER project, Atmos. Chem. Phys., 11, 4391–4410, https://doi.org/10.5194/acp-11-4391-2011, 2011.
Kormann, C., Bahnemann, D. W., and Hoffmann, M. R.: Photocatalytic production of hydrogen peroxides and organic peroxides in aqueous suspensions of titanium dioxide, zinc oxide, and desert sand, Environ. Sci. Technol., 22, 798–806, https://doi.org/10.1021/es00172a009, 1988.
Krautstrunk, M. and Giez, A.: The Transition From FALCON to HALO Era Airborne Atmospheric Research, in: Atmospheric Physics, edited by: Schumann, U., Springer Berlin Heidelberg, Berlin, Heidelberg, 609–624, https://doi.org/10.1007/978-3-642-30183-4_37, 2012.
Kumar, S.: An Eulerian model for scavenging of pollutants by raindrops, Atmos. Environ., 19, 769–778, https://doi.org/10.1016/0004-6981(85)90065-4, 1985.
Kunen, S. M., Lazrus, A. L., Kok, G. L., and Heikes, B. G.: Aqueous oxidation of SO2 by hydrogen peroxide, J. Geophys. Res., 88, 3671, https://doi.org/10.1029/JC088iC06p03671, 1983.
Lazrus, A. L., Kok, G. L., Gitlin, S. N., Lind, J. A., and McLaren, S. E.: Automated fluorimetric method for hydrogen peroxide in atmospheric precipitation, Anal. Chem., 57, 917–922, https://doi.org/10.1021/ac00281a031, 1985.
Lazrus, A. L., Kok, G. L., Lind, J. A., Gitlin, S. N., Heikes, B. G., and Shelter, R. E.: Automated Fluorometric Method for Hydrogen Peroxide in Air, Anal. Chem., 58, 594–597, 1986.
Lee, M., Heikes, B. G., and O'Sullivan, D. W.: Hydrogen peroxide and organic hydroperoxide in the troposphere: a review, Atmos. Environ., 34, 3475–3494, https://doi.org/10.1016/S1352-2310(99)00432-X, 2000.
Lee, Y.-N. and Lind, J. A.: Kinetics of aqueous-phase oxidation of nitrogen(III) by hydrogen peroxide, J. Geophys. Res., 91, 2793, https://doi.org/10.1029/JD091iD02p02793, 1986.
Lelieveld, J. and Crutzen, P. J.: Influences of cloud photochemical processes on tropospheric ozone, Nature, 343, 227–233, https://doi.org/10.1038/343227a0, 1990.
Lelieveld, J. and Crutzen, P. J.: The role of clouds in tropospheric photochemistry, J. Atmos. Chem., 12, 229–267, https://doi.org/10.1007/BF00048075, 1991.
Lelieveld, J. and Crutzen, P. J.: Role of deep cloud convection in the ozone budget of the troposphere, Science, 264, 1759–1761, https://doi.org/10.1126/science.264.5166.1759, 1994.
Levy, H.: Normal atmosphere: large radical and formaldehyde concentrations predicted, Science, 173, 141–143, https://doi.org/10.1126/science.173.3992.141, 1971.
Lightfoot, P. D., Cox, R. A., Crowley, J. N., Destriau, M., Hayman, G. D., Jenkin, M. E., Moortgat, G. K., and Zabel, F.: Organic peroxy radicals: Kinetics, spectroscopy and tropospheric chemistry, Atmos. Environ. A-Gen., 26, 1805–1961, https://doi.org/10.1016/0960-1686(92)90423-I, 1992.
Logan, J. A., Prather, M. J., Wofsy, S. C., and McElroy, M. B.: Tropospheric chemistry: A global perspective, J. Geophys. Res., 86, 7210, https://doi.org/10.1029/JC086iC08p07210, 1981.
Madronich, S.: Photodissociation in the atmosphere: 1. Actinic flux and the effects of ground reflections and clouds, J. Geophys. Res., 92, 9740, https://doi.org/10.1029/JD092iD08p09740, 1987.
McArdle, J. V. and Hoffmann, M. R.: Kinetics and mechanism of the oxidation of aquated sulfur dioxide by hydrogen peroxide at low pH, J. Phys. Chem., 87, 5425–5429, https://doi.org/10.1021/j150644a024, 1983.
Olszyna, K. J., Meagher, J. F., and Bailey, E. M.: Gas-phase, cloud and rain-water measurements of hydrogen peroxide at a high-elevation site, Atmos. Environ., 22, 1699–1706, https://doi.org/10.1016/0004-6981(88)90398-8, 1988.
O'Sullivan, D. W., Heikes, B. G., Lee, M., Chang, W., Gregory, G. L., Blake, D. R., and Sachse, G. W.: Distribution of hydrogen peroxide and methylhydroperoxide over the Pacific and South Atlantic Oceans, J. Geophys. Res., 104, 5635–5646, https://doi.org/10.1029/98JD01250, 1999.
Palenik, B., Zafiriou, O. C., and Morel, F. M. M.: Hydrogen peroxide production by a marine phytoplankter1, Limnol. Oceanogr., 32, 1365–1369, https://doi.org/10.4319/lo.1987.32.6.1365, 1987.
Penkett, S. A., Jones, B. M. R., Brich, K. A., and Eggleton, A. E. J.: The importance of atmospheric ozone and hydrogen peroxide in oxidising sulphur dioxide in cloud and rainwater, Atmos. Environ., 13, 123–137, https://doi.org/10.1016/0004-6981(79)90251-8, 1979.
Perros, P. E.: Large-scale distribution of hydrogen peroxide from aircraft measurements during the TROPOZ II experiment, Atmos. Environ. A-Gen., 27, 1695–1708, https://doi.org/10.1016/0960-1686(93)90232-N, 1993.
Pilz, W. and Johann, I.: Die Bestimmung Kleinster Mengen von Wasserstoffperoxyd in Luft, Int. J. Environ. Anal. Chem., 3, 257–270, https://doi.org/10.1080/03067317408071087, 1974.
Reeves, C. E. and Penkett, S. A.: Measurements of peroxides and what they tell us, Chem. Rev., 103, 5199–5218, https://doi.org/10.1021/cr0205053, 2003.
Reifenberg, S. F., Martin, A., Kohl, M., Bacer, S., Hamryszczak, Z., Tadic, I., Röder, L., Crowley, D. J., Fischer, H., Kaiser, K., Schneider, J., Dörich, R., Crowley, J. N., Tomsche, L., Marsing, A., Voigt, C., Zahn, A., Pöhlker, C., Holanda, B. A., Krüger, O., Pöschl, U., Pöhlker, M., Jöckel, P., Dorf, M., Schumann, U., Williams, J., Bohn, B., Curtius, J., Harder, H., Schlager, H., Lelieveld, J., and Pozzer, A.: Numerical simulation of the impact of COVID-19 lockdown on tropospheric composition and aerosol radiative forcing in Europe, Atmos. Chem. Phys., 22, 10901–10917, https://doi.org/10.5194/acp-22-10901-2022, 2022.
Robbin Martin, L. and Damschen, D. E.: Aqueous oxidation of sulfur dioxide by hydrogen peroxide at low pH, Atmos. Environ., 15, 1615–1621, https://doi.org/10.1016/0004-6981(81)90146-3, 1981.
Roeckner, E., Bäuml, G., Bonaventura, L., Brokopf, R., Esch, M., Giorgetta, M., Hagemann, S., Kirchner, I., Kornblueh, L., Manzini, E., Rhodin, A., Schlese, U., Schulzweida, U., and Tompkins, A.: The atmospheric general circulation model ECHAM 5. PART I: Model description, Max-Planck-Institut für Meteorologie, https://doi.org/10.17617/2.995269, 2003.
Roeckner, E., Brokopf, R., Esch, M., Giorgetta, M., Hagemann, S., Kornblueh, L., Manzini, E., Schlese, U., and Schulzweida, U.: Sensitivity of Simulated Climate to Horizontal and Vertical Resolution in the ECHAM5 Atmosphere Model, J. Climate, 19, 3771–3791, https://doi.org/10.1175/JCLI3824.1, 2006.
Sakugawa, H., Kaplan, I. R., Tsai, W., and Cohen, Y.: Atmospheric hydrogen peroxide, Environ. Sci. Technol., 24, 1452–1462, https://doi.org/10.1021/es00080a002, 1990.
Sakugawa, H., Kaplan, I. R., and Shepard, L. S.: Measurements of H2O2, aldehydes and organic acids in Los Angeles rainwater: Their sources and deposition rates, Atmos. Environ. B-Urb., 27, 203–219, https://doi.org/10.1016/0957-1272(93)90006-R, 1993.
Sander, R., Kerkweg, A., Jöckel, P., and Lelieveld, J.: Technical note: The new comprehensive atmospheric chemistry module MECCA, Atmos. Chem. Phys., 5, 445–450, https://doi.org/10.5194/acp-5-445-2005, 2005.
Sander, R., Baumgaertner, A., Gromov, S., Harder, H., Jöckel, P., Kerkweg, A., Kubistin, D., Regelin, E., Riede, H., Sandu, A., Taraborrelli, D., Tost, H., and Xie, Z.-Q.: The atmospheric chemistry box model CAABA/MECCA-3.0, Geosci. Model Dev., 4, 373–380, https://doi.org/10.5194/gmd-4-373-2011, 2011.
Sander, R., Baumgaertner, A., Cabrera-Perez, D., Frank, F., Gromov, S., Grooß, J.-U., Harder, H., Huijnen, V., Jöckel, P., Karydis, V. A., Niemeyer, K. E., Pozzer, A., Riede, H., Schultz, M. G., Taraborrelli, D., and Tauer, S.: The community atmospheric chemistry box model CAABA/MECCA-4.0, Geosci. Model Dev., 12, 1365–1385, https://doi.org/10.5194/gmd-12-1365-2019, 2019.
Slemr, F. and Tremmel, H. G.: Hydroperoxides in the marine troposphere over the Atlantic Ocean, J. Atmos. Chem., 19, 371–404, https://doi.org/10.1007/BF00694493, 1994.
Snow, J. A.: Winter-spring evolution and variability of HOx reservoir species, hydrogen peroxide, and methyl hydroperoxide, in the northern middle to high latitudes, J. Geophys. Res., 108, 1890, https://doi.org/10.1029/2002JD002172, 2003.
Snow, J. A., Heikes, B. G., Shen, H., O'Sullivan, D. W., Fried, A., and Walega, J.: Hydrogen peroxide, methyl hydroperoxide, and formaldehyde over North America and the North Atlantic, J. Geophys. Res., 112, 8353, https://doi.org/10.1029/2006JD007746, 2007.
Stickler, A., Fischer, H., Williams, J., Reus, M. de, Sander, R., Lawrence, M. G., Crowley, J. N., and Lelieveld, J.: Influence of summertime deep convection on formaldehyde in the middle and upper troposphere over Europe, J. Geophys. Res., 111, D14308, https://doi.org/10.1029/2005JD007001, 2006.
Tost, H., Jöckel, P., Kerkweg, A., Sander, R., and Lelieveld, J.: Technical note: A new comprehensive SCAVenging submodel for global atmospheric chemistry modelling, Atmos. Chem. Phys., 6, 565–574, https://doi.org/10.5194/acp-6-565-2006, 2006.
Valverde-Canossa, J., Wieprecht, W., Acker, K., and Moortgat, G. K.: H2O2 and organic peroxide measurements in an orographic cloud: The FEBUKO experiment, Atmos. Environ., 39, 4279–4290, https://doi.org/10.1016/j.atmosenv.2005.02.040, 2005.
Voigt, C., Lelieveld, J., Schlager, H., Schneider, J., Curtius, J., Meerkötter, R., Sauer, D., Bugliaro, L., Bohn, B., Crowley, J. N., Erbertseder, T., Groß, S., Hahn, V., Li, Q., Mertens, M., Pöhlker, M. L., Pozzer, A., Schumann, U., Tomsche, L., Williams, J., Zahn, A., Andreae, M., Borrmann, S., Bräuer, T., Dörich, R., Dörnbrack, A., Edtbauer, A., Ernle, L., Fischer, H., Giez, A., Granzin, M., Grewe, V., Harder, H., Heinritzi, M., Holanda, B. A., Jöckel, P., Kaiser, K., Krüger, O. O., Lucke, J., Marsing, A., Martin, A., Matthes, S., Pöhlker, C., Pöschl, U., Reifenberg, S., Ringsdorf, A., Scheibe, M., Tadic, I., Zauner-Wieczorek, M., Henke, R., and Rapp, M.: Cleaner skies during the COVID-19 lockdown, B. Am. Meteorol. Soc., https://doi.org/10.1175/BAMS-D-21-0012.1, online first, 2022.
Walker, S. J., Evans, M. J., Jackson, A. V., Steinbacher, M., Zellweger, C., and McQuaid, J. B.: Processes controlling the concentration of hydroperoxides at Jungfraujoch Observatory, Switzerland, Atmos. Chem. Phys., 6, 5525–5536, https://doi.org/10.5194/acp-6-5525-2006, 2006.
Warneck, P.: Chemical reactions in clouds, Fresen. J. Anal. Chem., 340, 585–590, https://doi.org/10.1007/BF00322434, 1991.
Warneck, P.: Chemistry of the natural atmosphere, 3rd print, International geophysics series, Vol. 41, Academic Press, San Diego, Calif., 757 pp., ISBN 0127356304, 1994.
Weinstein-Lloyd, J. B., Lee, J. H., Daum, P. H., Kleinman, L. I., Nunnermacker, L. J., Springston, S. R., and Newman, L.: Measurements of peroxides and related species during the 1995 summer intensive of the Southern Oxidants Study in Nashville, Tennessee, J. Geophys. Res., 103, 22361–22373, https://doi.org/10.1029/98JD01636, 1998.
Xuan, X., Chen, Z., Gong, Y., Shen, H., and Chen, S.: Partitioning of hydrogen peroxide in gas-liquid and gas-aerosol phases, Atmos. Chem. Phys., 20, 5513–5526, https://doi.org/10.5194/acp-20-5513-2020, 2020.
Zahn, A., Weppner, J., Widmann, H., Schlote-Holubek, K., Burger, B., Kühner, T., and Franke, H.: A fast and precise chemiluminescence ozone detector for eddy flux and airborne application, Atmos. Meas. Tech., 5, 363–375, https://doi.org/10.5194/amt-5-363-2012, 2012.
Zepp, R. G., Faust, B. C., and Hoigne, J.: Hydroxyl radical formation in aqueous reactions (pH 3–8) of iron(II) with hydrogen peroxide: the photo-Fenton reaction, Environ. Sci. Technol., 26, 313–319, https://doi.org/10.1021/es00026a011, 1992.
Zuo, Y. and Deng, Y.: Iron(II)-catalyzed photochemical decomposition of oxalic acid and generation of H2O2 in atmospheric liquid phases, Chemosphere, 35, 2051–2058, https://doi.org/10.1016/S0045-6535(97)00228-2, 1997.
Zuo, Y. and Hoigne, J.: Formation of hydrogen peroxide and depletion of oxalic acid in atmospheric water by photolysis of iron(III)-oxalato complexes, Environ. Sci. Technol., 26, 1014–1022, https://doi.org/10.1021/es00029a022, 1992.
Zuo, Y. and Hoigné, J.: Evidence for Photochemical Formation of H2O2 and Oxidation of SO2 in Authentic Fog Water, Science, 260, 71–73, https://doi.org/10.1126/science.260.5104.71, 1993.