the Creative Commons Attribution 4.0 License.
the Creative Commons Attribution 4.0 License.
 | 08 Jul 2022
Evolution of turbulent kinetic energy during the entire sandstorm process
Hongyou Liu
Yanxiong Shi
Xiaojing Zheng
An adaptive segmented stationary method for non-stationary signal is proposed to reveal the turbulent kinetic energy evolution during the entire sandstorm process observed at the Qingtu Lake Observation Array. Sandstorms, which are a common natural disaster, are mechanically characterized by a particle-laden two-phase flow experiencing wall turbulence, with an extremely high Reynolds number and significant turbulent kinetic energy. Turbulence energy transfer is important to the understanding of sandstorm dynamics. This study indicates that large-scale and very large-scale coherent structures originally exist in the rising stage of sandstorms with a streamwise kinetic energy of 75 % (at ) rather than gradually forming. In addition to carrying a substantial portion of energy, the very large-scale motions are active structures with strong nonlinear energy transfer. These structures gain energy from strong nonlinear interaction. As a sandstorm evolves, these large structures are gradually broken by quadratic phase coupling, with the energy fraction reducing to 40 % (at ) in the declining stage. The nonlinear process in the steady and declining stages weakens and maintains a balanced budget of energy. The systematic bispectrum results provide a new perspective for further insight into sandstorms.
- Article
(7224 KB) - Full-text XML
-
Supplement
(950 KB) - BibTeX
- EndNote


Sandstorms are devastating natural hazards and one of the main global environmental problems which accelerate the expansion of desertification (Hu et al., 2017; Gu et al., 2021; Yang et al., 2021). Analyzing the temporal and spatial characteristics and the causes of sandstorms can help us better understand their occurrence and development, improving the level of sandstorm forecasting and reducing disaster impact and loss (Gasch et al., 2017; Li, 2020; Zhang and Zhou, 2020; Xu et al., 2020; Miri et al., 2021; Hamzeh et al., 2021). At present, there are a large number of studies on sandstorms, mainly focusing on the studies of meteorological conditions in the early stage of sandstorm formation and in the process of the sandstorm, including wind, humidity, temperature, and air pressure (Shao and Dong, 2006; Amanollahi et al., 2015; Li, 2020; Hamzeh et al., 2021). Studies also focused on the significant impacts of sandstorms on the whole earth atmosphere system, such as the change in the atmospheric chemical composition (Li et al., 2012; Formenti et al., 2014; Lovett et al., 2018; Oduber et al., 2019), affecting the radiation-energy budget (Shao et al., 2013; Kosmopoulos et al., 2017), the contribution to the acceleration of glacier melting (Gautam et al., 2013), and the adverse impact on ecosystems (Mahowald et al., 2005; Lawrence and Neff, 2009) and human health (Nastos et al., 2011; Garcia-Pando et al., 2014; Goudie, 2014; Soleimani et al., 2020). However, wind, as a driving force, is the energy source of wind-blown sand movement. The structural characteristics of the flow field directly affect the surface sand emission and vertical transport (Zheng et al., 2013; Martin and Kok, 2017; Zhan et al., 2017). Wind velocity has been proven to have a more significant impact on sandstorms than other meteorological elements (Li, 2020). Essentially, sandstorms are mechanically characterized by a particle-laden two-phase flow experiencing wall turbulence, with an extremely high Reynolds number and significant turbulent kinetic energy. Turbulence and multiphase flows are two of the most challenging topics in fluid mechanics (Balachandar and Eaton, 2010). Therefore, the evolution of turbulent kinetic energy during the entire sandstorm process is important to provide further insight into sandstorms but has not yet been reported currently.
At the beginning of a sandstorm, the local wind velocity gradually increases, and sand particles on the ground are carried away by the strong wind, which increases the particle concentration in the atmospheric surface layer (ASL). After the wind velocity gradually increases to reach a plateau, a steady state is usually maintained for a period of time, which is a steady turbulence signal that has been widely considered. Subsequently, the wind velocity decreases until it approaches zero, and the sand particles sink to the ground under the action of gravity (Zheng, 2009). Therefore, the entire sandstorm process includes the rising stage, the steady stage, and the declining stage. The existing studies on turbulence characteristics in sandstorms are mostly focused on the steady stage, which is a typical particle-laden two-phase flow under very high Reynolds number conditions. Zhang et al. (2007) investigated the characteristics of turbulent transfer, and results suggested that thermal turbulence is dominant during the daytime of non-dusty days but the dynamic turbulence increases obviously during sand events, and the dynamic turbulence even exceeds the thermal turbulence during severe sandstorm events. Statistical analysis of turbulent and gusty characteristics in the atmospheric boundary layer with strong mean wind behind cold fronts was conducted by Cheng et al. (2011), and results showed that the turbulent fluctuations are nearly random and isotropic with weak coherency, but the gusty wind disturbances are anisotropic with rather strong coherency. Li and Zhang (2012) evaluated the dynamic and thermal impact on sand emission by turbulence and found that the thermal impact on sand emission by turbulence is far less than its dynamic impact. Based on the three components of the high-frequency wind velocity data obtained by long-term observations during sandstorms, Wang and Zheng (2016) and Wang et al. (2020) suggested that the large-scale coherent structures exist in the steady stage of sandstorms and enhance the streamwise transport of sand particles, but the energy fraction of the large-scale structures is decreased by particles. In addition, Zhao et al. (2020) studied the turbulence coherent-structure sand emission mechanism and found that the turbulence coherent structure existed in the process of the sand emissions and exhibits a typical ejection–sweep cycle, where the sweep process mainly causes the sand particles on the surface to move, while the ejection process transports the particles upward to the sky. Recently, the turbulent characteristics in the steady stage of sandstorms have been summarized in Liu and Zheng (2021). The above studies indicate that the turbulent characteristics, especially the large-scale coherent structures, play an important role in the understanding of sandstorm dynamics.
There are few analyses on the evolution of turbulence characteristics during the entire sandstorm process because the rising and declining stages are non-stationary signals whose statistical characteristics are a function of time. For non-stationary signals, researchers hope to utilize an analysis method that combines the time domain and frequency domain, which can reflect not only the frequency information but also the changes in frequency over time. Therefore, the local transform method is adopted to overcome the faults of the Fourier transform due to globality and thus solve the challenge of analyzing and processing non-stationary signals. In 1946, Gabor (1946) first analyzed non-stationary signals by windowing in the time domain and proposed the Gabor transform, which laid a theoretical foundation for analyzing signals in the joint domain of time and frequency. In 1947, Potter (1947) improved the Gabor transform and proposed the short-time Fourier transform (STFT). Although these two methods greatly promoted the progress of the analysis of time non-stationary signals, they cannot obtain a high resolution at low frequency due to the limitation of the size of the moving window. In 1948, Ville (1948) applied the Wigner distribution, which was proposed by Wigner, to signal analysis. The Wigner distribution is a nonlinear time–frequency analysis method with a high resolution, but cross-interference terms are inevitably associated with this method for multiple components. Morlet et al. (1982) proposed the wavelet transform in the early 1980s, which used the joint timescale function to analyze non-stationary signals. However, all of the methods mentioned above utilize the Fourier transform framework. It was not until 1998 that Huang et al. (1998) proposed the empirical mode decomposition (EMD). Combined with the Hilbert transform, they proposed a new non-stationary signal processing method, that is, the Hilbert–Huang transform (HHT). The HHT can obtain a high time-domain and frequency-domain resolution at the same time. It is noted that the existing non-stationary signal processing methods can only perform time–frequency spectrum analysis, and other commonly used statistical approaches (such as bispectrum (Chokani, 2005), two-point correlation (Favre et al., 1957), and amplitude modulation coefficients (H. Y. Liu et al., 2019)) for analyzing turbulence characteristics cannot be implemented.
Therefore, this study aims to propose a method that can be used to analyze the entire process of sandstorms, including the non-stationary rising and declining stage. On this basis, the difference in energy characteristics of sandstorms at different stages and their evolutionary laws are investigated using high-frequency wind velocity observation data during a complete sandstorm event obtained from long-term observations in the high Reynolds number ASL on the desert surface.
2.1 Experimental setup
The sandstorm data used in this study were obtained from long-term observations conducted at the Qingtu Lake Observation Array (QLOA) site in western China. The site is located in a flat dry bed of Qingtu Lake, which borders the two deserts of Badain Jaran and Tengger, as shown in Fig. 1a. The area is perennially dry and rainless, with no vegetation covering the ground, and is on the path of cold air traveling northwest through China. Therefore, the cold front transit caused by the outbreak of cold air can form a strong wind in the region, which leads to frequent sandstorms in spring in the area. At the same time, the cold front transit is a regional weather process, and the control effect of the large weather system causes the strong wind to exhibit a relatively stable propulsion velocity and direction; thus, high-quality data for the entire sandstorm process can be obtained at the QLOA site.
The QLOA is composed of a 32 m high main tower and 22 lower towers that are 5 m in height. There are 10 streamwise towers in the prevailing wind of the main tower and 6 spanwise towers on the left and right sides of the main tower, as shown in Fig. 1b. Eleven sonic anemometers (Campbell CSAT3B, with a sampling frequency of 50 Hz) were installed on the main tower from 0.9 to 30 m in a logarithmic gradient, and 11 aerosol monitors (TSI, Dustrak II-8530-EP, with a sampling frequency of 1 Hz) for particles with sizes less than 10 µm (PM10) were also installed at the corresponding positions of the sonic anemometers, as shown in Fig. 1c and d. Thus, the three components of the wind velocity, the temperature, sand concentration, and near-ground sand flux, during a sandstorm can be obtained synchronously. Details regarding the QLOA and experimental apparatus can be found in Wang and Zheng (2016) and Wang et al. (2017).
To date, continuous ASL observations were performed at the QLOA over a duration of more than 8000 h. From 16 to 17 April 2016 a severe sandstorm occurred in the observation field. The QLOA captured the sandstorm event and obtained high-quality data during the complete process. The sandstorm started at 13:00 local time on 16 April and ended at 03:00 on 17 April, and lasted for 14 h, as shown in Fig. 2. The streamwise velocity at 5 m shown in Fig. 2a indicates that this sandstorm exhibits obvious rising, steady, and declining stages. The duration of these three stages is approximately 5, 7, and 2 h, respectively. At the steady stage, the average wind velocity was 11.26 m s−1 and the instantaneous maximum wind velocity reached up to 22.3 m s−1. With the development of the sandstorm, the instantaneous PM10 concentration can reach up to 5.45 mg m−3, as shown in Fig. 2c. Given the PM10 percentage in the QLOA site of approximately 2.5 %, the total sand concentration may reach up to 218 mg m−3 and the visibility is less than 300 m. In addition, Fig. 2d shows that as the sandstorm evolves, the ambient temperature drops sharply about 2 h after the start of the sandstorm; this is a typical feature of sandstorms induced by a cold front transit (Dragani, 1999; Zhao et al., 2020).
To clarify the cause of the sandstorm, the weather conditions and potential meteorological drivers were also investigated. From 16 to 17 April 2016, the average circulation in the midlatitudes to high latitudes of Eurasia turned into two troughs and one ridge. The midlatitudes to high latitudes from the Ural Mountains to Lake Balkhash were broad ridges, and northern Europe and the vicinity of the Okhotsk Sea were controlled by low-value systems. From the daily circulation evolution, affected by the westerly trough, plateau trough, and south branch trough, surface cyclones moved eastward and developed in Northwest China from 14 to 16 April. There was a cold air process with a low trough moving eastward from 16 to 17 April. Decreasing temperature occurred in the eastern part of Northwest China, accompanied by four to six northerly winds and seven to eight gusts. At the same time, under the influence of the ground cold front and the Mongolian cyclone, sandstorms occurred locally in northwestern and northern China.
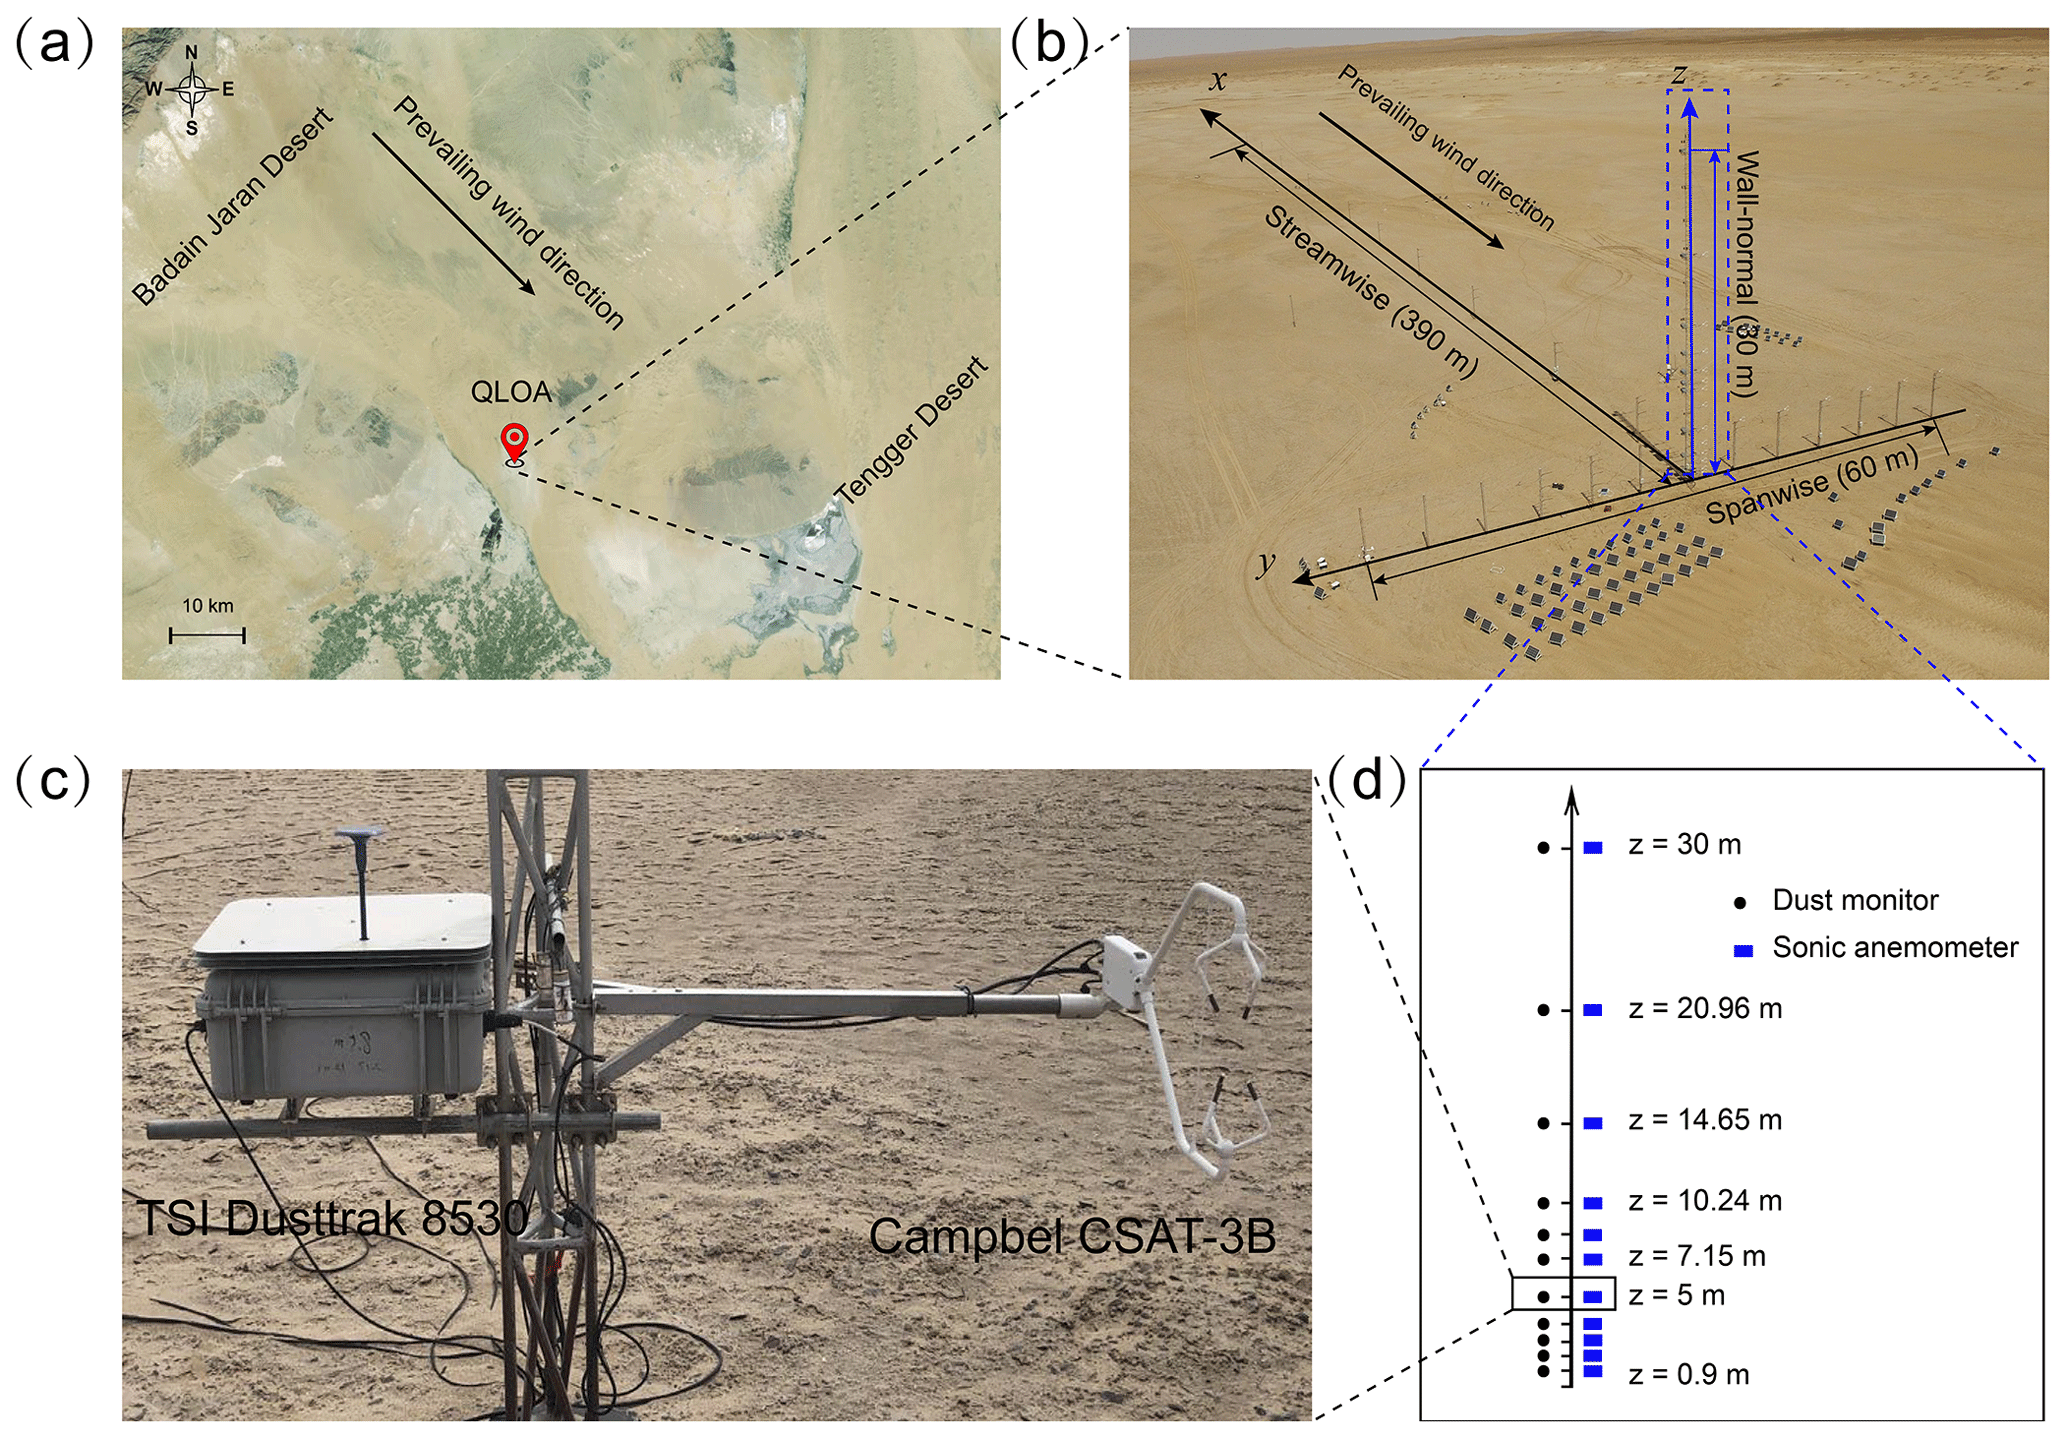
Figure 1The field observational site and measurement array: (a) satellite photographs of the QLOA site (© Google Earth), (b) panoramic view of the QLOA, (c) the photos of experimental instruments (dust monitor and sonic anemometer), and (d) the southeast view of the sonic anemometers (square) and dust monitors (circle) array on the wall-normal array.
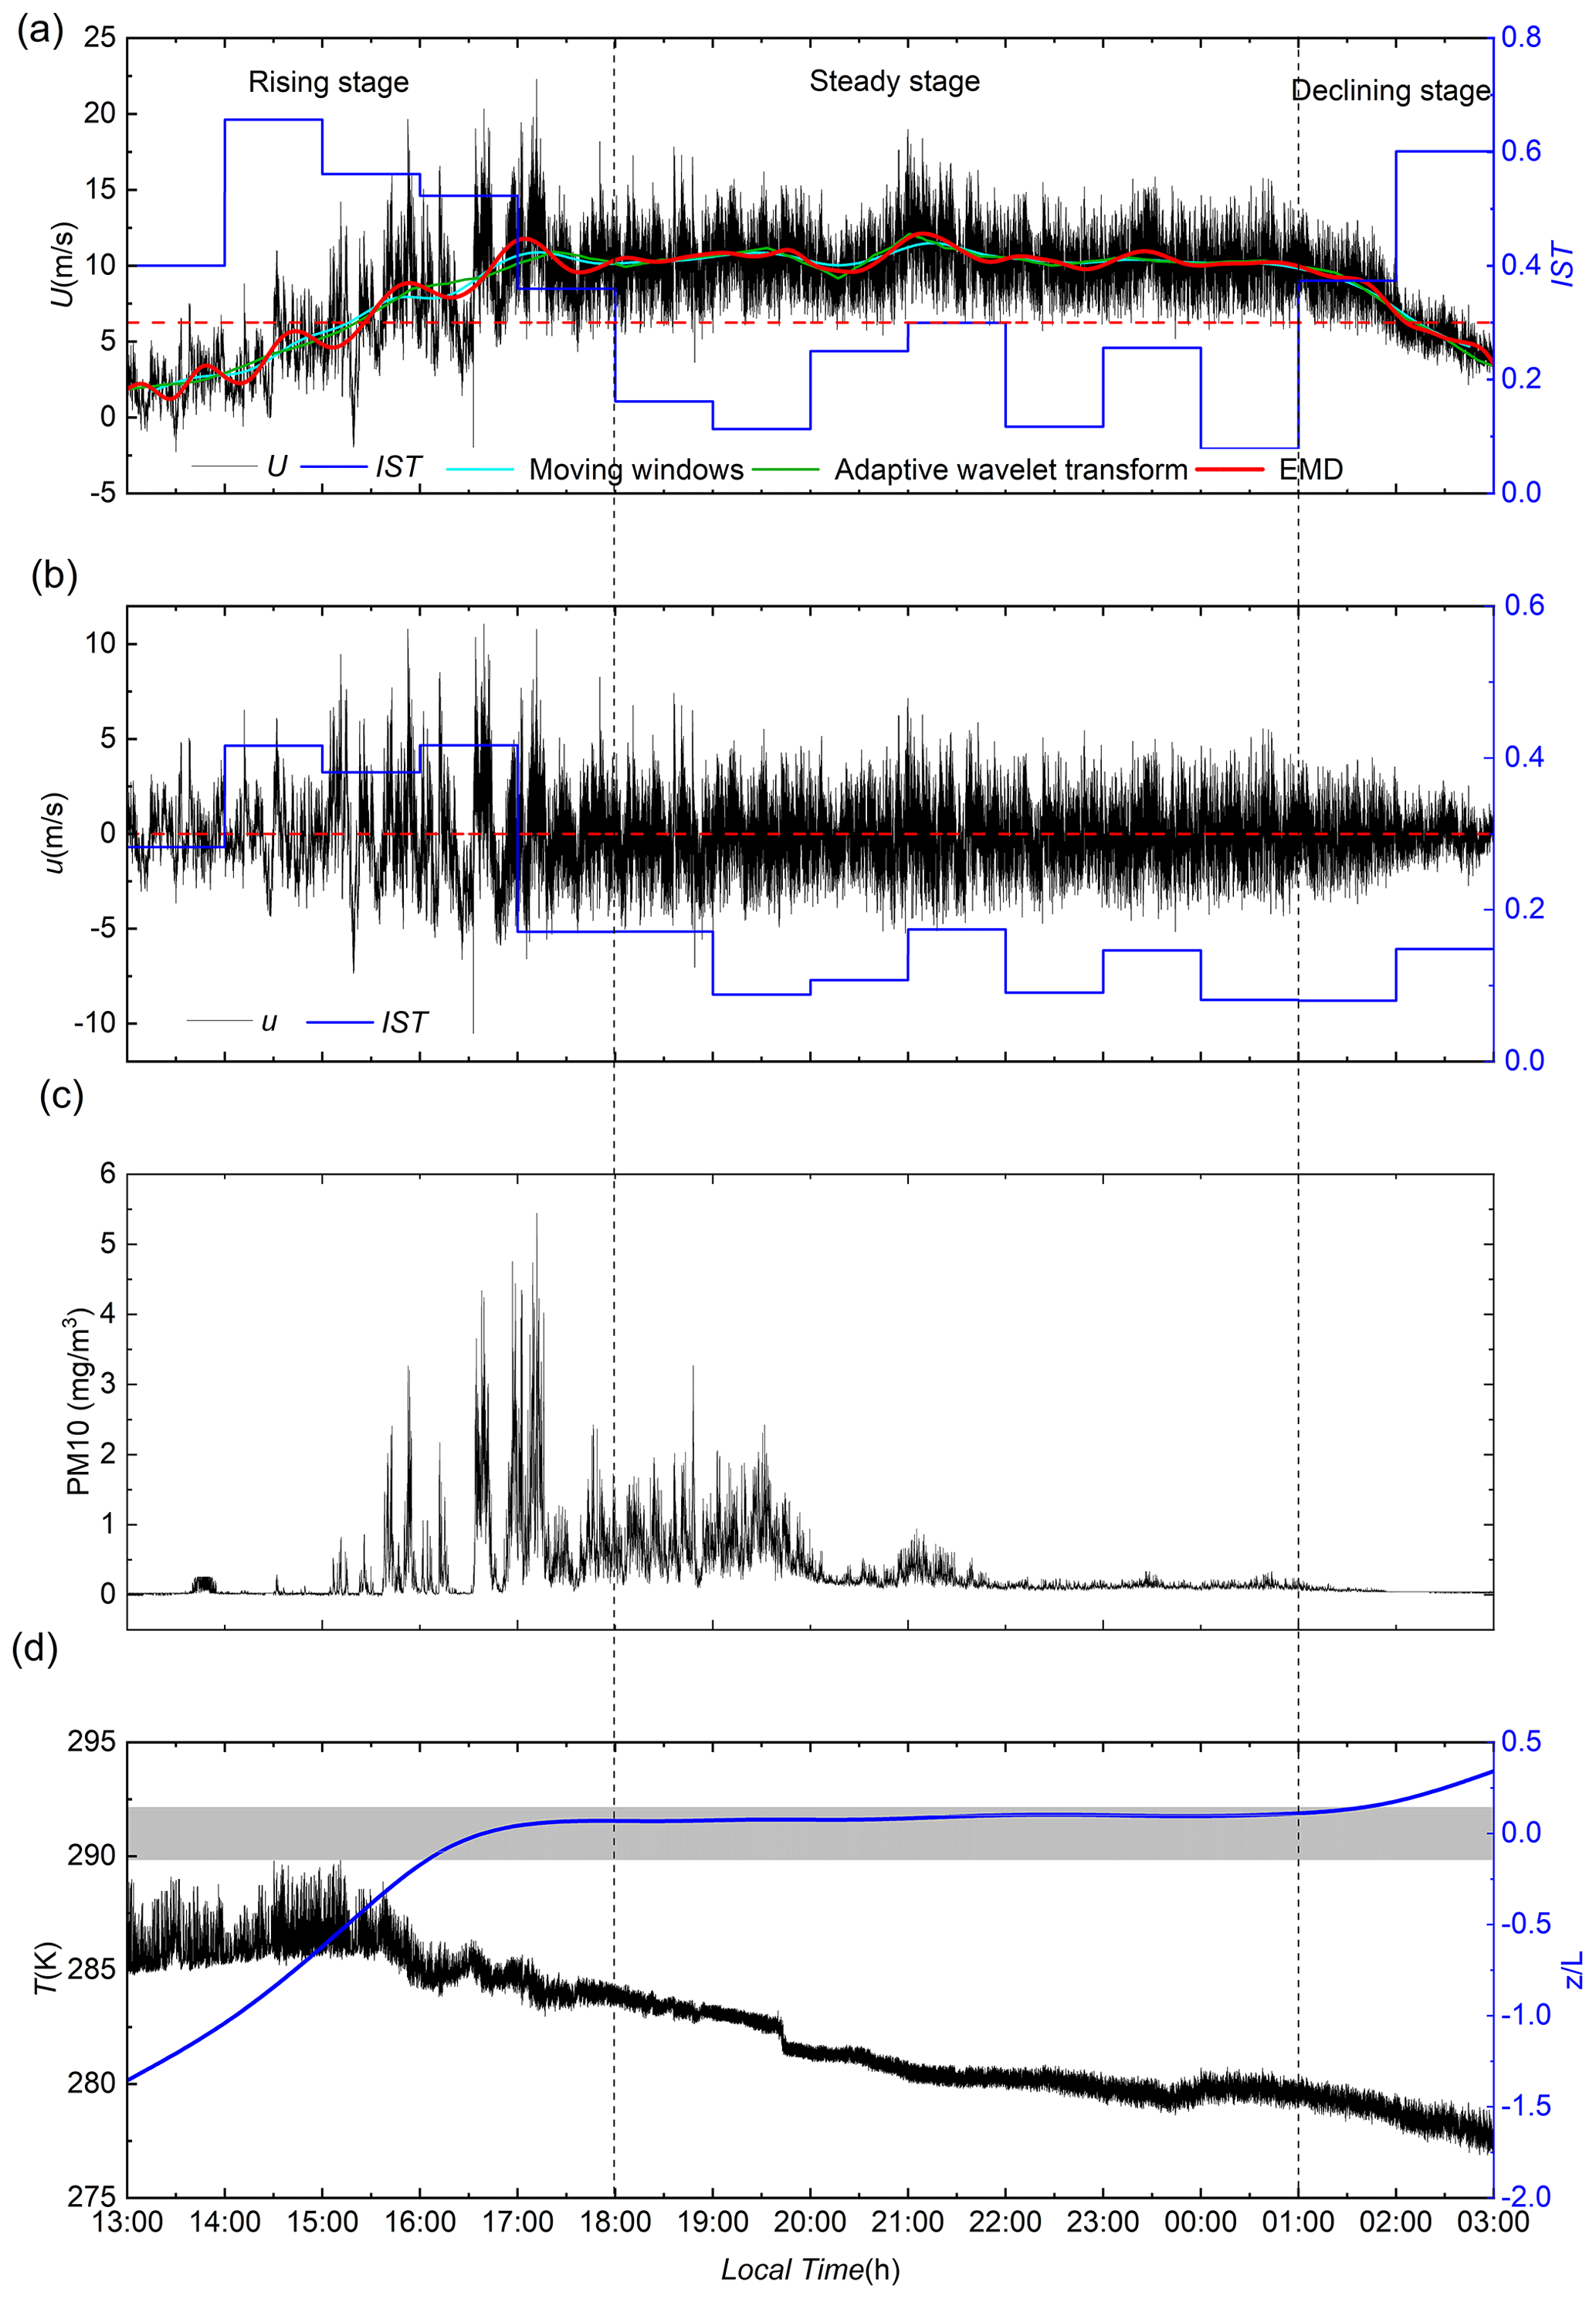
Figure 2(a) Streamwise velocity time series during the whole process of the sandstorm: the red line, cyan line, and green line are the time-varying average velocities obtained by EMD, moving average, and adaptive wavelet transform, respectively; the blue line is the non-stationary index IST. (b) The fluctuating streamwise velocity signal resulting from removing the trend term in (a). (c) The concentration of PM10. (d) The temperature and , where the shaded area marks the near-neutral stratification condition of .
The friction Reynolds number (, where uτ is the friction velocity, δ is the thickness of the ASL, and ν is kinematic viscosity) in the steady stage of the sandstorm is approximately 4.5×10⁶. The friction velocity uτ was estimated by eddy covariance (; u and w are the streamwise and vertical velocity fluctuations, respectively) and averaging at three heights below 2.5 m. The air kinematic viscosity ν was calculated based on the barometric pressure and temperature during the observation. The ASL thickness δ was estimated by the horizontal wind velocity signal (>30 m) collected by Doppler lidar and was basically kept within the range of 142 ± 23 m for different sandstorm events at the QLOA site. Following the previous work in Wang et al. (2020), the δ is adopted as 150 m in this study. The thermal stability of the ASL was characterized by the Monin–Obukhov stability parameter:
where z denotes the measurement height, L denotes the Obukhov length, κ=0.41 is the Kármán constant, g is gravitational acceleration, and is the average vertical heat flux, which was calculated by averaging the covariance between the vertical wind velocity w and the temperature θ. The resulting during the sandstorm is shown in Fig. 2d, where the shaded area marks the near-neutral stratification condition of (Hogstrom, 1988; Metzger et al., 2010). It is seen that the ASL is basically unstably stratified in the rising stage of the sandstorm, neutrally stratified in the steady stage, and stably stratified in the declining stage.
2.2 Data preprocessing
Given the complexity and uncontrollability of the atmospheric environment, specific pretreatment are performed on the raw data to obtain reliable results of turbulent characteristics in high Reynolds number ASLs. Following Hutchins et al. (2012) and Wang and Zheng (2016), the data processing procedure includes the wind direction correction, steady wind judgment, and thermal stability judgment. The wind direction correction is performed to obtain the actual streamwise, spanwise, and vertical velocities (denoted U, V, and W) because the actual incoming wind direction is not always the same as the x axis built into the sonic anemometer, although the x axis was installed to align with the prevailing direction. The trigonometric conversion is written as (Wilczak et al., 2001)
where ; Us, Vs, and Ws represent the velocity components of the x axis, y axis, and z axis in the coordinate system of the sonic anemometer, respectively. The corresponding average velocity is denoted , , and . The sonic anemometer was leveled during installation, and thus W=Ws.
The non-stationary index IST proposed by Foken et al. (2004) is employed to check the stationarity of the velocity signal and is given as
where is the local variance of each segment of data which is denoted by x(Δt) and CV is the overall variance of the signal. The period of time Δt is determined from the advection times of the energetic turbulence motions to contain the dominated structures in the outer region of the wall-bounded turbulence. The results of Hutchins and Marusic (2007) suggested that the very large-scale motions (VLSMs) in turbulent boundary layers can reach up to 10δ, with a δ of 150 m and a convection velocity of 5–20 m s−1; such as VLSMs could have advection times of O (1.25–5 min). Thus, the Δt is adopted as 5 min to be consistent with Foken et al. (2004). According to Foken et al. (2004), the signal is stationary when satisfying the high-quality data condition of IST <30 %. The IST for hourly data of the sandstorm is shown in Fig. 2a. As expected, the IST of the rising and declining stages in the sandstorm is greater than 30 %, which indicates that the data are non-stationary.
Therefore, non-stationary signal processing methods are needed. The existing method of the non-stationary signal is used to analyze the time–frequency distribution, and it is not sufficient for exploring the turbulence signals. The statistical characteristics of turbulence are of greater concern, such as bispectrum (Chokani, 2005), two-point correlation (Favre et al., 1957), amplitude modulation coefficients (H. Y. Liu et al., 2019), and the evolution of coherent structures. However, the premise of statistical analysis is that the data satisfy the stationary conditions. Lavielle (1998) and Mico et al. (2010) suggested that most signals can be regarded as quasi-stationary signals after piecewise processing. Therefore, the non-stationary time series can be divided into several segments of stationary signals, and each segment of data satisfying the stationary conditions can thus be analyzed by the traditional statistical analysis methods. However, a short period of time of the segment may reduce statistical convergence and omit low-frequency information, while a long period of time may make it difficult to meet the stationarity conditions. Thus, an effective method should be proposed to take into account the statistical convergence and stationarity conditions of the dataset at the same time. It is noted that the varying average wind velocity in the rising and declining stages of the sandstorm is the main factor causing the non-stationary data, and the turbulence characteristics are mainly contained in the fluctuations. Therefore, before segmenting the data, the time-varying average velocity should be removed, which can increase the time period of the data of each stationary segment and improve the statistical convergence.
To extract the time-varying mean value, the EMD is a widely applied signal analytical method, which can decompose a multicomponent signal x(t) into several intrinsic modal functions (IMFs) and a residual term, i.e.,
where ci(t) is the IMF and rn(t) is the residual term. There are two criteria for judging whether a signal component is an IMF: (1) the difference between the number of local maximums and local minimums and the number of zero crossings must be zero or one,;that is, an extreme value must be immediately followed by zero crossing; and (2) the moving average of the envelope defined by the local extremum is zero. The EMD algorithm details can be found in Huang et al. (1998, 2003) and Flandrin et al. (2004). The residual term rn(t) represents the overall trend of the signal and is the main factor to cause the non-stationarity of the signal. Thus, the residual term should be removed as the time-varying mean to reduce the non-stationarity of the signal. Specifically, the ogive analysis for time series of steady streamwise velocity fluctuations in the ASL suggested that a time series with a length of 50 min is sufficient (the corresponding streamwise advection length can reach O(100)δ) to obtain converged turbulent statistics (Hutchins et al., 2012; Liu et al., 2017). Moreover, the standard practice in studies of ASL observational data suggests that a fluctuation period on the order of 1 h or less can be regarded as turbulent, while slower fluctuations can be regarded as part of the mean field (Wyngaard, 1992). Therefore, it is suitable to consider fluctuations with periods greater than 1 h as time-varying average velocity. The time-varying average velocity extracted by EMD is shown in Fig. 2a and compared with that extracted by moving average and adaptive wavelet transform. The results show that the time-varying average velocities extracted by different methods are basically consistent and those extracted by EMD can better reflect the time-varying characteristics (confirmed by Zhang and Zheng, 2018); the correlation coefficient between the corresponding fluctuating velocities after removing the mean is larger than 0.93.
The fluctuating streamwise velocity after removing the time-varying mean extracted by the EMD is shown in Fig. 2b. It is seen that the non-stationarity of the data is reduced, but it is not eliminated. Therefore, an adaptive segmented stationary method is proposed in this study based on the non-stationary index, which is detailed as follows.
-
Step 1. For a non-stationary fluctuating time series x′(t), the first segment of data is initially selected as ; i.e., t1=Δt. According to Eq. (3), when only one Δt is taken, the local variance is the same as the overall variance, and thus the resulting IST = 0.
-
Step 2. Calculate the IST of this segment of data, and determine whether the IST is larger than 30 %.
-
Step 3. If IST <30 %, it indicates that this segment of data is stationary. To increase the statistical convergence of the data, the period of time is extended by Δt.
-
Step 4. Repeat steps 2–3, until IST <30 %, and thus we obtain the first segment of stationary data .
-
Step 5. Take the end time of the previous segment of data as a new start time, and repeat steps 1–4. The second segment of stationary data can be obtained; i.e., . Thus, a non-stationary signal can be divided into several segments of stationary signals; i.e.,
where and ti=niΔt . To validate the reliability of this method, a synthetic signal is analyzed by using the adaptive segmented stationary method, which is detailed in the Supplement.
After applying the data processing procedure, the sandstorm is divided into 14 segments, where the rising stage is divided into five segments (60, 55, 60, 80, and 45 min), the declining stage is divided into two hourly time series, and the steady stage is divided into seven hourly time series following standard practice in the analysis of ASL data (Wyngaard, 1992). The sensitivity tests of the IST threshold, the time window used for initial time-averaging and Δt indicate that they do not significantly affect the results and conclusions in the present work. Moreover, the unit root test is also applied to judge the stationarity, and the probability value (P value) is found to be less than 0.001, which is much less than the 0.05 level of significance; thus it is suitable to regard these segments of data as the stationary signal (Dickey and Fuller, 1981; Said and Dickey, 1984). The subsequent results in the present work are based on the analysis of these segments.
3.1 Pre-multiplied spectrum
Turbulent coherent structures are responsible for the production and dissipation of wall turbulence and thus are important to understanding turbulence dynamics (Robinson, 1991). Large-scale motions (LSMs) and very large-scale motions (VLSMs or “superstructures”, Hutchins and Marusic, 2007) are coherent structures with dimensions on the order of δ. These large coherent structures have been verified to be a dominant feature in the outer region of wall turbulence (Marusic et al., 2010), and they carry a substantial portion of the turbulent kinetic energy and Reynolds shear stress. The VLSMs are associated with the wavelengths of the lower wavenumber peaks in the pre-multiplied spectra of the streamwise velocity fluctuations (Vallikivi et al., 2015). Therefore, to investigate the existence of the VLSM and the corresponding length scale and energy contribution during the evolution of the sandstorm, the pre-multiplied spectra of the streamwise velocity fluctuations are analyzed in this subsection.
Figure 3a–c show the pre-multiplied spectra of the streamwise velocity fluctuations (where denotes the streamwise wavenumber, λx is the streamwise wavelength, and Φuu is the power spectral density of the streamwise velocity fluctuations) versus the streamwise wavenumber kxδ at different heights in different stages of the sandstorm. The calculation of the pre-multiplied spectrum follows the methods of Kim and Adrian (1999) and Kunkel and Marusic (2006). According to Hutchins and Marusic (2007) and Heisel et al. (2018), coherent structures with streamwise scales larger than 3δ (corresponding to ) are VLSMs. Therefore, the distinct peaks of the pre-multiplied spectra appear in the lower wavenumber region (on the left side of the vertical line), except in Fig. 3c, indicating that the VLSMs exist in both the rising stage and the steady stage of the sandstorm, while in the declining stage, the VLSMs gradually disappear. This implies that the VLSMs originally exist in the initial stage of the sandstorm instead of gradually developing with the increasing wind velocity in the later stage. By comparing the pre-multiplied spectra at different heights, Fig. 3 shows that during the entire sandstorm process, the spectral turbulent energy kxΦuu decreases with height on the right side of the peak, but increases with height on the left side of the peak. This is consistent with the phenomenon observed in the particle-free ASL flow (Wang and Zheng, 2016) but is different from the laboratory turbulent boundary layer measurements (where kxΦuu decreased with height throughout all the spectra) (Balakumar and Adrian, 2007). The decrease in kxΦuu with height in the high wavenumber region is consistent with the “bottom–up” mechanism proposed by Kim and Adrian (1999) and Adrian et al. (2000); that is, the turbulent motions grow upwards from the self-organization of near-wall cycles generated by kinetic bursts on the wall. The hairpin vortex being an important elementary coherent structure originates from the wall from some disturbance (Adrian et al., 2000). The primary vortex is stretched by the velocity gradient, while it will induce us to create new upstream and downstream hairpin vortices. The new hairpins grow and in turn can create more hairpins. These hairpin vortices are aligned coherently in the streamwise direction, creating larger-scale coherent structures (the basic idea of the hairpin vortex packet model in Adrian et al., 2000). Therefore, the turbulence kinetic energy was produced near the surface and gradually dissipated with height. On the other hand, the increase in kxΦuu with height in the low wavenumber region may be explained by the “top–down” mechanism (still pure conjecture) proposed by Hunt and Morrison (2000); that is, the VLSMs originate from the outer region of the turbulent boundary layer, which carries energy and moves downwards accompanied by breaking into smaller structures due to strong shear. The phenomenon in Fig. 3 indicates that these two structure formation mechanisms may coexist in the entire sandstorm process.
In addition, the spectral turbulent energy kxΦuu on the right side of the spectrum peak in the rising stage decreases rapidly within a short wavenumber range, but the decreases are slower in the steady and declining stages. This means that the distribution of energy between multi-scale turbulent motions is changed with the sandstorm evolution. The large coherent structures dominate in the early stages, and in the evolution of the sandstorm, more small-scale motions are generated. During the beginning of a sandstorm, the cold air would sink close to the ground (Dragani, 1999; Helfer and Nuijens, 2021), a large number of synoptic-scale structures gradually breaking into large turbulent structures (smaller than synoptic scale). The energetic structures are dominated by LSMs and VLSMs, and the energy of small-scale structures is relatively weak. Meanwhile, along with the momentum transport downward (when the wind direction aloft and the surface wind direction are consistent, convection and turbulence occur because the surface is heated in the daytime, which results in an exchange of momentum between the air and the ground; Liu et al., 2012; Helfer and Nuijens, 2021), the energy content of LSMs and VLSMs increases along the height. With the continuous development and evolution of the sandstorm, the steady stage is mainly affected by the downward momentum transport (Todd et al., 2008; Kaskaoutis et al., 2015), and the energy of small-scale turbulent motions increases due to the shearing breaking of large turbulent structures. When the sandstorm declines, the effects of strong synoptic events such as a cold front transit and the downward momentum transport are weakened. The LSMs and VLSMs are not sufficiently maintained, and the energy gradually concentrates toward smaller scales of motions and finally dissipates.
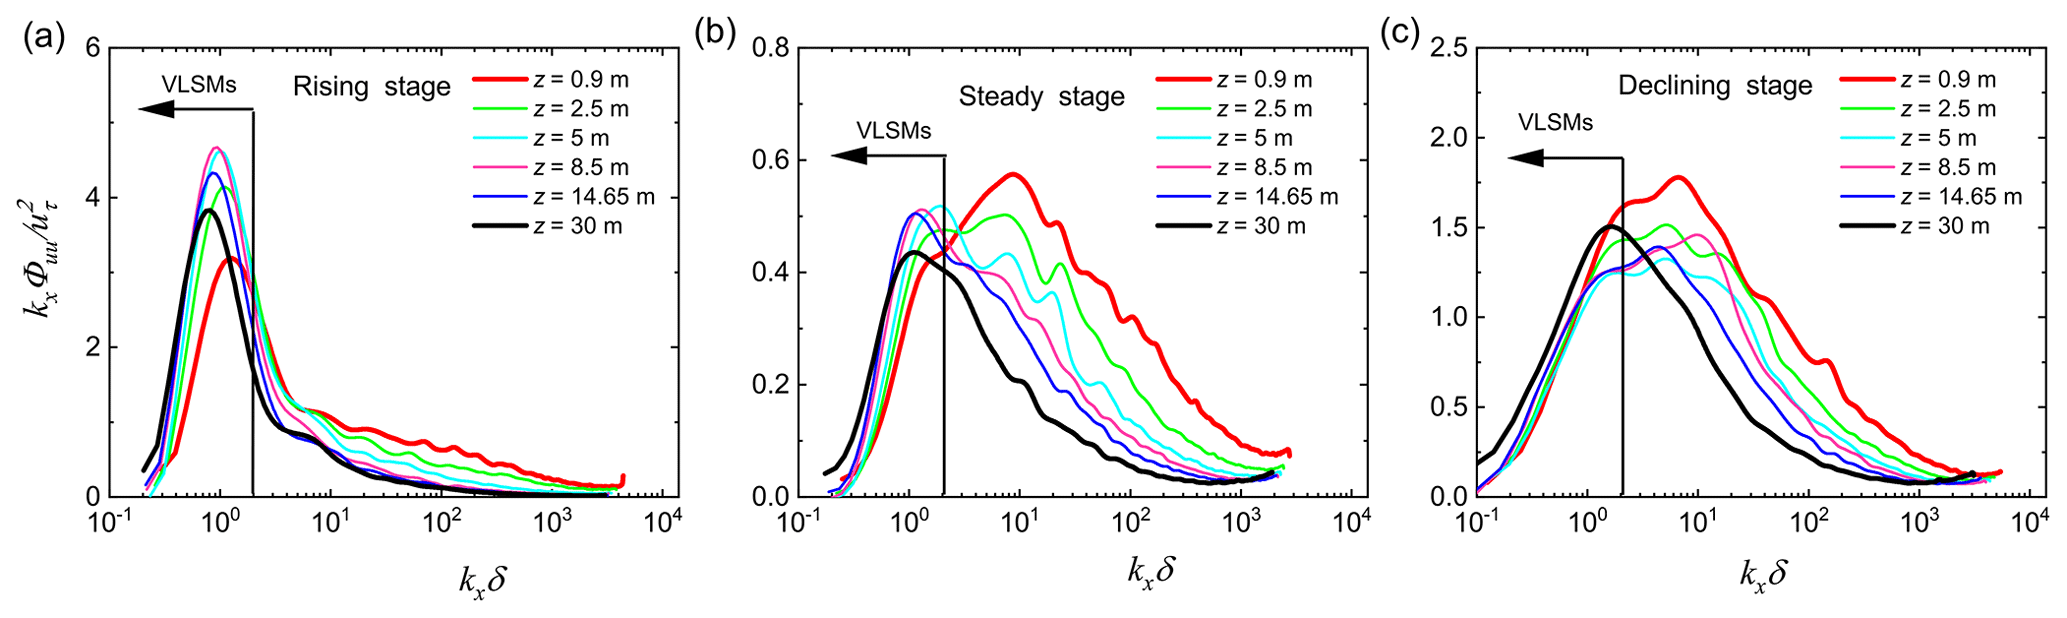
Figure 3Pre-multiplied spectra of streamwise velocity fluctuations versus streamwise wavenumber kxδ, where (a) is the rising stage, (b) is the steady stage, and (c) is the declining stage.
Figure 4a shows the wavelength variation in the lower wavenumber peak in pre-multiplied spectra with the height in the steady stage (blue solid circle). For comparison, Fig. 4a also includes the results in the laboratory turbulent boundary layer. The wavelength corresponding to the pre-multiplied spectral peak agrees well with the results in the laboratory turbulent boundary layer at low and moderate Reynolds numbers. Previously reported results indicated that the sand particles and Reynolds number exhibit negligible effects on the wavelength of the spectral peak (Hutchins and Marusic, 2007; Wang et al., 2017). Therefore, the agreement shown in Fig. 4a further confirms the reliability of the analysis method proposed in this study. However, the evolution of the wavelength of the spectral peak with time at the different heights shown in Fig. 4b indicates that there are significant differences in at different stages. The scale varies significantly with height in the steady stage, while the scale remains reasonably fixed at different heights (that is, the scale exhibits global characteristics in the measurement range) in the rising and declining stages. Hutchins et al. (2012) suggested that any events registered across the entire domain are weather related. Therefore, Fig. 4b may indicate that the rising and declining stages are mainly dominated by synoptic-scale motions, while the steady stage is mainly dominated by turbulent motions. With the intrusion of cold air, the sandstorm begins and the wind velocity starts to increase. The VLSMs are generated by the breaking process of synoptic-scale structures. As the wind velocity increases, the shearing breaking is enhanced, resulting in the reduced scale of the near-surface structures. After full development, the entire area is completely filled with cold air, and the wind velocity is basically stable, and the flow properties are similar to other laboratory experiments (Balakumar and Adrian, 2007; Vallikivi et al., 2015), as shown in Fig. 4a. During the declining stage, the energy brought by the cold air mass is exhausted, leading to the reduced wind velocity, and thus the flow is difficult to maintain, which is represented by a reduction in flow structure (as shown by the sharply decreasing scale in the declining stage in Fig. 4b). In addition, Fig. 4b shows a maximum right when the declining stage is started and before this sharp decrease. A plausible explanation for the increase in the scale of the near-surface flow structures is the weakened breaking of the synoptic-scale structures due to the attenuated quadratic phase coupling. In the late part of the steady stage (before the start of the declining stage), the average wind velocity remains constant (as shown in Fig. 2a), which indicates that the synoptic-scale fluctuations determined by the mean flow is approximately invariant (Hutchins et al., 2012). However, the quadratic phase coupling weakens in the late part of the steady stage (as shown in Fig. 7), suggesting a weakened breaking of the synoptic-scale structures.

Figure 4(a) Variation in the wavelength of the lower wavenumber peak in pre-multiplied spectra with height in the steady stage (blue solid cycle). Hollow symbols are the turbulent boundary layer (TBL) results in Balakumar and Adrian (2007) (Reτ=1476, 2395) and Vallikivi et al. (2015) (Reτ=72 500). (b) Evolution of with time at different heights in the whole process of the sandstorm.
To analyze the differences in the energy contributions of the VLSMs at different stages of sandstorms, the variations in the energy fraction of the VLSMs with height at different stages is shown in Fig. 5, where the yellow cycle is the result in a sand-laden flow available in Wang et al. (2017) at a Reynolds number similar to that in the steady stage. The most significant difference in the three stages is that the energy fraction of the VLSMs in the rising stage can reach up to 75 % at approximately the top of the logarithmic region () in the present ASL observation, which is much larger than that in the other two stages as well as the energy fraction of the VLSMs previously documented (which only reaches up to 60 % at in Wang and Zheng, 2016; Wang et al., 2017; Huang et al., 2021). The energy fraction of the VLSMs in the declining stage is the smallest, accounting for only approximately 40 % of the total energy at . The evidence presented by the energy fraction provides substantially deeper support for the above interpretation that at the beginning of the sandstorm, the VLSM is already a dominant feature in the flow field, whereas the VLSMs cannot retain their coherence in the declining stage and the energy gradually concentrates toward small-scale motions and finally attenuates.
In addition, Fig. 5 shows that the VLSM energy fraction increases with height in an approximately log-linear trend at different stages, which is qualitatively consistent with the results in the laboratory turbulent boundary layer (Balakumar and Adrian, 2007) and the steady sand-laden flow in the ASL (Wang et al., 2017). According to Townsend’s attached eddy hypothesis in wall turbulence (Townsend, 1976), the vortex scale in the flow increases with the height away from the surface (as shown in the steady stage in Fig. 4b). Therefore, the increasing large-scale energy fraction with height is expected because the large scales are more significant at higher height. However, given that the rising and declining stages of sandstorms are mainly dominated by weather events, the increasing large-scale energy fraction with height may be inconvincible to explain by the attached eddy hypothesis. Alternatively, the top–down mechanism in which the large-scale energy is transferred from top to bottom can also lead to the increasing energy with height. When these two factors are combined, it is possible to cause the energy fraction to increase even more dramatically with height. This can be confirmed by the larger slope in the steady stage shown in Fig. 5. The seemingly slightly smaller slope in the declining stage indicates a weakening top–down mechanism in the declining stage of the sandstorm. On the other hand, Fig. 5 provides evidence supporting the top–down mechanism for the VLSM origination.
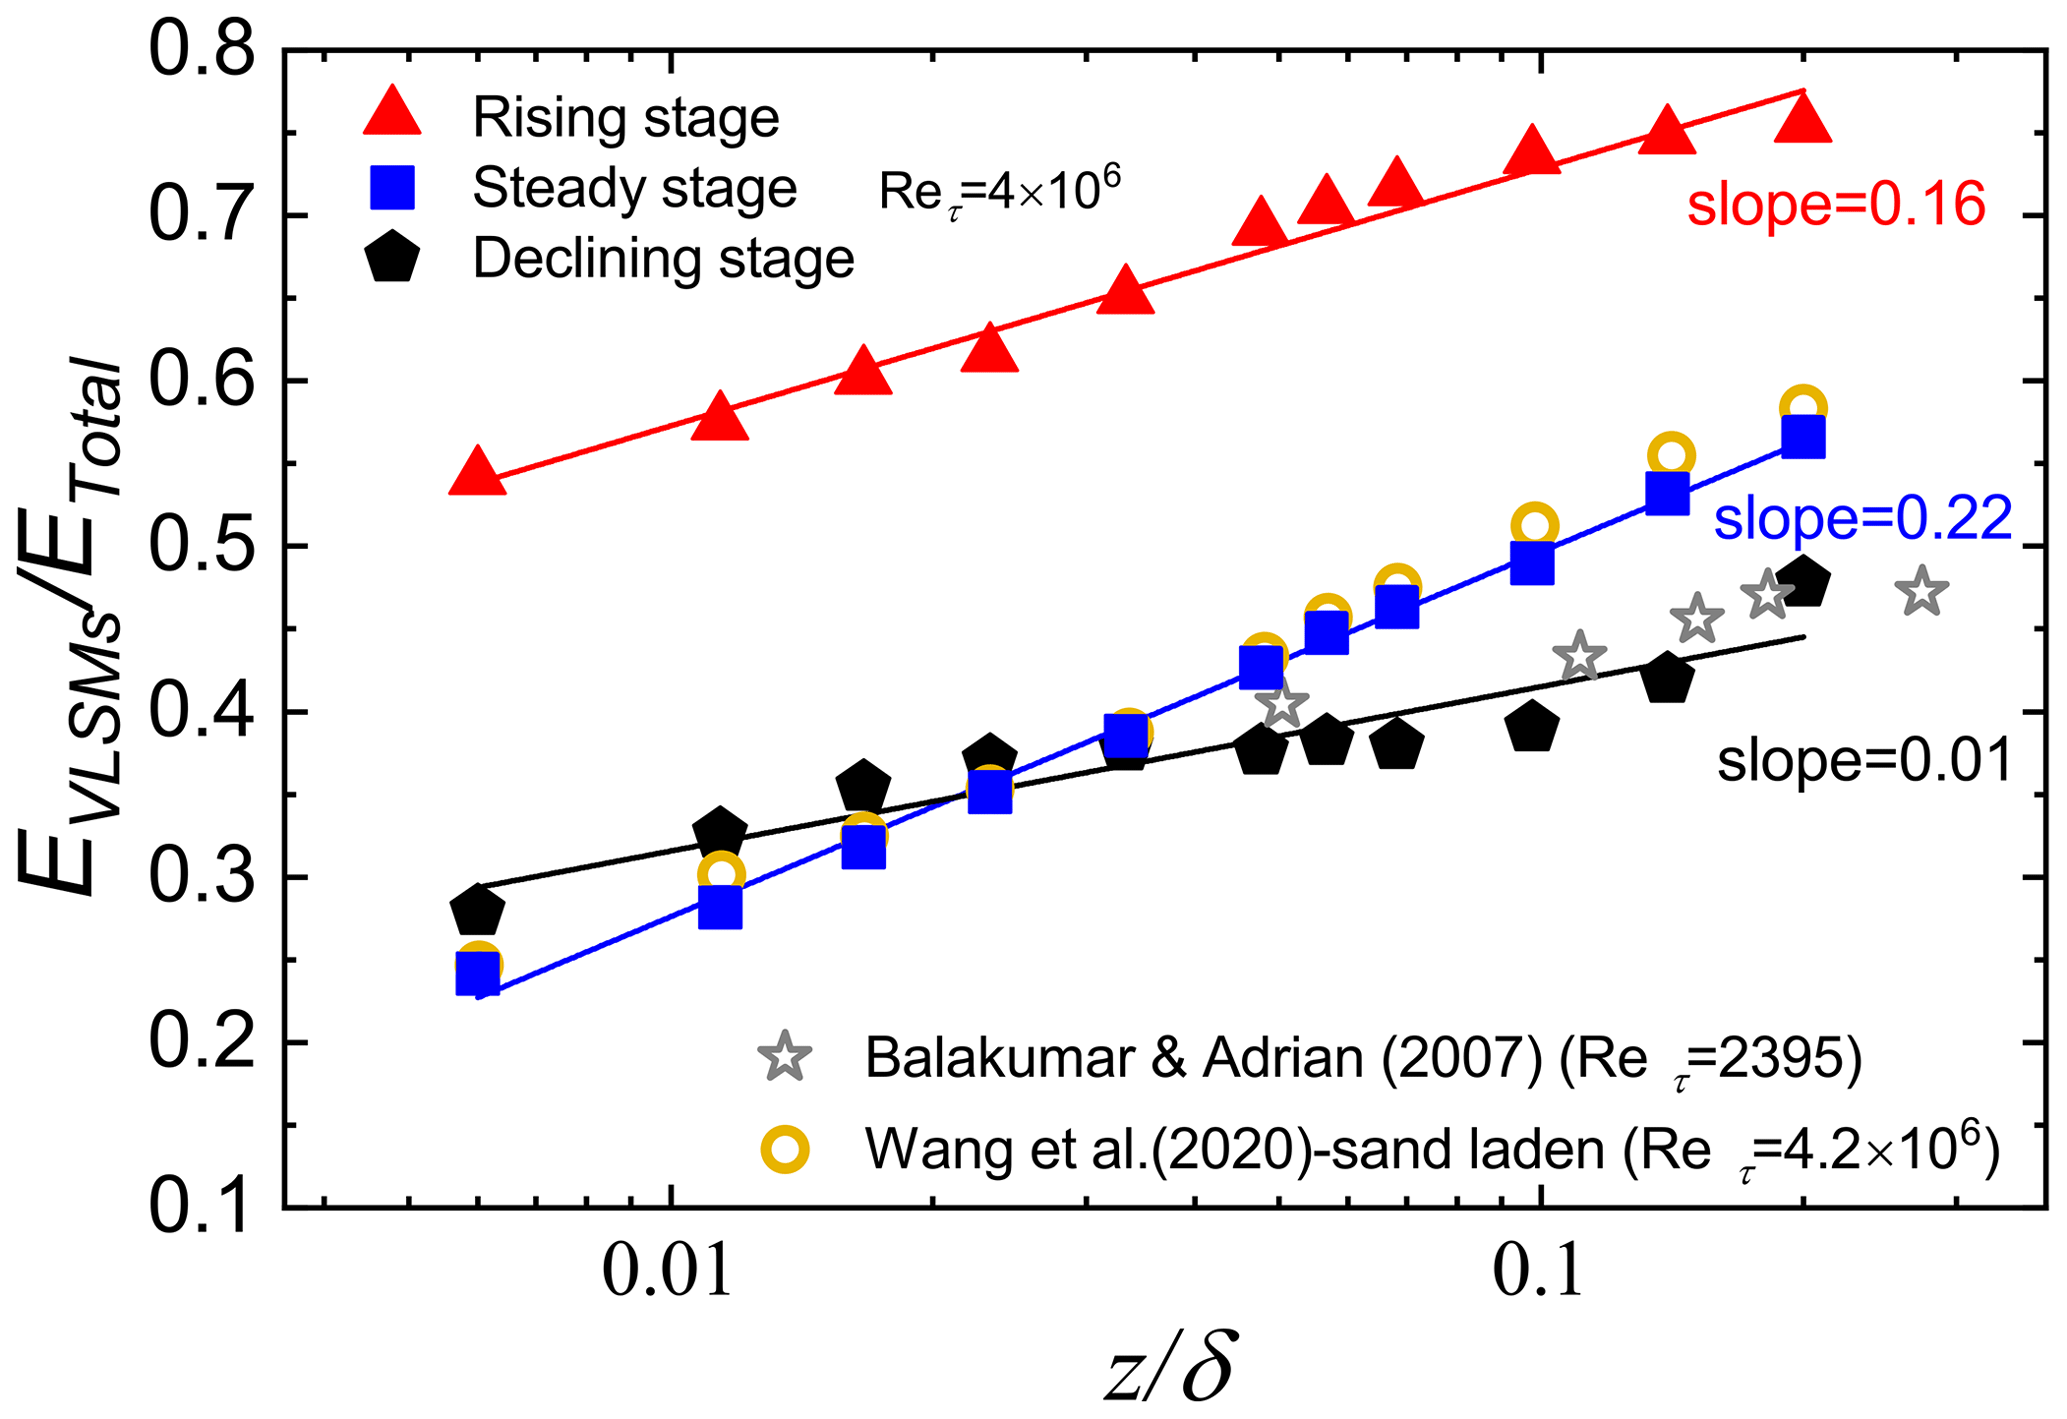
Figure 5Variations in the energy fraction contributed by VLSMs to the total streamwise turbulent kinetic energy with height at different stages of sandstorms. The gray star is the result of Reτ=2395 given by Balakumar and Adrian (2007), and the yellow cycle is the result of sand-laden flow at a similar Reynolds number in Wang et al. (2020).
3.2 Bispectrum
Affected by the cold front transit when a sandstorm occurs, the atmospheric flow in the local area changes dramatically, which could result in gales and unstable atmospheric stratification, and the particles at the surface are carried into the air. Moreover, the cold air mass transfers energy to the local atmosphere (Conrick et al., 2016): some of the energy is used to maintain the wind velocity, some is converted into the kinetic energy of particles, and some disappears through the dissipation effect. It is noted that the process is not only a simple linear transfer but is also accompanied by strong nonlinear interactions. For a fluid mechanical system for which the dynamics are dominated by a set of discrete modes interacting with one another, the bispectrum (an introduction to bispectrum is provided in the Supplement) will provide quantitative information of the relative strength of the various interactions (Helland et al., 1985). Specifically, bispectrum is an important tool for exploring nonlinear interactions corresponding to the nonlinear term ((u⋅∇)u) in the Navier–Stokes (N–S) equations (Hajj et al., 1997).
The bispectra of the streamwise velocity fluctuations in different stages of a sandstorm are shown in Fig. 6a–c. It is seen in Fig. 6a–c that the contour maps of the bispectra in different sandstorm stages are basically the same. The large bispectrum values are concentrated in the low-frequency region. A large bispectrum value represents a strong nonlinear interaction between these frequencies of fluctuations, leading to a breakdown of the structure into smaller scales (Helland et al., 1985; X. L. Liu et al., 2019; Zhu et al., 2020). Therefore, Fig. 6a–c indicate that there is a strong quadratic phase coupling in the low-frequency fluctuations during the sandstorm, which causes the large structures to break down into smaller-scale structures. This presents further evidence for the existence of a top–down mechanism in sandstorms and for the finding that the large coherent structures dominate in the early stages, and as the sandstorms evolve, more small-scale motions are generated. However, the quantitative comparison indicates that the magnitude of the bispectrum is larger in the rising stage than in the steady and declining stages. To highlight the difference in nonlinear interaction at different stages of the sandstorm, Fig. 6d–f show the bispectra of the high-frequency band of the streamwise velocity fluctuations (second-order modes by EMD). There is some indication in Fig. 6d–f that the high-frequency components also present nonlinear coupling of the order of the low-frequency fluctuations in the rising stage of the sandstorm.
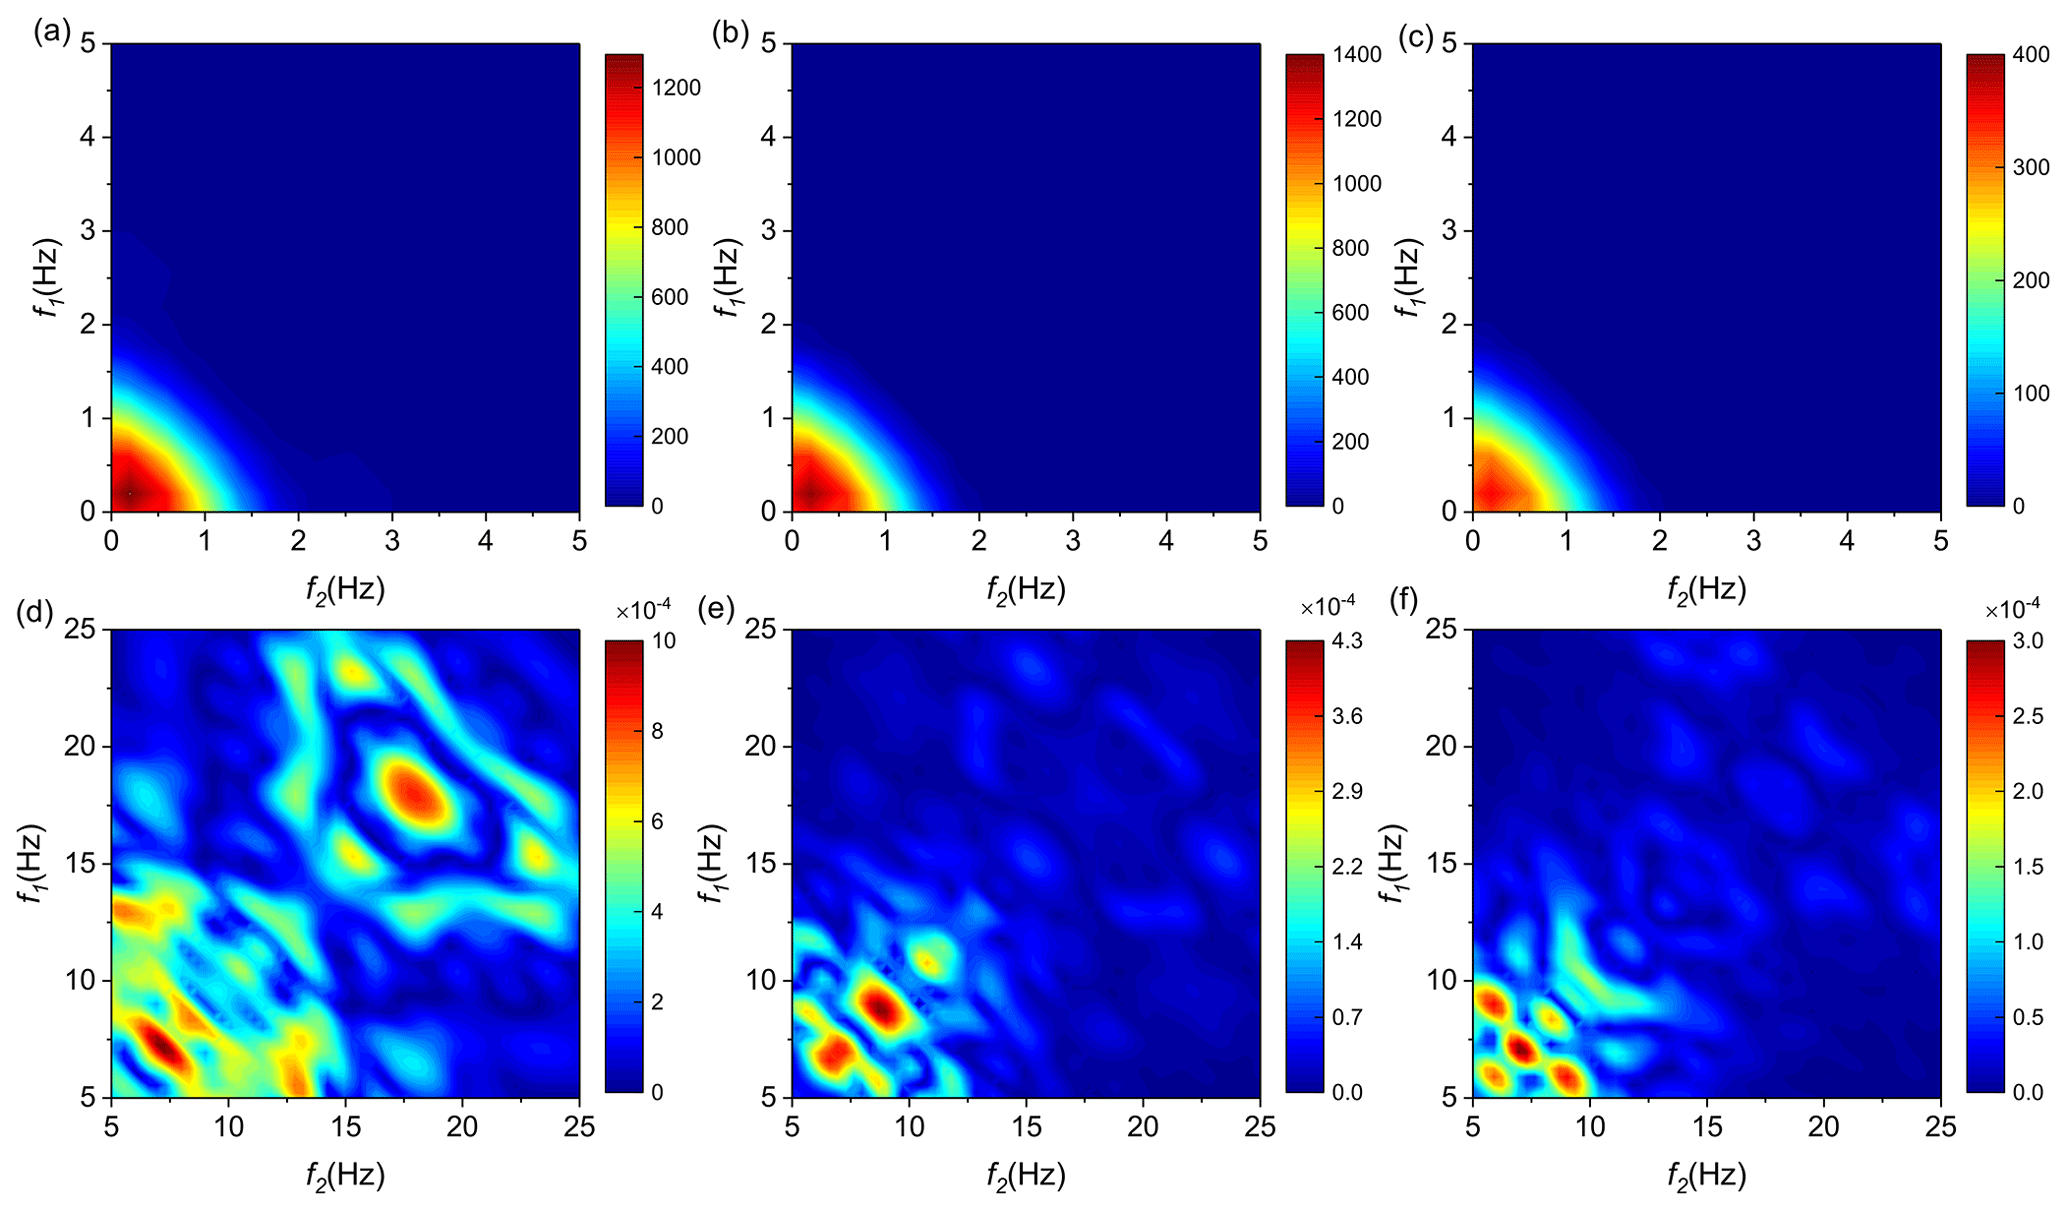
Figure 6Color contour maps of bispectra of the streamwise velocity fluctuations B(f1,f2) at (a) the rising stage, (b) the steady stage, and (c) the declining stage of the sandstorm. Bispectra of the high-frequency band of streamwise velocity fluctuations at (d) the rising stage, (e) the steady stage, and (f) the declining stage.
As an example, the two-dimensional contour map of the evolution of the integral bispectrum with time at the height corresponding to the logarithmic region center (z≈0.06δ) is shown in Fig. 7, which reveals the transfer of nonlinear energy occurring at different frequency components. Figure 7 shows that there are multiple local peaks in the integral bispectrum, and the positive and negative peaks appear alternately at the same moment (as shown by the black dashed line in Fig. 7). This implies that instantaneous nonlinear energy transfer occurs not only from the large scale to the small scale but possibly also to a larger-scale structure, although the energy cascade theory suggests that the overall energy is transferred from a large-scale to a small-scale vortex (Richardson, 1922). In addition, the peak of the integral bispectrum is significant in the rising stage, and with the evolution of time, the peak gradually weakens in the following steady and declining stages. Since LSMs and VLSMs (with streamwise length scales larger than 0.3δ nominally; Balakumar and Adrian, 2007; Heisel et al., 2018) contribute a substantial portion of the turbulent kinetic energy and thus are dominant in sandstorms, to explore the corresponding nonlinear energy transfer occurring in these large structures, the cutoff frequency associated with the LSMs and VLSMs is denoted in Fig. 7. The level of turbulence intensity (i.e., fluctuations compared to the mean wind value) is less than 0.1 at most of the position in the entire sandstorm process, which justifies the approximation of Taylor’s hypothesis (Lin, 1953). Therefore, the cutoff frequency is converted from the corresponding wavelength of λ=0.3δ by Taylor’s hypothesis of frozen turbulence. It is seen that the obvious peaks of integral bispectrum are mostly concentrated in the low-frequency region below the dashed line. This indicates that LSMs and VLSMs exhibit a significant nonlinear energy transfer at the rising stage of the sandstorm, and the energy transfer gradually weakens when the sandstorm develops steadily and finally attenuates. In other words, Fig. 7 suggests that the LSMs and VLSMs are not only significant energetic structures but also active structures that transfer strong nonlinear energy. The intrusion of cold air causes the convection with the local atmosphere. In this process, the quadratic phase coupling makes the large-scale fluctuations break into smaller-scale motions, which enhances the nonlinear energy transfer between different scales. After the cold front transit, the main mechanism of maintaining wind velocity is the momentum transport downward (Todd et al., 2008; Kaskaoutis et al., 2015), which weakens the nonlinear interaction. In the declining stage, the influence of the cold front transit on the observation area gradually disappears; that is, the energy brought by the cold air mass is almost exhausted, and the wind velocity gradually decreases, which makes the nonlinear energy transfer weaker.
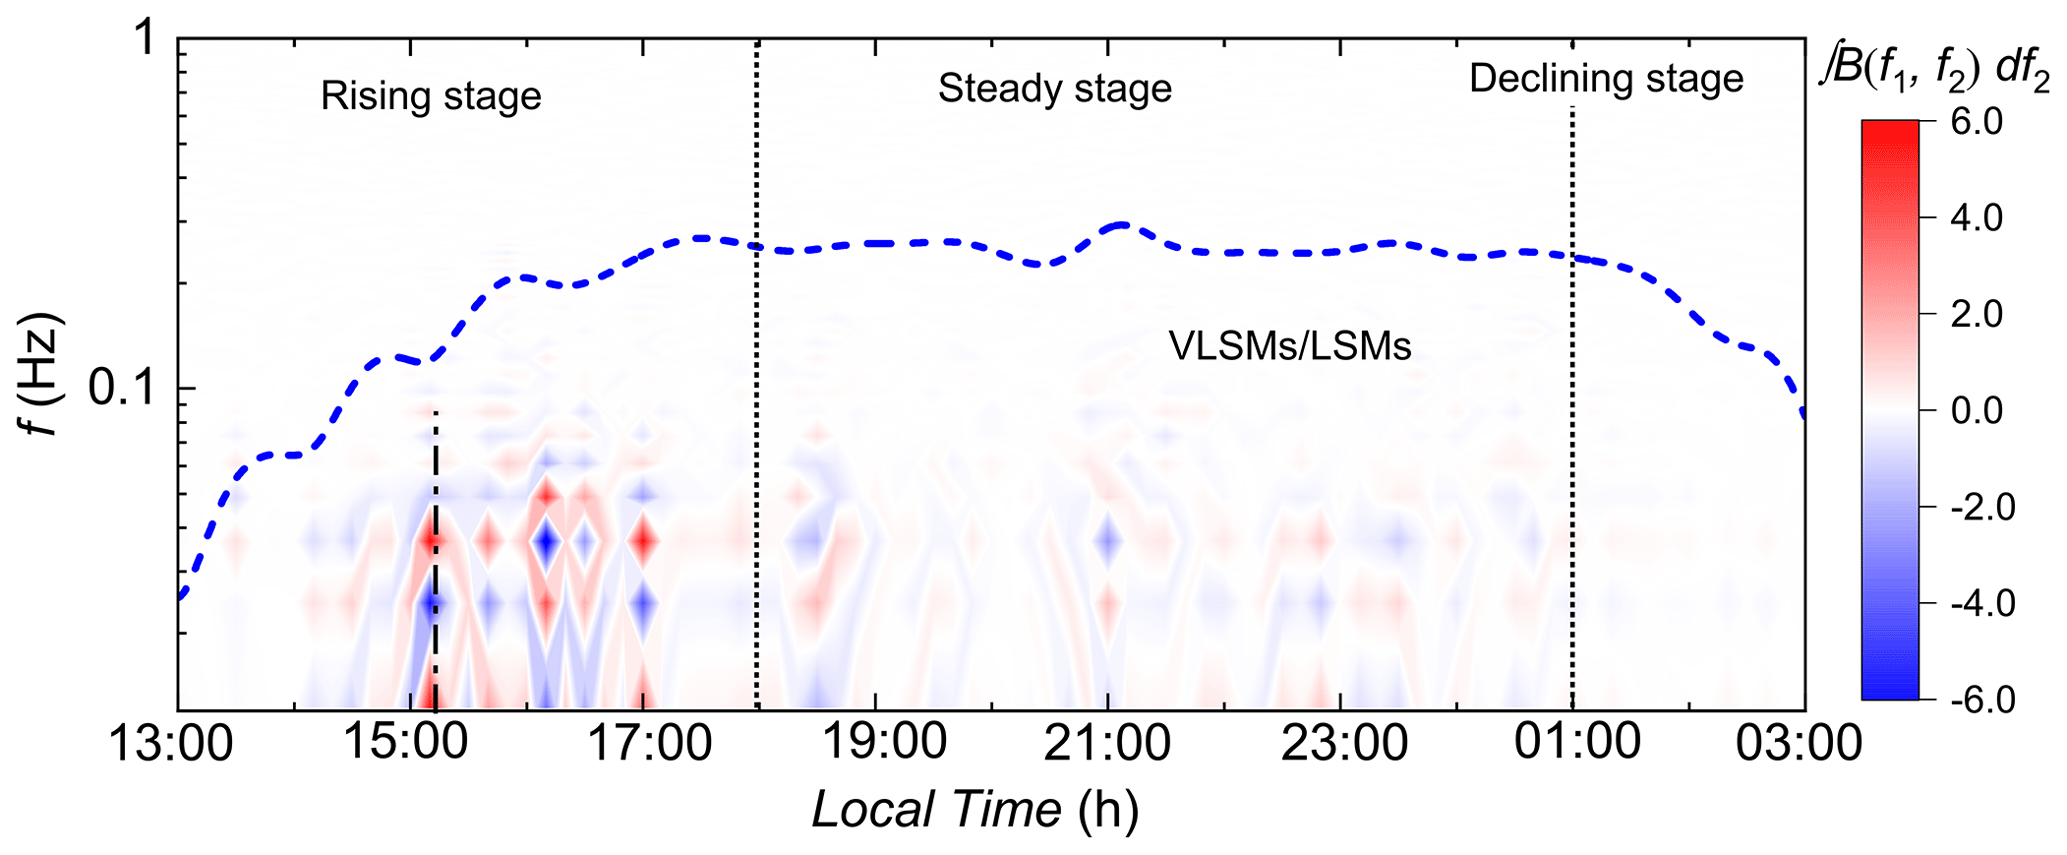
Figure 7Two-dimensional contour map of the evolution of the integral bispectrum with time at the height 8.5 m, where the height 8.5 m corresponds to the logarithmic region center and the blue dashed line represents the cutoff frequency converted from the wavelength of λ=0.3δ associated with the LSMs and VLSMs.
The integral bispectrum shown in Fig. 7 is integrated again in the region below and above the blue dashed line to obtain the total nonlinear interaction occurring in LSMs and VLSMs and small-scale structures (λ<0.3δ), respectively. The resulting integral bispectra at different heights are shown in Fig. 8, where Fig. 8a shows the evolution of the total nonlinear energy of LSMs and VLSMs (for all bispectrum integral) with time; Fig. 8b and c show the nonlinear energy input and output, respectively, at heights of 0.9–30 m near the surface (for the positive and negative bispectra integral, respectively). Similarly, Fig. 8d shows the total nonlinear energy transfer of small scales at different heights, and Fig. 8e and f show the nonlinear energy input and output, respectively.
Figure 8a shows that the integral bispectra value of LSMs and VLSMs is relatively large and is positive during the rising stage of the sandstorm, which means that the LSMs and VLSMs gain energy from the nonlinear interaction. In the steady and declining stages, the integral bispectra value fluctuates around zero. That is, after the sandstorm gains energy in the rising stage and develops to a steady state, the energy maintains a balanced budget during the weakened nonlinear interaction process. Furthermore, when integrating the positive and negative bispectra values separately, Fig. 8b and c show that the absolute values of the input and output energy from the nonlinear interaction increase with height, but the increasing trend becomes less noticeable with the increased height. A plausible explanation for the varying bispectra values with height can be derived from the LSM and VLSM production mechanism. The LSMs and VLSMs in the ASL are dominated by the top–down mechanism. The larger synoptic-scale fluctuations input energy into the upper boundary layer and break down due to a strong quadratic phase coupling with downward transmission, which causes the nonlinear energy transfer between different scales to be more active. With decreasing height, the influence of the top–down mechanism gradually weakened, resulting in the decreased degree of nonlinear interaction.
For the nonlinear energy transfer of the small-scale motions (λ<0.3δ), Fig. 8d shows that the integral bispectra value in the rising stage is much larger (implying a more significant nonlinear interaction) than that in the steady and declining stages, but these values only fluctuate around zero. This indicates that the nonlinear interaction process does not change the energy budget of small-scale motions during the entire sandstorm process. It is noted that the measured small-scale motions in the ASL correspond to the inertial subregion in the power spectra of the streamwise velocity fluctuations (Wang and Zheng, 2016). Since the limitation of the spatial and temporal resolution of the sonic anemometer in ASL observations, the minimum scale of the vortex that can be measured is approximately , which is much larger than the viscous dissipation scale. Therefore, the energy dissipation is not shown in Fig. 8d. Similarly, Fig. 8e and f also show the results by integrating the positive and negative bispectra values separately in the small-scale motions. It is seen in Fig. 8e and f that the absolute value of nonlinear energy input and output decreases with height, which is contrary to the phenomenon of the LSMs and VLSMs. This may be due to the bottom–up mechanism dominating the small-scale motions; that is, the small-scale structures originate from the self-organization process of hairpin vortices (or a quasi-streamwise vortex) near the wall (Dennis, 2015).
In addition, by summarizing the phenomenon shown in Fig. 8b, c, e, and f, it is found that the overall integral bispectrum value being positive is a phenomenon unique to the rising stage of sandstorms, and the monotonic decrease in the absolute value of positive or negative bispectrum integrals with time is a unique phenomenon in the declining stage of sandstorms. Therefore, a new criterion for dividing the sandstorm into different stages may be presented, that is, when the overall integral bispectra value is positive, which is the rising stage of the sandstorm, and when the bispectra absolute value integral decreases monotonically with time, which is the declining stage of the sandstorm.
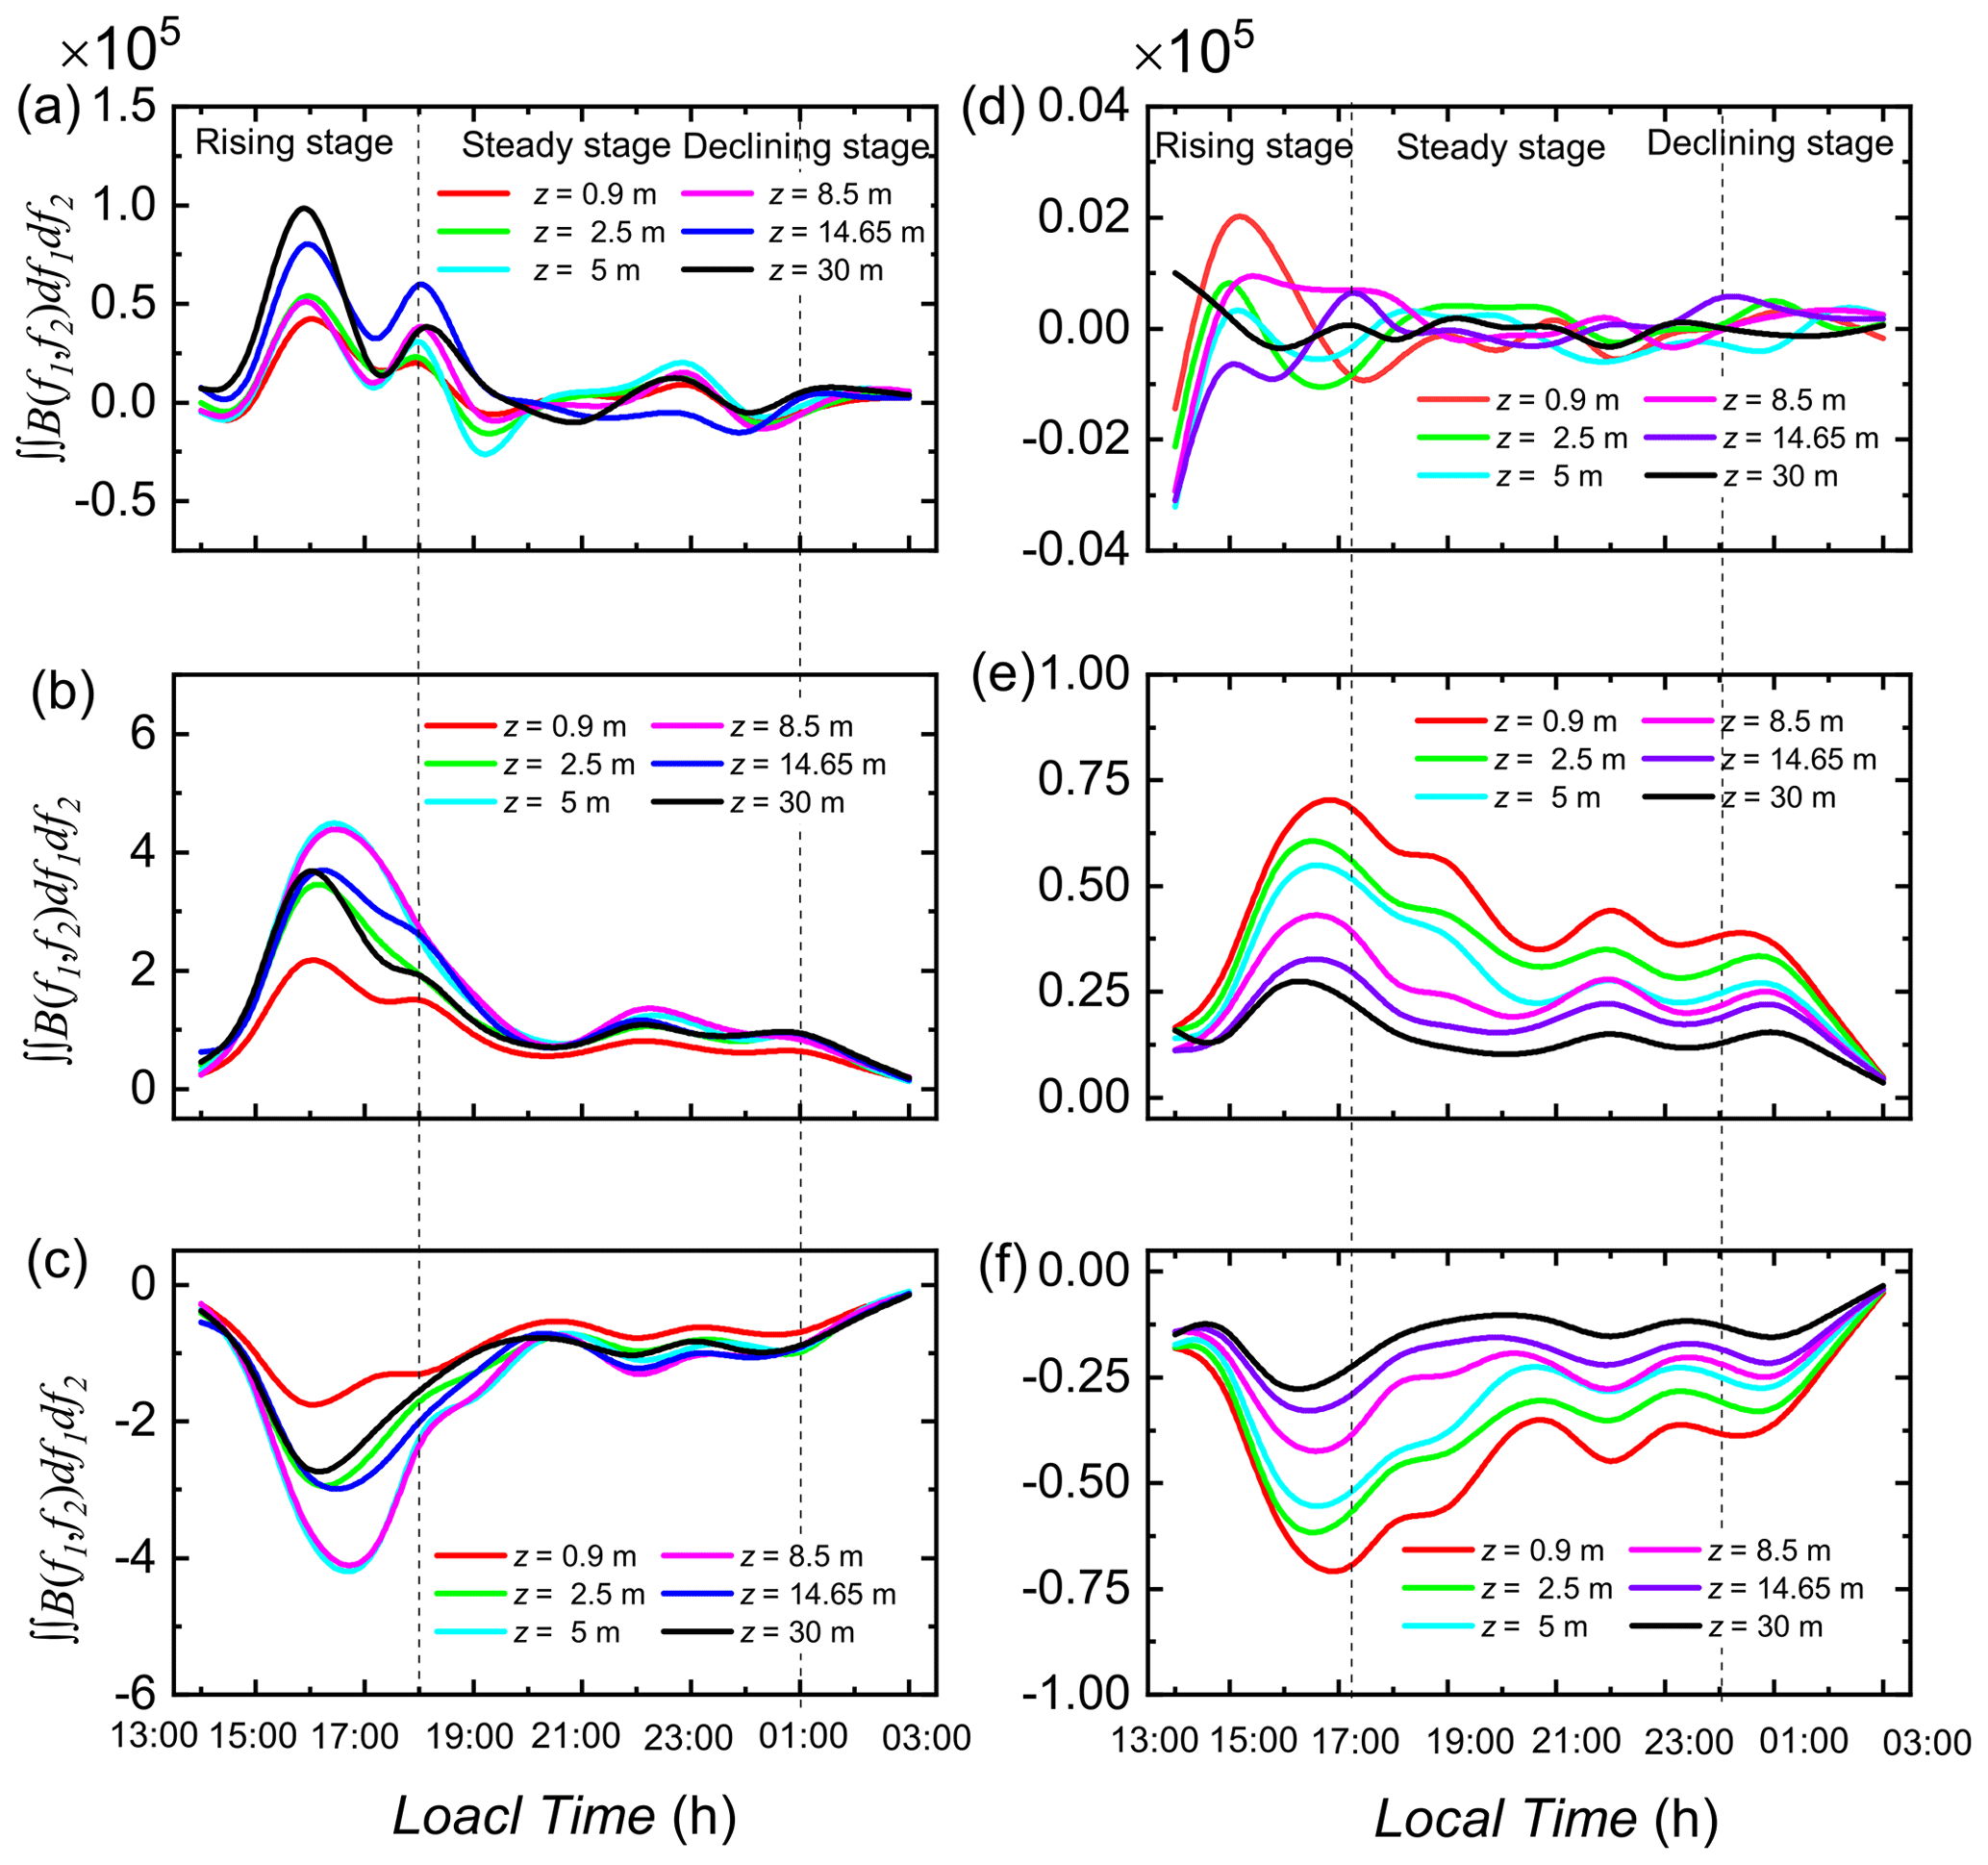
Figure 8Evolution of the total integral bispectra. (a–c) Evolution of the total integral bispectra for LSMs and VLSMs at different heights: (a) the overall bispectra integrals; (b) positive and (c) negative bispectra integrals. (d–f) Evolution of the total integral bispectra for small-scale motions (λ<0.3δ, Wang and Zheng, 2016) at different heights, where the settings of (d)–(f) are similar to those of (a)–(c).
The positive and negative integral bispectra for LSMs and VLSMs and small scales at different stages are averaged to investigate the variations in the average integral bispectrum with the height, as shown in Fig. 9, where Fig. 9a shows the LSM and VLSM results and Fig. 9b shows the small-scale motion results. As expected, the absolute of the average integral bispectra for LSMs and VLSMs exhibits a gradually slowing increase with height; i.e., the increase in the average integral bispectra is pronounced near the surface and appears to level off as the center of the logarithmic region (z≈0.06δ) is approached in the rising and steady stages. The positive values of the average integral bispectra are larger than the negative values at all heights in the rising stage, which is more significant at higher heights, indicating an LSM and VLSM energy gain from the nonlinear interaction. This provides support for the state in which the cold air mass transfers energy to the local atmosphere to increase the wind velocity and converts it into kinetic energy and confirms the conclusion that the top–down mechanism is dominant for LSMs and VLSMs from a quantitative perspective. However, the average integral bispectra remain basically unchanged with height in the declining stage, which indicates a weakened top–down mechanism. In contrast, Fig. 9b shows that the absolute value of the average integral bispectra for small-scale motions decrease approximately log-linearly with height, which provides evidence for the bottom–up mechanism for small-scale structures. The absolute values of the positive and negative average integral bispectra show good agreement at all of the stages, indicating a balanced budget of energy of small-scale motions from the nonlinear interaction during the entire sandstorm process.
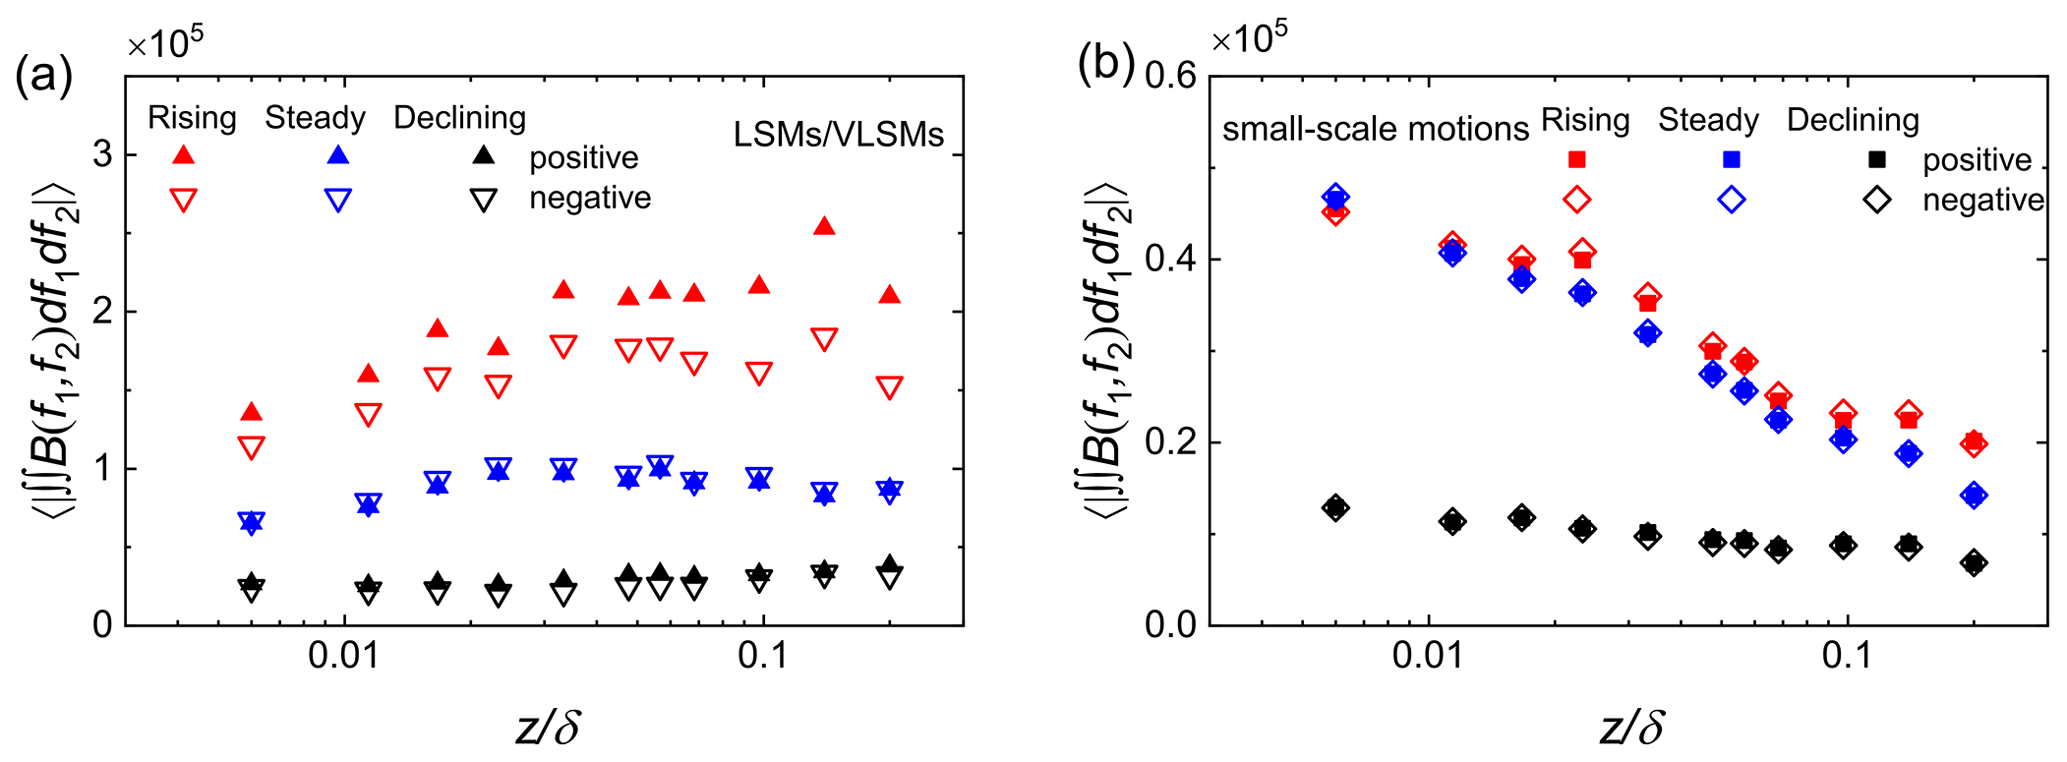
Figure 9Variations in the average integral bispectra. (a) Results for the LSMs and VLSMs and (b) for the small-scale motions (λ<0.3δ). Red, blue, and black symbols represent the rising, steady, and declining stages, respectively; solid symbols denote the positive values of the average integral bispectra, and hollow symbols are the negative values.
Combined with the previously documented reports on sandstorms from the perspective of meteorology, the dynamic characteristics in the entire sandstorm process can thus be summarized. The larger synoptic-scale fluctuations input energy into the upper boundary layer. This heralds the beginning of a sandstorm. With the sandstorm occurring, the cold air would sink close to the surface (Dragani, 1999; Zhao et al., 2020). In this process, there is a strong quadratic phase coupling in the low-frequency fluctuations, which causes a large number of synoptic-scale fluctuations to gradually break into large turbulent structures accompanied by downward transmission (top–down mechanism leading to the VLSM energy increases along the height) and enhances the nonlinear energy transfer. At the same time, the surface disturbance creates a hairpin vortex; with the stretching of the old hairpin vortex and the generation of new hairpin vortices, larger-scale coherent structures are formed (the basic idea of the hairpin vortex packet model in Adrian et al., 2000, bottom–up mechanism). These two mechanisms lead to the energetic structures being dominated by LSMs and VLSMs in the rising stage of sandstorms. As the wind velocity increases, the shearing breaking is enhanced, resulting in the reduced scale of the near-surface structures. After full development, the entire area is completely filled with cold air and the wind velocity is stable. The steady stage is mainly dominated by turbulent motions satisfying the attached eddy hypothesis (Townsend, 1976), and the flow properties are similar to other laboratory experiments. With the momentum transport downward (Todd et al., 2008; Kaskaoutis et al., 2015, top–down mechanism), the shearing breaking of large turbulent structures leads to the reduced VLSM energy fraction and the weakened nonlinear interaction. The coupled effects of the attached eddy and the momentum transport downward make the energy fraction of VLSMs increase more dramatically with height. During the declining stage, the quick dissipation of sandstorm energy would occur due to interactions of sand–air two-phase flows with the action of vortices. The exhausted energy brought by the cold air mass leads to the reduced wind velocity, and thus the flow structures, especially the large structures, are difficult to maintain, making the nonlinear interaction weaker. The energy gradually concentrates toward small-scale motions and finally dissipates.
This work studies the evolution of turbulent characteristics during an entire sandstorm process and establishes a relationship between turbulent characteristics and the macro-dynamic characteristics in meteorology. It is a new perspective for further insight into sandstorms, and thus needs more systematic and comprehensive research, such as other turbulence characteristics including the morphology and dynamics of turbulent structures and the interaction between multi-scale turbulent motions, rather than just energy. Moreover, experimental uncertainties are inevitably associated with these ASL measurements; however, it appears that the ASL measurements can be used as a representation of the very high Reynolds number behavior.
To investigate the entire sandstorm process (including the rising stage, the steady stage, and the declining stage), i.e., a typical complex non-stationary wind-blown-sand two-phase flow, an adaptive stationary segmentation method based on the IST index and the EMD is proposed, and this method is applied to separate the wind velocity series of a sandstorm. On this basis, the pre-multiplied spectra and bispectrum are obtained from the streamwise velocity fluctuations during the sandstorm.
In the rising stage of the sandstorm, the large coherent structures originally exist rather than gradually forming. The energetic structure in the flow field is dominated by VLSMs, and the turbulent kinetic energy fraction of the VLSMs may reach up to 75 % (at ), which is much larger than the previously documented results in both the laboratory turbulent boundary layer and the ASL. In addition to carrying a substantial portion of energy, the LSMs and VLSMs are active structures with strong nonlinear interactions, which are supported by the bispectrum analysis. The nonlinear coupling effect is more significant in the rising stage than in the steady and declining stages. Moreover, through integration, it is found that the overall bispectrum of LSMs and VLSMs is positive; that is, the nonlinear energy input is greater than the energy output, which becomes more significant with the increasing height. Thus, the large coherent structures gain energy from the nonlinear interaction in the rising stage to increase the wind velocity and transform it into kinetic energy.
In the steady stage, there is still quadratic phase coupling in the low-frequency large-scale fluctuations, but it is relatively weaker than that in the rising stage. The weakened nonlinear interaction process does not change the energy budget of turbulent motions of different scales. In addition, the results of the pre-multiplied energy spectrum agree well with the existing results in the laboratory turbulent boundary layer and the ASL, which confirms the reliability of the analysis method proposed in this study.
During the declining stage, the wind velocity decreases, and the VLSMs cannot retain their coherence. The energy fraction of VLSMs is the smallest during the sandstorm, accounting for only approximately 40 % (at ) of the total kinetic energy, and the growth rate of the energy fraction with height is lower than that in the other stages. Moreover, the nonlinear interaction of multi-scale turbulent motions decreases monotonically with time.
The data that support the findings of this study are available in the Zenodo data repository (https://doi.org/10.5281/zenodo.6459518, Liu et al., 2021). Additional data related to this paper and the codes may be requested from the authors.
The supplement related to this article is available online at: https://doi.org/10.5194/acp-22-8787-2022-supplement.
XZ designed and organized the research and its approach. HL analyzed the results, wrote the paper, and carefully modified the paper. YS carried out the field observations, analyzed the data, and performed the spectrum calculations. All authors contributed to the paper.
The contact author has declared that neither they nor their co-authors have any competing interests.
Publisher’s note: Copernicus Publications remains neutral with regard to jurisdictional claims in published maps and institutional affiliations.
This study was supported by grant from the National Natural Science Foundation of China (92052202). The authors would like to express their sincere appreciation for the support.
This research has been supported by the National Natural Science Foundation of China (grant no. 92052202).
This paper was edited by Peter Haynes and reviewed by Hosein Foroutan and one anonymous referee.
Adrian, R. J., Meinhart, C. D., and Tomkins, C. D.: Vortex organization in the outer region of the turbulent boundary layer, J. Fluid Mech., 422, 1–54, https://doi.org/10.1017/s0022112000001580, 2000. a, b, c, d
Amanollahi, J., Kaboodvandpour, S., Qhavami, S., and Mohammadi, B.: Effect of the temperature variation between Mediterranean Sea and Syrian deserts on the dust storm occurrence in the western half of Iran, Atmos. Res., 154, 116–125, https://doi.org/10.1016/j.atmosres.2014.11.003, 2015. a
Balachandar, S. and Eaton, J. K.: Turbulent Dispersed Multiphase Flow, Annu. Rev. Fluid Mech., 42, 111–133, https://doi.org/10.1146/annurev.fluid.010908.165243, 2010. a
Balakumar, B. J. and Adrian, R. J.: Large- and very-large-scale motions in channel and boundary-layer flows, Philos. T. R. Soc. A, 365, 665–681, https://doi.org/10.1098/rsta.2006.1940, 2007. a, b, c, d, e, f
Cheng, X. L., Zeng, Q. C., and Hu, F.: Characteristics of gusty wind disturbances and turbulent fluctuations in windy atmospheric boundary layer behind cold fronts, J. Geophys. Res-Atmos., 116, D06101, https://doi.org/10.1029/2010jd015081, 2011. a
Chokani, N.: Nonlinear evolution of Mack modes in a hypersonic boundary layer, Phys. Fluids, 17, 014102, https://doi.org/10.1063/1.1825471, 2005. a, b
Conrick, R., Curtis, N. L., Staten, P. W., and Kirkpatrick, C.: The relationships between temperature gradient and wind during cold frontal passages in the eastern United States: a numerical modeling study, Atmos. Sci. Lett., 17, 339–345, https://doi.org/10.1002/asl.663, 2016. a
Dennis, D. J. C.: Coherent structures in wall-bounded turbulence, An. Acad. Bras. Cienc., 87, 1161–1193, https://doi.org/10.1590/0001-3765201520140622, 2015. a
Dickey, D. A. and Fuller, W. A.: Likelihood ratio statistics for autoregressive time-series with a unit-root, Econometrica, 49, 1057–1072, https://doi.org/10.2307/1912517, 1981. a
Dragani, W. C.: A feature model of surface pressure and wind fields associated with the passage of atmospheric cold fronts, Comput. Geosci., 25, 1149–1157, https://doi.org/10.1016/s0098-3004(99)00074-6, 1999. a, b, c
Favre, A., Gaviglio, J., and Dumas, R. J.: Space-time double correlations and spectra in a turbulent boundary layer, J. Fluid Mech., 2, 313–342, https://doi.org/10.1017/S0022112057000166, 1957. a, b
Flandrin, P., Rilling, G., and Goncalves, P.: Empirical mode decomposition as a filter bank, IEEE Signal Proc. Let., 11, 112–114, https://doi.org/10.1109/lsp.2003.821662, 2004. a
Foken, T., Göockede, M., Mauder, M., Mahrt, L., Amiro, B., and Munger, W.: Post-Field Data Quality Control, Handbook of Micrometeorology: A Guide for Surface Flux Measurement and Analysis, 1st edn., edited by: Lee, X., Massman, W., and Law, B., Springer Netherlands, Dordrecht, Online ISBN 978-1-4020-2265-4, Print ISBN is 978-1-4020-2265-4. https://doi.org/10.1007/1-4020-2265-4_9, 2004. a, b, c
Formenti, P., Caquineau, S., Desboeufs, K., Klaver, A., Chevaillier, S., Journet, E., and Rajot, J. L.: Mapping the physico-chemical properties of mineral dust in western Africa: mineralogical composition, Atmos. Chem. Phys., 14, 10663–10686, https://doi.org/10.5194/acp-14-10663-2014, 2014. a
Gabor, D.: Theory of communication. Part 1: The analysis of information, J. Inst. Elect. Eng. III: Radio Commun. Eng., 93, 429–441, https://doi.org/10.1049/ji-3-2.1946.0074, 1946. a
Garcia-Pando, C. P., Stanton, M. C., Diggle, P. J., Trzaska, S., Miller, R. L., Perlwitz, J. P., Baldasano, J. M., Cuevas, E., Ceccato, P., Yaka, P., and Thomson, M. C.: Soil Dust Aerosols and Wind as Predictors of Seasonal Meningitis Incidence in Niger, Environ. Health Perspect., 122, 679–686, https://doi.org/10.1289/ehp.1306640, 2014. a
Gasch, P., Rieger, D., Walter, C., Khain, P., Levi, Y., Knippertz, P., and Vogel, B.: Revealing the meteorological drivers of the September 2015 severe dust event in the Eastern Mediterranean, Atmos. Chem. Phys., 17, 13573–13604, https://doi.org/10.5194/acp-17-13573-2017, 2017. a
Gautam, R., Hsu, N. C., Lau, W. K. M., and Yasunari, T. J.: Satellite observations of desert dust-induced Himalayan snow darkening, Geophys. Res. Lett., 40, 988–993, https://doi.org/10.1002/grl.50226, 2013. a
Goudie, A. S.: Desert dust and human health disorders, Environ. Int., 63, 101–113, https://doi.org/10.1016/j.envint.2013.10.011, 2014. a
Gu, Z., He, Y., Zhang, Y., Su, J., Zhang, R., Yu, C. W., and Zhang, D.: An Overview of Triggering Mechanisms and Characteristics of Local Strong Sandstorms in China and Haboobs, Atmosphere, 12, 752, https://doi.org/10.3390/atmos12060752, 2021. a
Hajj, M. R., Miksad, R. W., and Powers, E. J.: Perspective: Measurements and analyses of nonlinear wave interactions with higher-order spectral moments, J. Fluid Eng-T. Asme., 119, 3–13, https://doi.org/10.1115/1.2819116, 1997. a
Hamzeh, N. H., Karami, S., Opp, C., Fattahi, E., and Jean-François, V.: Spatial and temporal variability in dust storms in the Middle East, 2002–2018: three case studies in July 2009, Arab. J. Geosci., 14, 538, https://doi.org/10.1007/s12517-021-06859-0, 2021. a, b
Heisel, M., Dasari, T., Liu, Y., Hong, J., Coletti, F., and Guala, M.: The spatial structure of the logarithmic region in very-high-Reynolds-number rough wall turbulent boundary layers, J. Fluid Mech., 857, 704–747, https://doi.org/10.1017/jfm.2018.759, 2018. a, b
Helfer, K. C. and Nuijens, L.: The Morphology of Simulated Trade-Wind Convection and Cold Pools Under Wind Shear, J. Geophys. Res-Atmos., 126, e2021JD035148, https://doi.org/10.1029/2021JD035148, 2021. a, b
Helland, K. N., Itsweire, E. C., and Lii, K. S.: A Program for the Computation of Bispectra with Application To Spectral Energy-Transfer in Fluid Turbulence, Adv. Eng. Softw., 7, 22–27, https://doi.org/10.1016/0141-1195(85)90089-0, 1985. a, b
Hogstrom, U.: Non-dimensional wind and temperature profiles in the atmospheric surface-layer-a re-evaluation, Bound-Lay. Meteorol., 42, 55–78, https://doi.org/10.1007/bf00119875, 1988. a
Hu, T., Wu, D., Li, Y., and Wang, C.: The Effects of Sandstorms on the Climate of Northwestern China, Adv. Meteorol., 2017, 4035609, https://doi.org/10.1155/2017/4035609, 2017. a
Huang, J., Zou, Z., Zeng, Q., Li, P., Song, J., Wu, L., Zhang, J. A., Li, S., and Chan, P.-W.: The Turbulent Structure of the Marine Atmospheric Boundary Layer during and before a Cold Front, J. Atmos. Sci., 78, 863–875, https://doi.org/10.1175/jas-d-19-0314.1, 2021. a
Huang, N. E., Shen, Z., Long, S. R., Wu, M. L. C., Shih, H. H., Zheng, Q. N., Yen, N. C., Tung, C. C., and Liu, H. H.: The empirical mode decomposition and the Hilbert spectrum for nonlinear and non-stationary time series analysis, P. Roy. Soc. A-Math. Phy., 454, 903–995, https://doi.org/10.1098/rspa.1998.0193, 1998. a, b
Huang, N. E., Wu, M.-L. C., Long, S. R., Shen, S. S. P., Qu, W., Gloersen, P., and Fan, K. L.: A confidence limit for the empirical mode decomposition and Hilbert spectral analysis, P. Roy. Soc. A-Math. Phy., 459, 2317–2345, https://doi.org/10.1098/rspa.2003.1123, 2003. a
Hunt, J. C. R. and Morrison, J. F.: Eddy structure in turbulent boundary layers, Eur. J. Mech. B-Fluid, 19, 673–694, https://doi.org/10.1016/s0997-7546(00)00129-1, 2000. a
Hutchins, N. and Marusic, I.: Evidence of very long meandering features in the logarithmic region of turbulent boundary layers, J. Fluid Mech., 579, 1–28, https://doi.org/10.1017/s0022112006003946, 2007. a, b, c, d
Hutchins, N., Chauhan, K., Marusic, I., Monty, J., and Klewicki, J.: Towards Reconciling the Large-Scale Structure of Turbulent Boundary Layers in the Atmosphere and Laboratory, Bound-Lay. Meteorol., 145, 273–306, https://doi.org/10.1007/s10546-012-9735-4, 2012. a, b, c, d
Kaskaoutis, D. G., Rashki, A., Houssos, E. E., Mofidi, A., Goto, D., Bartzokas, A., Francois, P., and Legrand, M.: Meteorological aspects associated with dust storms in the Sistan region, southeastern Iran, Clim. Dynam., 45, 407–424, https://doi.org/10.1007/s00382-014-2208-3, 2015. a, b, c
Kim, K. C. and Adrian, R. J.: Very large-scale motion in the outer layer, Phys. Fluids, 11, 417–422, https://doi.org/10.1063/1.869889, 1999. a, b
Kosmopoulos, P. G., Kazadzis, S., Taylor, M., Athanasopoulou, E., Speyer, O., Raptis, P. I., Marinou, E., Proestakis, E., Solomos, S., Gerasopoulos, E., Amiridis, V., Bais, A., and Kontoes, C.: Dust impact on surface solar irradiance assessed with model simulations, satellite observations and ground-based measurements, Atmos. Meas. Tech., 10, 2435–2453, https://doi.org/10.5194/amt-10-2435-2017, 2017. a
Kunkel, G. J. and Marusic, I.: Study of the near-wall-turbulent region of the high-Reynolds-number boundary layer using an atmospheric flow, J. Fluid Mech., 548, 375–402, https://doi.org/10.1017/s0022112005007780, 2006. a
Lavielle, M.: Optimal segmentation of random processes, IEEE Signal Proc. Let., 46, 1365–1373, https://doi.org/10.1109/78.668798, 1998. a
Lawrence, C. R. and Neff, J. C.: The contemporary physical and chemical flux of aeolian dust: A synthesis of direct measurements of dust deposition, Chem. Geol., 267, 46–63, https://doi.org/10.1016/j.chemgeo.2009.02.005, 2009. a
Li, J., Wang, Z., Zhuang, G., Luo, G., Sun, Y., and Wang, Q.: Mixing of Asian mineral dust with anthropogenic pollutants over East Asia: a model case study of a super-duststorm in March 2010, Atmos. Chem. Phys., 12, 7591–7607, https://doi.org/10.5194/acp-12-7591-2012, 2012. a
Li, W. Y.: Statistical quantification of the local daily surface meteorological condition’s impact properties on dust storm occurrence: style, intensity, significance, contribution, and decisiveness, taking North and Northwest China as an example, Theor. Appl. Climatol., 143, 403–428, https://doi.org/10.1007/s00704-020-03325-x, 2020. a, b, c
Li, X. L. and Zhang, H. S.: Seasonal variations in dust concentration and dust emission observed over Horqin Sandy Land area in China from December 2010 to November 2011, Atmos, Environ,, 61, 56–65, https://doi.org/10.1016/j.atmosenv.2012.07.007, 2012. a
Lin, C. C.: On Taylor's hypothesis and the acceleration terms in the Navier-Stokes equation, Q. Appl. Math., 10, 295–306, 1953. a
Liu, H. and Zheng, X.: Large-scale structures of wall-bounded turbulence in single- and two-phase flows: advancing understanding of the atmospheric surface layer during sandstorms, Flow, 1, E5, https://doi.org/10.1017/flo.2021.6, 2021. a
Liu, H., Shi, Y., and Zheng, X: Evolution of turbulent kinetic energy during the entire sandstorm process, Zenodo [data set], https://doi.org/10.5281/zenodo.6459518, 2021. a
Liu, H. Y., Bo, T. L., and Liang, Y. R.: The variation of large-scale structure inclination angles in high Reynolds number atmospheric surface layers, Phys. Fluids, 29, 035104, https://doi.org/10.1063/1.4978803, 2017. a
Liu, H. Y., Wang, G. H., and Zheng, X. J.: Amplitude modulation between multi-scale turbulent motions in high-Reynolds-number atmospheric surface layers, J. Fluid Mech., 861, 585–607, https://doi.org/10.1017/jfm.2018.906, 2019. a, b
Liu, X. E., Guo, X. L., and Letters, O. S.: Role of Downward Momentum Transport in the Formation of Severe Surface Winds, Atmos. Ocean Sci. Lett., 5, 379–383, https://doi.org/10.1080/16742834.2012.11447020, 2012. a
Liu, X. L., Yi, S. H., Xu, X. W., Shi, Y., Ouyang, T. C., and Xiong, H. X.: Experimental study of second-mode wave on a flared cone at Mach 6, Phys. Fluids, 31, 074108, https://doi.org/10.1063/1.5103192, 2019. a
Lovett, C., Sowlat, M. H., Saliba, N. A., Shihadeh, A. L., and Sioutas, C.: Oxidative potential of ambient particulate matter in Beirut during Saharan and Arabian dust events, Atmos. Environ., 188, 34–42, https://doi.org/10.1016/j.atmosenv.2018.06.016, 2018. a
Mahowald, N. M., Baker, A. R., Bergametti, G., Brooks, N., Duce, R. A., Jickells, T. D., Kubilay, N., Prospero, J. M., and Tegen, I.: Atmospheric global dust cycle and iron inputs to the ocean, Global Biogeochem. Cy., 19, GB4025, https://doi.org/10.1029/2004gb002402, 2005. a
Martin, R. L. and Kok, J. F.: Wind-invariant saltation heights imply linear scaling of aeolian saltation flux with shear stress, Sci. Adv., 3, e1602569, https://doi.org/10.1126/sciadv.1602569, 2017. a
Marusic, I., McKeon, B. J., Monkewitz, P. A., Nagib, H. M., Smits, A. J., and Sreenivasan, K. R.: Wall-bounded turbulent flows at high Reynolds numbers: Recent advances and key issues, Phys. Fluids, 22, 065103, https://doi.org/10.1063/1.3453711, 2010. a
Metzger, M., McKeon, B., and Arce-Larreta, E.: Scaling the characteristic time of the bursting process in the turbulent boundary layer, Physica D, 239, 1296–1304, https://doi.org/10.1016/j.physd.2009.09.004, 2010. a
Mico, P., Mora, M., Cuesta-Frau, D., and Aboy, M.: Automatic segmentation of long-term ECG signals corrupted with broadband noise based on sample entropy, Comput. Methods Programs Biomed., 98, 118–129, https://doi.org/10.1016/j.cmpb.2009.08.010, 2010. a
Miri, A., Maleki, S., and Middleton, N.: An investigation into climatic and terrestrial drivers of dust storms in the Sistan region of Iran in the early twenty-first century, Sci. Total. Environ., 757, 143952, https://doi.org/10.1016/j.scitotenv.2020.143952, 2021. a
Morlet, J., Arens, G., Fourgeau, E., and Giard, D.: Wave propagation and sampling theory – Part II: Sampling theory and complex waves, Geophysics, 47, 222–236, https://doi.org/10.1190/1.1441329, 1982. a
Nastos, P. T., Kampanis, N. A., Giaouzaki, K. N., and Matzarakis, A.: Environmental impacts on human health during a Saharan dust episode at Crete Island, Greece, Meteorol. Z., 20, 517–529, 2011. a
Oduber, F., Calvo, A. I., Blanco-Alegre, C., Castro, A., Nunes, T., Alves, C., Sorribas, M., Feraandez-Gonzalez, D., Vega-Maray, A. M., Valencia-Barrera, R. M., Lucarelli, F., Nava, S., Calzolai, G., Alonso-Blanco, E., Fraile, B., Fialho, P., Coz, E., Prevot, A. S. H., Pont, V., and Fraile, R.: Unusual winter Saharan dust intrusions at Northwest Spain: Air quality, radiative and health impacts, Sci. Total Environ., 669, 213–228, https://doi.org/10.1016/j.scitotenv.2019.02.305, 2019. a
Potter, R. K.: Visible Speech, Am. Ann. Deaf, 91, 447–452, 1947. a
Richardson, L. F.: Weather Prediction by Numerical Process, 2nd edn., Cambridge University Press, Cambridge, ISBN 9780511618291, https://doi.org/10.1017/CBO9780511618291, 1922. a
Robinson, S. K.: Coherent Motions in the Turbulent Boundary Layer, Annu. Rev. Fluid Mech., 23, 601–639, https://doi.org/10.1146/annurev.fl.23.010191.003125, 1991. a
Said, S. E. and Dickey, D. A.: Testing for unit roots in autoregressive-moving average models of unknown order, Biometrika, 71, 599–607, https://doi.org/10.1093/biomet/71.3.599, 1984. a
Shao, Y. and Dong, C. H.: A review on East Asian dust storm climate, modelling and monitoring, Global Planet. Change, 52, 1–22, https://doi.org/10.1016/j.gloplacha.2006.02.011, 2006. a
Shao, Y. P., Klose, M., and Wyrwoll, K. H.: Recent global dust trend and connections to climate forcing, J. Geophys. Res-Atmos., 118, 11107–11118, https://doi.org/10.1002/jgrd.50836, 2013. a
Soleimani, Z., Teymouri, P., Boloorani, A. D., Mesdaghinia, A., Middleton, N., and Griffin, D. W.: An overview of bioaerosol load and health impacts associated with dust storms: A focus on the Middle East, Atmos. Environ., 223, 117187, https://doi.org/10.1016/j.atmosenv.2019.117187, 2020. a
Todd, M. C., Washington, R., Raghavan, S., Lizcano, G., and Knippertz, P.: Regional model simulations of the Bodele low-level jet of northern Chad during the Bodele Dust Experiment (BoDEx 2005), J. Climate, 21, 995–1012, https://doi.org/10.1175/2007jcli1766.1, 2008. a, b, c
Townsend, A. A.: The structure of turbulent shear flow, 2nd edn., Cambridge, Cambridge University Press, ISBN 0 521 29819 9, 1976. a, b
Vallikivi, M., Ganapathisubramani, B., and Smits, A. J.: Spectral scaling in boundary layers and pipes at very high Reynolds numbers, J. Fluid Mech., 771, 303–326, https://doi.org/10.1017/jfm.2015.181, 2015. a, b, c
Ville, J.: Théorie et applications de la notion de signal analytique, Cables et Transmission, 2, 61–74, 1948. a
Wang, G., Zheng, X., and Tao, J.: Very large scale motions and PM10 concentration in a high-Re boundary layer, Phys. Fluids, 29, 061701, https://doi.org/10.1063/1.4990087, 2017. a, b, c, d, e
Wang, G., Gu, H., and Zheng, X.: Large scale structures of turbulent flows in the atmospheric surface layer with and without sand, Phys. Fluids, 32, 106604, https://doi.org/10.1063/5.0023126, 2020. a, b, c
Wang, G. H. and Zheng, X. J.: Very large scale motions in the atmospheric surface layer: a field investigation, J. Fluid Mech., 802, 464–489, https://doi.org/10.1017/jfm.2016.439, 2016. a, b, c, d, e, f, g
Wilczak, J. M., Oncley, S. P., and Stage, S. A.: Sonic anemometer tilt correction algorithms, Bound-Lay. Meteorol., 99, 127–150, https://doi.org/10.1023/a:1018966204465, 2001. a
Wyngaard, J. C.: Atmospheric turbulence, Annu. Rev. Fluid Mech., 24, 205–233, https://doi.org/10.1146/annurev.fl.24.010192.001225, 1992. a, b
Xu, C., Guan, Q., Lin, J., Luo, H., Yang, L., Tan, Z., Wang, Q., Wang, N., and Tian, J.: Spatiotemporal variations and driving factors of dust storm events in northern China based on high-temporal-resolution analysis of meteorological data (1960–2007), Environ. Pollut., 260, 114084, https://doi.org/10.1016/j.envpol.2020.114084, 2020. a
Yang, L., Hu, Z., Huang, Z., Wang, L., Han, W., Yang, Y., Tao, H., and Wang, J.: Detection of a Dust Storm in 2020 by a Multi-Observation Platform over the Northwest China, Remote Sensing, 13, 1056, https://doi.org/10.3390/rs13061056, 2021. a
Zhan, K., Liu, S., Yang, Z., Fang, E., Zhou, L., Wang, Q., Guo, S., Zhang, J., and Huang, N.: Suspended dust particle characteristics during an sandstorm on 29 February 2008 in Minqin area, China, Aeolian Res., 25, 79–86, https://doi.org/10.1016/j.aeolia.2017.04.002, 2017. a
Zhang, H. and Zheng, X.: Quantifying the large-scale electrification equilibrium effects in dust storms using field observations at Qingtu Lake Observatory, Atmos. Chem. Phys., 18, 17087–17097, https://doi.org/10.5194/acp-18-17087-2018, 2018. a
Zhang, H. and Zhou, Y.-H.: Effects of 3D electric field on saltation during dust storms: an observational and numerical study, Atmos. Chem. Phys., 20, 14801–14820, https://doi.org/10.5194/acp-20-14801-2020, 2020. a
Zhang, H., Zhu, H., Peng, Y., Kang, L., Chen, J., and Soon, U. P.: Experiment on dust flux during dust storm periods over sand desert area, Acta Meteorol. Sin., 22, 239–247, https://doi.org/10.11676/qxxb2007.070, 2007. a
Zhao, J. H., Long, X., Zhang, F., Yang, Y. L., Liu, S. X., and Yun, L.: The role of turbulent coherent structure in sand-dust emissions in a sanddust storm of the middle China-Mongolia regime, Chinese J. Geophys., 63, 3967–3980, https://doi.org/10.6038/cjg2020O0179, 2020. a, b, c
Zheng, X.: Mechanics of Wind-blown Sand Movements, 1st edn., edited by: Allan, R., Forstner, U., and Salomons, W., Springer, Berlin, Heidelberg, Hardcover ISBN 978-3-540-88253-4, Softcover ISBN 978-3-642-09999-1, https://doi.org/10.1007/978-3-540-88254-1, 2009. a
Zheng, X., Zhang, J., Wang, G., Liu, H., and Zhu, W.: Investigation on very large scale motions (VLSMs) and their influence in a dust storm, Sci. China Phys. Mech., 56, 306–314, https://doi.org/10.1007/s11433-012-4985-1, 2013. a
Zhu, W. K., Shi, M. T., Zhu, Y. D., and Lee, C.: Experimental study of hypersonic boundary layer transition on a permeable wall of a flared cone, Phys. Fluids, 32, 011701, https://doi.org/10.1063/1.5139546, 2020. a