the Creative Commons Attribution 4.0 License.
the Creative Commons Attribution 4.0 License.
 | 24 Jun 2022
Transport of substantial stratospheric ozone to the surface by a dying typhoon and shallow convection
Zhixiong Chen
Xiushu Qie
Xugeng Cheng
Yukun Shen
Mengmiao Yang
Rubin Jiang
Xiangke Liu
Stratospheric ozone transported to the troposphere is estimated to account for 5 %–15 % of the tropospheric ozone sources. However, the chances of intruded stratospheric ozone reaching the surface are low. Here, we report an event of a strong surface ozone surge of stratospheric origin in the North China Plain (NCP, 34–40∘ N, 114–121∘ E) during the night of 31 July 2021. The hourly measurements reveal surface ozone concentrations of up to 80–90 ppbv at several cities over the NCP from 23:00 LST (Local Standard time, = UTC +8 h) on 31 July to 06:00 LST on 1 August 2021. The ozone enhancement was 40–50 ppbv higher than the corresponding monthly mean. A high-frequency surface measurement indicates that this ozone surge occurred abruptly, with an increase reaching 40–50 ppbv within 10 min. A concurrent decline in surface carbon monoxide (CO) concentrations suggests that this surface ozone surge might have resulted from the downward transport of a stratospheric ozone-rich and CO-poor air mass. This is further confirmed by the vertical evolutions of humidity and ozone profiles based on radiosonde and satellite data respectively. Such an event of stratospheric impact on surface ozone is rarely documented in view of its magnitude, coverage, and duration.
We find that this surface ozone surge was induced by a combined effect of dying Typhoon In-fa and shallow local mesoscale convective systems (MCSs) that facilitated transport of stratospheric ozone to the surface. This finding is based on analysis of meteorological reanalysis and radiosonde data, combined with high-resolution Weather Research and Forecasting (WRF) simulation and backward trajectory analysis using the FLEXible PARTicle (FLEXPART) particle dispersion model. Although Typhoon In-fa on the synoptic scale was at its dissipation stage when it passed through the NCP, it could still bring down a stratospheric dry and ozone-rich air mass. As a result, the stratospheric air mass descended to the middle-to-low troposphere over the NCP before the MCSs formed. With the pre-existing stratospheric air mass, the convective downdrafts of the MCSs facilitated the final descent of stratospheric air mass to the surface. Significant surface ozone enhancement occurred in the convective downdraft regions during the development and propagation of the MCSs. This study underscores the substantial roles of weak convection in transporting stratospheric ozone to the lower troposphere and even to the surface, which has important implications for air quality and climate change.
- Article
(16825 KB) - Full-text XML
- Comment
-
Supplement
(2286 KB) - BibTeX
- EndNote


The exchange between the stratosphere and the troposphere, between which atmospheric compositions and static stability are fundamentally different, is crucial to atmospheric chemistry, global climate change, and ecosystem health (Holton et al., 1995; Stohl et al., 2003). The stratosphere stores approximately 90 %–95 % of atmospheric ozone (O3), and hence is characterized by a high abundance of ozone. Meanwhile, the stratosphere contains little water vapor, and little carbon monoxide (CO), which is primarily emitted from combustion processes near the surface (Hartmann et al., 2001; Pan et al., 2014b, 2018; D. Li et al., 2020). In contrast, the troposphere contains only 5 %–15 % of atmospheric ozone, as well as high water vapor and CO concentrations owing to its closeness to the surface sources. Therefore, a tropospheric air mass is rich in CO and water vapor, and poor in ozone relative to the stratospheric air mass. The transport of these trace gases from the stratosphere to the troposphere can occur under the influences of synoptic-scale and mesoscale atmospheric processes. Among these processes, deep convection is of great interest because it can effectively redistribute the trace gases vertically by modulating the flows of air mass upward or downward (Dickerson et al., 1987; Lelieveld and Crutzen, 1994; Pickering et al., 1991, 1992; Li et al., 2017). For example, intensive updrafts of deep convection can transport ozone and its precursors such as CO, nitrogen oxides (NOx), and volatile organic compounds (VOC) in the atmospheric boundary layer (ABL) to the upper troposphere and lower stratosphere (UTLS), and hence alter the chemical nature and promote substantial ozone formation in the UTLS. The stratospheric ozone-rich air mass can also be transported downward to the lower troposphere by deep convection. Therefore, deep convection is deemed important to the ozone budgets in the stratosphere and troposphere.
Previous studies on convective redistribution of vertical atmospheric composition mainly focus on the upward injection of pollutants from the ABL to the UTLS, whereas recent field campaigns and numerical analysis have started to pay attention to the downward transport of a stratospheric air mass and its influences on the troposphere (e.g., Baray et al., 1999; Betts et al., 2002; Sahu and Lal, 2006; Hu et al., 2010; Pan et al., 2014a; Phoenix et al., 2020, 2021). It is known that ozone is important for the radiation balance of the climate system and atmospheric oxidative capability. In recent years, continuous increases in surface ozone levels have been reported over many areas in China (Li et al., 2019; Han et al., 2020), whereas the contributions from the stratosphere-to-troposphere processes to the increasing surface ozone have been rarely studied. There are great uncertainties in the estimation of stratospheric impacts on the tropospheric ozone budget, because most studies are based on global models that have coarse spatiotemporal resolutions and a simplified representation of convection. Although events of stratospheric intrusions directly influencing surface ozone concentrations appear rarely and sporadically (Davies and Schuepbach, 1994; Akritidis et al., 2019; Dreessen, 2019; Knowland et al., 2017), the frequency and intensity of convection are projected to increase significantly in the future owing to global warming (Del Genio et al., 2007; Akritidis et al., 2019; Meul et al., 2018; Raupach et al., 2021). As a result, the likelihood of frequent convection-triggered transport from the stratosphere to the troposphere is also expected to rise in the future. Therefore, detailed analysis of simulations with high spatiotemporal resolution models can enhance our understanding of stratospheric intrusion related to convection.
The variation in ozone concentrations in the troposphere has close links to stratospheric intrusions of ozone-rich air mass through convection. For example, Pan et al. (2014a), based on aircraft observations, found that the stratospheric ozone-rich air mass can be transported downward and wrapped around the anvil by mesoscale convective systems (MCSs) with overshooting convection. Pan et al. (2014a) and Phoenix et al. (2020) revealed that vigorous atmospheric motions of tropopause-penetrating convection can perturb the tropopause and drive subsidence flow containing stratospheric ozone-rich air around the storm edges. Researchers also observed that small-scale convective downdrafts over tropical regions such as the Amazon rainforest are able to enhance surface ozone by 3–30 ppbv (Betts et al., 2002; Grant et al., 2008; Gerken et al., 2016; Melo et al., 2019). Jiang et al. (2015) reported a typhoon-induced high ozone episode at night with large surface ozone increases reaching 21–42 ppbv over the southeastern coast of China. Along the downward transport of stratospheric ozone-rich air mass, the upper and middle troposphere are most frequently impacted by the intrusions that mix with ambient air and contribute to the general free tropospheric ozone burden (Zanis et al., 2003; Tarasick et al., 2019). In some cases, a stratospheric air mass can sink to the surface (e.g., Davies and Schuepbach, 1994; Dreessen, 2019), whereas the fine-scale transport pathways of stratospheric air to reach the surface still require in-depth investigation. In this study, we report an event of substantial surface ozone enhancement observed at midnight on 31 July 2021 over the North China Plain (NCP) (34–40∘ N, 114–121∘ E, geographical location is shown in Fig. 1). Impacted by Typhoon In-fa and local MCSs, the surface ozone concentrations reached 80–90 ppbv at several cities over the NCP from 23:00 LST on 31 July to 06:00 LST on 1 August 2021. Compared with the monthly mean ozone concentrations, the surface ozone was enhanced by up to 40–50 ppbv. We expect that a direct stratospheric intrusion over the NCP was responsible for this vigorous surface ozone enhancement event, which would be analyzed in detail in the following sections. Such a significant ozone surge is impressive, given the rareness of direct stratospheric intrusions into the ground level and severe threats to the ecosystem. In addition, several features of atmospheric processes responsible for this night-time surface ozone surge event are worth noting. First, upon the occurrence of the ozone surge, Typhoon In-fa, which caused the record-breaking rainfall over Henan province of northern China in the summer of 2021, had been downgraded to tropical depression (TD, with a wind speed of 10.8–17.1 m s−1) category and evolved into its dissipation stage. Chen et al. (2021) evaluated the impacts of typhoons on tropospheric ozone and showed that typhoons can induce stratospheric intrusions to the lower troposphere when typhoons are intensive over the ocean. Although in this case, Typhoon In-fa had made landfall on 25 July 2021, and was weak when it moved into the NCP on 29 July, it could still have substantial influences on tropospheric ozone. Second, instead of showing significant tropopause-penetrating features in the convection case of Pan et al. (2014a), the local MCSs associated with the ozone surge were shallow in terms of vertical development and did not penetrate into the tropopause. As there are few studies that documented and analyzed the stratospheric impact on the troposphere over the NCP (Li et al., 2015a, b), the variations, magnitudes, transport pathways, and mechanisms of how the stratospheric air mass can reach the surface remain less well understood. Specifically, how the stratospheric air mass finally descends to the ground level is not clear, despite some detrainment processes of stratospheric ozone to ambient air in the upper and middle troposphere. Therefore, based on the observations and model simulations with high spatiotemporal resolutions, we intend to address the following key scientific issues related to this surface ozone surge that is induced by stratospheric intrusions:
-
The fine-scale spatiotemporal variations and magnitudes of surface ozone enhancement induced by the stratospheric intrusions.
-
The interactions between synoptic-scale and mesoscale atmospheric processes responsible for the rapid and direct stratospheric influences.
-
The transport pathways of stratospheric ozone-rich air to reach the surface.
The remaining paper is structured as follows. Section 2 describes the atmospheric composition observational data and meteorological data. Details of high-resolution simulations of the MCSs and backward trajectories analysis are also introduced. Section 3 presents the fine-scale variations in surface atmospheric composition. In Sect. 4, we analyze the multi-scale interactions of atmospheric processes responsible for the stratospheric intrusion to the surface, and present the transport pathways of ozone-rich air mass. Section 5 offers the conclusions and discussions.
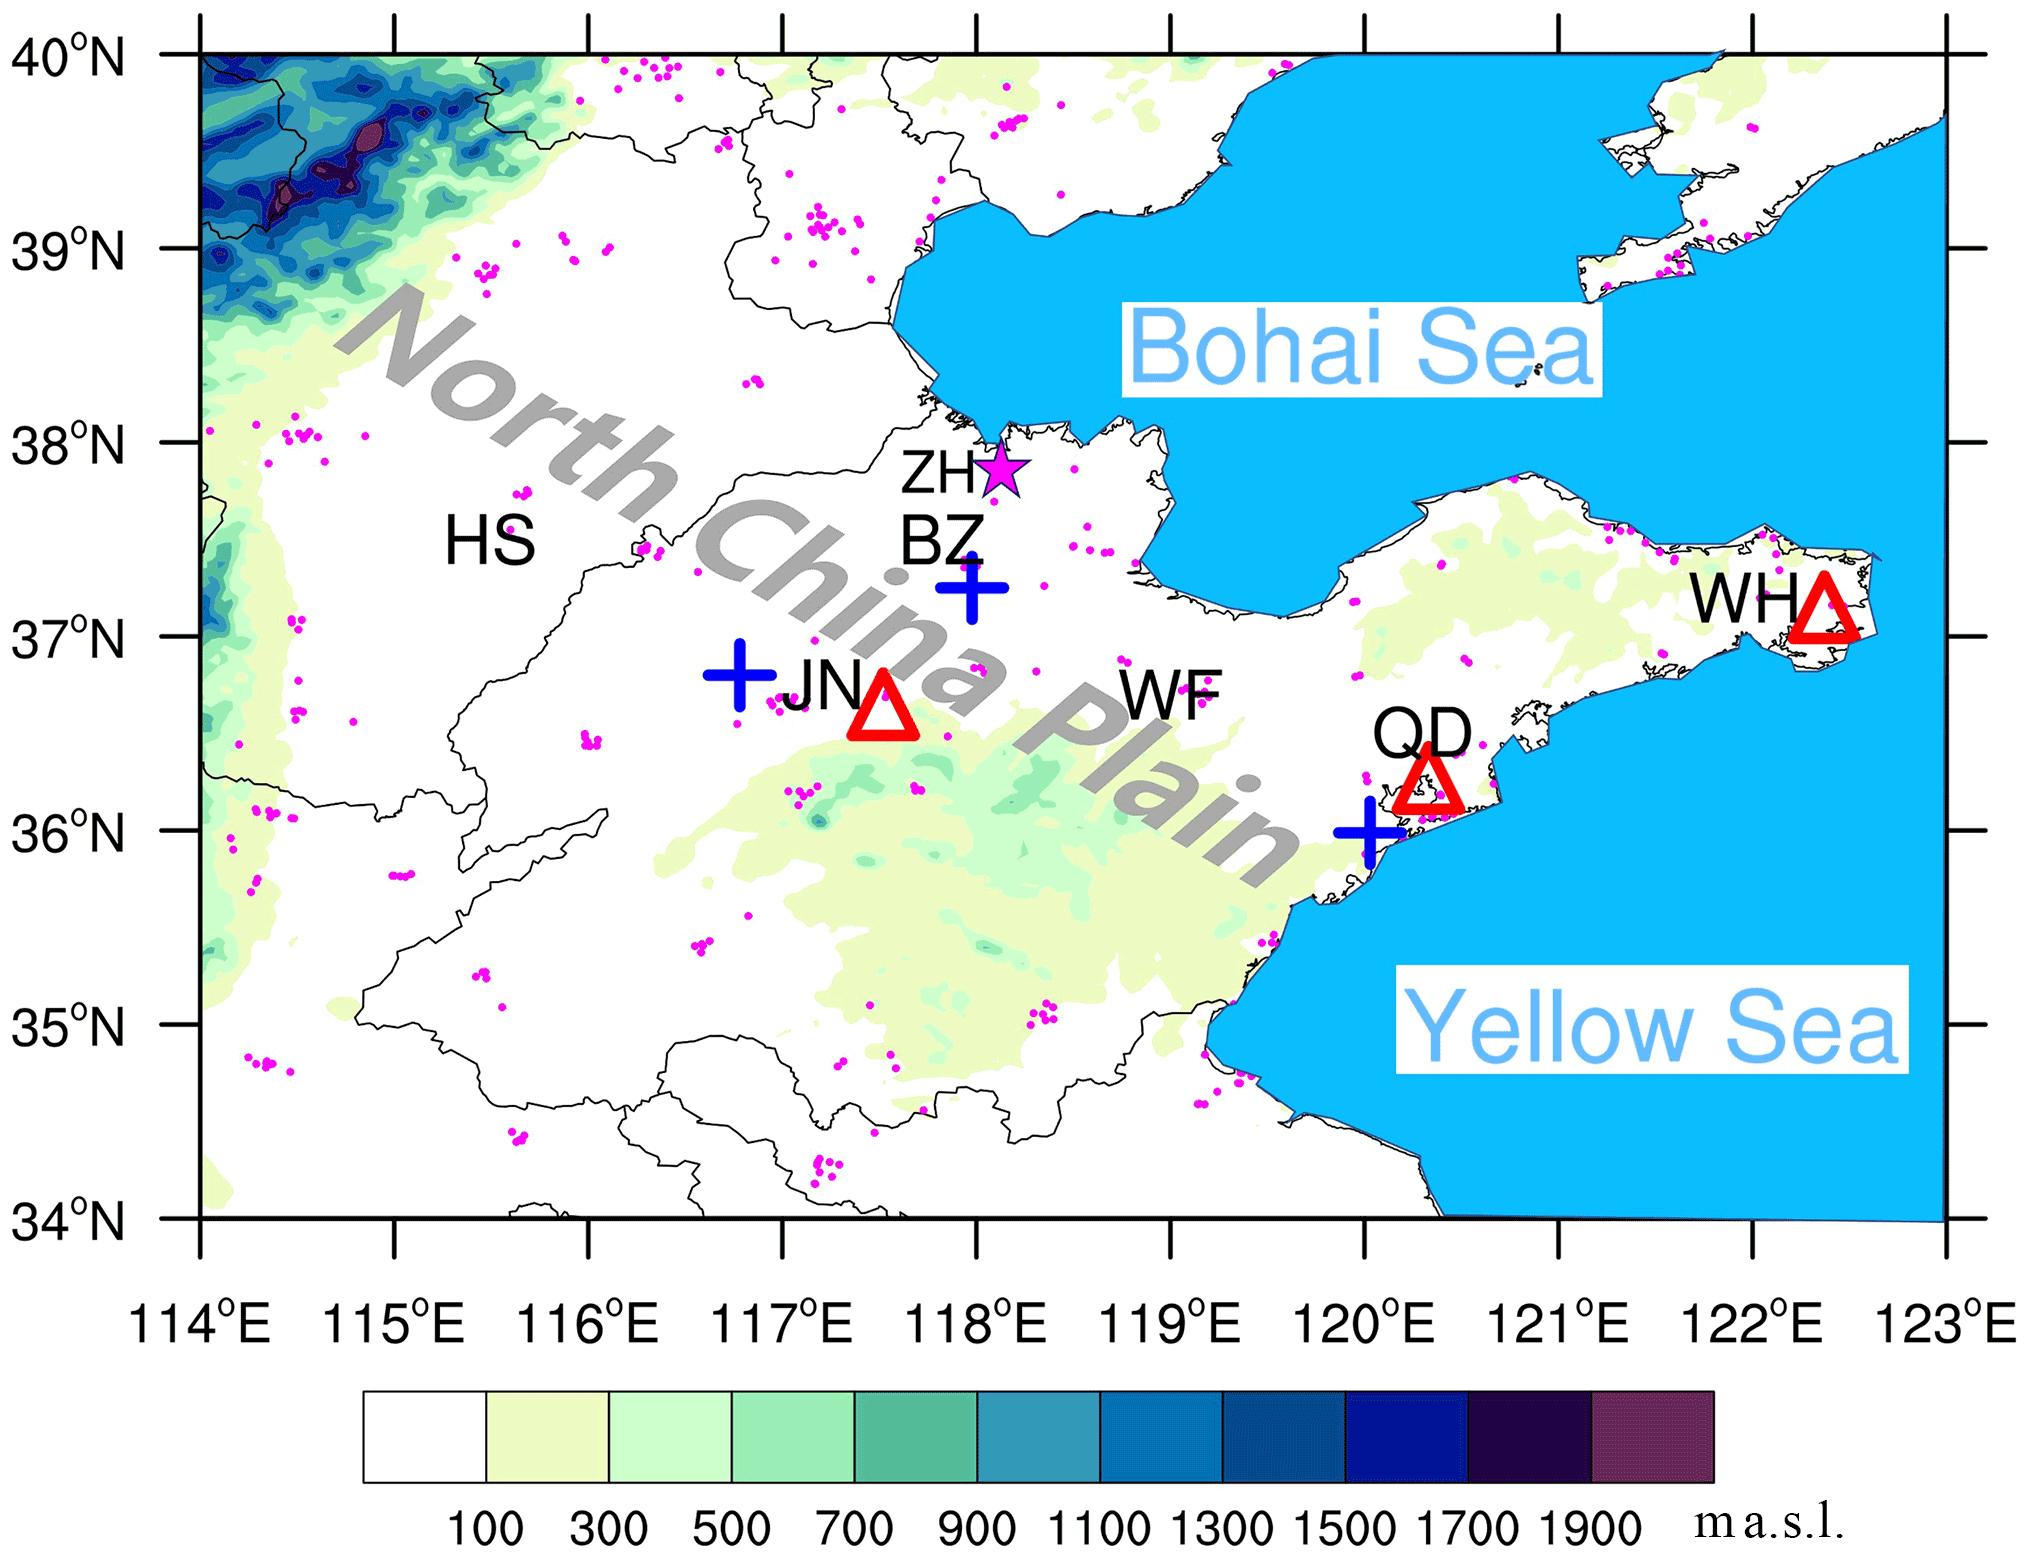
Figure 1Topography of North China Plain (NCP; unit: m a.s.l., indicated with different colors (color bar)) and locations of cities Hengshui (HS), Jinan (JN), Binzhou (BZ), Weifang (WF), Qingdao (QD), and Weihai (WH). Three radar stations, located in JN, QD, and WH, are marked by red triangles. The ground-based air quality monitoring stations are shown by magenta dots, and the station with high-frequency measurement of air quality located in Zhanhua (ZH) county of Binzhou city is marked by a magenta star. The locations of Bohai Sea and the Yellow Sea are also indicated. The thin gray lines indicate the borders of provinces.
2.1 Atmospheric composition observations
Ground-based air pollutant data were collected from two sources. First, a nationwide observation network with more than 1500 stations distributed over 454 cities is maintained by the China National Environmental Monitoring Center (CNEMC), which measures air pollutants, including surface fine particles with an aerodynamic diameter of up to 2.5 µm (PM2.5) and of up to 10 µm (PM10), ozone, CO, nitrogen dioxide (NO2), and sulfur dioxide (SO2) (Lu et al., 2018). The air pollutant observations from the CNEMC are strictly quality controlled and released with a 1 h temporal resolution (https://quotsoft.net/air, last access: 21 January 2022). Correspondingly, city-scale air pollutant concentrations were obtained by averaging all available station observations in cities such as Hengshui (HS), Jinan (JN), Binzhou (BZ), Weifang (WF), Qingdao (QD), and Weihai (WH) (Fig. 1). Second, continuous measurements of ozone, CO, and NOx were made in July–August 2021 at a rural station (37.82∘ N, 118.11∘ E) located in Zhanhua (ZH), a county of Binzhou city, where the field campaign of the 2021 Shandong Triggering Lightning Experiment (SHATLE) was performed by the Institute of Atmospheric Physics (IAP) of the Chinese Academy of Sciences (CAS) (Qie et al., 2009; Jiang et al., 2013). The applied atmospheric composition instruments include an ultraviolet photometric ozone analyzer (Model 49i), a NOx analyzer (Model 42i-TL), and a CO analyzer (Model 48i-TLE) produced by Thermo Fisher Scientific Inc. Detailed calibrations and daily maintenance were performed to ensure data quality. Ozone, CO, and NOx concentrations (in ppbv) were output at a frequency of 30 s, originally designed to track the fast variations in atmospheric compositions during the triggered lightning flashes. In this study, we averaged these high-frequency observations into a 3 min temporal resolution.
In addition to the ground-based observations, tropospheric ozone vertical profiles from satellite observations were also analyzed. The vertical distributions of ozone are measured by the Atmospheric Infrared Sounder (AIRS) on the Earth Observing System (EOS) Aqua satellite, and the Ozone Monitoring Instrument (OMI) on the EOS Aura satellite under the NASA TRopospheric Ozone and Precursors from Earth System Sounding (TROPESS) project (Verstraeten et al., 2013; Fu et al., 2018; https://tes.jpl.nasa.gov/tropess/products/o3/, last access: 20 June 2022). The ozone profiles are produced via an optimal estimation algorithm using multi-spectra, multi-species, and multi-sensors. These satellite-based ozone profiles have a spatial resolution of 13 km × 24 km with 26 vertical levels from the surface to 0.1 hPa, and the temporal resolution is 1 d. Fu et al. (2018) compared the joint AIRS + OMI against ozonesonde measurements, showing that the mean and standard deviation of the differences are within the estimated measurement error of these space sensors (2–5 ppbv).
2.2 Meteorological observations and atmospheric reanalysis data
The operational radiosonde data from the cities Jinan, Qingdao, and Weihai (Fig. 1) were utilized to capture the meteorological evolution responsible for the stratospheric intrusion. Regional radar mosaic products were produced and analyzed using three Doppler radars, including two S-band radars located in Jinan and Qingdao and one C-band radar in Binzhou, because radar reflectivity and radial velocity are indicative of storm microphysical and dynamical structure, as well as the horizontal coverage and vertical extension of convection. Cloud-to-ground (CG) lightning flashes were also referenced to infer the storm development and intensity provided by a nationwide lightning detection network operated by the State Grid Electric Power Research Institute (Chen et al., 2012).
Three-dimensional atmospheric Modern-Era Retrospective Analysis for Research and Applications, Version 2 (MERRA-2) reanalysis data were used to reveal the synoptic-scale evolutions impacted by Typhoon In-fa (https://gmao.gsfc.nasa.gov/reanalysis/MERRA-2/, last access: 20 June 2022). MERRA-2 reanalysis has a horizontal resolution of 0.5∘ × 0.625∘, 72 vertical levels from the surface to 0.01 hPa and a 3 h update temporal cycle. The following gridded meteorological variables were extracted from MERRA-2. Dynamical variables including horizontal wind and vertical wind velocity were analyzed to reveal dominant flow patterns when Typhoon In-fa began dissipate. Potential vorticity (PV) and relative humidity (RH), which are indicative of stratospheric intrusion, were used to track the variation in tropopause height and the penetration of dry stratospheric air.
2.3 WRF simulations and FLEXPART backward trajectories
The relatively coarse spatiotemporal resolution of observations and reanalysis data mentioned above cannot explicitly capture atmospheric processes at the storm scale, especially for the evolving convective dynamics responsible for the downward transport of ozone-rich air mass. For example, the 3 h cycle of MERRA-2 reanalysis data can easily miss the details of the MCS evolution and is insufficient for conducting storm-scale backward trajectory analysis. Therefore, the dynamical evolution of the MCSs under the influence of Typhoon In-fa was simulated using the Weather Research and Forecasting with the Advanced Research core (WRF-ARW, Version 3.9.1; Skamarock et al., 2008). Table 1 offers the basic parameters used in WRF simulation. The numerical simulation employed two-way, three-domain nested grid cells. The outermost domain has 232 × 182 grids with a 27-km horizontal grid spacing and covers approximately East Asia and the neighboring oceans. The inner domain has 490 × 430 grids with a 9-km horizontal resolution covering the whole of China. The innermost domain is placed over the NCP with 610 × 610 grids and a 3-km horizontal resolution that guarantees to resolve the storm-scale features (Fig. S1 in the Supplement). To explicitly resolve the dynamical structure in the vertical direction, the number of terrain-following levels was set to 95, and the model top was set to 50 hPa. As a result, the vertical spacing between each layer is approximately 100 m in the ABL (<1.5 km) and 200 m in the free atmosphere (between 1.5 and 20 km).
The applied physics options in the WRF model include the Kain–Fritsch cumulus parameterization scheme (Kain and Frisch, 1993), which was applied only to the outermost domain and inner domain but turned off for the innermost domain. The microphysical parameterization is the Morrison two-moment scheme (Morrison et al., 2009), the planetary boundary layer physics parameterization is the Yonsei University (YSU) scheme (Hong et al., 2006), and the land surface model is the Noah land surface model (Chen and Dudhia, 2001). For the longwave and shortwave radiation processes, the Rapid Radiant Transfer Model (RRTM) scheme (Mlawer et al., 1997) and the Dudhia scheme (Dudhia, 1989) were utilized. A 24 h period simulation starting from 08:00 LST (Local Standard time, = UTC +8 h) on 31 July covering the entire lifespan of the MCSs was performed, which was initialized by the 0.5∘ and 3 h Global Forecast System (GFS) analysis of the National Centers for Environmental Prediction (NCEP). Simulation results of the innermost domain with a 3-km horizontal resolution were output every 3 min to analyze the evolution of storm-scale features.

Backward trajectories for the analysis of the surface ozone surge were simulated using the Flexible Lagrangian particle dispersion model (FLEXPART), which works with the WRF model (FLEXPART-WRF, Version 3.3.2; Brioude et al., 2013; https://www.flexpart.eu/wiki/FpLimitedareaWrf, last access: 20 June 2022). The FLEXPART model (Stohl et al., 2005) was originally developed at the Norwegian Institute for Air Research in the Department of Atmospheric and Climate Research, and was further tailored to WRF models so that the model can be widely used to study the influence of mesoscale processes on pollution transport (e.g., Aliaga et al., 2021; Nathan et al., 2021). Based on the WRF simulation results of the innermost domain with a 3-km horizontal resolution, we conducted backward trajectory calculations using FLEXPART-WRF. Ten thousand particles were released at each defined location and timing, which is described in the following section. The FLEXPART-WRF output was saved every 10 min to track the three-dimensional particle backward trajectories.
Before analyzing this surface ozone surge case of stratospheric origin, it is beneficial to provide some statistics of surface ozone background concentrations over the NCP. In the summer of 2021, the daily mean and maximum 8 h average (MDA8) ozone concentrations in the NCP were 43.9 and 70.8 ppbv respectively, whereas the mean night-time ozone concentration (19:00–06:00 LST) was 36.6 ppbv, calculated from observations. Figure 2 shows a 10 d averaged surface ozone concentration (from 27 July to 5 August 2021) in each city, used as the baseline for assessing ozone variations. Generally, the 10 d averaged ozone concentration in each city is close to the summertime mean ozone concentration of 45–50 ppbv. During 28–30 July 2021, under the cloudy conditions produced by Typhoon In-fa, surface ozone is apparently lower than the 10 d average. After 31 July, as Typhoon In-fa had moved over the NCP and entered the Bohai Sea, the photochemical reactions accelerated, as seen in the steady increase in surface ozone at daytime and subsequent diurnal cycles since. However, instead of continuously decreasing after sunset, the concentrations of surface ozone over some cites in the NCP increased abruptly and intensively between 23:00 LST on 31 July and 06:00 LST on 1 August (between the vertical black lines in Fig. 2 and the zoomed-in Fig. S2), which were 40–50 ppbv larger than their corresponding monthly mean values during the night and almost comparable with the daytime high ozone concentrations (Fig. S3). In the cities of Hengshui, Binzhou, Jinan, and Weifang, a peak ozone concentration at night-time reaching 80–90 ppbv appeared in succession, which was in accordance with the southeastward propagation of the MCSs (see Sect. 4.2, where impacts of the MCSs on surface ozone are addressed in detail). Although in the eastern cities such as Qingdao and Weihai (Fig. 2e–f), where convective activities were mostly absent, the ozone evolution at midnight was different from the cities experiencing storm passage shown in Fig. 2a–d.
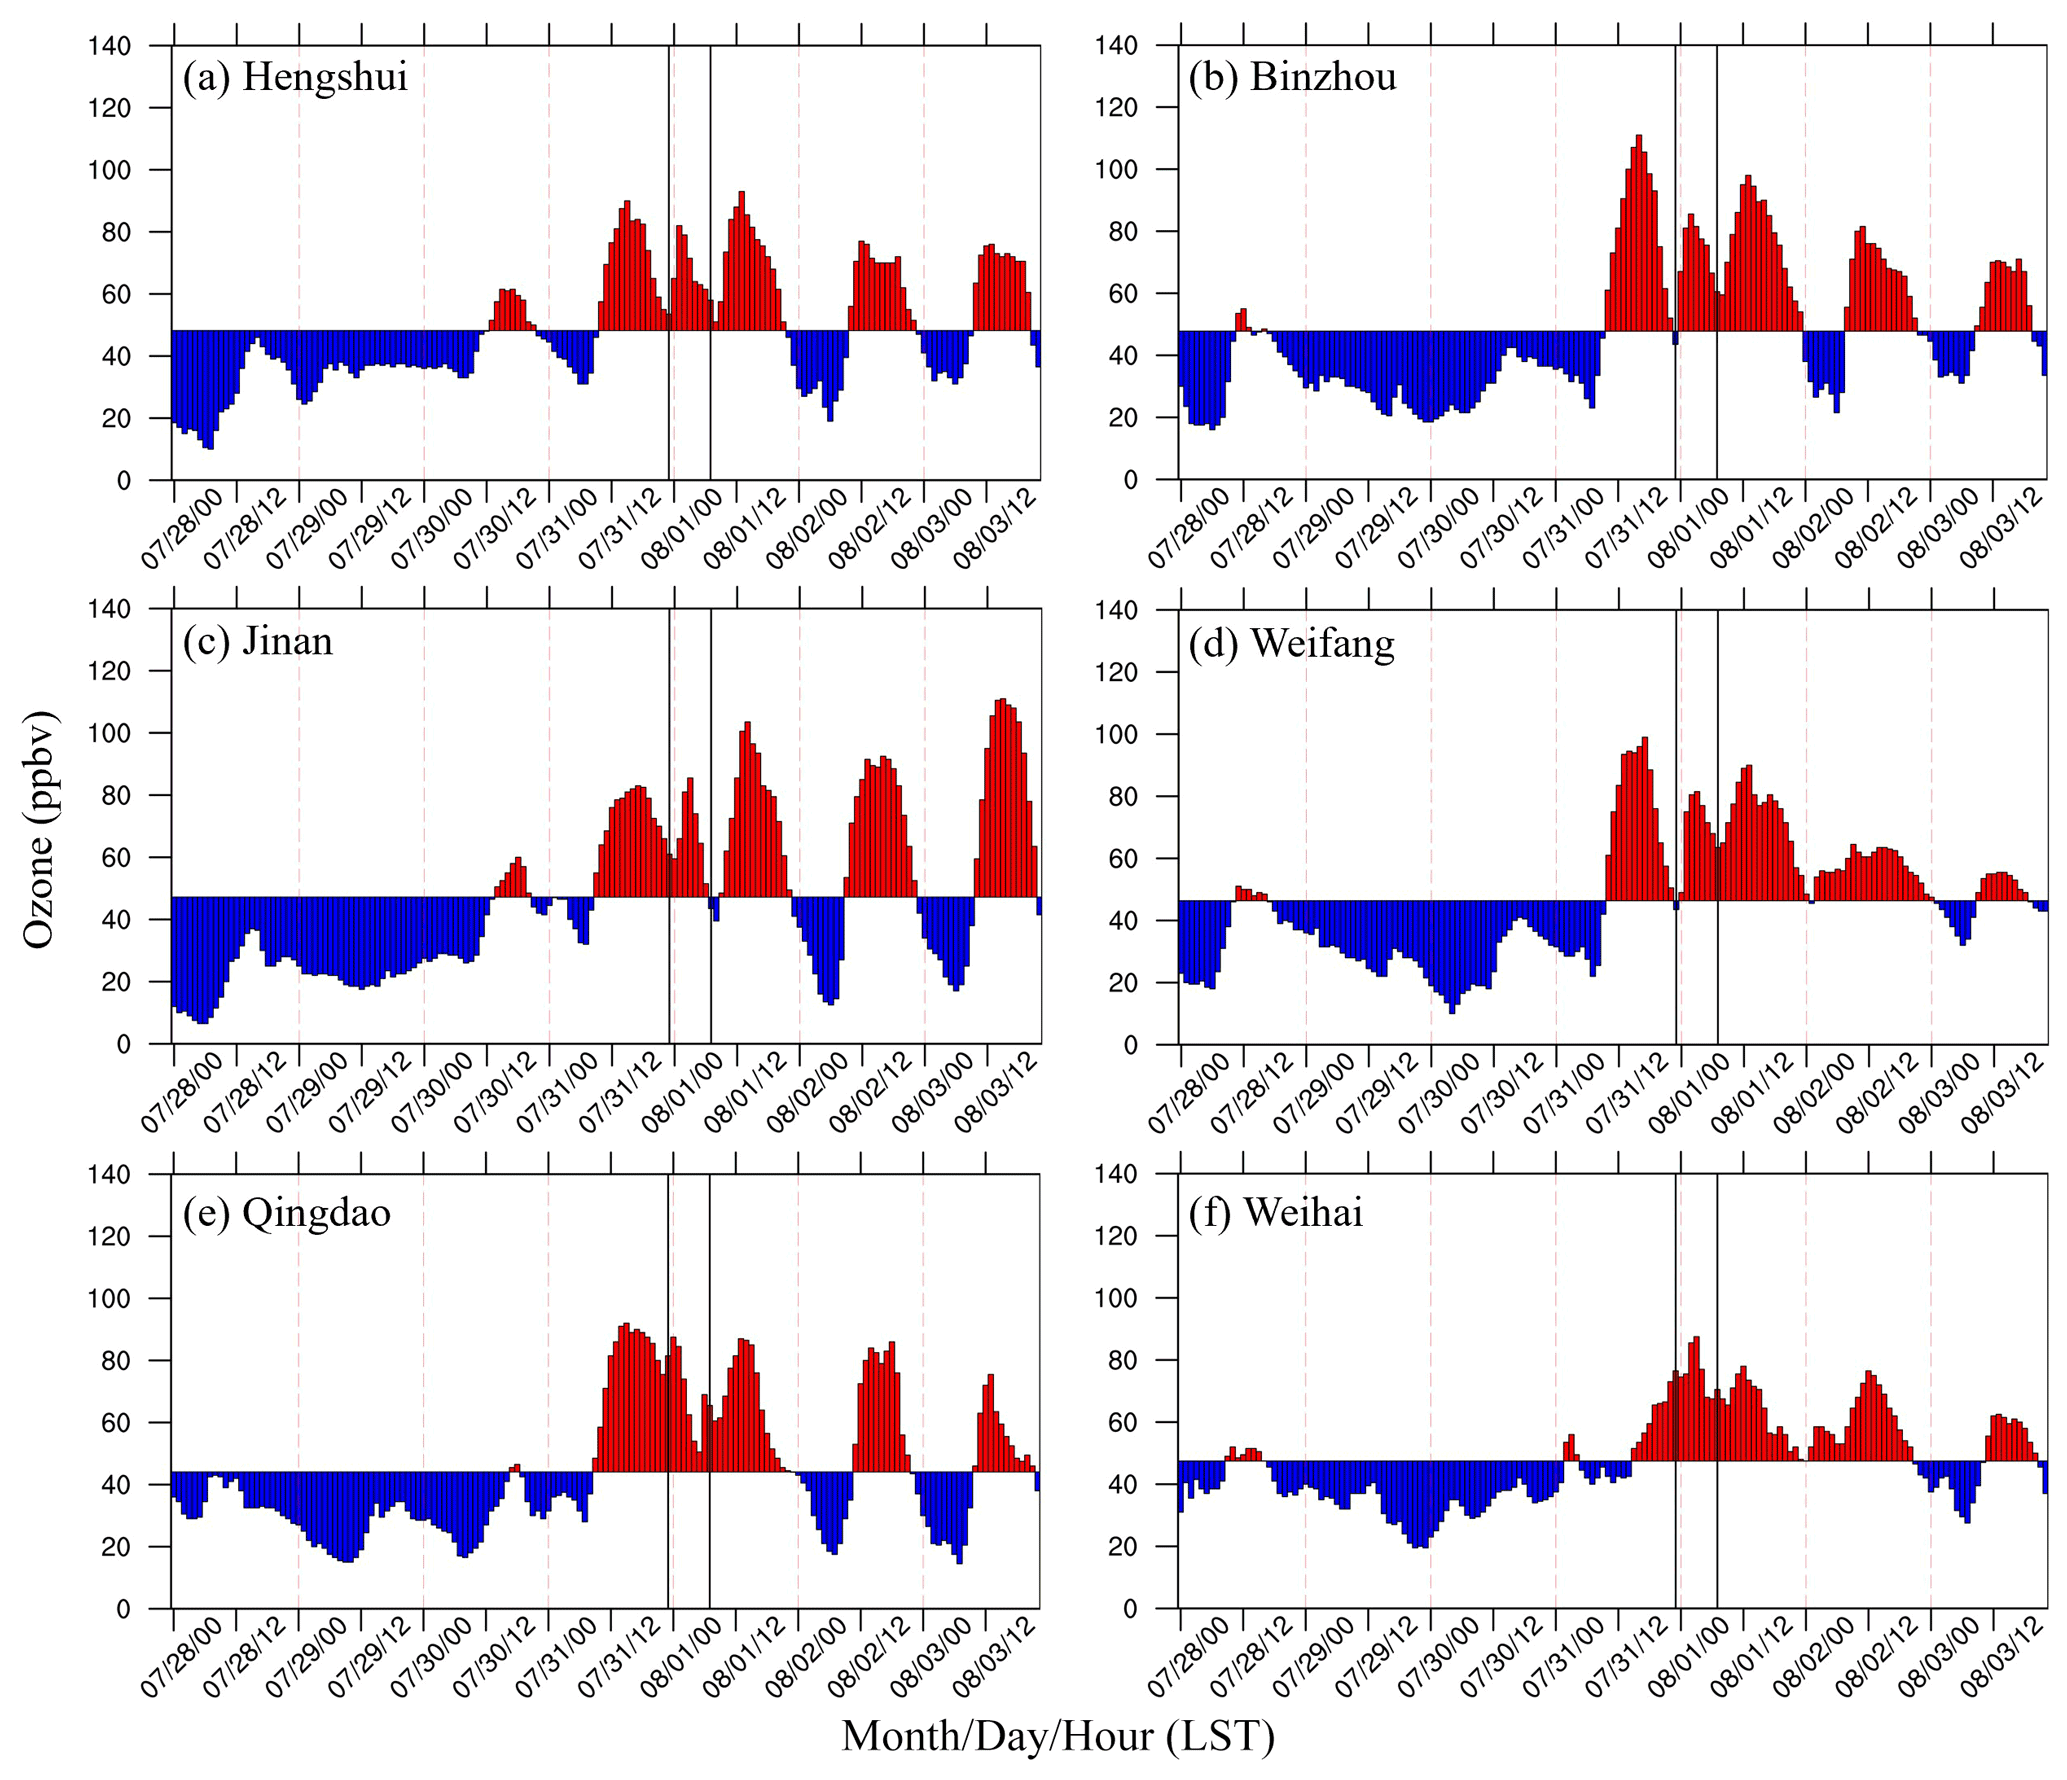
Figure 2(a)–(f) Temporal variation in surface ozone concentrations (unit: ppbv) in local standard time (LST) from 28 July to 3 August 2021 using the 10 d averaged ozone value as a baseline for comparison in cities Hengshui, Binzhou, Jinan, Weifang, Qingdao, and Weihai. Positive (negative) departure from the 10 d averaged ozone concentration is shown in red (blue) color. The two vertical black lines represent the observed ozone surge period between 23:00 LST on 31 July and 06:00 LST on 1 August 2021. Daily cycles (00:00–00:00 LST) are denoted by vertical dashed pink lines. Labels along the horizontal axis represent the observation times (month/day/hour).
During the ozone surge period, an obvious decrease in surface CO was also observed. Figure 3 shows the variations in surface CO with a 10 d mean concentration serving as the baseline. Although the temporal variations in surface CO were complex, a systematic low-concentration phase of CO appeared at midnight on 31 July (between the vertical black lines in Fig. 3 and the zoomed-in Fig. S4), when surface ozone surged (Fig. 2) during the MCS event. The surface CO concentrations were greatly reduced in cities such as Hengshui, Binzhou, and Jinan, although the concentrations were reduced in Weifang during partial night-time, and were not reduced in Qingdao and Weihai, which were outside the path of influence of the MCSs, as noted in the preceding paragraph. CO is often used as a tracer for both anthropogenic pollution and biomass burning (e.g., Pochanart et al., 2003; Lin et al., 2018); therefore, the high surface ozone synchronized with low CO in the time series supports the case that the surface ozone surge was caused by stratospheric intrusions of ozone-rich and CO-poor air mass. The area impacted by stratospheric intrusions was larger than these cities covered, and was at least 300 km × 300 km based on the nationwide atmospheric composition measurements (Fig. 1).
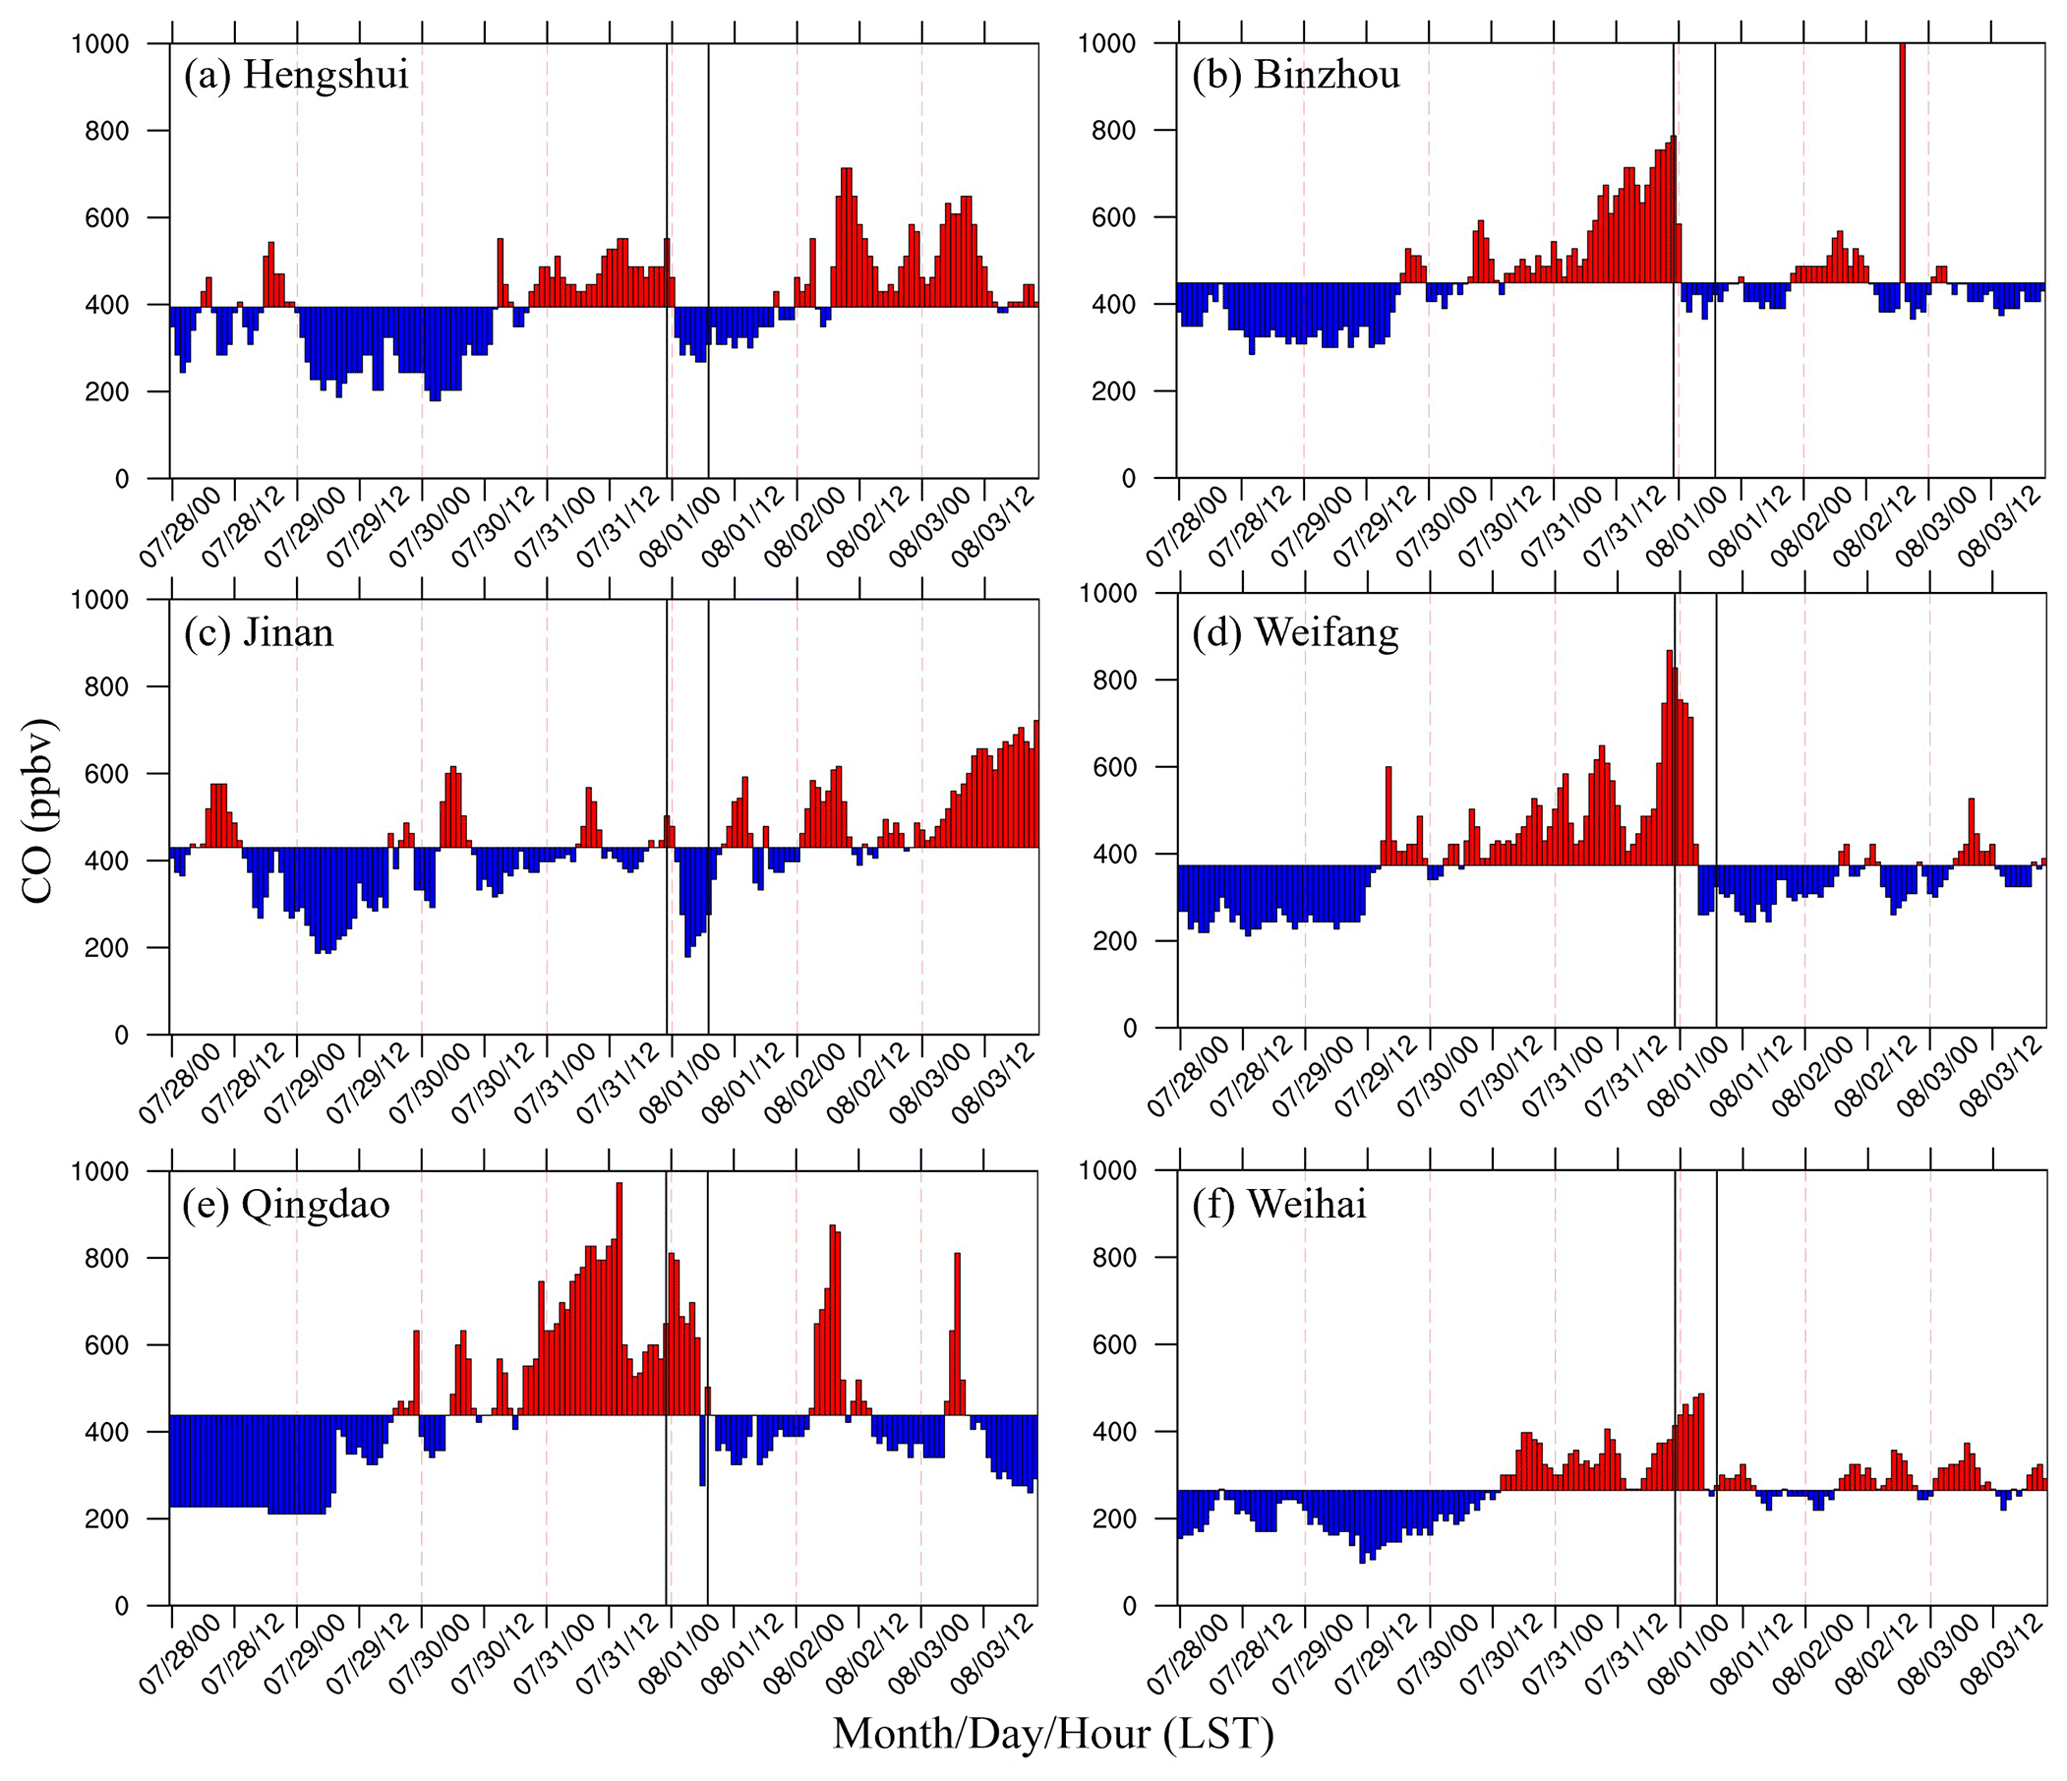
Figure 3(a)–(f) Same as Fig. 2, but for surface carbon monoxide (CO) concentrations (unit: ppbv) from 28 July to 3 August 2021.
The atmospheric composition data from the national monitoring network captured well this surface ozone surge event with stratospheric origin spatially, although these observations were smoothed during each hour. To better identify the magnitude and timing of surface ozone surge, high-frequency atmospheric composition measurements collected during the SHATLE field campaign at Zhanhua were analyzed. Figure 4 shows the 3 min variations in surface ozone and CO concentrations relative to their 10 d averaged baseline concentrations. As a rural county of Binzhou city, the ozone baseline concentration (approximately 60 ppbv) in Zhanhua was higher than that in Binzhou city (approximately 45 ppbv), whereas the CO baseline concentration in Zhanhua, which is closely related to anthropogenic emissions, was lower than that in Binzhou. The active photochemical reactions in the afternoon elevated ozone concentrations, which fluctuated between 100 and 120 ppbv. After sunset at 19:00 LST, surface ozone concentrations continuously decreased via the titration effect and dry deposition of vegetation, and thus was lower than its background concentration at 21:00 LST. However, at 22:36 LST, the continuous decrease in surface ozone stopped. Instead, ozone concentrations surged abruptly from 31 to 80 ppbv in the next 10 min and remained high for the next 8 h. The averaged surface ozone concentrations in the night were 79 ppbv, and the maximum concentrations reached 93 ppbv at 01:54 LST on 1 August 2021. Based on the observations with finer temporal resolution, a synchronous reduction of surface CO concentrations occurred exactly when ozone rose abruptly, which further confirmed that the ozone surge was caused by intrusions of a stratospheric air mass. Compared with the normal night-time ozone concentrations (an average of 36.6 ppbv), the magnitudes of surface ozone surge due to stratospheric intrusions were approximately 40–50 ppbv. The Chinese National Ambient Air Quality Standard for ozone exceedance level is approximately 82 ppbv (K. Li et al., 2020), as a result, the vigorous ozone surge can pose a threat to human health and agricultural crops and other plants.
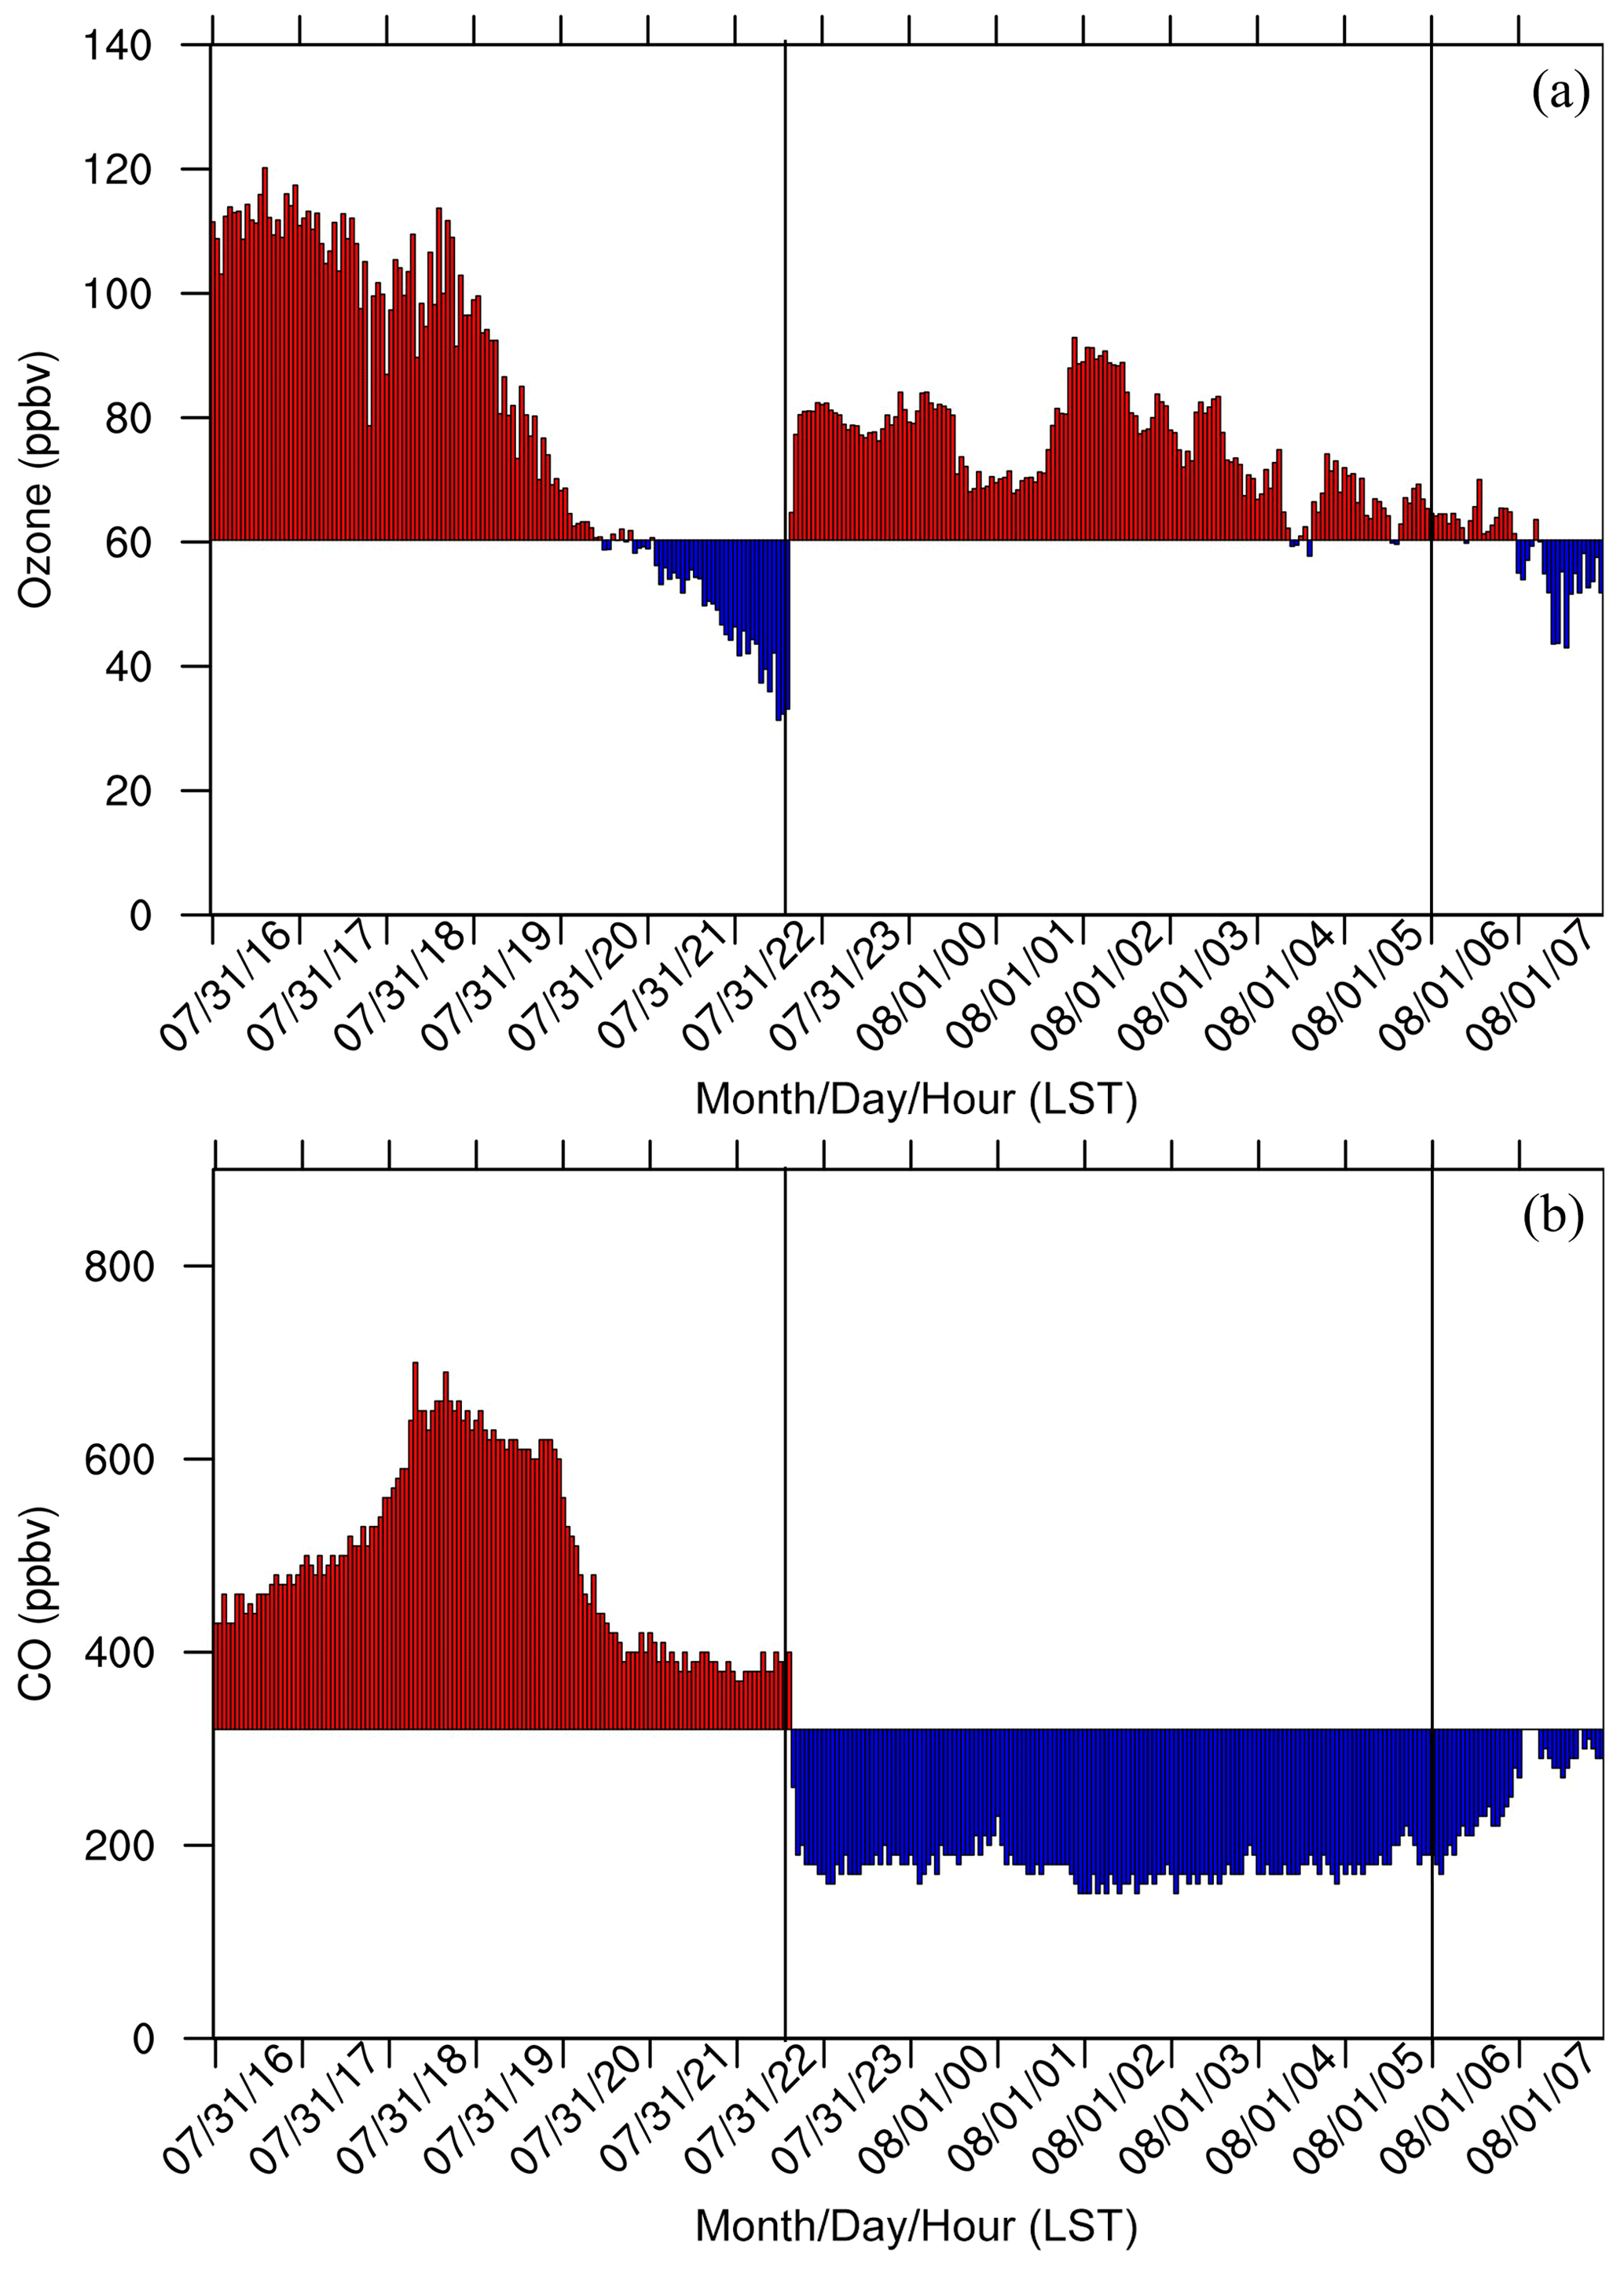
Figure 4(a), (b) Surface ozone and CO concentrations (unit: ppbv) at the SHATLE field campaign site located in Zhanhua county of Binzhou city, measured with a 3 min temporal resolution from 16:00 LST on 31 July to 08:00 LST on 1 August 2021. The 10 d averaged ozone and CO concentrations at the site are used as the baseline, and positive (negative) departure from the 10 d averaged concentration is shown in red (blue) color. The two vertical black lines represent the observed ozone surge period between 22:36 LST on 31 July and 06:00 LST on 1 August 2021. Labels along the horizontal axis represent the observation times (month/day/hour).
Several mechanisms have been proposed to explain higher tropospheric ozone concentrations than normal. For example, the STE associated with synoptic-scale dynamical exchange processes, such as tropopause folding near the polar jet and subtropical jet (Stohl et al., 2003; Pan et al., 2014b; Li et al., 2015a), cut-off low (Wirth, 1995; Li et al., 2015b), and typhoons (Baray et al., 1999; Jiang et al., 2015; Preston et al., 2019; Chen et al., 2021; Meng et al., 2022), are well studied. Local photochemical production of ozone using the precursors anthropogenic emissions, biomass burning (Chan et al., 2003; Brioude et al., 2007), and lightning-generated nitrogen oxides (LNOx) (Cooper et al., 2006; Schumann and Huntrieser, 2007) are also able to increase tropospheric ozone burden. Particular to this study is that convection with overshooting tops can force subsidence air motions near the cloud edge owing to mass continuity and hence transport stratospheric ozone-rich air downward (Hu et al., 2010; Pan et al., 2014a; Phoenix et al., 2020). In this night-time surface ozone surge event associated with stratospheric intrusions, the dominant atmospheric processes are dying Typhoon In-fa and the local MCSs, with no significant influences from ozone precursors from biomass burning or LNOx. In the following, we provide detailed analyses of the interactions between synoptic-scale and convective-scale processes that finally bring ozone from the stratosphere to the surface and lead to the intensive midnight ozone surge.
4.1 Large-scale descent of stratospheric air attributed to the dying Typhoon In-fa
Previous studies indicated that typhoons can perturb the tropopause and hence induce stratospheric intrusion that brings an ozone-rich air mass to the lower troposphere and even the ABL. Using a large ensemble of landfalling typhoon cases, Chen et al. (2021) found significant positive ozone anomalies at the middle and upper troposphere due to stratospheric intrusion when typhoons are intensive, and negative ozone anomalies within the entire troposphere when typhoons have made landfall. In this study, Typhoon In-fa shows different features from the ensemble-averaged behaviors. Typhoon In-fa made landfall in southern China approximately at 12:00 LST on 25 July 2021 with a maximum wind speed of 38 m s−1 (typhoon category) and gradually weakened along its northward passage over land. At 08:00 LST on 29 July 2021, Typhoon In-fa entered the NCP (magenta cross symbols in Figs. 5a and S5) with a maximum wind speed of 15 m s−1 (TD category) and propagated slightly northeastward to the Bohai Sea (Fig. 1). The monitoring of Typhoon In-fa's track and intensity by the Meteorology Administration of China was terminated after 20:00 LST on 30 July 2021, given its weaker intensity than TD category. Consequently, Typhoon In-fa maintained its existence over land for more than 5 d (128 h). Figure 5a shows the 700 hPa vertical air motions superimposed on the 850 hPa horizontal wind flows at 20:00 LST on 30 July 2021 based on MERRA-2 reanalysis data. Although the intensity of Typhoon In-fa declined steadily and could not even satisfy the TD category, Typhoon In-fa was still capable of maintaining systematic upward air motions with counterclockwise circulations at the Bohai Sea and inducing downward air motions over land. In the vertical direction (Fig. 5b), the downward air motions over land were deep, extending from surface to 500 hPa. The dynamical tropopause represented by the 2.5 PVU (potential vorticity unit, 1 PVU = 10−6 K m2 s−1 kg−1; Wirth, 2003) contour line mainly located at approximately 100 hPa, and the stratospheric dryness with relative humidity (RH) less than 30 % had reached around 300 hPa. The next day, a significant downward placement of 2.5 PVU dynamical tropopause and dryness occurred under the influences of Typhoon In-fa (Fig. 5c–d). At 14:00 LST on 31 July 2021, the tropopause descended to 300 hPa and the dry air mass filled the upper troposphere above 500 hPa, yielding great potential for stratospheric intrusions, even though Typhoon In-fa was in its dissipation stage.

Figure 5(a) Vertical velocity (shaded; 0.01 Pa s−1) at 700 hPa overlaid with 850 hPa horizontal wind flows (gray vector; reference vector is 12 m s−1) at 20:00 LST on 30 July 2021. The magenta crosses represent the tracks of Typhoon In-fa during its dissipation stage, with a time interval of 6 h. (b–d) Cross sections of vertical velocity (shaded; unit: 0.01 Pa s−1; the positive values represent the downward air motions and the negative values represent the upward air motions), relative humidity (solid black lines with values of 10 % and 30 %) and the 2.5 PVU dynamical tropopause height (solid magenta lines) at 20:00 LST on 30 July (b), 08:00 LST on 31 July (c), and 14:00 LST on 31 July 2021 (d). The time in (b)–(d) is indicated as month/day/hour at the bottom right corners. The cross sections are performed along the dashed black line in Fig. 5a.
Vertical profile observations can reveal details of the large-scale descent of a stratospheric air mass attributed to the dying Typhoon In-fa. Water vapor and ozone are tracers commonly used to detect the stratospheric air mass. Previous observations collected at mountain peaks suggest that the frequency of stratospheric intrusions is at a minimum in summer, and stratospheric intrusions that directly influence ozone concentrations below 700 hPa are rare (Elbern et al., 1997; Stohl et al., 2000). Here, we averaged the moisture and ozone of the air mass below 700 hPa over the 10 d (28 July to 3 August 2021) and used the averages as the baselines to track stratospheric intrusions induced by the dissipating Typhoon In-fa. The operational radiosondes provide temperature (T) and dew-point (Td) profiles, and the differences between them, dew-point depressions (), can imply the saturation of air masses. Figure 6 shows the vertical profiles of dew-point depressions relative to the 10 d averaged baseline between the surface and 700 hPa using radiosonde observations collected in Jinan. Consistent with the continuous downward penetration of stratospheric dryness shown in Fig. 5, the dry air mass associated with large dew-point depressions over Jinan sunk down to 900 hPa at 20:00 LST on 31 July. The dry stratospheric air further replaced the low-level moist air and reached the ground level as seen in the profile at 08:00 LST on 1 August. The timing of the surface ozone surge in Jinan was in agreement with variations in atmospheric moisture profile (Fig. 2c). Radiosonde observations at Qingdao and Weihai also confirmed the large-scale descent of dry stratospheric air impacted by Typhoon In-fa. However, the near-surface air mass in Qingdao and Weihai were moister than their baseline values (Figs. S6 and S7) on 31 July and 1 August, suggesting weaker impacts of stratospheric intrusion at the surface.
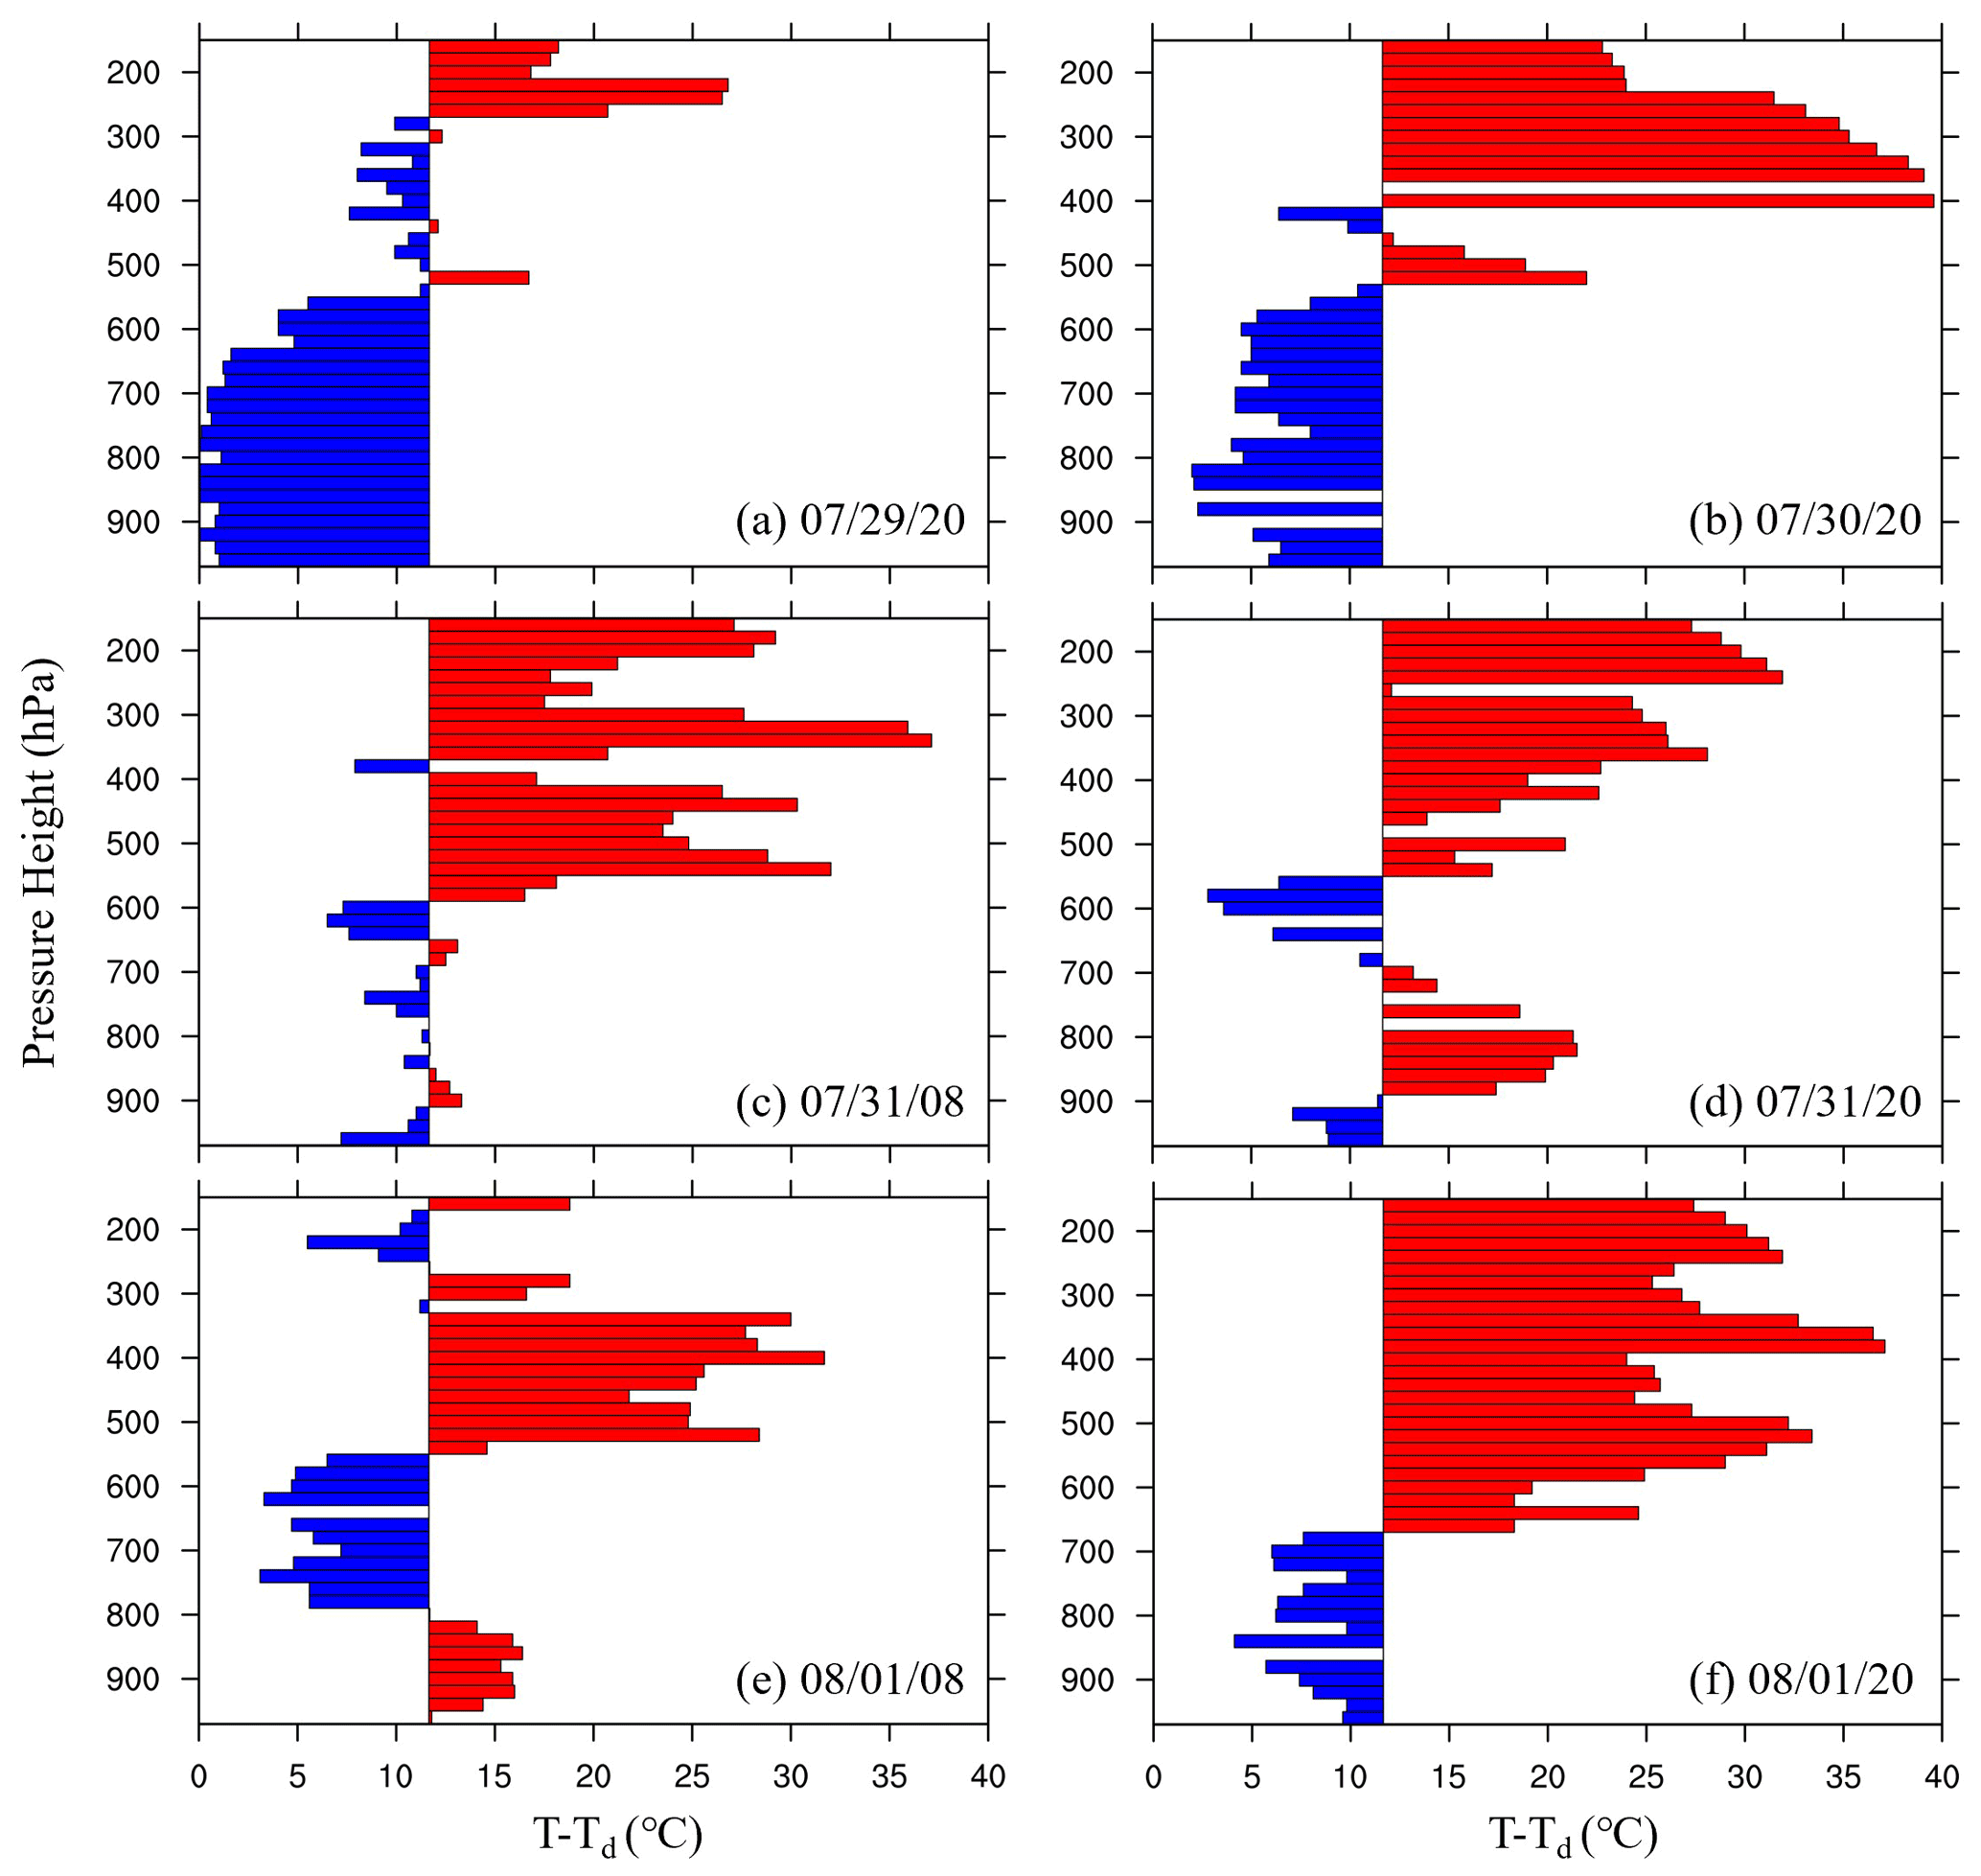
Figure 6Profiles of dew-point depressions (T−Td, unit: ∘C) from Jinan radiosonde observations at (a) 20:00 LST on 29 July, (b) 20:00 LST on 30 July, (c) 08:00 LST, (d) 20:00 LST on 31 July, (e) 08:00 LST 01, and (f) 20:00 LST on 1 August 2021. These times are indicated as month/day/hour at the bottom right corners. The 10 d averaged dew-point depressions between the surface and 700 hPa are used as the baseline, and positive (negative) departure from the 10 d averaged value is shown in red (blue) color.
Behaviors of vertical ozone profiles under the influence of Typhoon In-fa were examined using satellite ozone observations. Figure 7 shows the mean profiles of ozone concentrations over the NCP against the baseline ozone concentration (56 ppbv) averaged between the surface and 700 hPa based on TROPESS AIRS L2 ozone products. Compared with the ozone profile on 29 July, a significant increase in tropospheric ozone occurred over the following 3 d. Impacted by the stratospheric ozone-rich air mass, the positive ozone anomalies relative to the baseline concentration extended downward to the lower troposphere. Despite possible bias of AIRS ozone profiles, especially at low levels, the relative variations in vertical ozone concentrations between those days clearly reveal the large-scale downward propagation of ozone enhancement under the influence of dissipating Typhoon In-fa. The concurrent trends of atmospheric moisture and ozone provide a piece of clear evidence that the stratospheric air mass had descended to the middle-to-low troposphere (at least 900–500 hPa) during the evening of 31 July over the NCP, which was adequate for initiating the subsequent vigorous surface ozone surge.
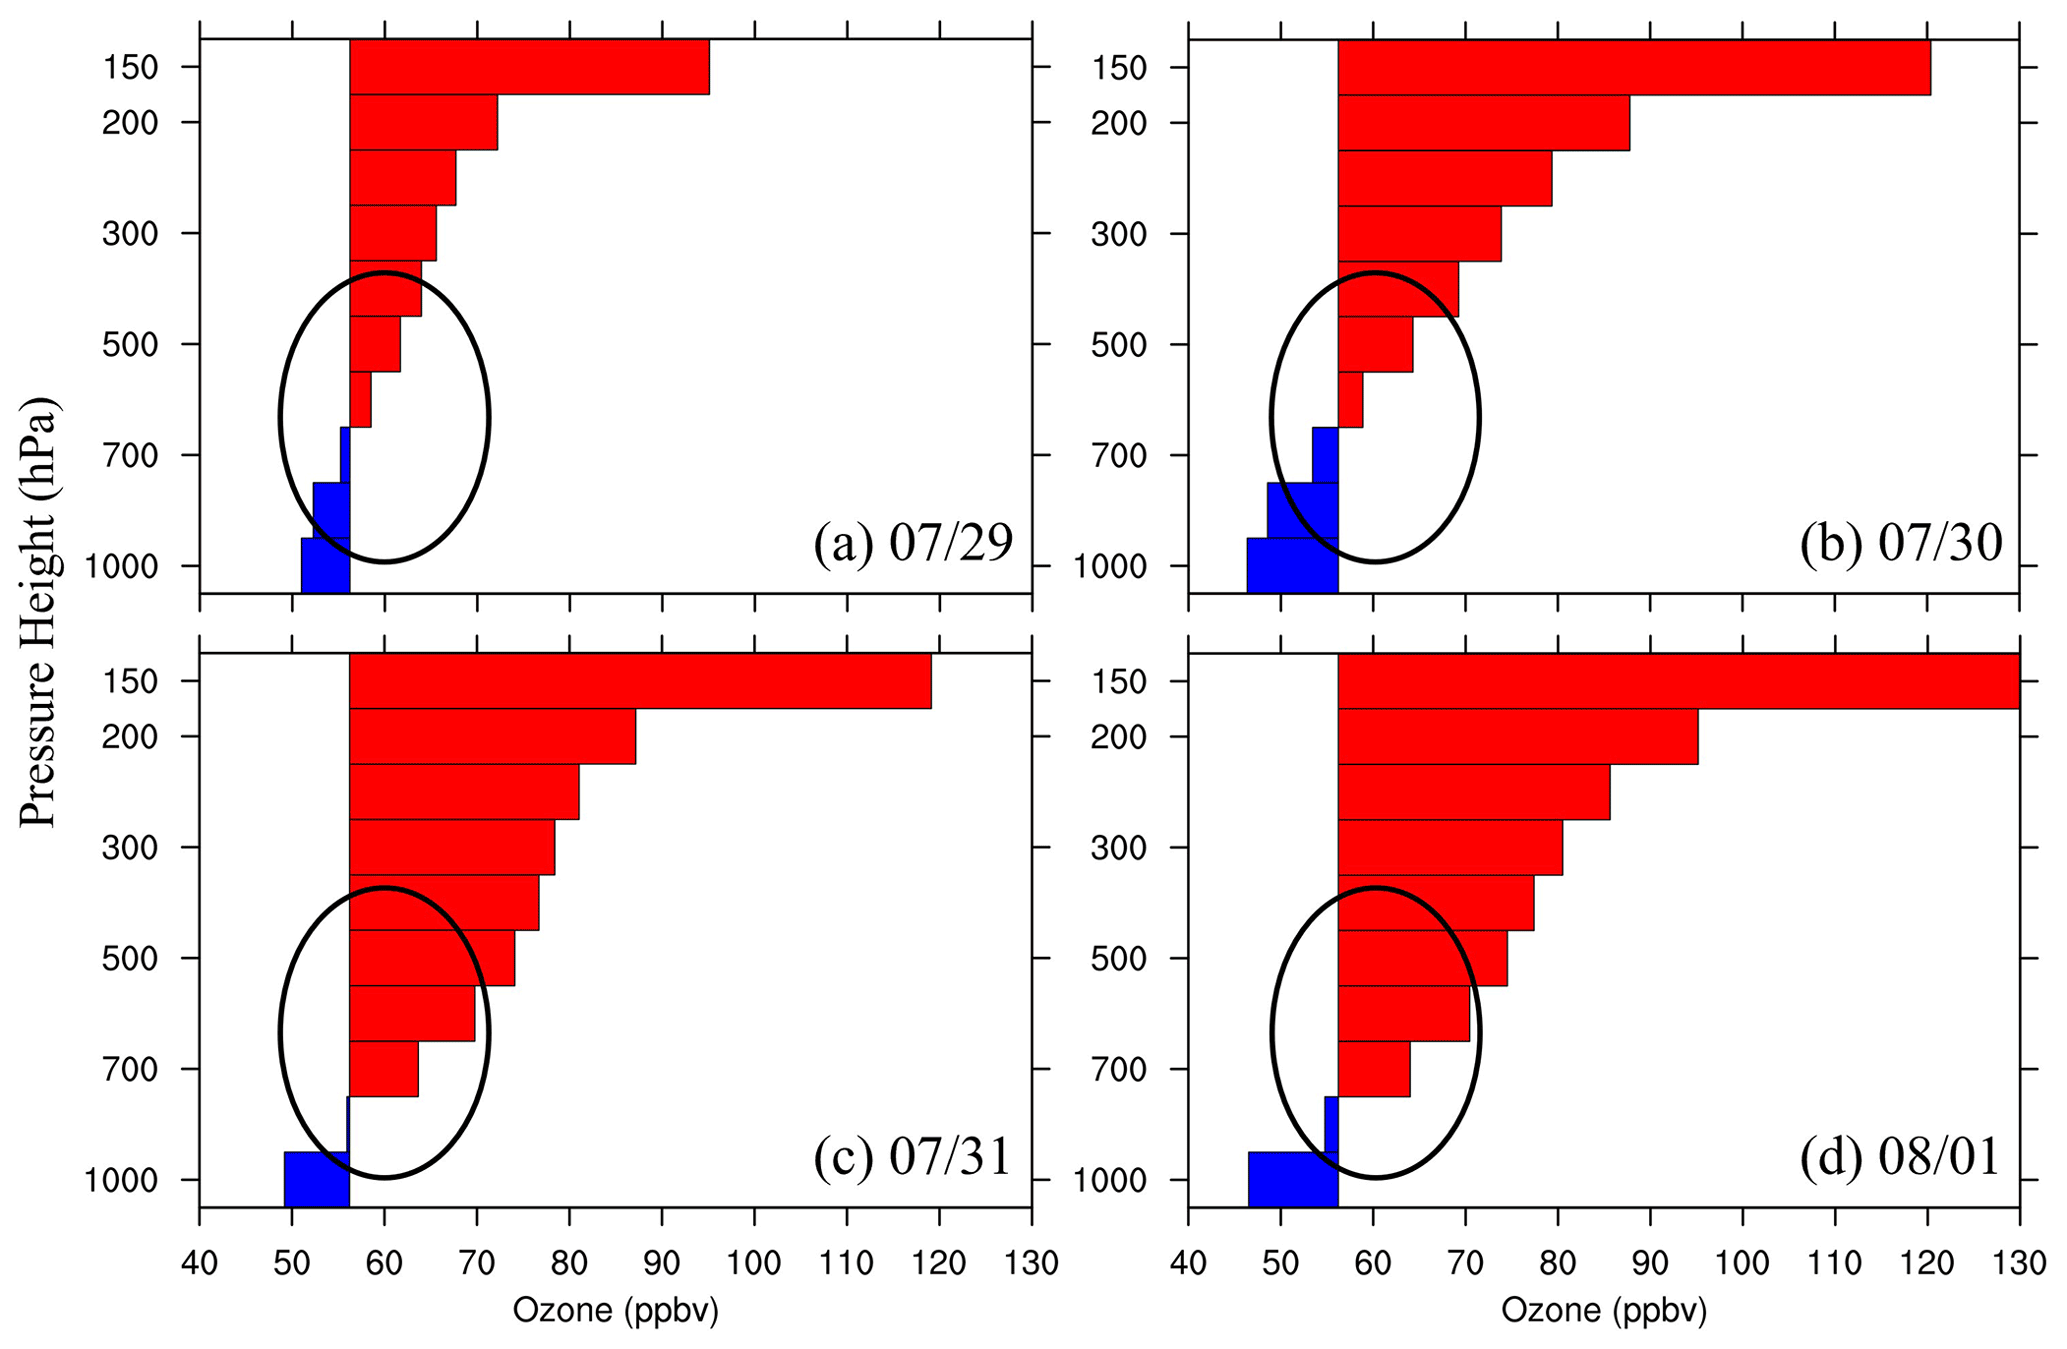
Figure 7Spatially averaged profiles of ozone concentrations (unit: ppbv) over the NCP from the TROPESS AIRS L2 ozone products on (a) 29 July, (b) 30 July, (c) 31 July, and (d) 1 August 2021, all indicated as month/day at the bottom right corners. The 10 d averaged ozone concentrations between the surface and 700 hPa over the NCP are used as the baseline, and positive (negative) departure from the 10 d averaged concentrations is shown in red (blue) color.
4.2 Convection-facilitated stratospheric intrusion and transport pathways of ozone-rich air mass
The above analyses reveal a large-scale downward intrusion of stratospheric air to the lower troposphere under the influence of dissipating Typhoon In-fa. However, the responses of surface ozone concentrations differed spatially (Fig. 2), which leaves an important question: how was stratospheric ozone-rich air transported to the surface? To be more exact, what are the mechanisms responsible for the final descent of a stratospheric air mass to the surface? Previous studies indicated that deep convection with overshooting tops can effectively transport stratospheric ozone-rich air to the surface (e.g., Poulida et al., 1996; Hu et al., 2010; Pan et al., 2014a). Such convective redistribution of ozone in vertical profile is driven by dynamical processes, in which vigorous upward motions penetrate into the stratosphere and induce compensating subsidence of stratospheric ozone-rich air. Here, the MCSs formed and passed through the NCP at night on 31 July 2021. In this section, we illustrate how the MCSs facilitated the final descent of a stratospheric air mass to the surface.
Figure 8 shows the hourly radar mosaic observations on the night of 31 July and 1 August 2021 during which ozone concentrations at the ground stations exceeded 80 ppbv. At 20:00 LST on 31 July 2021 (1 h after sunset; Fig. 8a), two convective cells were located southwest and northeast of Hengshui, and many stations still maintained high ozone concentrations accumulated from the daytime photochemical reactions. The northeastern convective cell developed rapidly, with increasing horizontal areal coverage, and evolved into bow-echo MCSs, whereas the southwestern cell gradually weakened (Fig. 8b–f). Bow echoes are the bow-shaped segment of radar reflectivity structures within squall lines that can persist for several hours and are associated with damaging winds near the apex of the bow, particularly when the rear inflows descend to the surface. The rear inflows originate from the rear anvil cloud of the stratiform region and descend toward the leading convective line. They are driven by the diabatic cooling processes at the middle levels, in which precipitation particles falling from the stratiform clouds evaporate, melt, and cool the air (Keene and Schumacher, 2013; French and Parker, 2014). The number of stations with high ozone concentrations decreased as a result of titration effect and dry deposition; however, significant surface ozone enhancement occurred in the convective downdraft regions along with the development and propagation of bow-echo MCSs. For example, the surface ozone (CO) concentrations increased (decreased) abruptly when the bow echoes passed through Binzhou and Jinan. As the bow-echo MCSs kept traveling southeastward, the downstream of regions of convection such as Weifang experienced convective downdrafts and hence ozone surge subsequently (Fig. 2). Although in regions where convective activities were weak or absent such as Qingdao and Weihai, despite the high ozone episode that lasted more than several hours, the surface ozone enhancement at midnight was not coincident with CO reduction, suggesting that the stratospheric air mass might not have reached the surface.
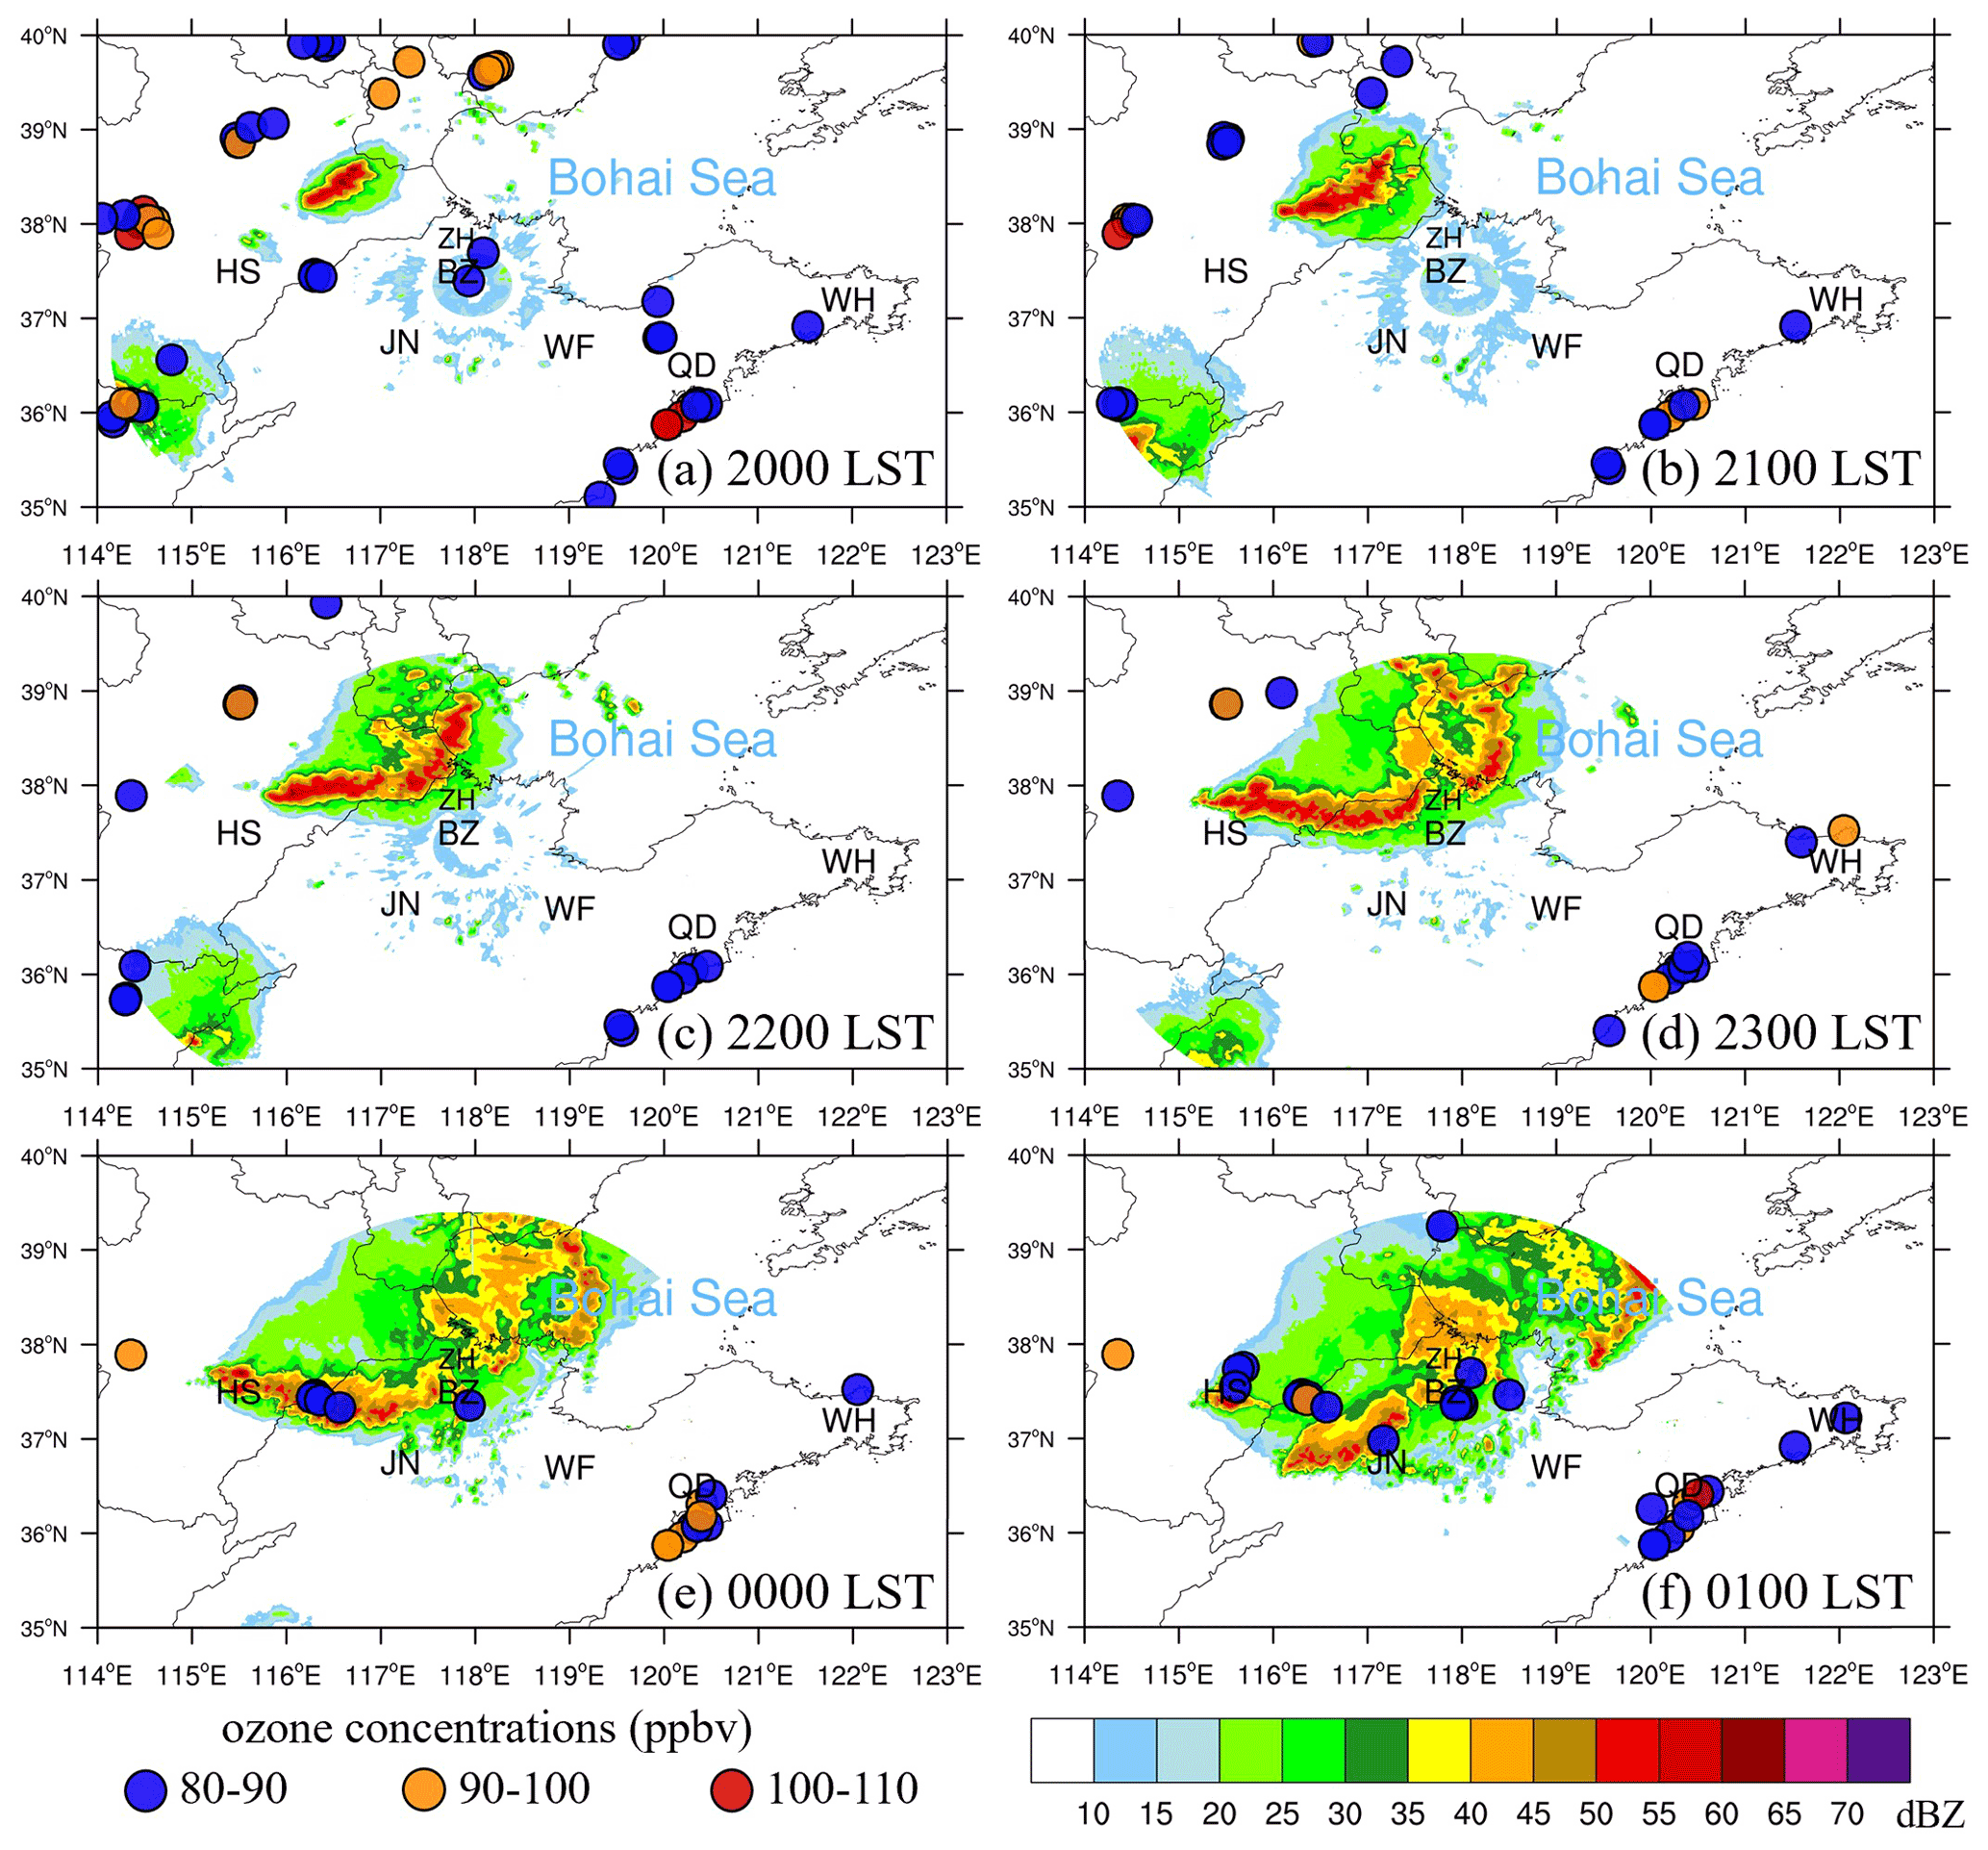
Figure 8(a)–(f) Observed radar reflectivity structure (shaded; dBZ) of the bow-echo MCSs at night on 31 July 2021. Stations with high ozone concentrations are mapped by large circles in different colors. Stations with ozone concentrations less than 80 ppbv are not displayed for clearness.
With reference to radar radial wind observations (not shown here), the descending rear inflows of bow echoes exceeded 25 m s−1 from the trailing cloud region and hence brought down the stratospheric ozone-rich air mass located at 900–500 hPa. Different than the case studies of deep convection with overshooting tops reaching stratosphere (e.g., Pan et al., 2014a), the bow-echo MCSs in this case were relatively weak and did not penetrate to the tropopause altitudes. Figure S8 shows the temporal evolution of vertical radar reflectivity profiles over Jinan and Binzhou. Following the standard World Meteorology Organization (WMO) lapse-rate criterion (Reichler et al., 2003), the thermal tropopause height was 15.8 km based on the nearest sounding collected in Jinan station at 20:00 LST on 31 July 2021. The overall radar reflectivity structure over Jinan and Binzhou did not reach the thermal tropopause height, and the strong radar reflectivities were confined below an altitude of 6 km (480 hPa, −9 ∘C) suggesting limited vertical extension of convective storms. Lightning flashes are indicative of vertical development of a thunderstorm (e.g., Qie et al., 2021). A total of 362 cloud-to-ground lightning flashes were detected from 21:00 LST on 31 July to 06:00 LST on 1 August 2021 within a 50-km radius of Zhanhua station. It is inferred that the bow-echo MCSs were weakly electrified owing to shallow extension above the freezing level. Owing to the pre-existing stratospheric ozone-rich air mass located in the lower troposphere under the influences of the dying typhoon (Fig. 5), the middle level rear inflows can facilitate the downward transport of ozone to the surface even though the convection was relatively shallow and weak. This case provides new insights into the interactions between synoptic-scale and mesoscale atmospheric processes that enable the direct stratospheric intrusion to the surface.
To better depict the convective-scale transport pathways facilitating the final descent of a stratospheric ozone-rich air mass to the surface, high-resolution WRF simulations of the bow-echo MCSs were performed and used to drive backward trajectories using the FLEXPART model. Figure 9 shows the WRF-simulated radar reflectivity structure of the bow-echo MCSs. Compared with the radar observations shown in Fig. 8, the WRF simulation reproduced the two convective cells distributed in the southwestern and northeastern regions of Hengshui, respectively (Fig. 9a), although the regions associated with high radar reflectivity are larger than the observations. Despite slightly overforecasted convection coverage, the WRF simulation does a good job capturing the subsequent dissipation of the southwestern cell and the evolution of the northeastern cell into bow echoes passing through Binzhou and Jinan (Fig. 8b–f vs. Fig. 9b–f). Furthermore, the simulations were quantitatively evaluated against observations as represented in the categorical performance diagram, which is an evaluation technique commonly used in convective-scale data assimilation and forecasting (Roebber, 2009). The performance diagram merges multiple metrics, including bias, POD (probability of detection), SR [success ratio, = 1-FAR (false alarm rate)], and CSI (critical success index) into one graph, and simulations lie on the upper-right corner of the diagram. As shown in Fig. S9, the POD for 30 dBZ radar reflectivity threshold exceeds 0.7, and the SR and CSI increased steadily as the MCSs pass through Binzhou and Jinan, suggesting the satisfactory simulations from WRF. Given the general agreement between the simulations and observations, we use the output from this high-resolution model to address the transport pathways of stratospheric ozone-rich air from the upper troposphere to the surface.
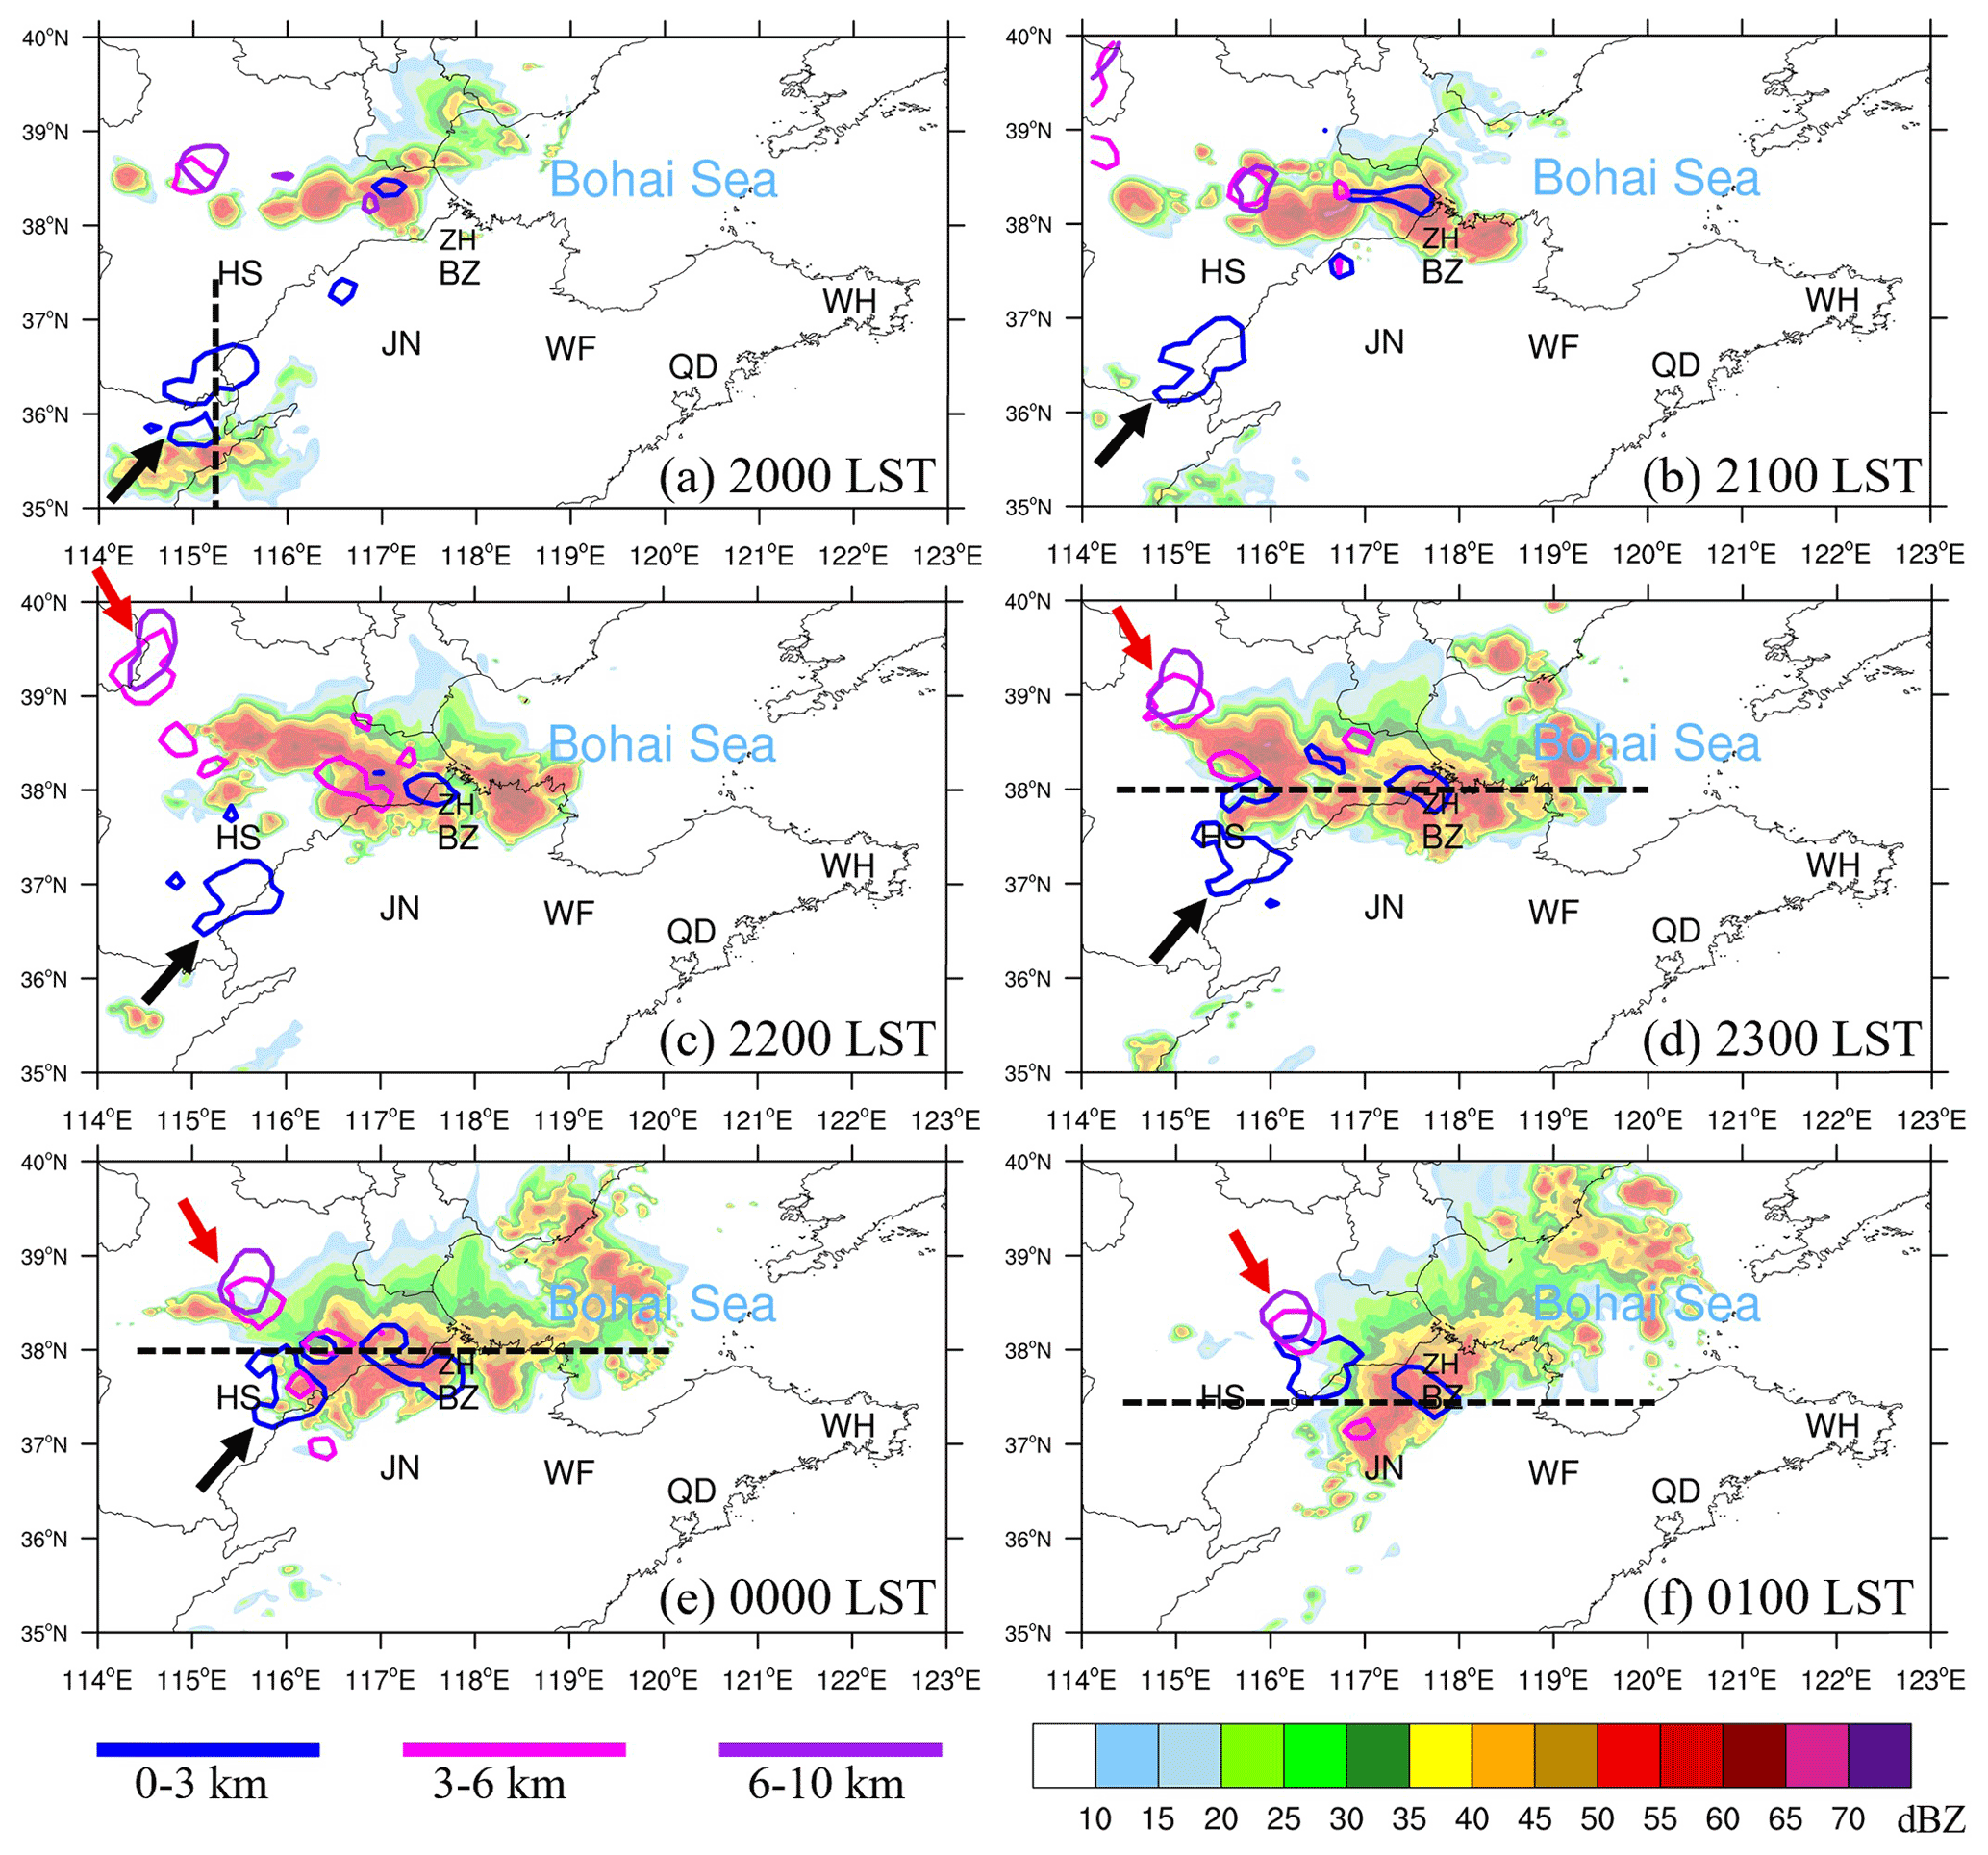
Figure 9(a)–(f) WRF-simulated radar reflectivity structure (shaded; dBZ) of the bow-echo MCSs that occurred during the night of 31 July 2021. The solid lines represent regions with high tracer particle counts released in Binzhou between 0 and 3 km (blue lines), 3 and 6 km (magenta lines), and 6 and 10 km (purple lines). The dashed black lines are the cross-section lines used in Fig. 11. The red and black arrows highlight the movements of the tracer particles.
In this large-scale stratospheric intrusion event, the surface ozone concentrations increased abruptly and vigorously at cities Jinan, Binzhou, and Weifang (Fig. 2) when the bow-echo MCSs passed through. Although the surface ozone enhancement was not coincident with CO reduction in Qingdao and Weihai (Figs. 2 and 3) where convection was weaker or absent. Through the FLEXPART simulations driven by the meteorology field from the WRF model, two scenarios concerning ozone transport were designed and the backward trajectories of tracer particles were analyzed. In the first scenario, tracer particles were released in Binzhou between 1000 and 950 hPa at 04:00 LST on 1 August, when the stratospheric air mass had reached the surface (referred to in Figs. 2 and 4). In the second scenario, tracers were released at Qingdao in order to examine the contribution of convection to the surface ozone surge. Figure 10 shows the temporal variations in vertical tracer particle counts in each of the scenarios. with reference to the three-dimensional location of tracers in backward time. In the Binzhou release scenario, the upper boundary of vertical distributions of tracers was approximately 11 km on 31 July 2021, whereas the thermal tropopause height was 15.8 km. Therefore, it can be inferred that the stratospheric ozone-rich air mass that reached the surface was not freshly produced from wrapping and shedding of stratospheric air by the MCSs (Pan et al., 2014a). Before convection formed (09:00–20:00 LST here), the tracer particles concentrated between 4 and 6 km, corresponding to the large-scale intrusion of stratospheric air toward the middle-to-low troposphere under the influence of the dying Typhoon In-fa. During this slow descending phase, the distribution of tracers was typical of a filamentary structure owing to the weak large-scale descending motions. As convection developed and evolved into bow-echo MCSs, there were two periods with rapidly descending tracers. The former rapidly descending phase took place at 20:00 LST at 2 km, whereas the latter occurred at 23:00 LST at 3 km, which is analyzed in detail in the following part. In the Qingdao release scenario, although the distribution of tracers extended up to 10 km, quite a large portion of tracers remained below 1 km on 31 July 2021, suggesting that surface ozone in Qingdao mainly originated within the boundary layer and hence was faintly influenced by the stratospheric air mass. The distinctly different distribution patterns between the two scenarios indicate that convection has a considerable influence on facilitating the final descent of stratospheric air to the surface.
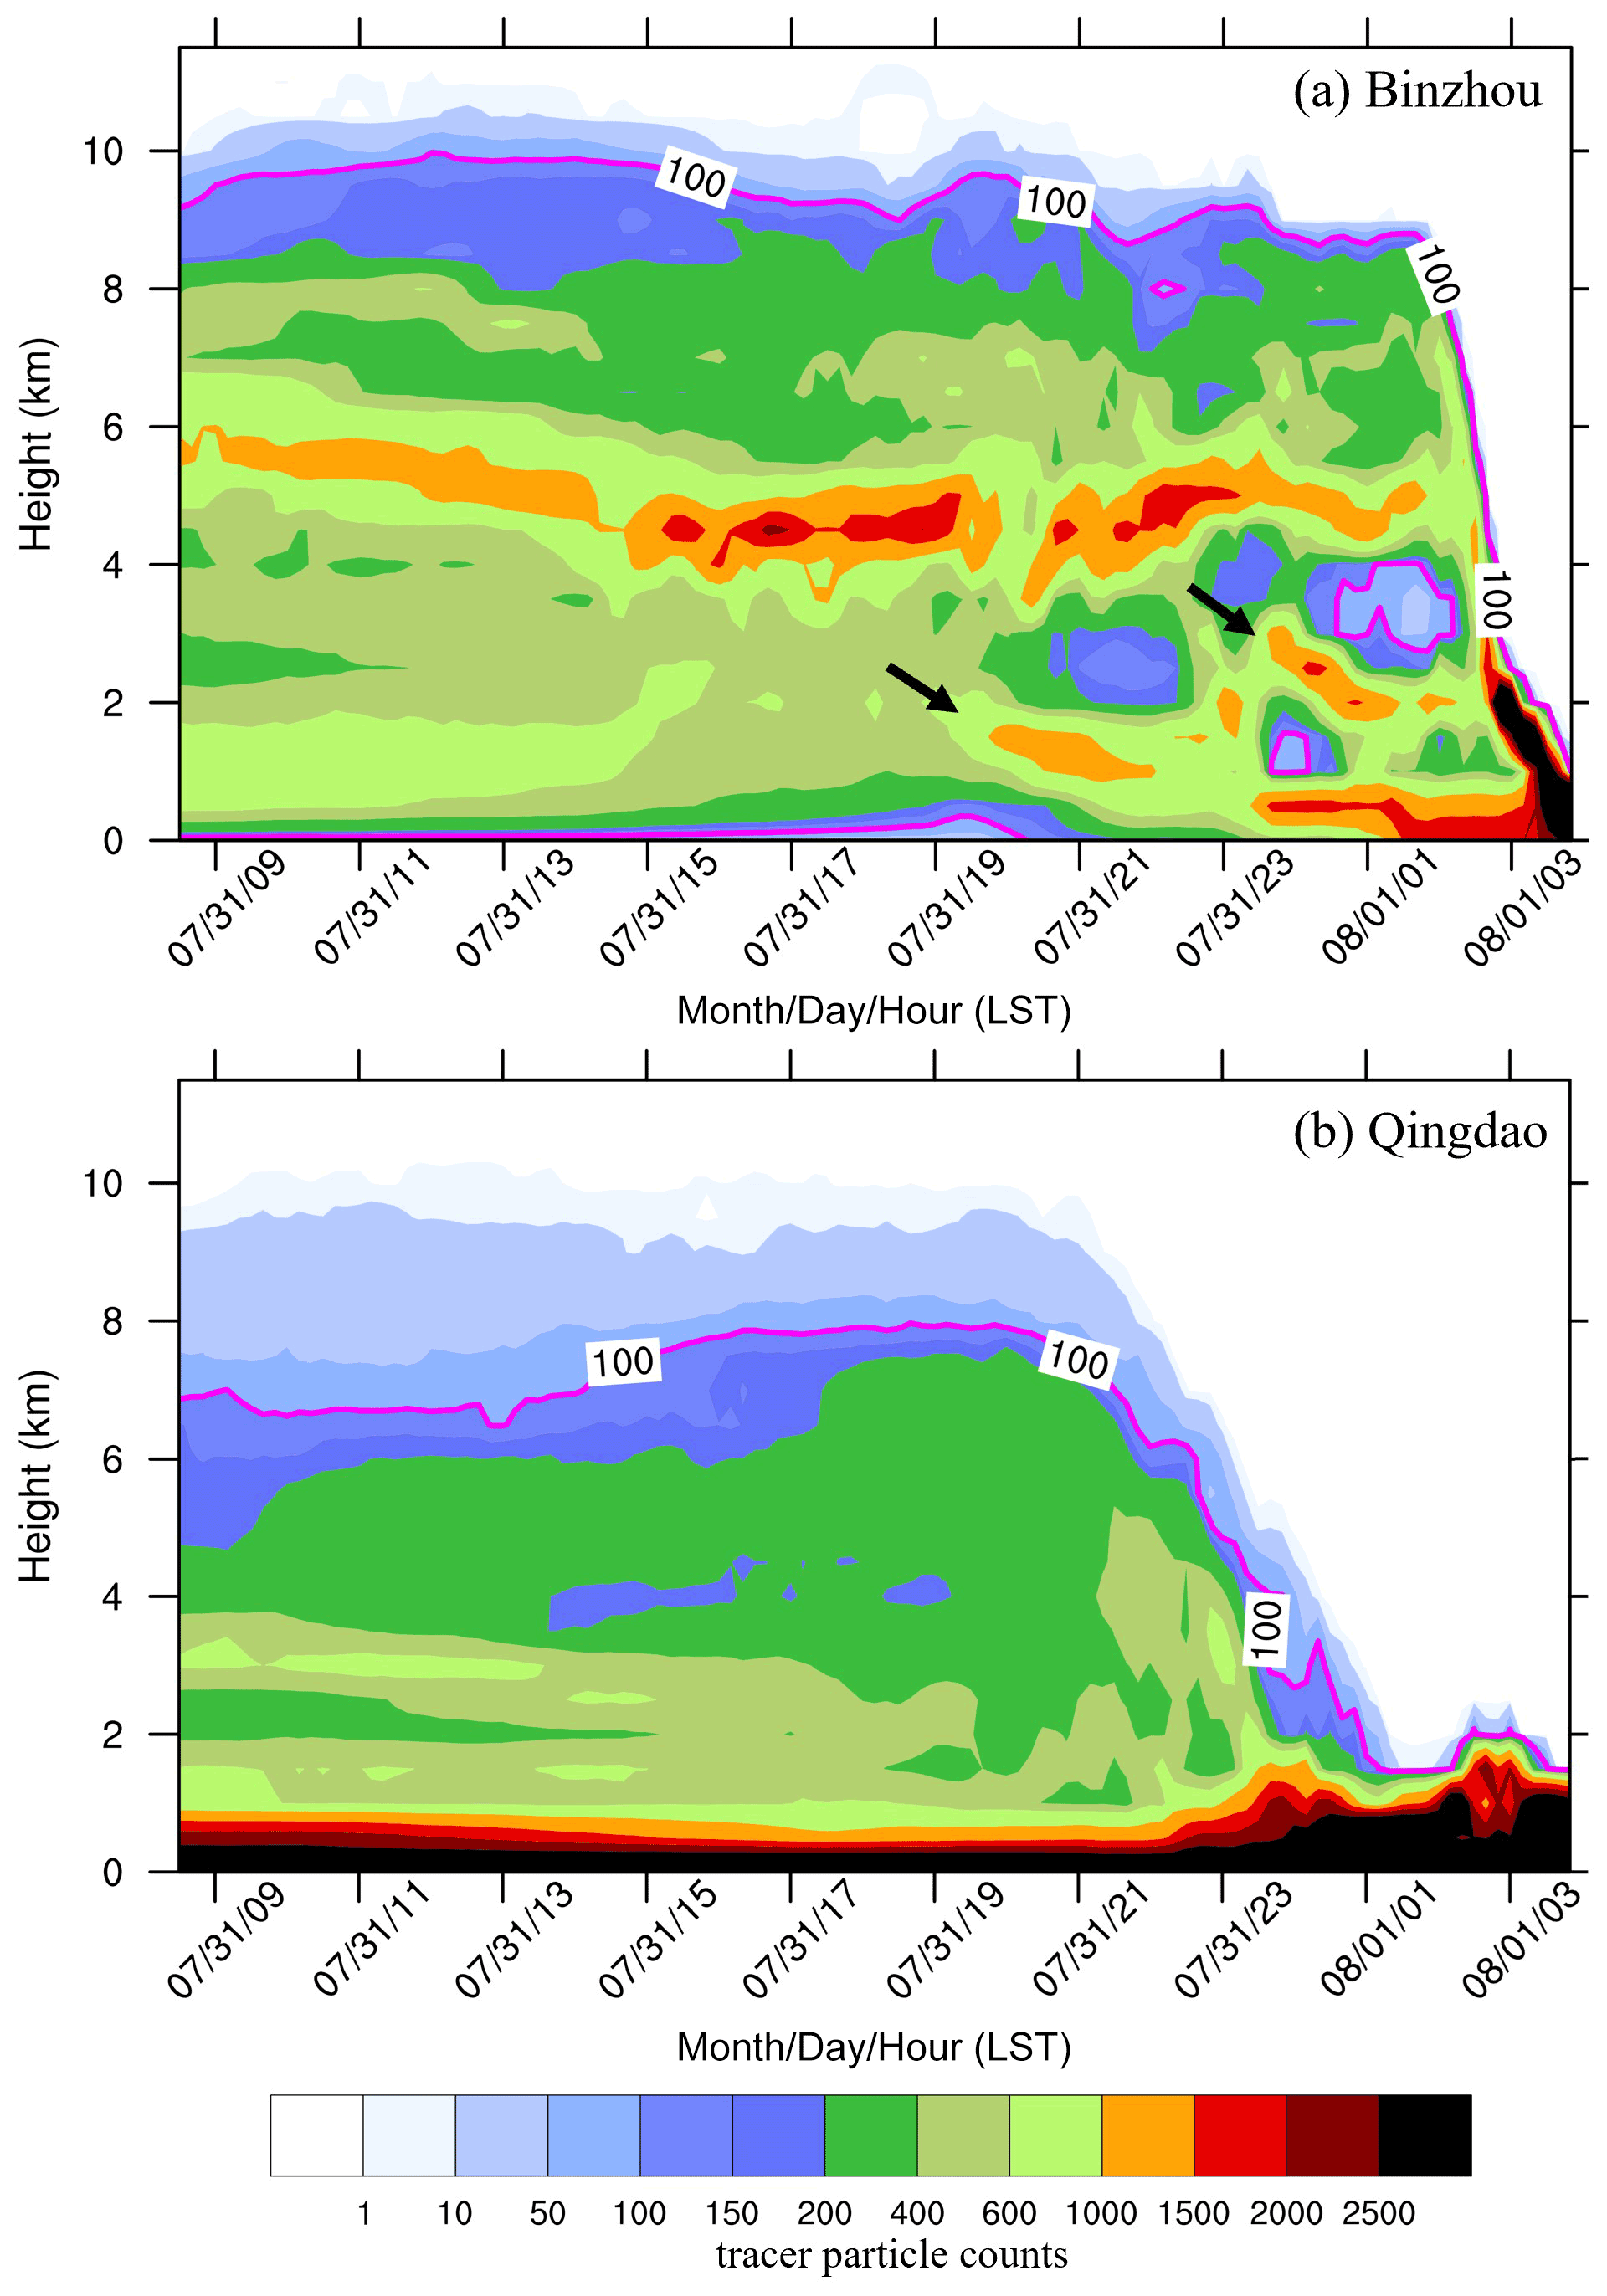
Figure 10Temporal variations in vertical tracer particle counts released at (a) Binzhou and (b) Qingdao. Tracer particle counts with a value of 100 (equalling 1 % of the total number of released tracers) are highlighted by magenta lines. The black arrows highlight the two rapidly descending phases of stratospheric air.
A key scientific aspect concerning stratospheric impacts on surface ozone is how the stratospheric air mass reaches the surface. The backward trajectories of tracers during the two rapidly descending phases in the Binzhou release scenario were used here to address the convective-scale transport pathways of stratospheric air to the surface. We separated the distributions of tracer particles within the low (0–3 km), middle (3–6 km), and high (6–10 km) levels, and superimposed them on the radar reflectivity evolution of the MCSs (Fig. 9). During the first rapidly descending phase at 20:00 LST on 31 July, a low-level region with high tracer particle counts (black arrow in Fig. 9) appeared in the northern flank of the southwestern convective cell and propagated northeastward to Binzhou. The cross-section of southwestern cell and tracer distributions (Fig. 11a) indicates that the low-level tracers were transported by the widespread outflow winds between 0 and 3 km. At 20:00 LST, the stratospheric ozone-rich air mass had likely been transported to the surface by the dissipation of the southwestern cell (referred to in the high surface ozone concentrations in Fig. 8a–c), and the ozone-rich air mass was transported horizontally by the downdraft outflows of the southwestern cell toward Binzhou.
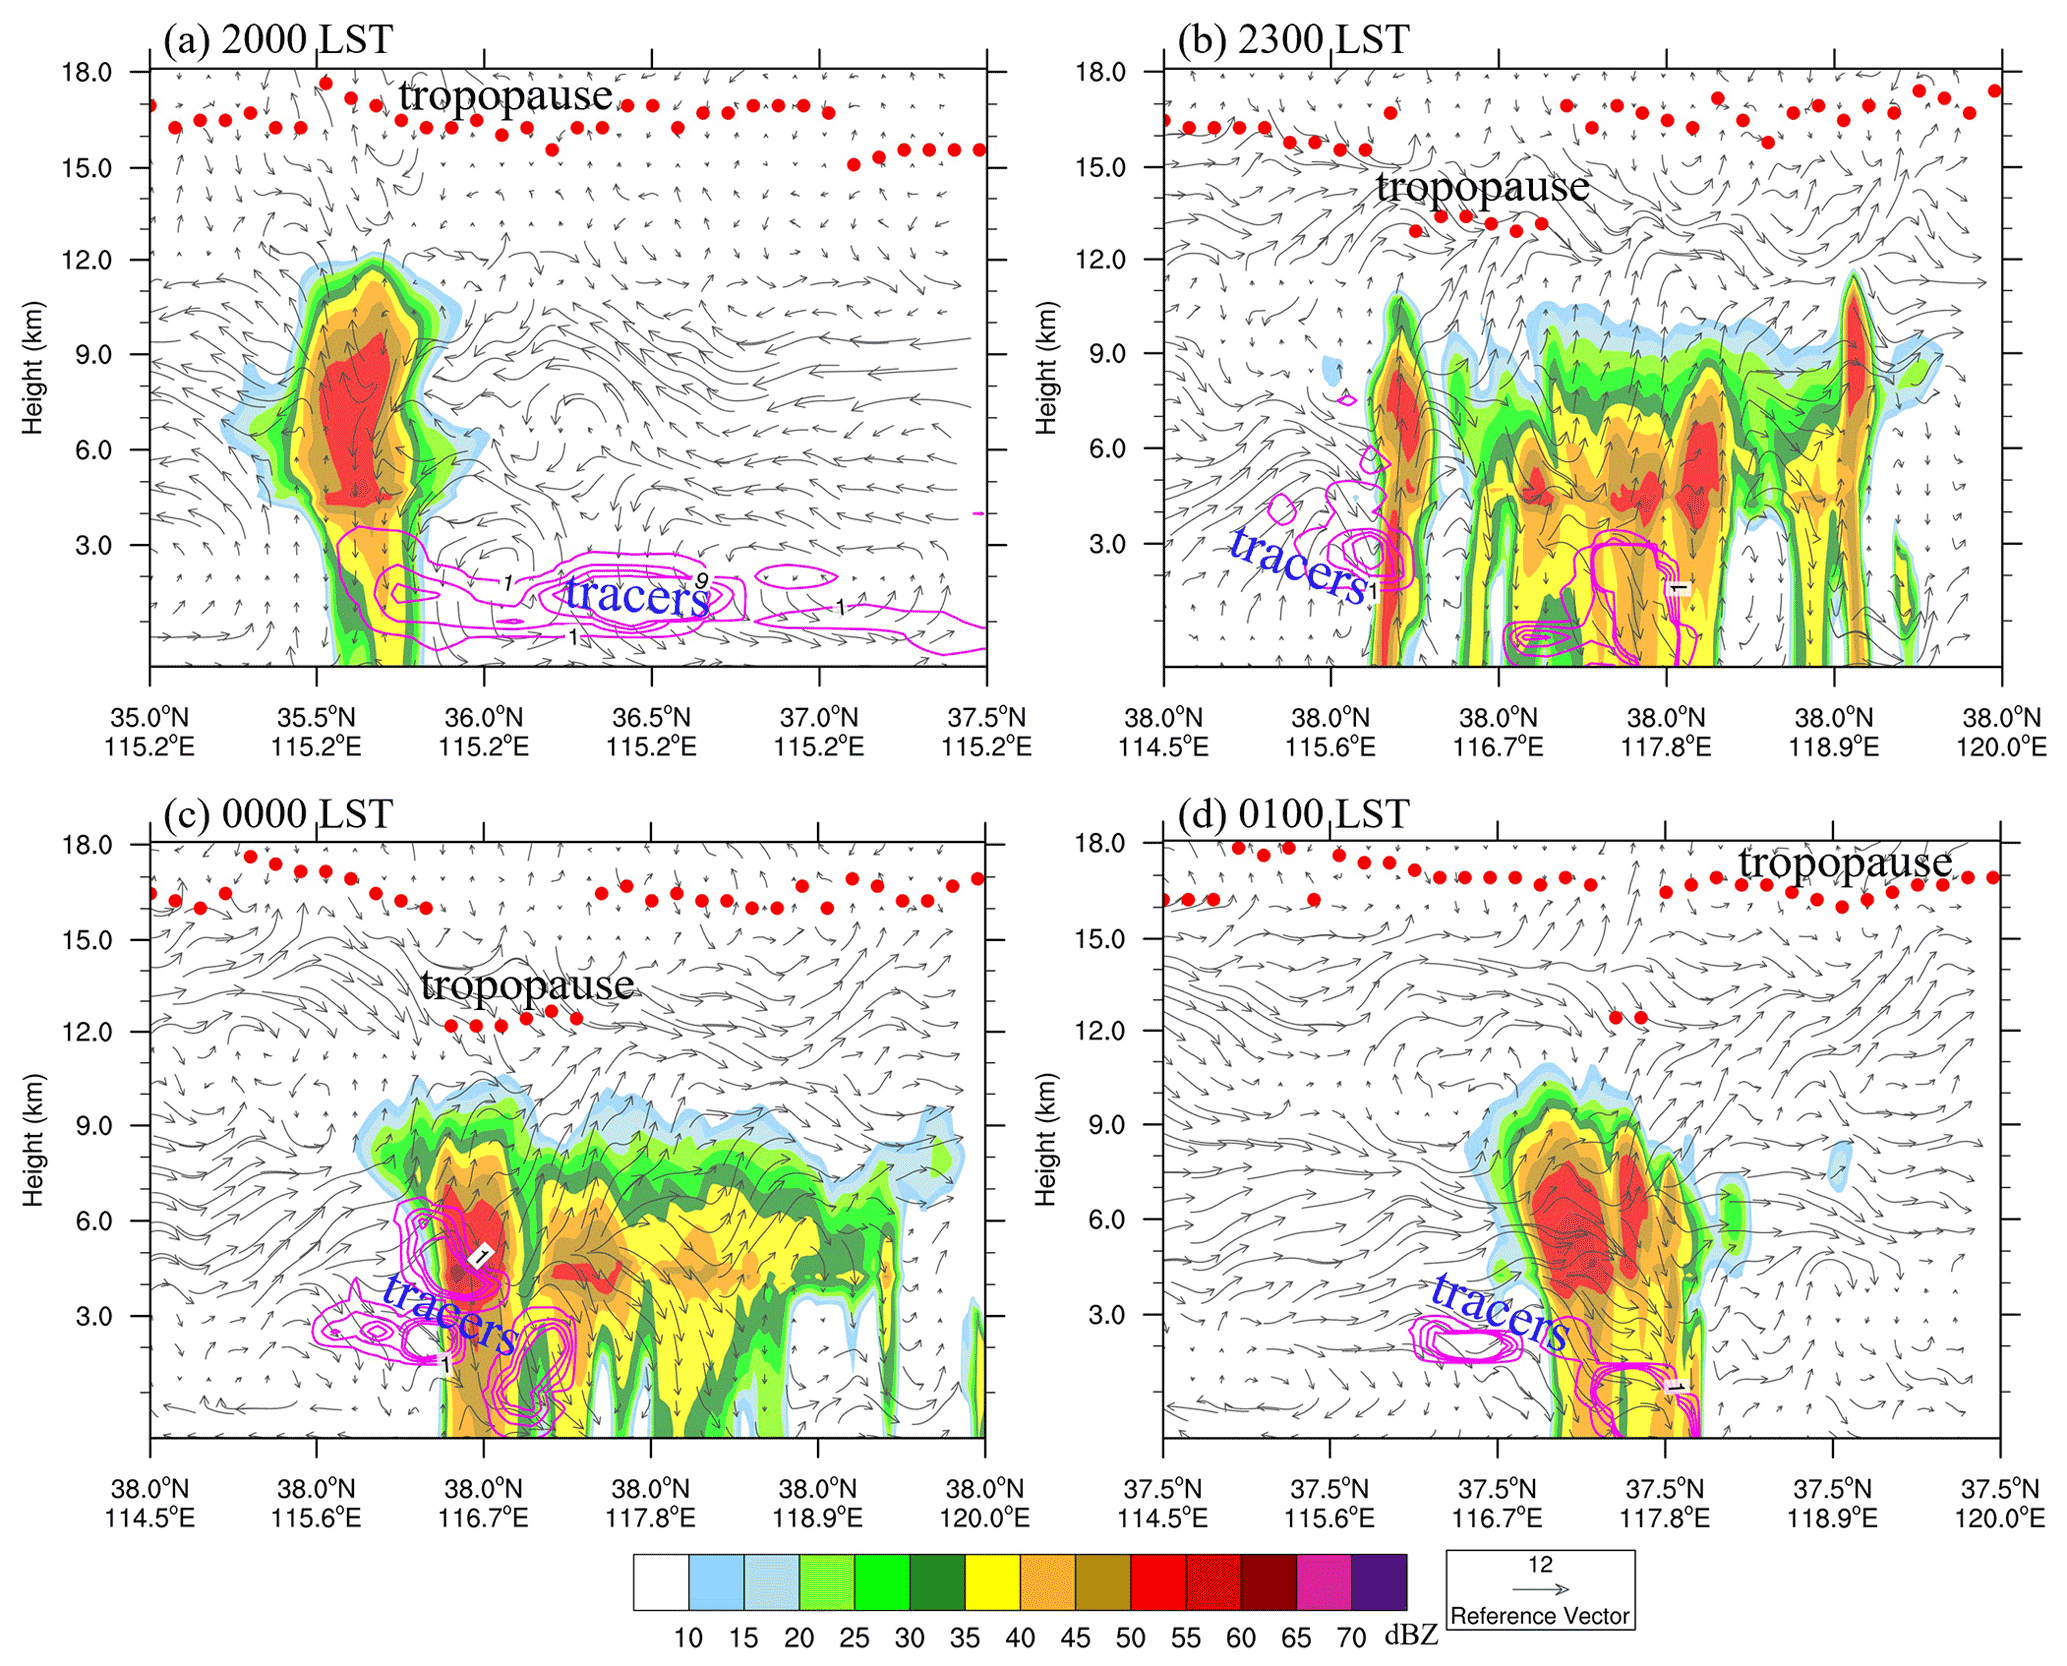
Figure 11Cross sections of WRF-simulated radar reflectivity structure (shaded; dBZ), tracer particle counts from the FLEXPART model (magenta lines, the value of the outmost contour line is 1 and the contour interval is 2) and wind flows (vectors) at (a) 20:00 LST and (b) 23:00 LST on 31 July, and at (c) 00:00 LST and 01:00 LST on 1 August 2021. The red circles represent the thermal tropopause height calculated from WRF simulations. The cross-section lines are shown in Fig. 9.
In addition to the horizontal transport of ozone at low levels by the southwestern cell, the middle- and high-level regions with high tracer particle counts expanded in the rear part of the northeastern convective cell that evolved into bow echoes. During the second rapidly descending phase, a significant rearward-sloping configuration of regions with high tracer particle counts was noticeable from low to high levels (red arrow in Fig. 9). We performed cross-section analyses of the bow-echo MCSs (Fig. 11b–c), and the results clearly show a rearward pathway through which the stratospheric ozone-rich air mass was transported to the surface by the rear inflows descending from stratiform clouds to the leading convective line. Although the tropopause was perturbed and hence deformed by convective dynamics, the bow-echo MCSs did not penetrate the tropopause significantly and were not likely to bring down fresh stratospheric air from the cloud edges. Instead, because of the pre-existing stratospheric air mass located at 3–6 km, rear inflows of the MCSs originating at the middle level could easily facilitate the downward transport pathways for stratospheric ozone to reach the surface. Previous studies documented the downward transport of stratospheric ozone occurring both in the rearward anvil and in the forward anvil (Stenchikov et al., 1996; Pan et al., 2014a), and that the transport in the forward anvil is more rapid (Phoenix et al., 2020), although in this case, there only existed rearward transport pathways for a stratospheric ozone-rich air mass, probably because of the relatively weak and shallow structure of the MCSs.
In this paper, we report an unusual surface ozone surge event of stratospheric origin that occurred at night (from 23:00 LST on 31 July to 06:00 LST on 1 August 2021) over the North China Plain (NCP), where the population is high and agricultural crops are plentiful. However, the impact of stratospheric influence on surface ozone over the NCP is rarely documented. According to ground-based atmospheric composition observations, satellite ozone profile products, meteorological data, including radiosonde and radar observations and MERRA-2 reanalysis products, we confirmed the stratospheric influences of this unusual night=time surface enhancement and documented the evolution and magnitude of the surface ozone surge in detail. The mechanisms responsible for this direct stratospheric intrusion to reach the surface and the transport pathways of ozone-rich air were investigated using high-resolution model simulations and backward trajectory analyses. The conclusions are drawn as follows:
-
Evolution and magnitude of the surface ozone surge.
The surface ozone surge mainly occurred between 23:00 LST on 31 July and 06:00 LST on 1 August 2021 over the NCP and swept southeastward with a large spatial coverage (at least 300 km × 300 km). Instead of decreasing continuously after sunset as normal, surface ozone increased abruptly and significantly. Surface ozone concentrations at midnight in the cities of Hengshui, Binzhou, Jinan, and Weifang reached 80–90 ppbv in succession and were nearly twice as large as the baseline ozone concentrations. Referring to the high-frequency measurements, the ozone concentrations at Zhanhua station surged from 31 to 80 ppbv within 10 min, indicating that the stratospheric air mass can enhance surface ozone by 40–50 ppbv within a short time period. A concurrent vigorous decline in surface CO concentrations was observed, which suggested that the surface ozone surge might have been caused by stratospheric intrusion of ozone-rich and CO-poor air. This is further confirmed by the vertical evolutions of humidity and ozone profiles during the night, based on radiosonde and satellite data respectively. In terms of magnitude, covering areas, abruptness, and duration, such a stratospheric impact on surface ozone is rarely documented.
-
Mechanisms for the direct stratospheric intrusion to reach the surface.
The vigorous surface ozone enhancement was induced by the multi-scale interactions between the dying Typhoon In-fa and local MCSs. Although the typhoon was in its dissipation stage after a 5 d journey over land, it can still perturb the tropopause and maintain the downward motions over the NCP that brought down a dry and ozone-rich air mass, as seen in the reanalysis data as well as moisture and ozone profiles. Before the local MCSs occurred, the air mass with stratospheric origin had descended to the middle-to-low troposphere (900–500 hPa) over the NCP. The local bow-echo MCSs facilitated the final descent of a stratospheric air mass to the surface through the development of convective downdrafts. Significant surface ozone enhancement occurred in the convective downdraft regions during the development and propagation of the bow-echo MCSs, whereas at stations where convective activities were weak or absent, the surface ozone and CO evolutions during the night were not in a high-ozone and low-CO pattern, suggesting that stratospheric air mass did not reach the surface.
-
Transport pathways of ozone-rich air to the surface.
In the face of pre-existing stratospheric air mass, the rear inflows of the bow-echo MCSs transported the ozone-rich air mass downward from the mid-level rear stratiform cloud to the leading convective line and eventually to the surface. Compared with the large-scale descending processes associated with the dying typhoon, the convection-facilitated transport processes of ozone were faster. Based on high-resolution simulations and trajectory analysis, two convective-scale transport pathways responsible for ozone enhancement at station sites were identified. The direct pathway was the vertical transport of ozone through rear inflows of convection, which can effectively bring down the ozone-rich air mass to the surface. The indirect pathway mainly involved the horizontal transport of ozone by mature storms that had already brought down the ozone-rich air mass.
Previous studies found the association between stratospheric intrusions and strong convection, for example, intensive typhoons before making landfall (e.g., Meng et al., 2022) and thunderstorms with over-shooting tops. This study provides new insight into the interactions between synoptic-scale and mesoscale atmospheric processes that enable a direct stratospheric intrusion to reach the surface. The typhoon in this case was in its dissipation stage, and the local MCSs were relatively shallow (up to 6 km) and weak without any obvious over-shooting features. However, the dying typhoon can still induce substantial stratospheric intrusions reaching the middle-to-low troposphere, and the weak MCSs further facilitated the intrusion-carried ozone to contact the surface. This kind of multi-scale stratospheric intrusions with great ozone enhancement can pose unexpected threats to human health and vegetation growth. Over a short timescale, the timely warning and prediction of such ozone surges associated with multi-scale interactions of atmospheric processes are important for ecosystem wellbeing, which requires a deeper understanding of the mechanisms of convective redistribution of vertical ozone profiles in the atmosphere. In addition, the chemical consequences of vigorous ozone surges for air quality should be further explored in order to issue appropriate management policies. Over longer timescales, a proper analysis of the frequency and magnitude of convection-driven (including weak convection) ozone changes is crucial to better differentiate the natural and anthropogenic contributions to the rapid ozone increase in the region (Lu et al., 2018; Li et al., 2019; Han et al., 2020). As such dynamical transports of ozone associated with convection are inexplicitly expressed in global chemistry climate models, the stratospheric ozone input to the troposphere and the ABL is probably underestimated (Pan et al., 2014a). In the context of global warming, the frequency and intensity of convection are projected to increase, which underscores the necessity of incorporating these processes into the global models.
The surface air pollutant observations obtained from the China National Environmental Monitoring Centre are archived at https://quotsoft.net/air (Wang, 2022) and are available from the authors upon request. The MERRA-2 reanalysis meteorological data can be downloaded from https://gmao.gsfc.nasa.gov/reanalysis/MERRA-2 (Gelaro et al., 2017). Satellite-based ozone vertical profiles measured by the AIRS and the OMI under the NASA TRopospheric Ozone and Precursors from Earth System Sounding (TROPESS) project were obtained from https://tes.jpl.nasa.gov/tropess/products/o3/ (Verstraeten et al., 2013; Fu et al., 2018). The applied Weather Research and Forecasting with the Advanced Research core (WRF-ARW, Version 3.9.1) model is open-source code in the public domain maintained by the National Center for Atmospheric Research (NCAR; https://www2.mmm.ucar.edu/wrf/users/download/get_source.html; Skamarock et al., 2008). The Flexible Lagrangian particle dispersion model (FLEXPART) which uses the WRF model (FLEXPART-WRF, Version 3.3.2) was downloaded from https://www.flexpart.eu/wiki/FpLimitedareaWrf (Brioude et al., 2013). The data and model output are available for scientific investigations upon request.
The supplement related to this article is available online at: https://doi.org/10.5194/acp-22-8221-2022-supplement.
ZC and JL designed the study and performed the research, with contributions from all co-authors. YS, XC, ZC, and XL collected the observations and analyzed the data. XQ and RJ run the field campaign of the Shandong Triggering Lightning Experiment (SHATLE), and contributed to the backward trajectory analysis of tracers. ZC and JL wrote and revised the paper, with input from XC and MY. All authors commented on drafts of the paper.
The contact author has declared that neither they nor their co-authors has any competing interests.
Publisher’s note: Copernicus Publications remains neutral with regard to jurisdictional claims in published maps and institutional affiliations.
This article is part of the special issue “Atmospheric ozone and related species in the early 2020s: latest results and trends (ACP/AMT inter-journal SI)”. It is not associated with a conference.
The computing resources used in this study were provided by Fujian Normal University High Performance Computation Center (FNU-HPCC). Specifically, we thank Zongxiang Li for maintaining the atmospheric composition instruments in the field campaign. The authors would also like to thank the five anonymous reviewers for their suggestions and comments, which improved the paper.
This research has been supported by the National Natural Science Foundation of China (grant no. 42105079) and the Key Laboratory of Middle Atmosphere and Global Environmental Observation (grant no. LAGEO-2021-03).
This paper was edited by Martin Dameris and reviewed by five anonymous referees.
Akritidis, D., Pozzer, A., and Zanis, P.: On the impact of future climate change on tropopause folds and tropospheric ozone, Atmos. Chem. Phys., 19, 14387–14401, https://doi.org/10.5194/acp-19-14387-2019, 2019.
Aliaga, D., Sinclair, V. A., Andrade, M., Artaxo, P., Carbone, S., Kadantsev, E., Laj, P., Wiedensohler, A., Krejci, R., and Bianchi, F.: Identifying source regions of air masses sampled at the tropical high-altitude site of Chacaltaya using WRF-FLEXPART and cluster analysis, Atmos. Chem. Phys., 21, 16453–16477, https://doi.org/10.5194/acp-21-16453-2021, 2021.
Baray, J. L., Ancellet, G., Randriambelo, T., and Baldy, S.: Tropical cyclone Marlene and stratosphere–troposphere exchange, J. Geophys. Res., 104, 13953–13970, https://doi.org/10.1029/1999JD900028, 1999.
Betts, A. K., Gatti, L. V., Cordova, A. M., Dias, M. A. S., and Fuentes, J. D.: Transport of ozone to the surface by convective downdrafts at night, J. Geophys. Res.-Atmos., 107, LBA 13-1–LBA 13-6, https://doi.org/10.1029/2000JD000158, 2002.
Brioude, J., Cooper, O. R., Trainer, M., Ryerson, T. B., Holloway, J. S., Baynard, T., Peischl, J., Warneke, C., Neuman, J. A., De Gouw, J., Stohl, A., Eckhardt, S., Frost, G. J., McKeen, S. A., Hsie, E.-Y., Fehsenfeld, F. C., and Nédélec, P.: Mixing between a stratospheric intrusion and a biomass burning plume, Atmos. Chem. Phys., 7, 4229–4235, https://doi.org/10.5194/acp-7-4229-2007, 2007.
Brioude, J., Arnold, D., Stohl, A., Cassiani, M., Morton, D., Seibert, P., Angevine, W., Evan, S., Dingwell, A., Fast, J. D., Easter, R. C., Pisso, I., Burkhart, J., and Wotawa, G.: The Lagrangian particle dispersion model FLEXPART-WRF version 3.1, Geosci. Model Dev., 6, 1889–1904, https://doi.org/10.5194/gmd-6-1889-2013, 2013 (data available at: https://www.flexpart.eu/wiki/FpLimitedareaWrf, last access: 20 June 2022).
Chan, C. Y., Chan, L. Y., Harris, J. M., Oltmans, S. J., Blake, D. R., Qin, Y., Zheng, Y. G., and Zheng, X. D.: Characteristic of biomass burning emission sources, transport, and chemical speciation in enhanced springtime tropospheric ozone profile over Hong Kong, J. Geophys. Res., 108, 4015, https://doi.org/10.1029/2001JD001555, 2003.
Chen, F. and Dudhia J.: Coupling an advanced land surface – hydrology model with the Penn State – NCAR MM5 modeling system, Part I: Model implementation and sensitivity, Mon. Wea. Rev., 129, 569–585, https://doi.org/10.1175/1520-0493(2001)129<0569:CAALSH>2.0.CO;2, 2001.
Chen, L., Zhang, Y., Lu, W., Zheng, D., Zhang, Y., Chen, S., and Huang, Z.: Performance evaluation for a lightning location system based on observations of artificially triggered lightning and natural lightning flashes, J. Atmos. Ocean. Tech., 29, 1835–1844, https://doi.org/10.1175/JTECH-D-12-00028.1, 2012.
Chen, Z., Liu, J., Cheng, X., Yang, M., and Wang, H.: Positive and negative influences of typhoons on tropospheric ozone over southern China, Atmos. Chem. Phys., 21, 16911–16923, https://doi.org/10.5194/acp-21-16911-2021, 2021.
Cooper, O. R., Trainer, M., Thompson, A. M., Witte, J. C., Oltmans, S. J., Morris, G., Pickering, K. E., Crawford, J. H., Chen, G., Cohen, R. C., Bertram, T. H., Wooldridge, P., Perring, A., Brune, W. H., Merrill, J., Moody, J. L., Tarasick, D., Nédélec, P., Forbes, G., Newchurch, M. J., Schmidlin, F. J., Johnson, B. J., Turquety, S., Baughcum, S. L., Ren, X., Fehsenfeld, F. C., Meagher, J. F., Spichtinger, N., Brown, C. C., McKeen, S. A., McDermid, I. S., and Leblanc, T.: Large upper tropospheric ozone enhancements above midlatitude North America during summer: In situ evidence from the IONS and MOZAIC ozone measurement network, J. Geophys. Res.-Atmos., 111, D24S05, https://doi.org/10.1029/2006JD007306, 2006.
Davies, T. and Schuepbach, E.: Episodes of high ozone concentrations at the earth's surface resulting from transport down from the upper troposphere/lower stratosphere: a review and case studies, Atmos. Environ., 28, 53–68, 1994.
Del Genio, A. D., Yao, M. S., and Jonas, J.: Will moist convection be stronger in a warmer climate?, Geophys. Res. Lett., 34, L16703, https://doi.org/10.1029/2007GL030525, 2007.
Dickerson, R. R., Huffman, G. L., Luke, W. T., Nunnermacker, L. J., Pickering, K. E., Leslie, A. C., Lindsey, C. G., Slinn, W. G. N., Kelly, T. J., Daum, P. H., Delany, A. C., Greenberg, J. P., Zimmerman, P. R., Boatman, J. F., Ray, J. D., and Stedman, D. H.: Thunderstorms-An important mechanism in the transport of air pollutants, Science, 235, 460–464, https://doi.org/10.1126/science.235.4787.460, 1987.
Dreessen, J.: A sea level stratospheric ozone intrusion event induced within a thunderstorm gust front, B. Am. Meteorol. Soc., 100, 1259–1275, https://doi.org/10.1175/BAMS-D-18-0113.1, 2019.
Dudhia, J.: Numerical study of convection observed during the winter monsoon experiment using a mesoscale two-dimensional model, J. Atmos. Sci., 46, 3077–3107, https://doi.org/10.1175/1520-0469(1989)046<3077:NSOCOD>2.0.CO;2, 1989.
Elbern, H., Kowol, J., Sladkovic, R., and Ebel A.: Deep stratospheric intrusions: A statistical assessment with model guided analyses, Atmos. Environ., 31, 3207–3226, https://doi.org/10.1016/S1352-2310(97)00063-0, 1997.
French, A. J. and Parker, M. D.: Numerical simulations of bow echo formation following a squall line-supercell merger, Mon. Wea. Rev., 142, 4791–4822, https://doi.org/10.1175/MWR-D-13-00356.1, 2014.
Fu, D., Kulawik, S. S., Miyazaki, K., Bowman, K. W., Worden, J. R., Eldering, A., Livesey, N. J., Teixeira, J., Irion, F. W., Herman, R. L., Osterman, G. B., Liu, X., Levelt, P. F., Thompson, A. M., and Luo, M.: Retrievals of tropospheric ozone profiles from the synergism of AIRS and OMI: methodology and validation, Atmos. Meas. Tech., 11, 5587–5605, https://doi.org/10.5194/amt-11-5587-2018, 2018 (data available at: https://tes.jpl.nasa.gov/tropess/products/o3/, last access: 20 June 2022).
Gelaro, R., McCarty, W., Suarez, M. J., Todling, R., Molod, A., Takacs, L., Randles, C. A., Darmenov, A., Bosilovich, M. G., Reichle, R., Wargan, K., Coy, L., Cullather, R., Draper, C., Akella, S., Buchard, V., Conaty, A., da Silva, A. M., Gu, W., Kim, G. K., Koster, R., Lucchesi, R., Merkova, D., Nielsen, J. E., Partyka, G., Pawson, S., Putman, W., Rienecker, M., Schubert, S. D., Sienkiewicz, M., and Zhao, B.: The Modern-Era Retrospective Analysis for Research and Applications, Version 2 (MERRA-2), J. Climate, 30, 5419–5454, https://doi.org/10.1175/jcli-d-16-0758.1, 2017 (data available at: https://gmao.gsfc.nasa.gov/reanalysis/MERRA-2, last access: 20 June 2022).
Gerken, T., Wei, D., Chase, R., Fuentes, J., Schumacher, C., Machado, L., Andreoli, R., Chamecki, M., Ferreira de Souza, R., Freire, L., Jardine, A., Manzi, A., Nascimento dos Santos, R., von Randow, C., dos Santos Costa, P., Stoy, P., Tóta, J., and Trowbridge, A.: Downward transport of ozone rich air and implications for atmospheric chemistry in the Amazon rainforest, Atmos. Environ., 124, 64–76, https://doi.org/10.1016/j.atmosenv.2015.11.014, 2016.
Grant, D. D., Fuentes, J. D., DeLonge, M. S., Chan, S.,Joseph, E., Kucera, P., Ndiaye, S. A., and Gaye, A. T.: Ozone transport by mesoscale convective storms in western Senegal, Atmos. Environ., 42, 7104–7114, https://doi.org/10.1016/j.atmosenv.2008.05.044, 2008.
Han, H., Liu, J., Shu, L., Wang, T., and Yuan, H.: Local and synoptic meteorological influences on daily variability in summertime surface ozone in eastern China, Atmos. Chem. Phys., 20, 203–222, https://doi.org/10.5194/acp-20-203-2020, 2020.
Hartmann, D. L., Moy, L. A., and Fu, Q.: Tropical convection and the energy balance at the top of the atmosphere, J. Climate, 14, 4495–4511, https://doi.org/10.1175/1520-0442(2001)014<4495:TCATEB>2.0.CO;2, 2001.
Holton, J. R., Haynes, P. H., McIntyre, M. E., Douglass, A. R., Rood, R. B., and Pfister, L.: Stratosphere-troposphere exchange, Rev. Geophys., 33, 403–439, https://doi.org/10.1029/95RG02097, 1995.
Hong, S., Noh, Y., and Dudhia, J.: A new vertical diffusion package with an explicit treatment of entrainment processes, Mon. Wea. Rev., 134, 2318–2341, https://doi.org/10.1175/MWR3199.1, 2006.
Hu, X. M., Fuentes, J. D., and Zhang, F. Q.: Downward transport and modification of tropospheric ozone through moist convection, J. Atmos. Chem., 65, 13–35, https://doi.org/10.1007/s10874-010-9179-5, 2010.
Jiang, R., Qie, X., Wang, C., and Yang, J.: Propagating features of upward positive leaders in the initial stage of rocket-triggered lightning, Atmos. Res., 129, 90–96, https://doi.org/10.1016/j.atmosres.2012.09.005, 2013.
Jiang, Y. C., Zhao, T. L., Liu, J., Xu, X. D., Tan, C. H., Cheng, X. H., Bi, X. Y., Gan, J. B., You, J. F., and Zhao, S. Z.: Why does surface ozone peak before a typhoon landing in southeast China?, Atmos. Chem. Phys., 15, 13331–13338, https://doi.org/10.5194/acp-15-13331-2015, 2015.
Kain, J. and Fritsch, J.: Convective parameterization for mesoscale models: The Kain-Fritsch scheme, in: The Representation of Cumulus Covection in Numerical Models, 46 edn., edited by: Emanuel, K. A. and Raymond, D. J., Meteorological Monographs, American Meteorological Society, Boston, MA, 165–170, https://doi.org/10.1007/978-1-935704-13-3_16, 1993.
Keene, K. M. and Schumacher, R. S.: The bow and arrow mesoscale convective structure, Mon. Wea. Rev., 141, 1648–1672, https://doi.org/10.1175/MWR-D-12-00172.1, 2013.
Knowland, E., Ott, E., Duncan, N., and Wargan, K.: Stratospheric intrusion-influenced ozone air quality exceedances investigated in the NASA MERRA-2 reanalysis, Geophys. Res. Lett., 44, 10691–10701, https://doi.org/10.1002/2017GL074532, 2017.
Lelieveld, J. and Crutzen, P. J.: Role of deep cloud convection in the ozone budget of the troposphere, Science, 264, 1759–1761, https://doi.org/10.1126/science.264.5166.1759, 1994.
Li, D. and Bian, J. C.: Observation of a summer tropopause fold by ozonesonde at Changchun, China: Comparison with reanalysis and model simulation, Adv. Atmos. Sci., 32, 1354–1364, https://doi.org/10.1007/s00376-015-5022-x, 2015a.
Li, D., Bian, J. C., and Fan, Q. J.: A deep stratospheric intrusion associated with an intense cut-off low event over East Asia, Science China: Earth Sciences, 58, 116–128, https://doi.org/10.1007/s11430-014-4977-2, 2015b.
Li, D., Vogel, B., Müller, R., Bian, J., Günther, G., Ploeger, F., Li, Q., Zhang, J., Bai, Z., Vömel, H., and Riese, M.: Dehydration and low ozone in the tropopause layer over the Asian monsoon caused by tropical cyclones: Lagrangian transport calculations using ERA-Interim and ERA5 reanalysis data, Atmos. Chem. Phys., 20, 4133–4152, https://doi.org/10.5194/acp-20-4133-2020, 2020.
Li, K., Jacob, D. J., Liao, H., Shen, L., Zhang, Q., and Bates, K. H.: Anthropogenic drivers of 2013–2017 trends in summer surface ozone in China, P. Natl. Acad. Sci. USA, 116, 422, https://doi.org/10.1073/pnas.1812168116, 2019.
Li, K., Jacob, D. J., Shen, L., Lu, X., De Smedt, I., and Liao, H.: Increases in surface ozone pollution in China from 2013 to 2019: anthropogenic and meteorological influences, Atmos. Chem. Phys., 20, 11423–11433, https://doi.org/10.5194/acp-20-11423-2020, 2020.
Lin, Y.-C., Hsu, S.-C., Lin, C.-Y., Lin, S.-H., Huang, Y.-T., Chang, Y., and Zhang, Y.-L.: Enhancements of airborne particulate arsenic over the subtropical free troposphere: impact of southern Asian biomass burning, Atmos. Chem. Phys., 18, 13865–13879, https://doi.org/10.5194/acp-18-13865-2018, 2018.
Li, Y., Pickering, K. E., Allen, D. J., Barth, M. C., Bela, M. M., Cummings, K. A., Carey, L. D., Mecikalski, R. M., Fierro, A. O., Campos, T. L., Weinheimer, A. J., Diskin, G. S., and Biggerstaff, M. I.: Evaluation of deep convective transport in storms from different convective regimes during the DC3 field campaign using WRF-Chem with lightning data assimilation, J. Geophys. Res.-Atmos., 122, 7140–7163, https://doi.org/10.1002/2017JD026461, 2017.
Lu, X., Hong, J., Zhang, L., Cooper, O. R., Schultz, M. G., Xu, X., Wang, T., Gao, M., Zhao, Y., and Zhang, Y.: Severe surface ozone pollution in China: A global perspective, Environ. Sci. Technol. Lett., 5, 487–494, https://doi.org/10.1021/acs.estlett.8b00366, 2018.
Melo, A. M., Dias-Junior, C. Q., Cohen, J. C., Sá, L. D., Cattanio, J. H., and Kuhn, P. A.: Ozone transport and thermodynamics during the passage of squall line in Central Amazon, Atmos. Environ., 206, 132–143, https://doi.org/10.1016/j.atmosenv.2019.02.018, 2019.
Meng, K., Zhao, T., Xu, X., Hu, Y., Zhao, Y., Zhang, L., Pang, Y., Ma, X., Bai, Y., Zhao, Y., and Zhen, S.: Anomalous surface O3 changes in North China Plain during the northwestward movement of a landing typhoon, Sci. Total Environ., 820, 153196, https://doi.org/10.1016/j.scitotenv.2022.153196, 2022.
Meul, S., Langematz, U., Kröger, P., Oberländer-Hayn, S., and Jöckel, P.: Future changes in the stratosphere-to-troposphere ozone mass flux and the contribution from climate change and ozone recovery, Atmos. Chem. Phys., 18, 7721–7738, https://doi.org/10.5194/acp-18-7721-2018, 2018.
Mlawer, E., Taubman, S., Brown, P., Iacono, M., and Clough, S.: Radiative transfer for inhomogeneous atmosphere: RRTM, a validated correlated-k model for the long-wave. J. Geophys. Res., 102, 16663–16682, https://doi.org/10.1029/97JD00237, 1997.
Morrison, H., Thompson, G., and Tatarskii, V.: Impact of cloud microphysics on the development of trailing stratiform precipitation in a simulated squall line: Comparison of one- and two-moment schemes, Mon. Wea. Rev., 137, 991–1007, https://doi.org/10.1175/2008MWR2556.1, 2009.
Nathan, B., Kremser, S., Mikaloff-Fletcher, S., Bodeker, G., Bird, L., Dale, E., Lin, D., Olivares, G., and Somervell, E.: The MAPM (Mapping Air Pollution eMissions) method for inferring particulate matter emissions maps at city scale from in situ concentration measurements: description and demonstration of capability, Atmos. Chem. Phys., 21, 14089–14108, https://doi.org/10.5194/acp-21-14089-2021, 2021.
Pan, L. L., Homeyer, C. R., Honomochi, S., Ridley, B. A., Weisman, M., Barth, M. C., Hair, J. W., Fenn, M. A., Butler, C., Diskin, G. S., Crawford, J. H., Ryerson, T. B., Pollack, I., Peischl, J., and Huntrieser, H.: Thunderstorms enhance tropospheric ozone by wrapping and shedding stratospheric air, Geophys. Res. Lett., 41, 7785–7790, https://doi.org/10.1002/2014GL061921, 2014a.
Pan, L. L., Paulik, L. C., Honomichl, S. B., Munchak, L. A., Bian, J., Selkirk, H. B., and Vömel, H.: Identification of the tropical tropopause transition layer using the ozone-water vapour relationship, J. Geophys. Res.-Atmos., 119, 3586–3599, https://doi.org/10.1002/2013JD020558, 2014b.
Pan, L. L., Honomichl, S. B., Bui, T. V., Thornberry, T., Rollins, A., Hintsa, E., and Jensen, E. J.: Lapse rate or cold point: the tropical tropopause identified by in situ trace gas measurements, Geophys. Res. Lett., 45, 10756–10763, https://doi.org/10.1029/2018GL079573, 2018.
Phoenix, D. and Homeyer, C.: Simulated impacts of tropopause-overshooting convection on the chemical composition of the Upper troposphere and lower stratosphere, J. Geophys. Res., 126, 21, https://doi.org/10.1029/2021JD034568, 2021.
Phoenix, D. B., Homeyer, C. R., Barth, M. C., and Trier, S. B.: Mechanisms Responsible for Stratosphere-to-Troposphere Transport Around a Mesoscale Convective System Anvil, J. Geophys. Res.-Atmos., 125, e2019JD032016, https://doi.org/10.1029/2019JD032016, 2020.
Pickering, J. E., Thompson, A. M., Scala, J. R., Tao, W.-K., Simpson, J., and Garstang, M.: Photochemical ozone production in tropical squall line convection during NASA/GTE/ABLE 2A, J.Geophys. Res., 96, 3099–3114, https://doi.org/10.1029/90JD02284, 1991.
Pickering, K. E., Thompson, A. M., Scala, J. R. Tao, W.-K., and Simpson, J.: Ozone production potential following convective redistribution of biomass burning emissions, J. Atmos. Chem., 14, 297–313, https://doi.org/10.1007/BF00115241, 1992.
Pochanart, P., Akimoto, H., Kajii, Y., and Sukasem, P.: Carbon monoxide, regional-scale, and biomass burning in tropical continental Southeast Asia: Observations in rural Thailand, J. Geophys. Res.-Atmos., 108, 4552, https://doi.org/10.1029/2002JD003360, 2003.
Poulida, O., Dickerson, R. R., and Heymsfield, A.: Stratosphere troposphere exchange in a midlatitude mesoscale convective complex, J. Geophys. Res., 101, 6823–6836, https://doi.org/10.1029/95JD03523, 1996.
Preston, A., Fuelberg, H., and Barth., M.: Simulation of chemical transport by Typhoon Mireille (1991), J. Geophys. Res.-Atmos., 124, 11614–11639, https://doi.org/10.1029/2019JD030446, 2019.
Qie, K., Qie, X., and Tian, W.: Increasing trend of lightning activity in the South Asia region, Sci. Bull., 66, 78–84, https://doi.org/10.1016/j.scib.2020.08.033, 2021.
Qie, X., Zhao, Y., Zhang, Q., Yang, J., Feng, G., Kong X., Zhou, Y., Zhang, T., Zhang, G., Zhang T., Wang, D., Cui H., Zhao Z., and Wu, S.: Characteristics of triggered lightning during Shandong artificial triggering lightning experiment (SHATLE), Atmos. Res., 91, 310–315, https://doi.org/10.1016/j.atmosres.2008.08.007, 2009.
Raupach, T. H., Martius, O., Allen, J. T., Kunz, M., Trapp, S., Mohr, S., Rasmussen, K., Trapp, R., and Zhang, Q. H.: The effects of climate change on hailstorms, Nat. Rev. Earth. Environ., 2, 213–226, https://doi.org/10.1038/s43017-020-00133-9, 2021.
Reichler, T., Damerisand, M., and Sausen, R.: Determining the tropopause height from gridded data, Geophys. Res. Lett., 30, 2042, https://doi.org/10.1029/2003GL018240, 2003.
Roebber, P. J.: Visualizing multiple measures of forecast quality, Wea. Forecasting, 24, 601–608, https://doi.org/10.1175/2008WAF2222159.1, 2009.
Sahu, L. K. and Lal, S.: Changes in surface ozone levels due to convective downdrafts over the Bay of Bengal, Geophys. Res. Lett., 33, L10807, https://doi.org/10.1029/2006gl025994, 2006.
Schumann, U. and Huntrieser, H.: The global lightning-induced nitrogen oxides source, Atmos. Chem. Phys., 7, 3823–3907, https://doi.org/10.5194/acp-7-3823-2007, 2007.
Skamarock, W. C., Klemp, J. B., Dudhia, J., Gill, D. O., Barker, D. M., Duda, G. M., Huang, X.-Y., Wang, W., and Powers, J. G.: A description of the advanced research WRF version 3, NCAR, Tech. Note, NCAR/TN-475þSTR, p. 113, https://doi.org/10.5065/D68S4MVH, 2008 (data available at: https://www2.mmm.ucar.edu/wrf/users/download/get_source.html, last access: 20 June 2022).
Stenchikov, G., Dickerson, R., Pickering, K., Ellis, W., Doddridge, B., Kondragunta, S., Poulida, O., Scala, L., and Tao, W. K.: Stratosphere-troposphere exchange in a midlatitude mesoscale convective complex: 2. Numerical simulations, J. Geophys. Res., 101, 6837–6851, https://doi.org/10.1029/95JD02468, 1996.
Stohl, A., Spichtinger-Rakowsky, N., Bonasoni, P., Feldmann, H., Memmesheimer, M., Scheel, H., Trickl, T., Hübener, S., Ringer, W., and Mandl, M.: The influence of stratospheric intrusions on alpine ozone concentrations, Atmos. Environ., 34, 1323–1354, https://doi.org/10.1016/S1352-2310(99)00320-9, 2000.
Stohl, A., Bonasoni, P., Cristofanelli, P., Collins, W., Feichter, J., Frank, A., Forster, C., Gerasopoulos, E., Gaggeler, H., James, P., Kentarchos, T., Kromp-Kolb, H., Kruger, B., Land, C., Meloen, J., Papayannis, A., Priller, A., Seibert, P., Sprenger, M., Roelofs, G. J., Scheell, H., E. Schnabel, C., Siegmund, P., Tobler, L., Trickl, T., Wernli, H., Wirth, V., Zanis, P., and Zerefos, C.: Stratosphere-troposphere exchange: A review, and what we have learned from STACCATO, J. Geophys. Res.-Atmos., 108, 8516, https://doi.org/10.1029/2002JD002490, 2003.
Stohl, A., Forster, C., Frank, A., Seibert, P., and Wotawa, G.: Technical note: The Lagrangian particle dispersion model FLEXPART version 6.2, Atmos. Chem. Phys., 5, 2461–2474, https://doi.org/10.5194/acp-5-2461-2005, 2005.
Tarasick, D. W., Carey-Smith, T. K., Hocking, W. K., Moeini, O., He, H., Liu, J., Osman, M. K., Thompson, A. M., Johnson, B. J., Oltmans, S. J., and Merrill, J. T.: Quantifying stratosphere-troposphere transport of ozone using balloon-borne ozonesondes, radar windprofilers and trajectory models, Atmos. Environ., 198, 496–509, https://doi.org/10.1016/j.atmosenv.2018.10.040, 2019.
Verstraeten, W. W., Boersma, K. F., Zörner, J., Allaart, M. A. F., Bowman, K. W., and Worden, J. R.: Validation of six years of TES tropospheric ozone retrievals with ozonesonde measurements: implications for spatial patterns and temporal stability in the bias, Atmos. Meas. Tech., 6, 1413–1423, https://doi.org/10.5194/amt-6-1413-2013, 2013 (data available at: https://tes.jpl.nasa.gov/tropess/products/o3/, last access: 20 June 2022).
Wang, X. L.: Historical air quality data in China, Hourly surface concentrations of ozone and CO in China [data set], https://quotsoft.net/air, last access: 21 January 2022.
Wirth, V.: Diabatic heating in an axisymmetric cut-off cyclone and related stratosphere-troposphere exchange, Q. J. Roy. Meteor. Soc., 121, 127–147, https://doi.org/10.1002/qj.49712152107, 1995.
Wirth, V.: Static stability in the extratropical tropopause region, J. Atmos. Sci., 60, 1395–1409, https://doi.org/10.1175/1520-0469(2003)060<1395:SSITET>2.0.CO;2, 2003.
Zanis, P., Trickl, T., Stohl, A., Wernli, H., Cooper, O., Zerefos, C., Gaeggeler, H., Schnabel, C., Tobler, L., Kubik, P. W., Priller, A., Scheel, H. E., Kanter, H. J., Cristofanelli, P., Forster, C., James, P., Gerasopoulos, E., Delcloo, A., Papayannis, A., and Claude, H.: Forecast, observation and modelling of a deep stratospheric intrusion event over Europe, Atmos. Chem. Phys., 3, 763–777, https://doi.org/10.5194/acp-3-763-2003, 2003.
- Abstract
- Introduction
- Data and Model
- Confirmation of surface ozone surge with stratospheric origin
- Multi-scale interactions responsible for the stratospheric intrusion
- Conclusions and discussions
- Data availability
- Author contributions
- Competing interests
- Disclaimer
- Special issue statement
- Acknowledgements
- Financial support
- Review statement
- References
- Supplement