the Creative Commons Attribution 4.0 License.
the Creative Commons Attribution 4.0 License.
 | 26 Mar 2024
Comment on “Transport of substantial stratospheric ozone to the surface by a dying typhoon and shallow convection” by Chen et al. (2022)
Xiangdong Zheng
Wen Yang
Yuting Sun
Chunmei Geng
Yingying Liu
Chen et al. (2022) analyzed the event of rapid nocturnal O3 enhancement (NOE) observed on 31 July 2021 at the surface level in the North China Plain and proposed transport of substantial stratosphere ozone to the surface by Typhoon In-fa followed by downdraft of shallow convection as the mechanism of the NOE event. The analysis seems to be valid from the viewpoint of atmospheric physics. This comment revisits the NOE phenomenon on the basis of the China National Environmental Monitoring Center (CNEMC) network data used in Chen et al. (2022), together with the CNEMC data from Zibo (ZB) and O3, NOx, PAN (peroxyacetic nitric anhydride), and VOC (volatile organic compound) data from the Zibo supersite operated by the China Research Academy of Environmental Sciences (CRAES). We found (a) Ox (O3 + NO2) levels during the NOE period approaching those of O3 during 14:00–17:00 LT, (b) levels of PAN and the relationship between O3 and PAN consistent with dominance of chemical and physical processes within the boundary layer, and (c) estimated photochemical ages of air mass shorter than 1 d and showing no drastic increases during the NOE. We argue that the NOE was not caused by typhoon-induced stratospheric intrusion but originated from fresh photochemical production in the lower troposphere. Our argument is well supported by the analysis of atmospheric transport as well as ground-based remote sensing data.
- Article
(2792 KB) - Full-text XML
- Corresponding article
-
Supplement
(3091 KB) - BibTeX
- EndNote


Chen et al. (2022) reported a phenomenon of rapid nocturnal ozone (O3) enhancement (NOE) that occurred at the surface level during the night of 31 July 2021 in six cities in the North China Plain (NCP, 34–40° N, 114–121° E). Prior to the NOE, the NCP was impacted by Typhoon In-fa, which was largely weakened by 30 July 2021. The mesoscale convective systems (MCSs) formed and passed through the NCP at night on 31 July 2021. Chen et al. (2022) concluded that the NOE phenomenon resulted from “the direct stratospheric intrusion to reach the surface” and was “induced by the multi-scale interactions between the dying Typhoon In-fa and local MCSs”. The study suggested that the dying Typhoon In-fa induced stratospheric troposphere transport (STT) of O3 followed by downdrafts of shallow convections, which resulted in “transport of substantial stratospheric ozone to the surface”. The relatively high O3 to low water vapor and CO (HOLWCO) concentrations observed at some sites in the NCP and the relative variations of water vapor and O3 profiles from radiosonde data and the AIRS satellite product, respectively, were used to support the conclusions.
STT processes are triggered by the large-scale circulation or synoptic-scale dynamical processes (Holton et al., 1995). A global study (Škerlak et al., 2014) shows that STT displays a strong regional distribution and seasonal variations and that the NCP is not a hot region, particularly in summer. STT can be an important source of tropospheric O3, particularly in regions where the photochemistry is weak (Lelieveld and Dentener, 2000). However, tropospheric O3 originates dominantly from photochemistry within the troposphere, and photochemically produced O3 (PPO) is the more important O3 source, not only in the middle to low troposphere (Lelieveld and Dentener, 2000; Logan, 1985), but also in the upper troposphere (Chameides, 1978; Liu et al., 1983; Jaeglé et al., 1998). Anthropogenic and natural O3 precursors convectively transported from the surface or lower troposphere and lightning-produced NOx may involve PPO in the upper troposphere. Precursors emitted near the surface contribute largely to PPO in the surface and boundary layer, which can be transported upwards through the warm conveyor belt (Bethan et al., 1998; Cooper et al., 2002), spread in the free atmosphere, and delivered over a long range by atmospheric circulations (Parrish et al., 1998). PPO in the surface boundary layer is mainly removed by NOx titration reactions and dry deposition. The NCP is a hot region of PPO from the surface level up to 2.5 km in the summer (e.g., Ding et al., 2008) and has demonstrated rapid long-term increases in surface O3 levels (Ma et al., 2016; Lu et al., 2018; Lyu et al., 2023).
Typhoons are tropical cyclones formed over the western North Pacific regions, which have well-organized structures of updrafts and downdrafts over hundreds and thousands of kilometers (Ahrens and Henson, 2016). A large-scale tropical cyclone with a good self-organized character is able to induce dynamical processes and form an outflow layer in the upper troposphere and lower stratosphere (UTLS) and cause strong downdrafts on the periphery of the cyclone (Merrill, 1988; Ahrens and Henson, 2016). The strong air subsidence on the periphery of a typhoon can theoretically lead to the STT of O3. It was suggested that the observed enhancement of O3 in the middle troposphere over the Indian Ocean was caused by the STT through an ageostrophic process linked to the strong tropical cyclone Marlene, which occurred in April 1995 (Baray et al., 1999). This suggestion is supported by a modeling study (de Bellevue et al., 2007). However, the idea that O3 increases in the middle and upper troposphere are directly from the STT processes induced by typhoons is less supported by in situ aircraft-borne observations by Cairo et al. (2008) and the literature reviewed therein. Especially the comparative studies on the supertyphoon Mireille (1991) during the Pacific Exploratory Mission (PEM)-West A campaign (Newell et al., 1996a; Preston et al., 2019) and the hurricanes Floyd (1999) and Georges (1998) in the Atlantic Ocean during their phases of intensification and weakening (Carsey and Willoughy, 2005) provided little evidence of the STT of O3. On the other hand, the analysis of ERA5 PV (potential vorticity) and air mass with HOLWCO observed below 12 km by the In-service Aircraft for a Global Observing System (IGOS) indicated the occurrence of STT induced by typhoons (Roux et al., 2020; Z. Chen et al., 2021). However, it should be noted that atmospheric large-scale subsidence over East Asia can also be induced by the strong summer subtropical high. Photochemically aged pollution air masses may also show HOLWCO features as observed in the PEM-West A campaign (Newell et al., 1996b; Stoller et al., 1999).
Surface O3, NOx, and meteorology data collected in the cities of Hengshui (HS), Binzhou (BZ), Jinan (JN), Weifang (WF), Qingdao (QD), Weihai (WH), and the newly added Zibo (ZB) were from the China National Environmental Monitoring Center (CNEMC) network (https://quotsoft.net/air, last access: 21 March 2024; Wang, 2020). The geographical location of ZB is shown in Supplement Fig. S1. In addition, hourly averages of surface O3, PAN (peroxyacetic nitric anhydride), NOx, and VOCs (volatile organic compounds) were obtained from a supersite in ZB operated by the China Research Academy of Environmental Sciences (CRAES). Ambient O3 and NOx at the supersite were monitored using a Model 49i ozone analyzer and a Model 42i NO NO2 NOx analyzer (both from Thermo Fisher Scientific), respectively. The analyzers were calibrated weekly. Quasi-continuous measurement of PAN was made using a gas chromatograph coupled with an electron capture detector (GC-ECD) (ZC-PANs, Research Center for Eco-Environmental Sciences, Chinese Academy of Sciences). The GC-ECD system was calibrated seasonally using PAN inline produced from CH3COCH3+NO reactions under UV irradiation (J. Chen et al., 2021). Samples of VOCs were taken hourly and analyzed using a coupled gas chromatograph–mass spectrometry (GC–MS) system (5800-GM, Thermo Fisher Scientific), which was calibrated monthly using a standard gas mixture from Linda containing 116 species, including hydrocarbons and oxygenated and halogenated hydrocarbons.
3.1 Summary of observed NOE events
The hourly averages of surface O3 and NOx in the six cities (HS, BZ, JN, WF, QD, and WH) listed in Chen et al. (2022) as well as those from ZB and the ZB supersite are shown in Fig. 1. The data of O3 and NOx from 18:00 LT on 31 July to 06:00 LT on 1 August 2021 are highlighted in red lines in Figs. 1 and S2. Although PPO was not obvious during 29–30 July due to the weather conditions, the diurnal variations of O3 and NOx on most days displayed typical features being controlled by the PPO process, with O3 maxima and corresponding NOx minima during 14:00–17:00 LT and rapid nighttime O3 decreases due to substantial NOx titration reactions and dry deposition. As reported by Chen et al. (2022), a clear NOE was observed during the night of 31 July in HS, BZ, JN, WF, and QD. Our data from ZB (Fig. 1g and h) also confirm the occurrence of this NOE. However, it is noteworthy that NOE events occurred not only during the night of 31 July, but also during some other nights in these cities with an O3 enhancement of 5–20 ppbv. The frequency of NOE was highest in WH: in detail, O3 increased from 24 ± 8 ppbv at 22:00 LT on 27 July to 46 ± 21 ppbv at 01:00 LT on 28 July, from 23 ± 5 ppbv at 23:00 LT on 29 July to 40 ± 4 ppbv at 04:00 LT on 30 July, from 43 ± 2 ppbv at 00:00 LT to 57 ± 3 ppbv at 04:00 LT on 31 July, from 54 ± 19 ppbv at 00:00 LT to 66 ± 5 ppbv at 02:00 LT on 2 August, from 42 ± 17 ppbv at 00:00 LT to 48 ± 5 ppbv at 03:00 LT on 3 August, and from 20 ± 4 ppbv at 02:00 LT to 25 ± 2 ppbv at 03:00 LT on 5 August. Other NOE events occurred, for example, on 4 August in HS, on 28 July and 5 August in BZ, on 26 July and 4 August in JN, and on 4 August in WF and QD. Therefore, the NOE events occur frequently in the NCP, regardless of the impacts from typhoon or STT, as already reported in He et al. (2022).
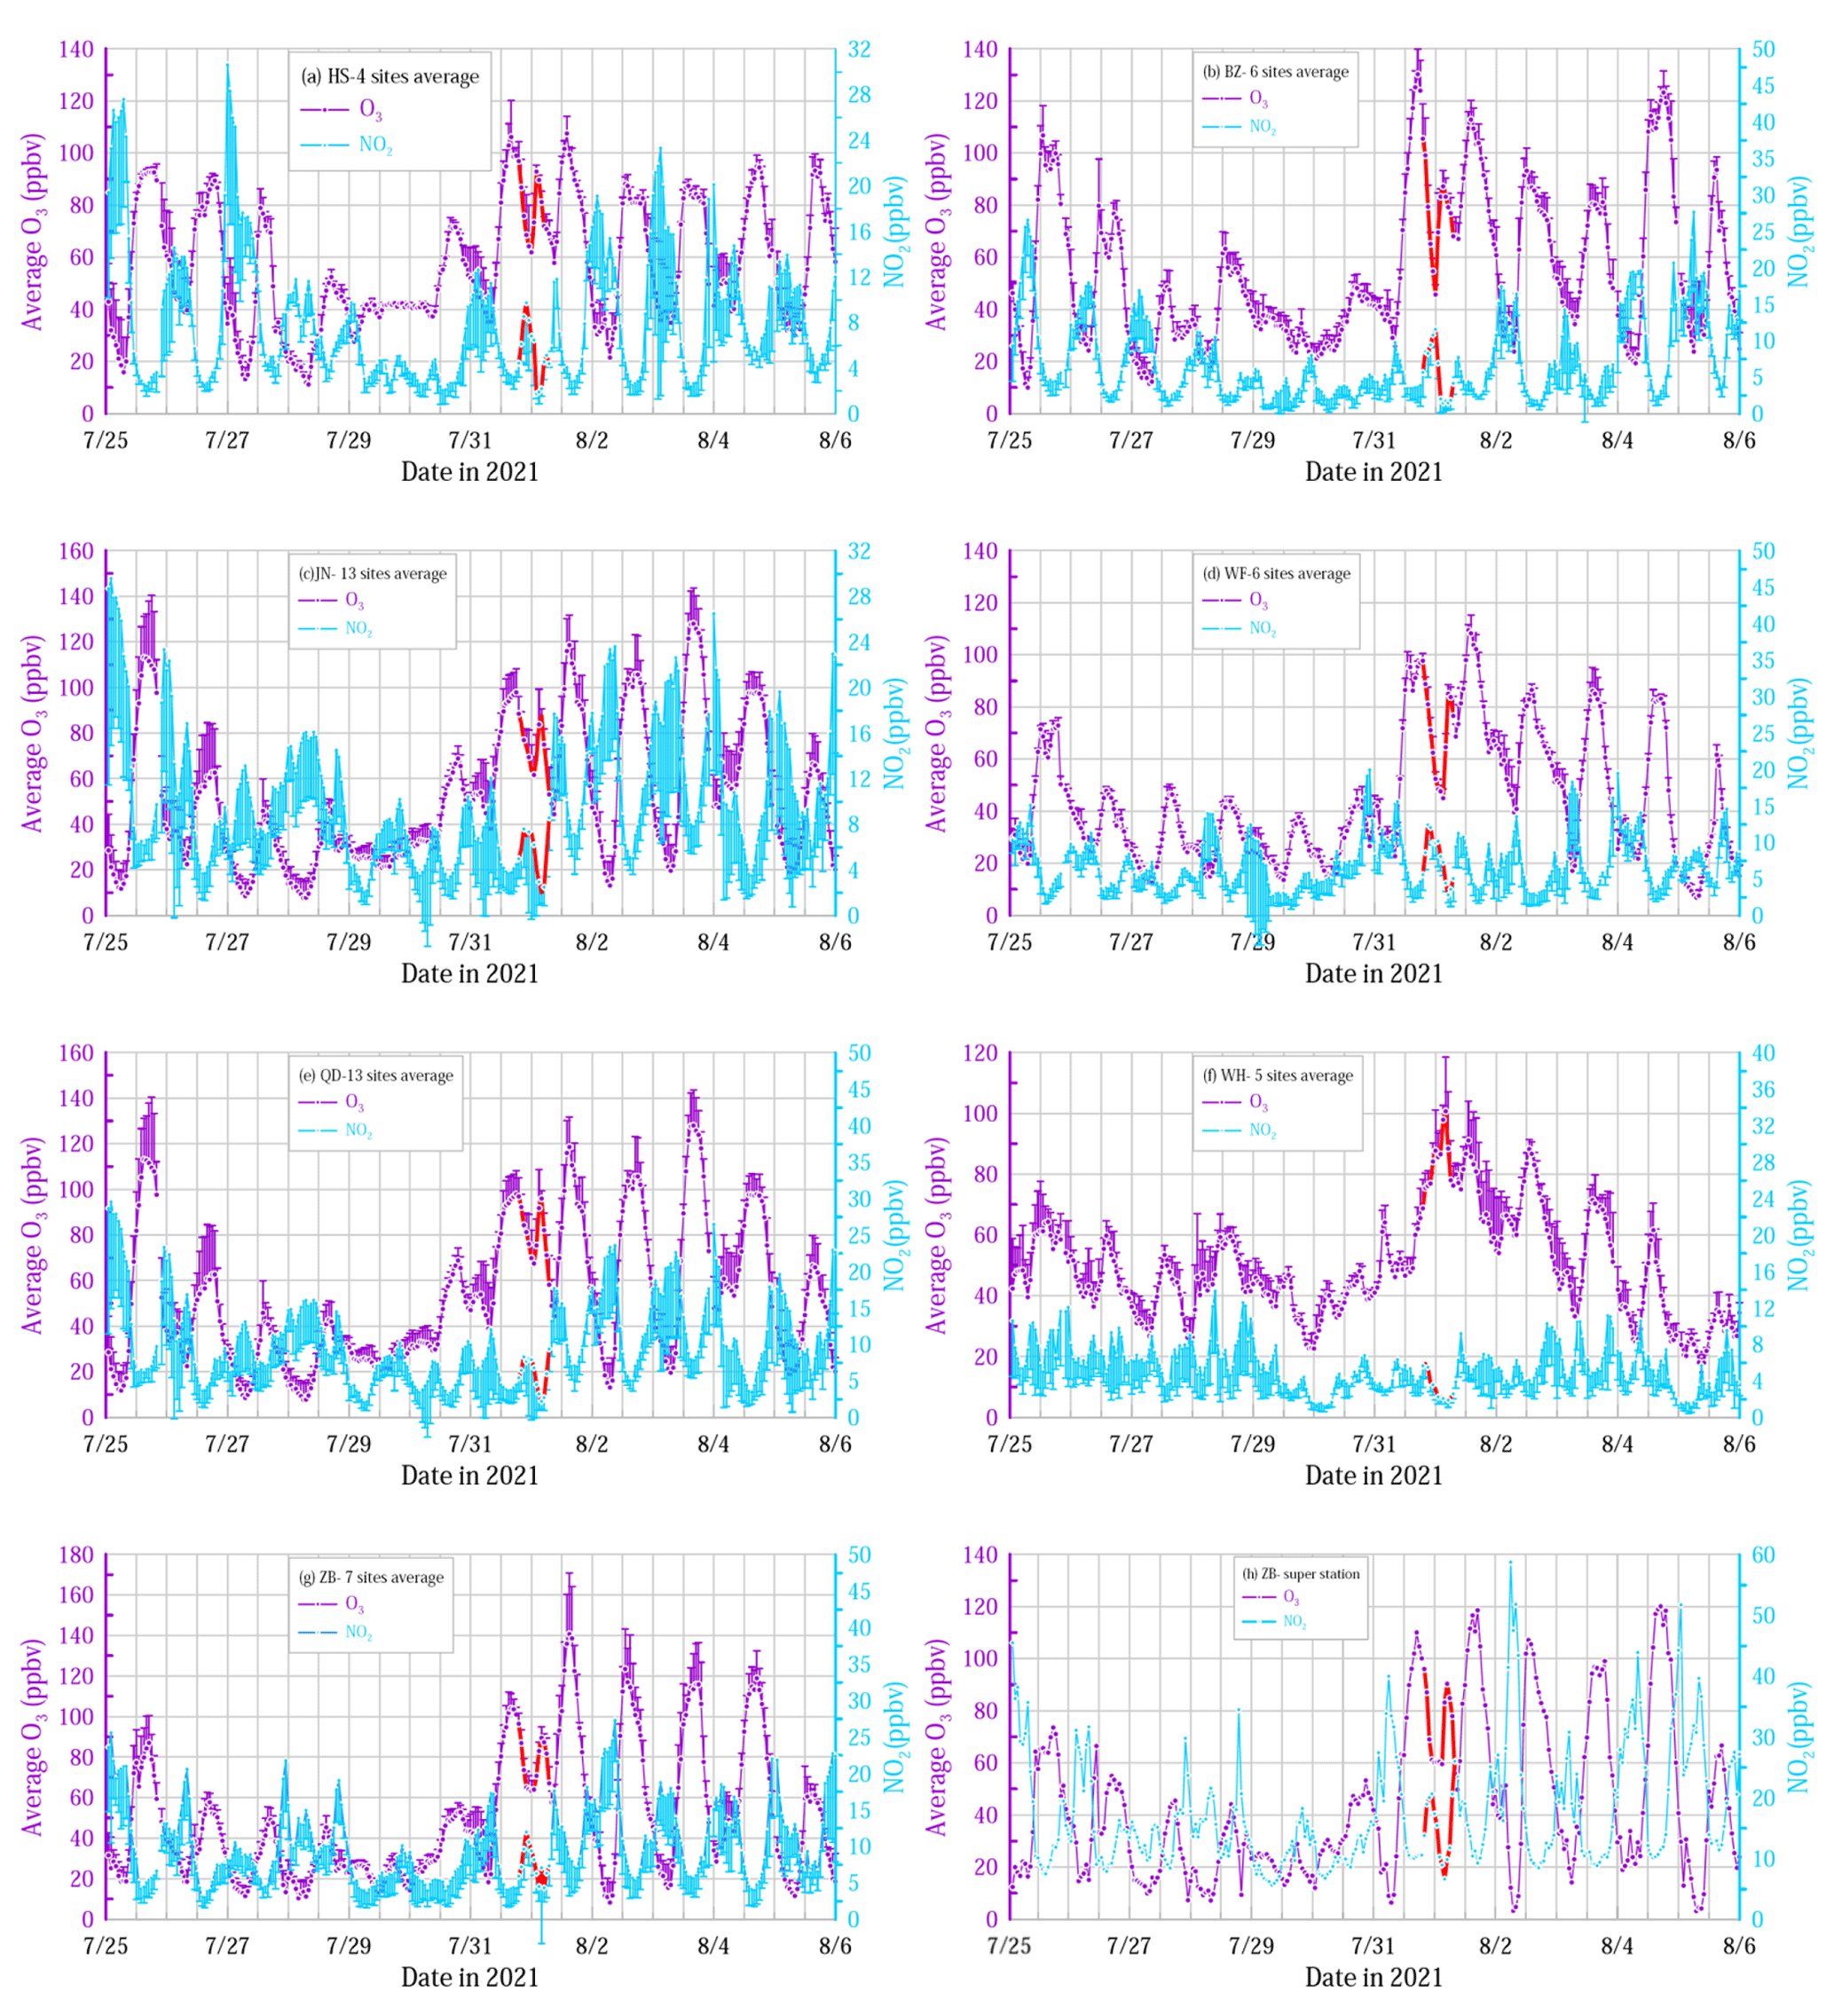
Figure 1Time series of the hourly multi-site average of O3 (purple) and NO2 (bright blue) in several NCP cities between 25 July and 5 August 2021. Data from 18:00 LT on 31 July to 06:00 LT on 1 August are highlighted in red. The multi-site data from HS (4 sites) (a), BZ (6 sites) (b), JN (13 sites) (c), WF (6 sites) (d), QD (13 sites) (e), WH (5 sites) (f), and ZB (7 sites) (g) are available at https://quotsoft.net/air (last access: 15 April 2023; Wang, 2020). Data from the ZB supersite (h) are provided by the Chinese Academy of Environmental Sciences (CRAES). The positive (negative) error bars represent 1 standard deviation of O3 (NO2).
3.2 Identifying the origin of the NOE by comparing afternoon O3 with Ox in the nocturnal boundary layer (NBL)
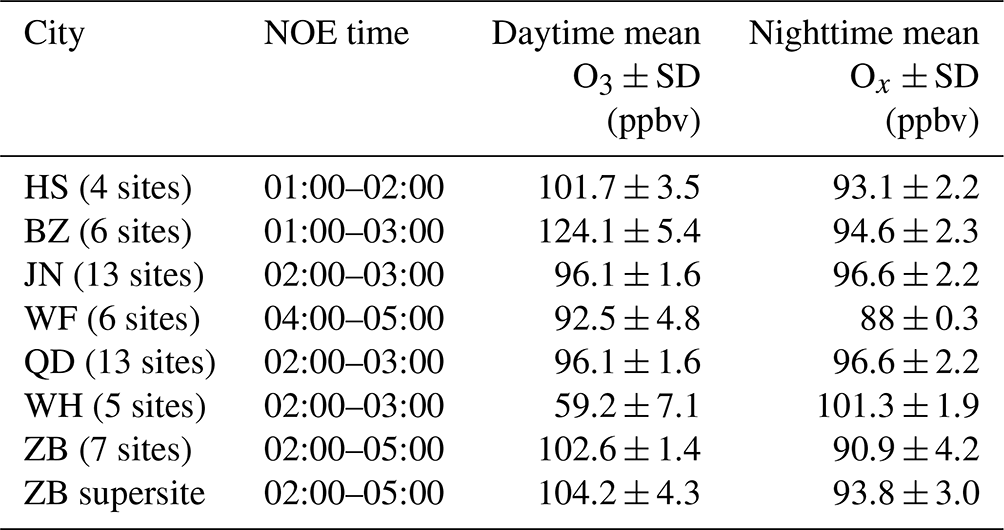
Following the method of He et al. (2022), we make a comparison of O3 averages during 14:00–17:00 LT on 31 July in the above cities with the respective Ox (O3 + NO2) averages during the periods of the maximum NOE between 31 July and 1 August (Table 1). Such comparison facilitates judgment of whether or not the NOE was caused by downward mixing of air in the residual layer (RL) into the NBL because afternoon averages of O3 in the convective boundary layer are well preserved at night in the RL and Ox is a more conserved quantity than O3 in the NBL. Details of the reasonability of this method are given in Sect. S1. It can be seen in Table 1 that, except for WH, the nighttime Ox averages approach or are obviously lower than the respective daytime O3 averages. In the megacities QD and JN, the average levels of Ox during the maximum NOE were nearly the same as those of the daytime O3, while the nighttime Ox in the other cities (excluding WH) was at least a few parts per billion by volume lower than the daytime O3. According to the discussions in Sect. S1, for all cities excluding WH, data in Table 1 do not suggest any significant STT impact on the NOE events.
Table 1Averages of surface O3 during 14:00–17:00 LT and Ox during the periods of the maximum NOE in the night from 31 July to 1 August 2021.
3.3 Analysis of atmospheric transport
The case of WH deserves more detailed analysis. WH is a relatively small city at the tip of the Shandong Peninsula. The higher Ox concentration for WH in Table 1 was probably related to the regional transport of air pollution and the influence of the diurnal alternations of land–sea breezes. Actually, the afternoon PPO in WH had not been well established, as shown in Fig. 1f. During the daytime (particularly the afternoon), when the sea breeze dominates, PPO is significantly diluted by cleaner air from the marine boundary layer. The daily maximum of O3 in WH is generally observed between 11:00 and 13:00 LT rather than between 14:00 and 17:00 LT. If the O3 average for WH in Table 1 were replaced with that from 11:00 to 13:00 LT on 1 August (80 ± 2.0 ppbv), then the difference between Ox and O3 would be reduced to about 21 ppbv. At night, when the land breeze dominates, the near-surface level of WH is usually controlled by divergence, which induces downdraft from the residual layer, transports daytime PPO residing in the residual layer to the surface, and results in the NOE. This might have been the main reason for the highly frequent NOE emerging in WH.
Chen et al. (2022) investigated the atmospheric transport process of the NOE by using high-resolution Weather Research and Forecasting (WRF) simulation and FLEXible PARTicle (FLEXPART) particle dispersion modeling. They presented the two scenarios for BZ and QD and found very different results for the two cities. To support the above view, we calculated backward trajectories of air parcels arriving at 100 m above the ground level over WH every hour between 19:00 and 08:00 UTC on 31 July 2021, using the HYSPLIT model (https://www.ready.noaa.gov/HYSPLIT.php, last access: 4 January 2024; ARL, 2023) and the Global Forecast System (GFS) reanalysis data (0.25° resolution, https://www.emc.ncep.noaa.gov/emc/pages/numerical_forecast_systems/gfs.php, last access: 4 January 2024; EMC, 2023). Our intention is not to resolve the dynamical evolution of the MCSs but to analyze atmospheric transport at a relatively larger scale. Figure S3 shows the calculated backward trajectories for WH together with those for ZB and BZ in the same time window. The trajectories in Fig. S3 (right) indicate that air parcels influencing the NBL in WH were mostly from the marine boundary layer over the Yellow Sea area. The prevailing wind direction at 850 hPa over the Yellow Sea and the neighboring land was southwesterly, as shown in Fig. 5a in Chen et al. (2022). Such a wind condition could facilitate the transport of PPO from the continent to the sea area. Because of the lower emissions of NOx over the sea, PPO can be well sustained at night and transported to continental locations like WH through sea breezes.
The 24 h backward trajectories for ZB (Fig. S3, left) and BZ (Fig. S3, middle) provide additional clues denying STT impacts on nighttime O3 in these cities. All the trajectories do not indicate any transport of air parcels from altitudes over the daytime boundary layer. To gain a more complete insight into the air movements during and before the NOE events, we show in Fig. S4 a matrix of backward trajectories for air parcels arriving at 100 m above ground level over the domain 36–38° N and 115–122° E at 19:00 UTC (03:00 LT) on 31 July 2021. The trajectory heights and locations shown in Fig. S4 indicate that only 3 of the 24 trajectories traveled over the daytime boundary layer, and the 3 trajectories ended at locations over the Bohai Gulf. Therefore, our systematic trajectory analysis does not suggest that the NOE events in the NCP cities were related to downward transport of air masses from the free troposphere.
3.4 Confirming rapid downward transport of daytime PPO
To confirm the possibility of rapid downward transport of daytime PPO, we obtained some radiosonde data from three stations in Shandong Province, i.e., Zhangqiu (ZQ, 117.524° E, 36.713° N), Rongcheng (RC, 122.477° E, 37.173° N), and QD. ZQ is about 52 km east of JN and RC about 56 km southeast of WH. The radiosonde data collected at 19:00 LT on 31 July and 07:00 LT on 1 August 2021 at these sites can be used to get a glimpse of the vertical thermal and dynamical evolutions in the night of 31 July. The raw radiosonde data include temperature, pressure, relative humidity, and wind speed and direction (https://data.cma.cn/, last access: 13 July 2023; NMIC, 2015). We calculated the virtual temperature and equivalent potential temperature (θse) (Bolton, 1980) and wind shear (du dz)2 (Cho et al., 2001). The vertical profiles of these quantities from the surface level to 400 hPa are shown in Fig. S5. The pronounced decreasing θse below 900 hPa over ZQ and QD from 19:00 LT on 31 July to 07:00 LT on 1 August indicated that a descending process occurred at night. The wind shear peaked near 900 hPa over ZQ and QD, providing kinetic energy for the mixing process. The above thermal and dynamical conditions were favorable for the downward mixing of higher levels of O3 in the residual layer over ZQ and QD. Over RC, however, the thermal and dynamical conditions were different (Fig. S5c) and less favorable for triggering the downward transport. This is consistent with the data from the neighboring coastal city of WH, showing a high surface O3 during the NOE event accompanied by relatively high CO and water vapor (Fig. S6f). As a coastal city near WH, RC should have been impacted by air masses from the marine boundary layer, as discussed for WH in Sect. 3.3.
3.5 Cities impacted by the mesoscale convective systems
The above analyses show that not all the cities in the study area were clearly influenced by strong downward transport. The cities strongly impacted by the MCSs should have experienced intensive vertical air motion. Chen et al. (2022) showed in their Fig. 8 that the vertical atmospheric activity seemed to be limited near ZB and that the main convective zone was in western Shandong Province. However, this figure by no means presents the whole process of the convective activity because it only shows six snapshots of the MSCs observed between 20:00 LT, 31 July and 01:00 LT, 1 August 2021 and does not show the dissipation of the MSCs. The radar reflectivity maps in Fig. S7 add additional snapshots to the MSCs. As can be seen in Fig. S7b–f, ZB and JN were clearly under the influence of the MSCs around 00:00 LT and hit heavily by the MSCs between 01:00 and 03:00 LT, 1 August. Without a doubt, the MSCs impacting the cities with NOEs reported in Chen et al. (2022) also impacted ZB. The radar reflectivity maps show clearly that, except for QD and WH, all the cities listed in our Table 1 were strongly impacted by the MSCs. While the occurrence of the NOE was a little later than the MSC impact, the sequence of the MSC impacts is consistent with that of the NOE events. Therefore, the major conclusions based on our analysis of data from the ZB supersite should also apply to Chen et al. (2022). In the next sections, we offer more evidence from ZB to support our argument.
3.6 Evidence from ground-based remote sensing
In addition to the backward trajectories, some ground-based remote sensing data from ZB also support our view. Figure S8 presents time–altitude cross sections of O3, relative humidity (RH), virtual temperature (Tv), and wind speed (WS) observed at the ZB supersite between 18:00 LT, 31 July and 06:00 LT, 1 August 2021. As can been seen in the figure, relatively higher O3 mixing ratios only occurred below about 0.5 km. From the evening to midnight, very strong wind prevailed below 1 km, after which humidity was largely enhanced, it rained, and the NOE event occurred. The wind directions below 1 km were southerly before 01:00 LT and turned to northerly by 02:00 LT (Fig. S9). The top of the higher O3 layer was partly uplifted during the NOE period. According to the backward trajectories shown in Fig. S3 (left), the air parcels were from the southwestern sector and traveled mostly below 0.5 km above sea level. Both the remote sensing data and the trajectory analysis provide no evidence of air from the free troposphere. Therefore, it is very likely that the NOE observed from the ground to about 0.5 km was due to advection transport of daytime PPO from the southwestern sector rather than SST impacts.
3.7 Diagnosis based on measurements of pollutants in the surface layer
To further understand the source characteristics of NOE, the hourly average concentrations of surface PAN and O3 observed at the ZB supersite are displayed in Fig. 2. It can be seen that the variations of PAN and O3 were in phase and that the concentrations of both gases were well correlated (r2= 0.60, p < 0.0001, n= 283), indicating that the variations of PAN and O3 were driven mainly by chemical and physical processes within the boundary layer. The maximum O3 from 02:00 to 05:00 LT on 1 August was 88 ± 5 ppbv, matching a PAN of 0.44 ± 0.02 ppbv, which was still significantly higher than those lowest values at nighttime of other dates. As a secondary photochemical pollutant, PAN is thermally unstable but can be transported over higher altitudes, where it has a much longer lifetime due to low temperatures. However, observations over the years on mountain tops, aircraft, and satellites showed that the mixing ratios of PAN in the free troposphere and lower stratosphere of the Northern Hemisphere were normally much lower than 0.5 ppb and mostly lower than 0.3 ppb (Singh et al., 2007; Moore and Remedios, 2010; Roiger et al., 2011; Pandey Deolal et al., 2013; Fadnavis et al., 2014; Kramer et al., 2015). PAN decomposes rapidly in warm urban air. According to Cox and Roffey (1977), the lifetime of PAN was only 2.7 h at 25 °C. In our case, the nighttime temperature at the ZB supersite varied from 33.1 °C at 18:00 LT on 31 July to 20.4 °C at 06:00 LT on 1 August 2021, with an average of 26.0 °C. Under such warm conditions, the thermal decomposition lifetimes were in the range of 0.2–1.3 h based on the hourly observations. If the surface layer had been significantly impacted by air masses from the free troposphere and lower stratosphere, we would have seen much lower levels of PAN during the NOE instead of the observed 0.4–0.5 ppb (Fig. 2). Therefore, given the relative lower concentrations of PAN in the free troposphere and lower stratosphere and the rapid thermal decomposition, it is unlikely that over 0.4 ppb of PAN could be observed in surface air significantly impacted by stratospheric intrusion, not to mention that the PAN values during the NOE were even much higher than the nighttime values before and after the NOE event.
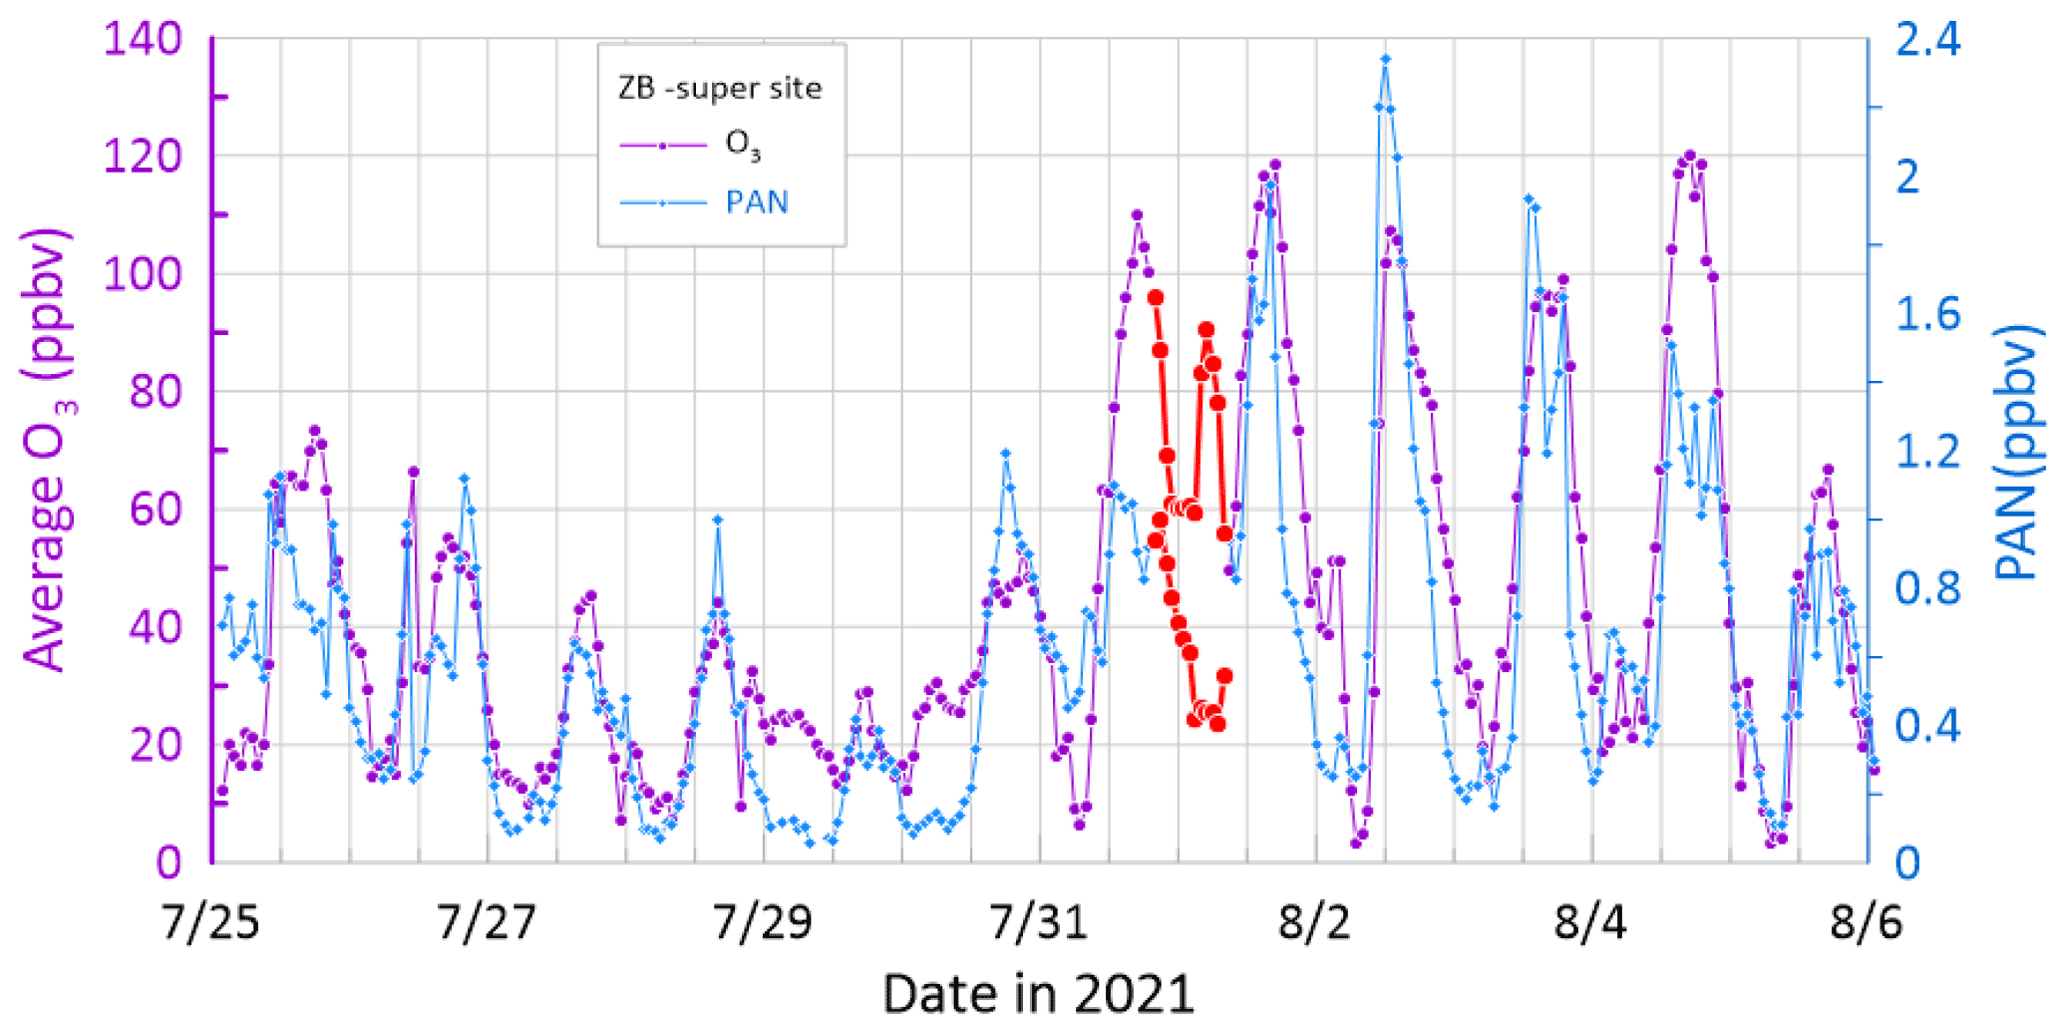
Figure 2Time series of hourly averages of O3 (purple) and PAN (blue) at the ZB supersite between 25 July and 5 August 2021. Data from 18:00 LT on 31 July to 06:00 LT on 1 August are highlighted in red.
Photochemical ages of air masses arriving at the ZB supersite from 25 July to 5 August 2021 were estimated based on hourly VOC (volatile organic compound) measurements. The methodologies of the estimation are given in detail in Sect. S2. Figure 3 shows two sets of estimated photochemical ages based on the ratios [butane] [propane] and [o-xylene] [ethylbenzene], respectively, together with hourly O3 concentrations from the supersite. As can be seen in the figure, photochemical ages estimated based on [o-xylene] [ethylbenzene] are much shorter than those based on [butane] [propane]. Since we used the observed maximum [butane] [propane] and [o-xylene] [ethylbenzene] in the calculations instead of the respective initial [butane] [propane] and [o-xylene] [ethylbenzene], the photochemical ages were underestimated, particularly those based on measurements of o-xylene and ethylbenzene, which are much more reactive than the alkanes (see Sect. S2). The estimated photochemical ages can be used to check the major conclusion in Chen et al. (2022), even though they could be underestimated. Here, the actual values of the photochemical ages are less important than their variations during, before, and after the NOE. The photochemical ages of stratospheric air masses are usually longer than 1 year (Diallo et al., 2012). However, all the estimated photochemical ages in Fig. 3, including those for the NOE period, are much shorter than 1 d. More importantly, the photochemical ages for the NOE from 31 July to 1 August 2021 varied roughly in the middle of all the estimated ages and showed no drastic increases, which would be expected if the surface air had contained a significant fraction of stratospheric air. Therefore, our observation-based calculations of photochemical ages do not support the conclusion drawn by Chen et al. (2022) about the mechanisms of the NOE. It is very likely that the NOE was not a result of typhoon-induced stratospheric intrusion. Instead, it originated from fresh photochemical production of O3 in the lower troposphere.
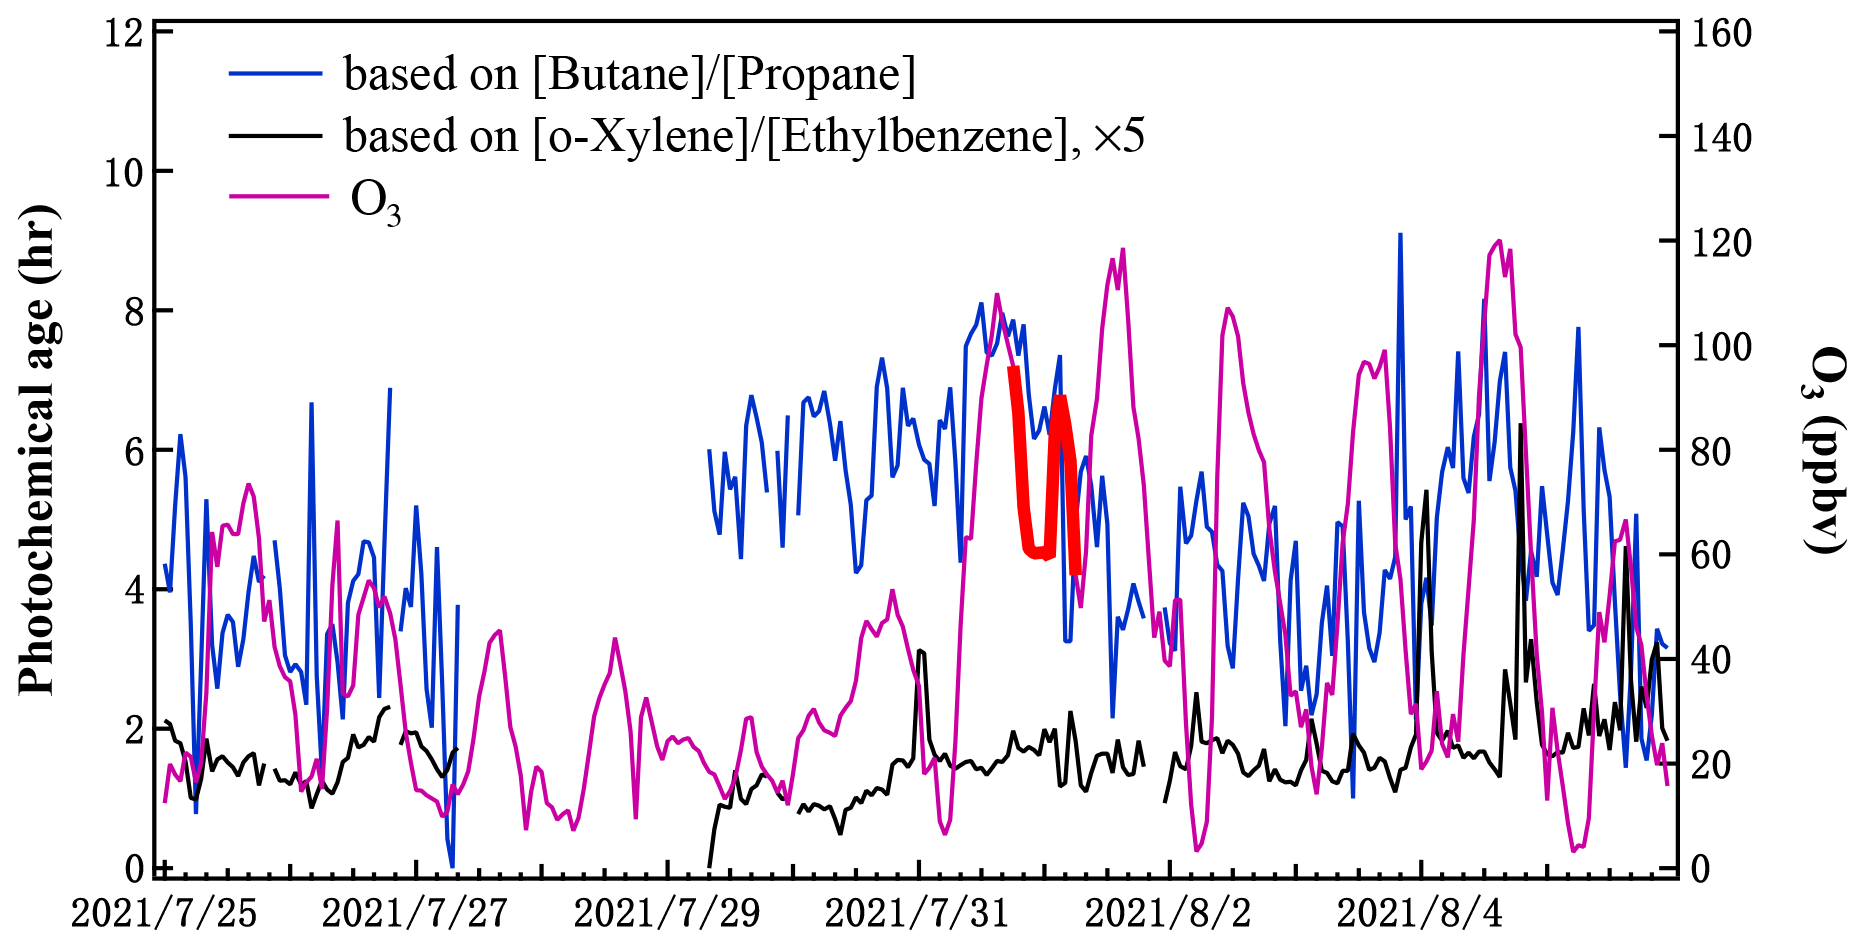
Figure 3Variations of estimated photochemical ages of air masses arriving at the ZB supersite and the O3 mixing ratio (purple). The O3 data from 18:00 LT on 31 July to 06:00 LT on 1 August 2021 are highlighted in bold red line. The photochemical ages were estimated on the basis of [butane] [propane] (blue) and [o-xylene] [ethylbenzene] (black), respectively.
The NOE event presented by Chen et al. (2022) was actually one of the normal cases of NOE associated with the compensatory downdrafts induced by convection cells (Betts et al., 2002). Occurrences of NOE had been reported in the NCP during the summer (e.g., Ma et al., 2013; Jia et al., 2015). Similar phenomena were found in southern China (He et al., 2021), in the Bay of Bengal in India (Sahu and Lal, 2006), and even in Amazonia (Betts et al., 2002). The daytime PPO is transported upward to and resides in the residual layer, while surface O3 is largely removed at night, mainly by NOx titrations, forming a large positive lower-tropospheric gradient of O3 from the surface to the residual layer during the night and early morning period, as often reported in the literature (e.g., Ma et al., 2013; Jia et al., 2015; Wang et al., 2017; Tang et al., 2017; Zhao et al., 2019; Zhu et al., 2020). The positive gradient of O3 can be strongly disturbed by nighttime convective processes or low-level jets and the compensatory downdrafts in convection systems can cause NOE events, as reported for a Amazonia site (Betts et al., 2002) and a NCP site (Jia et al., 2015) and systematically summarized in He et al. (2022).
Previous investigations into surface O3 enhancement associated with passage of typhoons revealed two possible mechanisms: (i) stratospheric O3 is ultimately transported to the surface level after typhoon-induced STT (Jiang et al., 2015; Wang et al., 2020; Zhan et al., 2020; Chen et al., 2022; Meng et al., 2022); (ii) formation and accumulation of O3 as well as emissions of O3 precursors in the boundary layer are promoted under meteorological conditions accompanying strong atmospheric subsidence on the typhoon periphery (Hung and Lo, 2015; Shao et al., 2022; Wang et al., 2022). Directly before the NOE event reported by Chen et al. (2022), the photochemical formation of O3 in the NCP was obviously intensified after a few days of weakening (Fig. 1). The O3-rich air spread within the boundary layer during the daytime of 31 July and remained in the residual layer at night. Given the favorable thermal–dynamical condition like MCSs, the PPO in the residual layer could easily be conveyed downward to the surface, leading to NOE in the surface layer, as also shown in other studies (Shu et al., 2016; Qu et al., 2021; Ouyang et al., 2022; He et al., 2022). Our analysis supports the conclusion that this NOE event was caused by rapid downward transport of daytime PPO residing in the residual layer.
The STT of O3 is often observed in the free troposphere through balloon or aircraft-based observations, and air masses associated with the identified STT of O3 usually exhibit the feature of HOLWCO. However, an air mass with a HOLWCO feature in the free troposphere does not necessarily mean that the O3 enhancement originated from the stratosphere (Stoller et al., 1999). For those observations made at a high mountain site (Izaña, 28°18′ N, 16°30′ W; 2370 m a.s.l), even with stratospheric tracers (such as 7Be), the contribution of PPO to the rise of O3 at the surface level was important and the stratosphere seemed not to be a direct source (Prospero et al., 1995; Graustein and Turekian, 1996). Although the air with HOLWCO, induced by katabatic winds, was observed at the base camp of Mount Everest (about 5000 m a.s.l.), the source of O3 from the stratosphere was not confirmed (Zhu et al., 2006). Simultaneous observations of O3 and PAN at Namco (4545 m a.s.l.) in Tibet captured air masses with high O3 and low water vapor, which were accompanied by increases in PAN, suggesting that PPO during the long-range transport might be one of the major sources of elevated O3 (Xu et al., 2018). These examples show that, even at high-altitude sites, HOLWCO phenomena may not be caused by STT.
In the NOE cases reported in Chen et al. (2022), the HOLWCO feature during the NOE was very far from the stratospheric characteristics. The maximum O3 levels were around 80 ppb and significantly lower than the respective daytime maxima; the CO levels were between 200 and 500 ppb (see Fig. 3 in Chen et al., 2022, and Fig. S6), much higher than the CO levels in the middle and upper troposphere (about 100 ppb) and the lower stratosphere (< 50 ppb) (Inness et al., 2022) and even not lower than those CO values on some other days. The measured water vapor pressure during the NOE was close to its normal values (Fig. S6) and did not show any sign of substantial stratospheric impact. In other words, although the levels of CO or water vapor were relatively lower during the NOE events, they did not show large deviations from their values within the normal boundary layer, nor substantial STT influences. All these, together with our evidence given above, indicate that the NOE reported in Chen et al. (2022) was not caused by typhoon-induced stratospheric intrusion. Therefore, more caution should be taken when attributing HOLWCO events at low-altitude sites to stratospheric impact, whether or not there was an influence from a typhoon or another synoptic system. It is suggested that, if possible, each case should be verified by analyzing both physical and chemical processes before drawing a conclusion.
The data used in this study are available upon request to the corresponding author (xiaobin_xu@189.cn).
The supplement related to this article is available online at: https://doi.org/10.5194/acp-24-3759-2024-supplement.
XZ and XX designed the research. WY was responsible for the observations at the Zibo supersite. CG and YL validated the data from the supersite. XZ, YS, and XX performed the data analysis. XZ and XX prepared the manuscript.
The contact author has declared that none of the authors has any competing interests.
Publisher's note: Copernicus Publications remains neutral with regard to jurisdictional claims made in the text, published maps, institutional affiliations, or any other geographical representation in this paper. While Copernicus Publications makes every effort to include appropriate place names, the final responsibility lies with the authors.
We thank the staff of the Zibo supersite and the Zhangqiu, Qingdao and Rongcheng meteorological stations for carrying out the ground-based and radiosonde measurements. We also thank Wenhua Zhang for providing the radar reflectivity maps. The authors gratefully acknowledge the NOAA Air Resources Laboratory (ARL) for the provision of the READY website (https://www.ready.noaa.gov, last access: 4 January 2024) used in this publication.
This research has been supported by the National Natural Science Foundation of China (grant no. 41775031) and the Science and Technology Development Fund of the Chinese Academy of Meteorological Sciences (grant nos. 2023KJ013 and 2023KJ014). The observations at the ZB supersite were supported by the National Research Program for Key Issues in Air Pollution Control (grant nos. DQGG202119 and DQGG202137).
This paper was edited by Tao Wang and reviewed by two anonymous referees.
Ahrens, C. D. and Henson, R.: Essential of Meteorology: An Invitation to the Atmosphere, 8th Edition, Cengage Learning, Boston, USA, ISBN 978-1-305-62845-8, 2016.
ARL (Air Resources Laboratory): HYSPLIT, National Oceanic and Atmospheric Administration (NOAA) [code], https://www.ready.noaa.gov/HYSPLIT.php, 2023.
Baray, J. L., Ancellet, G., Radriambelo, T., and Baldy, S.: Tropical cyclone Marlene and stratosphere-troposphere exchange, J. Geophys. Res., 104, 13953–13970, https://doi.org/10.1029/1999JD900028, 1999.
Bethan, S., Vaughan, G., Gerbig, C., Volz-Thomas, A., Richer, H., and Tiddeman, D. A.: Chemical air mass differences near fronts, J. Geophys. Res., 103, 13413–13434, https://doi.org/10.1029/98JD00535, 1998.
Betts, A. K., Gatti, L. V., Cordova, A. M., Dias, M. A. S., and Fuentes, J. D.: Transport of ozone to the surface by convective downdrafts at night, J. Geophys. Res.-Atmos., 107, 8046, https://doi.org/10.1029/2000JD000158, 2002.
Bolton, D.: The computation of equivalent potential temperature, Mon. Weather Rev., 108, 1046–1053, https://doi.org/10.1175/1520-0493(1980)108<1046:TCOEPT>2.0.CO;2, 1980.
Cairo, F., Buontempo, C., MacKenzie, A. R., Schiller, C., Volk, C. M., Adriani, A., Mitev, V., Matthey, R., Di Donfrancesco, G., Oulanovsky, A., Ravegnani, F., Yushkov, V., Snels, M., Cagnazzo, C., and Stefanutti, L.: Morphology of the tropopause layer and lower stratosphere above a tropical cyclone: a case study on cyclone Davina (1999), Atmos. Chem. Phys., 8, 3411–3426, https://doi.org/10.5194/acp-8-3411-2008, 2008.
Carsey, T. P. and Willoughy, H. E: Ozone measurements from eyewall transects of two Atlantic tropical cyclones, Mon. Weather Rev., 133, 166–174, https://doi.org/10.1175/MWR-2844.1, 2005.
Chameides, W. L.: The photochemical role of tropospheric nitrogen oxides, Geophys. Res. Lett., 5, 17–20, https://doi.org/10.1029/GL005i001p00017, 1978.
Chen, J., Peng, Y., Zhang, C., Sun, X., He, X., Liu, C., and Mu, Y.: Study and application in calibration method of photochemical synthesis for peroxyacetyl nitrate analyzer (in Chinese with English abstract), Environ. Chem., 40, 1862–1870, https://doi.org/10.7524/j.issn.0254-6108.2020012003, 2021.
Chen, Z., Liu, J., Cheng, X., Yang, M., and Wang, H.: Positive and negative influences of typhoons on tropospheric ozone over southern China, Atmos. Chem. Phys., 21, 16911–16923, https://doi.org/10.5194/acp-21-16911-2021, 2021.
Chen, Z., Liu, J., Qie, X., Cheng, X., Shen, Y., Yang, M., Jiang, R., and Liu, X.: Transport of substantial stratospheric ozone to the surface by a dying typhoon and shallow convection, Atmos. Chem. Phys., 22, 8221–8240, https://doi.org/10.5194/acp-22-8221-2022, 2022.
Cho, J. Y. N., Newell, R. E., Browell, E. V., Grant, W. B., Butler, C. F., and Fenn, M. A.: Observation of pollution plume capping by a tropopause fold, Geophys. Res. Lett., 28, 3243–3246, https://doi.org/10.1029/2001GL012898, 2001.
Cooper, O. R., Moody, J. L., Parrish, D. D., Trainer, M., Holloway, J. S., Hubler, G., Fehsenfeld, F. C., and Stohl, A.: Trace gas composition of midlatitude cyclones over the western North Atlantic Ocean: A seasonal comparison of O3 and CO, J. Geophys. Res., 107, ACH 2-1–ACH 2-12, https://doi.org/10.1029/2001JD000902, 2002.
Cox, R. A. and Roffey, M. J.: Thermal decomposition of peroxyacetylnitrate in the presence of nitric oxide, Environ. Sci. Technol., 11, 900–906, 1977.
Diallo, M., Legras, B., and Chédin, A.: Age of stratospheric air in the ERA-Interim, Atmos. Chem. Phys., 12, 12133–12154, https://doi.org/10.5194/acp-12-12133-2012, 2012.
de Bellevue, J. L., Baray, J. L., Baldy, S., Ancellet, G., Diab, R., and Ravetta, F.: Simulations of stratospheric to tropospheric transport during the tropical cyclone Marlene event, Atmos. Environ., 41, 6510–6526, https://doi.org/10.1016/j.atmosenv.2007.04.040, 2007.
Ding, A. J., Wang, T., Thouret, V., Cammas, J.-P., and Nédélec, P.: Tropospheric ozone climatology over Beijing: analysis of aircraft data from the MOZAIC program, Atmos. Chem. Phys., 8, 1–13, https://doi.org/10.5194/acp-8-1-2008, 2008.
EMC (Environmental Modeling Center): Global Forecast System, National Oceanic and Atmospheric Administration (NOAA) [data set], https://www.emc.ncep.noaa.gov/emc/pages/numerical_forecast_systems/gfs.php (last access: 4 January 2024), 2023.
Fadnavis, S., Schultz, M. G., Semeniuk, K., Mahajan, A. S., Pozzoli, L., Sonbawne, S., Ghude, S. D., Kiefer, M., and Eckert, E.: Trends in peroxyacetyl nitrate (PAN) in the upper troposphere and lower stratosphere over southern Asia during the summer monsoon season: regional impacts, Atmos. Chem. Phys., 14, 12725–12743, https://doi.org/10.5194/acp-14-12725-2014, 2014.
Graustein, W. C. and Turekian, K. K.: 7Be and 210Pb indicate upper troposphere source for elevated ozone in the summertime subtropical free troposphere of the eastern North Atlantic, Geophys. Res. Lett., 23, 539-542, https://doi.org/10.1029/96GL00304, 1996.
He, C., Lu, X., Wang, H., Wang, H., Li, Y., He, G., He, Y., Wang, Y., Zhang, Y., Liu, Y., Fan, Q., and Fan, S.: The unexpected high frequency of nocturnal surface ozone enhancement events over China: characteristics and mechanisms, Atmos. Chem. Phys., 22, 15243–15261, https://doi.org/10.5194/acp-22-15243-2022, 2022.
He, Y., Wang, H., Wang, H., Xu, Y., Li, Y., and Fan, S.: Meteorology and topographic influences on nocturnal ozone increase during the summertime over Shaoguan, China, Atmos. Environ., 256, 118459, https://doi.org/10.1016/j.atmosenv.2021.118459, 2021.
Hung, C.-H. and Lo, K.-C.: Relationship between ambient ozone concentration changes in southwestern Taiwan and invasion tracks of tropical typhoons, Adv. Meteorol., 2015, 402976, https://doi.org/10.1155/2015/402976, 2015.
Holton, J. R., Haynes, P. H., McIntyre, M. E., Douglass, A. R., Rood, R. B., and Pster, L.: Stratosphere-troposphere exchange, Rev. Geophys., 33, 403–439, https://doi.org/10.1029/95RG02097, 1995.
Inness, A., Aben, I., Ades, M., Borsdorff, T., Flemming, J., Jones, L., Landgraf, J., Langerock, B., Nedelec, P., Parrington, M., and Ribas, R.: Assimilation of S5P/TROPOMI carbon monoxide data with the global CAMS near-real-time system, Atmos. Chem. Phys., 22, 14355–14376, https://doi.org/10.5194/acp-22-14355-2022, 2022.
Jaeglé, L., Jacob, D. J., Brune, W. H., Tan, D., Faloona, I. C., Weinheimer, A. J., and Ridley, B. A., Campos, T. L., and Sachse, G. W.: Sources of HOx and production of ozone in the upper troposphere over the United States, Geophys. Res. Lett., 25, 1709–1712, https://doi.org/10.1029/98GL00041, 1998.
Jia, S., Xu, X., Lin, W., Wang, Y., He, X., and Hualong, Z.: Increased Mixing Ratio of Surface Ozone by Nighttime Convection Process over the North China Plain, J. Appl. Meteorol. Sci., 26, 280–290, https://doi.org/10.11898/1001-7313.20150303, 2015 (in Chinese with English abstract).
Jiang, Y. C., Zhao, T. L., Liu, J., Xu, X. D., Tan, C. H., Cheng, X. H., Bi, X. Y., Gan, J. B., You, J. F., and Zhao, S. Z.: Why does surface ozone peak before a typhoon landing in southeast China?, Atmos. Chem. Phys., 15, 13331–13338, https://doi.org/10.5194/acp-15-13331-2015, 2015.
Kramer, L. J., Helmig, D., Burkhart, J. F., Stohl, A., Oltmans, S., and Honrath, R. E.: Seasonal variability of atmospheric nitrogen oxides and non-methane hydrocarbons at the GEOSummit station, Greenland, Atmos. Chem. Phys., 15, 6827–6849, https://doi.org/10.5194/acp-15-6827-2015, 2015.
Lelieveld, J. and Dentener, F. J.: What controls tropospheric ozone?, J. Geophys. Res., 105, 3531–3551, https://doi.org/10.1029/1999JD901011, 2000.
Liu, S. C., Kley, D., McFarland, M., Mahlman, J. D., and Levy II, H.: On the origin of tropospheric ozone, J. Geophys. Res., 85, 7546–7552, https://doi.org/10.1029/JC085iC12p07546, 1980.
Logan, J. A.: Tropospheric ozone: Seasonal behavior, trends, and anthropogenic influence, J. Geophys. Res., 90, 10463–10482, https://doi.org/10.1029/JD090iD06p10463, 1985.
Lu, X., Hong, J., Zhang, L., Cooper, O.R., Schultz, M.G., Xu, X., Wang, T., Gao, M., Zhao, Y., and Zhang, Y.: Severe Surface Ozone Pollution in China: A Global Perspective, Environ. Sci. Technol. Lett., 2018, 487–494, https://doi.org/10.1021/acs.estlett.8b00366, 2018.
Lyu, X., Li, K., Guo, H., Morawska, L., Zhou, B., Zeren, Y., Jiang, F., Chen, C., Goldstein, A., Lin, M., Xu, X., Wang, T., Lu, X., Zhu, T., Querol, X., Chatani, S., Latif, M.T., Schuch, D., Sinha, V., Kumar, P., Mullins, B., Seguel, R., Shao, M., Xue, L., Wang, N., Chen, J., Gao, J., Chai, F., Simpson, I., Sinha, B., and Blake, D.: A synergistic ozone-climate control to address emerging ozone pollution challenges, One Earth, 6, 964–977, https://doi.org/10.1016/j.oneear.2023.07.004, 2023.
Ma, Z. Q., Xu, H. H., Meng, W., Zhang, X. L., Xu, J., Liu, Q., and Wang, Y. S.: Vertical ozone characteristics in urban boundary layer in Beijing, Environ. Monit. Assess., 185, 5449–5460, https://doi.org/10.1007/s10661-012-2958-5, 2013.
Ma, Z., Xu, J., Quan, W., Zhang, Z., Lin, W., and Xu, X.: Significant increase of surface ozone at a rural site, north of eastern China, Atmos. Chem. Phys., 16, 3969–3977, https://doi.org/10.5194/acp-16-3969-2016, 2016.
Meng, K., Zhao, T., Xu, X., Hu, Y., Zhao, Y., Zhang, L., Pang, Y., Ma, X., Bai, Y., Zhao, Y., and Zhen, S.: Anomalous surface O3 changes in North China Plain during the northwestward movement of a landing typhoon, Sci. Total Environ., 820, 153196, https://doi.org/10.1016/j.scitotenv.2022.153196, 2022.
Merrill, R. T.: Characteristics of the Upper-tropospheric Environmental flow around Hurricanes, J. Atmos. Sci., 45, 1665–1677, https://doi.org/10.1175/1520-0469(1988)045<1665:COTUTE>2.0.CO;2, 1988.
Moore, D. P. and Remedios, J. J.: Seasonality of Peroxyacetyl nitrate (PAN) in the upper troposphere and lower stratosphere using the MIPAS-E instrument, Atmos. Chem. Phys., 10, 6117–6128, https://doi.org/10.5194/acp-10-6117-2010, 2010.
Newell, R. E., Hu, W., Wu, Z.-X., Zhu, Y., Akimoto, H., Anderson, B. E., Browell, E. V., Gregory, G. L., Sachse, G. W., Shipham, M. C., Bachmeier, A. S., Bandy, A. R., Thornton, D. C., Blake, D. R., Rowland, F. S., Bradshaw, J. D., Crawford, J. H., Davis, D. D., Sandholm, S. T., Brockett, W., DeGreef, L., Lewis, D., Mc-Cormick, D., Monitz, E., Collins, J. E., Heikes, B. G., Merrill, J. T., Kelly, K. K., Liu, S. C., Kondo, Y., Koike, M., Liu, C.-M., Sakamaki, F., Singh, H. B., Dibb, J. E., and Talbot, R. W.: Atmospheric sampling of Super typhoon Mireille with NASA DC-8 aircraft on September 27, 1991, during PEM-West A, J. Geophys. Res., 101, 1853–1871, https://doi.org/10.1029/95JD01374, 1996a.
Newell, R. E., Wu, Z.-X, Zhu, Y., Hu, W., Browel, E. V., Gregory, G. L., Sachse, G. W., Collins Jr., J. E., Kelly, K. K., and Li, S. C.: Vertical fine-scale atmospheric structure measured from NASA DC-8 during PEM-West A, J. Geophys. Res., 101, 1943–1960, https://doi.org/10.1029/95JD02613, 1996b.
NMIC (National Meteorological Information Center): China Meteorological Data (CMA), https://data.cma.cn (last access: 13 July 2023), 2015.
Ouyang, S., Deng, T., Liu, R., Chen, J., He, G., Leung, J. C.-H., Wang, N., and Liu, S. C.: Impact of a subtropical high and a typhoon on a severe ozone pollution episode in the Pearl River Delta, China, Atmos. Chem. Phys., 22, 10751–10767, https://doi.org/10.5194/acp-22-10751-2022, 2022.
Pandey Deolal, S., Staehelin, J., Brunner, D., Cui, J., Steinbacher, M., Zellweger, C., Henne, S., and Vollmer, M. K.: Transport of PAN and NOy from different source regions to the Swiss high alpine site Jungfraujoch, Atmos. Envron., 64, 103–115, https://doi.org/10.1016/j.atmosenv.2012.08.021, 2013.
Parrish, D. D., Trainer, M., Holloway, J. S., Yee, J. E., Warshawsky, M. S., Fehsenfeld, F. C., Forbes, G. L., and Moody, J. L.: Relationships between ozone and carbon monoxide at surface sites in the North Atlantic region, J. Geophys. Res., 103, 13357–13376, https://doi.org/10.1029/98JD00376, 1998.
Preston, A., Fuelberg, H., and Barth, M.: Simulation of chemical transport by Typhoon Mireille, J. Geophys. Res.-Atmos., 124, 11614–11639, https://doi.org/10.1029/2019JD030446, 2019.
Prospero, J. M., Schmitt, R., Cuevas, E., Savoie, D. L., Graustein, W. C., Turekian, K. K., Volz-Thomas, A., Diaz, A., Oltmans, S. J., and Levy II, H.: Temporal variability of summer-time ozone and aerosols in the free troposphere over the eastern North Atlantic, Geophys. Res. Lett., 22, 2925–2928, https://doi.org/10.1029/95GL02791, 1995.
Qu, K., Wang, X., Yan, Y., Shen, J., Xiao, T., Dong, H., Zeng, L., and Zhang, Y.: A comparative study to reveal the influence of typhoons on the transport, production and accumulation of O3 in the Pearl River Delta, China, Atmos. Chem. Phys., 21, 11593–11612, https://doi.org/10.5194/acp-21-11593-2021, 2021.
Roiger, A., Aufmhoff, H., Stock, P., Arnold, F., and Schlager, H.: An aircraft-borne chemical ionization – ion trap mass spectrometer (CI-ITMS) for fast PAN and PPN measurements, Atmos. Meas. Tech., 4, 173–188, https://doi.org/10.5194/amt-4-173-2011, 2011.
Roux, F., Clark, H., Wang, K.-Y., Rohs, S., Sauvage, B., and Nédélec, P.: The influence of typhoons on atmospheric composition deduced from IAGOS measurements over Taipei, Atmos. Chem. Phys., 20, 3945–3963, https://doi.org/10.5194/acp-20-3945-2020, 2020.
Sahu, L. K. and Lal, S.: Changes in surface ozone levels due to convective downdrafts over the Bay of Bengal, Geophys. Res. Lett., 33, L10807, https://doi.org/10.1029/2006GL025994, 2006.
Shao, M., Yang, J., Wang, J., Chen, P., Liu, B., and Dai, Q.: Co-occurrence of surface O3, PM2.5 pollution, and tropical cyclones in China, J. Geophys. Res.-Atmos., 127, e2021JD036310, https://doi.org/10.1029/2021JD036310, 2022.
Shu, L., Xie, M., Wang, T., Gao, D., Chen, P., Han, Y., Li, S., Zhuang, B., and Li, M.: Integrated studies of a regional ozone pollution synthetically affected by subtropical high and typhoon system in the Yangtze River Delta region, China, Atmos. Chem. Phys., 16, 15801–15819, https://doi.org/10.5194/acp-16-15801-2016, 2016.
Singh, H. B., Salas, L., Herlth, D., Kolyer, R., Czech, E., Avery, M., Crawford, J. H., Pierce, R. B., Sachse, G. W., Blake, D. R., Cohen, R. C., Bertram, T. H., Perring, A., Wooldridge, P. J., Dibb, J., Huey, G., Hudman, R. C., Turquety, S., Emmons, L. K., Flocke, F., Tang, Y., Carmichael, G. R., and Horowitz, L. W.: Reactive nitrogen distribution and partitioning in the North American troposphere and lowermost stratosphere, J. Geophys. Res., 112, D12S04, https://doi.org/10.1029/2006JD007664, 2007.
Škerlak, B., Sprenger, M., and Wernli, H.: A global climatology of stratosphere–troposphere exchange using the ERA-Interim data set from 1979 to 2011, Atmos. Chem. Phys., 14, 913–937, https://doi.org/10.5194/acp-14-913-2014, 2014.
Stoller, P., Cho, J. Y. N., Newell, R. E., Thouret, V., Zhu, Y., Carroll, M. A., Albercook, G. M., Anderson, B. E., Barrick, J. D. W., Browell, E. V., Gregory, G. L., Sachse, G. W., Vay, S., Bradshaw, J. D., and Sandholm, S.: Measurements of atmospheric layers from the NASA DC-8 and P-3B aircraft during PEM-Tropics A, J. Geophys. Res.-Atmos., 104, 5745–5764, https://doi.org/10.1029/98JD02717, 1999.
Tang, G., Zhu, X., Xin, J., Hu, B., Song, T., Sun, Y., Zhang, J., Wang, L., Cheng, M., Chao, N., Kong, L., Li, X., and Wang, Y.: Modelling study of boundary-layer ozone over northern China – Part I: Ozone budget in summer, Atmos. Res., 187, 128–137, https://doi.org/10.1016/j.atmosres.2016.10.017, 2017.
Wang, H., Wang, W., Huang, X., and Ding, A.: Impacts of stratosphere-to-troposphere-transport on summertime surface ozone over eastern China, Sci. Bull., 65, 276–279, https://doi.org/10.1016/j.scib.2019.11.017, 2020.
Wang, R., Xu, X., Jia, S., Ma, R., Ran, L., Deng, Z., Lin, W., Wang, Y., and Ma, Z.: Lower tropospheric distributions of O3 and aerosol over Raoyang, a rural site in the North China Plain, Atmos. Chem. Phys., 17, 3891–3903, https://doi.org/10.5194/acp-17-3891-2017, 2017.
Wang, N., Huang, X., Xu, J., Wang, T., Tan, Z., and Ding, A.: Typhoon-boosted biogenic emission aggravates cross-regional ozone pollution in China, Sci. Adv., 8, eabl6166, https://doi.org/10.1126/sciadv.abl6166, 2022.
Wang, X. L.: Historical air quality data in China, https://quotsoft.net/air (last access: 15 April 2023), 2020.
Xu, X., Zhang, H., Lin, W., Wang, Y., Xu, W., and Jia, S.: First simultaneous measurements of peroxyacetyl nitrate (PAN) and ozone at Nam Co in the central Tibetan Plateau: impacts from the PBL evolution and transport processes, Atmos. Chem. Phys., 18, 5199–5217, https://doi.org/10.5194/acp-18-5199-2018, 2018.
Zhan, C., Xie, M., Huang, C., Liu, J., Wang, T., Xu, M., Ma, C., Yu, J., Jiao, Y., Li, M., Li, S., Zhuang, B., Zhao, M., and Nie, D.: Ozone affected by a succession of four landfall typhoons in the Yangtze River Delta, China: major processes and health impacts, Atmos. Chem. Phys., 20, 13781–13799, https://doi.org/10.5194/acp-20-13781-2020, 2020.
Zhao, W., Tang, G., Yu, H., Yang, Y., Wang, Y., Wang, L., An, J., Gao, W., Hu, B., Cheng, M., An, X., Li, X., and Wang, Y.: Evolution of boundary layer ozone in Shijiazhuang, a suburban site on the North China Plain, J. Environ. Sci., 83, 152–160, https://doi.org/10.1016/j.jes.2019.02.016, 2019.
Zhu, T., Lin, W., Song, Y., Cai, X., Zou, H., Kang, L., Zhou, L., and Akimoto, H.: Downward transport of ozone-rich air near Mt. Everest, Geophys. Res. Lett., 33, L23809, https://doi.org/10.1029/2006GL027726, 2006.
Zhu, X., Ma, Z., Qiu, Y., Liu, H., Liu, Q., and Yin, X.: An evaluation of the interaction of morning residual layer ozone and mixing layer ozone in rural areas of the North China Plain, Atmos. Res., 236, 104788, https://doi.org/10.1016/j.atmosres.2019.104788, 2020.