the Creative Commons Attribution 4.0 License.
the Creative Commons Attribution 4.0 License.
 | 28 Mar 2022
Reducing future air-pollution-related premature mortality over Europe by mitigating emissions from the energy sector: assessing an 80 % renewable energies scenario
Patricia Tarín-Carrasco
Camilla Geels
Laura Palacios-Peña
Pedro Jiménez-Guerrero
Overall, European air quality has worsened in recent decades as a consequence of increased anthropogenic emissions, in particular from the power generation sector. The evidence of the effects of atmospheric pollution (and particularly fine particulate matter, PM2.5) on human health is now unquestionable; it is mainly associated with cardiovascular and respiratory diseases, along with morbidity and even mortality. These effects may even strengthen in the future as a consequence of climate penalties and future changes in the projected population. For all these reasons, the main objective of this contribution is the estimation of the annual excess premature deaths (PD) associated with PM2.5 in the present (1991–2010) and future (2031–2050) European population using non-linear exposure–response functions. The endpoints included are lung cancer (LC), chronic obstructive pulmonary disease (COPD), low respiratory infections (LRI), ischaemic heart disease (IHD), cerebrovascular disease (CEV) and other non-communicable diseases (other NCD). PM2.5 concentrations come from coupled chemistry–climate regional simulations under present and future (RCP8.5) scenarios. The cases assessed include the estimation of the present incidence of PD (PRE-P2010), the quantification of the role of a changing climate in PD (FUT-P2010) and the importance of changes in the population projected for the year 2050 in the incidence of excess PD (FUT-P2050). Two additional cases (REN80-P2010 and REN80-P2050) evaluate the impact on premature mortality rates of a mitigation scenario in which 80 % of European energy production comes from renewable sources. The results indicate that PM2.5 accounts for nearly 895 000 (95 % confidence interval (95 % CI) 725 000–1 056 000) annual excess PD over Europe, with IHD being the largest contributor to premature mortality associated with fine particles in both present and future scenarios. The case that isolates the effects of a climate penalty (FUT-P2010) estimates a variation of +0.2 % in mortality rates over the whole domain. However, under this scenario, the incidence of PD over central Europe will benefit from a decrease in PM2.5 (−2.2 PD/100 000 inhabitants), while in eastern (+1.3 PD/100 000 inhabitants) and western (+0.4 PD/100 000 inhabitants) Europe, PD will increase due to increased PM2.5 levels. The changes in the projected population (FUT-P2050) will lead to a large increase in annual excess PD (1 540 000, 95 % CI 1 247 000–1 818 000; +71.96 % with respect to PRE-P2010 and +71.67 % with respect to FUT-P2010) due to the ageing of the European population. Last, the mitigation scenario (REN80-P2050) demonstrates that the effects of a mitigation policy of increasing the ratio of renewable sources in the energy mix could lead to a decrease of over 60 000 (95 % CI 48 500–70 900) annual PD for the year 2050 (a decrease of −4 % in comparison with the no-mitigation scenario FUT-P2050). In spite of the uncertainties inherent in future estimations, this contribution reveals the need of governments and public entities to take action and choose air pollution mitigation policies.
- Article
(19547 KB) - Full-text XML
-
Supplement
(2091 KB) - BibTeX
- EndNote


Air pollution is now a leading cause of global disease burden, especially in low- and middle-income countries (Balakrishnan et al., 2019), and is expected to greatly increase under future climate scenarios (e.g. Fang et al., 2013a; Tarín-Carrasco et al., 2019; Park et al., 2020, among others). Fine particulate matter (PM2.5) is a common air pollutant with important effects on human health. Exposure to this pollutant leads to cardiovascular or respiratory diseases, together with an increase in premature mortality (e.g. Brook et al., 2010; Evans et al., 2013; Hamra et al., 2014; Ford and Heald, 2016; Im et al., 2018; Tarín-Carrasco et al., 2019, among others). Short- or long-term exposure to PM2.5 can have different impacts on human health. The much larger effects of long-term exposure may suggest that the effects on human health are due to not only increased pollution but also the progression of underlying diseases (World Health Organization, 2013).
In addition, over 90 % of the population living in cities is exposed to fine particles at concentrations exceeding the air quality guidelines established by the World Health Organization (WHO) (Prüss-Üstün et al., 2016). Lelieveld et al. (2013) estimate that 69 % of the global population is exposed to an annual mean anthropogenic PM2.5 concentration >10 µg m−3 (WHO air quality guideline); 33 % to concentrations over 25 µg m−3 (limit value of EU Directive 2008/50/CE); and 20 % to concentrations >35 µg m−3, the WHO Level 1 Interim Target (World Health Organization, 2013). Focussing on Europe for present scenarios, Lelieveld et al. (2013) calculate that the global respiratory mortality incidence associated with air pollution is 773 000 per year. The same study indicates that there is a burden of 186 000 premature deaths per year associated with lung cancer and a mortality incidence of around 2 000 000 due to cardiovascular diseases. For Europe, Andersson et al. (2009) estimate the number of excess premature deaths (PD) caused by PM2.5 as 301 000 per year.
Nowadays, 70 % of the mortality attributable to air pollution globally is associated with PM2.5 (Silva et al., 2016a), with some hotspots observed in East Asia, India and Europe. However, the mortality attributable to air pollution has changed over the last 25 years (Fang et al., 2013a; Silva et al., 2013; Cohen et al., 2017). Silva et al. (2013) attribute these increases in mortality to direct changes in anthropogenic emissions and estimate that 2.1 million of the premature deaths due to chronic obstructive pulmonary disease (COPD) and lung cancer (LC) are related to PM2.5. In addition, these numbers are expected to increase under future climate scenarios as a consequence of the effect of the climate penalty on air quality (Silva et al., 2016b; Hong et al., 2020; Park et al., 2020). Climate change will modify air quality by altering physico-chemical processes and parameters such as temperature (and thus the oxidative capacity of the atmosphere), wet deposition or dynamical changes (Jacob and Winner, 2009; Jiménez-Guerrero et al., 2013a).
Although fine particulate matter can travel long distances, provoking increased mortality on a global scale, Anenberg et al. (2014) estimate that 93–97 % of the PD associated with air pollution occur within the source region. Therefore, the contribution of anthropogenic emissions to air pollution is remarkable. As estimated by Fang et al. (2013a), 95 % of the mortality from PM2.5 is driven by local emissions of short-lived air pollutants and their precursors. The main source of emissions responsible for these numbers differs among regions. For instance, in Europe, agriculture is the sector with the highest contribution to PM2.5 emissions (Lelieveld et al., 2015; Crippa et al., 2019). However, the sources responsible for the largest impact on PD linked to outdoor air pollution are not related to agriculture, but to land traffic and energy use (Lelieveld et al., 2015; Silva et al., 2016a).
Therefore, the implementation of mitigation controls and environmental policies that can help offset the effect of the climate penalty has become essential to reduce premature mortality over Europe (McConnell et al., 2006; Anenberg et al., 2014; Fang et al., 2013b; Crippa et al., 2019, among others). Changes in future anthropogenic emissions will depend on different variables such as socioeconomics, technology and developments, energy demand, demographic trends and land-use changes, as well as climate policies (Kirtman et al., 2013). In this sense, Silva et al. (2016a) suggested that specific actions targeting residential and commercial sectors could control PM2.5 emissions and would benefit human health. Other works such as those of Anenberg et al. (2014) or Liang et al. (2018) showed that reducing anthropogenic emissions by 20 % could substantially decrease the incidence of excess mortality. Under a business as usual scenario (no emission control), the contribution of outdoor pollution to PD could increase by 100 % by mid-century, doubling in 2050 (Lelieveld et al., 2015). In this context, Lelieveld et al. (2019) showed that replacing fossil fuels with renewable energy sources could improve the numbers related to the expected loss of life from air pollution. However, previous studies have shown that e.g. an ageing population in the future would have the potential to counteract the effect of these emission reductions (Geels et al., 2015).
Hence, the objective of this study is to estimate the present (1991–2010) incidence of excess PD (PD per year) associated with fine particulate matter and its changes under several future scenarios for the years 2031–2050, which include the climate penalty, the projected population by 2050 and a mitigation scenario where 80 % of European energy production comes from renewable sources. A number of different endpoints or causes of premature mortality such as lung cancer (LC), chronic obstructive pulmonary disease (COPD), low respiratory infections (LRI), ischaemic heart disease (IHD), cerebrovascular disease (CEV) and other non-communicable diseases (other NCD) are included in this contribution.
2.1 Premature mortality estimation using exposure–response functions
Future PD caused by several specific endpoints related to PM2.5 have been estimated using non-linear exposure–response functions, a methodology analogous to that previously implemented in Tarín-Carrasco et al. (2021). The health impact function was applied in each grid cell (Eq. 1) to estimate the premature mortality:
This equation is based on epidemiological relationships between air pollution concentration and mortality in each grid cell, where ΔM is the premature mortality due to a specific disease, y0 is the baseline mortality rate, RR is the risk ratio and Population refers to the exposed population (in this contribution, adults are considered). y0 varies according to the cause of mortality, age and European region (Fig. S1 in the Supplement) and is estimated by the WHO for each sex and year. Sex mixing values used in the present study account for both male and female dwellers during the year 2017 (the last available). The premature mortality and RR were estimated for each pathology and the different group ages included in this contribution: 25–29, 30–34, 35–39, 40–44, 45–49, 50–54, 55–59, 60–64, 65–69, 70–74, 75–79, +80 years and all ages.
Risk ratios were determined with the GEMM methodology developed by Burnett et al. (2018) (Eq. 2):
θ, α, μ and ν are variables obtained from Burnett et al. (2018) for each pathology, and z refers to the mean annual concentration of PM2.5. The pathologies included in this work are lung cancer (LC), chronic obstructive pulmonary disease (COPD), lower respiratory infection (LRI), cerebrovascular disease (CEV), ischaemic heart disease (IHD) and non-accidental diseases (NCD + LRI). Other NCD is calculated by subtracting NCD + LRI and the rest of the categories. Uncertainty ranges are expressed as the 95 % confidence intervals (95 % CIs), adopted from Burnett et al. (2018).
2.2 Population data
Population data for Europe were taken from the NASA SocioEconomic Data and Applications Center (2019) gridded dataset. These data provide the population density by age and gender for the year 2010 (consistent with national censuses and population registers) with a resolution of 5 km2. Population data were interpolated to the working grid to make them consistent with the gridded air pollution data (Fig. S2, top, in the Supplement).
With respect to the future population, a projection for the year 2050 was estimated using information on population prospects from the United Nations (UN) Department of Economic and Social Affairs Population Dynamics (United Nations, 2020). This included the changes in the total national numbers and the age distribution. The relative variation of the population from this dataset between 2010 and 2050 for each European country and age range was calculated in order to obtain the ratio of population for the future scenario (2050) in this study (Fig. S2, bottom). The population pyramids for the years 2010 and 2050 are presented in Fig. 1. This figure indicates a very slight projected decrease (−0.2 %) in the European population (807.5 M vs. 806.2 M dwellers in the present and future populations, respectively), especially over eastern Europe (−4.0 %). Conversely, the populations of western and central Europe increase in the UN 2050 projections (by +2.7 % and +5.7 %, respectively). In addition, the projected data include a higher population density over many urban areas and a clear ageing of European citizens. As an example, the population of over 80 year olds (80+) represents barely 4 % of the total European population today, while it is expected to increase to >9 % in the projected UN 2050 estimations.
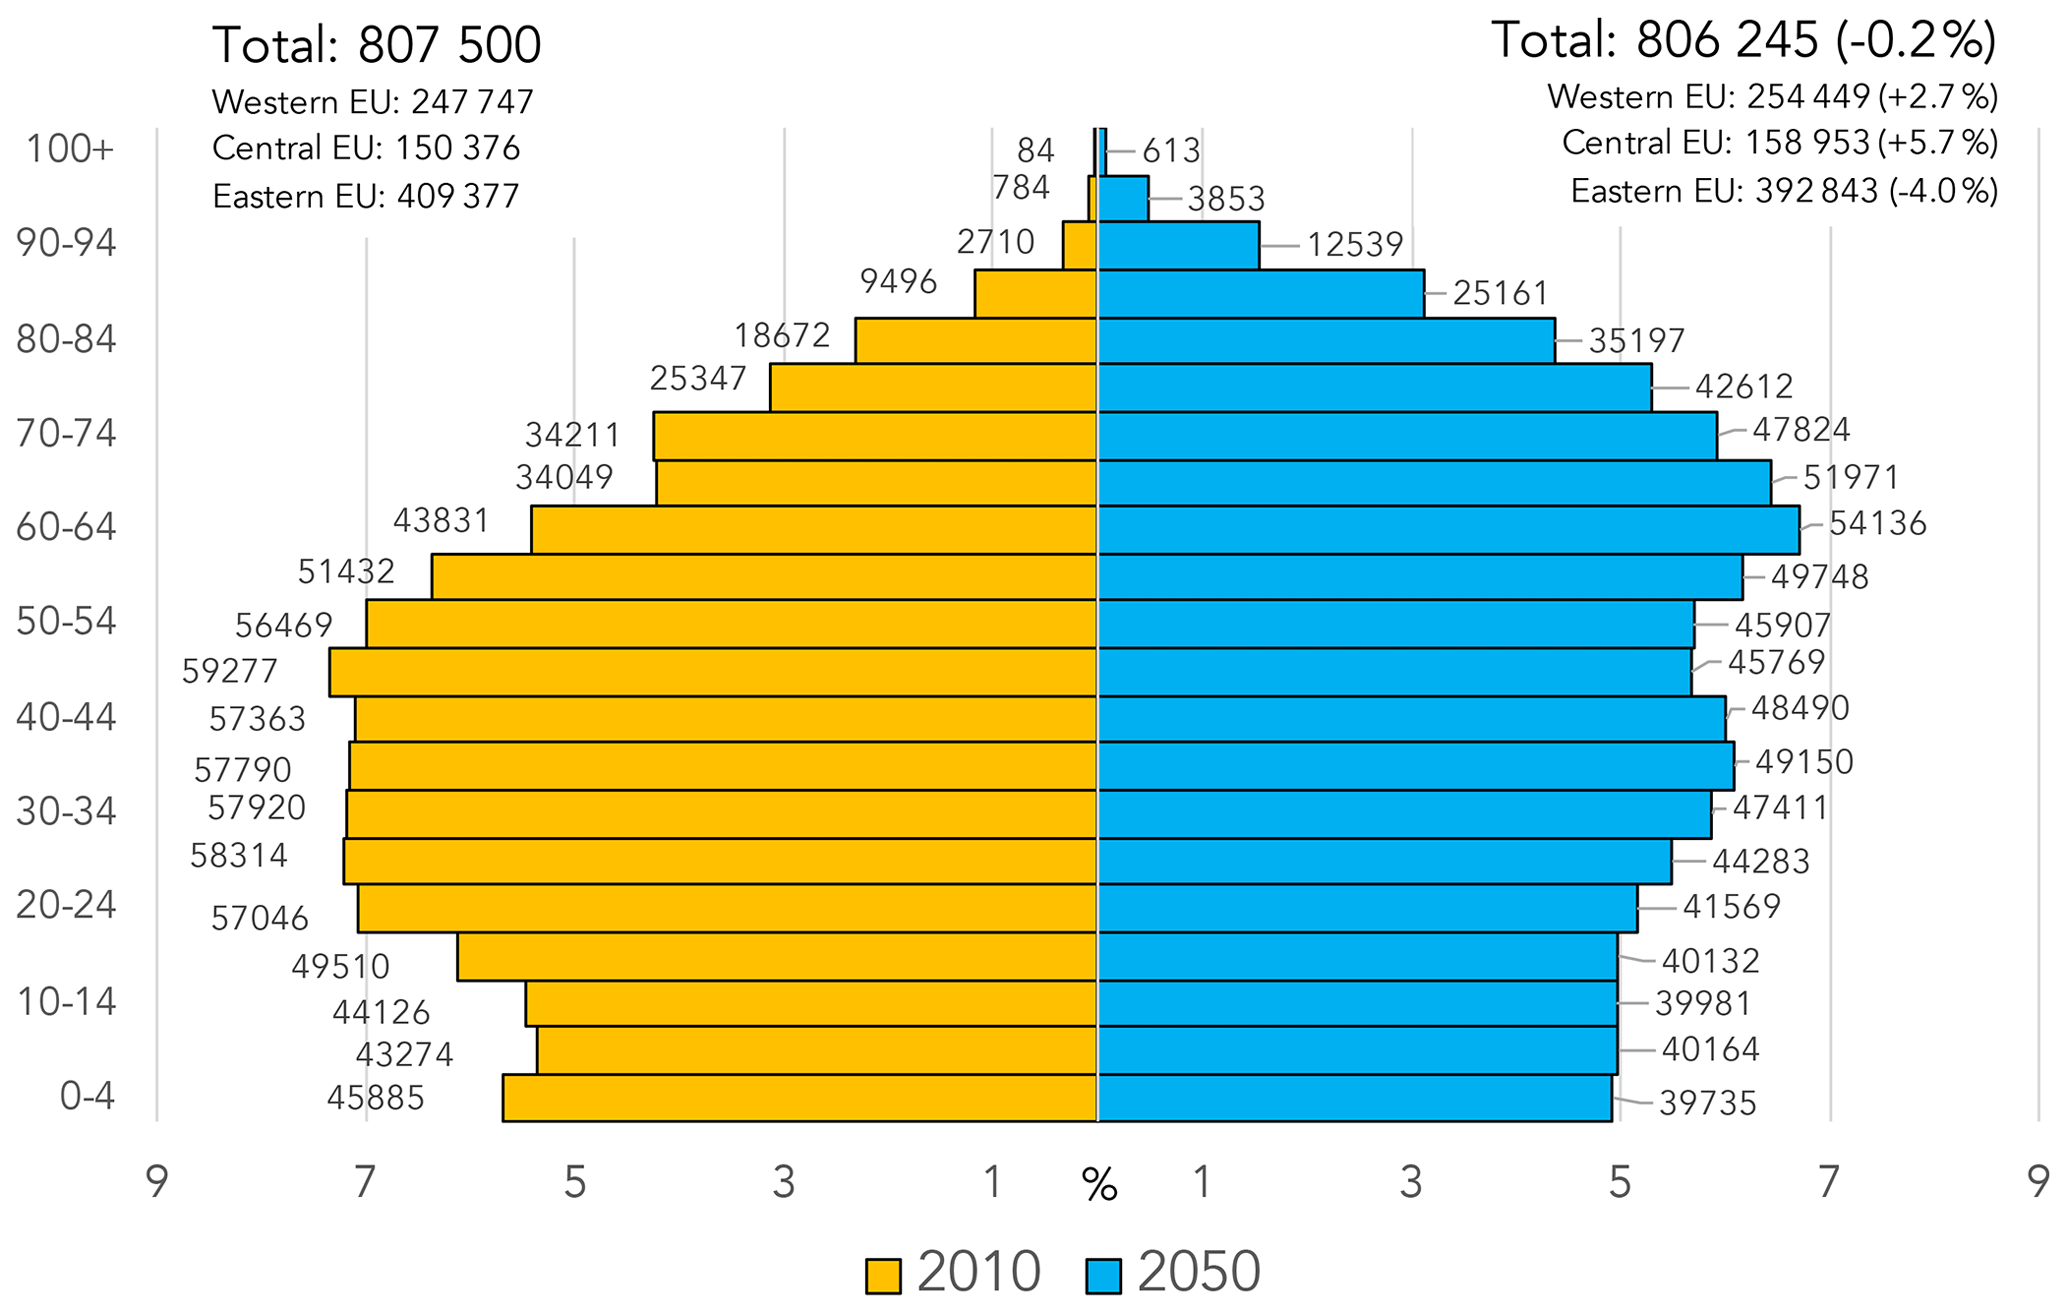
Figure 1Population pyramids by age range for the years 2010 (orange, left) and 2050, as projected by the UN (blue, right). Population data are shown in thousands. The x axis represents the percentage of the contribution of each age range to the total population.
2.3 Air quality data and scenarios
Data on observed air pollution for conducting studies on the impacts of air pollution on human health are scarce. The network of stations for measuring air pollutants are generally insufficient for health purposes due to their spatial misalignment and low coverage (Vedal et al., 2017). This limitation has led to the modelling of outputs to provide information about air pollution, especially when air quality projections are needed (Tarín-Carrasco et al., 2019).
Here, air quality model data (PM2.5 dry aerosol mass) from the WRF-Chem model (Grell et al., 2005) of the REPAIR initiative (Jerez et al., 2020; Palacios-Peña et al., 2020b; Pravia-Sarabia et al., 2020; Jerez et al., 2021; López-Romero et al., 2021) are inputted into Eq. (2) in order to estimate the annual PD associated with different endpoints in both current and future climate change scenarios. The parameterizations implemented in the WRF-Chem model are summarized in Table S1 of the Supplement. The domain covers Europe with a horizontal resolution of 0.11∘ under the Euro-CORDEX requirements (Jacob et al., 2020). For future scenarios, climate forcing is derived from the RCP8.5 scenario, since RCP8.5 represents an upper limit to climate impacts (Moss et al., 2010). The reference periods span 1991–2010 for the present and 2031–2050 for future projections (PM2.5 concentrations are averaged for each 20-year period). The robustness of this simulation for representing PM2.5 is evaluated in the Supplement (Tables S2 and S3), where the model is compared with data from 108 stations belonging to the AirBase database of the European Environment Agency. The results are summarized in Fig. 2, and the numerical results for each station can be found in Table S3. Briefly, the low errors found (for example, an average mean bias of under 2 µg m−3 and a mean fractional bias of <9 %) guarantee phase accordance (timing) between and similar amplitudes for the simulated and observational series as well as the quantitative accuracy of the simulated climatologies, hence making us confident of the suitability of the modelling system for the purpose of this study.
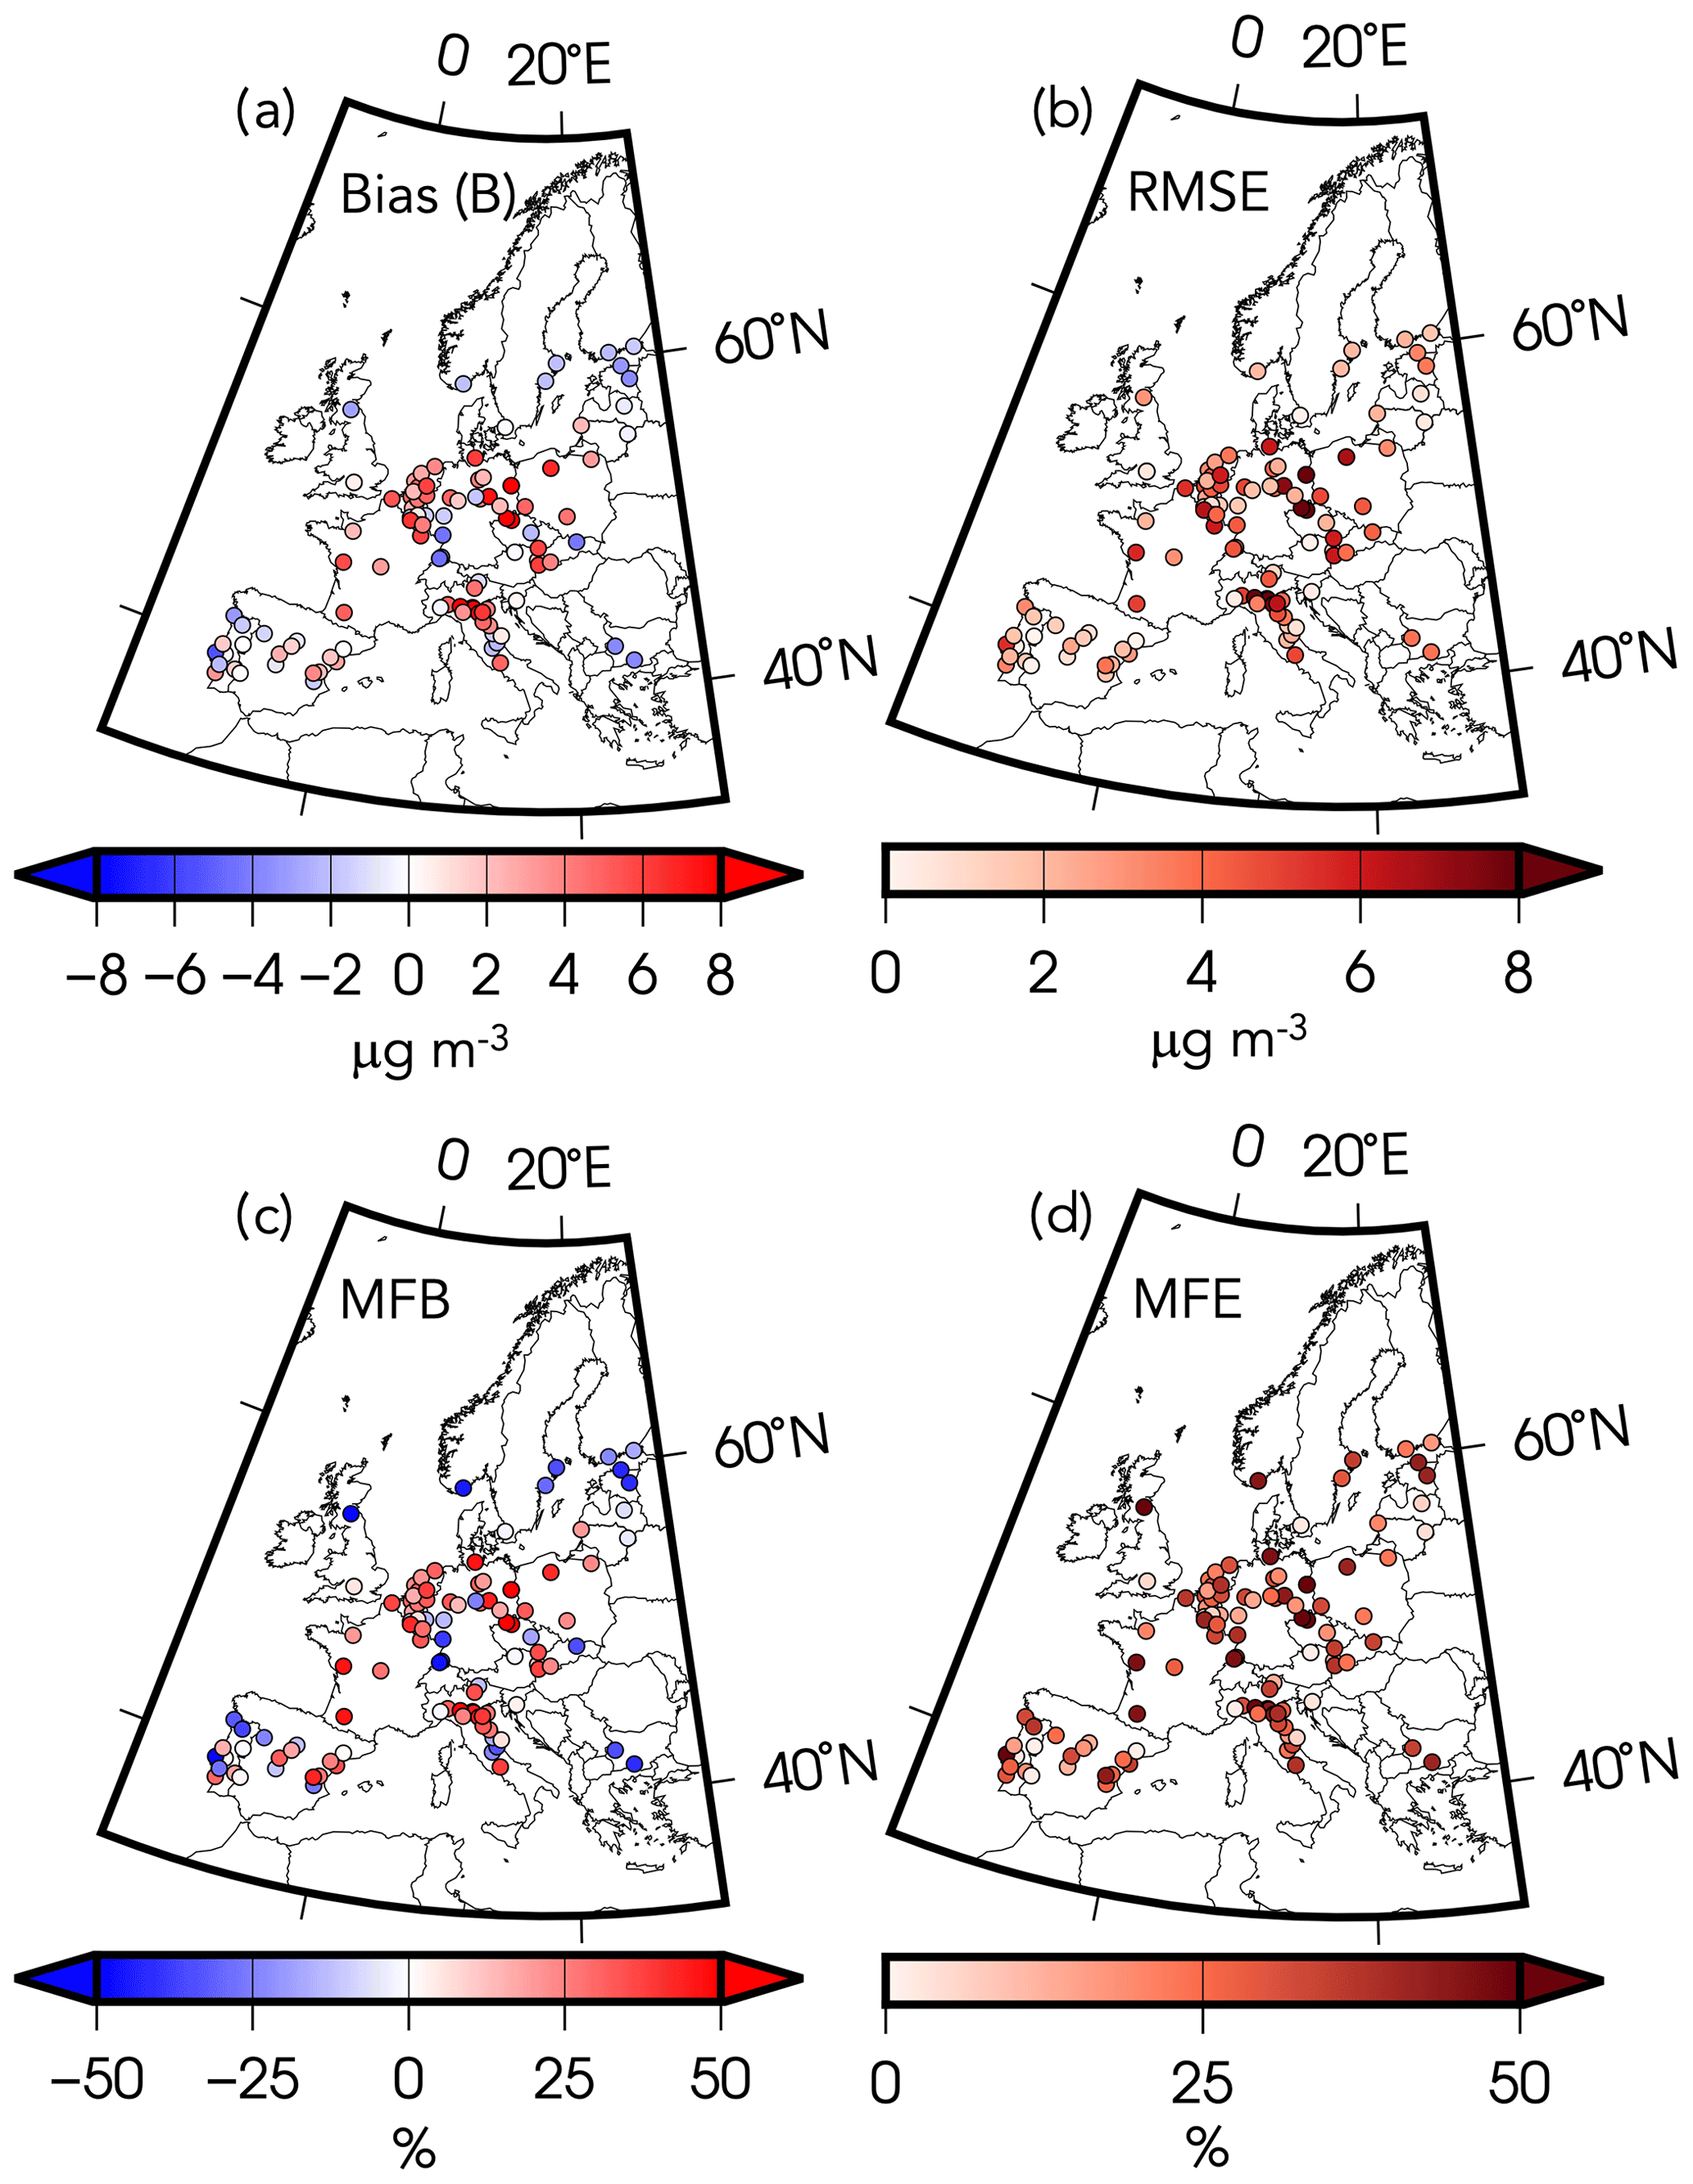
Figure 2Results of model validation for PM2.5 simulations: (a) mean bias (B, µg m−3); (b) root mean square error (RMSE, µg m−3); (c) mean fractional bias (MFB, %); (d) mean fractional error (MFE, %).
In our case, simulations do not assimilate observational data. Ground-based observations and satellite products are often used to improve modelling results for present-day simulations concerning particulate matter (e.g. Lee et al., 2015; van Donkelaar et al., 2016; Chen et al., 2020; Jiménez-Guerrero and Ratola, 2021; McDuffie et al., 2021). However, these bias correction techniques that are widely used in climate impact modelling (Maraun, 2016) are limited when future scenarios are included in the simulations, since no observations can constrain future modelling results. Instead, we have decided to use the so-called “delta method” (Räisänen, 2007) to present the results and future changes in air pollution, as recommended in Fernández et al. (2019). In the simple terms applied in this contribution, we assume that the results of the evaluation presented in the Supplement point to accurate results (small biases) for present-day PM2.5 simulations. In addition, the delta method assumes that model errors for the future time slice (2031–2050 in this contribution) will cancel out when compared with the simulation of the present climate (1991–2010, taken as the present reference time slice). This is related to bias correction methods. In particular, delta changes are insensitive to local shift bias correction methods. It is true that more complex bias correction techniques could have been applied (e.g. quantile mapping), but the bias-corrected and delta-change projections differ for those methods (Ho et al., 2012; Räisänen and Räty, 2013; Fernández et al., 2019), leading to a new source of uncertainty. Therefore, this contribution uses the delta method (assuming the cancellation of present and future biases), as also implemented in other works related to air pollution impacts on health issues (e.g. Silva et al., 2017 or the contributions of Tarín-Carrasco et al., 2019, 2021; Guzmán et al., 2022 (among many others), which rely on these very simulations).
Further details about the methodology of the model simulations are included below. The GOCART aerosol module (Ginoux et al., 2001; Chin et al., 2002), the aerosol scheme used in this work, includes a bulk approach for black carbon (BC), organic carbon (OC) and sulfate, as well as a sectional scheme for mineral dust and sea salt using Kok (2011) brittle fragmentation theory, a simple and cheap computational approach (Palacios-Peña et al., 2020a). In the present work, this scheme is coupled with the RACM-KPP (KPP: kinetics preprocessor; Stockwell et al., 1997; Geiger et al., 2003). ISORROPIA (Nenes et al., 1998) is used for the thermodynamic partitioning of aerosols.
In order to isolate the possible effects of climate change in atmospheric pollutants on pathologies, constant anthropogenic emissions for all present and future simulations are assumed. Anthropogenic emissions for the year 2000 by country and sector with a spatial resolution of 0.1∘ were obtained from the ACCMIP database (Lamarque et al., 2010). This allows possible impacts to be anticipated if mitigation strategies for regulatory pollutants are not carried out, and characterizes the climatic penalty for air quality levels. ACCMIP compiled a global emission dataset with annual official or scientific inventories at the national or regional scale for CH4, NMVOC, CO, SO2, NOx, NH3, PM10, PM2.5, black carbon and organic carbon. Climate-dependent natural emission sources include desert dust, sea salt aerosols and biogenic volatile organic compounds (VOCs). The emissions were pre-processed according to Freitas et al. (2011).
As stated in Ukhov et al. (2021), the estimation of the PM2.5 is carried out by the subroutine sum_pm_gocart in module_gocart_aerosols.F. This estimation considers dust and sea salt concentration in bins 1 (ranges 0.1–1.0 and 0.1–0.5 µm, respectively) and 2 (1.0–1.8 and 0.5–1.5 µm, respectively), black and organic carbon, and sulfate. GOCART does not include the treatment of secondary organic aerosols (SOA). The authors are aware of this limitation; however, the WRF-Chem version requires the use of the GOCART scheme if desert dust and sea salt aerosols are to be included (Palacios-Peña et al., 2020a). Nitrate aerosols are also not explicitly included in the simulations conducted here.
Last, it should be mentioned that the GOCART aerosol scheme in the WRF-Chem simulations presented here does not allow full coupling of aerosol–cloud interactions (Palacios-Peña et al., 2020b). For instance, convective wet scavenging and cloud chemistry are not available. However, the Morrison microphysics scheme (Morrison et al., 2009) acts as a double-moment scheme here. Hence, the configuration of the model used here allows double-moment microphysics with greater flexibility when representing size distributions and hence microphysical process rates (Palacios-Peña et al., 2020a). When the double-moment scheme is activated (as it is here), a prognostic droplet number concentration is estimated using gamma functions and mixing ratios of cloud ice, rain, snow, graupel and hail, cloud droplets, and water vapour (Morrison et al., 2009). Finally, the interaction of cloud and solar radiation with the Morrison microphysics scheme is implemented in WRF-Chem. Therefore, the droplet number will affect both the droplet mean radius and the cloud optical depth calculated by the model, affecting the cloud and precipitation in the model.
2.3.1 Emissions scenarios
As mentioned above, anthropogenic emissions are obtained from the ACCMIP initiative (Lamarque et al., 2010) for the year 2000. Using those emissions, a scenario where emissions from the energy sector have been mitigated in the future is defined, based on the European 2050 Roadmap (European Climate Foundation, 2010) of the European Climate Foundation (ECF). The ECF sets out three possible scenarios in their strategy for the year 2050. These scenarios differ in the percentage of renewable energy production (40 %, 60 % and 80 %) in 2050. Although complicated, the ECF indicates that the 80 % scenario considered here is achievable if the power sector is assumed to implement essentially carbon-free technologies, and hence that emission scenario (denoted REN80 from now on) has been implemented as a mitigation scenario in this contribution.
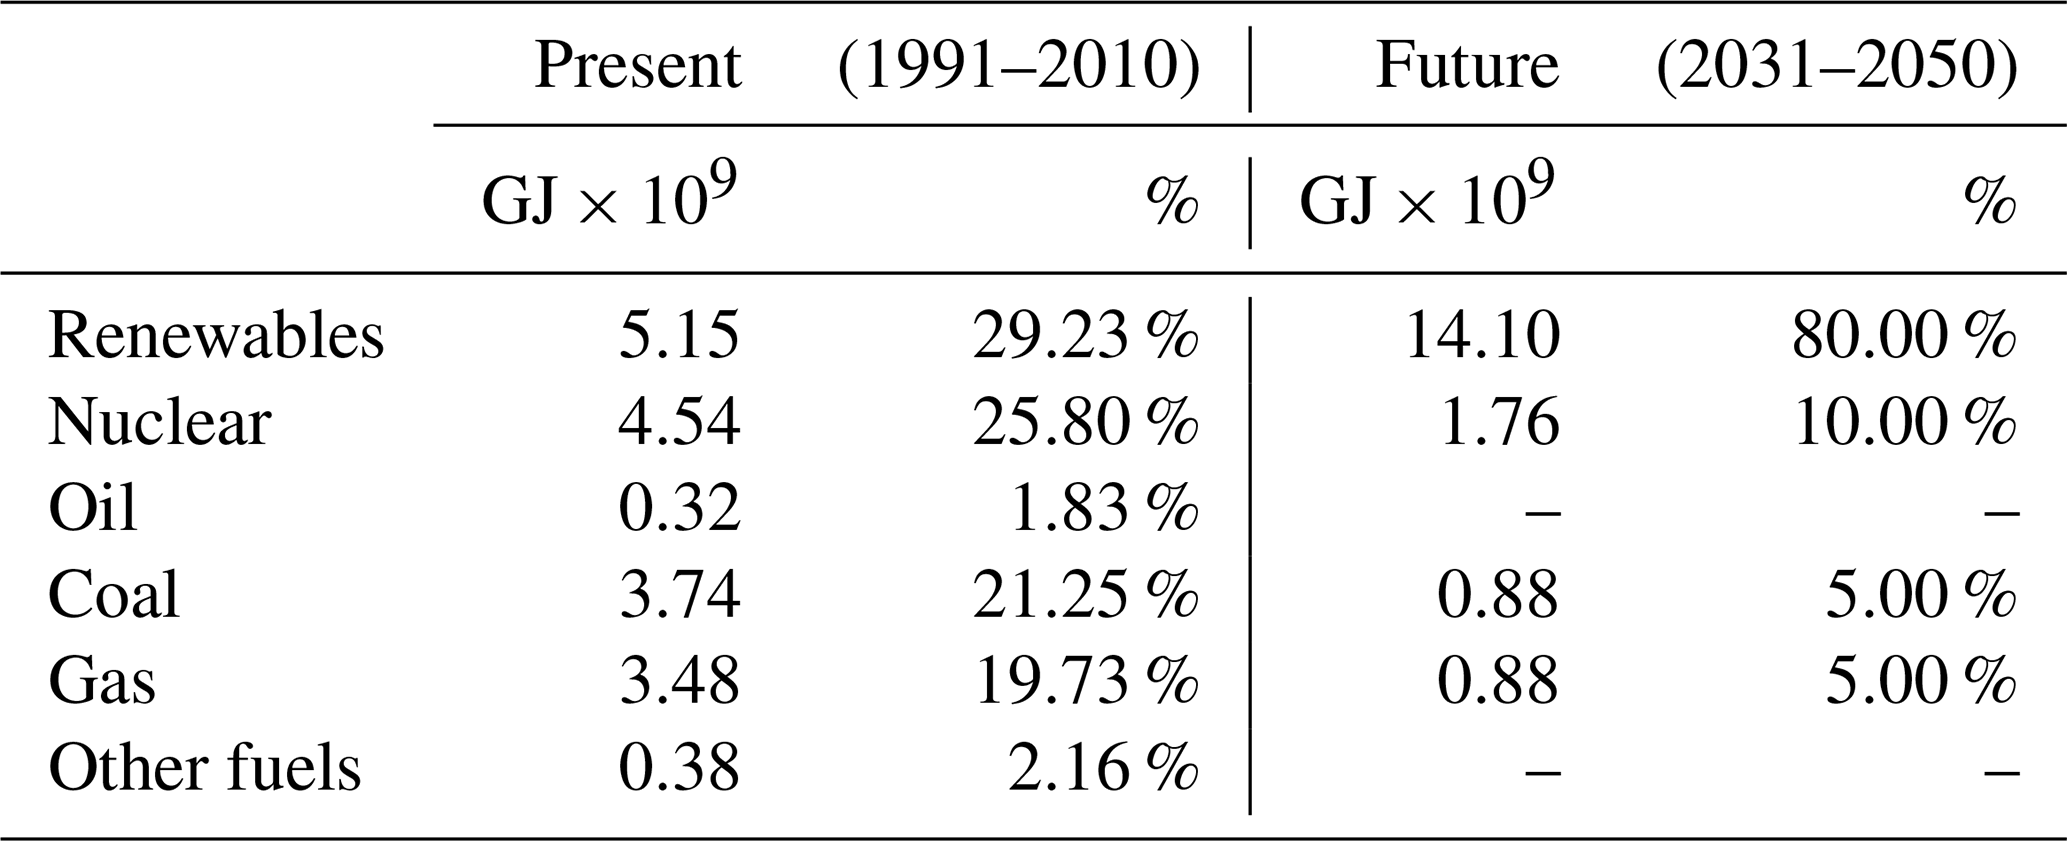
Present-day energy production has been estimated using data from the European Environment Agency (2020) with respect to gross electricity production by fuel (Table 1). For the REN80 scenario, energy production by different energy sectors such as coal, gas and nuclear is taken into account as the 20 % of the energy that originates from non-renewables. The remaining 80 % is expected to be produced from sources such as wind power (representing 30 %, i.e. almost one-third of the energy production in 2050), solar power (23 %), biomass and hydropower (12 % each), and geothermal, which provides the smallest contribution in 2050 (2 %). Figure 3 shows the energy mix by sector for the year 2050 in REN80. The present and future power production in the target domain for this scenario are presented in Table 1.
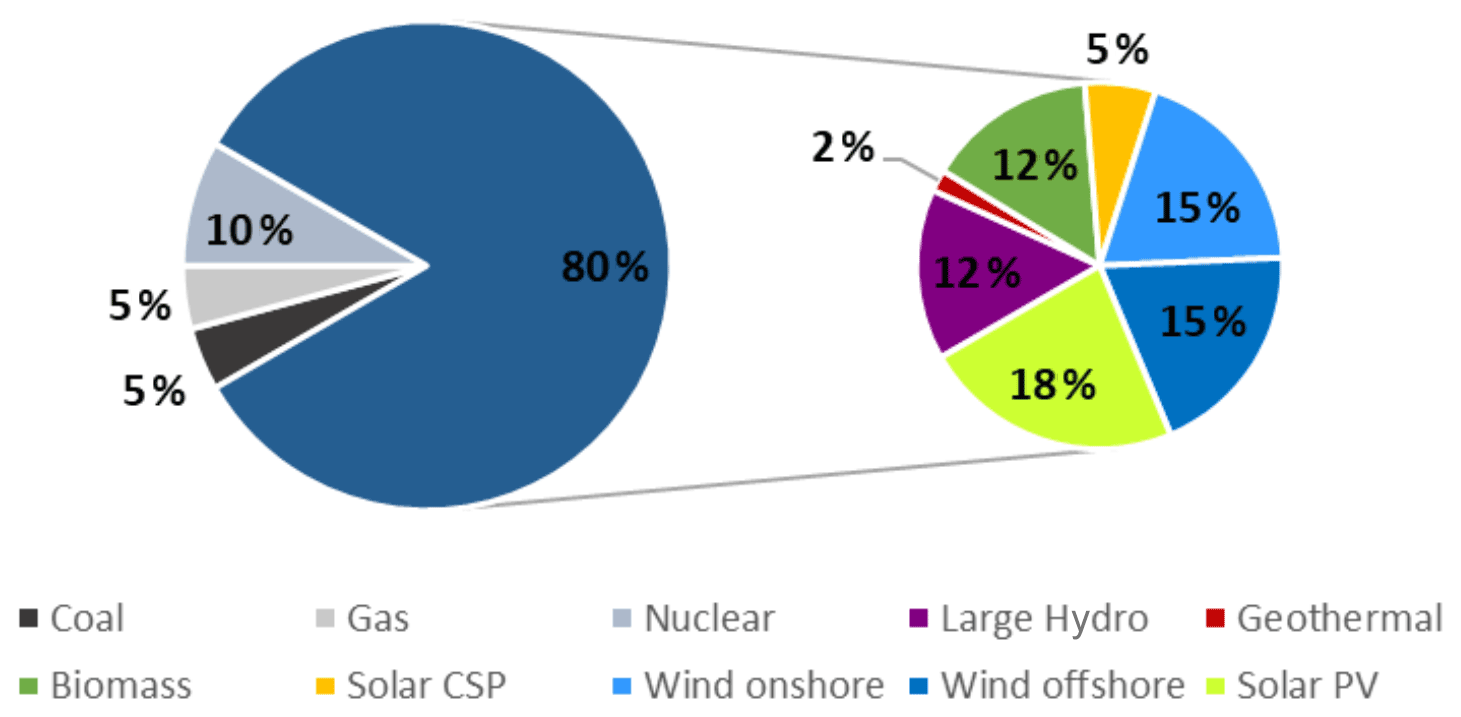
Table 1Annual energy production (in billions of GJ) over Europe from different sources and their contributions to the energy mix in the present and REN80 scenarios.
In order to estimate emissions from energy production, the emission factors were obtained from the EMEP/EEA Air Pollutant Emission Inventory Guidebook 2019 (European Environment Agency, 2019). The emission factors from coal (brown, coking, steam, sub-bituminous and hard), natural gas, gaseous fuel, residual oil and gas oil energy production were selected based on the activity data from the Tier 2 method in Sect. 1.A.1.a “Public electricity and heat production” within Chap. 1.A.1 “SNAP 01. Combustion in energy and transformation industries” in “Part B: Sectoral guidance chapters”. Figure 4 shows the emission factors for coal, oil and gas. The highest emission factors for CO, NOx and SOx are related to coal (1174 g GJ−1, 3170 and 11 640 g GJ−1, respectively), while oil is the most important contributor (per GJ of energy produced) to particulate matter PM10 and PM2.5 (923 and 798 g GJ−1, respectively) and non-methane volatile organic compounds (436 g GJ−1).

Finally, present and future emissions from the energy sector were estimated using the European Environment Agency (2019) methodology (Eq. 3) from the energy produced by each type of fuel and the corresponding emission factor:
The annual mass of pollutants emitted by the different fuels included here (coal and lignite, oil and gas) is shown in Table 2. The estimations indicate that 6 Mt of pollutant emissions are saved annually in the REN80 emission scenario compared to the baseline present emissions. Focussing on PM2.5 (the main aim of this contribution), annual emissions decrease from 0.22 to 0.05 Mtons (a reduction of around 79 % in the REN80 scenario). Primary anthropogenic PM2.5 (PPM2.5) emissions can be subdivided by species as follows: 7.5 % of the PPM2.5 corresponds to black carbon, 55.6 % to organic carbon and 36.5 % to inert PPM2.5. Further information about PM emissions in Europe can be found in Im et al. (2015).
Table 2Annual (for 2010) ACCMIP emissions of regulatory air pollutants produced by the energy sector, as used in the simulations (in Mt) of the SNAP sector representing energy production in the present scenario and projected future emissions under a mitigation scenario taking ACCMIP present emissions as the basis. The last column indicates the total emissions in the domain from all sectors.

2.3.2 Cases for the estimation of present and future premature deaths over Europe
Table 3 compiles the different cases that have been included in this contribution for the estimation of PD associated with PM2.5 in Europe. First, the PRE-P2010 case uses present-day annual mean concentrations of PM2.5 (1991–2010) and the population corresponding to the present period (2010) to estimate the PD for the baseline conditions. In order to isolate the climate penalty, the FUT-P2010 case uses the future concentrations of PM2.5 under the RCP8.5 scenario, keeping the population at 2010 levels. The FUT-P2050 case includes the UN 2050 population changes, which allows the variation in PD caused by modifications to the population pyramid over Europe to be estimated. Last, REN80-P2010 and REN80-P2050 use the modelled PM2.5 concentrations of pollutants for the future RCP8.5 scenario using REN80 emissions and the populations corresponding to the years 2010 and 2050, respectively.
Table 3Summary of cases considered for the estimation of premature deaths over Europe.
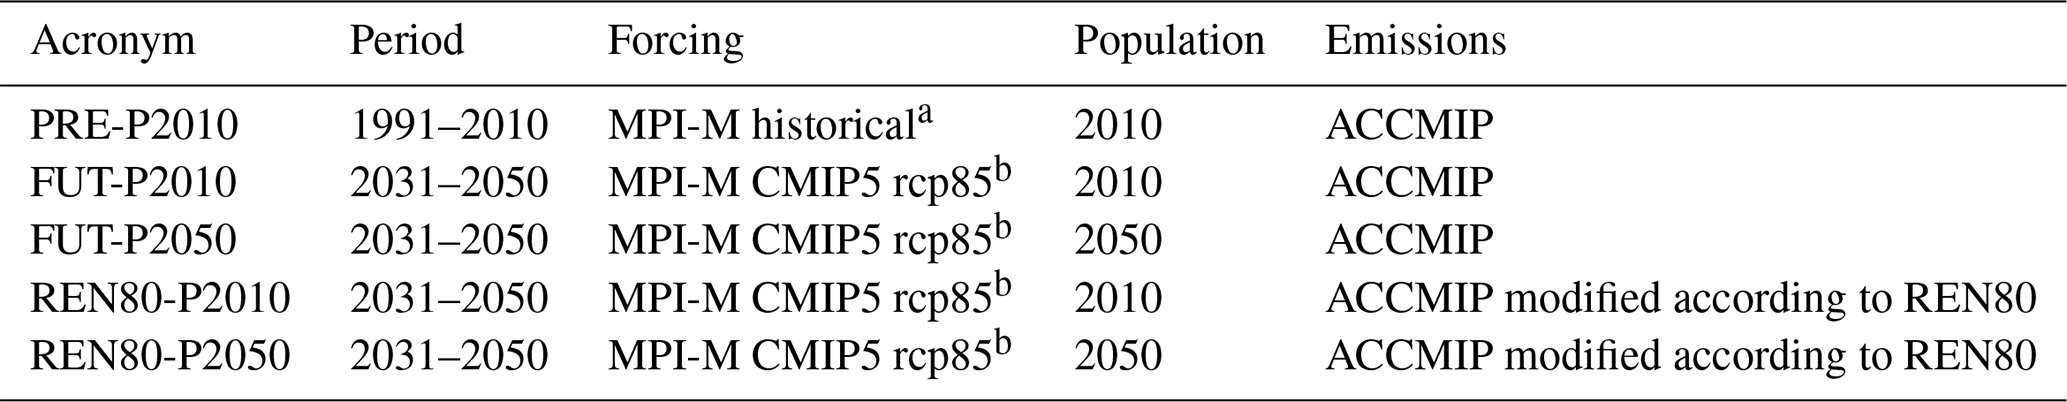
a Giorgetta et al. (2012a); a Giorgetta et al. (2012b).
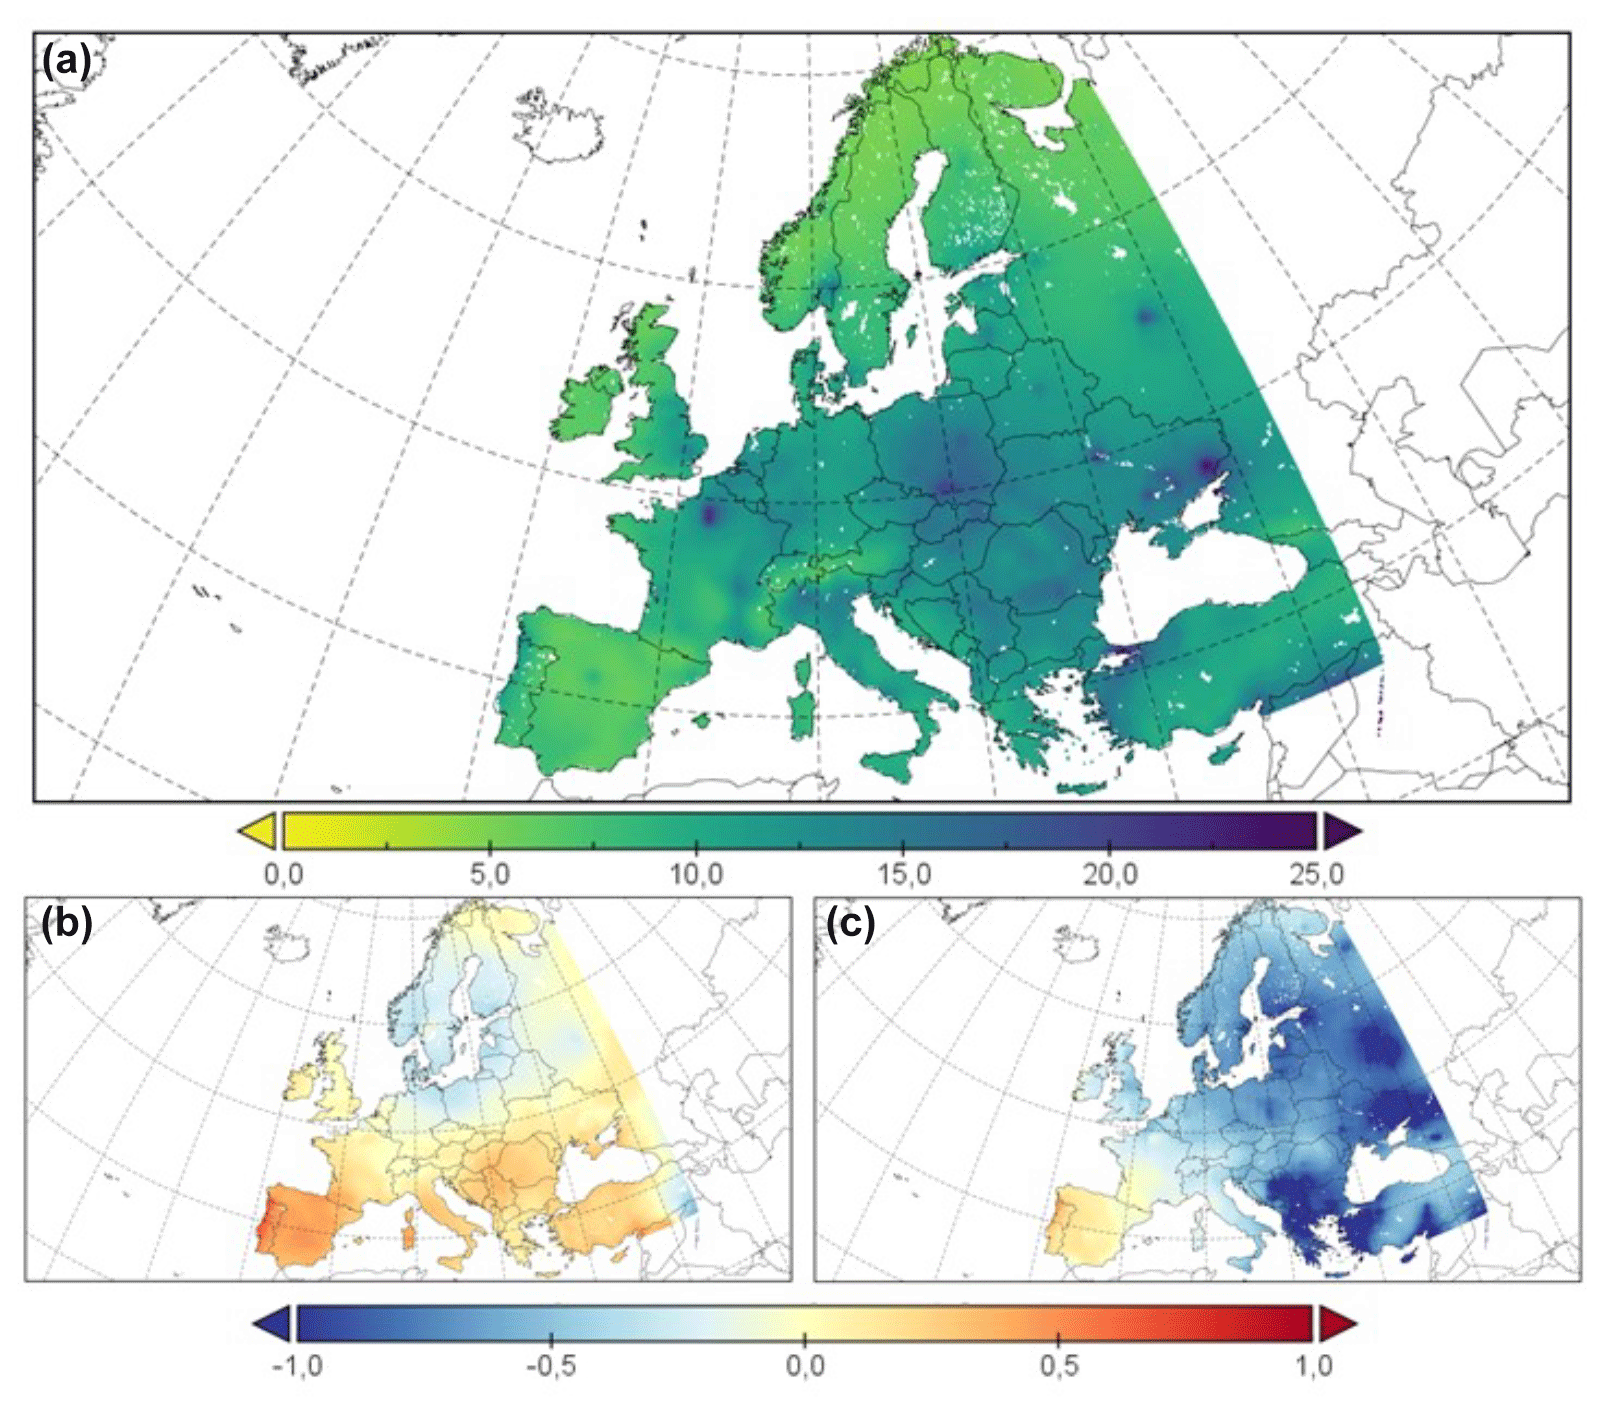
Figure 5PM2.5 concentrations over Europe: (a) in the present scenario (1991–2010); (b) difference between the future scenario (2031–2050, RCP8.5) and the present scenario; (c) difference between the future (2031–2050, RCP8.5) +80 % renewable energies scenario (REN80) and the present scenario. All values are in µg m−3.
The results presented in this section are used to try to disentangle the impacts of PM2.5 levels over Europe on the present and future premature mortality over Europe. For that purpose, a brief description of the changes in PM2.5 concentration as a consequence of the climate penalty are presented. Once these changes are established, the estimation of the present PD (the PRE-P2010 case) over three different areas of Europe (western EU, central EU and eastern EU) is discussed. Next, the effect of the climate penalty on PD is assessed for a future scenario (RCP8.5, 2031–2050) where the population is kept at 2010 levels (FUT-P2010). The results for the future case that also considers the change in the population by 2050 (FUT-P2050) are studied and compared with FUT-P2010. Finally, the effects of the future mitigation scenario are quantified. That scenario includes the use of 80 % of renewable sources to produce energy (REN80-P2010 and REN80-2050) and allows us to isolate the effect of a future mitigation strategy based on energy production from renewable sources.
3.1 Levels of PM2.5 in present and future scenarios
Figure 5 shows the PM2.5 mean annual concentration over Europe for the present period (1991–2010) and the changes projected for the future scenario (2031–2050, RCP8.5) with emissions from ACCMIP and the mitigation scenario (2031–2050, REN80). As also stated in previous works (Tarín-Carrasco et al., 2019, 2021), chemistry/climate simulations reveal the presence of some areas in Europe that exceed the annual PM2.5 limit value (25 µg m−3) established by the European Directive 2008/50/EC on ambient air quality and cleaner air for Europe. Currently, eastern Europe and some large cities and conurbations have the highest concentrations of fine particles, with some cities such as Paris (France), Krakow (Poland) and Moscow (Russia) presenting elevated levels that exceed 25 µg m−3.
The future changes in PM2.5 concentration attributable to GHG-induced climate change under the RCP8.5 scenario indicate a mean increase of 0.7 µg m−3, with higher increases over southern Europe. These results are in agreement with those of Silva et al. (2017) and Park et al. (2020), among others, who show an overall increase in surface PM2.5 concentration over most land regions. On the other hand, slight decreases are mainly projected over the Scandinavian countries and some Baltic areas (−0.2 µg m−3). The decrease in PM2.5 over this area under the mitigation scenario (REN80) can be > 0.5 µg m−3. Although air quality improves overall in Europe, areas such as Paris, Krakow and Moscow will keep exceeding the European Directive threshold.
On the other hand, the REN80 scenario indicates an overall improvement in air pollution related to PM2.5 in Europe, especially over eastern Europe. In that area, the effect of REN80 largely counteracts the climate penalty (reductions of µg m−3 with respect to present concentrations and average changes of µg m−3 with respect to the RCP8.5 scenario, reaching −2.5 µg m−3 over certain hotspots). The reason for this decrease over eastern Europe is the high ratio of fossil fuels in the energy mixes of countries in that area (European Environment Agency, 2020). Again, these results are in agreement with previous works found in the scientific literature. For instance, Liang et al. (2018) obtain a reduction of almost 0.9 µg m−3 for a future scenario with a reduction of 20 % in anthropogenic emissions from power and industrial sources.
It is also noticeable that northern Europe will benefit from both the climate penalty and the mitigation scenarios. This benefit cannot be observed over southern Europe, where the benefits of mitigation strategies might not compensate for the effect of climate change on PM2.5 levels (fine particles will increase in concentration in southern Europe as a consequence of decreasing precipitations and increased emissions from natural sources in this target area) (Jiménez-Guerrero et al., 2013b) (Fig. 5).
3.2 Estimation of premature deaths over Europe in the present period (PRE-P2010)
Figure 6 depicts the annual excess PD associated with the present PM2.5 pollution (PRE-P2010). For the present period (1991–2010), 895 000 (95 % CI 725 000–1 056 000) annual PD are estimated over the European area. This estimation is in agreement with – although slightly higher than – that of Burnett et al. (2018) (647 000 PD) and exceeds that of Andersson et al. (2009) (546 000), who only include the contribution from primary PM2.5 and secondary inorganic aerosols. Crippa et al. (2019) report 260 000 PD associated with PM2.5; the difference from the number of annual PD estimated in the present work is primarily due to the domain covered in the simulations presented here. The target domain in the present contribution includes the most populated areas of Russia and Turkey, which are not included in the numbers reported for Europe in the aforementioned study.
In this contribution, the highest incidence of excess PD is estimated for eastern Europe (467 000 annual PD, 95 % CI 378 200–551 100) (Table 4), while the highest incidence of normalized PD per 100 000 adult inhabitants is found over central Europe (229.4 PD/100 000 inhabitants per year). The latter result is in good qualitative agreement with the estimation of Silva et al. (2016a), who identify the Benelux region as the European region with the highest excess mortality rates associated with air pollution.
.
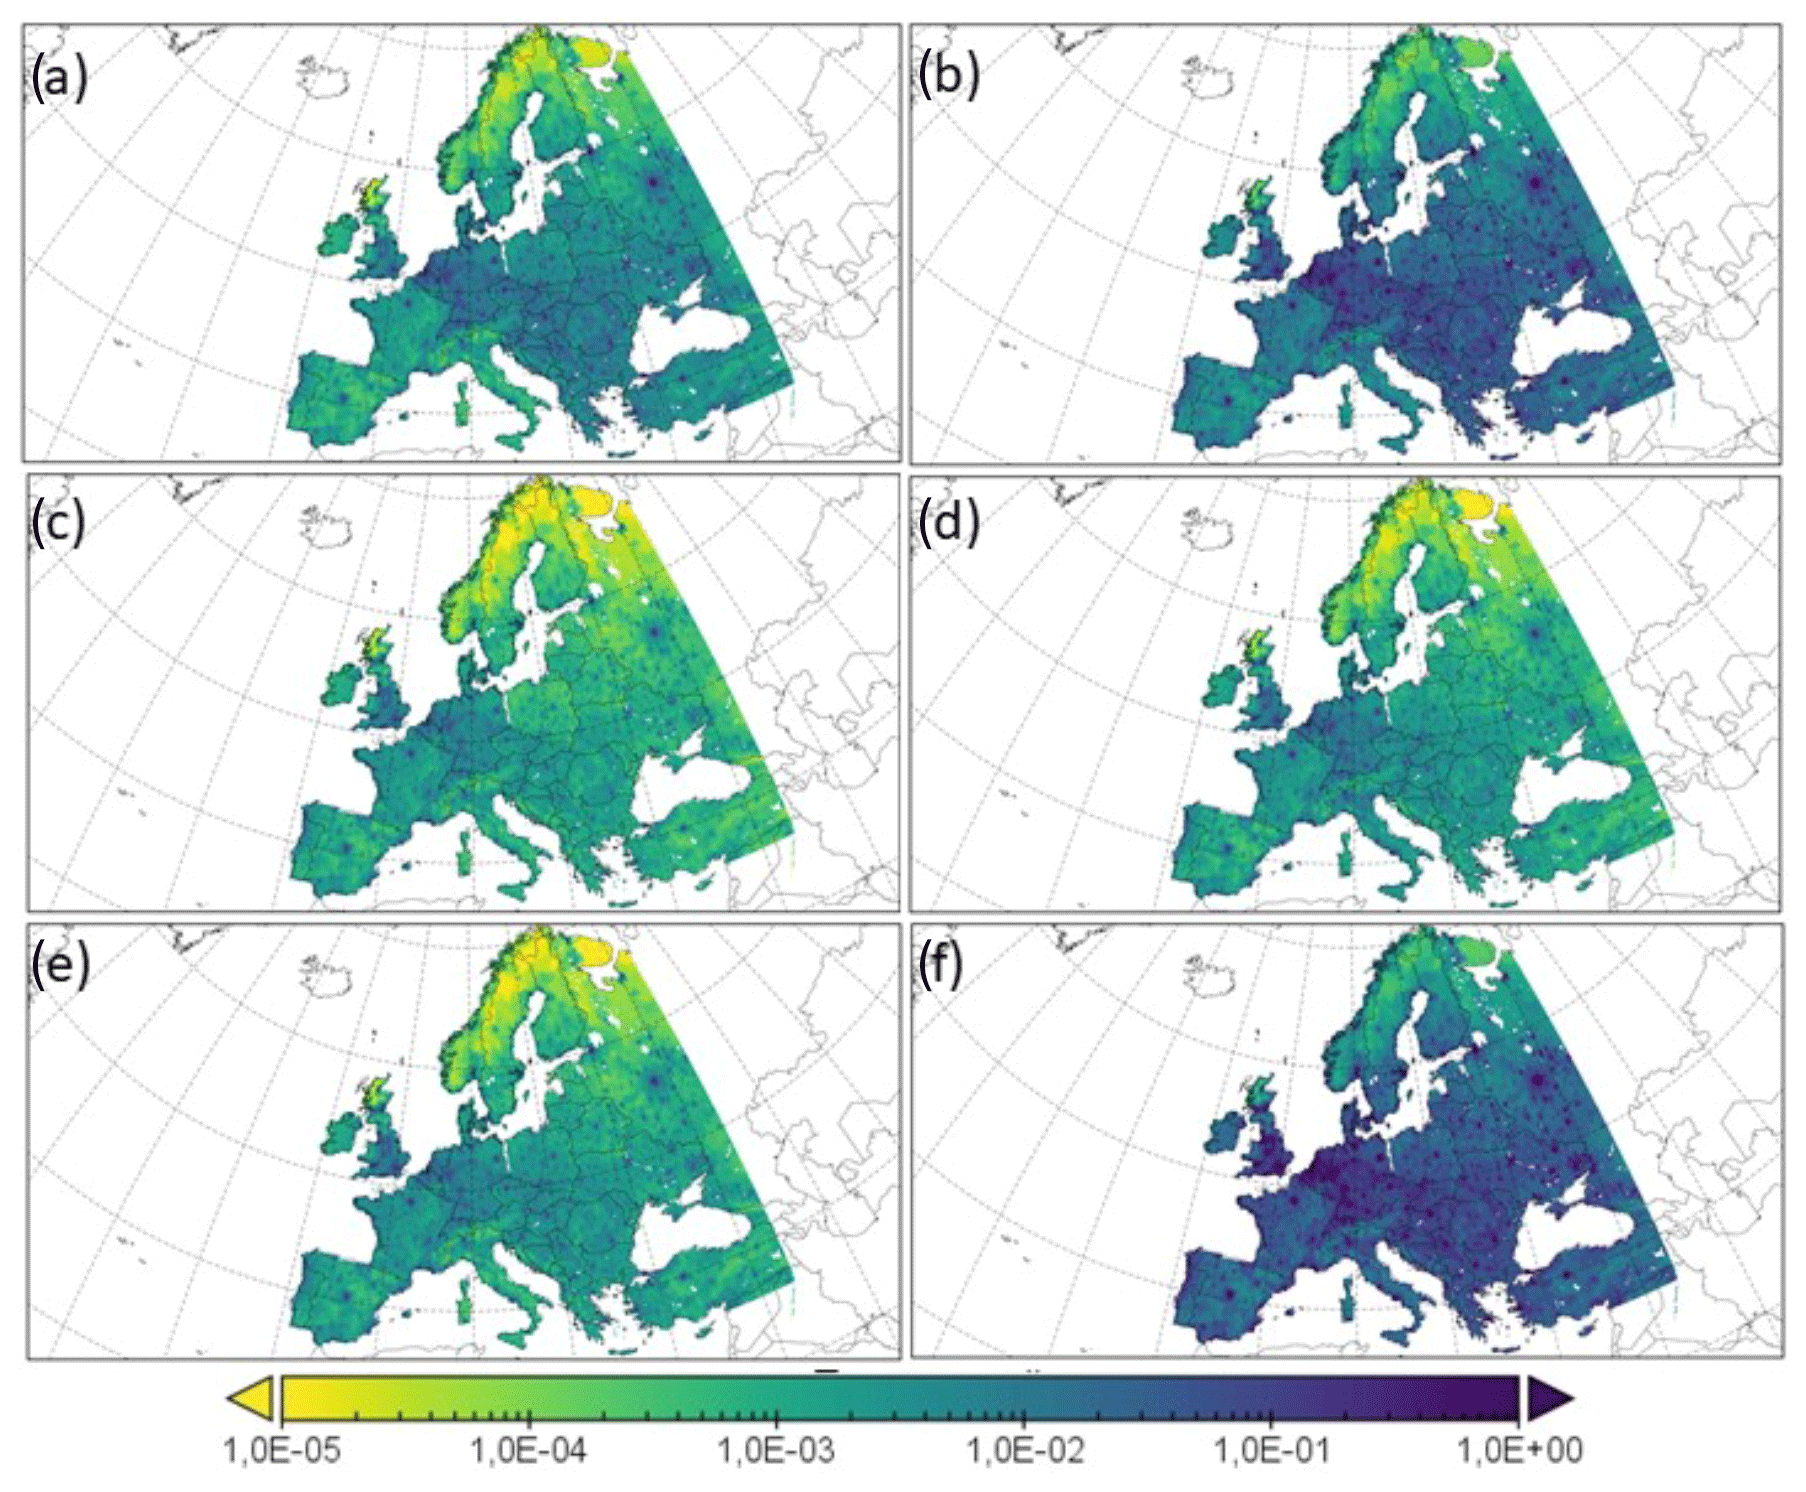
Figure 6Estimation of PD over Europe for the PRE-P2010 case with different endpoints: (a) CEV, (b) IHD, (c) COPD, (d) LC, (e) LRI and (f) all. All values are in PD km−2 per year.
Table 4Estimated incidence of excess premature deaths (PD, in thousands) and PD per 100 000 inhabitants (h.) for each European region in all scenarios covered. Numbers in parentheses represent the 95 % confidence interval.
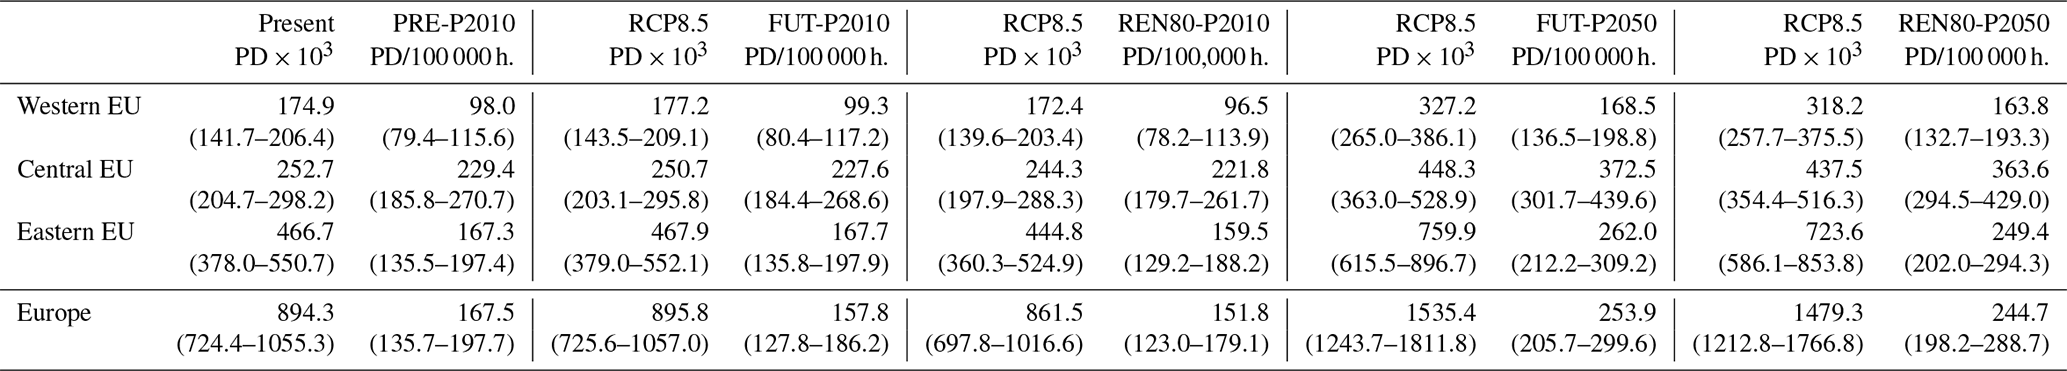
PRE-P2010: PD for the present case; FUT-P2010: PD for the future scenario with the population at 2010 levels; (REN80-P2010): PD for the future mitigation scenario with the population at 2010 levels; FUT-P2050: PD for the future scenario with the UN's population projections for 2050; REN80-P2010: PD for the future mitigation scenario with the population at 2010 levels; REN80-P2050: PD for the future mitigation scenario with the UN's population projections for 2050.
When considering individual endpoints (Fig. 7), the main cause of the excess PD associated with PM2.5 in the European domain is cardiovascular diseases (IHD + CEV), especially over eastern Europe. Moreover, CEV and IHD are the causes of PD that show the largest differences between target areas. The PD incidence over eastern Europe is caused mainly by IHD + CEV: together, they contribute >60 % of the premature mortality burden in Europe (Fig. 7). This is because of (1) the higher population (51 % of the total European population contemplated in this contribution) of eastern Europe in comparison with central Europe (19 % of the European population) and western Europe (30 % of European inhabitants) and (2) the higher PM2.5 concentrations in eastern Europe (as previously shown in Fig. 5). Similar results are seen for the total PD by all causes: the PD are proportional (with respect to their percentage) to the population held in the respective areas. In this sense, eastern Europe contributes more than 50 % of the mortality in Europe, while central and western Europe add around 20 % and 30 % of the PD, which are proportional to their populations.
.
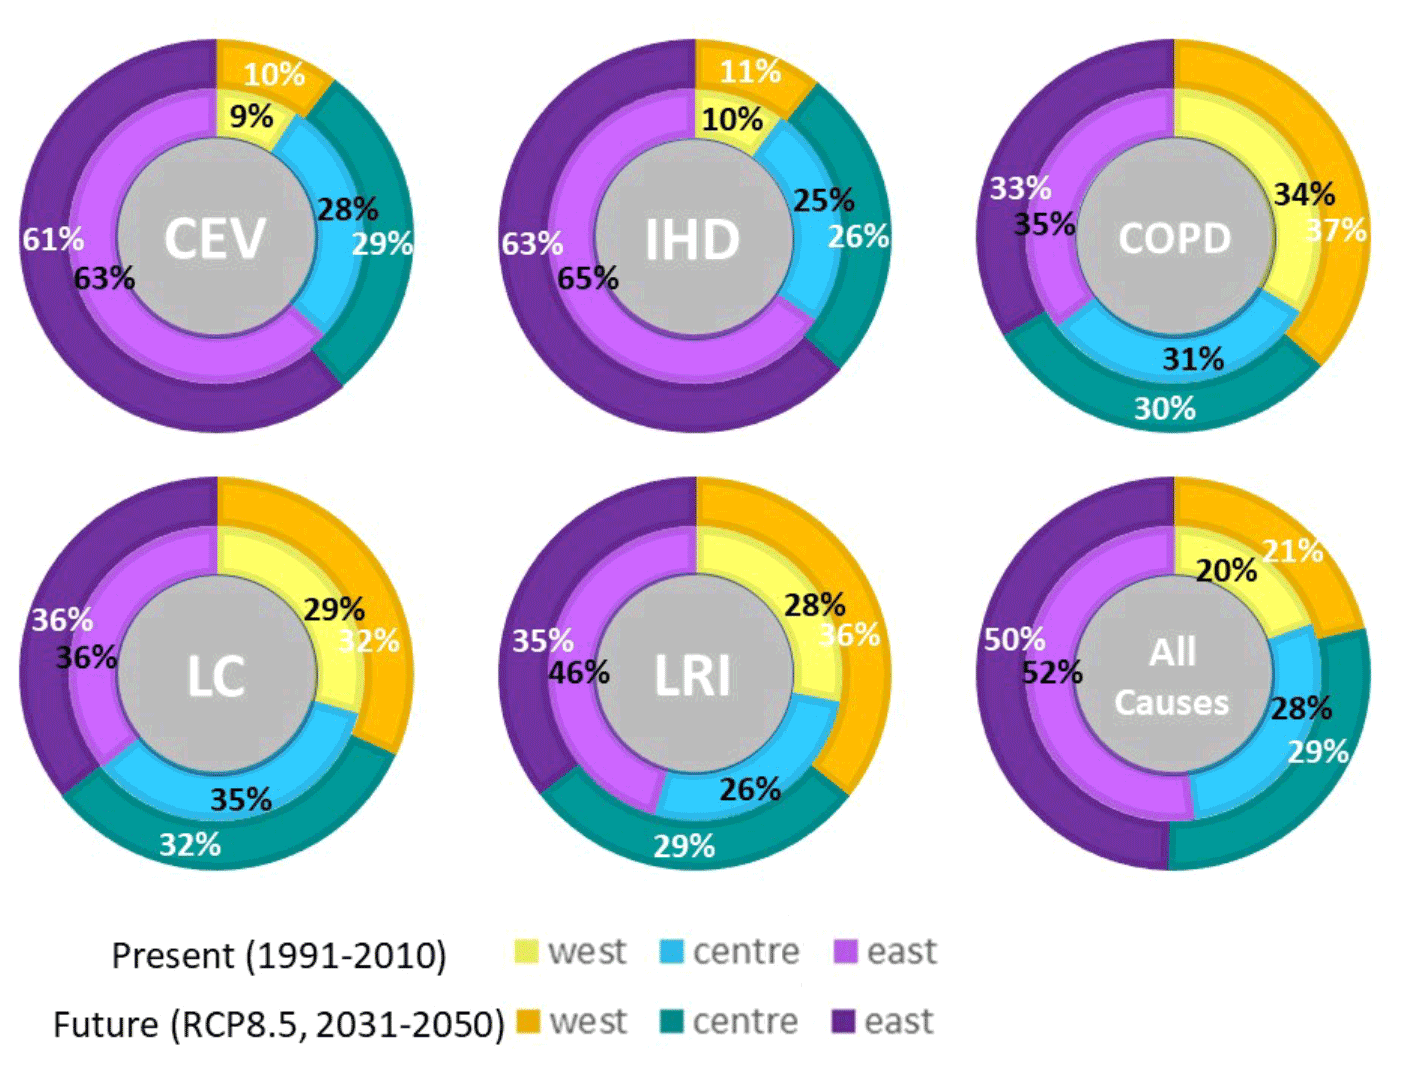
Figure 7Relative contribution of each cause of PD by European region for PRE-P2010 and FUT-P2050.
It is noticeable that for COPD, LRI and LC, the three studied regions contribute similar percentages of the total PD over Europe (around 30 %), which is indicative that the COPD, LRI and LC ratios are much higher over western Europe (30 % of the European population) and central Europe (19 % of the total European population) than over eastern Europe (51 % of the population).
3.3 Isolating the climate penalty effect on premature deaths over Europe (FUT-P2010)
In this section, the role of the climate penalty is assessed by comparing two simulations differing only in the radiative forcing (1991–2010 vs. RCP8.5 2031–2050; i.e. the two model runs FUT-P2010 and PRE-2010). For this, the population was kept constant at 2010 levels. The results presented in Table 5 indicate that the climate penalty has a very limited impact on air-pollution-related future premature deaths over Europe. When comparing the total incidence of PD in the PRE-P2010 and FUT-P2010 cases, only a +0.2 % increase is projected in the future scenario. However, this increase is uneven across the different regions of Europe. While the total PD per 100 000 adults (Table 4) increases by nearly 2 % in western Europe and by 0.2 % in eastern Europe, the mortality decreases by −0.8 % over central Europe. When considering a future RCP8.5 scenario, these variations in the distribution of PM2.5 in Europe are mainly due to changes in precipitation (Fig. 8).
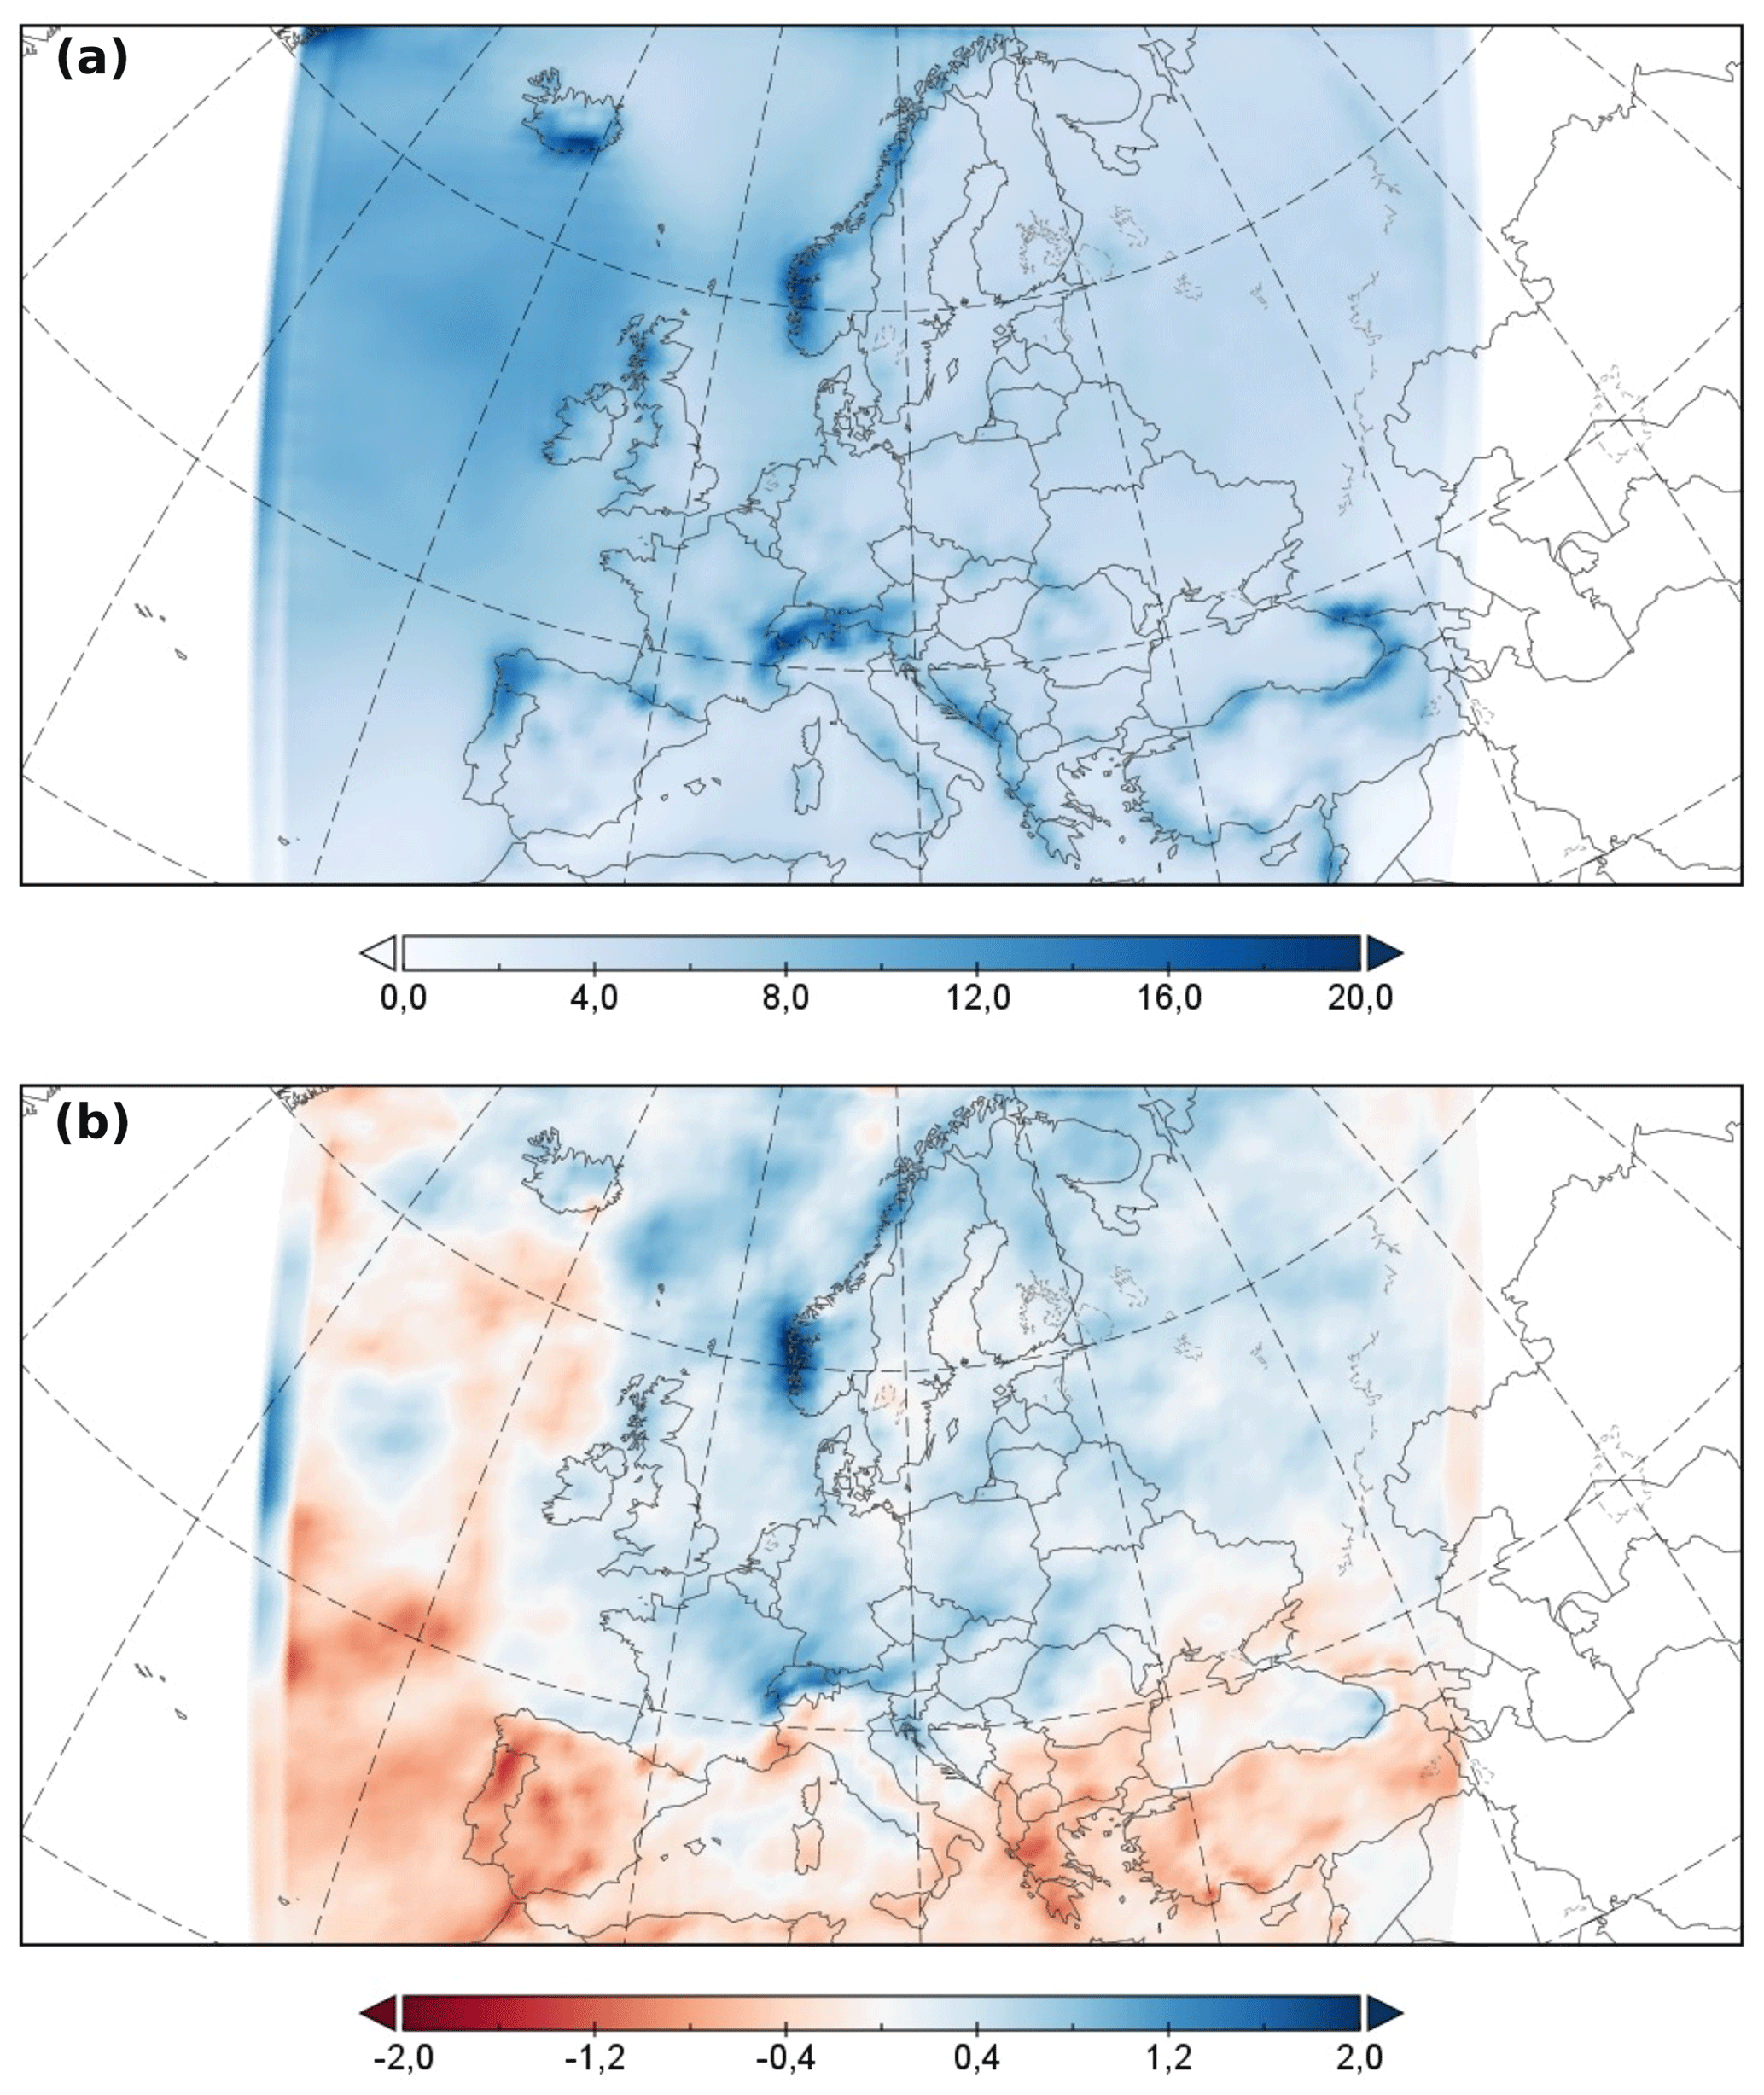
Figure 8(a) Precipitation (mm d−1) for the present (1991–2010) period. (b) Difference (mm d−1) between the future (RCP8.5, 2031–2050) and the present (1991–2010) precipitation.
The decrease in rainfall in southern Europe (e.g. Jiménez-Guerrero et al., 2012; Domínguez-Morueco et al., 2019) and the projected increase in rainfall in northern and central Europe for this scenario (e.g. Jiménez-Guerrero et al., 2013b; Jacob et al., 2018) affect the wet scavenging of particles (neglecting the influence of modified photochemistry on the levels of particles). In this context, wet scavenging is the fundamental process for removing particles from the atmosphere (e.g. Ohata et al., 2016; de Bruine et al., 2018; Hou et al., 2018).
Table 5Estimated annual premature deaths (PD × 103) associated with fine particles in the total population for all scenarios covered (in thousands).
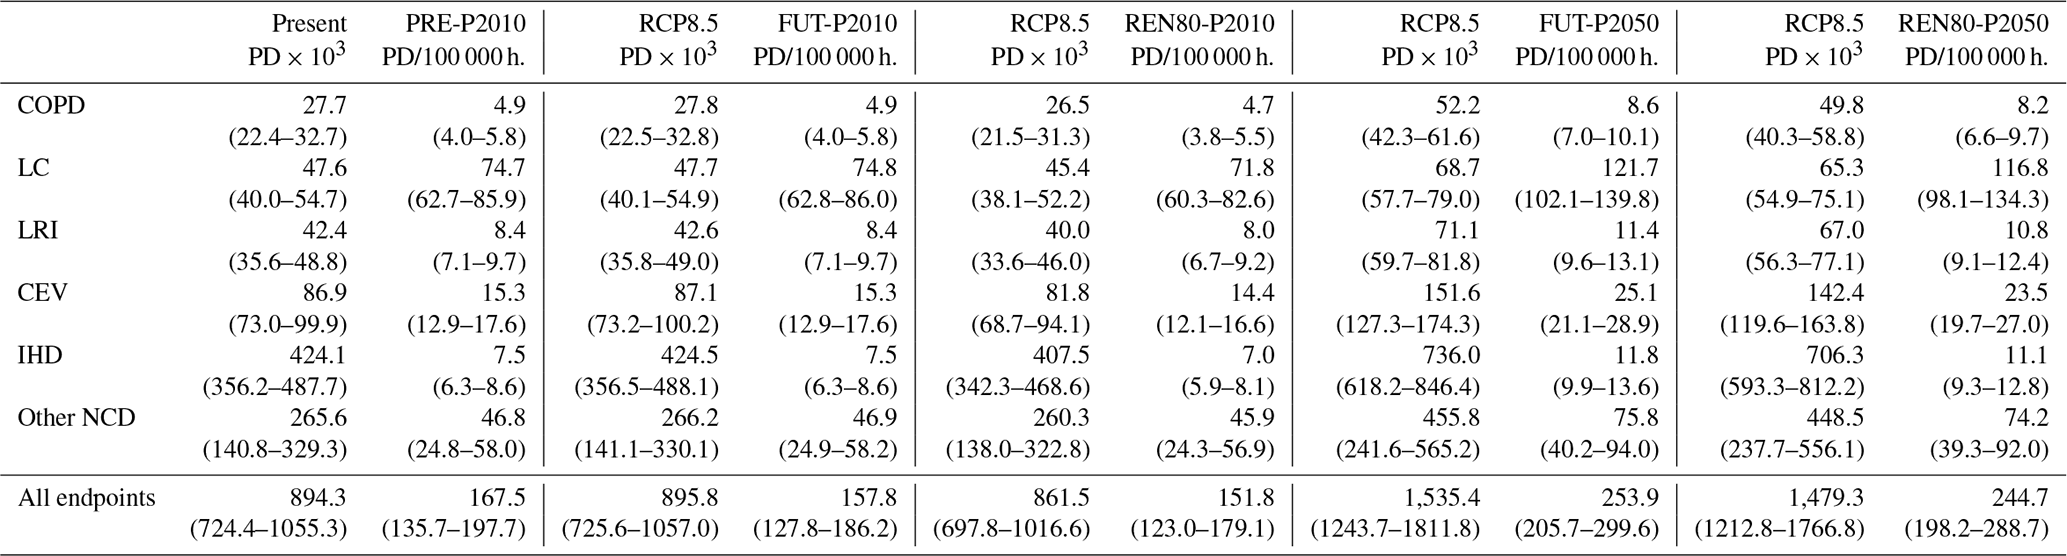
PRE-P2010: PD for the present case; FUT-P2010: PD for the future scenario with the population at 2010 levels; REN80-P2010: PD for the future mitigation scenario with the population at 2010 levels; FUT-P2050: PD for the future scenario with the UN's population projections for 2050; REN80-P2010: PD for the future mitigation scenario with the population at 2010 levels; REN80-P2050: PD for the future mitigation scenario with the UN's population projections for 2050.
It should be highlighted that the cause of premature mortality that is most sensitive to changes in PM2.5 is CEV + IHD (Fig. 9), as also found by previous studies (Pope et al., 2009, 2020). The spatial patterns of change in the latter endpoint condition the patterns of total variation in PD by all causes. IHD mortality rates increase by nearly 3 % from 424 000 (95 % CI 356 100–487 600) to 425 000 (95 % CI 357 000–488 800) in the FUT-P2010 case. On the other hand, COPD, LC, and other NCD barely change, since these causes are not as sensitive to the PM2.5 concentration as IHD and LRI are at low PM2.5 concentrations (Fig. 10), as also discussed in Tarín-Carrasco et al. (2021).
.

Figure 9Differences in PD over Europe in the FUT-PRE2010 and the PRE-P2010 cases for different endpoints: (a) CEV, (b) IHD, (c) COPD, (d) LC, (e) LRI and (f) all endpoints. All values are in PD km−2.
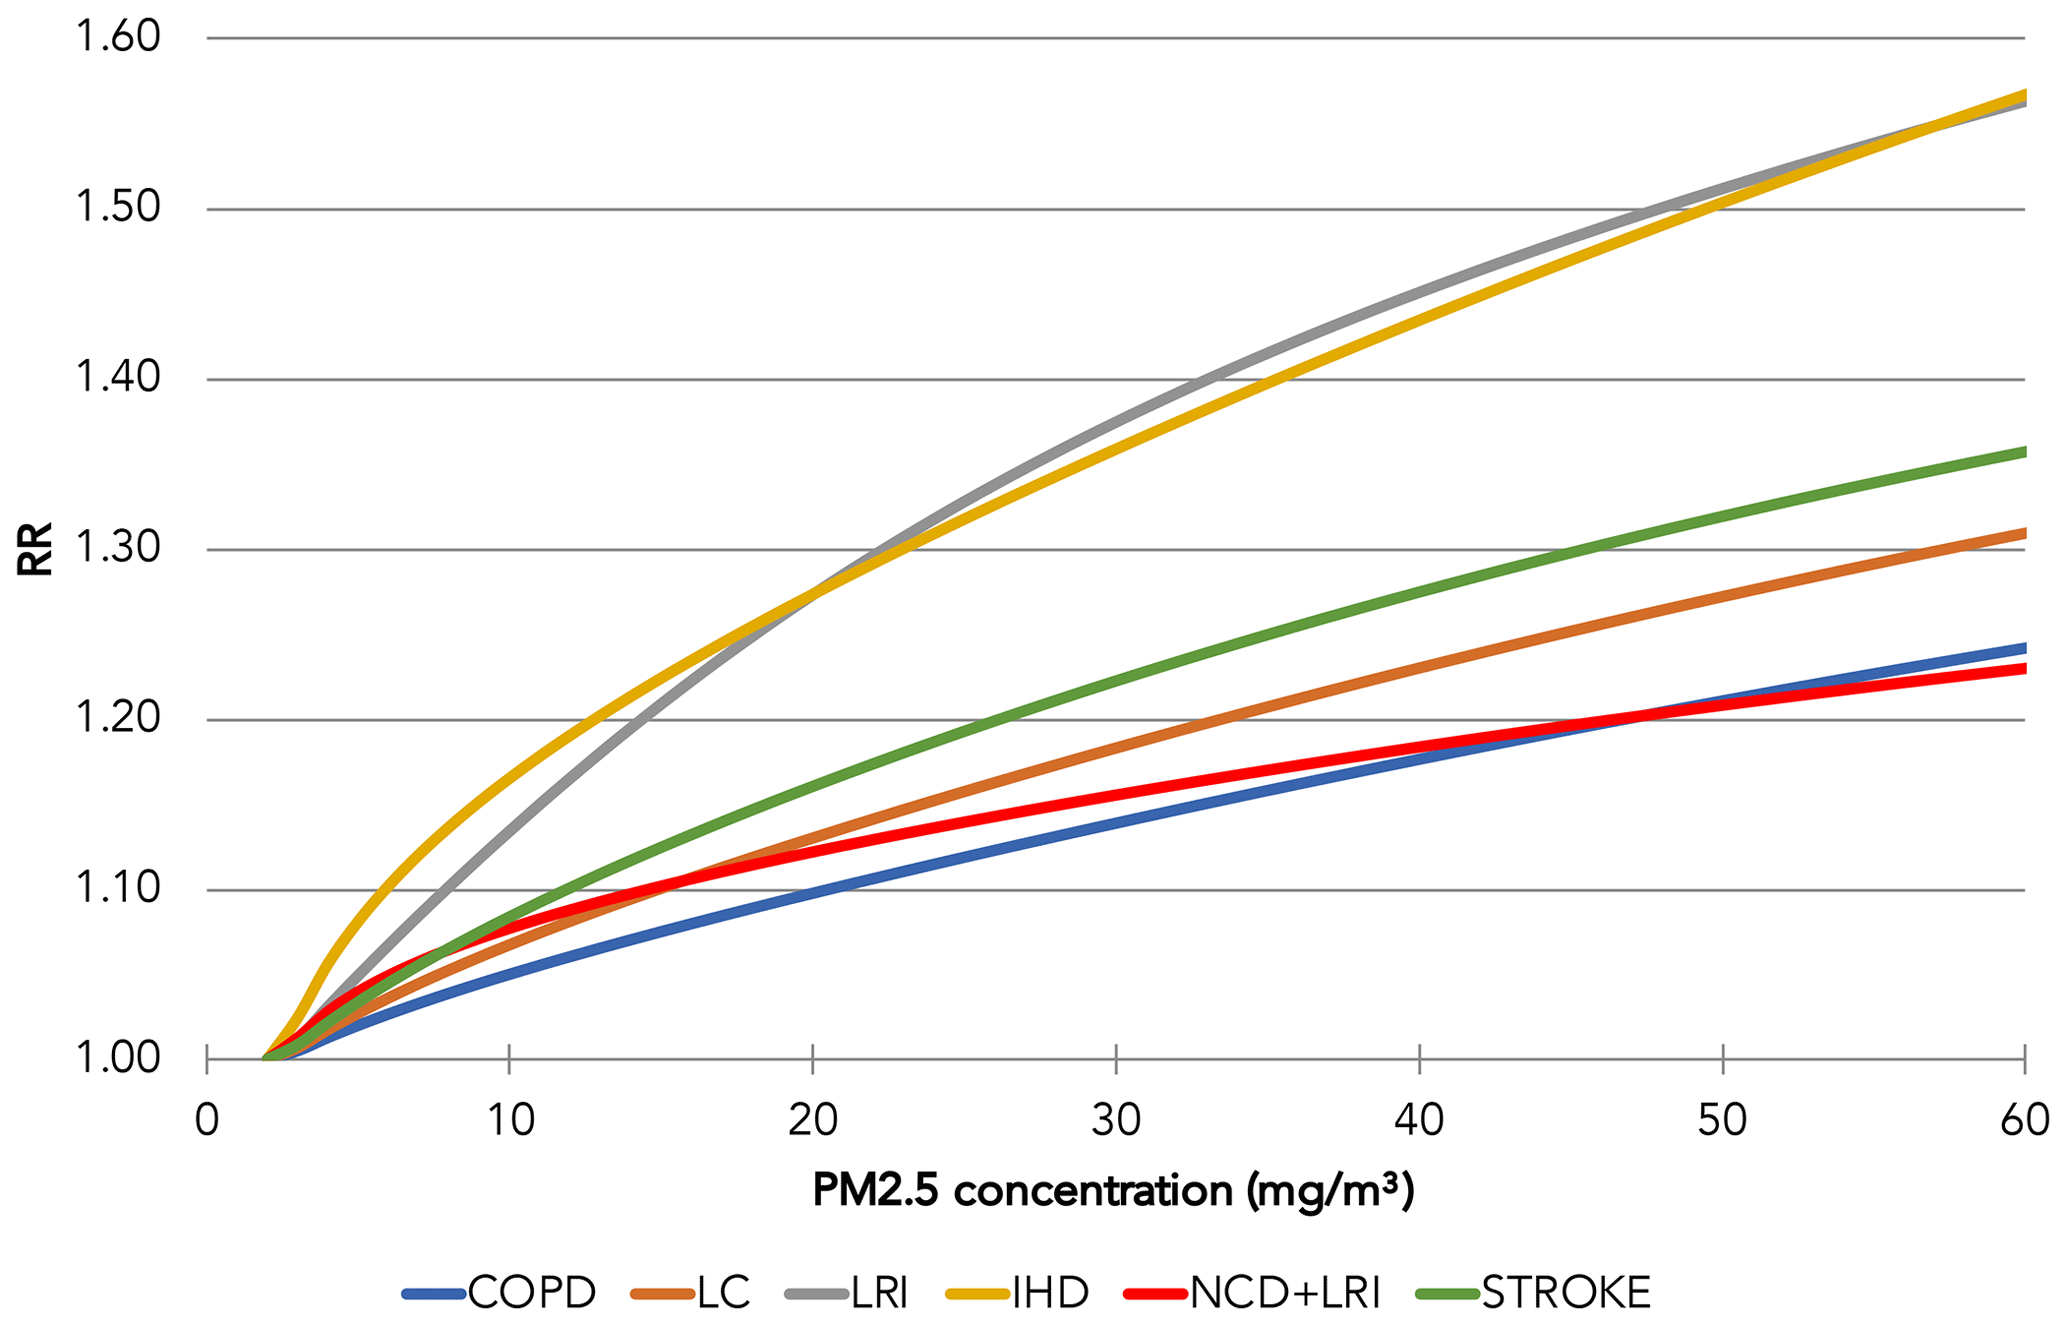
Figure 10Shapes of the risk ratio functions for the target endpoints as functions of the PM2.5 concentration (µg m−3).
3.4 Estimation of future premature deaths over Europe with a projected population (FUT-P2050)
The previous section analysed the contribution of climate change alone (RCP8.5 scenario with the population kept constant) to the PD over Europe. Here, the impact of projected changes in the population according to UN2050 data is added to the climate penalty. This scenario is denoted FUT-P2050. As shown in Fig. 11, the highest mortality incidence in FUT-P2050 is related to IHD, which has an widely spread spatial pattern in the target domain. For FUT-P2050, the projected PD incidence increases to 1 540 000 (95 % CI 1 247 000–1 818 000), with eastern Europe being the most affected region, contributing almost half of the excess mortality rate over Europe (Table 4).
The premature mortality burden associated with exposure to ambient PM2.5 in Europe is expected to increase by 72 % by the year 2050 in FUT-P2050 when compared with the PRE-P2010 simulation: from 894 000 (95 % CI 723 900–1 055 400) PD per year in 1990–2010 to 1 540 000 (95 % CI 1 247 000–1 818 000) PD per year in 2031–2050 (Table 5). The leading cause of PM2.5-related mortality is IHD in both the present and future cases: 424 000 (95 % CI 356 200–487 800) PD per year at present, which increases by 74 % to 736 000 (95 % CI 618 200–846 400) PD per year in the FUT-P2050 case. IHD is followed by other NCD; this leads to 265 600 (95 % CI 140 800–329 300) PD per year in the PRE-P2010 case, which increases by 73 %, to 458 400 (95 % CI 243 000–568 400) PD per year in the FUT-P2050 case.
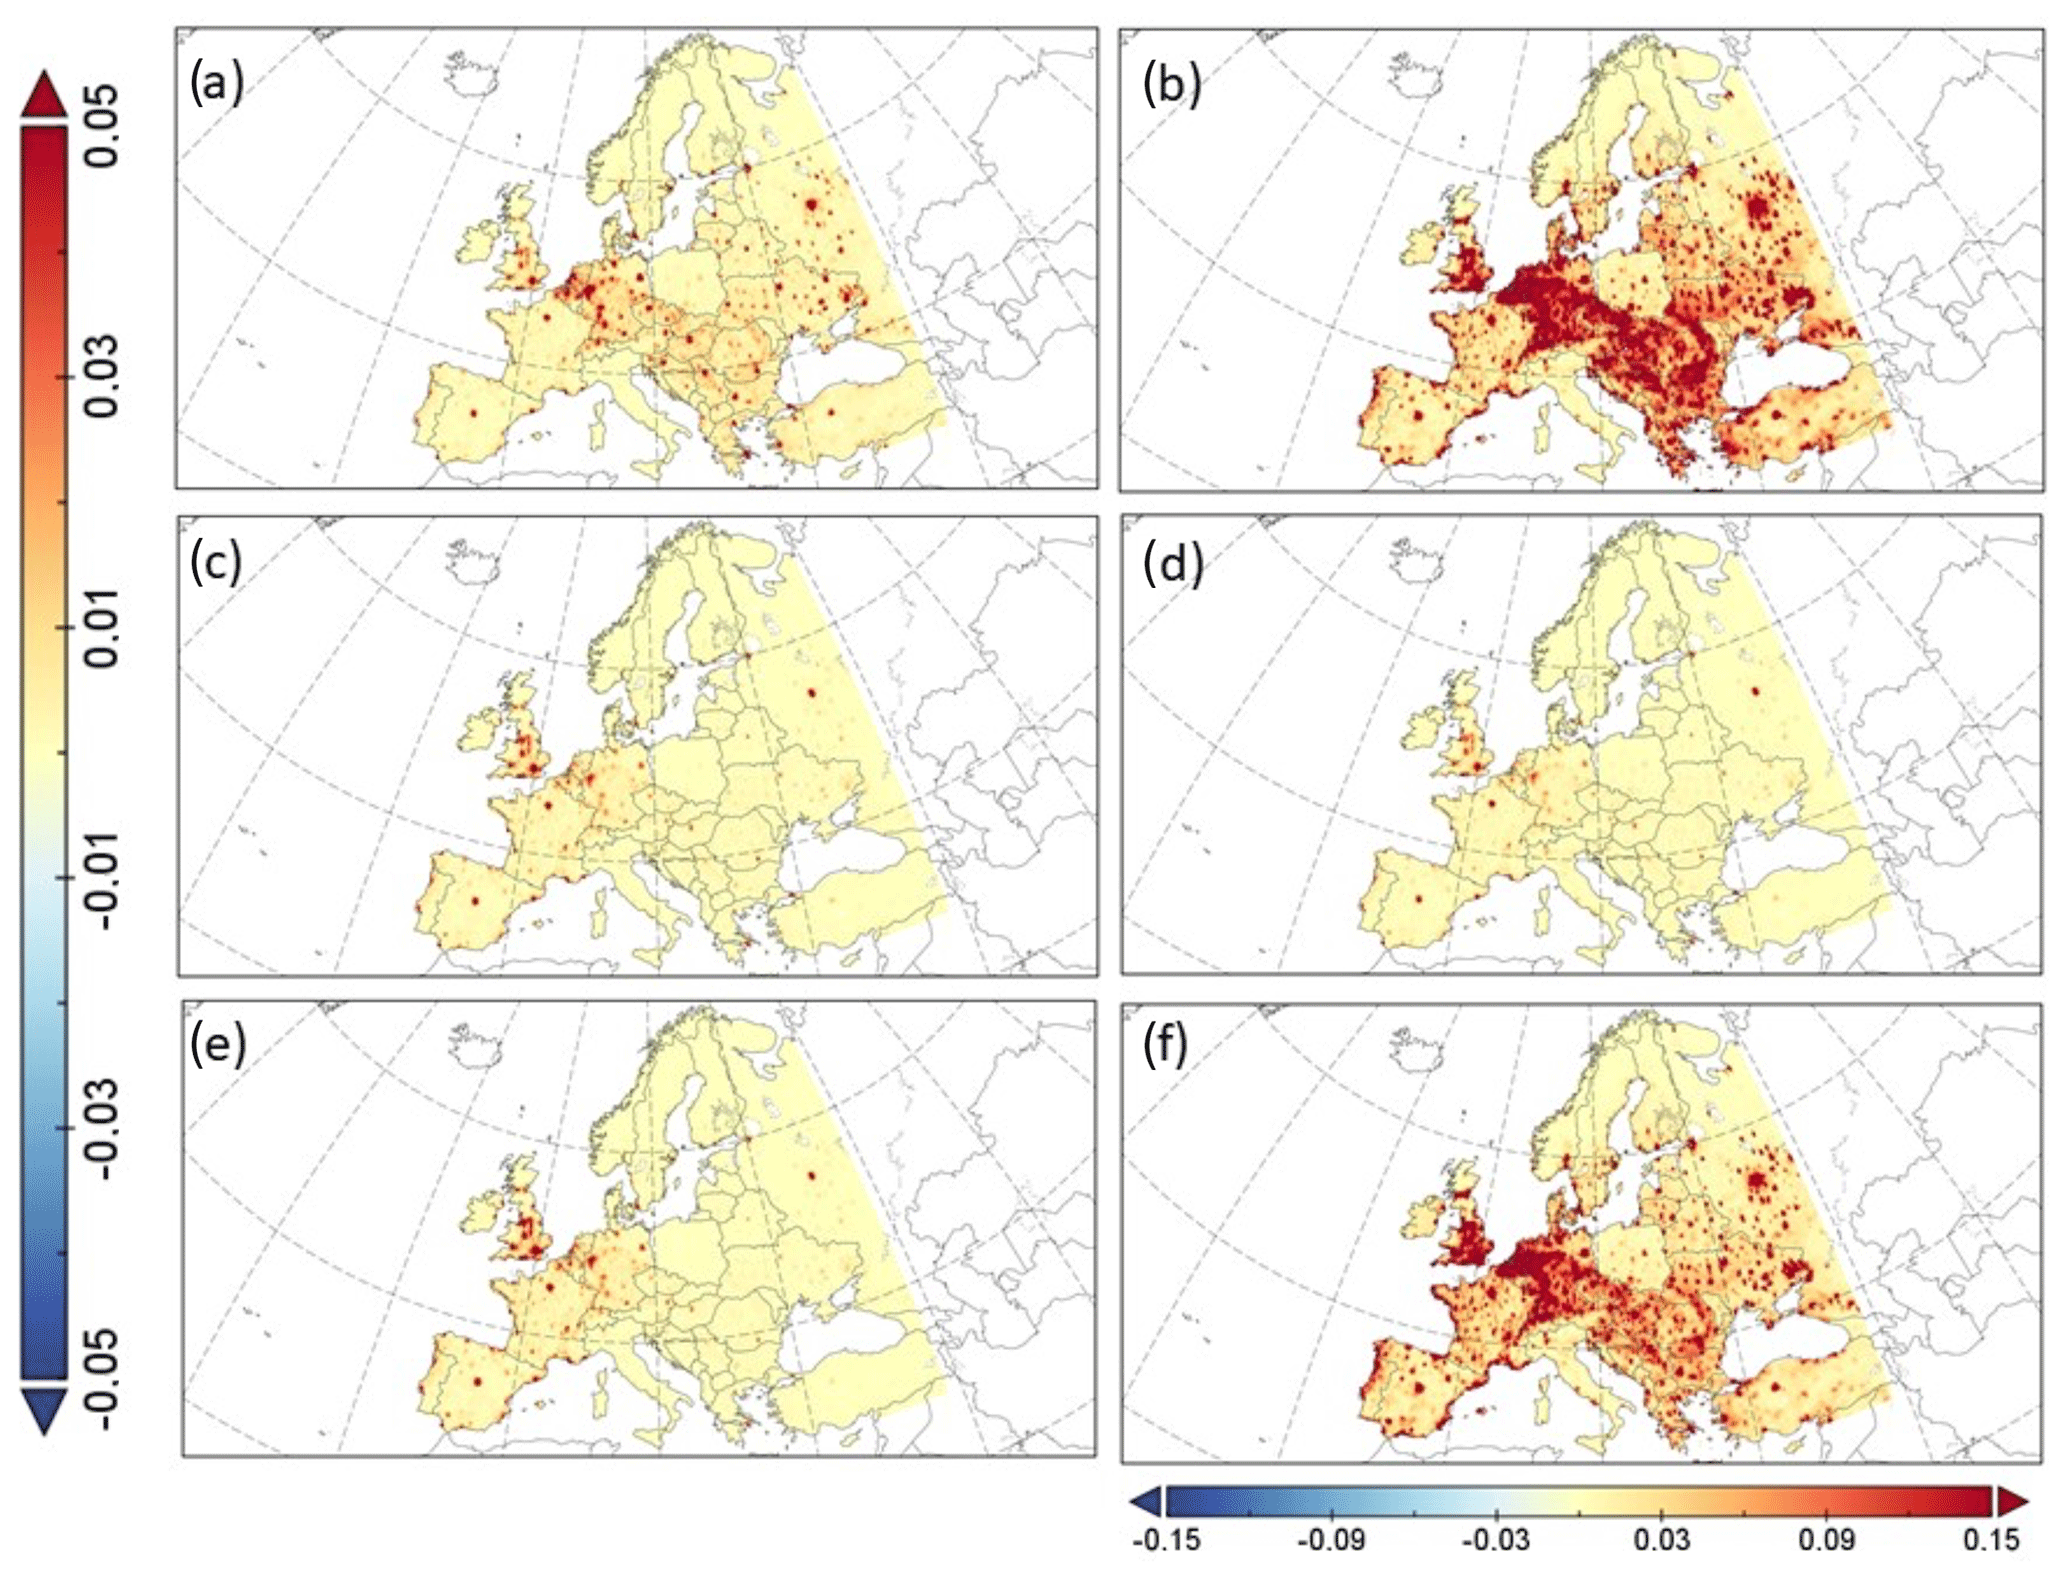
Figure 11Differences in future premature mortality for the future scenario considering the population dynamics for 2050 (FUT-P2050). Endpoints considered are (a) CEV, (b) IHD, (c) COPD, (d) LC, (e) LRI and (f) all endpoints. All values are in PD km−2.
When assessing the relative contribution of each endpoint to the total PD burden in both PRE-P2010 and FUT-P2050, Fig. 7 indicates that future climate change and the change in the population by the year 2050 will barely change the relative percentage of each mortality cause by region, so the discussion is analogous to that presented in Sect. 3.2. The only exception is for LRI, which experiences several important changes from PRE-P2010 to FUT-P2050 (increasing from a 28 % contribution in western Europe for the present case to 36 % over the same area in the FUT-P2050 case, and from 35 % in PRE-P2010 over eastern Europe to 46 % in FUT-P2050 over the same domain).
3.5 Effect of the future mitigation scenario (REN80-P2010 and REN80-P2050)
This case takes into account the effect of climate change (RCP8.5, 2031–2050) together with the emissions scenario where it is assumed that 80 % of the energy production over Europe is provided by renewable sources (REN80). For the analysis of this impact, a scenario where the population remains constant at 2010 levels (REN80-P2010) and a second scenario where the population dynamics are taken into account (REN80-P2050) are analysed below.
Figure 12 shows that in REN80-P2010, the PD incidence will be lower than in the REN80-P2050 scenario that considers changes in the population, as previously discussed for FUT-P2010 and FUT-P2050. Large central European cities are the areas in which the PD incidence will increase most with a changing population (increases in the density and age of the population, as previously shown in Fig. 1). A summary of the excess mortality incidence in all scenarios is presented in Table 4.
The incidence of all mortality causes studied decreases by 4 % in the future mitigation scenarios REN80-P2010 and REN80-P2050 when compared to the corresponding FUT-P2010 and FUT-P2050 simulations, respectively. This decrease is especially apparent in the central and eastern regions regarding the total PD (Table 4). This is explained by the fact that an important part of the anthropogenic emissions of PM2.5 over Europe is associated with power generation (Crippa et al., 2019). To be precise, this contribution is 15.1 % here. Table 5 indicates that CEV and IHD contribute the largest relative reductions to the reduction in the incidence ratio of PD in the REN80-P2050 scenario with respect to FUT-P2050 (−6 % changes in annual PD), while COPD and LRI show −5 % changes (Fig. 13)) and the change in LC is −4 % for the renewable scenario. Other NCD decreases by −2 % in the REN80 simulations. Other NCD and CEV are the endpoints that experience the largest improvements in the mitigation scenario, with decreases in the annual excess PD of 30 000 (95 % CI 15 900–37 200) and 10 000 (95 % CI 5300–12 400), respectively.
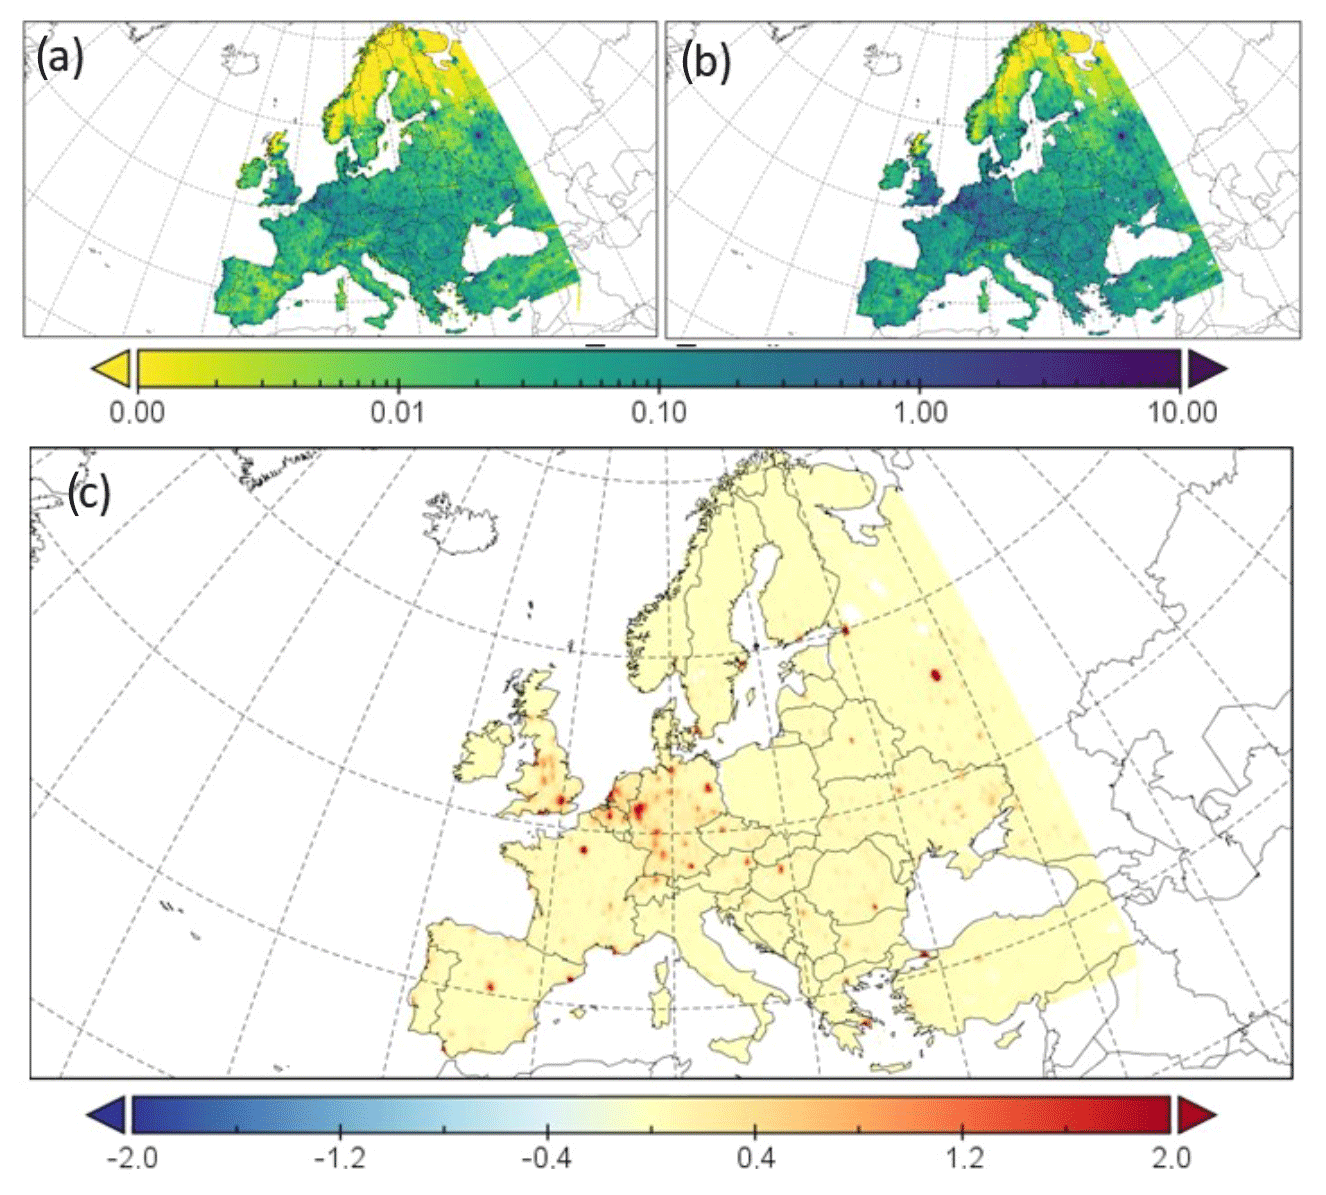
Figure 12Future (2031–2050) premature deaths for (a) the mitigation scenario with the population kept at present levels (REN80-P2010) and (b) the mitigation scenario that considers the population projections for 2050 (REN80-P2050). (c) Differences between both future scenarios (REN80-P2050 minus REN80-P2010). All values are in PD km−2.
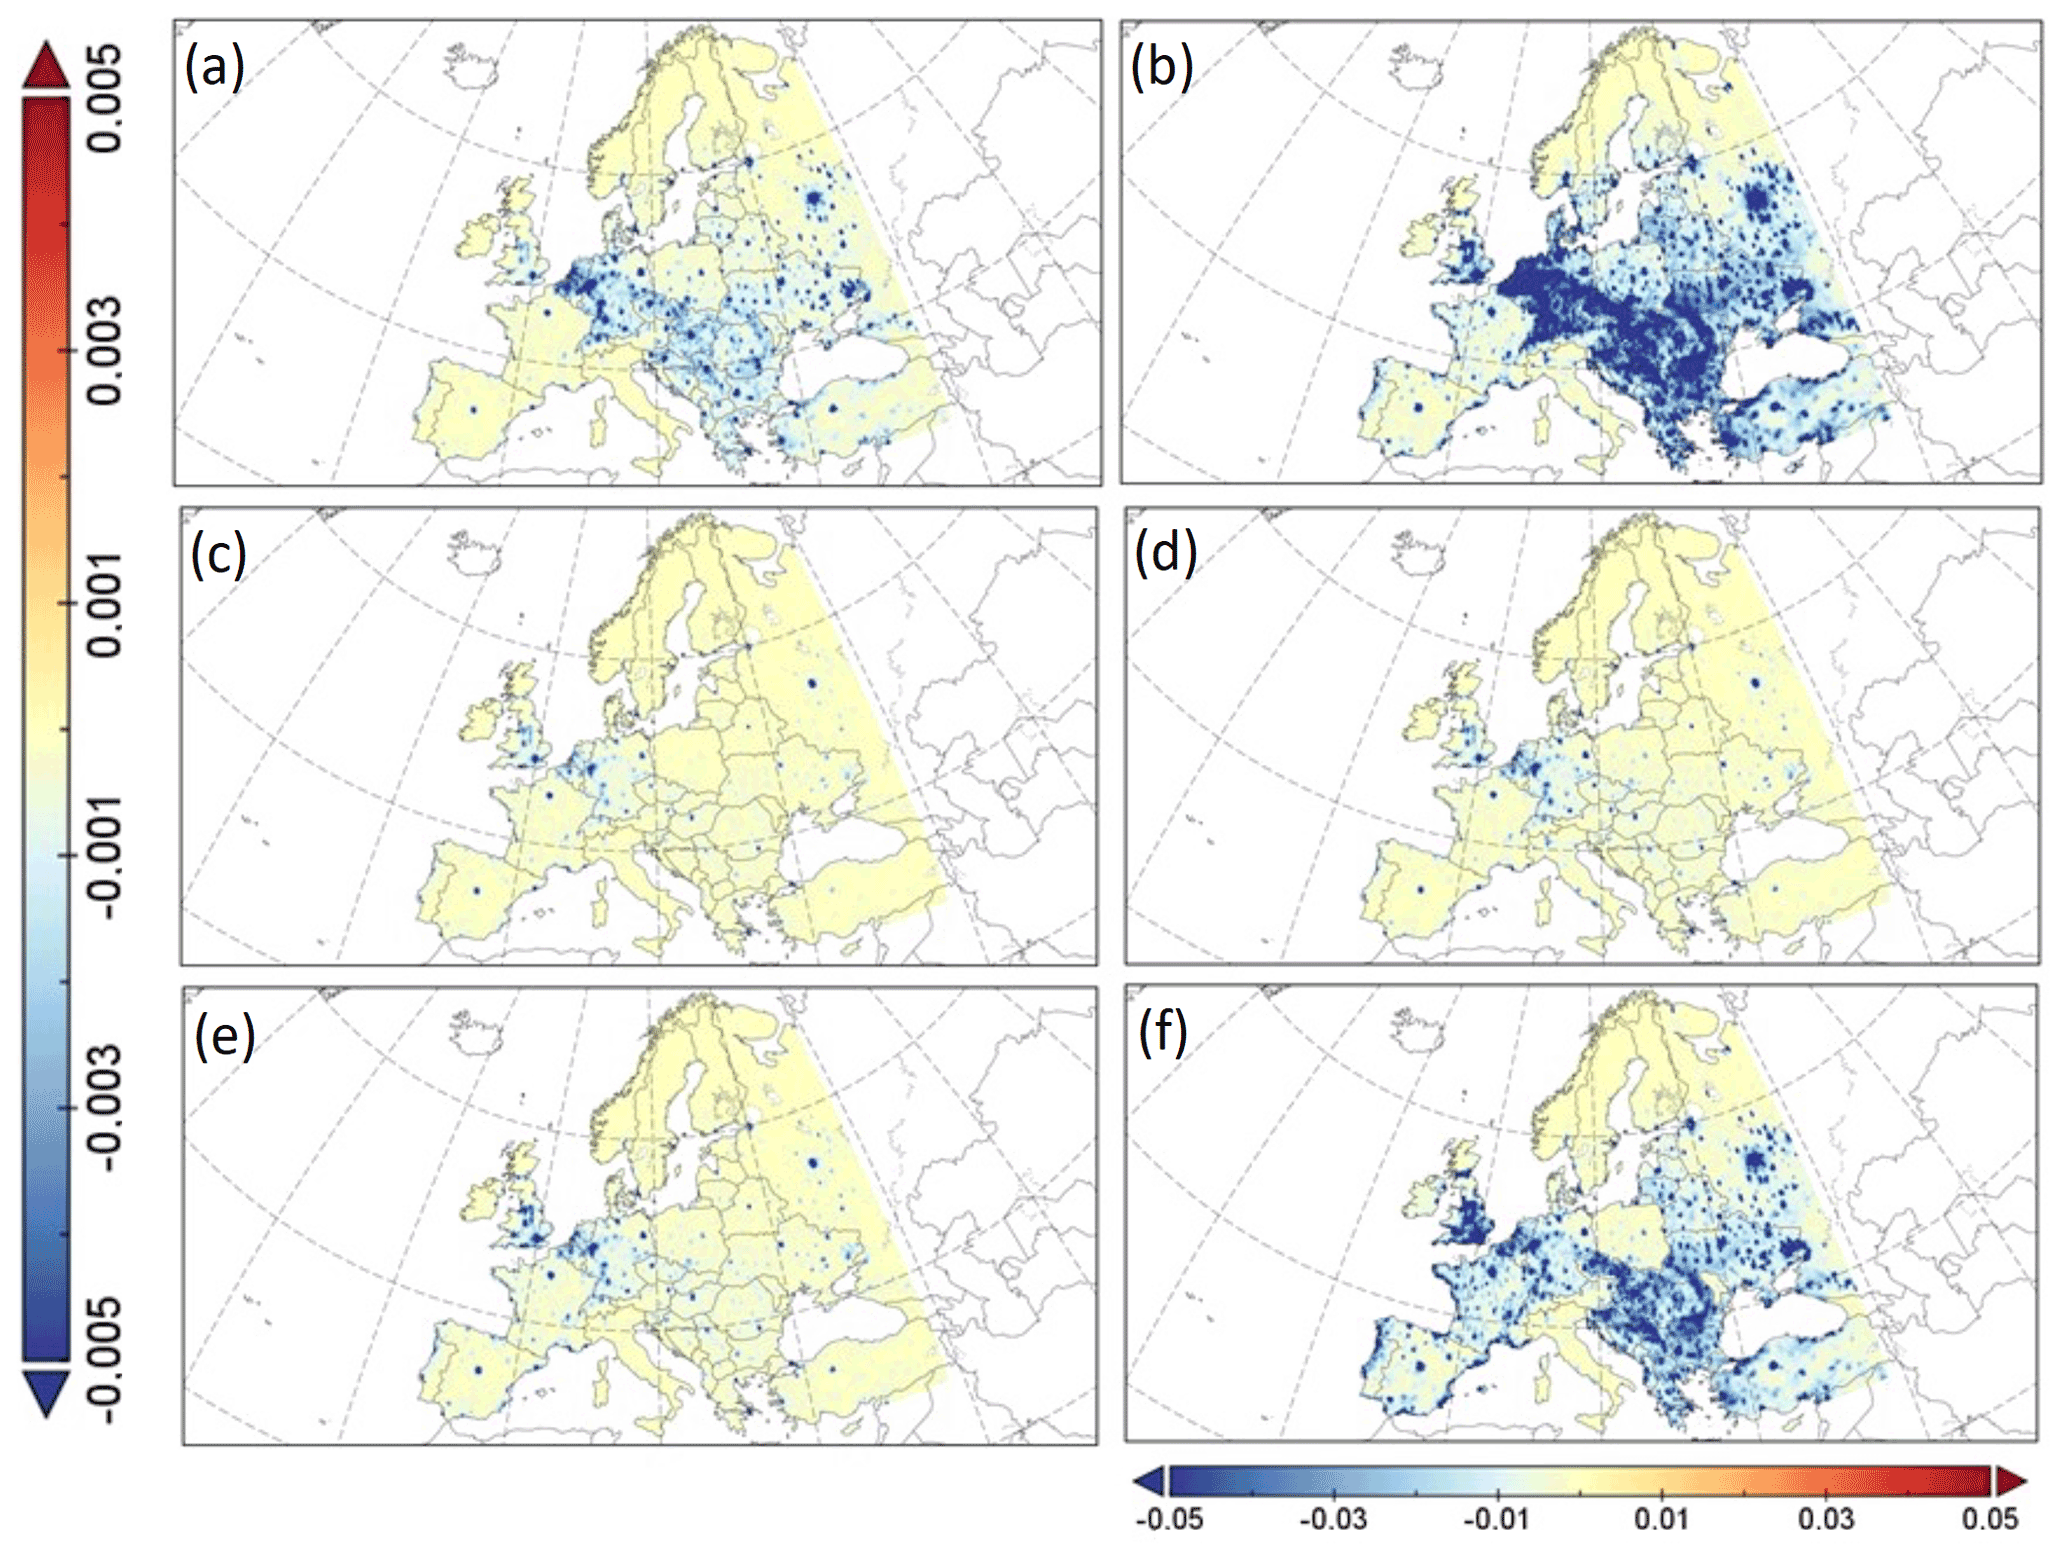
Figure 13Differences in future premature mortality for the future scenario FUT-P2050 and the mitigation scenario (REN80-P2050) (REN80-P2050 minus FUT-P2050), both of which consider the population projections for 2050. Endpoints considered are (a) CEV, (b) IHD, (c) COPD, (d) LC, (e) LRI and (f) all endpoints. All values are in premature deaths (PD) per km2.
Effect of the projected population for 2050
This last section tries to shed some light on the effect of the changes in the projected population (mainly the ageing of the European population, since almost half of all the PD over Europe occur in the age group of 80+). A comparison of the mortality burden for each age group between the different future scenarios is shown in the Supplement (Table S4).
In particular, the effect of the ageing of the population is clearly noticeable when comparing the FUT-P2010 and the FUT-P2050 scenarios, which only differ in the population taken as the basis for the estimation of PD over Europe. While the number of PD decreases in FUT-P2050 for younger age ranges, it generally increases for people over 65 years. For instance, the number of PD per 100 000 inhabitants in the 65–69 age range increases from 237 to 248 deaths/100 000 inhabitants, and the same statistic moves from 1037 to 1044 in the 80+ age range. This fact can be ascribed to the increase in the number of people in this group in the UN 2050 projection (Fig. 1). Conversely, for younger age ranges, mortality will decrease in the future, just like the population. For instance, mortality in the 30–34 age range moves from 14 PD/100 000 inhabitants in the FUT-P2010 case to 13 PD/100 000 inhabitants in FUT-P2050. Overall, the total number of premature deaths will increase from 158 to 254 PD/100 000 (+61 %) as a consequence of the ageing of the population, despite the UN projecting a decrease of −0.2 % in the total population over Europe for the year 2050.
With respect to individual endpoints, the proportion of the PD incidence caused by LRI remains similar for all age groups until the 80+ group is reached, when the incidence increases considerably (Fig. 14). Hence, LRI is not strongly sensitive to the ageing of the population but to modifications in the number of dwellers. LRI increases from 42 000 (95 % CI 35 200–48 300) in PRE-P2010 to 71 000 (95 % CI 59 500–81 700) PD per year in the FUT-P2050 case. Also, the LC results should be highlighted (48 000 PD per year, 95 % CI 40 300–55 200 in PRE-P2010 vs. 69 000 PD per year, 95 % CI 57 900–79 400; associated with PM2.5 air pollution in the FUT-P2050 case). For this cause, the number of deaths increases with age up to a maximum for the age range 70–74. Further increasing the age causes the number of deaths to decrease again. Finally, it is also noteworthy that PD decreases in adults (25–60 years) in the FUT-P2050 case for all mortality causes studied. PD increases in those aged 60 or more years in comparison with the present period due to the ageing of the population in the future. For this reason, a higher incidence is estimated for older-aged people.
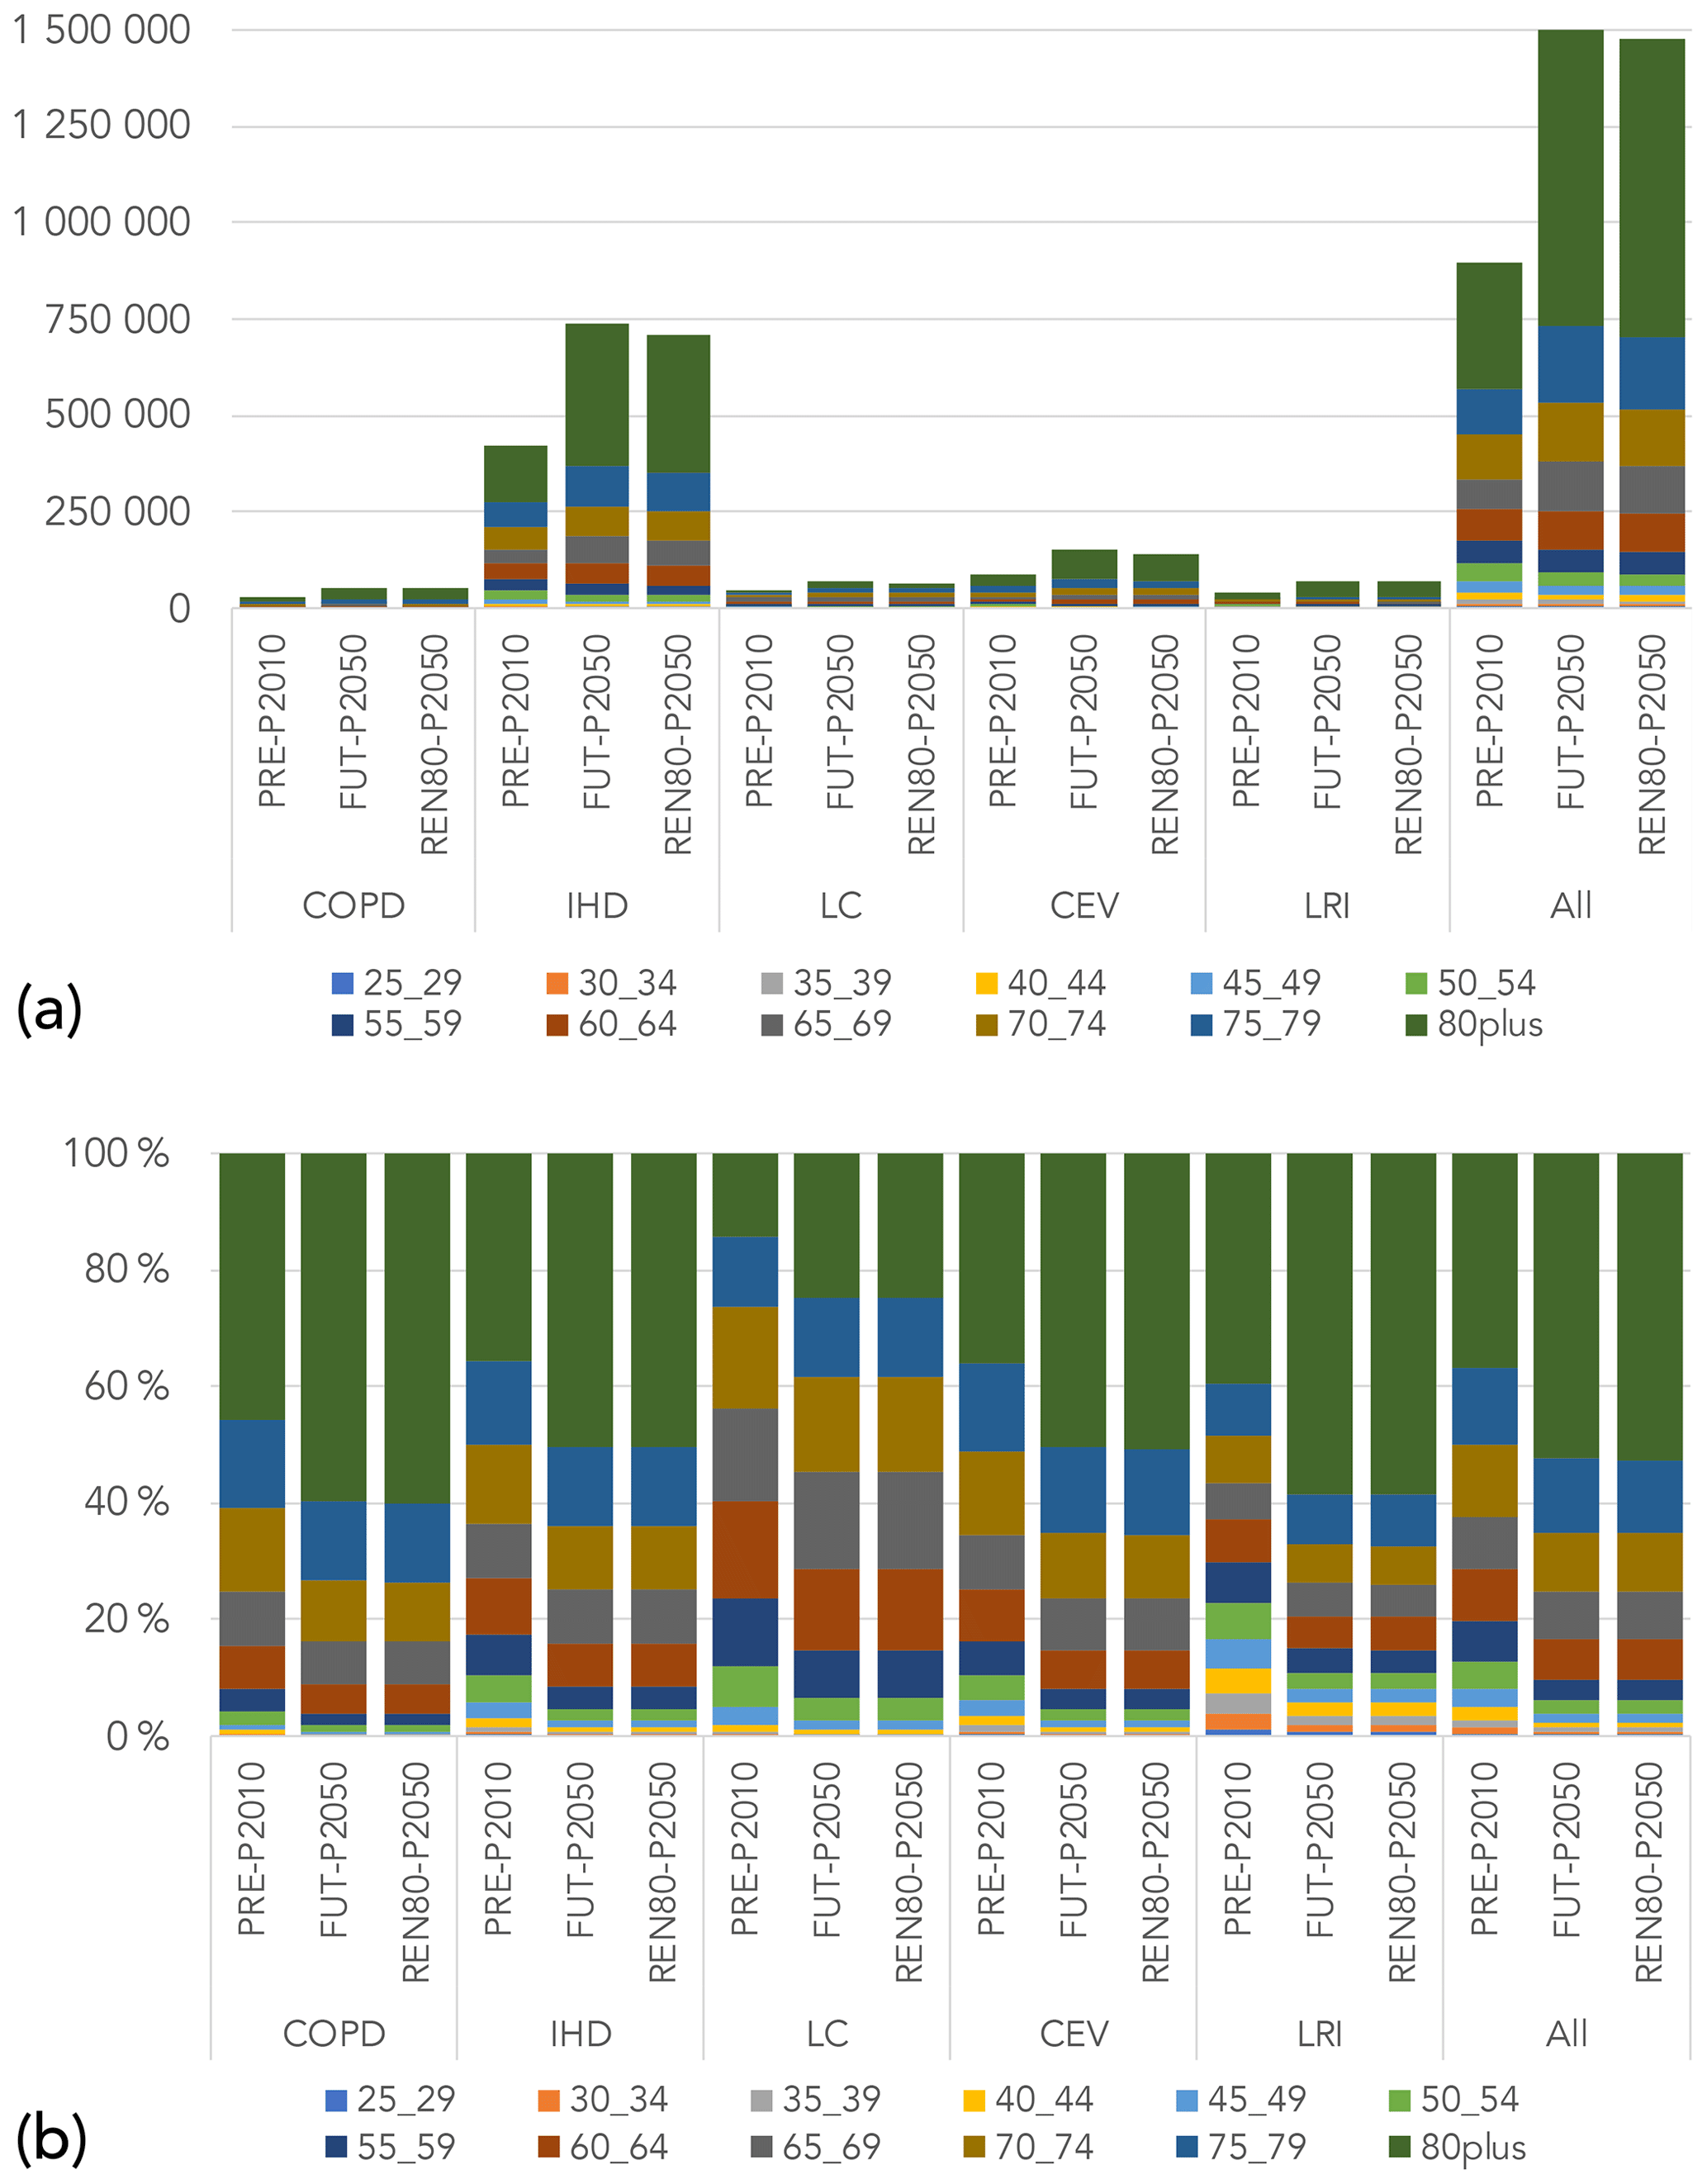
Figure 14Present (PRE-P2010) and future (FUT-P2010/P2050) estimations of PD per pathology and age group over Europe: (a) total PD per year; (b) %.
Hence, the differences between PRE-P2010 and FUT-P2010/P2050 arise from differences in the risk ratios estimated by Eq. (2). RRs are higher for younger age groups, with the incidence of PD higher for older groups. The baseline value (y0) in Eq. (2) is much higher for advanced ages, since elderly people present higher baseline mortality rates than younger dwellers.
This contribution has estimated the incidence of excess premature mortality associated with fine particulate matter for different present and future scenarios. The non-linear methodology employed indicated that there were 894 000 (95 % CI 723 900–1 055 400) annual premature deaths (PD) over Europe during the 1991–2010 period. The most important conclusions can be summarized as follows:
-
Effect of the climate penalty. When the effect of the climate penalty under the RCP8.5 scenario is isolated, the total premature mortality could increase by around 2000 PD (+0.2 % in FUT-P2010 vs. PRE-P2010), increasing from 894 000 (95 % CI 723 900–1 055 400) to 896 000 (95 % CI 725 500–1 057 800) over the target domain of Europe. Henceforth, the effect of the climate penalty is limited due to the compensating effects of increased mortality over western Europe (+1.3 PD/100 000 inhabitants) and eastern Europe (+0.4 PD/100 000 inhabitants) but a decrease over central Europe (−2.2 PD/100 000 inhabitants) (Fig. 15) as a consequence of the reduced PM2.5 levels over the latter region due to increased precipitation under RCP8.5. In this sense, the domain of central Europe (which includes the northern and central areas of the continent) will benefit from the climatic effects, while the climate penalty will have an important effect in western Europe, which includes southwestern European areas where the concentrations of PM2.5 are projected to increase in the RCP8.5 scenario.
-
Impact of changes in the projected population. This modification, together with the climate penalty (FUT-P2050), leads to an excess premature mortality rate of 1 540 000 (95 % CI 1 247 000–1 818 000); that is, an increase of 71.96 % with respect to the present scenario and 71.67 % compared to the future scenario in which only the climate penalty is considered. In contrast to the scenario in which the population is kept constant (FUT-P2010), PD will increase in central Europe in the future because of the increase in the elderly population.
-
Impact of mitigation scenarios. The introduction of energy policies favouring renewable energies (80 % of energy generated from renewable sources) could lead to a decrease of 60 000 (95 % CI 48 600–70 900) in the annual PD in the year 2050 (1 480 000 PD per year, 95 % CI 1 198 400–1 747 000 in the REN80-P2050 case, a decrease of −4 %) in comparison with the FUT-P2050 case). Thus, mortality will considerably increase in the future scenario, but establishing mitigation policies based on renewable energies could reduce the number of PD, with eastern Europe being the area that should benefit the most from this.
-
Causes of premature mortality. Among the different endpoints, IHD is the most important cause of mortality over Europe (over 50 % of the total premature mortality), with ∼424 000 (95 % CI 356 200–487 800) annual PD in the present and the climate penalty scenarios. When the change in the population by 2050 is considered, 736 000 (95 % CI 618 200–846 400) annual PD are associated with this endpoint. This number reduces the annual PD by 30 000 (95 % CI 15 900–37 200) when the mitigation through the use of renewables is considered. These results are caused by the high sensitivity of IHD to PM2.5. The second most important cause is CEV, with a ∼ 10 % contribution to the total premature mortality. LRI, LC and COPD represent 5 %, 4 % and 3 %, respectively, of the total premature mortality. Last, it should be highlighted that other NCD causes represent 30 % of the PD in Europe.
This study presents added value with respect to previous contributions. For instance, different baseline information was included depending on the area of Europe considered. In addition, the PD incidence by age range was detailed, which highlighted that mortality will increase in the future not only because of the climate penalty but also due to the aged European population projected for the year 2050. The ageing of the population will increase the number of sensitive dwellers and thus the PD burden over the European domain.
Despite the robust results obtained, a number of issues should be addressed in further contributions. For instance, the difficulty in estimating biomass burning emissions under future scenarios has caused emissions from this sector to be neglected, even though they can be an important source, especially when PM2.5 changes are less than 1.0 µg m−3.
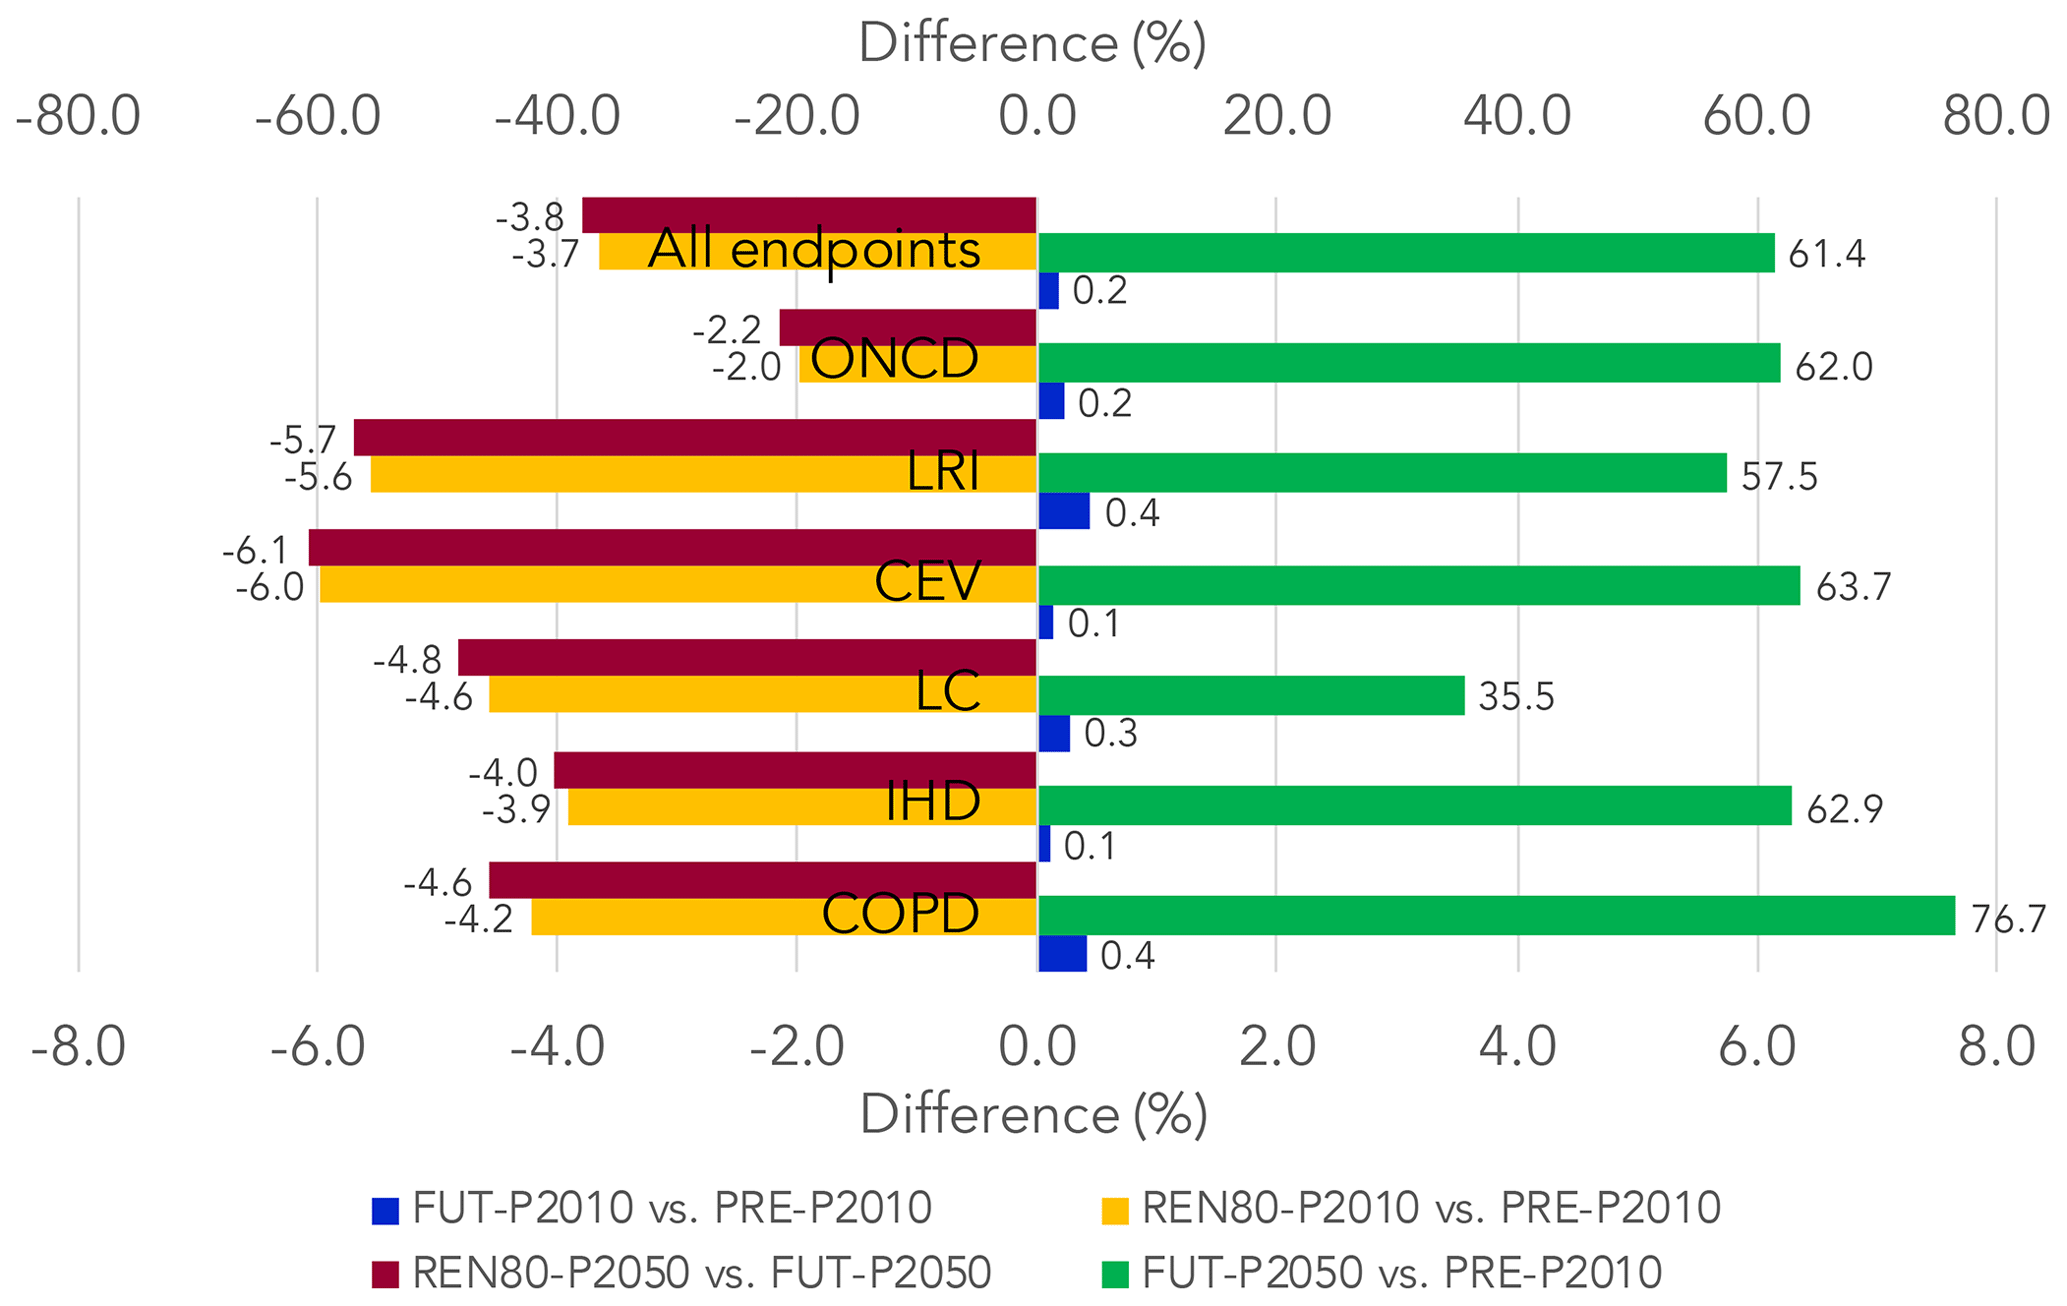
Figure 15Relative differences (in PD/100 000 inhabitants) between the different scenarios for all the endpoints included in this work. FUT-P2010, FUT-P2050 and REN80-P2010 are compared to the PRE-P2010 scenario, while the differences for the REN80-P2050 scenario are estimated with respect to the FUT-P2050 scenario.
Furthermore, it is important to bear in mind that these results were estimated for different future cases and scenarios. Hence, these estimations were generated using different variables that are sometimes difficult to project, such as the death rate, the levels of air pollution (which depend on emission scenarios and the human influence on emissions from traffic, power generation and agriculture, for example) and demographic trends (the elderly population, urbanization processes). Some of these variables are hard to control, and because of these difficulties, the assumption of a constant baseline mortality rate (y0) was taken into account when estimating present and future premature deaths.
In addition, one of the aspects that deserves further attention with respect to this contribution is the selection of the future forcing scenario (RCP8.5). This high-emissions scenario is frequently referred to as “business as usual” (BAU), suggesting that is a likely outcome if society does not make concerted efforts to cut greenhouse gas emissions (Pielke and Ritchie, 2021). RCP8.5 was originally developed to represent an upper limit to climate impacts (Moss et al., 2010), and was intended to explore an unlikely high-risk future (Riahi et al., 2011). In this sense, several authors have highlighted that this worst-case scenario is extremely unlikely and should not be treated as a BAU scenario that is consistent with high CO2 forcing (Ritchie and Dowlatabadi, 2017; Ho et al., 2019; Peters and Hausfather, 2020). Despite the criticism of the selection of RCP8.5 as a reference scenario (e.g. Grant et al., 2020; Peters and Hausfather, 2020; Hausfather and Peters, 2020; Pielke and Ritchie, 2021), other works have kept this debate open. For example, Schwalm et al. (2020a, b) indicate that RCP8.5, the most aggressive scenario for assumed fossil fuel use in global climate models, will continue to serve as a useful tool for quantifying physical climate risk, especially over near- to mid-term policy-relevant time horizons. Those authors indicate that not only are emissions that are consistent with RCP8.5 in close agreement with historical total cumulative CO2 emissions (within 1 %), but that RCP8.5 is also the best match out to mid-century under current and stated policies, with highly plausible CO2 emission levels even for 2100. Other works, which assume that RCP8.5 is not the most likely scenario, point out that assessing RCP8.5 might still be a helpful exercise since it flags up potential risks that emerge only at the extremes (O'Neill et al., 2016).
Despite the uncertainties and the limitations of this work (e.g. the selection of the forcing scenario, the use of a constant baseline mortality in all scenarios), it has become clear from this contribution that governments and public entities must act to clearly implement mitigation policies that could improve air quality and, therefore, the wellness of the European citizens.
The modelling data are available in the Zenodo repository (https://doi.org/10.5281/zenodo.6230393; Jiménez-Guerrero, 2022). For further information, please contact the corresponding author: pedro.jimenezguerrero@um.es.
The supplement related to this article is available online at: https://doi.org/10.5194/acp-22-3945-2022-supplement.
PTC wrote the manuscript, with contributions from PJG. LPP and PJG designed the air quality/climate experiments; PTC conducted the numerical estimations of premature mortality, with the support of UI, PJG and CG. PTC did the analysis, with the support of UI, CG, LPP and PJG.
The contact author has declared that neither they nor their co-authors have any competing interests.
Publisher's note: Copernicus Publications remains neutral with regard to jurisdictional claims in published maps and institutional affiliations.
The authors are thankful to the WRF-Chem development community and the G-MAR research group at the University of Murcia for the fruitful scientific discussions.
This work was funded by the ECCE project (grant no. PID2020-115693RB-I00) of Ministerio de Ciencia e Innovación/Agencia Estatal de Investigación (grant no. MCIN/AEI/10.13039/501100011033/). This work has also received funding from the European Union's Horizon 2020 research and innovation programme (EXHAUSTION (grant no. 820655)). Laura Palacios-Peña was supported by the Spanish Ministry of Education, Culture and Sports (grant no. FPU14/05505).
This paper was edited by Barbara Ervens and reviewed by two anonymous referees.
Andersson, C., Bergstrom, R., and Johansson, C.: Population exposure and mortality due to regional background PM in Europe – Long-term simulations of source region and shipping contributions, Atmos. Environ., 43, 3614–3620, https://doi.org/10.1016/j.atmosenv.2009.03.040, 2009. a, b
Anenberg, S. C., West, J. J., Yu, H., Chin, M., Schulz, M., Bergmann, D., Bey, I., Bian, H., Diehl, T., Fiore, A., Hess, P., Marmer, E., Montanaro, V., Park, R., Shindell, D., Takemura, T., and Dentener, F.: Impacts of intercontinental transport of anthropogenic fine particulate matter on human mortality, Air Qual. Atmos. He., 7, 369–379, https://doi.org/10.1007/s11869-014-0248-9, 2014. a, b, c
Balakrishnan, K., Dey, S., Gupta, T., Dhaliwal, R. S., Brauer, M., Cohen, A. J., Stanaway, J. D., Beig, G., Joshi, T. K., Aggarwal, A. N., Sabde, Y., Sadhu, H., Frostad, J., Causey, K., Godwin, W., Shukla, D. K., Kumar, G. A., Varghese, C. M., Muraleedharan, P., Agrawal, A., Anjana, R. M., Bhansali, A., Bhardwaj, D., Burkart, K., Cercy, K., Chakma, J. K., Chowdhury, S., Christopher, D. J., Dutta, E., Furtado, M., Ghosh, S., Ghoshal, A. G., Glenn, S. D., Guleria, R., Gupta, R., Jeemon, P., Kant, R., Kant, S., Kaur, T., Koul, P. A., Krish, V., Krishna, B., Larson, S. L., Madhipatla, K., Mahesh, P. A., Mohan, V., Mukhopadhyay, S., Mutreja, P., Naik, N., Nair, S., Nguyen, G., Odell, C. M., Pandian, J. D., Prabhakaran, D., Prabhakaran, P., Roy, A., Salvi, S., Sambandam, S., Saraf, D., Sharma, M., Shrivastava, A., Singh, V., Tandon, N., Thomas, N. J., Torre, A., Xavier, D., Yadav, G., Singh, S., Shekhar, C., Vos, T., Dandona, R., Reddy, K. S., Lim, S. S., Murray, C. J. L., Venkatesh, S., and Dandona, L.: The impact of air pollution on deaths, disease burden, and life expectancy across the states of India: the Global Burden of Disease Study 2017, The Lancet Planetary Health, 3, e26–e39, https://doi.org/10.1016/S2542-5196(18)30261-4, 2019. a
Brook, R. D., Rajagopalan, S., Pope, C. A., Brook, J. R., Bhatnagar, A., Diez-Roux, A. V., Holguin, F., Hong, Y., Luepker, R. V., Mittleman, M. A., Peters, A., Siscovick, D., Smith, S. C., Whitsel, L., and Kaufman, J. D.: Particulate Matter Air Pollution and Cardiovascular Disease, Circulation, 121, 2331–2378, https://doi.org/10.1161/CIR.0b013e3181dbece1, 2010. a
Burnett, R., Chen, H., Szyszkowicz, M., Fann, N., Hubbell, B., Pope, C. A., Apte, J. S., Brauer, M., Cohen, A., Weichenthal, S., Coggins, J., Di, Q., Brunekreef, B., Frostad, J., Lim, S. S., Kan, H., Walker, K. D., Thurston, G. D., Hayes, R. B., Lim, C. C., Turner, M. C., Jerrett, M., Krewski, D., Gapstur, S. M., Diver, W. R., Ostro, B., Goldberg, D., Crouse, D. L., Martin, R. V., Peters, P., Pinault, L., Tjepkema, M., van Donkelaar, A., Villeneuve, P. J., Miller, A. B., Yin, P., Zhou, M., Wang, L., Janssen, N. A. H., Marra, M., Atkinson, R. W., Tsang, H., Quoc Thach, T., Cannon, J. B., Allen, R. T., Hart, J. E., Laden, F., Cesaroni, G., Forastiere, F., Weinmayr, G., Jaensch, A., Nagel, G., Concin, H., and Spadaro, J. V.: Global estimates of mortality associated with long-term exposure to outdoor fine particulate matter, P. Natl. Acad. Sci. USA, 115, 9592–9597, https://doi.org/10.1073/pnas.1803222115, 2018. a, b, c, d
Chen, H., Zhang, Z., van Donkelaar, A., Bai, L., Martin, R. V., Lavigne, E., Kwong, J. C., and Burnett, R. T.: Understanding the Joint Impacts of Fine Particulate Matter Concentration and Composition on the Incidence and Mortality of Cardiovascular Disease: A Component-Adjusted Approach, Environ. Sci. Technol., 54, 4388–4399, https://doi.org/10.1021/acs.est.9b06861, 2020. a
Chin, M., Ginoux, P., Kinne, S., Torres, O., Holben, B. N., Duncan, B. N., Martin, R. V., Logan, J. A., Higurashi, A., and Nakajima, T.: Tropospheric aerosol optical thickness from the GOCART model and comparisons with satellite and Sun photometer measurements, J. Atmos. Sci., 59, 461–483, https://doi.org/10.1175/1520-0469(2002)059<0461:TAOTFT>2.0.CO;2, 2002. a
Cohen, A. J., Brauer, M., Burnett, R., Anderson, H. R., Frostad, J., Estep, K., Balakrishnan, K., Brunekreef, B., Dandona, L., Dandona, R., Feigin, V., Freedman, G., Hubbell, B., Jobling, A., Kan, H., Knibbs, L., Liu, Y., Martin, R., Morawska, L., Pope, C. A., Shin, H., Straif, K., Shaddick, G., Thomas, M., van Dingenen, R., van Donkelaar, A., Vos, T., Murray, C. J. L., and Forouzanfar, M. H.: Estimates and 25-year trends of the global burden of disease attributable to ambient air pollution: an analysis of data from the Global Burden of Diseases Study 2015, Lancet, 389, 1907–1918, https://doi.org/10.1016/S0140-6736(17)30505-6, 2017. a
Crippa, M., Janssens-Maenhout, G., Guizzardi, D., Van Dingenen, R., and Dentener, F.: Contribution and uncertainty of sectorial and regional emissions to regional and global PM2.5 health impacts, Atmos. Chem. Phys., 19, 5165–5186, https://doi.org/10.5194/acp-19-5165-2019, 2019. a, b, c, d
de Bruine, M., Krol, M., van Noije, T., Le Sager, P., and Röckmann, T.: The impact of precipitation evaporation on the atmospheric aerosol distribution in EC-Earth v3.2.0, Geosci. Model Dev., 11, 1443–1465, https://doi.org/10.5194/gmd-11-1443-2018, 2018. a
Domínguez-Morueco, N., Ratola, N., Sierra, J., Nadal, M., and Jiménez-Guerrero, P.: Combining monitoring and modelling approaches for BaP characterization over a petrochemical area, Sci. Total Environ., 658, 424–438, https://doi.org/10.1016/j.scitotenv.2018.12.202, 2019. a
European Climate Foundation: Roadmap 2050: a practical guide to a prosperous, low-carbon Europe. Volume I. Technical and economic assessment, http://www.roadmap2050.eu/project/roadmap-2050 (last access: 20 December 2021), 2010. a
European Environment Agency: EMEP/EEA air pollutant emission Inventory Guidebook. Technical guidance to prepare national emission inventories, EEA Report No 13/2019, https://doi.org/10.2800/293657, 2019. a, b
European Environment Agency: Indicator assessment: Overview of electricity production and use in Europe, https://www.eea.europa.eu/ims/greenhouse-gas-emission-intensity-of-1 (last access: 2 February 2022), 2020. a, b
Evans, J., van Donkelaar, A., Martin, R. V., Burnett, R., Rainham, D. G., Birkett, N. J., and Krewski, D.: Estimates of global mortality attributable to particulate air pollution using satellite imagery, Environ. Res., 120, 33–42, https://doi.org/10.1016/j.envres.2012.08.005, 2013. a
Fang, Y., Mauzerall, D. L., Liu, J., Fiore, A. M., and Horowitz, L. W.: Impacts of 21st century climate change on global air pollution-related premature mortality, Clim. Change, 121, 239–253, https://doi.org/10.1007/s10584-013-0847-8, 2013a. a, b, c
Fang, Y., Naik, V., Horowitz, L. W., and Mauzerall, D. L.: Air pollution and associated human mortality: the role of air pollutant emissions, climate change and methane concentration increases from the preindustrial period to present, Atmos. Chem. Phys., 13, 1377–1394, https://doi.org/10.5194/acp-13-1377-2013, 2013b. a
Fernández, J., Frías, M. D., Cabos, W. D., Cofiño, A. S., Domínguez, M., Fita, L., Gaertner, M. A., García-Díez, M., Gutiérrez, J. M., Jiménez-Guerrero, P., Liguori, G., Montávez, J. P., Romera, R., and Sánchez, E.: Consistency of climate change projections from multiple global and regional model intercomparison projects, Clim. Dynam., 52, 1139–1156, https://doi.org/10.1007/s00382-018-4181-8, 2019. a, b
Ford, B. and Heald, C. L.: Exploring the uncertainty associated with satellite-based estimates of premature mortality due to exposure to fine particulate matter, Atmos. Chem. Phys., 16, 3499–3523, https://doi.org/10.5194/acp-16-3499-2016, 2016. a
Freitas, S. R., Longo, K. M., Alonso, M. F., Pirre, M., Marecal, V., Grell, G., Stockler, R., Mello, R. F., and Sánchez Gácita, M.: PREP-CHEM-SRC – 1.0: a preprocessor of trace gas and aerosol emission fields for regional and global atmospheric chemistry models, Geosci. Model Dev., 4, 419–433, https://doi.org/10.5194/gmd-4-419-2011, 2011. a
Geels, C., Andersson, C., Hänninen, O., Lansø, A., Schwarze, P., Skjøth, C., and Brandt, J.: Future Premature Mortality Due to O3, Secondary Inorganic Aerosols and Primary PM in Europe? Sensitivity to Changes in Climate, Anthropogenic Emissions, Population and Building Stock, Int. J. Env. Res. Pub. He., 12, 2837–2869, https://doi.org/10.3390/ijerph120302837, 2015. a
Geiger, H., Barnes, I., Bejan, I., Benter, T., and Spittler, M.: The tropospheric degradation of isoprene: an updated module for the regional atmospheric chemistry mechanism, Atmos. Environ., 37, 1503–1519, https://doi.org/10.1016/S1352-2310(02)01047-6, 2003. a
Ginoux, P., Chin, M., Tegen, I., Prospero, J. M., Holben, B., Dubovik, O., and Lin, S.-J.: Sources and distributions of dust aerosols simulated with the GOCART model, J. Geophys. Res.-Atmos., 106, 20255–20273, https://doi.org/10.1029/2000JD000053, 2001. a
Giorgetta, M., Jungclaus, J., Reick, C., Legutke, S., Brovkin, V., Crueger, T., Esch, M., Fieg, K., Glushak, K., Gayler, V., Haak, H., Hollweg, H.-D., Kinne, S., Kornblueh, L., Matei, D., Mauritsen, T., Mikolajewicz, U., Muller, U., Notz, D., Raddatz, T., Rast, S., Reckner, E., Salzmann, M., Schmidt, H., Schunur, R., Segschneider, J., Six, K., Stockhause, M., Wegner, J., Widmann, H., Wieners, K.-H., Claussen, M., Marotzke, J., and Stevens, B.: Forcing data for Regional Climate Models based on the MPI-ESM-LR model of the Max Planck Institute for Meteorology (MPI-M): The CMIP5 historical experiment., World Data Center for Climate (WDCC) at DKRZ, https://doi.org/10.1594/WDCC/RCM_CMIP5_historical-LR, 2012a. a
Giorgetta, M., Jungclaus, J., Reick, C., Legutke, S., Brovkin, V., Crueger, T., Esch, M., Fieg, K., Glushak, K., Gayler, V., Haak, H., Hollweg, H.-D., Kinne, S., Kornblueh, L., Matei, D., Mauritsen, T., Mikolajewicz, U., Muller, U., Notz, D., Raddatz, T., Rast, S., Roeckner, E., Salzmann, M., Schmidt, H., Schunur, R., Segschneider, J., Six, K., Stockhause, M., Wegner, J., Widmann, H., Wieners, K.-H., Claussen, M., Marotzke, J., and Stevens, B.: Forcing data for Regional Climate Models based on the MPI-ESM-LR model of the Max Planck Institute for Meteorology (MPI-M): The CMIP5 rcp85 experiment., World Data Center for Climate (WDCC) at DKRZ, https://doi.org/10.1594/WDCC/RCM_CMIP5_rcp85-LR, 2012b. a
Grant, N., Hawkes, A., Napp, T., and Gambhir, A.: The appropriate use of reference scenarios in mitigation analysis, Nat. Clim. Change, 10, 605–610, https://doi.org/10.1038/s41558-020-0826-9, 2020. a
Grell, G. A., Peckham, S. E., Schmitz, R., McKeen, S. A., Frost, G., Skamarock, W. C., and Eder, B.: Fully coupled online chemistry within the WRF model, Atmos. Environ., 39, 6957–6975, https://doi.org/10.1016/j.atmosenv.2005.04.027, 2005. a
Guzmán, P., Tarín-Carrasco, P., Morales-Suárez-Varela, M., and Jiménez-Guerrero, P.: Effects of air pollution on dementia over Europe for present and future climate change scenarios, Environ. Res., 204, 112012, https://doi.org/10.1016/j.envres.2021.112012, 2022. a
Hamra, G. B., Guha, N., Cohen, A., Laden, F., Raaschou-Nielsen, O., Samet, J. M., Vineis, P., Forastiere, F., Saldiva, P., Yorifuji, T., and Loomis, D.: Outdoor particulate matter exposure and lung cancer: a systematic review and meta-analysis, Environ. Health Persp., 122, 906–911, https://doi.org/10.1289/ehp/1408092, 2014. a
Hausfather, Z. and Peters, G. P.: RCP8.5 is a problematic scenario for near-term emissions, P. Natl. Acad. Sci. USA, 117, 27791–27792, https://doi.org/10.1073/pnas.2017124117, 2020. a
Ho, C. K., Stephenson, D. B., Collins, M., Ferro, C. A. T., and Brown, S. J.: Calibration Strategies: A Source of Additional Uncertainty in Climate Change Projections, B. Am. Meteorol. Soc., 93, 21–26, https://doi.org/10.1175/2011BAMS3110.1, 2012. a
Ho, E., Budescu, D. V., Bosetti, V., van Vuuren, D. P., and Keller, K.: Not all carbon dioxide emission scenarios are equally likely: a subjective expert assessment, Clim. Change, 155, 545–561, https://doi.org/10.1007/s10584-019-02500-y, 2019. a
Hong, C., Zhang, Q., Zhang, Y., Davis, S. J., Zhang, X., Tong, D., Guan, D., Liu, Z., and He, K.: Weakening aerosol direct radiative effects mitigate climate penalty on Chinese air quality, Nat. Clim. Change, 10, 845–850, https://doi.org/10.1038/s41558-020-0840-y, 2020. a
Hou, P., Wu, S., McCarty, J. L., and Gao, Y.: Sensitivity of atmospheric aerosol scavenging to precipitation intensity and frequency in the context of global climate change, Atmos. Chem. Phys., 18, 8173–8182, https://doi.org/10.5194/acp-18-8173-2018, 2018. a
Im, U., Bianconi, R., Solazzo, E., Kioutsioukis, I., Badia, A., Balzarini, A., Baró, R., Bellasio, R., Brunner, D., Chemel, C., Curci, G., Denier van der Gon, H., Flemming, J., Forkel, R., Giordano, L., Jiménez-Guerrero, P., Hirtl, M., Hodzic, A., Honzak, L., Jorba, O., Knote, C., Makar, P. A., Manders-Groot, A., Neal, L., Pérez, J. L., Pirovano, G., Pouliot, G., San Jose, R., Savage, N., Schroder, W., Sokhi, R. S., Syrakov, D., Torian, A., Tuccella, P., Wang, K., Werhahn, J., Wolke, R., Zabkar, R., Zhang, Y., Zhang, J., Hogrefe, C., and Galmarini, S.: Evaluation of operational online-coupled regional air quality models over Europe and North America in the context of AQMEII phase 2. Part II: Particulate matter, Atmos. Environ., 115, 421–441, https://doi.org/10.1016/j.atmosenv.2014.08.072, 2015. a
Im, U., Brandt, J., Geels, C., Hansen, K. M., Christensen, J. H., Andersen, M. S., Solazzo, E., Kioutsioukis, I., Alyuz, U., Balzarini, A., Baro, R., Bellasio, R., Bianconi, R., Bieser, J., Colette, A., Curci, G., Farrow, A., Flemming, J., Fraser, A., Jimenez-Guerrero, P., Kitwiroon, N., Liang, C.-K., Nopmongcol, U., Pirovano, G., Pozzoli, L., Prank, M., Rose, R., Sokhi, R., Tuccella, P., Unal, A., Vivanco, M. G., West, J., Yarwood, G., Hogrefe, C., and Galmarini, S.: Assessment and economic valuation of air pollution impacts on human health over Europe and the United States as calculated by a multi-model ensemble in the framework of AQMEII3, Atmos. Chem. Phys., 18, 5967–5989, https://doi.org/10.5194/acp-18-5967-2018, 2018. a
Jacob, D., Kotova, L., Teichmann, C., Sobolowski, S. P., Vautard, R., Donnelly, C., Koutroulis, A. G., Grillakis, M. G., Tsanis, I. K., Damm, A., Sakalli, A., and van Vliet, M. T. H.: Climate Impacts in Europe Under +1.5 ∘C Global Warming, Earth's Future, 6, 264–285, https://doi.org/10.1002/2017EF000710, 2018. a
Jacob, D., Teichmann, C., Sobolowski, S., Katragkou, E., Anders, I., Belda, M., Benestad, R., Boberg, F., Buonomo, E., Cardoso, R. M., Casanueva, A., Christensen, O. B., Christensen, J. H., Coppola, E., De Cruz, L., Davin, E. L., Dobler, A., Domínguez, M., Fealy, R., Fernandez, J., Gaertner, M. A., García-Díez, M., Giorgi, F., Gobiet, A., Goergen, K., Gómez-Navarro, J. J., Alemán, J. J. G., Gutiérrez, C., Gutiérrez, J. M., Güttler, I., Haensler, A., Halenka, T., Jerez, S., Jiménez-Guerrero, P., Jones, R. G., Keuler, K., Kjellström, E., Knist, S., Kotlarski, S., Maraun, D., van Meijgaard, E., Mercogliano, P., Montávez, J. P., Navarra, A., Nikulin, G., de Noblet-Ducoudré, N., Panitz, H.-J., Pfeifer, S., Piazza, M., Pichelli, E., Pietikäinen, J.-P., Prein, A. F., Preuschmann, S., Rechid, D., Rockel, B., Romera, R., Sánchez, E., Sieck, K., Soares, P. M. M., Somot, S., Srnec, L., Sørland, S. L., Termonia, P., Truhetz, H., Vautard, R., Warrach-Sagi, K., and Wulfmeyer, V.: Regional climate downscaling over Europe: perspectives from the EURO-CORDEX community, Reg. Environ. Change, 20, 51, https://doi.org/10.1007/s10113-020-01606-9, 2020. a
Jacob, D. J. and Winner, D. A.: Effect of climate change on air quality, Atmos. Environ., 43, 51–63, https://doi.org/10.1016/j.atmosenv.2008.09.051, 2009. a
Jerez, S., López-Romero, J. M., Turco, M., Lorente-Plazas, R., Gómez-Navarro, J. J., Jiménez-Guerrero, P., and Montávez, J. P.: On the Spin-Up Period in WRF Simulations Over Europe: Trade-Offs Between Length and Seasonality, J. Adv. Model. Earth Syst., 12, e2019MS001945, https://doi.org/10.1029/2019MS001945, 2020. a
Jerez, S., Palacios-Peña, L., Gutiérrez, C., Jiménez-Guerrero, P., López-Romero, J. M., Pravia-Sarabia, E., and Montávez, J. P.: Sensitivity of surface solar radiation to aerosol–radiation and aerosol–cloud interactions over Europe in WRFv3.6.1 climatic runs with fully interactive aerosols, Geosci. Model Dev., 14, 1533–1551, https://doi.org/10.5194/gmd-14-1533-2021, 2021. a
Jiménez-Guerrero, P.: Data for manuscript Reducing future air pollution-related premature mortality over Europe by mitigating emissions from the energy sector: assessing an 80 % renewable energies scenario, Atmos. Chem. Phys. Atmospheric Chemistry and Physics, Zenodo [data set], https://doi.org/10.5281/zenodo.6230393, 2022. a
Jiménez-Guerrero, P. and Ratola, N.: Influence of the North Atlantic oscillation on the atmospheric levels of benzo[a]pyrene over Europe, Clim. Dynam., 57, 1173–1186, https://doi.org/10.1007/s00382-021-05766-0, 2021. a
Jiménez-Guerrero, P., Montávez, J. P., Gómez-Navarro, J. J., Jerez, S., and Lorente-Plazas, R.: Impacts of climate change on ground level gas-phase pollutants and aerosols in the Iberian Peninsula for the late XXI century, Atmos. Environ., 55, 483–495, https://doi.org/10.1016/j.atmosenv.2012.02.048, 2012. a
Jiménez-Guerrero, P., Gómez-Navarro, J. J., Baró, R., Lorente, R., Ratola, N., and Montávez, J. P.: Is there a common pattern of future gas-phase air pollution in Europe under diverse climate change scenarios?, Clim. Change, 121, 661–671, https://doi.org/10.1007/s10584-013-0944-8, 2013a. a
Jiménez-Guerrero, P., Jerez, S., Montávez, J. P., and Trigo, R. M.: Uncertainties in future ozone and PM10 projections over Europe from a regional climate multiphysics ensemble, Geophys. Res. Lett., 40, 5764–5769, https://doi.org/10.1002/2013GL057403, 2013b. a, b
Kirtman, B., Power, S. B., Adedoyin, A. J., Boer, G. J., Bojariu, R., Camilloni, I., Doblas-Reyes, F., Fiore, A. M., Kimoto, M., Meehl, G., Prather, M., Sarr, A., Schär, C., Sutton, R., van Oldenborgh, G. J., Vecchi, G., and Wang, H. J.: Near-term Climate Change: Projections and Predictability, in: Climate Change 2013 – The Physical Science Basis, edited by Intergovernmental Panel on Climate Change, Cambridge University Press, Cambridge, 9781107057, 953–1028, https://doi.org/10.1017/CBO9781107415324.023, 2013. a
Kok, J. F.: A scaling theory for the size distribution of emitted dust aerosols suggests climate models underestimate the size of the global dust cycle, P. Natl. Acad. Sci. USA, 108, 1016–1021, https://doi.org/10.1073/pnas.1014798108, 2011. a
Lamarque, J.-F., Bond, T. C., Eyring, V., Granier, C., Heil, A., Klimont, Z., Lee, D., Liousse, C., Mieville, A., Owen, B., Schultz, M. G., Shindell, D., Smith, S. J., Stehfest, E., Van Aardenne, J., Cooper, O. R., Kainuma, M., Mahowald, N., McConnell, J. R., Naik, V., Riahi, K., and van Vuuren, D. P.: Historical (1850–2000) gridded anthropogenic and biomass burning emissions of reactive gases and aerosols: methodology and application, Atmos. Chem. Phys., 10, 7017–7039, https://doi.org/10.5194/acp-10-7017-2010, 2010. a, b
Lee, C. J., Martin, R. V., Henze, D. K., Brauer, M., Cohen, A., and Donkelaar, A. v.: Response of Global Particulate-Matter-Related Mortality to Changes in Local Precursor Emissions, Environ. Sci. Technol., 49, 4335–4344, https://doi.org/10.1021/acs.est.5b00873, 2015. a
Lelieveld, J., Barlas, C., Giannadaki, D., and Pozzer, A.: Model calculated global, regional and megacity premature mortality due to air pollution, Atmos. Chem. Phys., 13, 7023–7037, https://doi.org/10.5194/acp-13-7023-2013, 2013. a, b
Lelieveld, J., Evans, J. S., Fnais, M., Giannadaki, D., and Pozzer, A.: The contribution of outdoor air pollution sources to premature mortality on a global scale, Nature, 525, 367–371, https://doi.org/10.1038/nature15371, 2015. a, b, c
Lelieveld, J., Klingmüller, K., Pozzer, A., Pöschl, U., Fnais, M., Daiber, A., and Münzel, T.: Cardiovascular disease burden from ambient air pollution in Europe reassessed using novel hazard ratio functions, European Heart Journal, 40, 1590–1596, https://doi.org/10.1093/eurheartj/ehz135, 2019. a
Liang, C.-K., West, J. J., Silva, R. A., Bian, H., Chin, M., Davila, Y., Dentener, F. J., Emmons, L., Flemming, J., Folberth, G., Henze, D., Im, U., Jonson, J. E., Keating, T. J., Kucsera, T., Lenzen, A., Lin, M., Lund, M. T., Pan, X., Park, R. J., Pierce, R. B., Sekiya, T., Sudo, K., and Takemura, T.: HTAP2 multi-model estimates of premature human mortality due to intercontinental transport of air pollution and emission sectors, Atmos. Chem. Phys., 18, 10497–10520, https://doi.org/10.5194/acp-18-10497-2018, 2018. a, b
López-Romero, J. M., Montávez, J. P., Jerez, S., Lorente-Plazas, R., Palacios-Peña, L., and Jiménez-Guerrero, P.: Precipitation response to aerosol–radiation and aerosol–cloud interactions in regional climate simulations over Europe, Atmos. Chem. Phys., 21, 415–430, https://doi.org/10.5194/acp-21-415-2021, 2021. a
Maraun, D.: Bias Correcting Climate Change Simulations – a Critical Review, Current Climate Change Reports, 2, 211–220, https://doi.org/10.1007/s40641-016-0050-x, 2016. a
McConnell, R., Berhane, K., Yao, L., Jerrett, M., Lurmann, F., Gilliland, F., Künzli, N., Gauderman, J., Avol, E., Thomas, D., and Peters, J.: Traffic, susceptibility, and childhood asthma, Environ. Health Persp., 114, 766–772, https://doi.org/10.1289/ehp.8594, 2006. a
McDuffie, E. E., Martin, R. V., Spadaro, J. V., Burnett, R., Smith, S. J., O'Rourke, P., Hammer, M. S., van Donkelaar, A., Bindle, L., Shah, V., Jaeglé, L., Luo, G., Yu, F., Adeniran, J. A., Lin, J., and Brauer, M.: Source sector and fuel contributions to ambient PM2.5 and attributable mortality across multiple spatial scales, Nat. Commun., 12, 3594, https://doi.org/10.1038/s41467-021-23853-y, 2021. a
Morrison, H., Thompson, G., and Tatarskii, V.: Impact of Cloud Microphysics on the Development of Trailing Stratiform Precipitation in a Simulated Squall Line: Comparison of One- and Two-Moment Schemes, Mon. Weather Rev., 137, 991–1007, https://doi.org/10.1175/2008MWR2556.1, 2009. a, b
Moss, R. H., Edmonds, J. A., Hibbard, K. A., Manning, M. R., Rose, S. K., van Vuuren, D. P., Carter, T. R., Emori, S., Kainuma, M., Kram, T., Meehl, G. A., Mitchell, J. F. B., Nakicenovic, N., Riahi, K., Smith, S. J., Stouffer, R. J., Thomson, A. M., Weyant, J. P., and Wilbanks, T. J.: The next generation of scenarios for climate change research and assessment, Nature, 463, 747–756, https://doi.org/10.1038/nature08823, 2010. a, b
NASA SocioEconomic Data and Applications Center: Basic Demographic Characteristics, v4.11, http://sedac.ciesin.columbia.edu (last access: 17 November 2021), 2019. a
Nenes, A., Pandis, S. N., and Pilinis, C.: ISORROPIA: A New Thermodynamic Equilibrium Model for Multiphase Multicomponent Inorganic Aerosols, Aquat. Geochem., 4, 123–152, https://doi.org/10.1023/A:1009604003981, 1998. a
Ohata, S., Moteki, N., Mori, T., Koike, M., and Kondo, Y.: A key process controlling the wet removal of aerosols: new observational evidence, Sci. Rep.-UK, 6, 34113, https://doi.org/10.1038/srep34113, 2016. a
O'Neill, B. C., Tebaldi, C., van Vuuren, D. P., Eyring, V., Friedlingstein, P., Hurtt, G., Knutti, R., Kriegler, E., Lamarque, J.-F., Lowe, J., Meehl, G. A., Moss, R., Riahi, K., and Sanderson, B. M.: The Scenario Model Intercomparison Project (ScenarioMIP) for CMIP6, Geosci. Model Dev., 9, 3461–3482, https://doi.org/10.5194/gmd-9-3461-2016, 2016. a
Palacios-Peña, L., Fast, J. D., Pravia-Sarabia, E., and Jiménez-Guerrero, P.: Sensitivity of aerosol optical properties to the aerosol size distribution over central Europe and the Mediterranean Basin using the WRF-Chem v.3.9.1.1 coupled model, Geosci. Model Dev., 13, 5897–5915, https://doi.org/10.5194/gmd-13-5897-2020, 2020a. a, b, c
Palacios-Peña, L., Montávez, J. P., López-Romero, J. M., Jerez, S., Gómez-Navarro, J. J., Lorente-Plazas, R., Ruiz, J., and Jiménez-Guerrero, P.: Added value of aerosol-cloud interactions for representing aerosol optical depth in an online coupled climate-chemistry model over Europe, Atmosphere, 11, 360, https://doi.org/10.3390/atmos11040360, 2020b. a, b
Park, S., Allen, R. J., and Lim, C. H.: A likely increase in fine particulate matter and premature mortality under future climate change, Air Qual. Atmos. He., 13, 143–151, https://doi.org/10.1007/s11869-019-00785-7, 2020. a, b, c
Peters, G. P. and Hausfather, Z.: Emissions – the “business as usual” story is misleading, Nature, 577, 618–620, 2020. a, b
Pielke, R. and Ritchie, J.: Distorting the view of our climate future: The misuse and abuse of climate pathways and scenarios, Energy Research Social Science, 72, 101890, https://doi.org/10.1016/j.erss.2020.101890, 2021. a, b
Pope, C. A., Burnett, R. T., Krewski, D., Jerrett, M., Shi, Y., Calle, E. E., and Thun, M. J.: Cardiovascular mortality and exposure to airborne fine particulate matter and cigarette smoke, Circulation, 120, 941–948, https://doi.org/10.1161/CIRCULATIONAHA.109.857888, 2009. a
Pope, C. A., Coleman, N., Pond, Z. A., and Burnett, R. T.: Fine particulate air pollution and human mortality: 25+ years of cohort studies, Environ. Res., 183, 108924, https://doi.org/10.1016/j.envres.2019.108924, 2020. a
Pravia-Sarabia, E., Gómez-Navarro, J. J., Jiménez-Guerrero, P., and Montávez, J. P.: TITAM (v1.0): the Time-Independent Tracking Algorithm for Medicanes, Geosci. Model Dev., 13, 6051–6075, https://doi.org/10.5194/gmd-13-6051-2020, 2020. a
Prüss-Üstün, A., Wolf, J., Corvalán, C. F., Bos, R., and Neira, M. P.: Preventing disease through healthy environments: a global assessment of the burden of disease from environmental risks, World Health Organization, ISBN 9789241565196, 2016. a
Räisänen, J.: How reliable are climate models?, Tellus A, 59, 2–29, https://doi.org/10.1111/j.1600-0870.2006.00211.x, 2007. a
Räisänen, J. and Räty, O.: Projections of daily mean temperature variability in the future: cross-validation tests with ENSEMBLES regional climate simulations, Clim. Dynam., 41, 1553–1568, https://doi.org/10.1007/s00382-012-1515-9, 2013. a
Riahi, K., Rao, S., Krey, V., Cho, C., Chirkov, V., Fischer, G., Kindermann, G., Nakicenovic, N., and Rafaj, P.: RCP 8.5—A scenario of comparatively high greenhouse gas emissions, Clim. Change, 109, 33, https://doi.org/10.1007/s10584-011-0149-y, 2011. a
Ritchie, J. and Dowlatabadi, H.: Why do climate change scenarios return to coal?, Energy, 140, 1276–1291, https://doi.org/10.1016/j.energy.2017.08.083, 2017. a
Schwalm, C. R., Glendon, S., and Duffy, P. B.: RCP8.5 tracks cumulative CO2 emissions, P. Natl. Acad. Sci. USA, 117, 19656–19657, https://doi.org/10.1073/pnas.2007117117, 2020a. a
Schwalm, C. R., Glendon, S., and Duffy, P. B.: Reply to Hausfather and Peters: RCP8.5 is neither problematic nor misleading, P. Natl. Acad. Sci. USA, 117, 27793–27794, https://doi.org/10.1073/pnas.2018008117, 2020b. a
Silva, R. A., West, J. J., Zhang, Y., Anenberg, S. C., Lamarque, J.-F., Shindell, D. T., Collins, W. J., Dalsoren, S., Faluvegi, G., Folberth, G., Horowitz, L. W., Nagashima, T., Naik, V., Rumbold, S., Skeie, R., Sudo, K., Takemura, T., Bergmann, D., Cameron-Smith, P., Cionni, I., Doherty, R. M., Eyring, V., Josse, B., MacKenzie, I. A., Plummer, D., Righi, M., Stevenson, D. S., Strode, S., Szopa, S., and Zeng, G.: Global premature mortality due to anthropogenic outdoor air pollution and the contribution of past climate change, Environ. Res. Lett., 8, 034005, https://doi.org/10.1088/1748-9326/8/3/034005, 2013. a, b
Silva, R. A., Adelman, Z., Fry, M. M., and West, J. J.: The Impact of Individual Anthropogenic Emissions Sectors on the Global Burden of Human Mortality due to Ambient Air Pollution, Environ. Health Persp., 124, 1776–1784, https://doi.org/10.1289/EHP177, 2016a. a, b, c, d
Silva, R. A., West, J. J., Lamarque, J.-F., Shindell, D. T., Collins, W. J., Dalsoren, S., Faluvegi, G., Folberth, G., Horowitz, L. W., Nagashima, T., Naik, V., Rumbold, S. T., Sudo, K., Takemura, T., Bergmann, D., Cameron-Smith, P., Cionni, I., Doherty, R. M., Eyring, V., Josse, B., MacKenzie, I. A., Plummer, D., Righi, M., Stevenson, D. S., Strode, S., Szopa, S., and Zengast, G.: The effect of future ambient air pollution on human premature mortality to 2100 using output from the ACCMIP model ensemble, Atmos. Chem. Phys., 16, 9847–9862, https://doi.org/10.5194/acp-16-9847-2016, 2016b. a
Silva, R. A., West, J. J., Lamarque, J.-F., Shindell, D. T., Collins, W. J., Faluvegi, G., Folberth, G. A., Horowitz, L. W., Nagashima, T., Naik, V., Rumbold, S. T., Sudo, K., Takemura, T., Bergmann, D., Cameron-Smith, P., Doherty, R. M., Josse, B., MacKenzie, I. A., Stevenson, D. S., and Zeng, G.: Future global mortality from changes in air pollution attributable to climate change, Nat. Clim. Change, 7, 647–651, https://doi.org/10.1038/nclimate3354, 2017. a, b
Stockwell, W. R., Kirchner, F., Kuhn, M., and Seefeld, S.: A new mechanism for regional atmospheric chemistry modeling, J. Geophys. Res.-Atmos., 102, 25847–25879, https://doi.org/10.1029/97JD00849, 1997. a
Tarín-Carrasco, P., Morales-Suárez-Varela, M., Im, U., Brandt, J., Palacios-Peña, L., and Jiménez-Guerrero, P.: Isolating the climate change impacts on air-pollution-related-pathologies over central and southern Europe – a modelling approach on cases and costs, Atmos. Chem. Phys., 19, 9385–9398, https://doi.org/10.5194/acp-19-9385-2019, 2019. a, b, c, d, e
Tarín-Carrasco, P., Im, U., Geels, C., Palacios-Peña, L., and Jiménez-Guerrero, P.: Contribution of fine particulate matter to present and future premature mortality over Europe: A non-linear response, Environ. Int., 153, 106517, https://doi.org/10.1016/j.envint.2021.106517, 2021. a, b, c, d
Ukhov, A., Ahmadov, R., Grell, G., and Stenchikov, G.: Improving dust simulations in WRF-Chem v4.1.3 coupled with the GOCART aerosol module, Geosci. Model Dev., 14, 473–493, https://doi.org/10.5194/gmd-14-473-2021, 2021. a
United Nations: Department of Economic and Social Affairs Population Dynamics, https://population.un.org/wpp/ (last access: 19 November 2021), 2020. a
van Donkelaar, A., Martin, R. V., Brauer, M., Hsu, N. C., Kahn, R. A., Levy, R. C., Lyapustin, A., Sayer, A. M., and Winker, D. M.: Global Estimates of Fine Particulate Matter using a Combined Geophysical-Statistical Method with Information from Satellites, Models, and Monitors, Environ. Sci. Technol., 50, 3762–3772, https://doi.org/10.1021/acs.est.5b05833, 2016. a
Vedal, S., Han, B., Xu, J., Szpiro, A., and Bai, Z.: Design of an air pollution monitoring campaign in beijing for application to cohort health studies, Int. J. Env. Res. Pub. He., 14, 1580, https://doi.org/10.3390/ijerph14121580, 2017. a
World Health Organization: Review of evidence on health aspects of air pollution – REVIHAAP Project: Technical Report, World Health Organization, p. 301, https://doi.org/10.1007/BF00379640, 2013. a, b