the Creative Commons Attribution 4.0 License.
the Creative Commons Attribution 4.0 License.
 | 25 Feb 2022
Primary and secondary ice production: interactions and their relative importance
Xiaohong Liu
A discrepancy of up to 5 orders of magnitude between ice crystal and ice nucleating particle (INP) number concentrations was found in the measurements, indicating the potentially important role of secondary ice production (SIP) in the clouds. However, the interactions between primary and SIP processes and their relative importance remain unexplored. In this study, we implemented five different ice nucleation schemes as well as physical representations of SIP processes (i.e., droplet shattering during rain freezing, ice-ice collisional break-up, and rime splintering) in the Community Earth System Model version 2 (CESM2). We ran CESM2 in the single column mode for model comparisons with the DOE Atmospheric Radiation Measurement (ARM) Mixed-Phase Arctic Cloud Experiment (M-PACE) observations.
We found that the model experiments with aerosol-aware ice nucleation schemes and SIP processes yield the best simulation results for the M-PACE single-layer mixed-phase clouds. We further investigated the relative importance of ice nucleation and SIP to ice number and cloud phase as well as interactions between ice nucleation and SIP in the M-PACE single-layer mixed-phase clouds. Our results show that SIP contributes 80 % to the total ice formation and transforms ∼30 % of pure liquid-phase clouds simulated in the model experiments without considering SIP into mixed-phase clouds. The SIP is not only a result of ice crystals produced from ice nucleation, but also competes with the ice nucleation by reducing the number concentrations of cloud droplets and cloud-borne dust INPs. Conversely, strong ice nucleation also suppresses SIP by glaciating mixed-phase clouds and thereby reducing the amount of precipitation particles (rain and graupel).
- Article
(5336 KB) - Full-text XML
-
Supplement
(7765 KB) - BibTeX
- EndNote


Ice crystals significantly impact microphysical and radiative properties of mixed-phase clouds (Korolev and Isaac, 2003; Korolev et al., 2017; Morrison et al., 2012), which further impact the earth's energy budgets. Ice particles in mixed-phase clouds with temperatures between about −38 and 0 ∘C can be formed via heterogeneous ice nucleation on ice nucleating particles (INPs) or arisen through secondary ice production (SIP) (Kanji et al., 2017; Field et al., 2017). Ice crystals that fall from overlying cirrus clouds can provide another source of ice in mixed-phase clouds. There are three identified heterogeneous ice nucleation mechanisms, namely, contact, deposition, and immersion freezing. Dust is generally considered as the most effective INPs for heterogeneous ice nucleation at temperatures below about −15 ∘C (Hoose et al., 2008; Atkinson et al., 2013; Kanji et al., 2017). SIP processes generate additional ice crystals, often involving the primary ice. Several SIP mechanisms have been suggested: rime splintering, also known as the Hallett–Mossop (HM) process, droplet shattering during rain freezing (FR), ice-ice collisional break-up (IIC), and fragmentation during the sublimation of an ice bridge (Field et al., 2017; Korolev et al., 2020). In addition, other microphysical processes, such as rain formation, ice growth, and ice sedimentation are important for mixed-phase cloud properties (Mülmenstädt et al., 2021; Tan and Storelvmo, 2016). Regarding ice-related microphysical processes in mixed-phase clouds, some processes, including riming, accretion, and the Wegener–Bergeron–Findeisen (WBF) process can increase the ice mass mixing ratios while others have no effect on ice crystal number concentrations (ICNCs). On the other hand, some processes such as ice aggregational growth decrease the ICNCs while others have no impact on the ice mass mixing ratios.
A systematically measured discrepancy by up to 5 orders of magnitude between the ICNCs and INP number concentrations has been reported in previous studies (Mossop, 1985; Lasher-Trapp et al., 2016; Field et al., 2017), indicating the existence of additional ice production mechanisms to the primary ice production (PIP) or ice nucleation. Moreover, a strong increase in ICNCs over INP number concentrations may suggest that the PIP would be less important once the SIP processes take place in the clouds. However, the relative importance between PIP and SIP to the ice formation in mixed-phase clouds is largely unknown and warrants further investigation.
Previous studies have identified the potential role of PIP in initiating the SIP based on measurements and idealized parcel model simulations. Sullivan et al. (2018) found that clouds with INP concentrations from 0.002 to 0.15 L−1 can initiate the IIC fragmentation to produce enough ice crystals based on parcel model simulations. They also indicated that higher INP concentrations enhance the IIC and HM process rates, while the FR rate is not dependent on the INP concentration. Huang et al. (2017) suggested that a number concentration as low as 0.01 L−1 for primary ice is sufficient to generate secondary ice though the HM process in the cumulus clouds observed over the British Isles during the Ice and Precipitation Initiation in Cumulus (ICEPIC) campaign. Crawford et al. (2012) found that a small amount of primary ice (0.01 L−1) could produce enough ice crystals with concentrations up to 100 L−1 through the SIP processes in a shallow convective cloud over the UK. Beard (1992) found that the droplet shattering can be initiated by primary ice with a number concentration of ∼0.001 L−1 in the measurement of a warm-base convective cloud. Despite the above progress, many questions remain unexplored for the Arctic mixed-phase stratus clouds, e.g., whether PIP always promotes the SIP and how SIP influences the PIP.
SIP is not only a result of PIP, but also can interact with and may even suppress the subsequent PIP. A previous study indicated a 40 % decrease of heterogeneous ice nucleation after implementing the SIP into a model (Phillips et al., 2017b), because some of the mixed-phase clouds with weak ascents and low humidities are fully glaciated and become ice-only phase. The influence of SIP processes on PIP is far less investigated compared to the limited studies of PIP influence on the SIP.
The goal of this study is to investigate the relative importance of PIP and SIP to ICNCs and their interactions in the Arctic mixed-phase stratus clouds. We are attempting to address the following scientific questions: is the PIP still important for ICNCs once the SIP processes take place? What effect does the PIP have on the SIP processes? Once happening, how do the SIP processes affect the following PIP through the cloud microphysical processes? This paper is organized as follows. Section 2 introduces the model and the model parameterizations used in this study. Section 3 describes the model set-up and model experiments. Section 4 presents the model results and comparison with observations. The main findings of this study are summarized in Section 5.
2.1 Model description
This study uses the Community Atmosphere Model version 6 (CAM6), the atmosphere component of the Community Earth System Model version 2 (CESM2) (Danabasoglu et al., 2020) for all the model experiments. In CAM6, the cloud microphysics are represented by the version 2 of a double-moment scheme (Gettelman and Morrison, 2015, hereafter as MG2), which predicts mass mixing ratios and number concentrations of four categories of hydrometeors: cloud droplet, cloud ice, rain, and snow. Graupel is not considered in the default CAM6 with MG2 microphysics. Furthermore, the MG scheme only treats the HM process among various SIPs. The aerosol properties and processes are represented by the four-mode version of the Model Aerosol Module (MAM4) (Liu et al., 2012, 2016). Ice nucleation in cirrus clouds considers the homogeneous freezing of sulfate droplets and heterogeneous freezing of dust (Liu and Penner, 2005), while the classical nucleation theory (CNT) is used to treat the heterogeneous ice nucleation in mixed-phase cloud regimes (Wang et al., 2014; Hoose et al., 2010).
In our previous study (Zhao et al., 2021a), we have implemented the parameterizations (Phillips et al., 2017a, 2018) of the two new SIP processes: FR and IIC (without graupel involved) into CAM6 via an emulated bin framework. The graupel related IIC was further included in CAM6 (Zhao and Liu, 2021), with the graupel amount diagnosed following Zhao et al. (2017). In this study, we compare several different ice nucleation schemes in CAM6 to examine the relative importance and interactions between PIP and SIP in the Arctic mixed-phase clouds.
2.2 Ice nucleation parameterization
2.2.1 CNT scheme
The default CAM6 uses the CNT (classical nucleation theory) scheme for treating the ice nucleation in mixed-phase clouds. CNT is a “stochastic” scheme which calculates the ice nucleation rates from deposition, contact, and immersion freezing of cloud droplets, depending on the surface areas and contact angles of cloud-borne dust and black carbon (BC) particles. The contact angle is used as a proxy for the ice nucleation efficiency on INPs. CNT is formulated based on Hoose et al. (2010) and implemented in CAM by Wang et al. (2014) with further improvements using a probability density function (PDF) of contact angle instead of a single contact angle in Hoose et al. (2010).
2.2.2 N12 scheme
Based on laboratory measurements from the Aerosol Interaction and Dynamics in the Atmosphere (AIDA) cloud chamber, Niemand et al. (2012) (hereafter as N12) proposed a surface-active site density-based scheme for the immersion freezing of cloud droplets on dust aerosols. N12 is an empirical scheme that connects the dust INP number concentration to the density of ice-active surface sites (ns(T)) at a given temperature T(K), total number concentration of dust aerosols (Ntot, L−1), and dust particle surface area (Sae, m2). The dust INP number concentration (L−1) in N12 is calculated as
in which Sae is calculated based on the dry diameter of dust particles, and ns(T) (m−2) is calculated following:
2.2.3 D15 scheme
An empirical scheme for the immersion freezing of cloud droplets on dust aerosols was developed by considering dust particles with sizes larger than 0.5 µm (DeMott et al., 2015), hereafter referred to as D15. This scheme argues that dust particles smaller than 0.5 µm may not be efficient INPs (DeMott et al., 2010, 2015). D15 was developed as a combination of field campaign and laboratory data measured by the continuous flow diffusion chamber (CFDC) and the Aerosol Interactions and Dynamics of the Atmosphere (AIDA) cloud chamber. The field campaign data were obtained during the 2007 Pacific Dust Experiment (PACDEX) on the NSF/NCAR G-V aircraft over the Pacific Ocean basin (Stith et al., 2009), and the 2011 Ice in Clouds Experiment – Tropical (ICE-T) on the NSF/NCAR C-130 aircraft flown from St. Croix, US Virgin Islands (Heymsfield and Willis, 2014). The dust INP number concentration (per standard Liter; normalized to the standard temperature of 273 K and pressure of 1013 hPa) in D15 is calculated as:
in which n0.5 is the number concentration (per standard cm−3) of dust particles with diameters larger than 0.5 µm, and the parameters a=3, b=1.25, , and d=11.6.
2.2.4 B53 scheme
Bigg (1953) proposed a volume-dependent immersion freezing scheme, hereafter referred to as the B53 scheme. In this scheme, the number concentration of frozen cloud droplets with a diameter D is given as:
in which is the ice number production rate (kg−1s−1), T is the environmental temperature in unit of K, T0=273.15 K, A=0.66 and B=100, and Nc(D) is the number mixing ratio of cloud droplets (kg−1) with a diameter D (unit : m).
2.2.5 M92 scheme
An empirical temperature dependent scheme was developed based on measurements in the Northern Hemisphere midlatitudes by using a continuous-flow diffusion chamber (CFDC) (Meyers et al., 1992), hereafter referred to as M92. The INP number concentration (L−1) is calculated as:
in which , b=0.1296, and esl and esi are the saturation vapor pressures with respect to liquid and ice, respectively.
Marine organic aerosols and sea salt are not included as INPs in any of the above ice nucleation parameterizations.
2.3 Graupel parameterization
The graupel mass mixing ratio (qg) is diagnosed as precipitation ice mass (currently snow, qs) multiplied by the rimed mass fraction Ri (Zhao et al., 2017):
The rimed mass fraction Ri is calculated as:
qc, qi, and qs in Eq. (7) are modeled cloud water, cloud ice, and snow mixing ratios (kg kg−1), respectively. The graupel number is assumed to have the same ratio to snow number as the ratio of graupel mass to snow mass.
The CAM6 model was set up with the Single Column Atmospheric Model (SCAM) configuration. SCAM is an efficient approach to understand the physical processes in the model without the impact from nonlinear interactions with dynamic processes (Gettelman et al., 2019a). In SCAM, aerosols are initialized with monthly averaged profiles for different aerosol types (sulfate, BC, particulate organic matter, secondary organic aerosol, dust, and sea salt) at a given location, which are derived from a present-day CAM6 climatological simulation. Aerosol processes are fully represented in SCAM, including emission, transport, chemistry, dry and wet scavenging, and aerosol-radiation and aerosol-cloud interactions (Liu et al., 2012, 2016). For example, the interstitial aerosols will be activated to become the cloud-borne aerosols once cloud droplets are nucleated in the cloud microphysics. The cloud-borne aerosols will be released to the interstitial aerosols once cloud droplets evaporate, which can be reactivated when cloud droplets are nucleated. The simulated aerosols are relaxed to a monthly averaged profile, and temperature and horizontal winds to the large-scale forcing data every 3 hours. More details about the model set-up and the large-scale forcing data used to drive the model experiments can be found in Zhao et al. (2021a).
This study focuses on the Arctic mixed-phase clouds observed during the Department of Energy (DOE)'s Atmospheric Radiation Program (ARM) Mixed-Phase Arctic Cloud Experiment (M-PACE), which was conducted in the North Slope of Alaska in October 2004 (Verlinde et al., 2007). In the study four major cloud regimes were identified during M-PACE, i.e., the multilayer stratiform cloud period (6–8 October 2004), the single-layer boundary-layer stratiform cloud period (9–12 October), the transition cloud period (16 October), and the frontal cloud period (18–20 October).
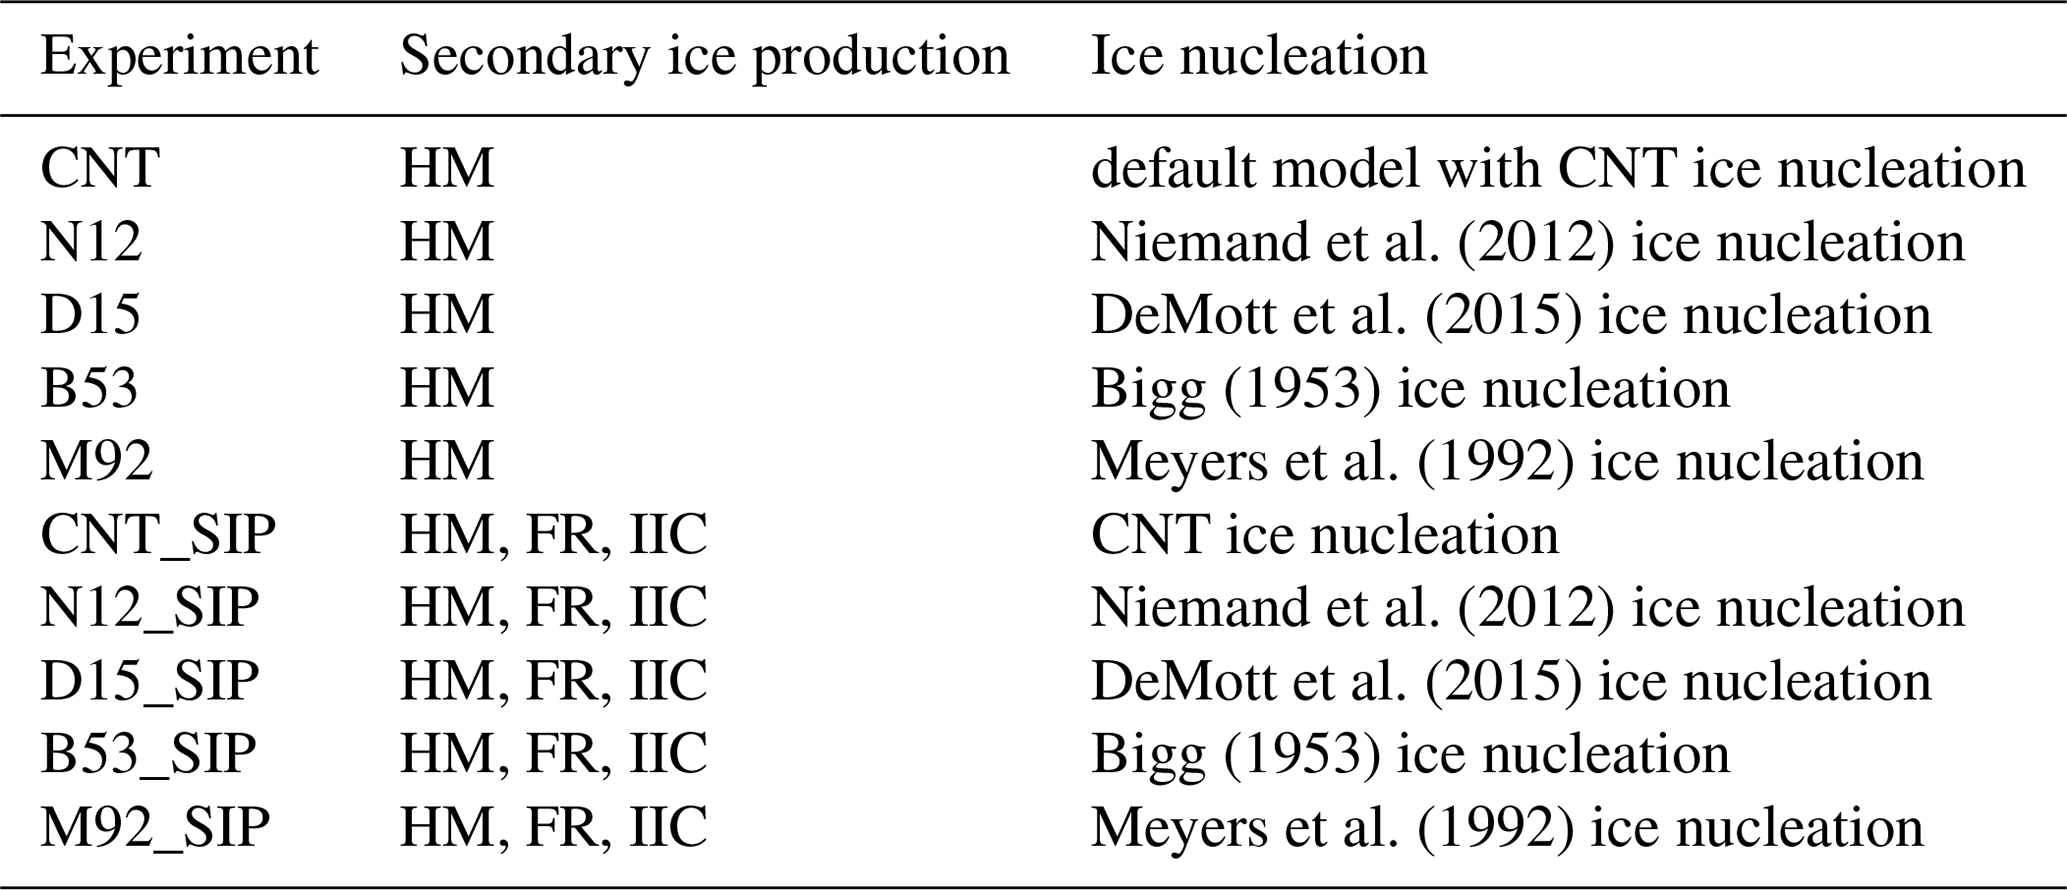
Several SCAM model experiments are conducted in this study (Table 1), covering the whole M-PACE period from 5 to 22 October 2004. The CNT experiment uses the default CAM6 model with the MG scheme, in which only HM is considered for SIP. The ice nucleation is treated by the CNT scheme. The N12, D15, B53, and M92 experiments are the same as the CNT experiment except using the respective ice nucleation scheme to replace the CNT scheme for the immersion freezing (Sect. 2.2). The deposition and contact ice nucleation are still based on the CNT scheme in the N12 and D15 experiments, and based on Meyers et al. (1992) and Young (1974), respectively in the B53 and M92 experiments. The impacts of other SIP mechanisms in addition to HM, i.e., FR and IIC, are addressed in the CNT_SIP experiment. To evaluate the SIP sensitivity to ice nucleation, four additional experiments with different ice nucleation schemes are conducted, and these experiments are named as N12_SIP, D15_SIP, B53_SIP, and M92_SIP.
The model simulations are compared against the M-PACE observations. The ice water path (IWP) and liquid water path (LWP) are based on ground-based remote sensing observations provided by Zhao et al. (2021a) with uncertainties within one order of magnitude (Dong and Mace, 2003; Shupe et al., 2005; Deng and Mace, 2006; Turner et al., 2007; Wang, 2007; Khanal and Wang, 2015). The INP concentrations are based on in situ observations by a CFDC on board an aircraft (Prenni et al., 2007). The ICNCs and cloud phase are based on in situ observations and provided by McFarquhar et al. (2007). However, the ICNCs were measured before anti-shattering algorithms were developed to remove the shattered particles for the 2DC cloud probe. To remove the shattering effect, the ICNCs observed by M-PACE were scaled by a factor of , as Jackson and McFarquhar (2014) and Jackson et al. (2014) suggested an averaged reduction of ICNCs by 1–4.5 times in other field campaigns which adopted the anti-shattering algorithms and also used the 2DC cloud probe. A different scaling factor of is applied to the observed ICNCs, which increases the observed ICNCs by a factor of 2 (Fig. S3 in the Supplement). The underestimation of ICNCs by the model experiments with only ice nucleation (CNT, N12 and D15) is even worse and our conclusion regarding model and observation comparison of ICNCs is not changed. Since the measurements cannot distinguish snow from cloud ice, the simulated ICNC, IWP, and IWC all include the snow component for the comparison with observations.
4.1 Overview of modeled clouds during M-PACE
The simulated LWP and IWP are compared with observations in Figs. 1 and S1 in the Supplement. First, SIP processes have a varied impact on modeled LWP and IWP, depending on ice nucleation. In the SIP experiments with the CNT, N12, and D15 ice nucleation schemes, simulated IWP is increased from 5 to 10 g m−2 and LWP is decreased from 156 to 97 g m−2 averaged over the M-PACE period after considering the SIP. In the SIP experiments with the B53 and M92 schemes, however, SIP has a minimal impact on the LWP/IWP. Second, the B53, B53_SIP, M92, and M92_SIP produce the largest IWP (∼12 g m−2 averaged over the M-PACE period), followed by CNT_SIP, N12_SIP, and D15_SIP (∼10 g m−2 averaged over the M-PACE period). The CNT, N12, and D15 experiments produce the smallest IWP (∼5 g m−2 averaged over the M-PACE period). These characteristics are also evident in the vertical profiles of LWC and IWC in Figs. 2 and S2 in the Supplement. It indicates that the B53 and M92 nucleation schemes are highly efficient in forming ice; in comparison, the SIP simulations using CNT/N12/D15 ice nucleation schemes show lower ice production capabilities. The B53, B53_SIP, M92, and M92_SIP experiments generate the closest IWP (∼12 g m−2 averaged over the M-PACE period) compared with the observation (∼64 g m−2). However, these four experiments also show substantially low biases of LWP (∼40 g m−2 compared with 126 g m−2 in the observation averaged over the M-PACE period). As shown in Figs. 1 and S1, the mixed-phase clouds are almost fully glaciated during the single- layer stratus period. Therefore, the CNT_SIP, N12_SIP, and D15_SIP experiments give the best simulation results in terms of LWP and IWP during the M-PACE. Adding the SIP does not change the modeled LWP/LWC and IWP/IWC with the B53 and M92 ice nucleation schemes. On the contrary, SIP decreases the LWP/LWC by 38 % and doubles the IWP/IWC with the CNT, N12, and D15 ice nucleation schemes.
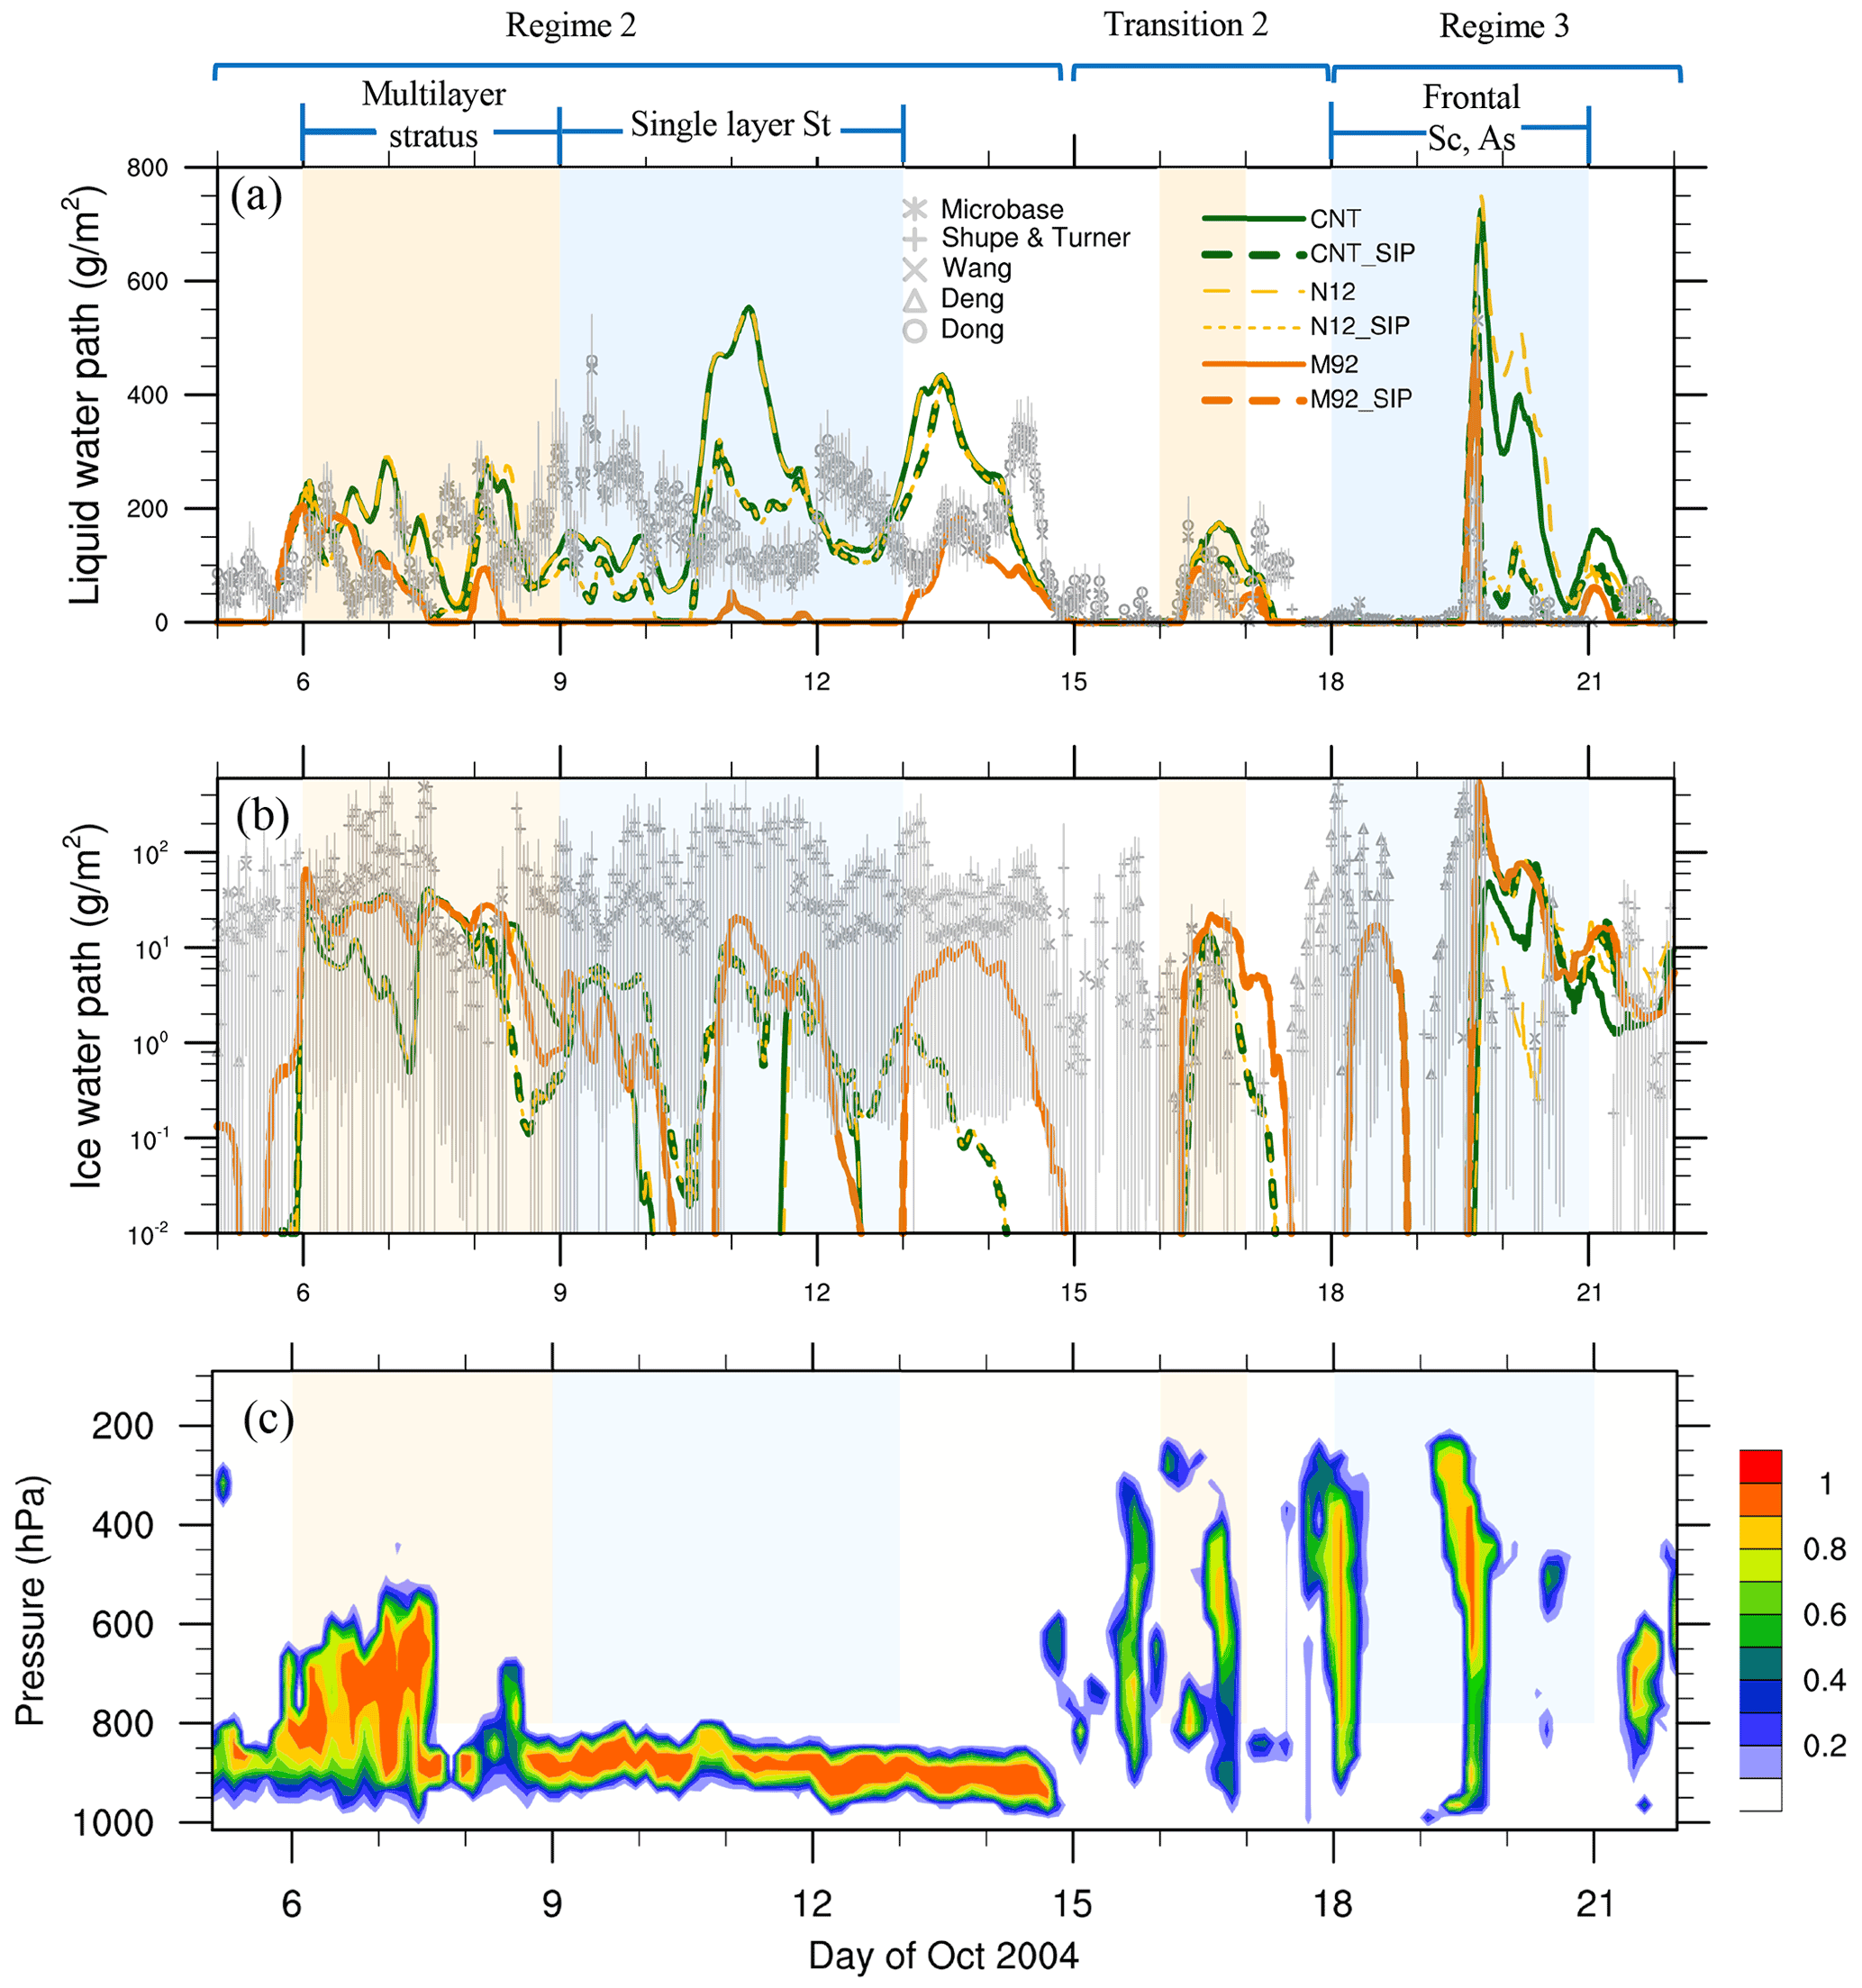
Figure 1Temporal evolution of (a) LWP and (b) IWP from remote sensing retrievals (symbols) and CNT, CNT_SIP, N12, N12_SIP, M92, and M92_SIP experiments (lines); (c) vertical distribution of observed cloud fraction. The light orange shadings show the multilayer stratus and transition periods; light blue shadings show the single-layer stratus and frontal clouds periods. Vertical gray lines represent the standard deviations of retrieval data. Note that N12 (N12_SIP) coincides with CNT (CNT_SIP) during the single-layer stratus cloud period.
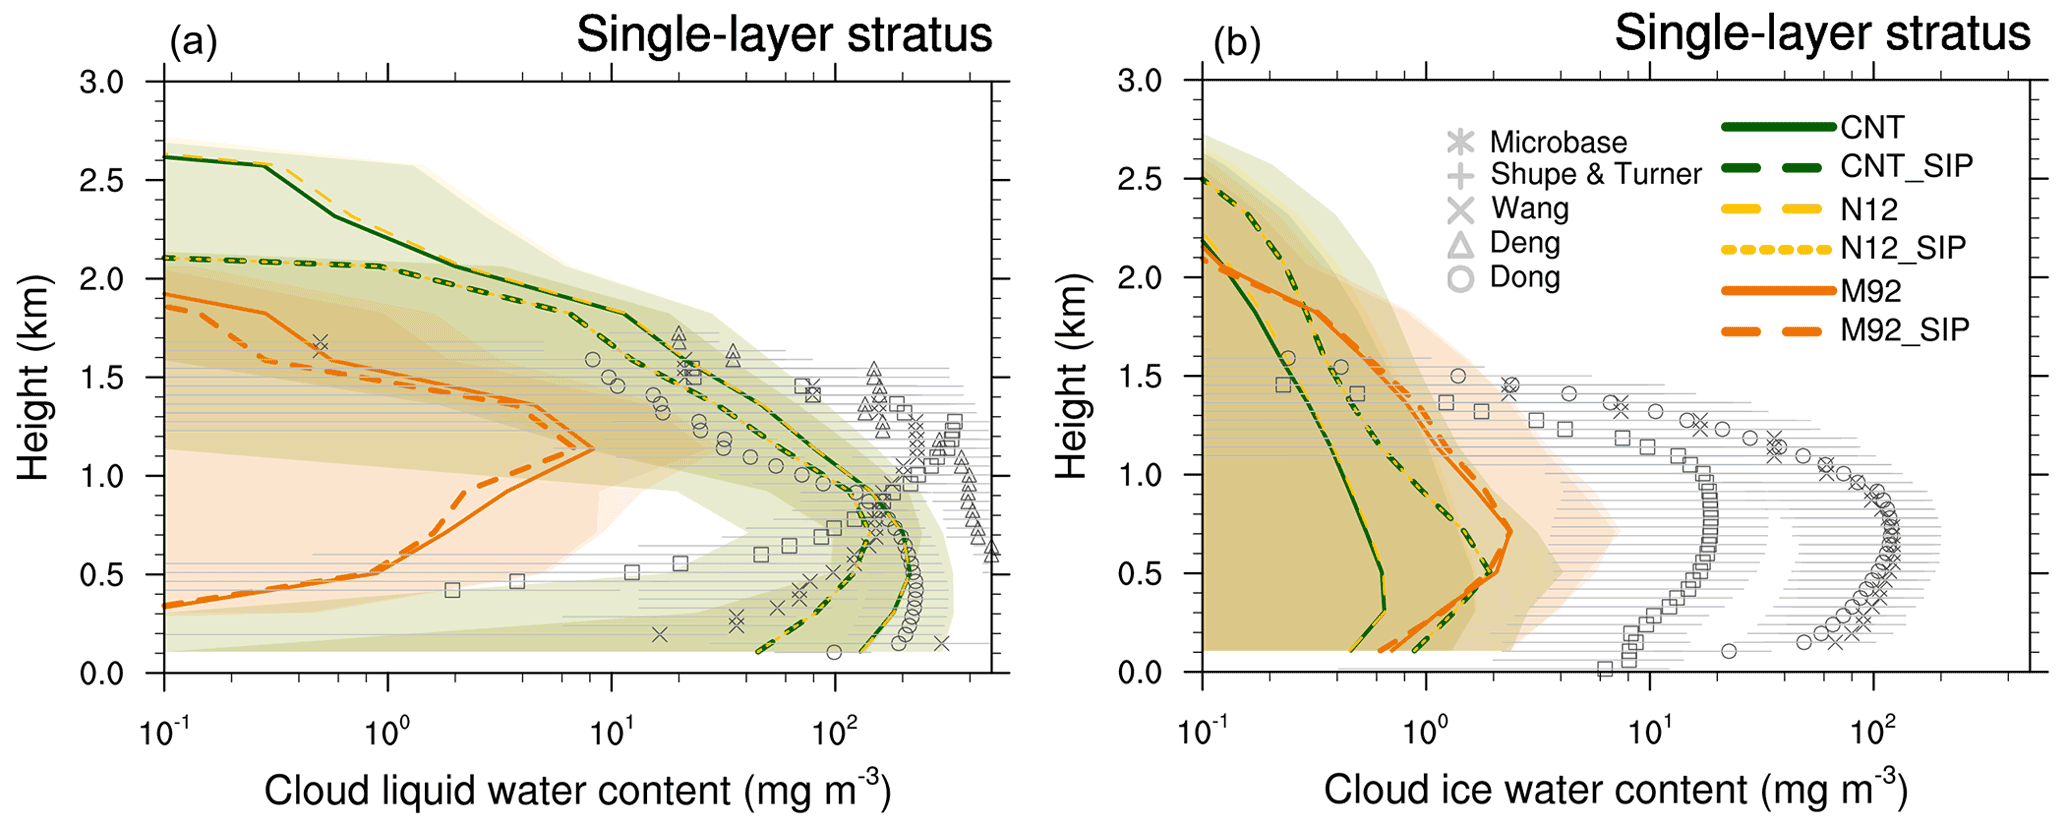
Figure 2Vertical profiles of LWC (a) and IWC (b) during the single-layer mixed-phase cloud period (9–12 October) from CNT, CNT_SIP, N12, N12_SIP, M92, and M92_SIP experiments and from remote sensing retrievals (symbols). Horizontal gray lines represent standard deviations of retrieval data, and colored shadings are standard deviations of model data. Note that N12 (N12_SIP) coincides with CNT (CNT_SIP) during the single layer stratus cloud period.
4.2 PIP and SIP importance for ice number and cloud phase
A comparison between INP number concentrations (NINPs) and ICNCs during 9–12 October is shown in Fig. 3. During this period, a long-lived single-layer mixed-phase cloud occurred at 800–950 hPa, with observed cloud top temperatures of −17∘C (Verlinde et al., 2007). Modeled ICNCs include ice crystals of all sizes, since our purpose here is to compare NINPs with ICNCs. With the empirical ice nucleation schemes (e.g., N12 and D15), there appears to be an inverse relationship between log10(NINPs) and temperature (Fig. 3c, d). However, this relationship is not as clear with the CNT and B53 schemes, and NINPs reduces rapidly at temperatures warmer than −15 ∘C, from L−1 at −17∘C to <10−5 L−1 at −13∘C (Fig. 3b, e). In contrast, NINPs with the aerosol-independent M92 scheme are less variable with temperature, and are 1–7 orders of magnitude higher than that with the aerosol-aware schemes, such as CNT, N12, and D15, particularly at warmer temperatures. We note that the model may significantly underestimate dust burdens in the Arctic regions by 1–2 orders of magnitude (Shi and Liu, 2019) and may miss the representation of other INP sources in the Arctic (e.g., local high-latitude dust, marine and terrestrial biological aerosols).

Figure 3Comparison between INP (blue dots, in unit of L−1) and ice crystal number concentrations (gray dots, in unit of L−1) from (a) observations, (b) CNT_SIP, (c) N12_SIP, (d) D15_SIP, (e) B53_SIP, and (f) M92_SIP experiments. Modeled ice number concentrations include ice crystals of all sizes, since the purpose of this figure is to compare INP number concentrations with ice crystal number concentrations. To account for the anti-shattering tip effect, only ice particles with diameters larger than 100 µm from observations are included in (a), and a correction factor of is also applied to the measured ice crystal number concentrations based on Jackson et al. (2014) and Jackson and McFarquhar (2014). The purpose of this figure is to examine the relative importance between primary ice nucleation and SIP by comparing INP and ice crystal number concentrations. Therefore, all ice sizes are included in the simulation results.
The ice multiplication from the SIP processes can be noted from the results that modeled ICNCs are higher than modeled NINPs in Fig. 3, even when we account for the 1–2 orders of magnitude underestimation of NINPs for these aerosol-aware ice nucleation schemes (CNT, N12 and D15). The model simulation with the aerosol-independent nucleation scheme M92 is an exception (Fig. 3f). However, M92, which was based on the measurements in the Northern Hemisphere mid-latitudes may overestimate the NINPs in the Arctic during the M-PACE (Prenni et al., 2007) comparing NINPs in Fig. 3a, f. Observed NINPs are mostly within the medium range of observed ICNCs (Fig. 3a). However, observed ICNCs only include ice crystals with diameters larger than 100 µm, and thus the actual ambient ICNCs including all size ice crystals can be much higher.
Although these schemes differ in details about temperature and aerosol dependences (Fig. 3), CNT, N12, and D15 predict much lower INP concentrations during M-PACE than those from the B53 and M92 schemes. With these low INP concentrations, the single-layer clouds modeled with the CNT, N12 and D15 schemes have similar cloud states (e.g., dominated by liquid phase) (Figs. 1 and 2). In contrast, B53 and M92 which are only dependent on temperature and not limited by aerosols, predict much higher INP concentrations. With these high INP concentrations, modeled clouds with the B53 and M92 schemes are dominated by ice phase.
Figure 4 shows the vertical distribution of ICNCs in the single-layer mixed-phase clouds during 9–12 October from model simulations and observations. Here, modeled and observed ICNCs only include ice particles with diameters larger than 100 µm. The observed ICNCs, which range mainly between 0.1 and 1 L−1, show a slight decrease with altitude. CNT, N12, and D15 all show rather constant ICNCs with altitude, which are also one order of magnitude lower than the observation. The ICNCs with B53 and M92 are increased compared with CNT, but the vertical ICNC patterns show increasing trends with altitude. As suggested in Morrison et al. (2012), the long-lived Arctic mixed-phase clouds are featured with liquid phase at cloud top and ice phase at cloud bottom. The SIP experiments with CNT, N12, and D15 increase the ICNCs mainly in the lower portion of clouds, and thus improve the agreement with the observed vertical distribution trend of ICNCs. In contrast, SIP causes few changes to the ICNCs when the B53 and M92 schemes are used.
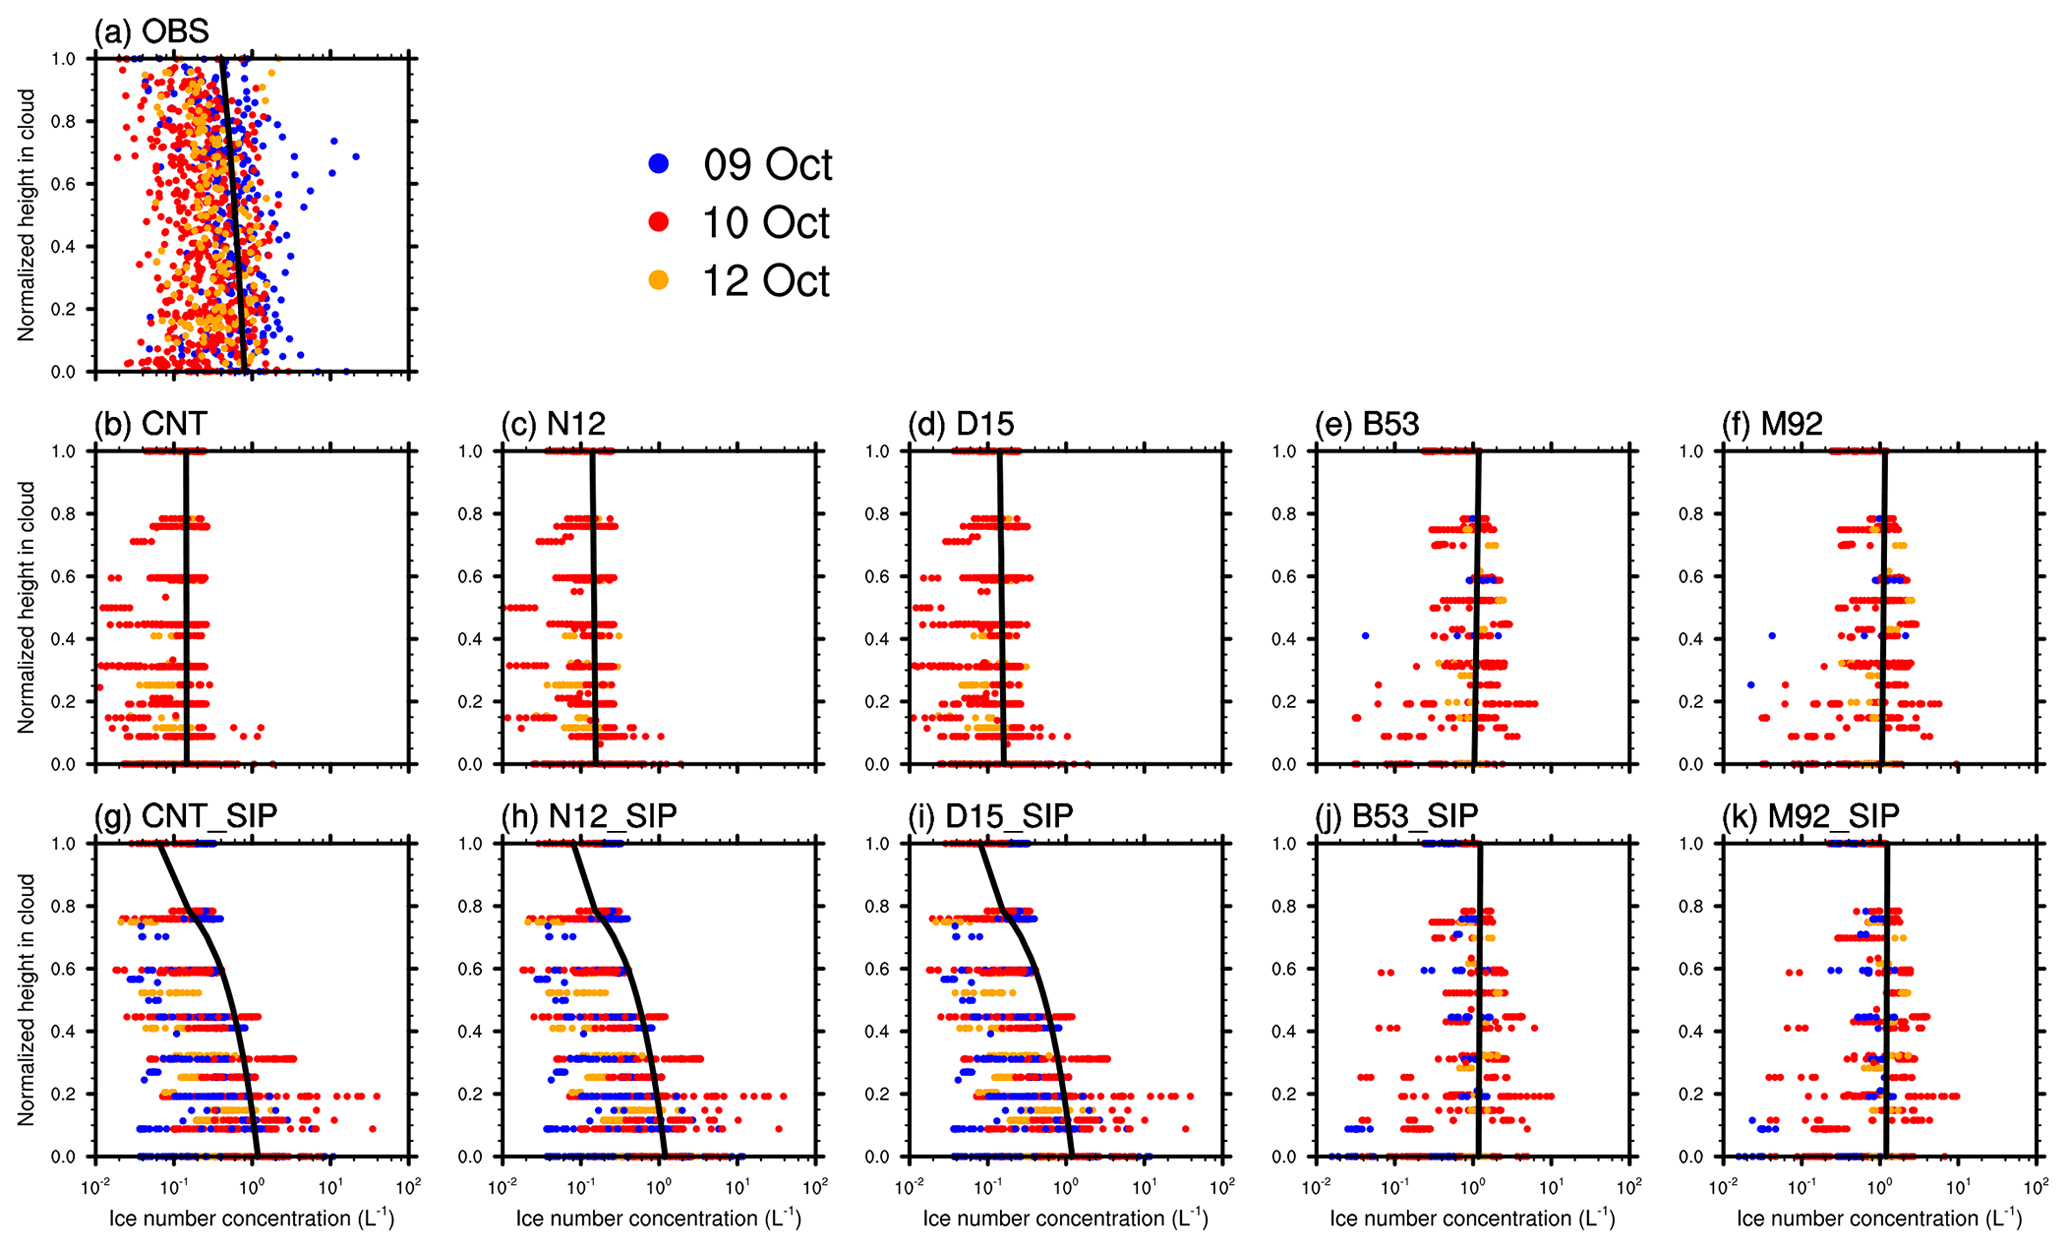
Figure 4Ice crystal number concentrations as a function of normalized cloud height (i.e., 0 for cloud base and 1 for cloud top) from (a) observation, (b) CNT, (c) N12, (d) D15, (e) B53, (f) M92, (g) CNT_SIP, (h) N12_SIP, (i) D15_SIP, (j) B53_SIP, and (k) M92_SIP experiments. Black solid lines show the linear regression between ice number concentration and height. Only ice particles with diameters larger than 100 µm from simulations and observations are included in the comparison. To account for the anti-shattering tip effect, a correction factor of is applied to the measured ice number concentrations based on Jackson et al. (2014) and Jackson and McFarquhar (2014). The cloud base and cloud top used for (a) are provided from in situ observations (McFarquhar et al., 2007), and those used for the model analyses are derived by searching the model layers from the model top to the bottom with modeled total cloud water LWC + IWC >10−6 kg kg−1.
The ICNC in the CNT experiment and ice enhancement ratios of ICNC from the other experiments to that from CNT are shown in Fig. 5. The enhancement ratios are around 1.0 in the N12 and D15 experiments, suggesting that these three ice nucleation schemes (CNT, N12, and D15) produce similar magnitudes of ICNCs. Correspondingly, the ice enhancement ratio patterns in the CNT_SIP, N12_SIP, and D15_SIP experiments show the dominant role of SIP in increasing the ICNCs by up to 4 orders of magnitude. In contrast, the ice enhancement ratios in B53 and M92 are up to 3.4 and 4 orders of magnitude, respectively, suggesting that the B53 and M92 schemes are much more efficient in producing ice particles than CNT, N12, and D15. The ice enhancements in B53_SIP and M92_SIP are mainly contributed from the ice nucleation (B53 and M92) with only a minor contribution from SIP, unlike the N12_SIP and D15_SIP experiments where the ice enhancements are predominantly contributed by SIP.
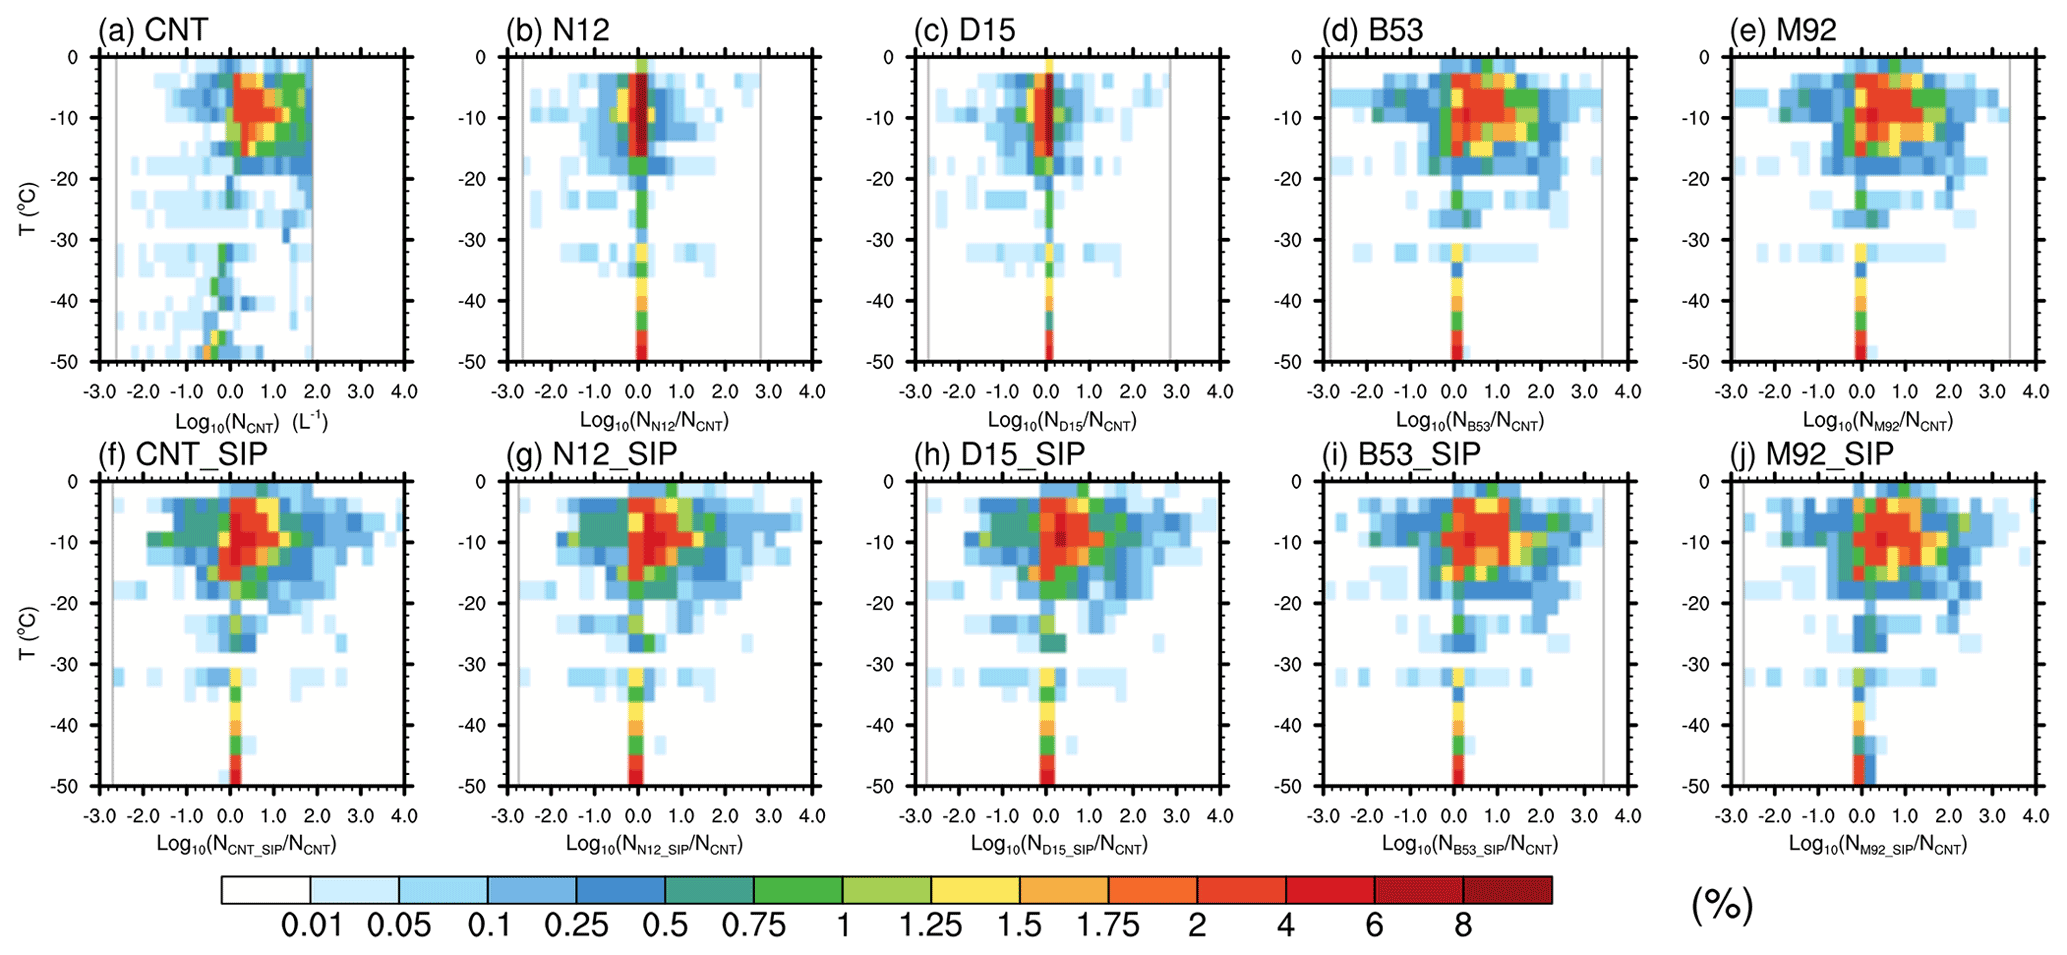
Figure 5Bivariate joint probability density functions (PDF) in terms of both temperature and (a) ice crystal number concentration (L−1) from the CNT experiment, and (b–j) in terms of both temperature and enhancement ratio of ice crystal number concentration from the respective experiment to that from the CNT experiment. A logarithmic scale is used for the x-axis.
Figure 6 shows the vertical distribution of the supercooled liquid fraction (SLF) (defined as LWC/TWC, TWC = LWC + IWC) in the single-layer mixed-phase clouds during 9–12 October from aircraft observations and model simulations. The CNT, N12, and D15 experiments share the similar cloud phase distribution and all overestimate the SLF in clouds with the vertically averaged SLF of 96.25 %, 96.28 %, and 96.26 % in CNT, N12, and D15, respectively, compared to 64.35 % from the observation. On the contrary, the B53 and M92 experiments with more efficient ice nucleation show predominantly ice phase clouds with the vertically averaged SLF of 17.62 % and 16.43 %, respectively, which agree with previous findings (Liu et al., 2011). The experiments with SIP (CNT_SIP, N12_SIP, and D15_SIP) improve the simulated cloud phase by reducing the SLF in the CNT, N12, and D15 experiments, respectively, and the SLF patterns are also similar among these experiments. The SIP transforms ∼30 % of pure liquid-phase clouds simulated in the CNT, N12, and D15 experiments into mixed-phase clouds. The TWC is reduced with the total water path (TWP = LWP + IWP) decreased from 218.5, 219.2, and 219.1 g m−2 in CNT, N12, and D15 to 132.6, 131.0, and 130.8 g m−2 in CNT_SIP, N12_SIP, and D15_SIP, respectively. The SIP causes few changes to the cloud phase simulated in the B53_SIP and M92_SIP experiments, since the clouds are already glaciated by ice crystals nucleated with the B53 and M92 schemes. These findings highlight the “foundation” effect of PIP on the cloud phase. We note that the CNT_SIP, N12_SIP, and D15_SIP experiments overall have the best performance in terms of vertical distribution of ICNCs and cloud phase during the single-layer mixed-phase cloud period.
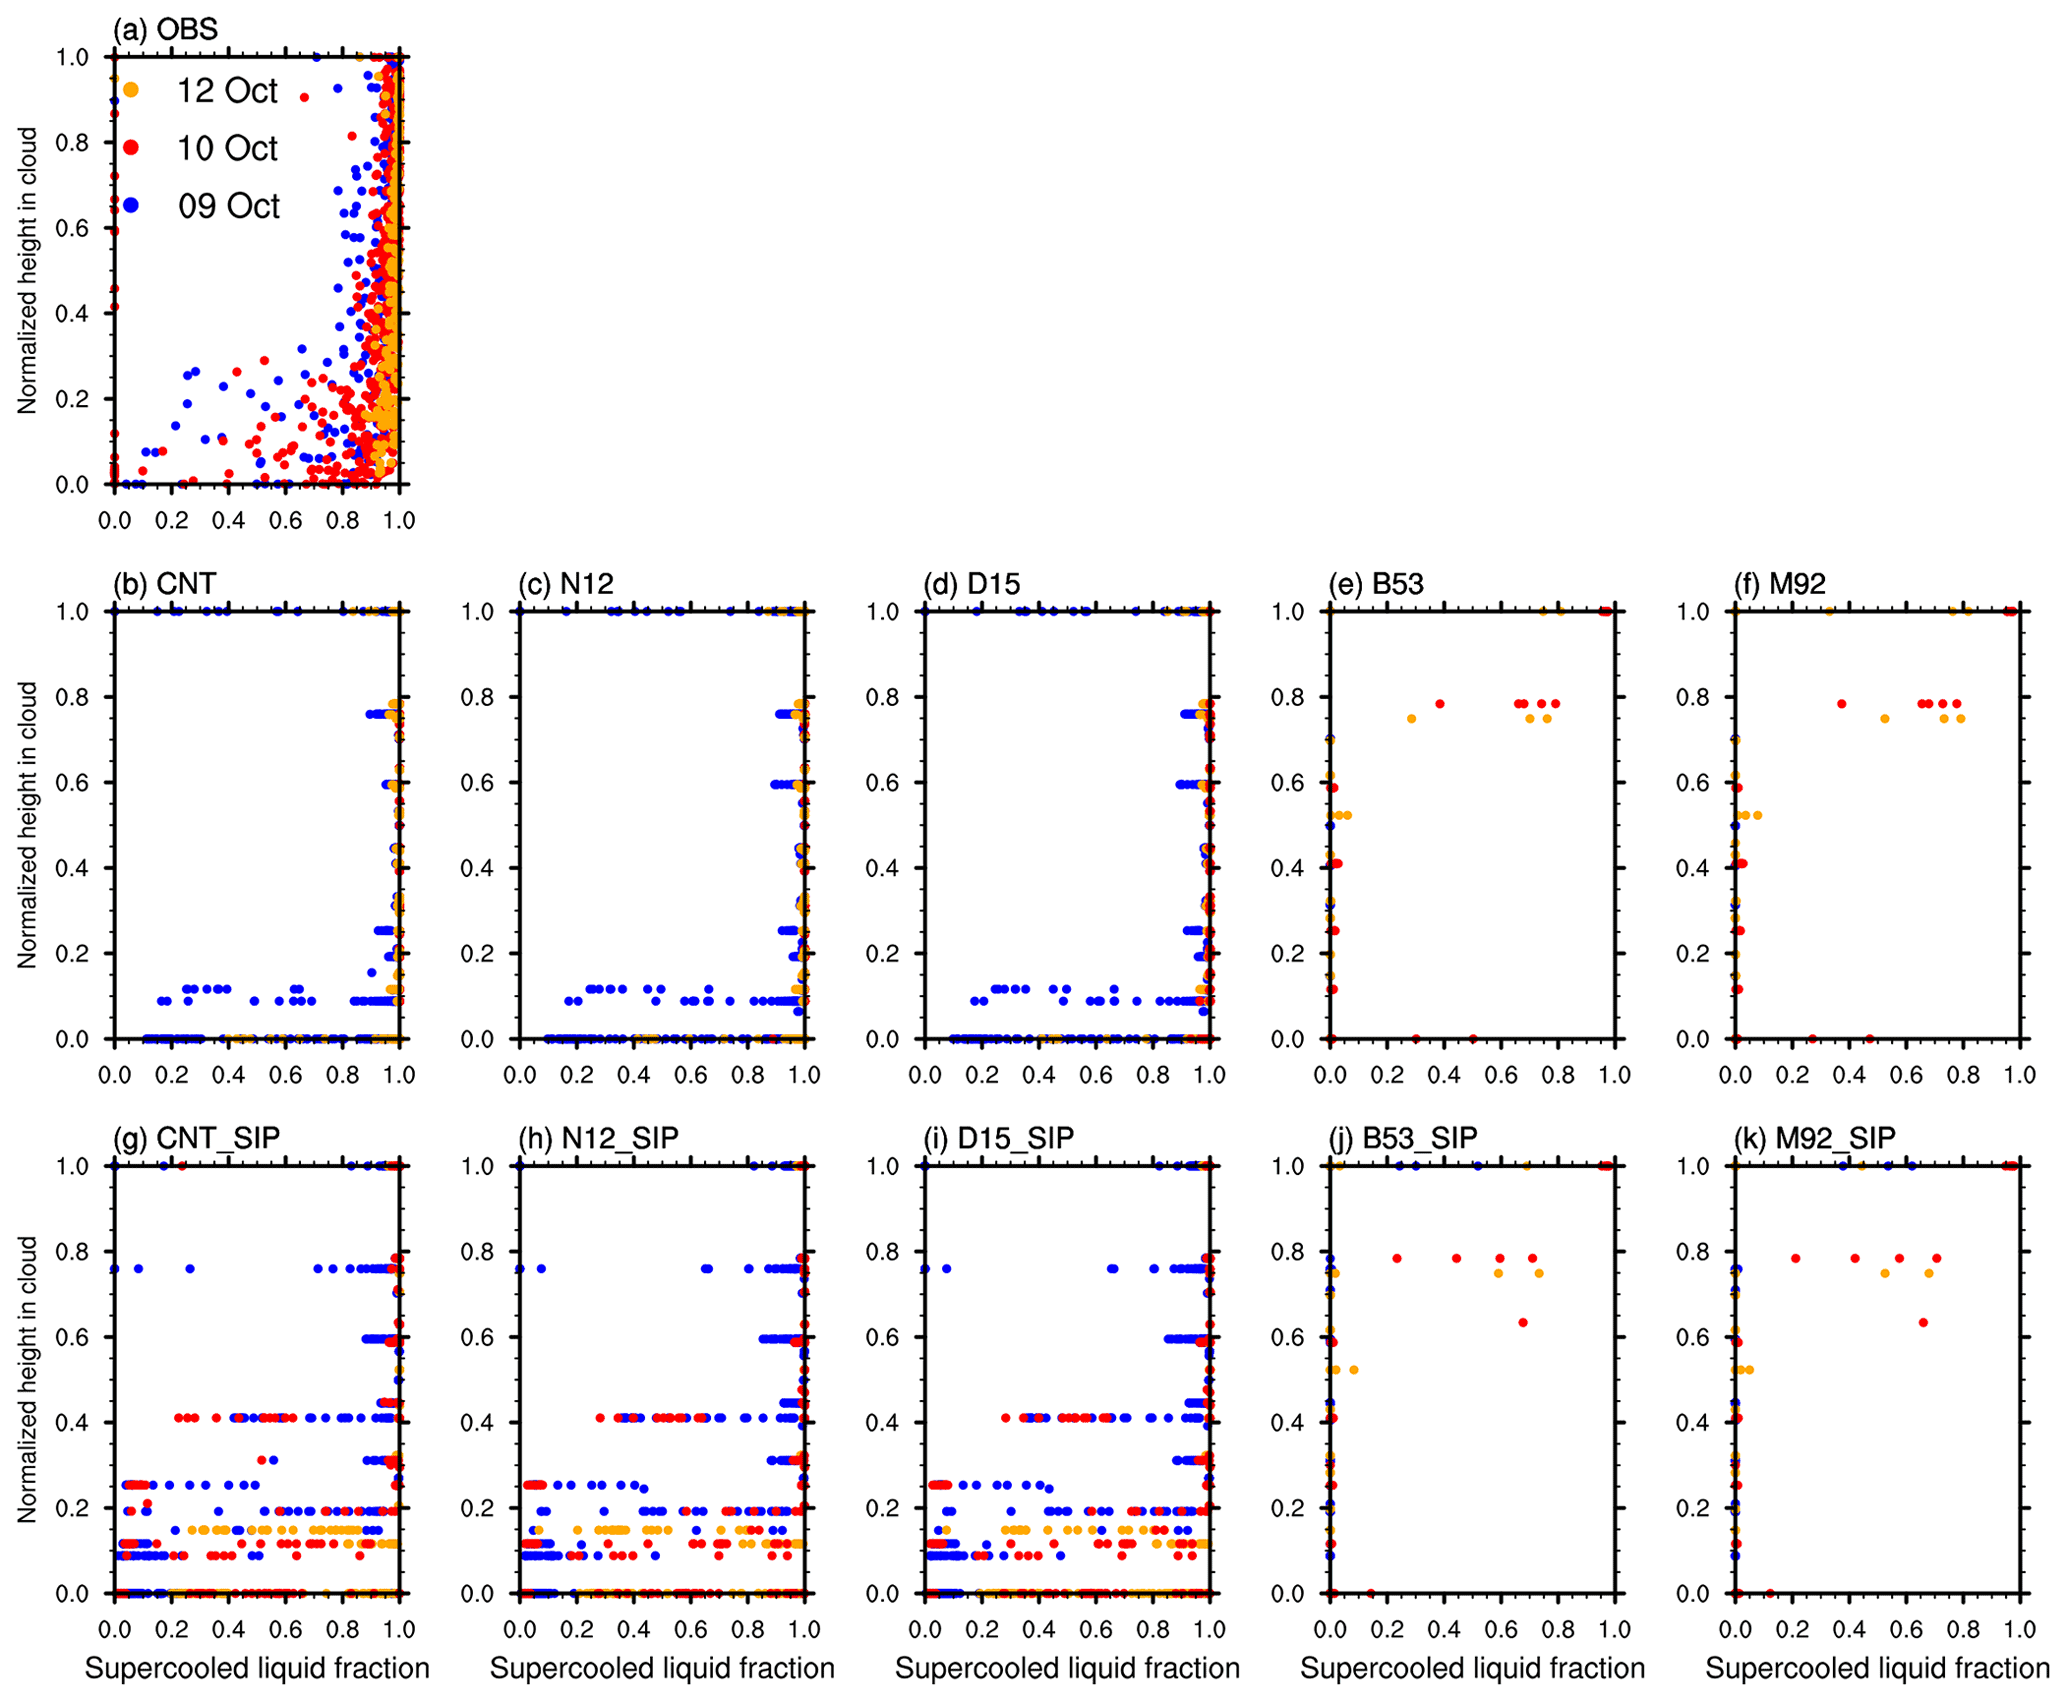
Figure 6Supercooled liquid fraction (defined as LWC (LWC + IWC)) as a function of normalized cloud height (i.e., 0 for cloud base and 1 for cloud top) from observations and model experiments. The cloud base and cloud top used for (a) are provided from in situ observations (McFarquhar et al., 2007), and those used for the model analyses (b–k) are derived by searching the model layers from the model top to the bottom with modeled total cloud water LWC + IWC >10−6 kg kg−1.
Figure 7 show the relative contributions from PIP and SIP processes to the total ice mass production from model experiments with different ice nucleation schemes averaged over different M-PACE periods. The ice mass production rates are calculated by multiplying ice number production rates from parameterizations by the initial mass of an ice particle ( kg). We notice that the CNT_SIP, N12_SIP, and D15_SIP experiments have similar relative contributions between PIP and SIP. The averaged PIP contribution is around 20 % for all the cloud types observed during M-PACE, with the maximum contribution of 60 % for the frontal clouds, and the minimum contribution of 7 % for the single-layer mixed-phase clouds. Moreover, the IIC is the dominant ice production process in these three experiments, with an averaged contribution of 60 %. On the contrary, the B53_SIP and M92_SIP experiments show much larger contributions from PIP, which contributes 65 % and 80 % to the total ice production, respectively, averaged for all the cloud types. However, we note that the unrealistic pure ice-phase clouds simulated in the B53 and M92 experiments imply that the role of ice nucleation in these experiments is overstated. Given that the CNT_SIP, N12_SIP, and D15_SIP experiments give the best performance in simulating ICNCs and cloud phase, their estimates of the relative importance of primary and secondary ice production are more reliable.
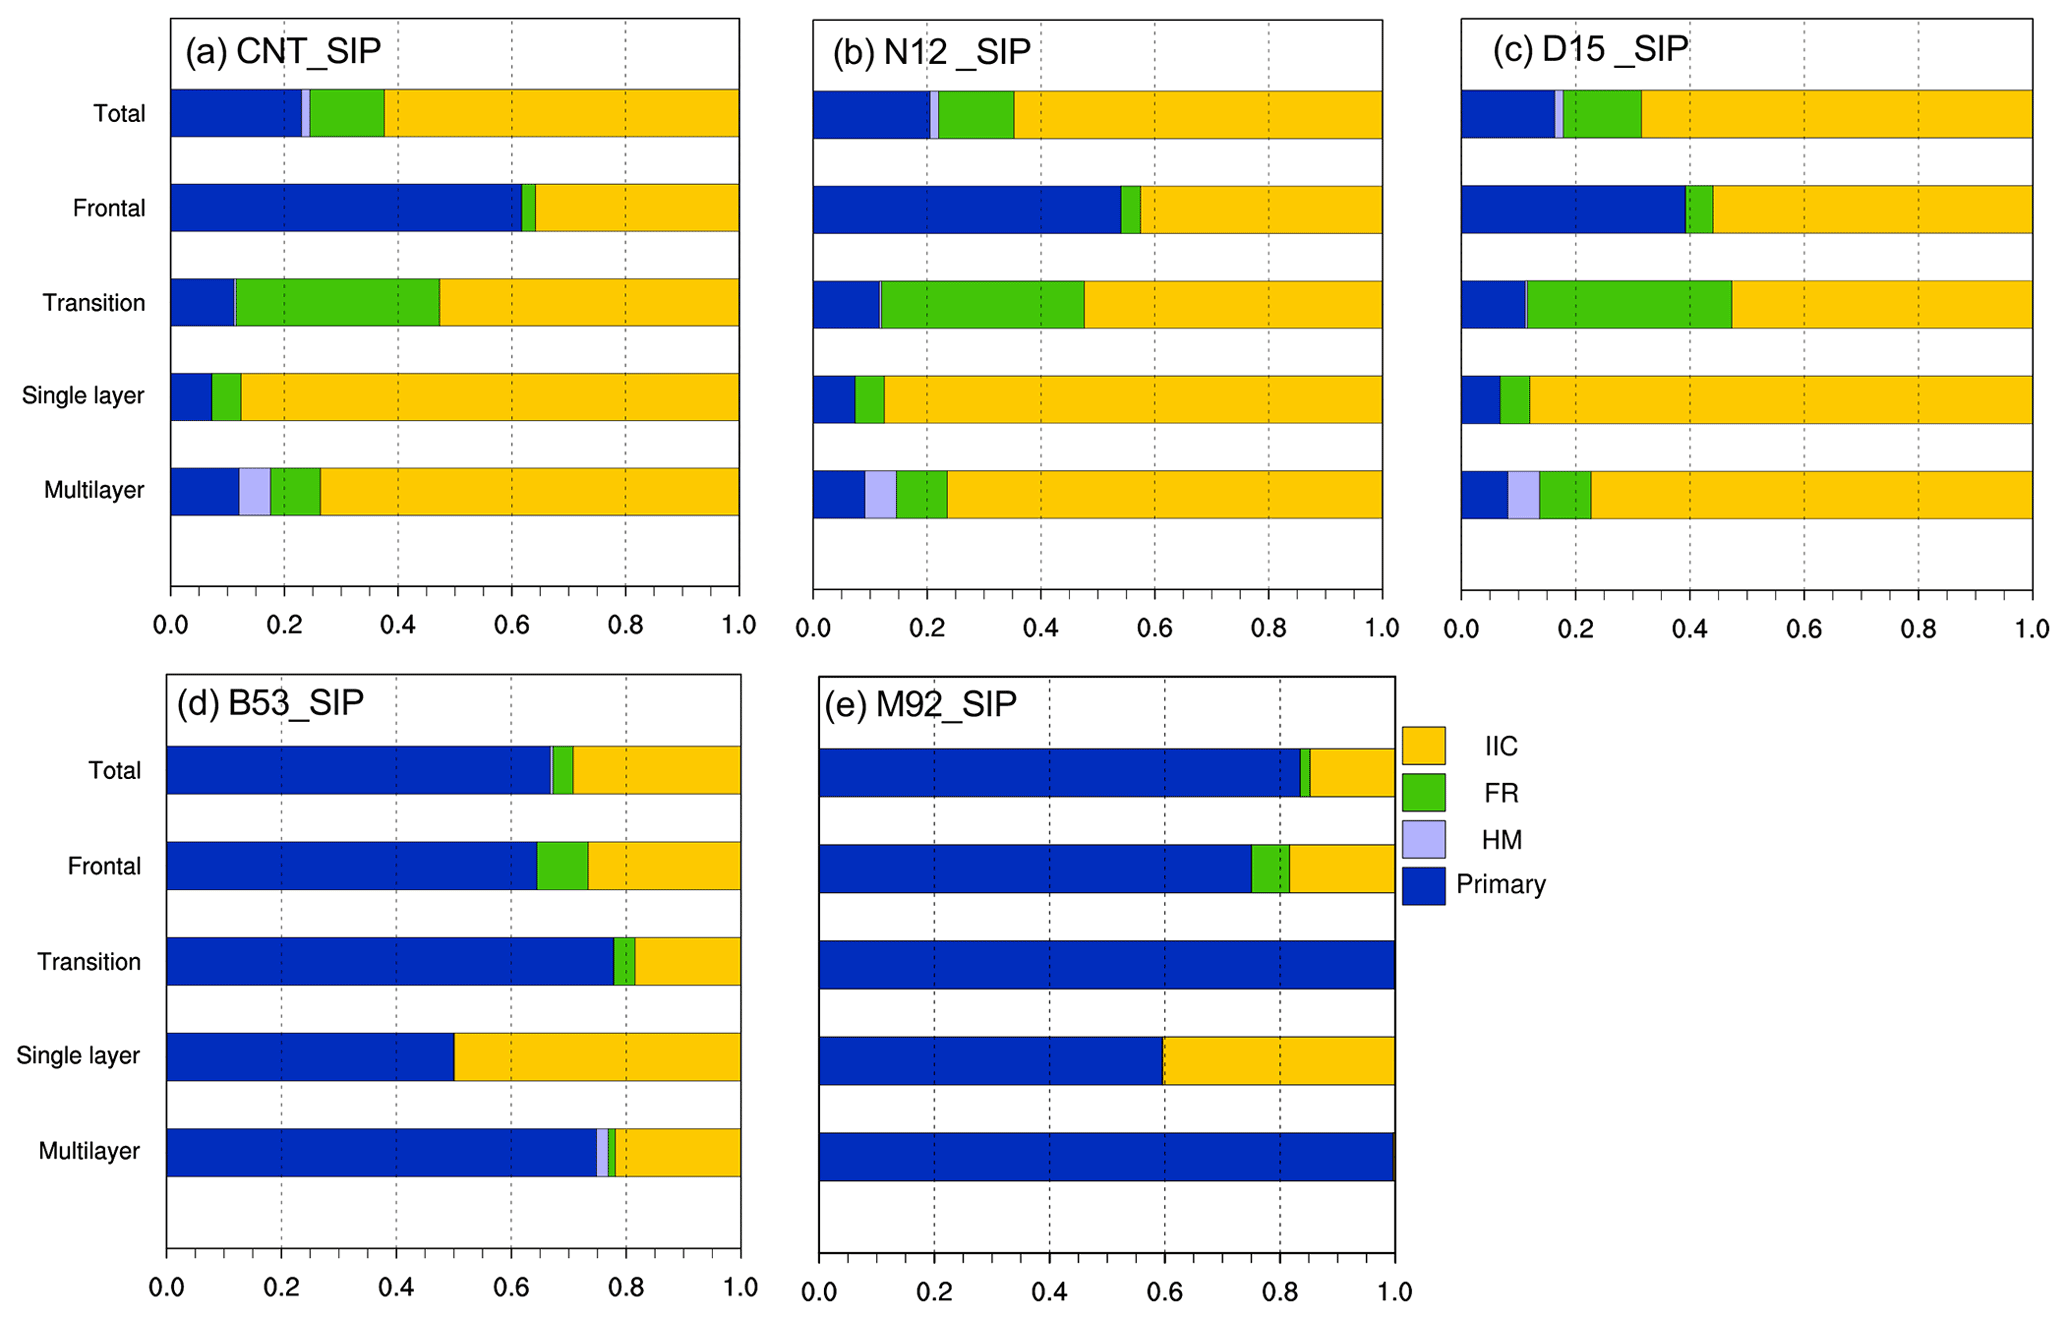
Figure 7Stacked bar charts of relative contributions from ice nucleation and secondary ice production to the total ice production rate from (a) CNT_SIP, (b) N12_SIP, (c) D15_SIP, (d) B53_SIP, and (e) M92_SIP experiments averaged over different time periods of M-PACE. The secondary ice production includes ice-ice collisional break-up (IIC), rain droplet fragmentation (FR), and the Hallett–Mossop (HM) process.
Since the INP number concentrations in CNT, N12 and D15 are significantly lower than the observations (Fig. 3), a sensitivity test using the CNT scheme with increased dust concentrations by 100 times shows overall similar cloud properties. However, the relative contribution of primary ice nucleation to total ice production is increased by a factor of ∼2 % to 30 % averaged for all the cloud types and to 20 % for the single-layer mixed-phase clouds.
4.3 Interactions between PIP and SIP
Figure 8 shows the temporally averaged vertical profiles of PIP and SIP process rates for ice mass and total from experiments with the CNT and M92 ice nucleation schemes, respectively, during the single-layer mixed-phase cloud period (9–12 October). As shown in Fig. 8a, clear suppression of PIP by SIP is revealed: the ice nucleation rate is reduced after the SIP is introduced for both CNT and M92 ice nucleation but with different sensitivities. The M92 ice nucleation is more suppressed by SIP than the CNT ice nucleation. The peak PIP rate is reduced by about one order of magnitude in M92 compared to a factor of 3 in CNT. The suppression of PIP by SIP is robust for the other three ice nucleation schemes over the single-layer mixed-phase cloud period (Fig. S5 in the Supplement), as well as for the whole M-PACE period (Figs. S6 and S7 in the Supplement).
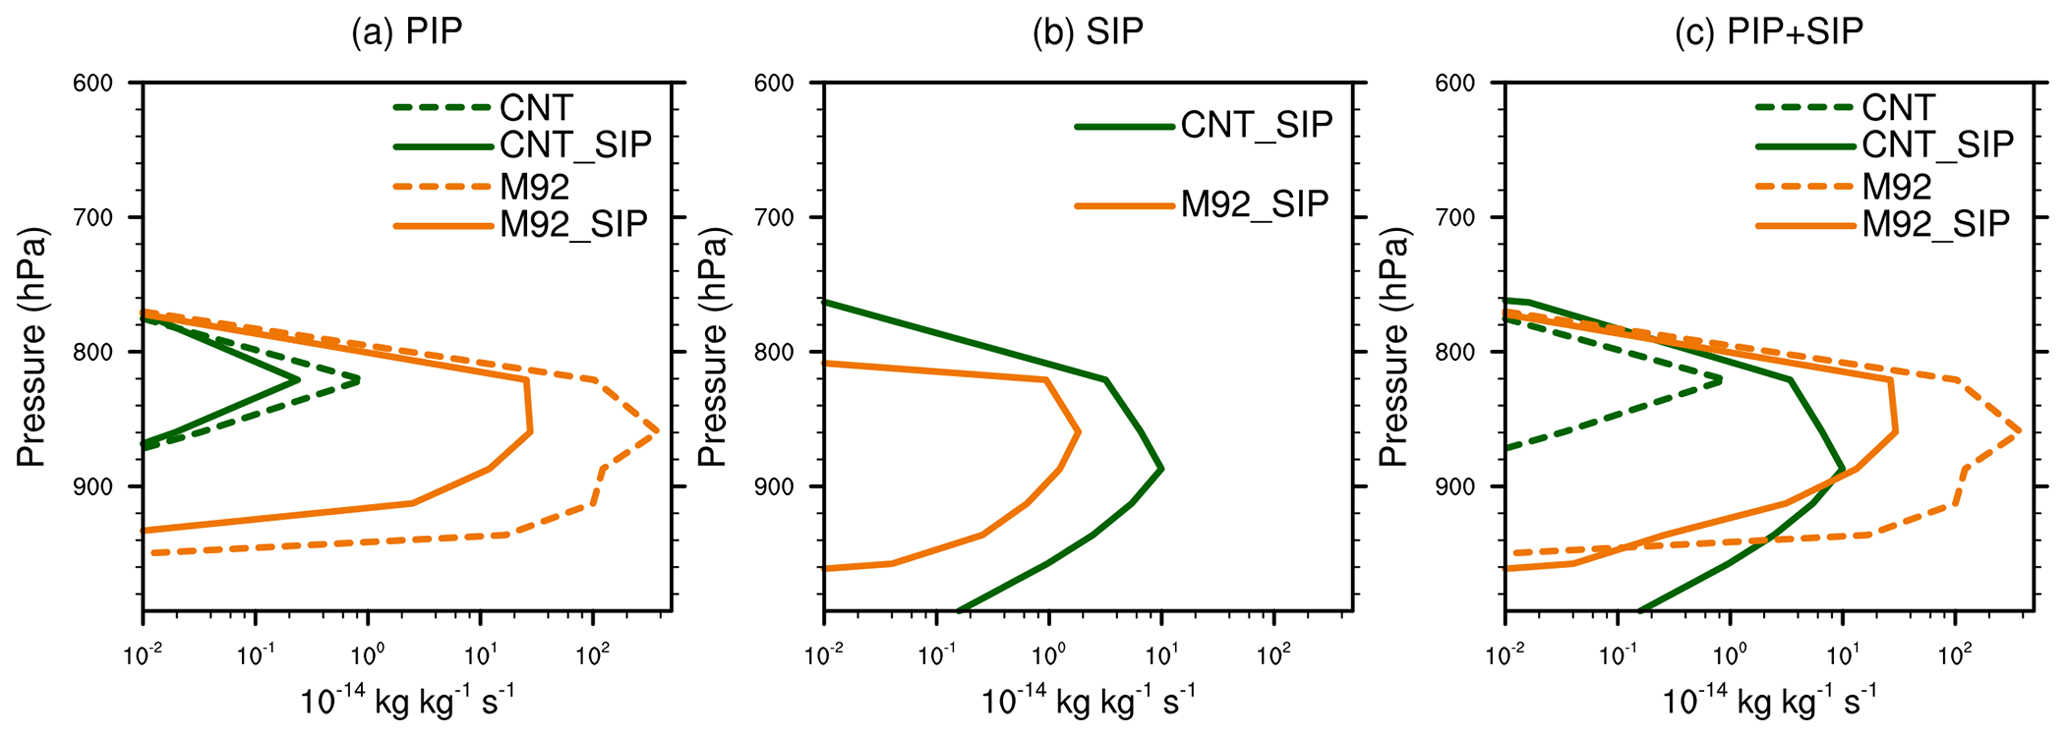
Figure 8Vertical profiles of (a) primary ice production rate (unit: kg kg−1 s−1), (b) secondary ice production rate (unit: kg kg−1 s−1), and (c) primary plus secondary ice production rate (unit: kg kg−1 s−1) from CNT, CNT_SIP, M92, and M92_SIP model experiments averaged over the single-layer mixed-phase cloud period. Ice production rates are grid-box means.
The mechanism for the suppression of PIP by SIP for the CNT ice nucleation is illustrated in Fig. 9. The ice nucleation is contributed from heterogeneous immersion, deposition and contact ice nucleation. Among these mechanisms, the immersion freezing is the dominant process in the single-layer mixed-phase clouds (Fig. 9a, b, c). The contributions from deposition and contact ice nucleation to the total ice nucleation rate are much smaller compared to immersion freezing. The immersion freezing rate is a function of INPs in cloud droplets and temperature. CNT calculates the immersion freezing rate based on cloud-borne BC and dust, the latter of which is the dominant INP.
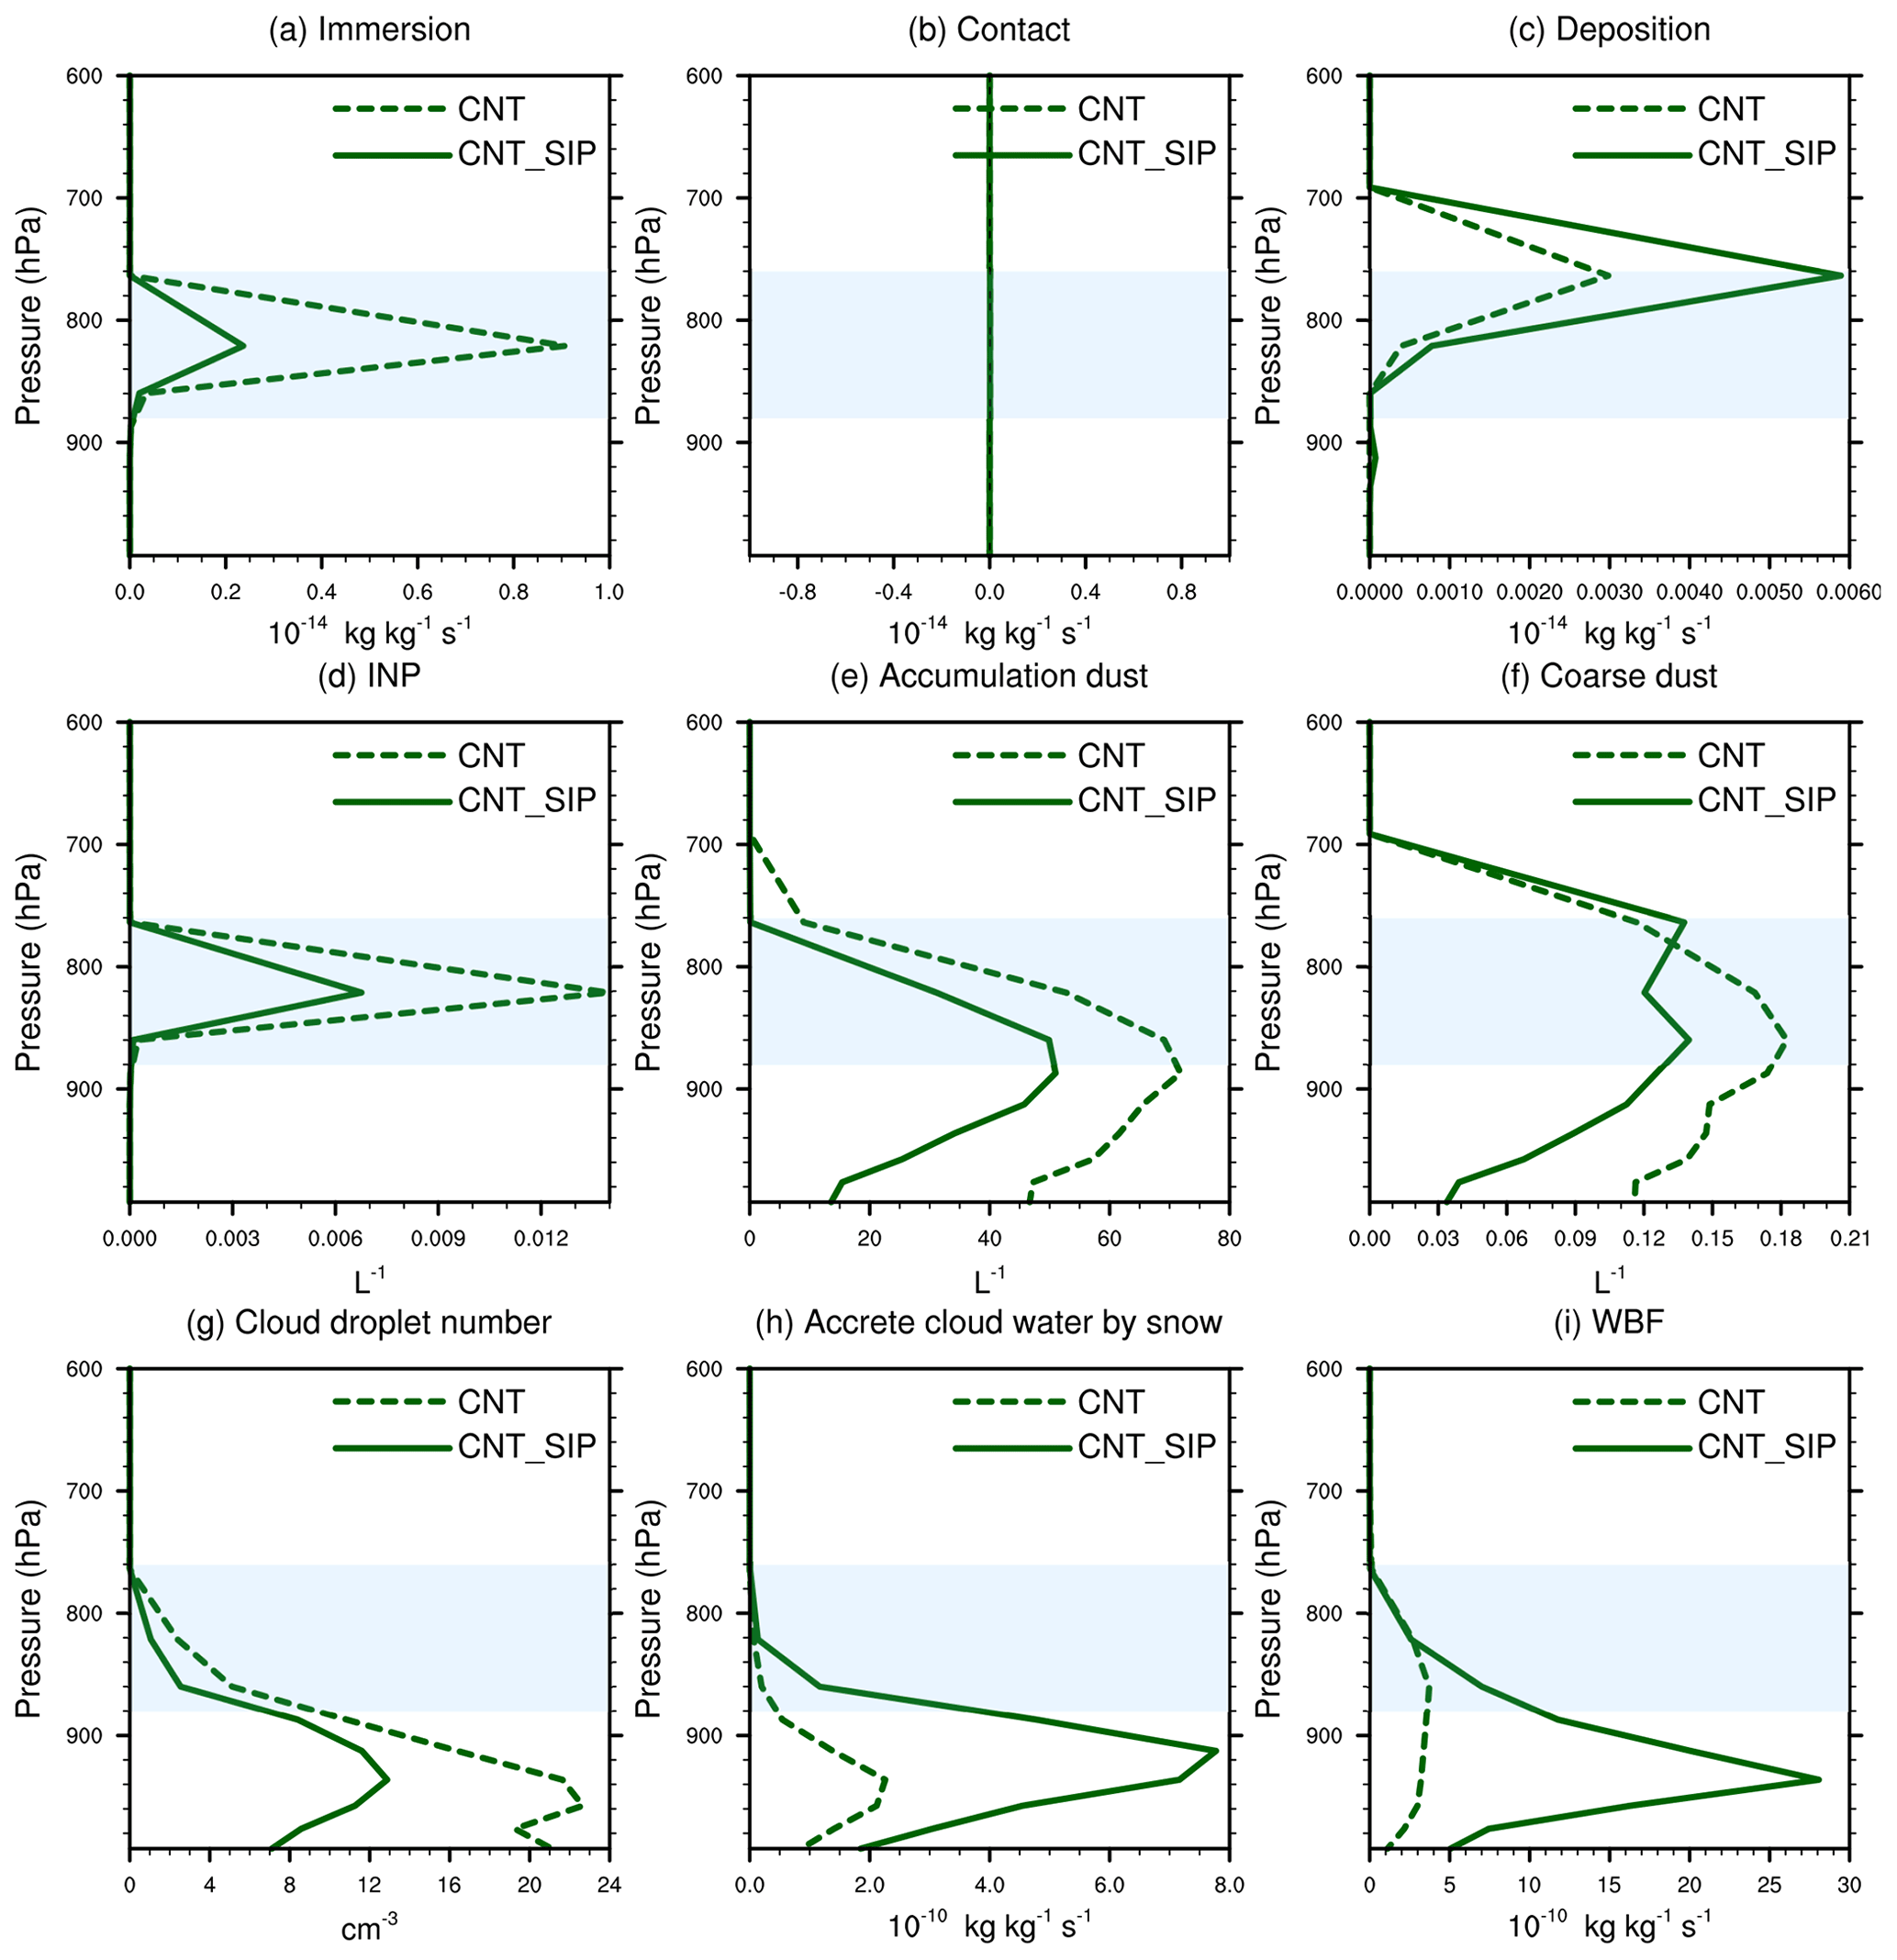
Figure 9Vertical profiles of (a) ice production rate (unit: kg kg−1 s−1) from immersion freezing of cloud water, (b) ice production rate (unit: kg kg−1 s−1) from contact freezing of cloud water, (c) ice production rate (unit: kg kg−1 s−1) from homogeneous and heterogeneous deposition nucleation, (d) immersion freezing INP number concentration, (e) cloud-borne dust number in the accumulation mode, (f) cloud-borne dust number in the coarse mode, (g) cloud droplet number concentration, (h) accretion rate of cloud droplets by snow, and (i) WBF process rate from CNT and CNT_SIP experiments averaged over the single-layer mixed-phase cloud period. Light blue shadings indicate the ice nucleation regime. Ice production rates are grid-box means.
The immersion ice nucleation is weakened by a factor of 4.5 (Fig. 9a) after considering SIP in the model due to lower number concentrations of INPs (Fig. 9d) and cloud droplets (Fig. 9g). The cloud-borne dust number concentrations in the accumulation (Fig. 9e) and coarse modes (Fig. 9f) are both decreased below ∼750 hPa level, corresponding to the reduction of INP number concentration and immersion ice nucleation rate in CNT_SIP compared to the CNT experiment. Lower cloud-borne dust number concentrations in the CNT_SIP experiment are caused by the reduction of cloud droplet number concentrations (Fig. 9g) as a result of SIP. The SIP strongly enhances the accretion of cloud water by snow (Fig. 9h) and the WBF process (Fig. 9i), leading to more consumption of cloud water (Zhao and Liu, 2021). The ice crystals formed from SIP are able to provide seeding for lower-level clouds when they sediment, further contributing to the suppression of PIP. However, this effect may not be an important factor for the suppression of PIP by SIP, considering that PIP occurs at higher levels relative to SIP in the single-layer mixed-phase clouds (Fig. 8).
The N12 and D15 schemes calculate the INP number concentrations based on the interstitial aerosols (Sect. 2.2). The mechanism for the suppression of PIP by SIP in the case of the N12 ice nucleation is shown in Fig. S8 in the Supplement: less cloud droplets and less available interstitial aerosols (as a result of stronger wet deposition) with the introduction of SIP lead to weaker PIP. The B53 and M92 schemes calculate the ice nucleation based on temperature, supersaturation, and cloud droplet number concentration (Sect. 2.2). Since temperature is similar in these nudged simulations, the decreased cloud droplet number concentration and ice supersaturation (due to the deposition of water vapor on more ice crystals) with the introduction of SIP leads to weaker PIP in B53_SIP and M92_SIP.
On the other hand, ice nucleation can also compete with SIP. The ice nucleation scheme with a larger ice nucleation rate (e.g., M92 versus CNT, Fig. 8a) is accompanied by a smaller SIP rate (Fig. 8b). The peak SIP rate in M92_SIP is kg kg−1 s−1, which is about 10 times lower than that in CNT_SIP ( kg kg−1 s−1). This competition between PIP and SIP is also revealed in the other ice nucleation schemes for the single-layer mixed-phase cloud period (Fig. S5) and for the whole M-PACE period (Figs. S6 and S7). We note that the largest PIP rate is in M92, followed by B53, CNT, N12, and D15, while the SIP rate is in the reverse order.
The mechanism for the suppression of SIP by PIP is illustrated in Fig. 10. First, the SIP rate is determined by three components, FR, IIC, and HM (Fig. 10a, b, c). The SIP rate is dominated by IIC and FR. Second, the smaller FR rate in M92_SIP compared to that in CNT_SIP (Fig. 10a) is a result of a smaller rainwater mass mixing ratio (Fig. 10d), which is caused by the strong M92 ice nucleation resulting in nearly complete glaciation of the cloud in the M92_SIP experiment. Third, the IIC can be further subdivided into the non-graupel-related IIC (Fig. 10e) and the graupel-related IIC (Fig. 10f), the latter of which dominates the total IIC. A smaller graupel-related IIC rate (with the peak value of 2 kg kg−1 s−1) (Fig. 10f) in M92_SIP compared to CNT_SIP (with the peak value of 10 kg kg−1 s−1) is a result of a smaller graupel mass mixing ratio in M92_SIP (with the peak value of 1.4 mg kg−1 in M92_SIP versus 5.2 mg kg−1 in CNT_SIP) (Fig. 10g). As the graupel mass is diagnosed from the cloud water mass, snow mass, and temperature, smaller mass mixing ratios of cloud water (with the peak value of 8 versus 125 mg kg−1 in Fig. 10h) and snow (with the peak value of 1.4 versus 2.3 mg kg−1 in Fig. 10i) in M92_SIP eventually lead to a smaller graupel mass mixing ratio and a smaller graupel-related IIC rate. Similar results can be found with the other ice nucleation schemes.

Figure 10Vertical profiles of (a) rain droplet shattering rate during freezing (FR), (b) rime splintering rate (HM), (c) ice-ice collision fragmentation rate (IIC), (d) rain water mixing ratio (qr, in unit of mg kg−1), (e) non-graupel-related ice-ice collision fragmentation rate, (f) graupel-related ice-ice collision fragmentation rate, (g) graupel mass mixing ratio (qg, in unit of mg kg−1), (h) cloud water mass mixing ratio (qc, in unit of mg kg−1), and (i) snow mass mixing ratio (qs, in unit of mg kg−1) from the CNT_SIP and M92_SIP experiments.
In summary, different from the PIP rate, which is dependent on cloud-borne aerosols and cloud droplets, the SIP rate is directly controlled by the precipitation particles, such as rain, snow, and graupel. A stronger ice nucleation rate leads to more glaciation of mixed-phase clouds in M92_SIP. As a consequence, less rainwater and graupel exist, leading to lower SIP rate in the M92_SIP experiment compared to the CNT experiment.
In this study, the relative importance of PIP through ice nucleation and SIP and their interactions are investigated for the Arctic single-layer mixed-phase clouds observed during M-PACE. To understand the interactions between PIP and SIP, five different ice nucleation schemes (CNT, N12, D15, B53 and M92) are implemented in the model. Model experiments with only ice nucleation and with both ice nucleation and SIP are conducted. The CNT, N12, and D15 experiments without considering SIP show relatively constant ICNCs with cloud height, which are also one order of magnitude lower than the observation. The SIP experiments based on the CNT, N12 and D15 ice nucleation schemes (i.e., CNT_SIP, N12_SIP, and D15_SIP) reverse the vertical distribution pattern of ICNCs by increasing the ICNCs in the lower portion of clouds. SIP also transforms ∼30 % of pure liquid-phase clouds simulated in the CNT, N12, and D15 experiments into mixed-phase clouds. In contrast, modeled clouds are totally ice phase instead of observed mixed-phase in the B53 and M92 experiments. Since the cloud is already completely glaciated by the ice nucleation with these ice nucleation schemes, adding the SIP processes has little impact on the cloud phase in the B53_SIP and M92_SIP experiments. These findings highlight the “foundation” effect of PIP on the cloud phase. It is concluded that the model experiments with both aerosol-aware ice nucleation schemes and SIP processes (i.e., CNT_SIP, N12_SIP, and D15_SIP) yield the best agreement with observations in simulating the Arctic single-layer mixed-phase clouds.
The relative importance of PIP and SIP is investigated in this study. We find that ice nucleation contributes around 20 % to the total ice production during M-PACE, with a maximum value of 60 % for the frontal clouds, and a minimum value of 7 % for the single-layer mixed-phase clouds in the CNT_SIP, N12_SIP, and D15_SIP experiments. The B53_SIP and M92_SIP experiments may overestimate the contribution from PIP, which contributes 65 % and 80 % to the total ice production, respectively, averaged over the M-PACE clouds.
In this study, for the first time, the interactions between PIP and SIP in the single-layer mixed-phase clouds are investigated and possible underlying mechanisms are discussed. We find a clear suppression of PIP by SIP, and the ice nucleation rate is reduced when SIP is introduced in the model. Ice crystals produced from SIP trigger a series of changes in microphysical processes (e.g., WBF, riming), resulting in reduced number concentrations of cloud droplets and cloud-borne dust aerosols. Less cloud-borne dust aerosols eventually cause a weakening of the following ice nucleation (e.g., immersion freezing of cloud droplets on dust). On the other hand, ice nucleation also competes with SIP. The ice nucleation schemes with larger nucleation rates are accompanied by smaller SIP rates. Different from the ice nucleation, which depends on cloud water and aerosols, the SIP rate is directly controlled by the precipitation particles. A stronger ice nucleation leads to more glaciation of mixed-phase clouds, and as a consequence less rain and graupel are formed leading to lower SIP rate.
We note that uncertainties still exist in the representations of ice nucleation and SIP in the model. First, the diagnostic graupel approach still has a large uncertainty. A cloud microphysical scheme with prognostic graupel (Gettelman et al., 2019b) or a “single-ice” microphysical scheme (Morrison and Milbrandt, 2015; Zhao et al., 2017) will be needed to further examine the impacts of graupel-related IIC. Second, modeled INP concentrations may be significantly underestimated in the Arctic regions with the aerosol-aware CNT, D15, and N12 ice nucleation schemes. This is owing to the model underestimation of long-range transport of dust from lower latitudes (Shi and Liu, 2019) as well as the model missing high-latitude local dust (Shi et al., 2021) and marine biogenic aerosols in the Arctic regions (Zhao et al., 2021b). Our future work will focus on representing the high latitude dust and biological aerosol emissions for better INP simulations in the model as well as improving the parameterization of SIP processes. More observational data are needed to identify the frequencies and conditions of SIP occurrence in cold clouds and its contribution to total ice formation so that the impact of SIP can be better quantified by the models.
The Community Earth System Model version 2 (CESM2) source code is freely available at GitHub repository: http://github.com/ESCOMP/CESM (last access: 11 Feb 2021) (Danabasoglu et al., 2020). The SIP source code and model datasets are archived at the NCAR Cheyenne supercomputer and are available upon request. The measured LWP and IWP datasets of M-PACE campaign are obtained from the Atmospheric Radiation Measurement (ARM) user facility, US Department of Energy Office of Science, available at https://www.arm.gov/research/campaigns/nsa2004arcticcld (last access: 3 July 2021) (McFarquhar et al., 2007).
The supplement related to this article is available online at: https://doi.org/10.5194/acp-22-2585-2022-supplement.
XZ and XL conceptualized the analysis, carried out the simulations, performed the analysis, and wrote the paper. XL was involved in obtaining the project grant and supervised the study.
At least one of the (co-)authors is a member of the editorial board of Atmospheric Chemistry and Physics. The peer-review process was guided by an independent editor, and the authors also have no other competing interests to declare.
Publisher's note: Copernicus Publications remains neutral with regard to jurisdictional claims in published maps and institutional affiliations.
We thank Vaughan T. J. Phillips, and Sachin Patade for helpful discussions. We thank Meng Zhang for helpful discussions, especially on processing the observation data. The authors would also like to acknowledge the use of computational resources for conducting the model simulations (ark:/85065/d7wd3xhc) at the NCAR-Wyoming Supercomputing Center provided by the NSF and the State of Wyoming and supported by the NCAR Computational and Information Systems Laboratory.
This research was supported by the DOE Atmospheric System Research (ASR) Program (grant nos. DE-SC0020510 and DE-SC0021211).
This paper was edited by Yafang Cheng and reviewed by three anonymous referees.
Atkinson, J. D., Murray, B. J., Woodhouse, M. T., Whale, T. F., Baustian, K. J., Carslaw, K. S., Dobbie, S., O'Sullivan, D., and Malkin, T. L.: The importance of feldspar for ice nucleation by mineral dust in mixed-phase clouds, Nature, 498, 355–358, https://doi.org/10.1038/nature12278, 2013.
Beard, K. V.: Ice initiation in warm-base convective clouds: An assessment of microphysical mechanisms, Atmos. Res., 28, 125–152, https://doi.org/10.1016/0169-8095(92)90024-5, 1992.
Bigg, E. K.: The Supercooling of Water, P. Phys. Soc. Lond. B, 66, 688–694, https://doi.org/10.1088/0370-1301/66/8/309, 1953.
Crawford, I., Bower, K. N., Choularton, T. W., Dearden, C., Crosier, J., Westbrook, C., Capes, G., Coe, H., Connolly, P. J., Dorsey, J. R., Gallagher, M. W., Williams, P., Trembath, J., Cui, Z., and Blyth, A.: Ice formation and development in aged, wintertime cumulus over the UK: observations and modelling, Atmos. Chem. Phys., 12, 4963–4985, https://doi.org/10.5194/acp-12-4963-2012, 2012.
Danabasoglu, G., Lamarque, J. F., Bacmeister, J., Bailey, D. A., DuVivier, A. K., Edwards, J., Emmons, L. K., Fasullo, J., Garcia, R., Gettelman, A., Hannay, C., Holland, M. M., Large, W. G., Lauritzen, P. H., Lawrence, D. M., Lenaerts, J. T. M., Lindsay, K., Lipscomb, W. H., Mills, M. J., Neale, R., Oleson, K. W., Otto-Bliesner, B., Phillips, A. S., Sacks, W., Tilmes, S., van Kampenhout, L., Vertenstein, M., Bertini, A., Dennis, J., Deser, C., Fischer, C., Fox-Kemper, B., Kay, J. E., Kinnison, D., Kushner, P. J., Larson, V. E., Long, M. C., Mickelson, S., Moore, J. K., Nienhouse, E., Polvani, L., Rasch, P. J., and Strand, W. G.: The Community Earth System Model Version 2 (CESM2), J. Adv. Model. Earth Sy., 12, e2019MS001916, https://doi.org/10.1029/2019MS001916, 2020 (code available at: http://github.com/ESCOMP/CESM, last access: 11 Feb 2021).
DeMott, P. J., Prenni, A. J., Liu, X., Kreidenweis, S. M., Petters, M. D., Twohy, C. H., Richardson, M. S., Eidhammer, T., and Rogers, D. C.: Predicting global atmospheric ice nuclei distributions and their impacts on climate, P. Natl. Acad. Sci. USA, 107, 11217–11222, https://doi.org/10.1073/pnas.0910818107, 2010.
DeMott, P. J., Prenni, A. J., McMeeking, G. R., Sullivan, R. C., Petters, M. D., Tobo, Y., Niemand, M., Möhler, O., Snider, J. R., Wang, Z., and Kreidenweis, S. M.: Integrating laboratory and field data to quantify the immersion freezing ice nucleation activity of mineral dust particles, Atmos. Chem. Phys., 15, 393–409, https://doi.org/10.5194/acp-15-393-2015, 2015.
Deng, M. and Mace, G. G.: Cirrus microphysical properties and air motion statistics using cloud radar Doppler moments. Part I: Algorithm description, J. Appl. Meteorol. Clim., 45, 1690–1709, https://doi.org/10.1175/JAM2433.1, 2006.
Dong, X. Q. and Mace, G. G.: Profiles of low-level stratus cloud microphysics deduced from ground-based measurements, J. Atmos. Ocean. Tech., 20, 42–53, https://doi.org/10.1175/1520-0426(2003)020<0042:POLLSC>2.0.CO;2, 2003.
Field, P. R., Lawson, R. P., Brown, P. R. A., Lloyd, G., Westbrook, C., Moisseev, D., Miltenberger, A., Nenes, A., Blyth, A., Choularton, T., Connolly, P., Buehl, J., Crosier, J., Cui, Z., Dearden, C., DeMott, P., Flossmann, A., Heymsfield, A., Huang, Y., Kalesse, H., Kanji, Z. A., Korolev, A., Kirchgaessner, A., Lasher-Trapp, S., Leisner, T., McFarquhar, G., Phillips, V., Stith, J., and Sullivan, S.: Secondary Ice Production: Current State of the Science and Recommendations for the Future, Meteor. Mon., 58, 7.1–7.20, https://doi.org/10.1175/amsmonographs-d-16-0014.1, 2017.
Gettelman, A. and Morrison, H.: Advanced two-moment bulk microphysics for global models. Part I: Off-line tests and comparison with other schemes, J. Climate, 28, 1268–1287, https://doi.org/10.1175/JCLI-D-14-00102.1, 2015.
Gettelman, A., Truesdale, J. E., Bacmeister, J. T., Caldwell, P. M., Neale, R. B., Bogenschutz, P. A., and Simpson, I. R.: The Single Column Atmosphere Model Version 6 (SCAM6): Not a Scam but a Tool for Model Evaluation and Development, J. Adv. Model. Earth Sy., 11, 1381–1401, https://doi.org/10.1029/2018MS001578, 2019a.
Gettelman, A., Morrison, H., Thayer-Calder, K., and Zarzycki, C. M.: The Impact of Rimed Ice Hydrometeors on Global and Regional Climate, J. Adv. Model. Earth Sy., 11, 1543–1562, https://doi.org/10.1029/2018MS001488, 2019b.
Heymsfield, A. and Willis, P.: Cloud conditions favoring secondary ice particle production in tropical maritime convection, J. Atmos. Sci., 71, 4500–4526, https://doi.org/10.1175/JAS-D-14-0093.1, 2014.
Hoose, C., Lohmann, U., Erdin, R., and Tegen, I.: The global influence of dust mineralogical composition on heterogeneous ice nucleation in mixed-phase clouds, Environ. Res. Lett., 3, 025003, https://doi.org/10.1088/1748-9326/3/2/025003, 2008.
Hoose, C., Kristjánsson, J. E., Chen, J. P., and Hazra, A.: A classical-theory-based parameterization of heterogeneous ice nucleation by mineral dust, soot, and biological particles in a global climate model, J. Atmos. Sci., 67, 2483–2503, https://doi.org/10.1175/2010JAS3425.1, 2010.
Huang, Y., Blyth, A. M., Brown, P. R. A., Choularton, T. W., and Cui, Z.: Factors controlling secondary ice production in cumulus clouds, Q. J. Roy. Meteor. Soc., 143, 1021–1031, https://doi.org/10.1002/qj.2987, 2017.
Jackson, R. C. and McFarquhar, G. M.: An assessment of the impact of antishattering tips and artifact removal techniques on bulk cloud ice microphysical and optical properties measured by the 2D cloud probe, J. Atmos. Ocean. Tech., 31, 2131–2144, https://doi.org/10.1175/JTECH-D-14-00018.1, 2014.
Jackson, R. C., Mcfarquhar, G. M., Stith, J., Beals, M., Shaw, R. A., Jensen, J., Fugal, J., and Korolev, A.: An assessment of the impact of antishattering tips and artifact removal techniques on cloud ice size distributions measured by the 2D cloud probe, J. Atmos. Ocean. Tech., 31, 2567–2590, https://doi.org/10.1175/JTECH-D-13-00239.1, 2014.
Kanji, Z. A., Ladino, L. A., Wex, H., Boose, Y., Burkert-Kohn, M., Cziczo, D. J., and Krämer, M.: Overview of Ice Nucleating Particles, Meteor. Mon., 58, 1.1–1.33, https://doi.org/10.1175/amsmonographs-d-16-0006.1, 2017.
Khanal, S. and Wang, Z.: Evaluation of the lidar-radar cloud ice water content retrievals using collocated in situ measurements, J. Appl. Meteorol. Clim., 54, 2087–2097, https://doi.org/10.1175/JAMC-D-15-0040.1, 2015.
Korolev, A. and Isaac, G.: Phase transformation of mixed-phase clouds, Q. J. Roy. Meteor. Soc., 129, 19–38, https://doi.org/10.1256/QJ.01.203, 2003.
Korolev, A. and Leisner, T.: Review of experimental studies of secondary ice production, Atmos. Chem. Phys., 20, 11767–11797, https://doi.org/10.5194/acp-20-11767-2020, 2020.
Korolev, A., McFarquhar, G., Field, P. R., Franklin, C., Lawson, P., Wang, Z., Williams, E., Abel, S. J., Axisa, D., Borrmann, S., Crosier, J., Fugal, J., Krämer, M., Lohmann, U., Schlenczek, O., Schnaiter, M., and Wendisch, M.: Mixed-Phase Clouds: Progress and Challenges, Meteor. Mon., 58, 5.1–5.50, https://doi.org/10.1175/amsmonographs-d-17-0001.1, 2017.
Lasher-Trapp, S., Leon, D. C., DeMott, P. J., Villanueva-Birriel, C. M., Johnson, A. V., Moser, D. H., Tully, C. S., and Wu, W.: A Multisensor Investigation of Rime Splintering in Tropical Maritime Cumuli, J. Atmos. Sci., 73, 2547–2564, https://doi.org/10.1175/JAS-D-15-0285.1, 2016.
Liu, X. and Penner, J. E.: Ice nucleation parameterization for global models, Meteorol. Z., 14, 499–514, https://doi.org/10.1127/0941-2948/2005/0059, 2005.
Liu, X., Xie, S., Boyle, J., Klein, S. A., Shi, X., Wang, Z., Lin, W., Ghan, S. J., Earle, M., Liu, P. S. K., and Zelenyuk, A.: Testing cloud microphysics parameterizations in NCAR CAM5 with ISDAC and M-PACE observations, J. Geophy. Res., 116, D00T11, https://doi.org/10.1029/2011JD015889, 2011.
Liu, X., Easter, R. C., Ghan, S. J., Zaveri, R., Rasch, P., Shi, X., Lamarque, J.-F., Gettelman, A., Morrison, H., Vitt, F., Conley, A., Park, S., Neale, R., Hannay, C., Ekman, A. M. L., Hess, P., Mahowald, N., Collins, W., Iacono, M. J., Bretherton, C. S., Flanner, M. G., and Mitchell, D.: Toward a minimal representation of aerosols in climate models: description and evaluation in the Community Atmosphere Model CAM5, Geosci. Model Dev., 5, 709–739, https://doi.org/10.5194/gmd-5-709-2012, 2012.
Liu, X., Ma, P.-L., Wang, H., Tilmes, S., Singh, B., Easter, R. C., Ghan, S. J., and Rasch, P. J.: Description and evaluation of a new four-mode version of the Modal Aerosol Module (MAM4) within version 5.3 of the Community Atmosphere Model, Geosci. Model Dev., 9, 505–522, https://doi.org/10.5194/gmd-9-505-2016, 2016.
McFarquhar, G. M., Zhang, G., Poellot, M. R., Kok, G. L., McCoy, R., Tooman, T., Fridlind, A., and Heymsfield, A. J.: Ice properties of single-layer stratocumulus during the Mixed-Phase Arctic Cloud Experiment: 1. Observations, J. Geophys. Res., 112, D24201, https://doi.org/10.1029/2007JD008633, 2007 (data available at: https://www.arm.gov/research/campaigns/nsa2004arcticcld (last access: 3 July 2021).
Meyers, M. P., Demott, P. J., and Cotton, W. R.: New primary ice-nucleation parameterizations in an explicit cloud model, J. Appl. Meteorol., 31, 708–721, https://doi.org/10.1175/1520-0450(1992)031<0708:NPINPI>2.0.CO;2, 1992.
Morrison, H. and Milbrandt, J. A.: Parameterization of cloud microphysics based on the prediction of bulk ice particle properties. Part I: Scheme description and idealized tests, J. Atmos. Sci., 72, 287–311, https://doi.org/10.1175/JAS-D-14-0065.1, 2015.
Morrison, H., de Boer, G., Feingold, G., Harrington, J., Shupe, M. D., and Sulia, K.: Resilience of persistent Arctic mixed-phase clouds, Nat. Geosci., 5, 11–17, https://doi.org/10.1038/ngeo1332, 2012.
Mossop, S. C.: Secondary ice particle production during rime growth: The effect of drop size distribution and rimer velocity, Q. J. Roy. Meteor. Soc., 111, 1113–1124, https://doi.org/10.1002/qj.49711147012, 1985.
Mülmenstädt, J., Salzmann, M., Kay, J. E., Zelinka, M. D., Ma, P.-L., Nam, C., Kretzschmar, J., Hörnig, S., and Quaas, J.: An underestimated negative cloud feedback from cloud lifetime changes, 11, 508–513, https://doi.org/10.1038/s41558-021-01038-1, 2021.
Niemand, M., Möhler, O., Vogel, B., Vogel, H., Hoose, C., Connolly, P., Klein, H., Bingemer, H., DeMott, P., Skrotzki, J., and Leisner, T.: A Particle-Surface-Area-Based Parameterization of Immersion Freezing on Desert Dust Particles, J. Atmos. Sci., 69, 3077–3092, https://doi.org/10.1175/JAS-D-11-0249.1, 2012.
Phillips, V. T. J., Yano, J. I., and Khain, A.: Ice multiplication by breakup in ice-ice collisions. Part I: Theoretical formulation, J. Atmos. Sci., 74, 1705–1719, https://doi.org/10.1175/JAS-D-16-0224.1, 2017a.
Phillips, V. T. J., Yano, J. I., Formenton, M., Ilotoviz, E., Kanawade, V., Kudzotsa, I., Sun, J., Bansemer, A., Detwiler, A. G., Khain, A., and Tessendorf, S. A.: Ice multiplication by breakup in ice-ice collisions. Part II: Numerical simulations, J. Atmos. Sci., 74, 2789–2811, https://doi.org/10.1175/JAS-D-16-0223.1, 2017b.
Phillips, V. T. J., Patade, S., Gutierrez, J., and Bansemer, A.: Secondary ice production by fragmentation of freezing drops: Formulation and theory, J. Atmos. Sci., 75, 3031–3070, https://doi.org/10.1175/JAS-D-17-0190.1, 2018.
Prenni, A. J., Harrington, J. Y., Tjernström, M., DeMott, P. J., Avramov, A., Long, C. N., Kreidenweis, S. M., Olsson, P. Q., and Verlinde, J.: Can Ice-Nucleating Aerosols Affect Arctic Seasonal Climate?, B. Am. Meteorol. Soc., 88, 541–550, https://doi.org/10.1175/BAMS-88-4-541, 2007.
Shi, Y. and Liu, X.: Dust radiative effects on climate by glaciating mixed-phase clouds, Geophys. Res. Lett., 46, 6128–6137, https://doi.org/10.1029/2019GL082504, 2019.
Shi, Y., Liu, X., Wu, M., Ke, Z., and Brown, H.: Relative Importance of High-Latitude Local and Long-Range Transported Dust to Arctic Ice Nucleating Particles and Impacts on Arctic Mixed-Phase Clouds, Atmos. Chem. Phys. Discuss. [preprint], https://doi.org/10.5194/acp-2021-621, in review, 2021.
Shupe, M. D., Uttal, T., and Matrosov, S. Y.: Arctic cloud microphysics retrievals from surface-based remote sensors at SHEBA, J. Appl. Meteorol. Clim., 44, 1544–1562, https://doi.org/10.1175/JAM2297.1, 2005.
Stith, J. L., Ramanathan, V., Cooper, W. A., Roberts, G. C., DeMott, P. J., Carmichael, G., Hatch, C. D., Adhikary, B., Twohy, C. H., Rogers, D. C., Baumgardner, D., Prenni, A. J., Campos, T., Gao, R., Anderson, J., and Feng, Y.: An overview of aircraft observations from the Pacific Dust Experiment campaign, J. Geophys. Res.-Atmos., 114, D05207, https://doi.org/10.1029/2008JD010924, 2009.
Sullivan, S. C., Hoose, C., Kiselev, A., Leisner, T., and Nenes, A.: Initiation of secondary ice production in clouds, Atmos. Chem. Phys., 18, 1593–1610, https://doi.org/10.5194/acp-18-1593-2018, 2018.
Tan, I. and Storelvmo, T.: Sensitivity study on the influence of cloud microphysical parameters on mixed-phase cloud thermodynamic phase partitioning in CAM5, J. Atmos. Sci., 73, 709–728, https://doi.org/10.1175/JAS-D-15-0152.1, 2016.
Turner, D. D., Clough, S. A., Liljegren, J. C., Clothiaux, E. E., Cady-Pereira, K. E., and Gaustad, K. L.: Retrieving liquid water path and precipitable water vapor from the atmospheric radiation measurement (ARM) microwave radiometers, IEEE T. Geosci. Remote, 45, 3680–3689, https://doi.org/10.1109/TGRS.2007.903703, 2007.
Verlinde, J., Harrington, J. Y., McFarquhar, G. M., Yannuzzi, V. T., Avramov, A., Greenberg, S., Johnson, N., Zhang, G., Poellot, M. R., Mather, J. H., Turner, D. D., Eloranta, E. W., Zak, B. D., Prenni, A. J., Daniel, J. S., Kok, G. L., Tobin, D. C., Holz, R., Sassen, K., Spangenberg, D., Minnis, P., Tooman, T. P., Ivey, M. D., Richardson, S. J., Bahrmann, C. P., Shupe, M., DeMott, P. J., Heymsfield, A. J., and Schofield, R.: The mixed-phase arctic cloud experiment, B. Am. Meteorol. Soc., 88, 205–221, https://doi.org/10.1175/BAMS-88-2-205, 2007.
Wang, Y., Liu, X., Hoose, C., and Wang, B.: Different contact angle distributions for heterogeneous ice nucleation in the Community Atmospheric Model version 5, Atmos. Chem. Phys., 14, 10411–10430, https://doi.org/10.5194/acp-14-10411-2014, 2014.
Wang, Z.: A refined two-channel microwave radiometer liquid water path retrieval for cold regions by using multiple-sensor measurements, IEEE Geosci. Remote S., 4, 591–595, https://doi.org/10.1109/LGRS.2007.900752, 2007.
Young, K. C.: The Role of Contact Nucleation in Ice Phase Initiation in Clouds, J. Atmos. Sci., 31, 768–776, https://doi.org/10.1175/1520-0469(1974)031<0768:TROCNI>2.0.CO;2, 1974.
Zhao, X. and Liu, X.: Global Importance of Secondary Ice Production, Geophys. Res. Lett., 48, e2021GL092581, https://doi.org/10.1029/2021GL092581, 2021.
Zhao, X., Lin, Y., Peng, Y., Wang, B., Morrison, H., and Gettelman, A.: A single ice approach using varying ice particle properties in global climate model microphysics, J. Adv. Model. Earth Sy., 9, 2138–2157, https://doi.org/10.1002/2017MS000952, 2017.
Zhao, X., Liu, X., Phillips, V. T. J., and Patade, S.: Impacts of secondary ice production on Arctic mixed-phase clouds based on ARM observations and CAM6 single-column model simulations, Atmos. Chem. Phys., 21, 5685–5703, https://doi.org/10.5194/acp-21-5685-2021, 2021a.
Zhao, X., Liu, X., Burrows, S. M., and Shi, Y.: Effects of marine organic aerosols as sources of immersion-mode ice-nucleating particles on high-latitude mixed-phase clouds, Atmos. Chem. Phys., 21, 2305–2327, https://doi.org/10.5194/acp-21-2305-2021, 2021b.