the Creative Commons Attribution 4.0 License.
the Creative Commons Attribution 4.0 License.
 | 23 Feb 2022
Free amino acid quantification in cloud water at the Puy de Dôme station (France)
Pascal Renard
Maxence Brissy
Florent Rossi
Martin Leremboure
Saly Jaber
Jean-Luc Baray
Angelica Bianco
Anne-Marie Delort
Laurent Deguillaume
Eighteen free amino acids (FAAs) were quantified in cloud water sampled at the Puy de Dôme station (PUY – France) during 13 cloud events. This quantification has been performed without concentration or derivatization, using liquid chromatography hyphened to mass spectrometry (LC-MS) and the standard addition method to correct for matrix effects. Total concentrations of FAAs (TCAAs) vary from 1.2 to 7.7 µM, Ser (serine) being the most abundant AA (23.7 % on average) but with elevated standard deviation, followed by glycine (Gly) (20.5 %), alanine (Ala) (11.9 %), asparagine (Asn) (8.7 %), and leucine/isoleucine (Leu/I) (6.4 %). The distribution of AAs among the cloud events reveals high variability. TCAA constitutes between 0.5 and 4.4 % of the dissolved organic carbon measured in the cloud samples. AA quantification in cloud water is scarce, but the results agree with the few studies that investigated AAs in this aqueous medium. The environmental variability is assessed through a statistical analysis. This work shows that AAs are correlated with the time spent by the air masses within the boundary layer, especially over the sea surface before reaching the PUY. The cloud microphysical properties' fluctuation does not explain the AA variability in our samples, confirming previous studies at the PUY. We finally assessed the sources and the atmospheric processes that potentially explain the prevailing presence of certain AAs in the cloud samples. The initial relative distribution of AAs in biological matrices (proteins extracted from bacterial cells or mammalian cells, for example) could explain the dominance of Ala, Gly, and Leu/I. AA composition of aquatic organisms (i.e., diatom species) could also explain the high concentrations of Ser in our samples. The analysis of the AA hygroscopicity also indicates a higher contribution of AAs (80 % on average) that are hydrophilic or neutral, revealing the fact that other AAs (hydrophobic) are less favorably incorporated into cloud droplets. Finally, the atmospheric aging of AAs has been evaluated by calculating atmospheric lifetimes considering their potential transformation in the cloud medium by biotic or abiotic (mainly oxidation) processes. The most concentrated AAs encountered in our samples present the longest atmospheric lifetimes, and the less dominant ones are clearly efficiently transformed in the atmosphere, potentially explaining their low concentrations. However, this cannot fully explain the relative contribution of several AAs in the cloud samples. This reveals the high complexity of the bio-physico-chemical processes occurring in the multiphase atmospheric environment.
- Article
(2972 KB) - Full-text XML
-
Supplement
(2472 KB) - BibTeX
- EndNote


Free or combined amino acids (AAs) that make up proteins and cell walls in living organisms are ubiquitous chemical compounds found in various environments. In the atmosphere, they are commonly detected in the condensed phases due to their low vapor pressures. They have been studied and characterized in atmospheric particles (Barbaro et al., 2020; Matos et al., 2016), rainwater (Mace et al., 2003a, b; Xu et al., 2019; Yan et al., 2015), fog water (Zhang and Anastasio, 2003b), and more recently in cloud water (Bianco et al., 2016b; Triesch et al., 2021). Many efforts have been made in the past to assess their sources, their role in the atmospheric chemical and physical processes, and their fate (Cape et al., 2011). However, despite those investigations, their exact role in the atmosphere is still poorly understood. They have been studied for their hygroscopic properties since they can modify the ability of the particles to act as cloud condensation nuclei (CCN) (Chan et al., 2005; Kristensson et al., 2010; Li et al., 2013) or ice nuclei (IN) (Pummer et al., 2015; Szyrmer and Zawadzki, 1997). More recently, the role of AAs in new particle formation has also been discussed (Ge et al., 2018). This raises the question of their role in aerosol and cloud formation and hence in the radiative forcing of the Earth's surface. In atmospheric aqueous phases, some AAs have been found to potentially influence atmospheric chemistry by reacting with atmospheric oxidants (Bianco et al., 2016b; McGregor and Anastasio, 2001; Zhang and Anastasio, 2003a); the study from De Haan et al. even showed that AAs can react with glyoxal to form secondary aerosol mass (De Haan et al., 2011). AAs are part of the proteinaceous fractions of aerosol particles that significantly contribute to the organic carbon and organic nitrogen fraction of aerosol particles. Their presence in aerosol particles can modify their chemical properties such as acidity/basicity and buffering ability (Cape et al., 2011; Zhang and Anastasio, 2003b). Finally, AAs are also transferred by atmospheric deposition to other ecosystems such as aquatic surfaces, where they act as nutrients since they are particularly bioavailable (Wedyan and Preston, 2008). Atmospheric AAs can therefore contribute to the nutrient cycling at a global scale as well as the global carbon and nitrogen cycles.
AAs have been detected in the atmosphere under various contrasted environmental scenarios such as urban areas (Barbaro et al., 2011; Di Filippo et al., 2014; Ren et al., 2018; Zhu et al., 2020), background/rural sites (Bianco et al., 2016b; Helin et al., 2017; Samy et al., 2011; Song et al., 2017), marine environments (Mandalakis et al., 2011; Matsumoto and Uematsu, 2005; Triesch et al., 2021; Violaki and Mihalopoulos, 2010), and polar regions (Barbaro et al., 2015; Feltracco et al., 2019; Mashayekhy Rad et al., 2019; Scalabrin et al., 2012). The quantity and type of AAs detected in all the compartments (aerosol particles, cloud water, rainwater) vary over a wide range. Indeed, their emissions, residence times, and spatial and temporal distributions are driven by complex bio-physico-chemical processes occurring in the atmosphere (transport, chemical, and biological transformations, deposition, etc.). Proteinaceous materials detected in the atmosphere are mostly linked to emissions of primary biological aerosol particles that notably include viruses, bacteria, fungi, algae, spores, pollens, and fragments of plants and insects (Després et al., 2012; Fröhlich-Nowoisky et al., 2016). The main source is consequently of biogenic origin, but several anthropogenic sources can also contribute (industry, agricultural practices, wastewater treatment). It is suggested that AAs are directly emitted into the atmosphere or result from the transformations of proteins by enzymatic activity, decomposition by the temperature, or the photochemistry (Mopper and Zika, 1987). There are some studies highlighting other possible sources such as emissions by volcanoes (Scalabrin et al., 2012), biomass burning emissions (Chan et al., 2005), and marine emissions by sea bubble bursting (Barbaro et al., 2015; Matsumoto and Uematsu, 2005). Due to the wide variety of AA sources in the atmosphere, it is rather difficult to correlate AA concentration and speciation with specific sources: Abe et al. (2016) recently proposed using AAs as markers for biological sources in urban aerosols (Abe et al., 2016). Matsumoto and Uematsu (2005) suggested that the major source of free amino acids (FAAs) in aerosols over the remote North Pacific are related to long-range transport from continental areas. Scalabrin et al. (2012) used the AA ratio to evaluate aerosol aging in the atmosphere.
The analysis of AAs in the atmosphere is essential and has been widely conducted to document the concentrations of aerosol particles, their environmental variability, and their effects on atmospheric physico-chemical processes. AAs can also be transferred to the atmospheric aqueous media after activation of aerosol particles into cloud droplets. They consequently contribute to the complex dissolved organic matter measured in clouds that is composed of a significant fraction of biologically derived material (lipids, peptides, carbohydrates, etc.) (Bianco et al., 2018; Cook et al., 2017; Zhao et al., 2013). However, only a few studies focus on the detection of AAs in cloud water (Bianco et al., 2016b; Triesch et al., 2021), mainly because of the inherent difficulty in sampling clouds. AA concentration in cloud water results from the dissolution of the soluble fraction of the aerosol particles acting as CCN and IN; some very recent studies also argue that AAs could be processed in the cloud medium by the biological activity (Bianco et al., 2019). For instance, the biodegradation of AAs was demonstrated to occur in rainwater (Xu et al., 2020) and in microcosms mimicking the cloud environment (Jaber et al., 2021). The presence of transcripts of gene coding for AAs and protein biosynthesis and biodegradation has also been shown directly in cloud water samples (Amato et al., 2019). AAs can also be photo-transformed by abiotic processes, mainly implying oxidants (Jaber et al., 2021). They can produce other compounds such as carboxylic acids, nitrate, and ammonia (Berger et al., 1999; Berto et al., 2016; Bianco et al., 2016a; Marion et al., 2018; Pattison et al., 2012), thus potentially contributing to the formation in the aqueous phase of secondary organic aerosol (“aqSOA”). It is therefore crucial to document AA concentration levels and speciation in clouds.
This aim of this work is the quantification of FAAs in cloud waters. This is quite a challenge due to the chemical complexity of the cloud medium and the low concentration of FAAs (≈ µM). In atmospheric waters, namely fog (Zhang and Anastasio, 2003b), rain (Gorzelska et al., 1992; Mopper and Zika, 1987; Xu et al., 2019; Yan et al., 2015), and clouds (Bianco et al., 2016b), the main technique that has been commonly used is liquid chromatography coupled with fluorescence detection. This approach is based on pre- or post-column derivatization of the AAs to increase the sensitivity and simplify the separation by chromatography, but it is time-consuming. More recently, Triesch et al. (2021) have used liquid chromatography hyphened to mass spectrometry (LC-MS) to detect derivatized AAs after concentration of cloud water samples. The use of LC-MS represents a significant improvement as it allows a unique identification. We propose here to go further using LC-MS without pre-concentration and derivatization of the sample. In addition, to overcome the matrix effect, we propose quantifying the AAs by the standard addition method (Hewavitharana et al., 2018). Cloud sampling is performed at the Puy de Dôme station (PUY) in France, offering the possibility of collecting 13 samples for various environmental conditions. Variability of cloud AA concentrations together with cloud bio-physico-chemical properties and air mass history is thus discussed in this work.
2.1 Site and cloud sampling
Thirteen clouds were sampled from 2014 to 2020 at the Puy de Dôme station in France (45.77∘ N, 2.96∘ E; 1465 m a.s.l.). This mountain observatory is part of the multi-site platform CO-PDD combining in situ and remote sensing observations at different altitudes (Baray et al., 2020). The PUY belongs to international atmospheric survey networks: ACTRIS (Aerosols, Clouds, and Trace Gases Research Infrastructure), EMEP (the European Monitoring and Evaluation Program), and GAW (Global Atmosphere Watch) as examples. Meteorological parameters, atmospheric gases, aerosols, and clouds are monitored over a long-term period to investigate the bio-physico-chemical processes linking those elements and to evaluate the anthropogenic forcing on climate.
The sampling is performed using aluminum cloud water collectors under non-precipitating and non-freezing conditions as described in Deguillaume et al. (2014). Cloud droplets are collected by impaction onto a rectangular plate which then flows directly into a sterilized bottle going through a funnel. The impactor has an estimated cut-off diameter of 7 µm. Before cloud collection, cloud impactors are cleaned using milliQ water and sterilized by autoclaving. Immediately after sampling, a fraction of the aqueous volume is filtered using a 0.2 µm nylon filter (Fisherbrand™) to eliminate microorganisms. The samples are then stored in the dark and frozen at −20 ∘C (adenosine triphosphate – ATP – ion chromatography, total organic carbon, and amino acids). For cell counts, samples are stored at 4 ∘C after adding a fixative. The analyses are performed shortly thereafter.
2.2 Physical, chemical, and microbiological characterization of clouds
A systematic characterization is performed on cloud samples allowing us to document the available PUYCLOUD database (http://opgc.fr/vobs/so_interface.php?so=puycloud, last access: 10 January 2022) of the cloud water chemical and biological composition (Renard et al., 2020). These data are reported in Table S1 for the studied cloud events.
Chemical composition analyses are performed on cloud samples: pH, total organic carbon (TOC) concentration, and concentrations of the main inorganic ionic species. TOC analyses are performed with a TOC analyzer (Shimadzu, TOC-5050A). The spectrofluorimetric method based on the reactivity of p-hydroxyphenylacetic acid with horseradish peroxidase is used to measure the concentration of H2O2 in cloud water (Wirgot et al., 2017). Ionic inorganic species (Ca2+, K+, Mg2+, Na+, NH, Cl−, SO, and NO) are measured by ion chromatography (Deguillaume et al., 2014).
Cloud microphysical properties are determined with the Gerber Particle Volume Monitor-100 (PVM-100) providing liquid water content (LWC) and effective droplet radius (re) parameters (Gerber, 1991).
The biology of cloud water is also assessed by quantification of bacterial density (CFU mL−1) at 17 ∘C (Vaïtilingom et al., 2012), and ATP concentration is measured using the BioThema© ATP Biomass Kit HS (Koutny et al., 2006).
2.3 Quantification of AAs
2.3.1 Sample preparation
Before analysis by LC-MS, in order to apply the standard addition method to quantify AAs (Hewavitharana et al., 2018), standard solutions are used to spike cloud water samples. Standard solutions are prepared in ultra-pure water and contained alanine (Ala, SIGMA-ALDRICH), arginine (Arg, SIMAFEX), asparagine (Asn, SIGMA-ALDRICH), aspartate (Asp, SIGMA-ALDRICH), glutamine (Gln, SIGMA-ALDRICH), glutamic acid (Glu, SIGMA-ALDRICH), glycine (Gly, MERCK), histidine (His, SIGMA-ALDRICH), leucine/isoleucine (Leu/I, SIGMA-ALDRICH), lysine (Lys, SIGMA-ALDRICH), methionine (Met, SIGMA-ALDRICH), phenylalanine (Phe, ACROS organics), proline (Pro, SIGMA-ALDRICH), serine (Ser, SIGMA-ALDRICH), threonine (Thr, SIGMA-ALDRICH), tryptophan (Trp, SIGMA-ALDRICH), tyrosine (Tyr, SIGMA-ALDRICH), valine (Val, SIGMA-ALDRICH), and cysteine (Cys, SIGMA-ALDRICH). The ratio between the sample volume and the standard solution volume is 9:1. The mixture is then vortex-mixed for 1 min.
Ten samples ready for LC-MS analysis are prepared from approximately 1 mL of cloud water, containing the original cloud water added with 20 AAs at final concentrations set to 1.0, 5.0, 10, 25, 50, 100, 150, and 500 µg L−1. This range of concentrations is appropriate considering previous quantification of AAs in cloud waters sampled at the PUY (Bianco et al., 2016b). This also allows us to cover a large range of AA concentrations that can be highly variable depending on the cloud events. An L-Lys isotope (13C6, 99 %; 15N2, 99 %) is also added to each sample at the concentration of 15 µg L−1 for mass calibration ().
2.3.2 LC-MS analysis
LC-MS analyses are performed using an UltiMate™ 3000 (Thermo Scientific™) LC equipped with a QExactive™ Hybrid Quadrupole-Orbitrap™ Mass Spectrometer (Thermo Scientific™) ionization chamber. Chromatographic separation of the analytes is performed on a BEH Amide/HILIC (1.7 µm, 100 mm × 2.1 mm) column with a column temperature of 30 ∘C. The mobile phases consist of 0.1 % formic acid and water (A) and 0.1 % formic acid and acetonitrile (B) with a 0.4 mL min−1 flow rate. A four-step linear gradient is applied during the analysis: 10 % A and 90 % B for 8 min, 42 % A and 58 % B for 0.1 min, 50 % A and 50 % B for 0.9 min, and 10 % A and 90 % B for 3 min.
The Q-Exactive™ ion source is equipped with electrospray ionization (ESI) and Q-Orbitrap™. The volume of injection is 5 µL, and the flow injection analyses are performed for individual AA solutions to obtain the mass spectral data, from which ions are carefully chosen for analysis in the selected ion monitoring (SIM) mode using the aforementioned parameter conditions. The mass resolution is set to 35 000 FWHM (full width at half maximum), and the instrument is tuned for maximum ions throughput. AGC (automatic gain control) target or the number of ions to fill CTrap is set to 105 with an injection time of 100 ms. Tests with standard solution and cloud water samples show a better sensitivity in positive mode of ionization for all AAs and with a preference for [M + H]+ ionization (ESI+). Other Q-Exactive™ generic parameters are N2 flow rate set at 13 a.u., sheath gas (N2) flow rate set at 50 a.u., sweep gas flow rate set at 2 a.u., spray voltage set at 3.2 kV in positive mode, capillary temperature set at 320 ∘C, and heater temperature set at 425 ∘C.
Analysis and visualization of the data set are performed using Xcalibur™ 2.2 software; it allows controlling and processing of data from Thermo Scientific™ LC-MS systems and associated instruments. Examples of chromatograms and MS spectra for three AAs (Ser, Val, and Trp) are presented in Fig. S1a, b, c. For quality control, one cloud sample has been analyzed in MS2 to check the presence of isobaric molecules. The peak with a retention time of 2.89 min and of 1 180 867 [M + H]+ has been found to correspond to the mixture of two isobaric molecules: valine and betaine (Fig. S2). Therefore, Val cannot be quantified. Leu and Ile could not be distinguished either as they are isobaric with the same retention time (hereafter Leu/I). Cys is not quantifiable as it forms S–S bonds. Consequently, 18 AAs can be quantified in this study: Ala, Arg, Asn, Asp, Gln, Glu, Gly, His, Leu/I, Lys, Met, Phe, Pro, Ser, Thr, Trp, and Tyr. The retention times and exact masses measured by LC-MS of all the AAs are summarized in Table S2.
2.3.3 Standard addition
Cloud water is a complex mixture conducive to disturbance in the LC-MS analytical signal. To restrain this matrix effect, the AA quantification is performed with the method of the standard addition, which consists of the addition of a series of small volumes of concentrated standard to an existing unknown. For each AA, this method provides a calibration curve. Figure S3 shows, as an example, how the concentration of Gly is measured for a particular cloud event (11 March 2020 cloud) using the standard addition method. The magnitude of the intercept on the x axis of the trend line is the original concentration of Gly.
Table S3 displays calibration curve data measured for the 13 different cloud samples for each AA. The linearity of the calibration curves is attested by the high R2 values (>0.95). The AA concentrations and their standard deviation (SD) are calculated according to the equation from Bader (1980). More details can be found in the Supplement (Fig. S3 and attached explanations of the calculations).
2.4 Evaluation of air mass history
The CAT model (Computing Atmospheric Trajectory Tool) is a three-dimensional (3D) forward–backward kinematic trajectory code which has recently been developed and used to characterize the atmospheric transport of air masses reaching the PUY station (Renard et al., 2020). Back-trajectory clusters have been calculated for all clouds included in the PUYCLOUD database. The temporal resolution of the back-trajectories is 15 min, and the total duration is 72 h. The model is initialized with wind fields from ECMWF ERA-5 reanalyzed with a horizontal resolution of 0.5∘ and 23 vertical pressure levels between 200 and 1000 hPa. On the basis of the atmospheric boundary layer height (ABLH) and the altitude of topography interpolated for each trajectory point, this numerical tool allows us to calculate the percentage of points above the sea and the continental surfaces (sea surface vs. continental surface), hereafter named the “zone”. A “zone matrix” is thus constructed from CAT model outputs and used for a statistical classification of each cloud event. All the data relative to the 13 clouds of this study are reported in Table S1.
According to the classification proposed by Renard et al. (2020), cloud samples are classified into four categories, “marine”, “highly marine”, “continental”, and “polluted”, by means of an agglomerative hierarchical clustering (AHC) based solely on their chemical concentrations (Cl−, Mg2+, Na+, NH, SO, and NO). This allows classification of clouds into four categories: “highly marine”, “marine”, “continental”, and “polluted”. The “marine” clouds have the lowest ion concentrations, and most of them come predominantly from the western sectors. The marine category is predominant and the most “homogeneous” in terms of concentrations. The “highly marine” category with a similar air mass history gathers clouds with the highest sea-salt concentrations (Cl−, Mg2+, and Na+). The continental category corresponds mainly to air masses with high concentrations of potentially anthropogenic ions (NH, NO, and SO) arriving predominantly from the northeastern sector. Finally, the “polluted” category gathers cloud samples with the highest anthropogenic ion concentrations. All the data relative to the clouds studied in the present work are reported in Table S1 and come from the PUYCLOUD data set.
2.5 Statistical analysis
With the objective of categorizing cloud samples, we performed AHC, an iterative classification, based on AA concentrations. The AHC dendrogram shows the progressive grouping of the data. The dissimilarity between samples is calculated with Ward's agglomeration method using Euclidean distance. The number of categories to retain is automatically defined on the basis of the entropy (Addinsoft, 2020).
A large variability of the AA concentrations and relative proportions in the 13 cloud samples from the PUY is observed. In order to better understand this variability, a partial least square (PLS) regression is performed to analyze the correlations between the explanatory (X) and dependent (Y) variables. The X variables gather the biological (ATP and bacteria density), physical (temperature and pH), and chemical (TOC, Ca2+, K+, Mg2+, Na+, NH, Cl−, NO, and SO concentration) parameters, the “zone” matrix (sea/continental surface ABLH), as well as the seasons. The Y variables are the 18 AA concentrations (Ala, Arg, Asn, Asp, Gln, Glu, Gly, His, Leu/I, Lys, Met, Phe, Pro, Ser, Thr, Trp, and Tyr). The Mann–Whitney nonparametric tests are carried out to validate significant differences (p value < 0.05) between two groups (Renard et al., 2020).
3.1 Evaluation of the LC-MS technique for a direct measurement of AAs in cloud
The analytical method used in this study allows assaying of AAs directly in cloud samples. MS coupled to LC allows the analysis of the underivatized and non-concentrated analytes, avoiding potential biases and time-consuming processes. The standard addition method also restrains matrix effects, which are very commonly encountered with environmental matrices (Hewavitharana et al., 2018). Eighteen AAs in cloud water sampled at the PUY have been identified and their concentrations quantified (Table S1). Concentration values obtained for all AAs and cloud samples – as well as the standard deviation of the measurements (SDM) (i.e., the precision of the measurements of AA concentrations) – are reported in Table S3 and detailed in Fig. S3. The median SDM is 12 nM (ranging from 6 for Trp to 44 nM for Ser). The relative standard deviation (RSD) ranges from 8 % for Ala to 119 % for Arg (median: 23 %).
The SDM values, as calculated in this work in the context of a standard addition (equation detailed in Fig. S3), could be compared to the limit of quantification (LOQ) established in works using an internal standard method (Bader, 1980). Both equations are similar and provide comparable results. However, the precision depends on the number of standard points added in the method and not on the number of replicates. The values in this work are globally low and consistent with those reported in previous works on cloud waters and aerosol particles (Table S4). A recent study performed by Triesch et al. (2021) was able to quantify Val in cloud water samples, but they could not measure Arg, Asn, His, Lys, Cys, and Tyr concentrations. Triesch et al.'s (2021) study is also based on LC-MS (Orbitrap™) but with samples concentrated (factor 44) and derivatized with a pre-column. They reported LOQ values ranging from 0.2 to 1.0 µg L−1 vs. SDM from 1.1 to 4.6 µg L−1 in this study. SDM values are also within the same range of magnitude as those reported for aerosol particles by Helin et al. (2017) using direct injection of extracted AAs in LC-MS (triple-quadrupole technology), with values varying from 4 to 160 nM vs. SDM values from 8 to 44 nM in this work.
Looking more carefully at the median of the AA concentration RSDs (calculated from data displayed in Table S3), it appears that some AAs (Ala, Gly, Leu/I, Pro, Ser, and Thr) have low RSDs (from 8 % to 13 %), while others (Tyr, Lys, Trp, Gln, Met, and Arg) present higher RSDs (from 44 % to 119 %). The RSD values obtained in this work are within the same range of order as those reported by Helin et al. (2017). To conclude, these uncertainties do not change the final range of magnitude of the AA concentrations.
3.2 Cloud physico-chemical characteristics
Table S1 presents data characterizing properties of cloud samples (chemical composition, microphysical properties, air mass history). Among the 13 studied clouds, 12 clouds are classified as “marine” according to their ion concentrations (Renard et al., 2020). The 17 July 2020 cloud from the northeast is classified as “continental” due to its NH, NO, and SO concentrations that are significantly higher than the other studied clouds (Table S1).
Similarly to the work performed by Renard et al. (2020), the CAT model is used to characterize the air mass history of the cloud samples. Figure 1 represents the mean back-trajectories calculated over the sampling period of the 13 cloud samples. Fig. S4 presents the back-trajectory calculations, every hour, for individual cloud events over the sampling period. The CAT model provides a “zone matrix” (Table S1) gathering the percentage of time spent by the air masses over the sea surface and over the continental surface with the discrepancy between the presence within the boundary layer (< ABLH) or in the free troposphere (> ABLH). During the 72 h back-trajectories, the air masses, on average, spent significant time in the free troposphere (≈80 %) and above the sea surface (56 %) (Fig. 1 and Table S1). This is consistent with the conclusion by Renard et al. (2020) arguing that the marine category is the most encountered one at the PUY, a category characterized by a low ionic content. However, even if the sampled clouds belong mainly to one category (“marine”), they present chemical compositions that vary significantly from one sample to the other. This is discussed in the following section, where AA content is presented and its variability analyzed.

Figure 1Back-trajectory plots of air masses reaching the PUY. Colors correspond to the air mass height minus the atmospheric boundary layer height (ABLH). Positive values (> ABLH, red) indicate the air mass is in the free troposphere. Negative values (< ABLH, blue) indicate the air mass is within the boundary layer. Each trajectory plot is the mean value of a cluster of 45 CAT trajectories calculated over 72 h, every hour from the beginning to the end of the cloud sampling period. Trajectory points are calculated every 15 min, and dots in the figure indicate 12 h intervals. All the trajectory clusters (without averaging) for each of the 13 events are given in Fig. S4.
3.3 Quantification of AAs in cloud waters
3.3.1 Concentration and distribution of AAs at the PUY
AA concentrations (nM) measured in the 13 cloud samples are reported in Table S1. Figure 2 represents the distribution of AA concentrations; minimum, maximum, mean, SD, and RSD of concentrations of those compounds are reported in Table 1.
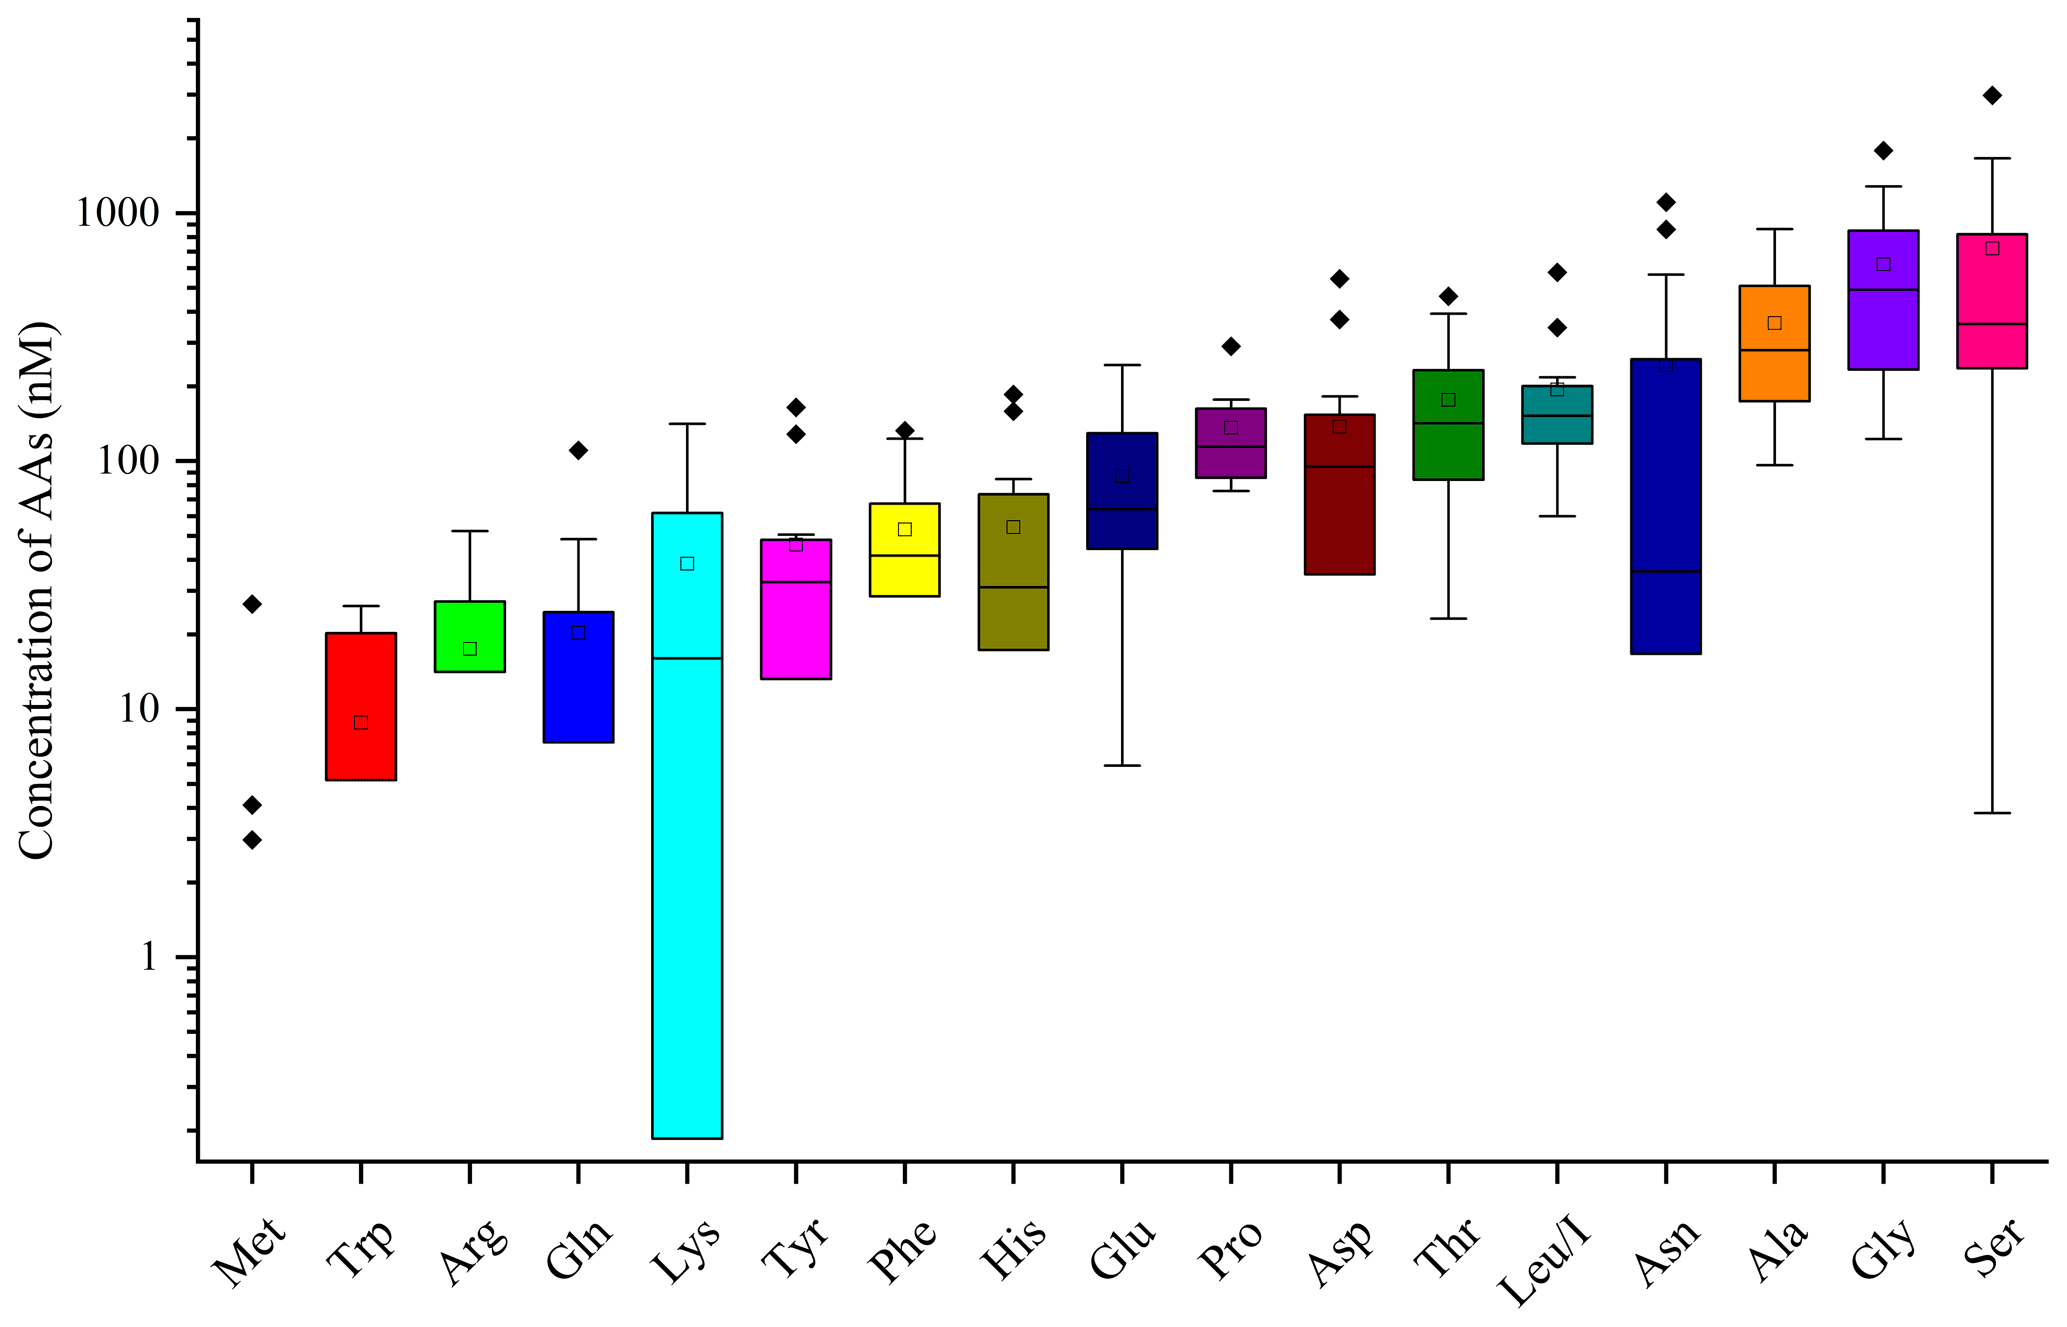
Figure 2Distribution of each AA for the 13 cloud samples. AA concentrations are in logarithmic scale. The bottom and top lines of the box correspond to the 25th and 75th percentiles, respectively. The middle line represents the median value and the square the mean value. The ends of the whiskers are the 10th and 90th percentiles, and the filled diamonds are outliers (concentrations above the 90th percentile).
Table 1Distribution of AA concentrations measured in the 13 clouds sampled at the PUY: minimum, maximum, mean, standard deviation (SD), and relative standard deviation (RSD).
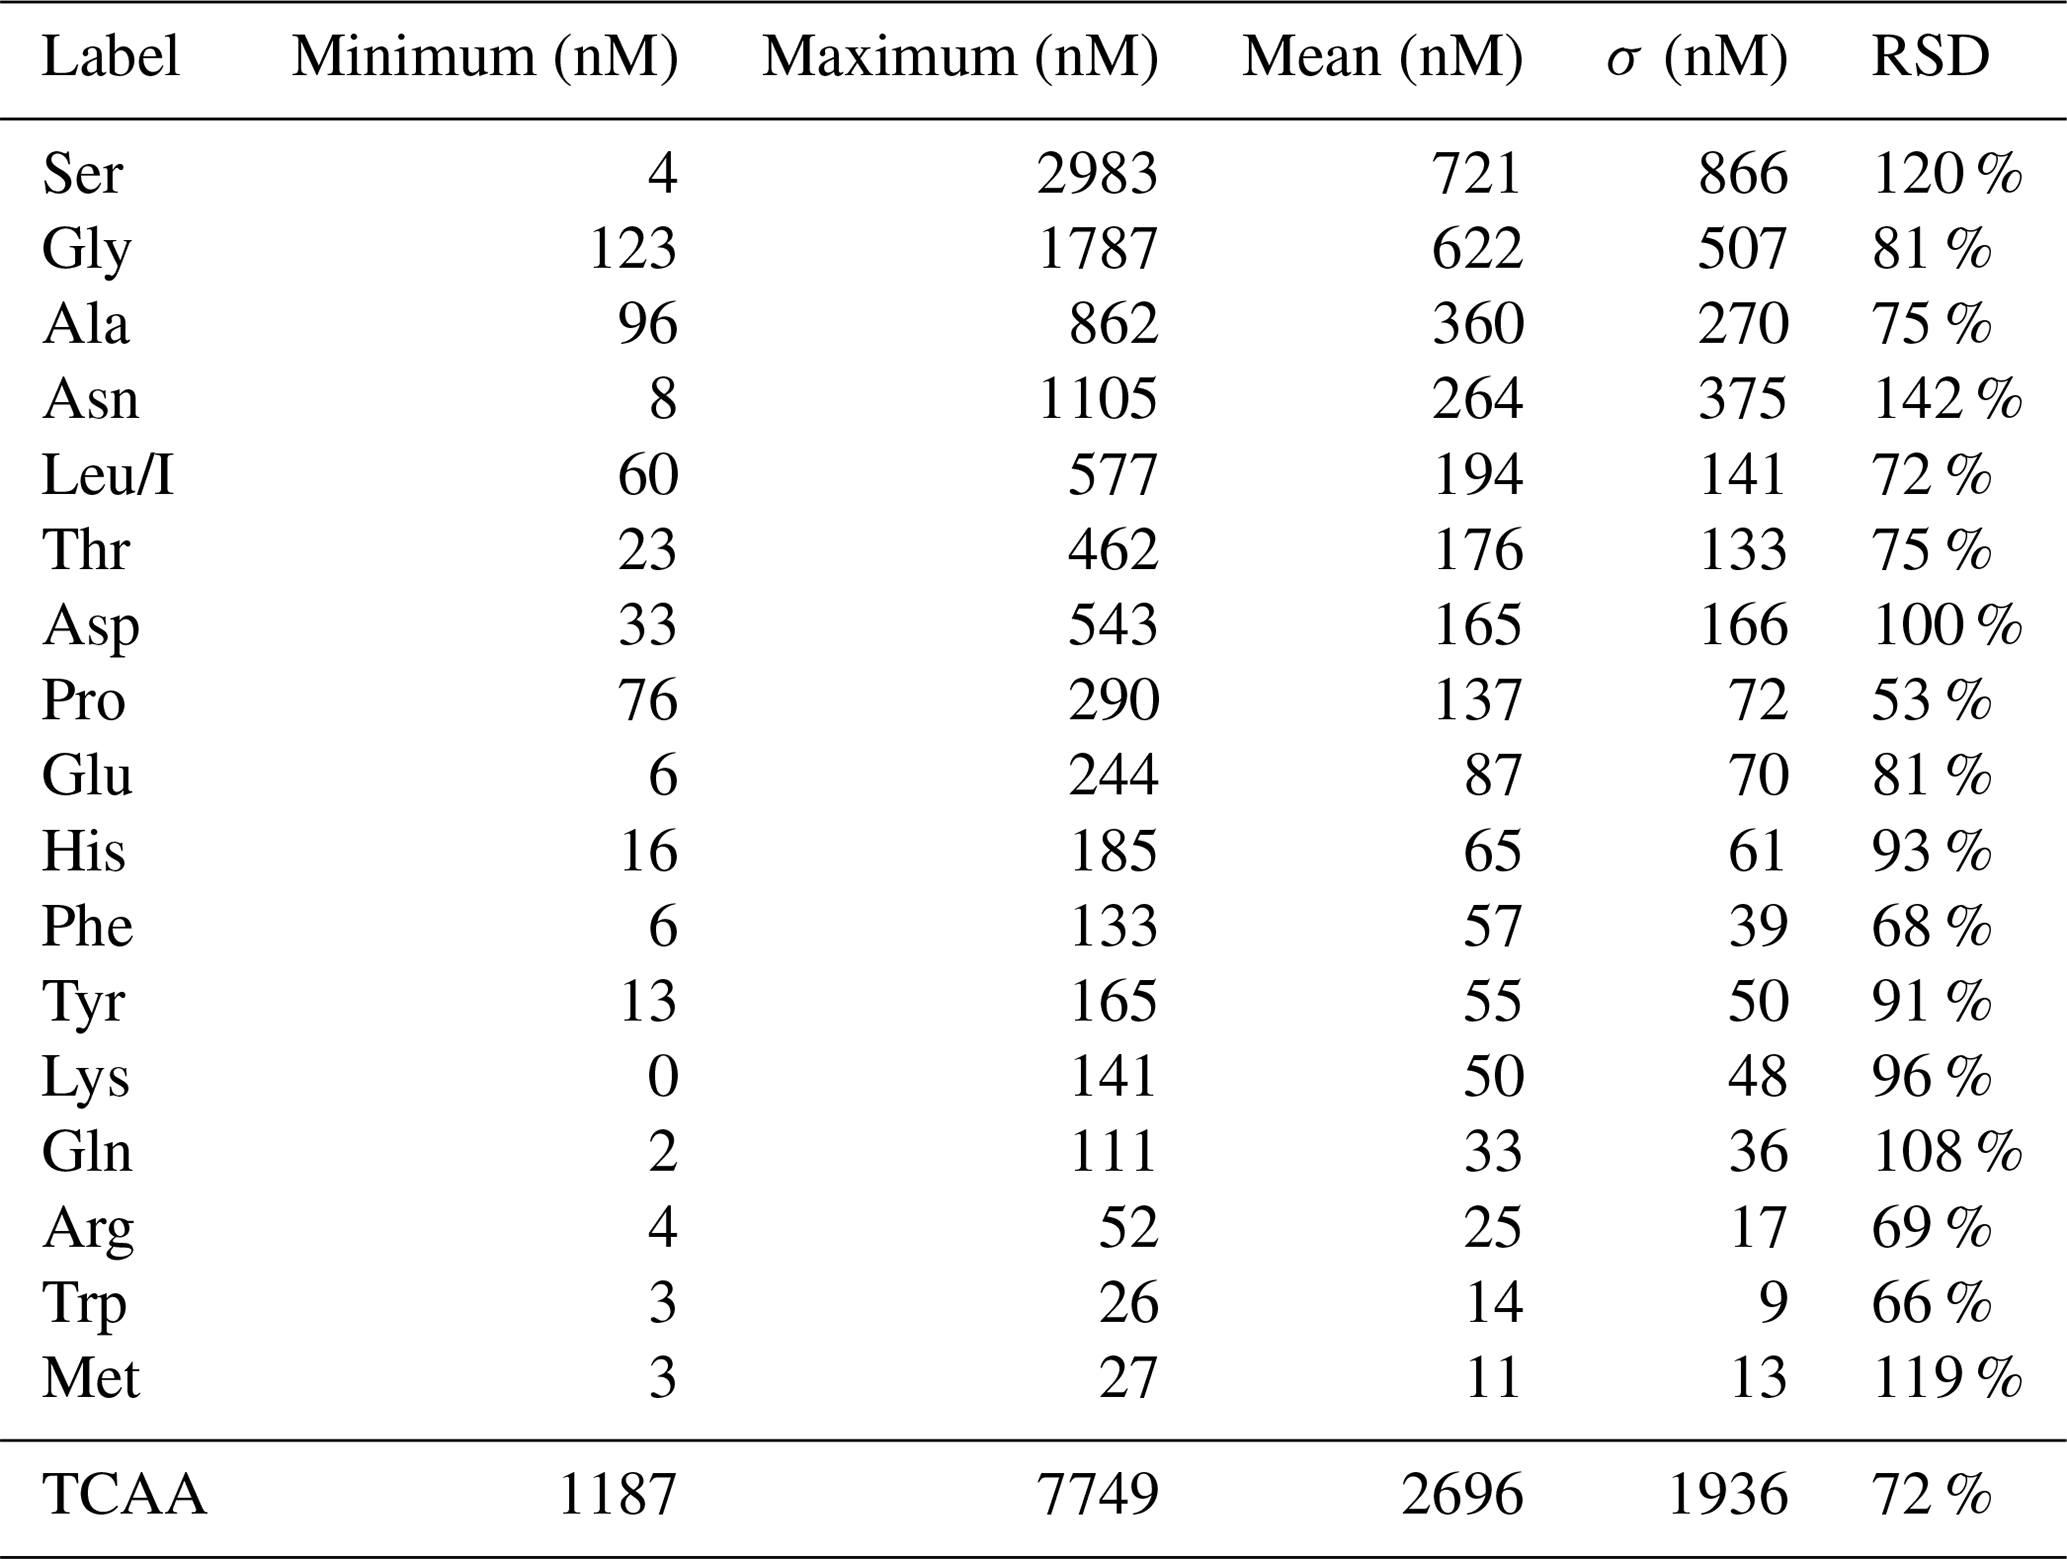
The total concentrations of free amino acids (TCAAs) vary significantly between cloud samples: the lowest concentration is 1.2 µM (24 September 2018 cloud), and the highest one is 7.7 µM (2 October 2019 cloud), while the mean value is equal to 2.7 µM (Table 1 and Fig. 3a). In detail, Ser is the most abundant AA in the 13 cloud samples, with the highest SD (from 4 to 2983 nM), followed by Gly (from 123 to 1787 nM), Ala (from 96 to 862 nM), and Asn (from 8 to 1105 nM) (Fig. 2). This ranking seems common and ubiquitous, from polar to urban sites, in clouds as in rainwater or aerosols (Table S4). Ser is also preponderant in marine clouds at Cape Verde (Triesh et al., 2021) and rural fogs in northern California (Zhang and Anastasio, 2003b).
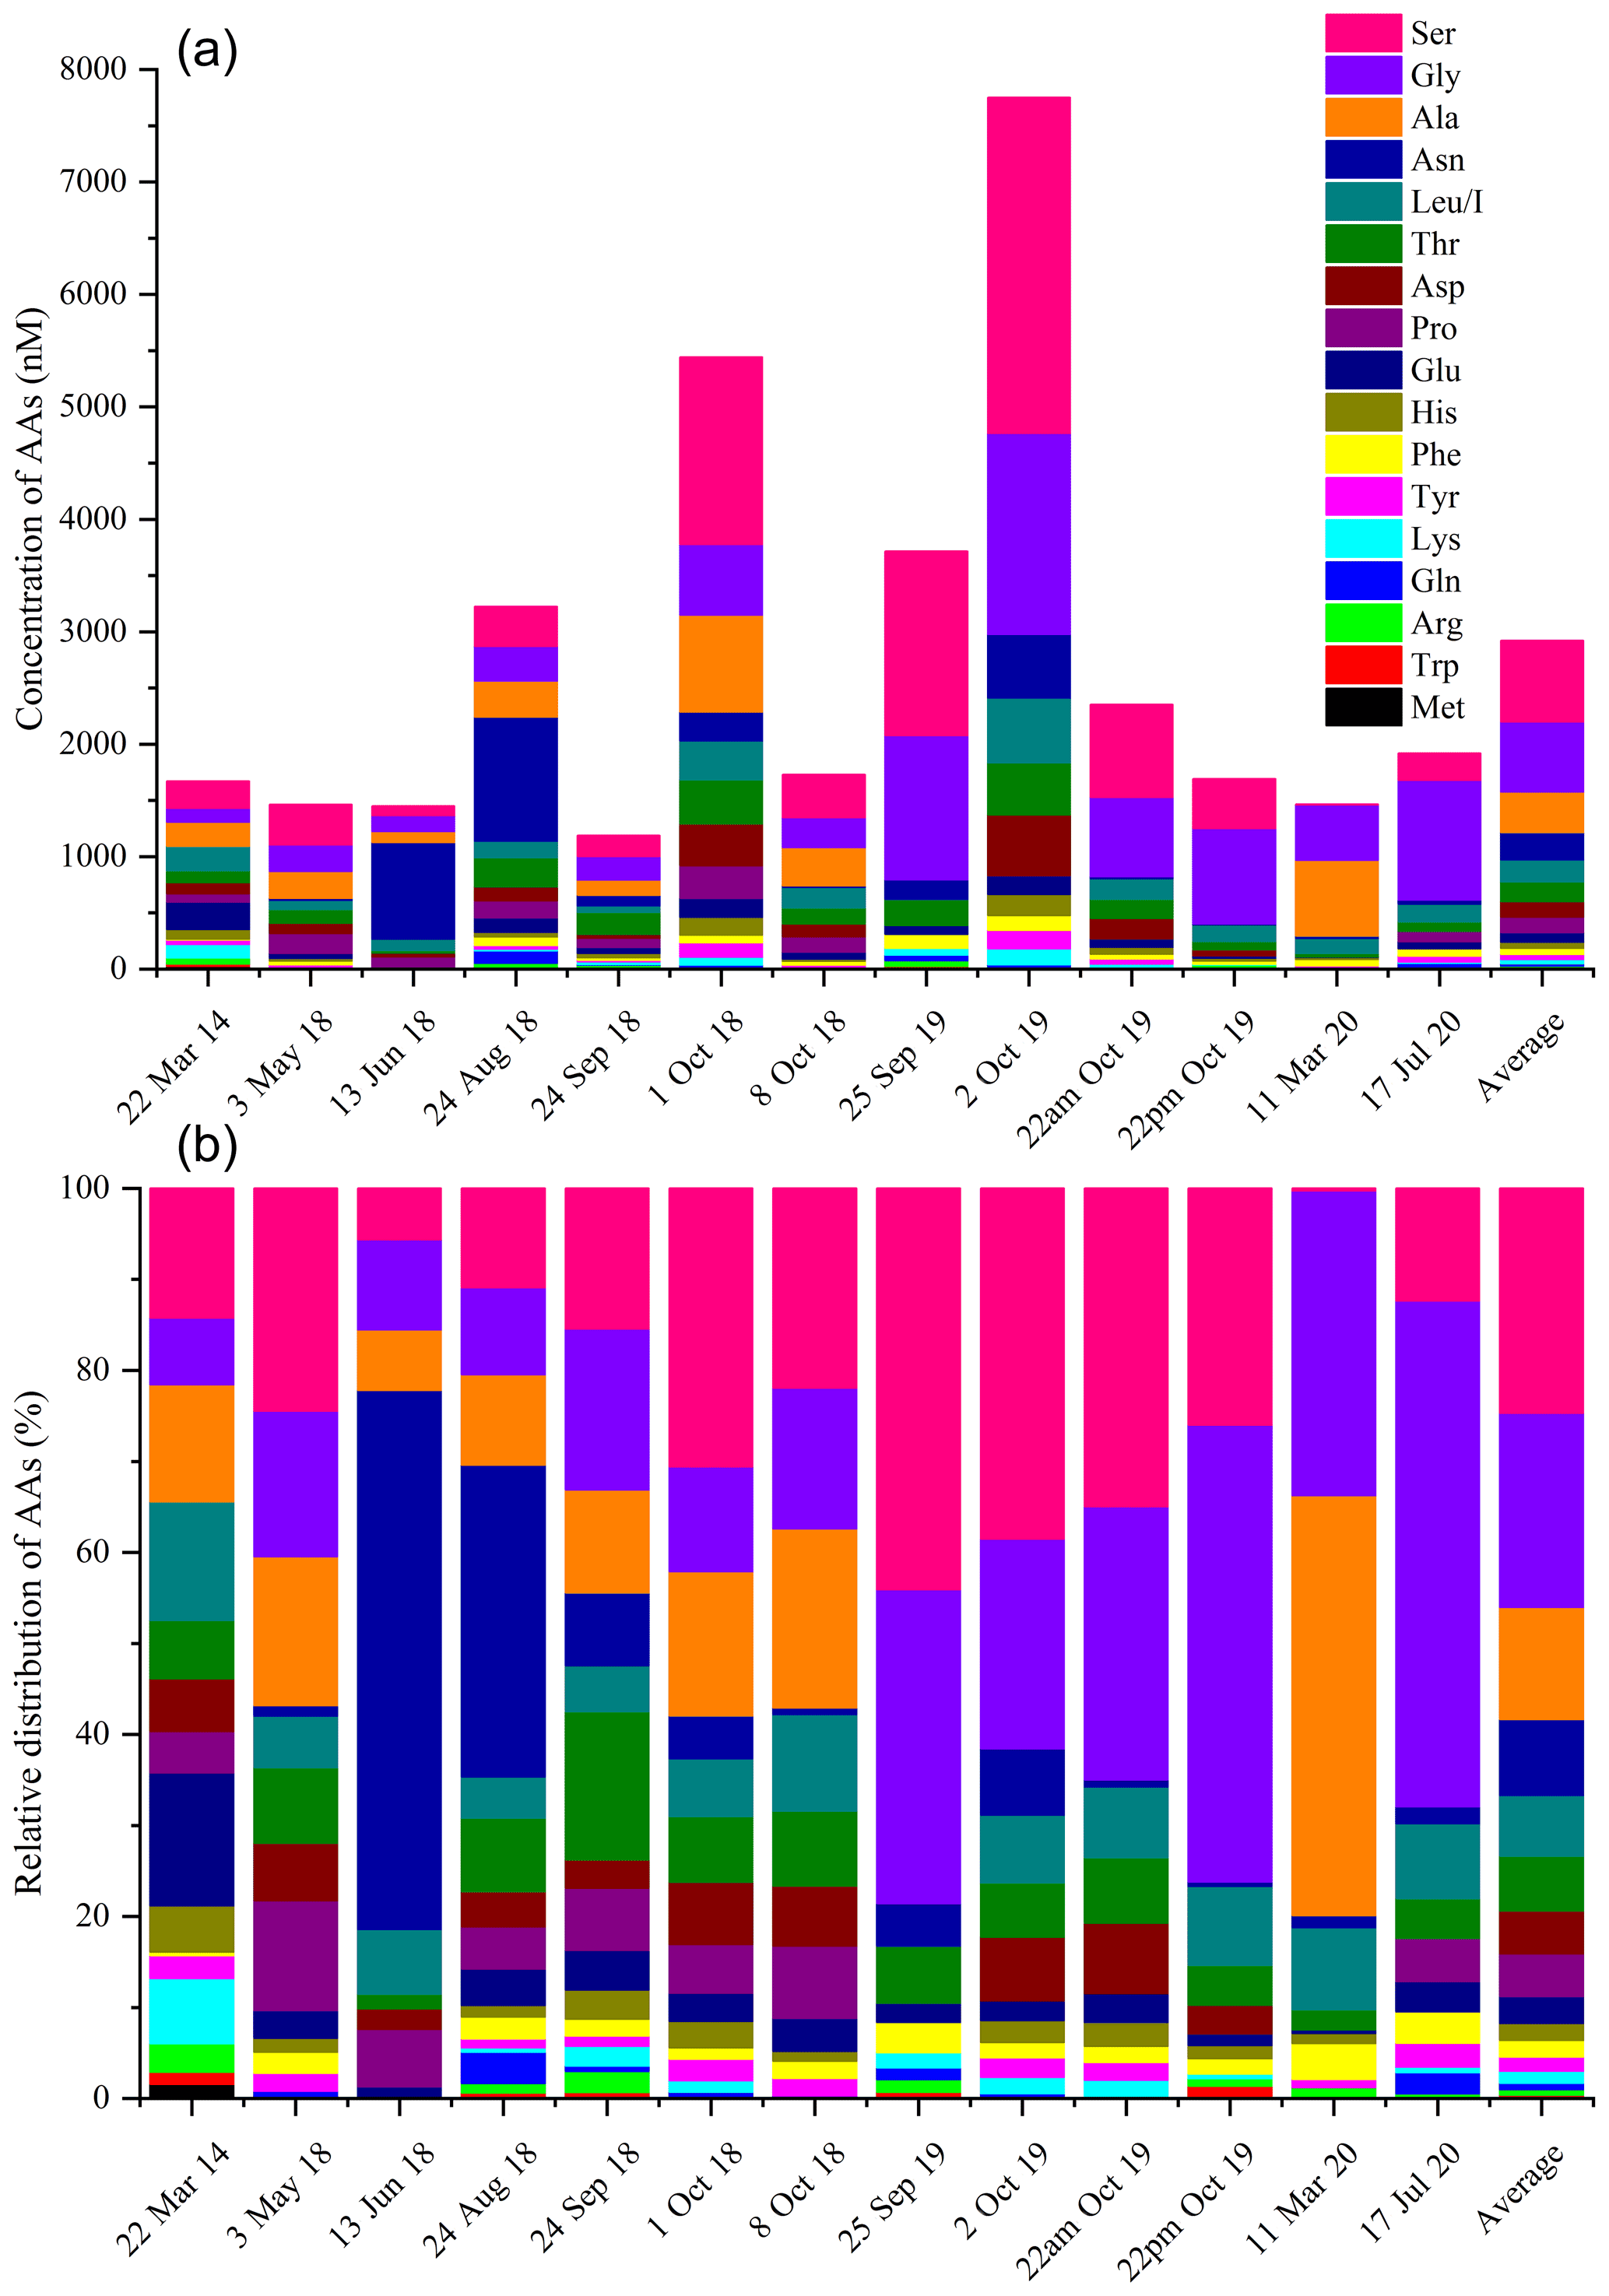
Figure 3(a) Distribution (nM) and (b) relative contributions (% nM) of AA molar concentrations in each cloud event sampled at the PUY.
Figure 3 illustrates for each cloud event the relative and absolute molar concentrations of AAs. As discussed above, the TCAAs strongly vary between the different cloud events (Fig. 3a). Their relative concentrations (Fig. 3b) also vary among the cloud samples. For example, Ser contribution exceeds 50 % in the 25 September 2019 cloud, while Ser is almost absent in the 11 March 2020 cloud sample and vice versa for Ala. Asn prevails in the 13 June 2018 and 24 August 2018 clouds. Nevertheless, the relative concentrations are quite similar, and the highest TCAAs do not seem to be explained by the mere presence, in excess, of a single AA.
AHC, used to categorize cloud samples based on the AA concentration, successfully groups the 13 observations, with a satisfactory cophenetic correlation (correlation coefficient between the dissimilarity and the Euclidean distance matrices) of (Fig. 4a). The dotted line in Fig. 4a represents the degree of truncation (dissimilarity = 5.7 × 10⁶) of the dendrogram used for creating categories. This truncation is automatically chosen based on the entropy level. The AHC profile plot (Fig. 4b) details the average composition of these two categories determined from the 18 AAs.

Figure 4(a) Dendrogram representing the agglomerative hierarchical clustering (AHC) based on dissimilarities using Ward's method on concentrations of the 18 AAs. The 13 cloud samples are assigned to one of two established categories by entropy (i.e., dissimilarity <5.7×10⁶). (b) Profile plot established by the AHC from the 18 main AAs. The y axis, in logarithmic scale, displays the average AA concentrations of the category.
AHC establishes two different categories which reflect the variability of AAs in the 13 cloud samples. In detail, the blue category gathers 10 cloud samples with lower AA concentrations. This blue category is the most homogeneous one (within-class variance = 3.7 × 10⁵) compared to the red category (within-class variance = 1.2 × 10⁶). Conversely, the red one, more heterogeneous, gathers three cloud samples with higher AA concentrations except for Met (absent in most of the 13 samples).
AHC reveals two categories significantly different which are not explained by a punctual excess of certain AAs such as Ser or Gly. This cannot be concluded by only analyzing Fig. 3 and confirms the advantage of using AHC. AHC allows us to perform a nonparametric test (Mann–Whitney test, not shown). Because the computed p value is lower than the significance level alpha = 0.05, the distribution of nine AA (Asp, Gly, His, Leu/I, Lys, Phe, Ser, Thr, and Tyr) concentrations can be accepted as significantly different between both AHC categories.
Note that the 13 June 2018 and 24 August 2018 cloud samples are isolated in the AHC blue category due to their high Asn concentration.
3.4 Comparison with previous studies on clouds, fogs, and rain
To our knowledge, only two studies refer to the AA characterization in cloud water (Table 2). A first one has been performed at the PUY on 25 cloud samples; 16 AAs have been quantified by a different analytical procedure using high-performance liquid chromatography connected to a fluorescence detection after derivatization of the AAs (Bianco et al., 2016b). They report a mean TCAA concentration of 2.67 µM with values ranging from 1.30 to 6.25 µM. These reported concentrations are within the same range of magnitude as those of the present study (from 1.2 to 7.7 µM). However, the main difference between the present study and Bianco's study lies in the relative concentrations of the various AAs. Trp, Leu/I, Phe, and Ser were the four most concentrated AAs (mean concentrations of 563, 548, 337, and 281 nM, respectively), while we found Ser, Gly, Ala, and Asn to be the most abundant AAs (mean concentrations of 721, 622, 360, and 264 nM, respectively). This discrepancy could result from sampling characteristics; i.e., cloud waters in Bianco's study have been sampled during two short periods (March/April and November 2014), whereas in the present work, cloud waters have been collected over 6 years and cover different seasons.
Table 2FAA concentrations in atmospheric aqueous samples: cloud, fog, and rain (n is relative to the number of samples).
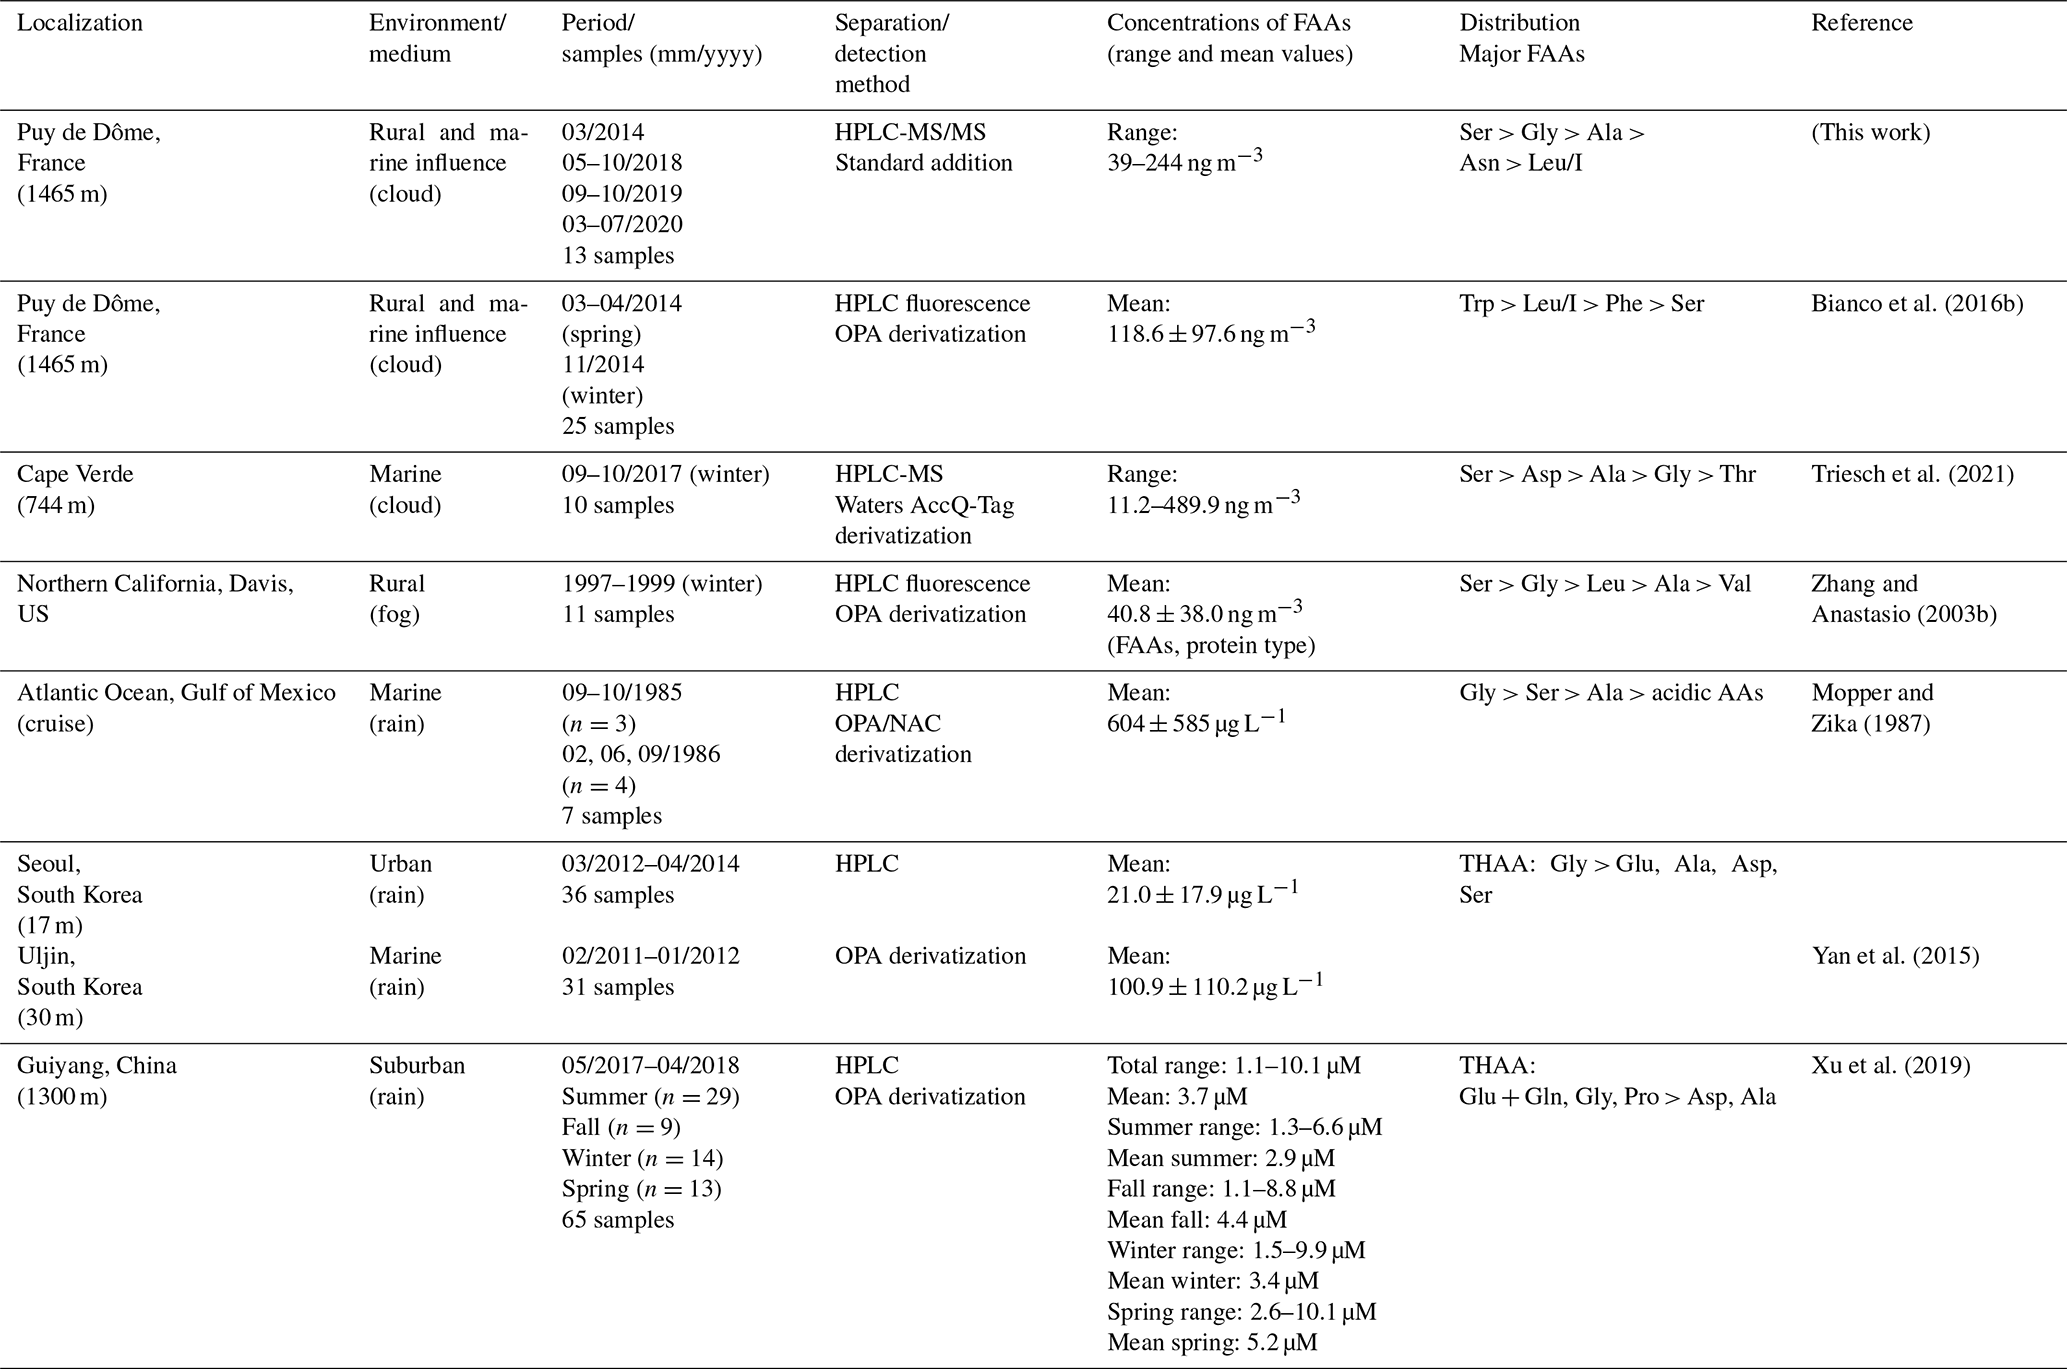
HPLC: high-performance liquid chromatography. OPA: ortho-phthalaldehyde. THAAs: total hydrolyzable amino acids. Analysis of the environmental variability.
The second one is a recent study reporting the characterization of AAs in cloud waters sampled at a marine site, Cape Verde (Triesh et al., 2021). Results also indicate variability of AA concentrations in cloud samples, with values varying from 11.2 to 489.9 ng m−3. These TCAAs are within the same range of magnitude as observed in this study (from 39 to 244 ng m−3). In both studies (Cape Verde and PUY), Ser, Ala, and Gly are amongst the major AAs, but Asp is found to be highly concentrated in the Cape Verde study. They also find that the relative distributions of these four AAs greatly change during the campaign period. Gly and Ser are found to be the dominant AAs in the first seven cloud samples, while Ala and Asp are also highly present together with Gly and Ser during the last part of the campaign (three samples). They conclude that these differences are due to the different types of clouds sampled during this campaign. Triesch et al. (2021) show that some clouds present low TCAAs (less than 65 ng m−3), with a dominance of Gly and Ser and a second group with elevated TCAAs (more than 250 ng m−3) and Ser as major AAs, followed by Ala and Gly. This enrichment of cloud waters in AAs could be due to oceanic sources or may be the result of in situ formation of AAs in cloud water by for example enzymatic degradation of proteins, as reported by the authors. These hypotheses are also supported by elevated concentrations of Asp at the end of the campaign, which is a biologically produced AA. Globally, the concentrations and major groups of AAs reported by Triesch et al. (2021) agree with the present work. This can be explained by the remoteness of both locations and also the relevant marine influence encountered at the PUY (Renard et al., 2020).
In fog waters, at Davis in northern California, Zhang et al. (2003b) measured elevated concentrations of TCAAs, with a mean concentration of 20 µM. This is probably due to the proximity of the sampling site collection to local emissions of aerosol particles in this rural environment; however, the dominant AAs are the same (Ser, Gly, Ala, Asn, and Leu/I). Two other studies in rainwater display similar AA concentrations and concentration rankings (Yan et al., 2015; Xu et al., 2019). The study in Korea measured lower AA concentrations (free and combined AAs) at Seoul (an inland urban area) than those at Uljin (a coastal rural area) attributed to differences in the contributing sources (Yan et al., 2015). Similar work was performed at a suburban site in Guiyang (China) over 1 year and has shown a seasonal effect with a maximum level of AAs (free and combined AAs) in spring and a minimal one in winter (Xu et al., 2019).
To conclude, the few studies presented above report concentrations of AAs in cloud and fog waters. It is a challenging issue to compare those three studies that have been performed for contrasting environmental conditions and for a limited number of samples.
A large variability of the AA concentrations and relative proportions in the 13 cloud samples from the PUY is observed (Table S1). To better understand this variability, data are analyzed in parallel with various environmental factors such as the air mass history and quantitative physical, chemical, and biological measurements. During their atmospheric transports, the air masses received chemical species under various forms and from various sources and could also undergo multiphase chemical transformations as well as deposition. This section is devoted to the correlation between the AA concentrations and the air mass history. To this end, PLS regressions are performed, and the results are validated with nonparametric tests (Mann–Whitney tests).
The PLS matrix of the explanatory variables (the “Xs”) is composed of the “zone matrix” (sea/continental surface ABLH) from the CAT model, to which are added the temperature, the pH, the inorganic ion concentrations, the bacteria density, the ATP concentration, and the seasons (Table S1). The matrix of the dependent variables (the “Ys”) is composed of the AA concentrations.
Table 3PLS correlation matrix between AA concentrations and the “zone matrix” (sea/continental surface ABLH) from the CAT model, temperature, pH, cation and anion concentrations, TOC and H2O2 concentrations, bacteria density (CFU mL−1) and ATP concentration, and the seasons (fall/winter and spring/summer) determined from 13 clouds sampled at the PUY. The highest correlations are displayed in dark red and the highest anticorrelations in dark blue. R > 0.5 (or R<−0.5) with p values < 0.1 are underlined.
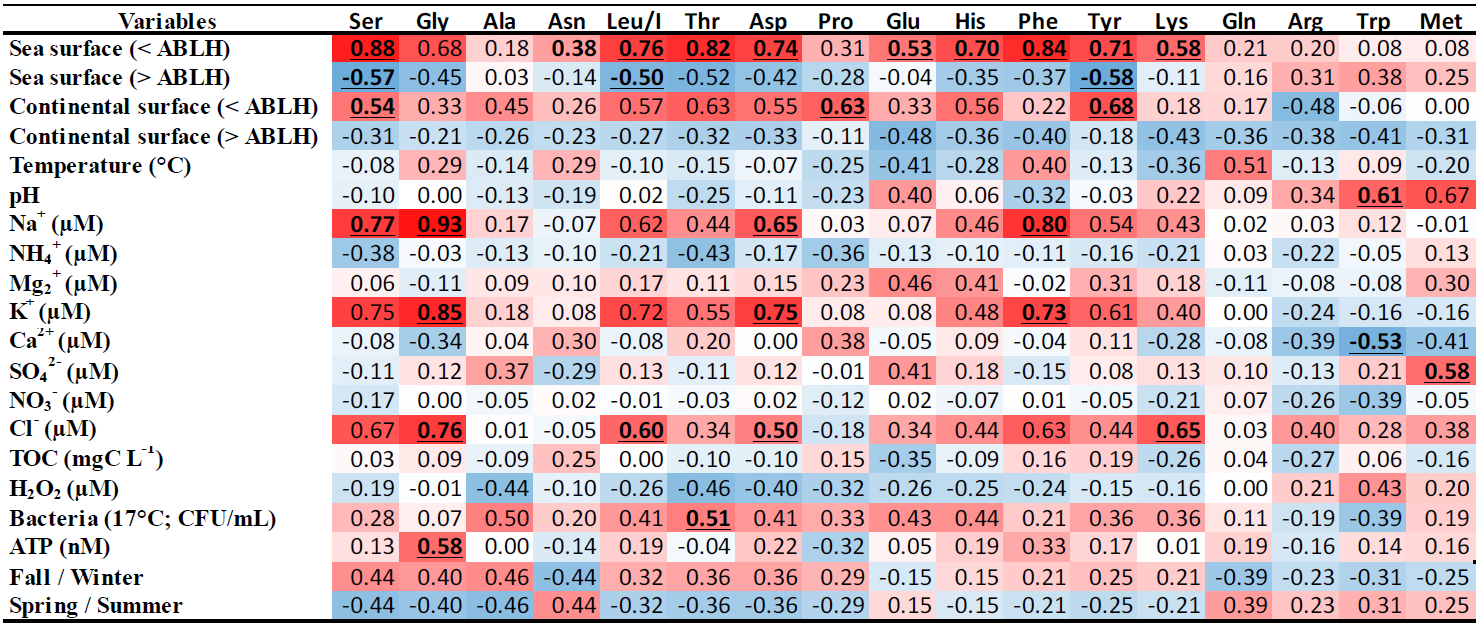
The correlation matrix of this PLS (Table 3) displays significant (anti)correlations. First, 9 of the 18 AAs (Gly, His, Tyr, Asp, Leu/I, Thr, Phe, and Ser) are robustly correlated with sea surface below the atmospheric boundary layer height (< ABLH), with correlation coefficients (r) ranging from 0.68 to 0.88. These nine AAs are also significantly anticorrelated with sea surface in the free atmosphere (> ABLH) (r ranging from −0.35 to −0.58), confirming direct influences from the boundary layer. These nine AAs coherently correlate with Na+, Cl−, and K+ concentrations, confirming a marine influence for those AAs similar to the observations of Triesch et al. (2021).
To a lesser extent, the same tendency (correlation–anticorrelation) is observed with continental surfaces (< ABLH/> ABLH). The PUY is a remote site, and the presence of anthropic ions, such as NO and NH, is correlated with the continental surface (> ABLH) (Renard et al., 2020). Thereby, the AAs and, in particular, the nine aforementioned AAs, are slightly anticorrelated with these anthropic ions.
No correlation appears between TOC concentration and the most abundant AAs, confirming the boundary layer influence as well as the variability of AA proportion in organic carbon. These nine AAs are also slightly anticorrelated with H2O2 concentration, suggesting a potential influence of the photochemistry on AA concentrations (Lundeen et al., 2014). The biological parameters, in particular the bacteria density, are overall correlated with the AA concentrations. The nine AAs most correlated with the sea surface (< ABLH) are, to a lesser extent, also correlated with fall/winter.
The PLS regression is a powerful statistical tool adapted for particular data conditions such as small sample sizes or data with non-normal distributions (Chin and Newsted, 1999). However, with only 13 samples, all the results in this work should be considered “trends” that need to be investigated.
To go further in modeling the environmental variability of the AA concentrations in our cloud samples, we performed a simplified PLS restricting the Xs to the parameters of the CAT model (i.e., the zone matrix). The predictive quality index of the models obtained with the PLS (Q2=0.19 with one component) is satisfactory given the complexity of the cloud composition. In detail, Fig. 5 displays a PLS correlation chart with a t component on axes t1 and t2. The main axis (t1) is linked to the ABLH, and most of the AAs are correlated with “< ABLH”. The t2 axis is linked to the zone (sea/continental surfaces), and it reveals a preponderance of marine influence, which is consistent with the dominant western oceanic air masses at the PUY.
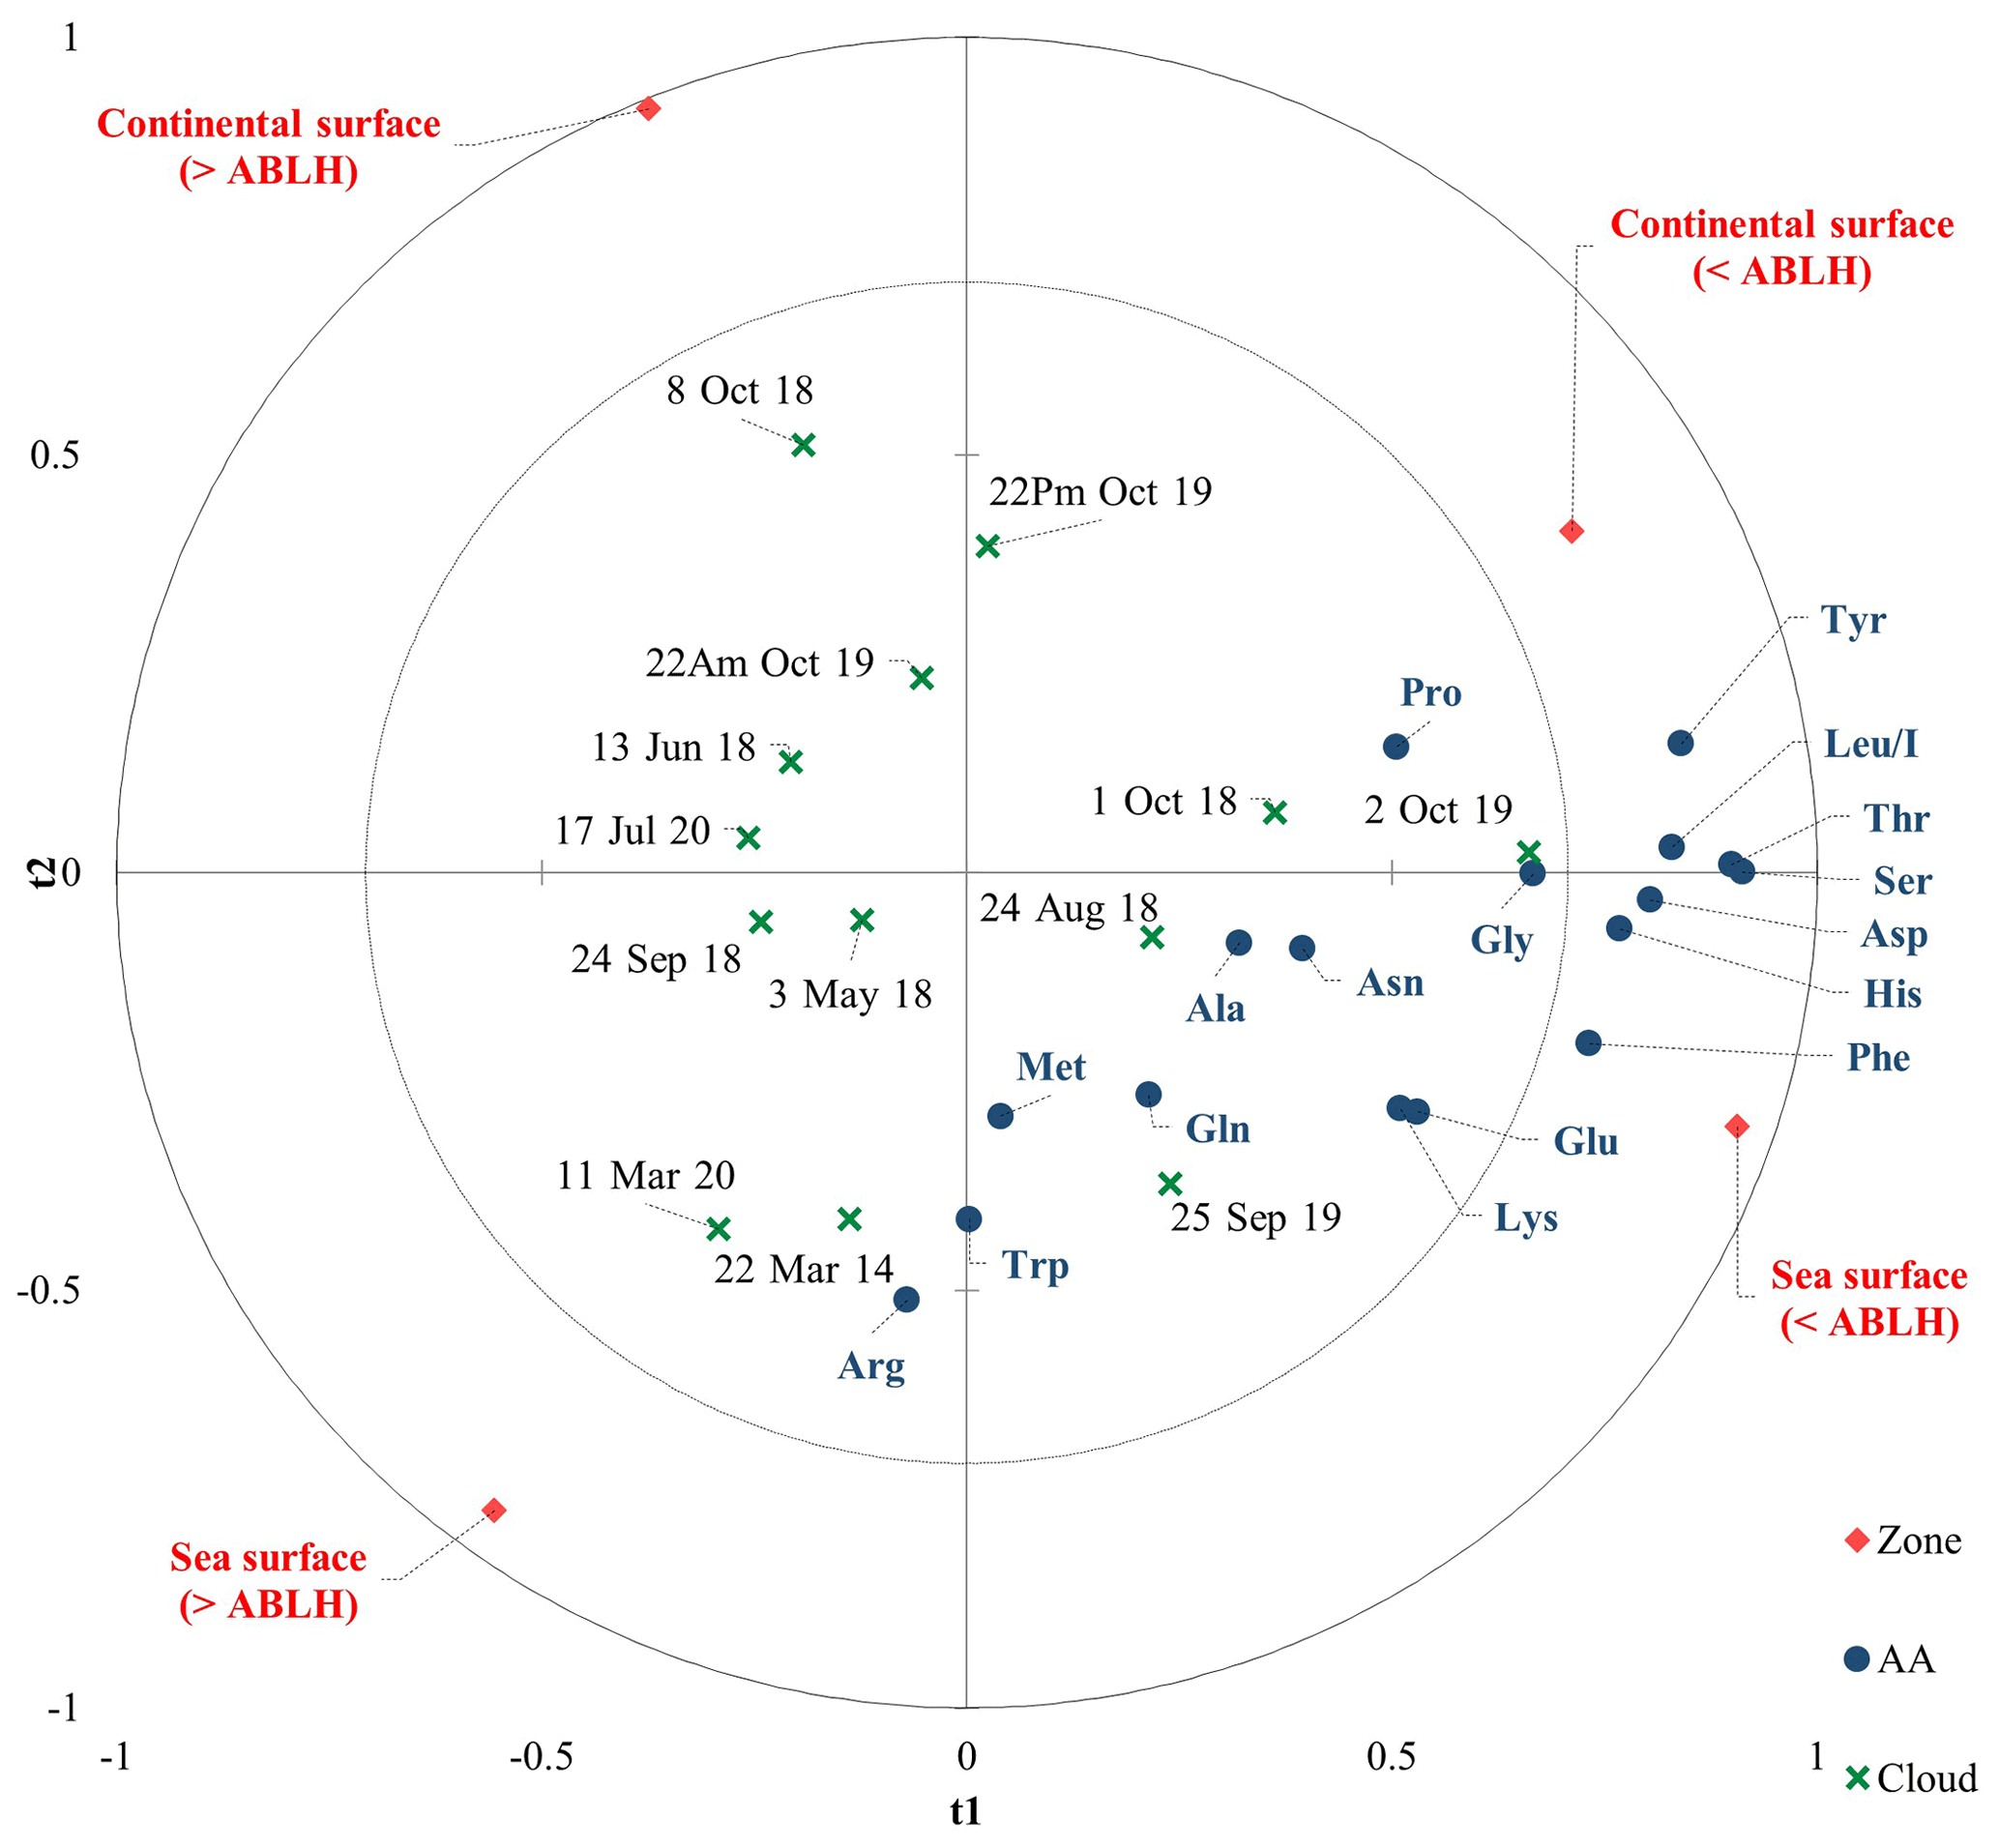
Figure 5Partial least square (PLS) chart with a t component on axes t1 and t2. The correlation map superimposes the dependent variables from the chemical matrix (blue circles), the explanatory variables (red diamonds), and the cloud events (green crosses).
Cloud water is a complex matrix resulting from the interaction of many factors; cloud samples more influenced by continental zones (northeast) could modify this model, and the predictive model provided by this PLS needs further investigations to be validated. However, it appears that the air mass history remains the prevailing parameter, as observed in Renard et al. (2020), after considering more cloud events. The CAT model could be used to estimate the AA concentration, and this work helps to propose scientifically plausible reasons explaining the environmental variability of AA composition.
The following section is devoted to the analysis of the processes occurring in the atmosphere that could potentially explain the AA levels and distributions in the clouds sampled at the PUY. These processes are linked to their sources and to their potential biotic and/or abiotic transformations in the atmosphere.
Results reveal high variability in the relative concentrations of FAAs among cloud samples; however, some major FAAs could be detected following this relative concentration ranking: Ser > Gly > Ala > Asn > Leu/I. By contrast, Trp and Met present very low concentrations.
4.1 Potential influence of the initial AA distribution on biological matrices
As free AAs are mostly of biological origin, we first compared the AA composition of various biological macromolecules (proteins, peptidoglycans, etc.) that can be the source of AAs after hydrolysis with the relative concentrations of AAs measured in the studied cloud samples.
Studies report the relative distributions of AAs in proteins extracted from different taxa (archaea, bacteria, and eucaryotes) (Bogatyreva et al., 2006; Gaur, 2014; Jordan et al., 2005). Although there are some differences between mammalian, invertebrate, plant, protozoa, fungi, and bacterial protein composition, some AAs (Ala, Gly, Leu/I, and Val) are clearly dominant, while others are in low amounts (Cyst, Trp, His, and Met). Globally, this relative abundance of AAs initially constituting proteins presents similarities to the relative concentrations present in our samples. In particular, Gly, Ala, and Leu/I are the most abundant in our samples, as in the proteins, while Trp and Met, whose concentrations are the lowest in our cloud samples, are also minor components of proteins. Ser, that is, the major AA in our samples, is present in proteins on average and is not dominant.
We looked at the composition of peptidoglycans that form all the cell walls of Gram-positive and Gram-negative bacteria that can be an atmospheric source of AAs (Vollmer et al., 2008). Peptidoglycans are complex structures formed by glycan strands (composed of sugars) cross-linked by short pentapeptides. Although some slight variations can exist depending on the bacterial strains, the standard sequence of this peptide is L–Ala–D–Glu–L–Lys–D–Ala–D–Ala. In a few cases Ser and Gly have also been reported in the sequence. In addition, these pentapeptides are connected by inter-peptide bridges varying from one to seven AAs which mostly contain Gly and Ala but also Orn, Lys, Glu, or Ser. Peptidoglycans can thus represent a major source of Ala and Gly, which are the major AAs detected in our samples.
Finally, we specifically searched in aqueous media for the potential origin of Ser, which is dominant in our sample. Hecky et al. (1973) report the AA composition of cell walls from six different diatom species, selected on the basis of taxonomy and habitat diversity. Three are of estuarine origin, the others of freshwater origin. The protein template of these cell walls is composed of the following AA sequences: Asp–Ser–Ser–Gly–Thr–Ser–Ser–Asp–Ser–Gly. Ser is thus highly abundant in these aquatic organisms and plays an important role in the complexation of the silicon (Si4+). This result confirms previous reported data, which showed the prevalence of serine in marine diatoms (Chuecas and Riley, 1969). AAs in seawater during phytoplankton blooms were also investigated (Ittekkot, 1982): Glu concentration is maximum in the early stages of the bloom, while Asp, Gly, Ala, and Lys concentrations increase at the end of the bloom. In parallel, Ser was one of the most abundant AAs, and its concentration remains high all along the bloom period. Ser could come from the cell walls of some phytoplankton species which are diatoms. Hashioka et al. (2013) showed that diatoms could contribute up to 80 % of the total phytoplankton in the ocean during bloom events. The high Ser concentration measured in our cloud samples could thus originate from diatoms and could be a marker of their oceanic origin; this has also been proposed by Triesch et al. (2021), who underline the marine origin of Ser present in their samples.
In conclusion, combining the composition of proteins, peptidoglycans, and diatom cell walls shows that Ala, Gly, Ser, and Leu/l are major AAs, while Trp and Met are minor ones; these ratios fit rather well with the concentrations found in our cloud samples.
In the following, we aim at discussing more the variability of the AA distributions and concentrations among the samples looking at the air mass history (i.e., sources) and their atmospheric transformations.
4.2 Potential influence of the air mass origin on the AA concentrations and their relative distribution
Table S4 summarizes the studies that analyze AA quantity and distribution in various atmospheric media. Interestingly, the systematic presence of Ser, Ala, and Gly is observed in the various atmospheric waters, including clouds (Triesch et al., 2021), fogs (Zhang and Anastasio, 2003b), and rains (Mopper and Zika, 1987; Yan et al., 2015). These three AAs are also significantly present in aerosols over contrasted regions over the world: rural sites (Zhang and Anastasio, 2003b), marine sites (Matsumoto and Uematsu, 2005; Triesch et al., 2021; Violaki and Mihalopoulos, 2010; Wedyan and Preston, 2008), urban or suburban sites (Barbaro et al., 2011; Samy et al., 2013), and polar sites (Scalabrin et al., 2012).
Looking more specifically at only two AAs (Gly and Ala), this list of studies can be extended to other works: in rain (Xu et al., 2019), in marine aerosols (Mace et al., 2003b; Mandalakis et al., 2011), in rural aerosols (Ruiz-Jimenez et al., 2021; Samy et al., 2011), and in polar and remote sites (Barbaro et al., 2020, 2015; Feltracco et al., 2019). We can notice that Gly is globally one of the major FAAs in all the reported studies (see Table S4 and the joint explanations). In the present study, we detect significant concentrations of Leu/I, in agreement with only three other studies (Bianco et al., 2016b; Mashayekhy Rad et al., 2019; Wedyan and Preston, 2008).
We overall found the same major groups of AAs that are commonly detected in marine clouds and aerosols. However, one of the main differences is the high concentration of Asn in two of our samples instead of the more common Asp, suggesting potential conversion of Asp/Asn (Jaber et al., 2021) and indicating that the origin of the clouds and aerosols is not the only main driving factor explaining the final observed FAA relative proportion in the clouds sampled at the PUY. Moreover, the presence of similar trends of AA composition in aerosols sampled under different sites (rural, marine, urban, and polar) and in our cloud samples shows various influences from both continental and marine sources.
In agreement with the results of the PLS analysis (Fig. 5), a significant correlation (r=0.78) is observed between the TCAA and the time spent by the air mass over the sea and below the boundary layer height (sea surface < ABLH). The correlation between the TCAA and sea and the continental surfaces (< ABLH) is even higher (r=0.86) (Fig. S5), indicating that the boundary layer influences the total number of AAs rather than their relative concentration. When the air mass is transported in the free troposphere, the TCAA is lower, possibly because of the remoteness of the direct sources and because of chemical transformations that might be more intense in this upper part of the atmosphere.
To go further, Triesch et al. (2021) compared the AA compositions of samples collected at Cape Verde (marine environment) in both the aerosol and cloud phases. They show that FAAs are partitioned according to their hygroscopic properties. They show that the hydrophobic AAs (Ala, Val, Phe, Leu/I) represent a much lower proportion (about 25 %) of the total AAs present in cloud water compared to the neutral (Ser, Gly, Thr, Pro, Tyr) plus hydrophilic AAs (Glu, Asp, Gaba). Figure 6 shows the distribution of the AAs in our samples collected at the PUY station according to their hydrophobic vs. hydrophobic + neutral properties. Clearly the concentrations of hydrophilic (Glu, Asp, Gln, Asn, His, Lys, Arg) and neutral (Trp, Tyr, Gly, Thr, Ser, Pro) AAs are much higher (average value of 80 %) than those of hydrophobic (Leu/I, Phe, Met, Ala) ones in all the samples, except in the 11 March 2020 sample, where the hydrophilic + neutral AAs represent only 40.8 % of the total FAAs. Our results are consistent with those measured in cloud samples at Cape Verde; this suggests that the hydrophobic nature of AAs is less favorable for their incorporation into cloud droplets due to their low solubility.
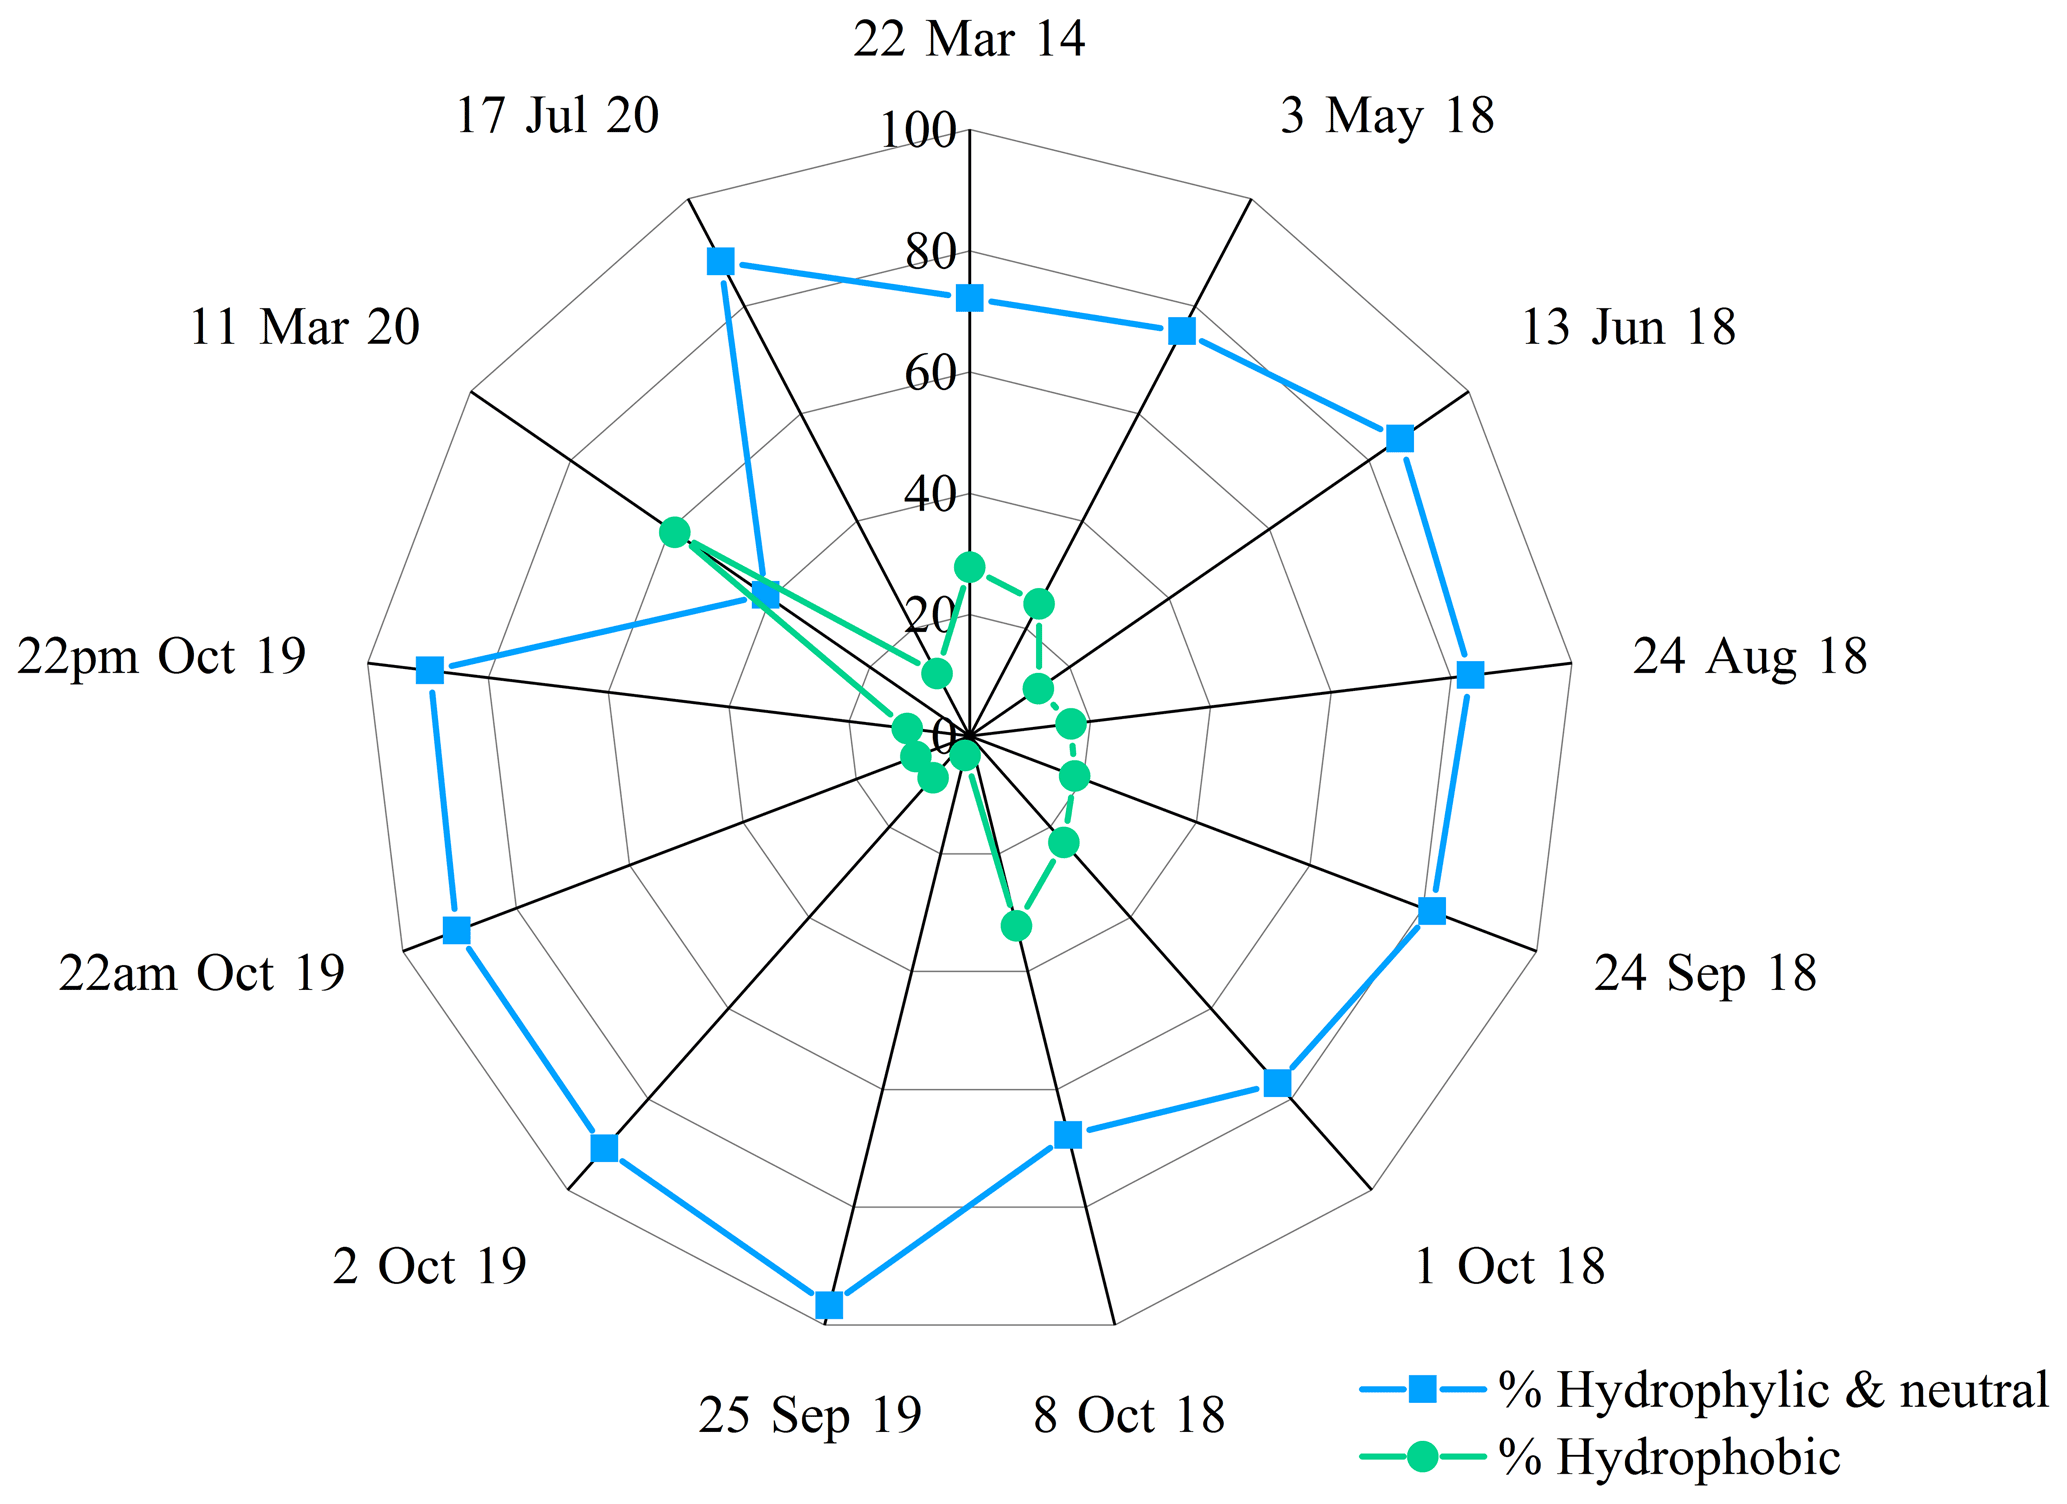
Figure 6Relative composition of AAs grouped by hygroscopicity (hydrophilic + neutral versus hydrophobic AAs) observed in each cloud sample.
Although the initial AA composition of the emitted aerosols can greatly impact the type of FAAs, the aging of the samples due to biotic and abiotic processes must be considered to explain the presence of major or minor groups of AAs.
4.3 Potential influence of the atmospheric aging of AAs
Table 4 reports calculated and experimental lifetimes of the different AAs targeted in this work considering different biotic and abiotic processes.
First, AA theoretical lifetimes are calculated considering the reactivity constants of AAs with HO• radicals, O3, and 1O. The values issued from the work of Jaber et al. (2021), Triesch et al. (2021), and McGregor and Anastasio (2001) are reported in columns A, B, and C, respectively. At first glance it can be noticed that the lifetimes depend on the AAs and can vary from a few hours or even minutes to a few days. Globally, reported values from the three studies are rather consistent, although they were calculated using a different set of reactivity constants and different oxidant concentrations (see footnotes of Table 4).
Table 4Estimated atmospheric lifetimes of AAs degraded by atmospheric, biological, and chemical processes. AAs are classified following their mean concentrations measured in the present study. A brief description of the calculations is added below this table. More information can be found in SI for the calculations performed in this study based on the work from Jaber et al. (2021).
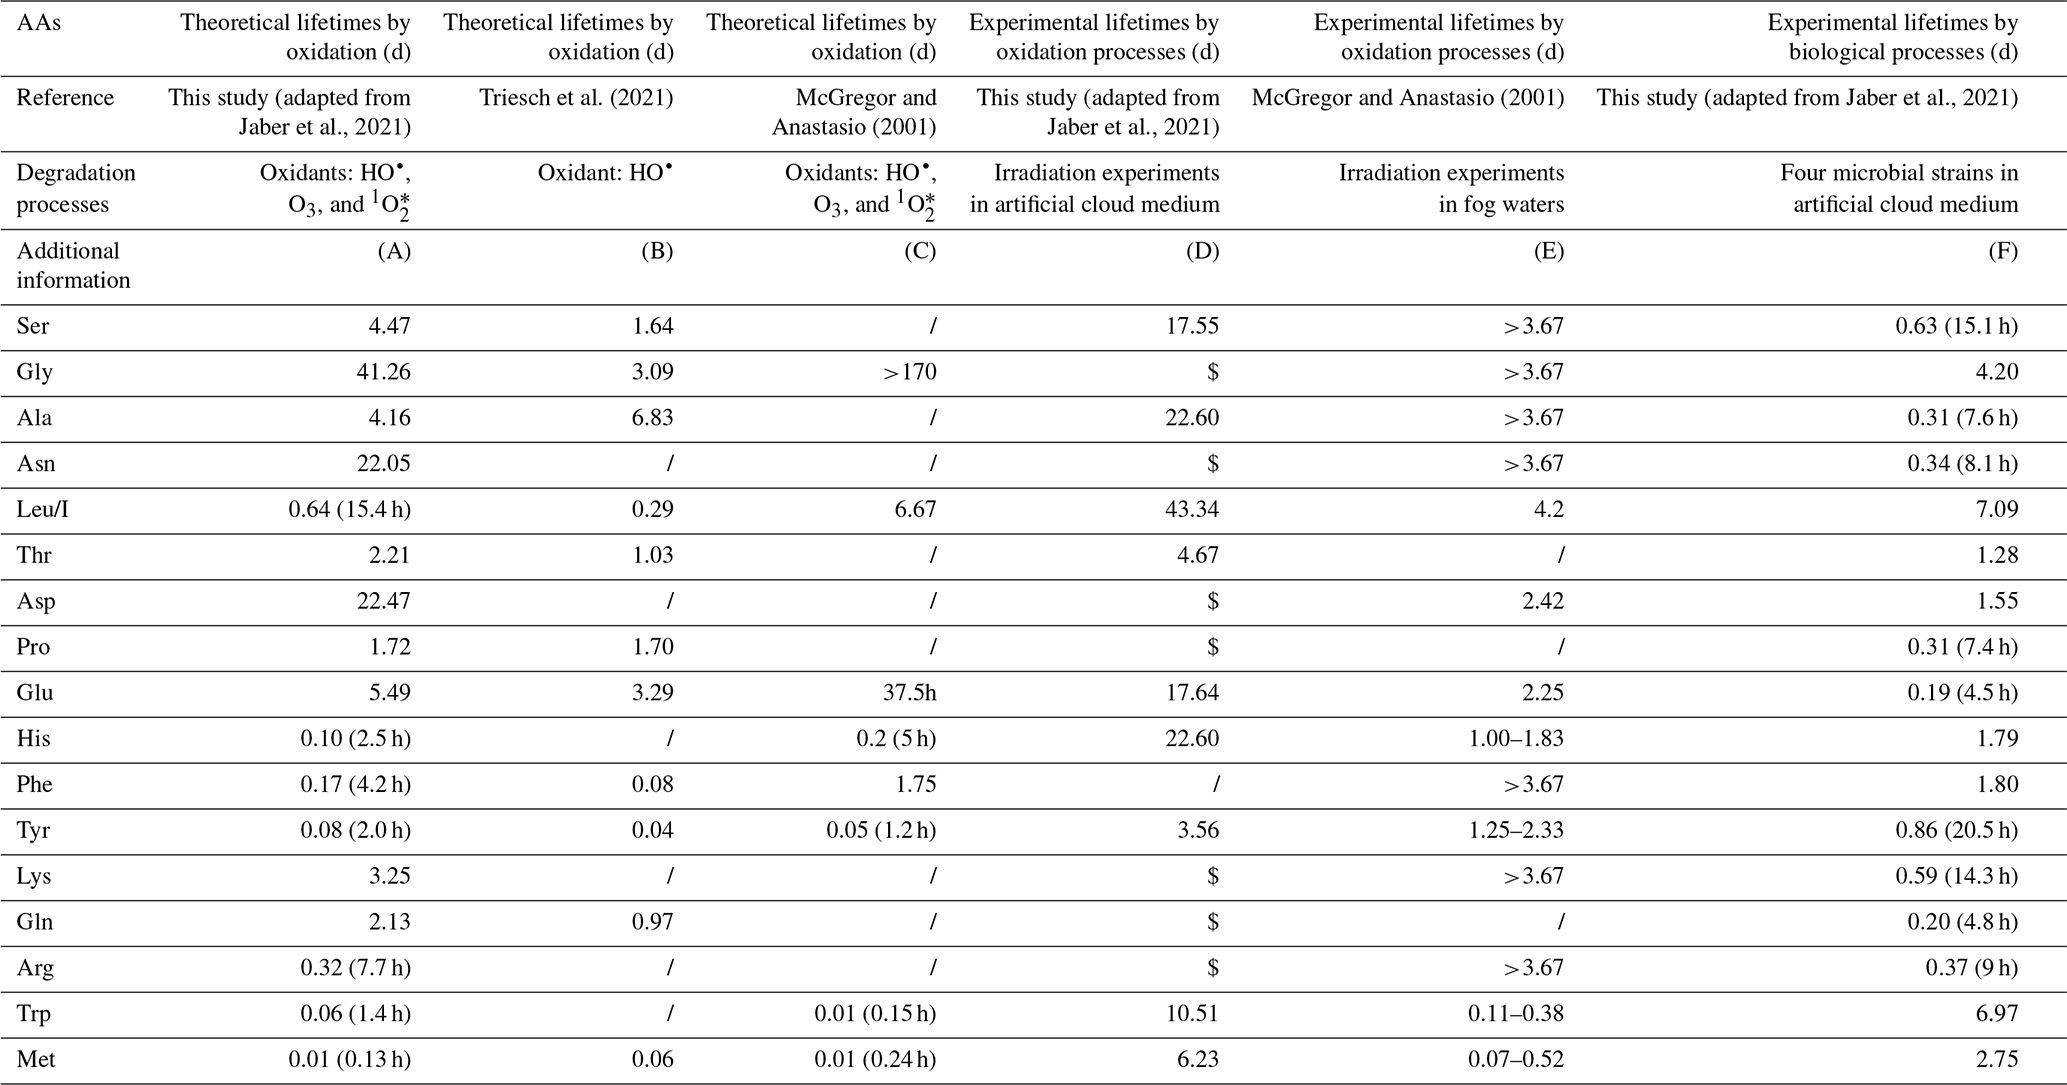
(A) Theoretical calculations considering kinetic rate constants for the AA oxidation by HO•, O3 and 1O following Jaber et al. (2021). Aqueous concentrations of HO•, O3, and 1O are, respectively, equal to 10−14, , and M. (B) Theoretical calculations by Triesch et al. (2021). The mean lifetimes are estimated by considering pH-dependent rate constants of AAs with HO•. An HO• concentration of M is considered in this study. (C) Theoretical calculations by McGregor and Anastasio (2001) were done under typical midday wintertime conditions. Several oxidants were considered: the photoproduction of HO• and 1O in the droplets, the source of HO• and O3 in the aqueous phase by mass transfer. (D) Experimental irradiation of 19 AAs at a concentration of 1 µM, each in an artificial cloud medium, was conducted. HO• production was performed using Fe-ethylenediamine-N,N′-disuccinic acid (EDDS) complex solution. HO• concentration of M is estimated. $: lifetimes cannot be calculated since a production is observed during the experiment. (E) Irradiation experiments using simulated sunlight illumination were performed on real fog waters containing AAs. (F) Biodegradation experiments of 19 AAs were performed by Jaber et al. (2021) using four microbial strains (Rhodococcus enclensis PDD-23b-28, Pseudomonas graminis PDD-13b-3, Pseudomonas syringae PDD-32b-74, and Sphingomonas sp. PDD-32b-11) in artificial cloud water.
These theoretical lifetimes of AAs could explain the very low Met and Trp concentrations measured in our cloud samples, which are very reactive, and the high concentrations measured for Gly and Asn and to some extent for Ser and Ala, which are very slowly transformed. However, they do not fit with the large amounts of Leu/I, except for the values given by McGregor and Anastasio (2001).
A second approach is to consider transformation rate measurements to further calculate experimental lifetimes. Experimental investigations were designed to evaluate both abiotic and biotic processes. Photodegradation experiments have been designed to assess oxidation processes: the first one was performed by Jaber et al. (2021) in a microcosm-mimicking cloud environment using an artificial cloud medium (Table 4, column D), and the second one (McGregor and Anastasio, 2001) consisted in irradiating real fog samples (Table 4, column E). In both cases the HO• concentration is quantified. Interestingly, the obtained experimental lifetimes are globally longer than the theoretical ones: many of them exceeded 3 d, and only Trp and Met lifetimes in the fog experiment are less than 1 h. Moreover, certain AA lifetimes could not be calculated from transformation rates measured by Jaber et al. (2021), as they observed production and not degradation of some AAs (Gly, Asn, Asp, Pro, Phe, Lys, Arg, Gln). The experimental results displayed in Table 4 (columns D, E, and F), which are different from theoretical ones (columns A, B, and C), reflect a much higher complexity of the occurring transformations. On the one hand, irradiations are performed on complex media containing a mixture of AAs as well as other carbon and nitrogen sources. So, the measured transformation rates are net values reflecting both synthesis and degradation processes and even potential inter-conversion mechanisms. On the other hand, theoretical lifetimes are calculated from reactivity constants measured in pure water containing a single AA without any other C or N components and thus far from the chemical reactivity in real environmental samples. In addition, it is difficult to interpret these data in more detail. Indeed, very few studies have studied the photo-produced compounds during these oxidation processes. Some works report the formation of carboxylic acids, nitrate, and ammonia from AA photo-transformations or the conversion of AAs in other different AAs (His to Pro, Asp and Asn, Phe to Tyr, Pro to Glu) (see Jaber et al., 2021, for a review). More detailed pathways of abiotic transformations are only available for Trp, Tyr, and Phe (Bianco et al., 2016a; Pattison et al., 2012). In spite of this complex situation, the long lifetimes or net production of Ser, Leu/I, Gly, and Asn (Table 4, columns D and E) could explain the relatively high concentrations of these compounds in cloud waters collected at the PUY. By contrast, the short lifetimes (<1 d) measured in fogs could explain the low concentrations of Met and Trp. However, the lifetimes reported here cannot fully explain intermediate concentration values measured for most of the other AAs; more work is needed to better understand oxidation pathways in complex atmospheric media and measure additional transformation rates.
Potential biological transformation processes have also been evaluated in the lab. Recent works (Xu et al., 2020; Zhu et al., 2021), based on degradation index (DI) calculations, suggest that biodegradation of AAs could occur in rain and in aerosols. To calculate biotransformation lifetimes, transformation rates were measured in microcosms with four bacterial strains isolated from clouds and representative of this medium and incubated in artificial cloud water (Jaber et al., 2021). As in the previous case of irradiation in the same microcosm, it was shown that some AAs could be degraded but also produced depending on the bacterial strain. The resulting biodegradation rates were thus calculated considering the proportion of each type of cell in real cloud (see Table S4 for more details). From these global reaction rates, lifetimes could be calculated for individual AAs (Table 4, column F). These biological lifetimes are very different from those obtained considering oxidation processes and globally are much shorter. Per se they cannot explain the ranking of the larger AA (Ser, Ala, Leu/I, Asn) and lower AA (Met, Trp) concentrations in our cloud samples, suggesting they might not be the major contribution to the transformation of these AAs. However, when other compounds are considered with rather low concentrations such as Gln, Arg, Lys, Phe, or His, experimental oxidation lifetimes are long, while biodegradation lifetimes are much shorter; a combination of these two processes could reflect a more realistic situation. Biosynthesis and biodegradation pathways are very complex and interconnected and are fully described in databases (see https://www.genome.jp/kegg/pathway.html, last access: 10 January 2022). The complexity comes from how different microorganisms use these pathways. Up to now, the only biodegradation rates related to atmospheric waters are from Jaber et al. (2021) and might be incomplete; more experimental work should be conducted on real atmospheric samples.
This study reports the quantification of amino acids in cloud waters sampled at the Puy de Dôme station using a new approach based on a direct in situ analysis of the sample. Concentrations of AAs represent on average nearly 2 % of the TOC, with a significant variability of TCAAs among the different samples. This heterogeneity is also observed in the AA distribution between the samples, but certain AAs are more dominant, especially Ser, Gly, Ala, Asp, and Leu/I. These AA relative proportions can be explained by the original biological matrices that emit AAs into the atmosphere, by the hygroscopicity of AAs that favors their incorporation into the cloud water, and finally by their transformations during their transport into the atmosphere that modulate the total concentrations of AAs. At the PUY, the residence of the air masses within the boundary layer, especially above the sea, seems also to surely increase the total number of AAs in cloud water. Conversely, the AA concentrations seem to decrease when the photolysis conditions are more favorable (free troposphere or spring/summer period). In other words, the AA concentration is modulated by the sources (mainly from the boundary layer) and the sinks associated with the photodegradation.
However, it is still hard to validate all the formulated hypotheses that have been proposed to explain the differences in the amounts and proportions of the various AAs found in our samples. This variability integrates many factors that are interconnected or decorrelated and that should be investigated in the future. Some future targeted works could be mentioned. First, this study is to our knowledge only the third one performed on cloud samples. More samples should be collected in different seasons and at other sites presenting contrasted environmental conditions. This is crucial for robustly evaluating atmospheric AA variability considering the effect of difference sources and atmospheric transport. Second, a major limitation encountered in interpreting the impact of transformation processes on the final distribution of AAs in atmospheric samples lies in the lack of knowledge available in this field. Very few studies report the complex mechanisms of biotic and abiotic transformations of AAs under realistic atmospheric conditions. Photochemists and biologists should develop interdisciplinary work to describe these transformation pathways; this remains a challenging task.
The CAT model is available upon request (contact: Jean-Luc Baray). The code is not free.
All the data are provided in the Supplement.
The supplement related to this article is available online at: https://doi.org/10.5194/acp-22-2467-2022-supplement.
LD and AMD designed the project. AB, MB, and LD sampled the clouds at the PUY. MB, SJ, and ML conducted the analysis. JLB used the CAT model to calculate back-trajectories and the “matrix zone”. PR and FR performed the statistical analysis. PR, MB, FR, AMD, and LD wrote the paper.
The contact author has declared that neither they nor their co-authors have any competing interests.
Publisher’s note: Copernicus Publications remains neutral with regard to jurisdictional claims in published maps and institutional affiliations.
CO-PDD is an instrumented site of the OPGC observatory and LaMP laboratory supported by the Université Clermont Auvergne (UCA), by the Centre National de la Recherche Scientifique (CNRS-INSU), and by the Centre National d’Etudes Spatiales (CNES). The authors are also very grateful for the support from the Fédération des Recherches en Environnement through the CPER funded by Region Auvergne–Rhône-Alpes, the French Ministry, ACTRIS Research Infrastructure, and FEDER European regional funds. The authors also thank I-Site CAP 20-25.
This work was funded by the French National Research Agency (ANR) in the framework of the “Investment for the Future” program (grant no. ANR-17-MPGA-0013). Saly Jaber is the recipient of a grant from the Walid Joumblatt Foundation for University Studies (WJF), Beirut, Lebanon, and Maxence Brissy from Clermont Auvergne Métropole.
This paper was edited by Kimitaka Kawamura and reviewed by two anonymous referees.
Abe, R. Y., Akutsu, Y., and Kagemoto, H.: Protein amino acids as markers for biological sources in urban aerosols, Environ. Chem. Lett., 14, 155–161, 2016.
Addinsoft: XLSTAT Statistical and Data Analysis Solution, New York, NY, USA, https://www.xlstat.com, last access: 23 May 2020.
Amato, P., Besaury, L., Joly, M., Penaud, B., Deguillaume, L., and Delort, A.-M.: Metatranscriptomic exploration of microbial functioning in clouds, Sci. Rep., 9, 4383, https://doi.org/10.1038/s41598-019-41032-4, 2019.
Bader, M.: A systematic approach to standard addition methods in instrumental analysis, J. Chem. Educ., 57, 703–706, https://doi.org/10.1021/ed057p703, 1980.
Baray, J.-L., Deguillaume, L., Colomb, A., Sellegri, K., Freney, E., Rose, C., Van Baelen, J., Pichon, J.-M., Picard, D., Fréville, P., Bouvier, L., Ribeiro, M., Amato, P., Banson, S., Bianco, A., Borbon, A., Bourcier, L., Bras, Y., Brigante, M., Cacault, P., Chauvigné, A., Charbouillot, T., Chaumerliac, N., Delort, A.-M., Delmotte, M., Dupuy, R., Farah, A., Febvre, G., Flossmann, A., Gourbeyre, C., Hervier, C., Hervo, M., Huret, N., Joly, M., Kazan, V., Lopez, M., Mailhot, G., Marinoni, A., Masson, O., Montoux, N., Parazols, M., Peyrin, F., Pointin, Y., Ramonet, M., Rocco, M., Sancelme, M., Sauvage, S., Schmidt, M., Tison, E., Vaïtilingom, M., Villani, P., Wang, M., Yver-Kwok, C., and Laj, P.: Cézeaux-Aulnat-Opme-Puy De Dôme: a multi-site for the long-term survey of the tropospheric composition and climate change, Atmos. Meas. Tech., 13, 3413–3445, https://doi.org/10.5194/amt-13-3413-2020, 2020.
Barbaro, E., Zangrando, R., Moret, I., Barbante, C., Cescon, P., and Gambaro, A.: Free amino acids in atmospheric particulate matter of Venice, Italy, Atmos. Environ., 45, 5050–5057, 2011.
Barbaro, E., Zangrando, R., Vecchiato, M., Piazza, R., Cairns, W. R. L., Capodaglio, G., Barbante, C., and Gambaro, A.: Free amino acids in Antarctic aerosol: potential markers for the evolution and fate of marine aerosol, Atmos. Chem. Phys., 15, 5457–5469, https://doi.org/10.5194/acp-15-5457-2015, 2015.
Barbaro, E., Morabito, E., Gregoris, E., Feltracco, M., Gabrieli, J., Vardè, M., Cairns, W. R. L., Dallo, F., De Blasi, F., Zangrando, R., Barbante, C., and Gambaro, A.: Col Margherita Observatory: A background site in the Eastern Italian Alps for investigating the chemical composition of atmospheric aerosols, Atmos. Environ., 221, 117071, https://doi.org/10.1016/j.atmosenv.2019.117071, 2020.
Berger, P., Karpel Vel Leitner, N., Doré, M., and Legube, B.: Ozone and hydroxyl radicals induced oxidation of glycine, Water Res., 33, 433–441, 1999.
Berto, S., De Laurentiis, E., Tota, T., Chiavazza, E., Daniele, P. G., Minella, M., Isaia, M., Brigante, M., and Vione, D.: Properties of the humic-like material arising from the photo-transformation of L-tyrosine, Sci. Total Environ., 545–546, 434–444, 2016.
Bianco, A., Passananti, M., Deguillaume, L., Mailhot, G., and Brigante, M.: Tryptophan and tryptophan-like substances in cloud water: Occurrence and photochemical fate, Atmos. Environ., 137, 53–61, 2016a.
Bianco, A., Voyard, G., Deguillaume, L., Mailhot, G., and Brigante, M.: Improving the characterization of dissolved organic carbon in cloud water: Amino acids and their impact on the oxidant capacity, Sci. Rep., 6, 37420, https://doi.org/10.1038/srep37420, 2016b.
Bianco, A., Deguillaume, L., Vaïtilingom, M., Nicol, E., Baray, J.-L., Chaumerliac, N., and Bridoux, M.: Molecular characterization of cloud water samples collected at the puy de Dôme (France) by Fourier Transform Ion Cyclotron Resonance Mass Spectrometry, Environ. Sci. Technol., 52, 10275–10285, 2018.
Bianco, A., Deguillaume, L., Chaumerliac, N., Vaïtilingom, M., Wang, M., Delort, A.-M., and Bridoux, M. C.: Effect of endogenous microbiota on the molecular composition of cloud water: a study by Fourier-transform ion cyclotron resonance mass spectrometry (FT-ICR MS), Sci. Rep., 9, 7663, https://doi.org/10.1038/s41598-019-44149-8, 2019.
Bogatyreva, N. S., Finkelstein, A. V., and Galzitskaya, O. V.: Trend of amino acid composition of proteins of different taxa, J. Bioinf. Comput. Biol., 04, 597–608, https://doi.org/10.1142/S0219720006002016, 2006.
Cape, J. N., Cornell, S. E., Jickells, T. D., and Nemitz, E.: Organic nitrogen in the atmosphere — Where does it come from? A review of sources and methods, Atmos. Res., 102, 30–48, 2011.
Chan, M. N., Choi, M. Y., Ng, N. L., and Chan, C. K.: Hygroscopicity of water-soluble organic compounds in atmospheric aerosols: Amino acids and biomass burning derived organic species, Environ. Sci. Tech., 39, 1555–1562, 2005.
Chin, W. W. and Newsted, P. R.: Structural equation modeling analysis with small samples using partial least squares, in: Statistical Strategies for Small Sample Research, edited by: Hoyle, R., Sage Publications, Thousand Oaks, CA, 307–341, https://www.researchgate.net/publication/242370645 (last access: 10 January 2022), 1999.
Chuecas, L. and Riley, J. P.: The component combined amino acids of some marine diatoms, J. Mar. Biol. Assoc. UK, 49, 117–120, 1969.
Cook, R. D., Lin, Y.-H., Peng, Z., Boone, E., Chu, R. K., Dukett, J. E., Gunsch, M. J., Zhang, W., Tolic, N., Laskin, A., and Pratt, K. A.: Biogenic, urban, and wildfire influences on the molecular composition of dissolved organic compounds in cloud water, Atmos. Chem. Phys., 17, 15167–15180, https://doi.org/10.5194/acp-17-15167-2017, 2017.
Deguillaume, L., Charbouillot, T., Joly, M., Vaïtilingom, M., Parazols, M., Marinoni, A., Amato, P., Delort, A.-M., Vinatier, V., Flossmann, A., Chaumerliac, N., Pichon, J. M., Houdier, S., Laj, P., Sellegri, K., Colomb, A., Brigante, M., and Mailhot, G.: Classification of clouds sampled at the puy de Dôme (France) based on 10 yr of monitoring of their physicochemical properties, Atmos. Chem. Phys., 14, 1485–1506, https://doi.org/10.5194/acp-14-1485-2014, 2014.
De Haan, D. O., Hawkins, L. N., Kononenko, J. A., Turley, J. J., Corrigan, A. L., Tolbert, M. A., and Jimenez, J. L.: Formation of nitrogen-containing oligomers by methylglyoxal and amines in simulated evaporating cloud droplets, Environ. Sci. Technol., 45, 984–991, 2011.
Després, V. R., Huffman, J. A., Burrows, S. M., Hoose, C., Safatov, A. S., Buryak, G., Fröhlich-Nowoisky, J., Elbert, W., Andreae, M. O., Pöschl, U., and Jaenicke, R.: Primary biological aerosol particles in the atmosphere: a review, Tellus B, 64, 15598, https://doi.org/10.3402/tellusb.v64i0.15598, 2012.
Di Filippo, P., Pomata, D., Riccardi, C., Buiarelli, F., Gallo, V., and Quaranta, A.: Free and combined amino acids in size-segregated atmospheric aerosol samples, Atmos. Environ., 98, 179–189, 2014.
Feltracco, M., Barbaro, E., Kirchgeorg, T., Spolaor, A., Turetta, C., Zangrando, R., Barbante, C., and Gambaro, A.: Free and combined L- and D-amino acids in Arctic aerosol, Chemosphere, 220, 412–421, 2019.
Fröhlich-Nowoisky, J., Kampf, C. J., Weber, B., Huffman, J. A., Pöhlker, C., Andreae, M. O., Lang-Yona, N., Burrows, S. M., Gunthe, S. S., Elbert, W., Su, H., Hoor, P., Thines, E., Hoffmann, T., Després, V. R., and Pöschl, U.: Bioaerosols in the Earth system: Climate, health, and ecosystem interactions, Atmos. Res., 182, 346–376, 2016.
Gaur, R. K.: Amino acid frequency distribution among Eukaryotic proteins, Institute of Integrative Omics and Applied Biotechnology (IIOAB) Journal, 5, 6–11, 2014.
Ge, P., Luo, G., Luo, Y., Huang, W., Xie, H., Chen, J., and Qu, J.: Molecular understanding of the interaction of amino acids with sulfuric acid in the presence of water and the atmospheric implication, Chemosphere, 210, 215–223, 2018.
Gerber, H.: Direct measurement of suspended particulate volume concentration and far-infrared extinction coefficient with a laser-diffraction instrument, Appl. Opt., 30, 4824–4831, 1991.
Gorzelska, K., Galloway, J. N., Watterson, K., and Keene, W. C.: Water-soluble primary amine compounds in rural continental precipitation, Atmos. Environ., 26, 1005–1018, 1992.
Hashioka, T., Vogt, M., Yamanaka, Y., Le Quéré, C., Buitenhuis, E. T., Aita, M. N., Alvain, S., Bopp, L., Hirata, T., Lima, I., Sailley, S., and Doney, S. C.: Phytoplankton competition during the spring bloom in four plankton functional type models, Biogeosciences, 10, 6833–6850, https://doi.org/10.5194/bg-10-6833-2013, 2013.
Hecky, R. E., Mopper, K., Kilham, P., and Degens, E. T.: The amino acid and sugar composition of diatom cell-walls, Mar. Biol., 19, 323–331, 1973.
Helin, A., Sietiö, O.-M., Heinonsalo, J., Bäck, J., Riekkola, M.-L., and Parshintsev, J.: Characterization of free amino acids, bacteria and fungi in size-segregated atmospheric aerosols in boreal forest: seasonal patterns, abundances and size distributions, Atmos. Chem. Phys., 17, 13089–13101, https://doi.org/10.5194/acp-17-13089-2017, 2017.
Hewavitharana, A. K., Abu Kassim, N. S., and Shaw, P. N.: Standard addition with internal standardisation as an alternative to using stable isotope labelled internal standards to correct for matrix effects—Comparison and validation using liquid chromatography-tandem mass spectrometric assay of vitamin D, J. Chromatogr. A, 1553, 101–107, https://doi.org/10.1016/j.chroma.2018.04.026, 2018.
Ittekkot, V.: Variations of dissolved organic matter during a plankton bloom: qualitative aspects, based on sugar and amino acid analyses, Mar. Chem., 11, 143–158, 1982.
Jaber, S., Joly, M., Brissy, M., Leremboure, M., Khaled, A., Ervens, B., and Delort, A.-M.: Biotic and abiotic transformation of amino acids in cloud water: experimental studies and atmospheric implications, Biogeosciences, 18, 1067–1080, https://doi.org/10.5194/bg-18-1067-2021, 2021.
Jordan, I. K., Kondrashov, F. A., Adzhubei, I. A., Wolf, Y. I., Koonin, E. V., Kondrashov, A. S., and Sunyaev, S.: A universal trend of amino acid gain and loss in protein evolution, Nature, 433, 633–638, 2005.
Koutny, M., Sancelme, M., Dabin, C., Pichon, N., Delort, A.-M., and Lemaire, J.: Acquired biodegradability of polyethylenes containing pro-oxidant additives, Polym. Degrad. Stabil., 91, 1495–1503, 2006.
Kristensson, A., Rosenørn, T., and Bilde, M.: Cloud droplet activation of amino acid aerosol particles, J. Phys. Chem. A, 114, 379–386, 2010.
Li, X., Hede, T., Tu, Y., Leck, C., and Ågren, H.: Cloud droplet activation mechanisms of amino acid aerosol particles: insight from molecular dynamics simulations, Tellus B, 65, 20476, https://doi.org/10.3402/tellusb.v65i0.20476, 2013.
Lundeen, R. A., Janssen, E. M., Chu, C., and McNeill, K.: Environmental photochemistry of amino acids, peptides and proteins, CHIMIA, 68, 812–817, https://doi.org/10.2533/chimia.2014.812, 2014.
Mace, K. A., Duce, R. A., and Tindale, N. W.: Organic nitrogen in rain and aerosol at Cape Grim, Tasmania, Australia, J. Geophys. Res.-Atmos., 108, 4338, https://doi.org/10.1029/2002JD003051, 2003a.
Mace, K. A., Kubilay, N., and Duce, R. A.: Organic nitrogen in rain and aerosol in the eastern Mediterranean atmosphere: An association with atmospheric dust, J. Geophys. Res.-Atmos., 108, 4320, https://doi.org/10.1029/2002JD002997, 2003b.
Mandalakis, M., Apostolaki, M., Tziaras, T., Polymenakou, P., and Stephanou, E. G.: Free and combined amino acids in marine background atmospheric aerosols over the Eastern Mediterranean, Atmos. Environ., 45, 1003–1009, 2011.
Marion, A., Brigante, M., and Mailhot, G.: A new source of ammonia and carboxylic acids in cloud water: The first evidence of photochemical process involving an iron-amino acid complex, Atmos. Environ., 195, 179–186, 2018.
Mashayekhy Rad, F., Zurita, J., Gilles, P., Rutgeerts, L. A. J., Nilsson, U., Ilag, L. L., and Leck, C.: Measurements of atmospheric proteinaceous aerosol in the Arctic using a selective UHPLC/ESI-MS/MS strategy, J. Am. Soc. Mass Spectr., 30, 161–173, 2019.
Matos, J. T. V., Duarte, R. M. B. O., and Duarte, A. C.: Challenges in the identification and characterization of free amino acids and proteinaceous compounds in atmospheric aerosols: A critical review, TrAC-Trend. Anal. Chem., 75, 97–107, 2016.
Matsumoto, K. and Uematsu, M.: Free amino acids in marine aerosols over the western North Pacific Ocean, Atmos. Environ., 39, 2163–2170, 2005.
McGregor, K. G. and Anastasio, C.: Chemistry of fog waters in California's Central Valley: 2. Photochemical transformations of amino acids and alkyl amines, Atmos. Environ., 35, 1091–1104, 2001.
Mopper, K. and Zika, R. G.: Free amino acids in marine rains: evidence for oxidation and potential role in nitrogen cycling, Nature, 325, 246–249, 1987.
Pattison, D. I., Rahmanto, A. S., and Davies, M. J.: Photo-oxidation of proteins, Photochem. Photobiol. Sci., 11, 38–53, 2012.
Pummer, B. G., Budke, C., Augustin-Bauditz, S., Niedermeier, D., Felgitsch, L., Kampf, C. J., Huber, R. G., Liedl, K. R., Loerting, T., Moschen, T., Schauperl, M., Tollinger, M., Morris, C. E., Wex, H., Grothe, H., Pöschl, U., Koop, T., and Fröhlich-Nowoisky, J.: Ice nucleation by water-soluble macromolecules, Atmos. Chem. Phys., 15, 4077–4091, https://doi.org/10.5194/acp-15-4077-2015, 2015.
Ren, L., Bai, H., Yu, X., Wu, F., Yue, S., Ren, H., Li, L., Lai, S., Sun, Y., Wang, Z., and Fu, P.: Molecular composition and seasonal variation of amino acids in urban aerosols from Beijing, China, Atmos. Res., 203, 28–35, 2018.
Renard, P., Bianco, A., Baray, J.-L., Bridoux, M., Delort, A.-M., and Deguillaume, L.: Classification of clouds sampled at the puy de Dôme station (France) based on chemical measurements and air mass history matrices, Atmosphere, 11, 732, https://doi.org/10.3390/atmos11070732, 2020.
Ruiz-Jimenez, J., Okuljar, M., Sietiö, O.-M., Demaria, G., Liangsupree, T., Zagatti, E., Aalto, J., Hartonen, K., Heinonsalo, J., Bäck, J., Petäjä, T., and Riekkola, M.-L.: Determination of free amino acids, saccharides, and selected microbes in biogenic atmospheric aerosols – seasonal variations, particle size distribution, chemical and microbial relations, Atmos. Chem. Phys., 21, 8775–8790, https://doi.org/10.5194/acp-21-8775-2021, 2021.
Samy, S., Robinson, J., and Hays, M. D.: An advanced LC-MS (Q-TOF) technique for the detection of amino acids in atmospheric aerosols, Anal. Bioanal. Chem., 401, 3103–3113, 2011.
Samy, S., Robinson, J., Rumsey, I. C., Walker, J. T., and Hays, M. D.: Speciation and trends of organic nitrogen in southeastern U.S. fine particulate matter (PM2.5), J. Geophys. Res.-Atmos., 118, 1996-2006, 2013.
Scalabrin, E., Zangrando, R., Barbaro, E., Kehrwald, N. M., Gabrieli, J., Barbante, C., and Gambaro, A.: Amino acids in Arctic aerosols, Atmos. Chem. Phys., 12, 10453–10463, https://doi.org/10.5194/acp-12-10453-2012, 2012.
Song, T., Wang, S., Zhang, Y., Song, J., Liu, F., Fu, P., Shiraiwa, M., Xie, Z., Yue, D., Zhong, L., Zheng, J., and Lai, S.: Proteins and amino acids in fine particulate matter in rural Guangzhou, Southern China: seasonal cycles, sources, and atmospheric processes, Environ. Sci. Technol., 51, 6773–6781, 2017.
Szyrmer, W. and Zawadzki, I.: Biogenic and anthropogenic sources of ice-forming nuclei: A review, B. Am. Meteorol. Soc., 78, 209–228, 1997.
Triesch, N., van Pinxteren, M., Engel, A., and Herrmann, H.: Concerted measurements of free amino acids at the Cabo Verde islands: high enrichments in submicron sea spray aerosol particles and cloud droplets, Atmos. Chem. Phys., 21, 163–181, https://doi.org/10.5194/acp-21-163-2021, 2021.
Vaïtilingom, M., Attard, E., Gaiani, N., Sancelme, M., Deguillaume, L., Flossmann, A. I., Amato, P., and Delort, A.-M.: Long-term features of cloud microbiology at the puy de Dôme (France), Atmos. Environ., 56, 88–100, 2012.
Violaki, K. and Mihalopoulos, N.: Water-soluble organic nitrogen (WSON) in size-segregated atmospheric particles over the Eastern Mediterranean, Atmos. Environ., 44, 4339–4345, 2010.
Vollmer, W., Blanot, D., and De Pedro, M. A.: Peptidoglycan structure and architecture, FEMS Microbiol. Rev., 32, 149–167, 2008.
Wedyan, M. A. and Preston, M. R.: The coupling of surface seawater organic nitrogen and the marine aerosol as inferred from enantiomer-specific amino acid analysis, Atmos. Environ., 42, 8698–8705, 2008.
Wirgot, N., Vinatier, V., Deguillaume, L., Sancelme, M., and Delort, A.-M.: H2O2 modulates the energetic metabolism of the cloud microbiome, Atmos. Chem. Phys., 17, 14841–14851, https://doi.org/10.5194/acp-17-14841-2017, 2017.
Xu, Y., Wu, D., Xiao, H., and Zhou, J.: Dissolved hydrolyzed amino acids in precipitation in suburban Guiyang, southwestern China: Seasonal variations and potential atmospheric processes, Atmos. Environ., 211, 247–255, 2019.
Xu, Y., Xiao, H., Wu, D., and Long, C.: Abiotic and biological degradation of atmospheric proteinaceous matter can contribute significantly to dissolved amino acids in wet deposition, Environ. Sci. Technol., 54, 6551–6561, 2020.
Yan, G., Kim, G., Kim, J., Jeong, Y.-S., and Kim, Y. I.: Dissolved total hydrolyzable enantiomeric amino acids in precipitation: Implications on bacterial contributions to atmospheric organic matter, Geochim. Cosmochim. Ac., 153, 1–14, https://doi.org/10.1016/j.gca.2015.01.005, 2015.
Zhang, Q. and Anastasio, C.: Conversion of fogwater and aerosol organic nitrogen to ammonium, nitrate, and NOx during exposure to simulated sunlight and ozone, Environ. Sci. Technol., 37, 3522–3530, 2003a.
Zhang, Q. and Anastasio, C.: Free and combined amino compounds in atmospheric fine particles (PM2.5) and fog waters from Northern California, Atmos. Environ., 37, 2247–2258, 2003b.
Zhao, Y., Hallar, A. G., and Mazzoleni, L. R.: Atmospheric organic matter in clouds: exact masses and molecular formula identification using ultrahigh-resolution FT-ICR mass spectrometry, Atmos. Chem. Phys., 13, 12343–12362, https://doi.org/10.5194/acp-13-12343-2013, 2013.
Zhu, R.-G., Xiao, H.-Y., Zhu, Y., Wen, Z., Fang, X., and Pan, Y.: Sources and transformation processes of proteinaceous matter and free amino acids in PM2.5, J. Geophys. Res.-Atmos., 125, e2020JD032375, https://doi.org/10.1029/2020JD032375, 2020.
Zhu, R.-G., Xiao, H.-Y., Luo, L., Xiao, H., Wen, Z., Zhu, Y., Fang, X., Pan, Y., and Chen, Z.: Measurement report: Hydrolyzed amino acids in fine and coarse atmospheric aerosol in Nanchang, China: concentrations, compositions, sources and possible bacterial degradation state, Atmos. Chem. Phys., 21, 2585–2600, https://doi.org/10.5194/acp-21-2585-2021, 2021.