the Creative Commons Attribution 4.0 License.
the Creative Commons Attribution 4.0 License.
 | 15 Nov 2022
The simulation of mineral dust in the United Kingdom Earth System Model UKESM1
Stephanie Woodward
Alistair A. Sellar
Yongming Tang
Marc Stringer
Andrew Yool
Eddy Robertson
Andy Wiltshire
Mineral dust plays an important role in Earth system models and is linked to many components, including atmospheric wind speed, precipitation and radiation, surface vegetation cover and soil properties and oceanic biogeochemical systems. In this paper, the dust scheme in the first configuration of the United Kingdom Earth System Model UKESM1 is described, and simulations of dust and its radiative effects are presented and compared with results from the parallel coupled atmosphere–ocean general circulation model (GCM) HadGEM3-GC3.1. Not only changes in the driving model fields but also changes in the dust size distribution are shown to lead to considerable differences to the present-day dust simulations and to projected future changes. UKESM1 simulations produce a present-day, top-of-the-atmosphere (ToA) dust direct radiative effect (DRE – defined as the change in downward net flux directly due to the presence of dust) of 0.086 W m−2 from a dust load of 19.5 Tg. Under climate change pathways these values decrease considerably. In the 2081–2100 mean of the Shared Socioeconomic Pathway SSP5–8.45 ToA DRE reaches 0.048 W m−2 from a load of 15.1 Tg. In contrast, in HadGEM3-GC3.1 the present-day values of −0.296 W m−2 and 15.0 Tg are almost unchanged at −0.289 W m−2 and 14.5 Tg in the 2081–2100 mean. The primary mechanism causing the differences in future dust projections is shown to be the vegetation response, which dominates over the direct effects of warming in our models. Though there are considerable uncertainties associated with any such estimates, the results presented demonstrate both the importance of the size distribution for dust modelling and also the necessity of including Earth system processes such as interactive vegetation in dust simulations for climate change studies.
- Article
(14018 KB) - Full-text XML
- BibTeX
- EndNote


Dust is an important component of the Earth system that is linked to the atmosphere, surface, aerosols and terrestrial and oceanic biospheres (Carslaw et al., 2010). Many factors control the dust life cycle, including vegetation cover, soil moisture, wind speed and precipitation; hence, dust is potentially sensitive to changes in climate through multiple mechanisms. Dust, in turn, affects climate via radiative processes in the atmosphere, via interaction with clouds and other aerosol species, by changing surface albedo and as a source of nutrients for oceanic and terrestrial biogeochemical cycles.
Climate models have long included dust schemes (e.g. Tegen and Miller, 1998; Woodward, 2001; Miller et al., 2006; Kok et al., 2014), which typically allowed dust emission, transport and deposition to be modelled together with the direct radiative effects of atmospheric dust. Some attempts were made to include the impact of the vegetation response on dust (Tegen et al., 2002; Mahowald et al., 2006), though, as the vegetation was not simulated interactively, feedbacks between vegetation and climate were excluded. The advent of Earth system models (Collins et al., 2011; Watanabe et al., 2011), which include interactive vegetation and ocean biogeochemical schemes together with other components, has extended the possibilities for the investigation of interactions between dust and other systems. This also allows for the impact of the responses of Earth system components on the dust to be included in future climate projections.
Here we employ the state-of-the-art UKESM1 model (Sellar et al., 2019) to explore the behaviour of dust within the Earth system in the present day and under possible future development pathways. UKESM1 is built around the HadGEM3-GC3.1 coupled ocean–atmosphere model (Kulbrodt et al., 2018; Williams et al., 2017), and we have made use of this to run parallel experiments with the coupled and Earth system models, in order to investigate the importance of Earth system processes to the dust simulation. Both models use the same dust emission scheme, though the tuning parameters were adjusted for UKESM1. We include particle sizes up to 63 µm diameter. Recent studies have suggested that the correct representation of super-coarse particles is important for the simulation of dust radiative effects (Ryder et al., 2019; Kok et al., 2017).
In this paper, we give a brief introduction to UKESM1 and describe the dust scheme and the experiments used before assessing the present-day simulation of dust load, size distribution, aerosol optical depth (AOD) and deposition against observations, and we also present the simulated dust direct radiative effect (DRE) results. We then compare the UKESM1 simulations with parallel results from HadGEM3-GC3.1 and investigate the causes of the differences. In particular, we examine the consequences of including interactive vegetation and other Earth system processes and the effects of the changes to the dust scheme settings, including the impacts of retuning on load and size distribution and of excluding emissions from seasonal sources. In the next section, we investigate the response of dust to potential climate change as driven by two Shared Socioeconomic Pathways and consider the mechanisms involved. Finally, we present a discussion of the results and summarise our main findings.
UKESM1 is the latest-generation UK Earth system model built around the HadGEM3-GC3.1 coupled atmosphere–ocean general circulation model (Kulhbrodt et al., 2018; Williams et al., 2017) combined with the Model of Ecosystem Dynamics, nutrient Utilisation, Sequestration and Acidification (MEDUSA) biogeochemical model (Yool et al., 2013). The interface between these is provided by the OASIS coupler (Craig et al., 2017). The component models within HadGEM3 are the Met Office Unified Model (UM) atmospheric model (Williams et al., 2017), which contains the United Kingdom Chemistry and Aerosols (UKCA) stratospheric–tropospheric chemistry model (Archibald et al., 2020) with the GLOMAP-mode version of the Global Model of Aerosol Processes scheme (Mulcahy et al., 2020), together with the Joint UK Land Environment Simulator (JULES) model (Walters et al., 2019), the Nucleus for European Modelling of the Ocean (NEMO) model (Storkey et al., 2018) and the CICE sea ice model (Ridley et al., 2018). In UKESM1, these components are used for the interactive simulation of Earth system processes, such as the full atmospheric chemistry from UKCA. The modelling of vegetation and surface properties is particularly important for dust. In UKESM1 the TRIFFID (Top-down Representation of Interactive Foliage and Flora Including Dynamics) scheme within JULES simulates interactive vegetation, while, in HadGEM3-GC3.1, data from the International Geosphere–Biosphere Programme (IGBP) climatology (IGBP, 2000) are used. The soil parameters also differ. Those in HadGEM3-GC3.1 are based on Van Genuchten (Loveland et al., 2000), while those in UKESM1 are from Brooks and Corey (1964). A full description of UKESM1 is available in Sellar et al. (2019).
The mineral dust is simulated within HadGEM3 by the fully interactive dust scheme described below, which is called each atmospheric model time step. The driving fields are calculated directly by the UM and JULES, and dust impacts the rest of the model through radiative interactions with the UM atmosphere and through input to the ocean biogeochemistry in MEDUSA. In the current configuration, the dust is externally mixed with other aerosols.
3.1 Description of dust scheme
The dust scheme is a development of that described in Woodward (2001), with significant improvements to the emission scheme and newer refractive index data. Dust emission in six size bins, with boundaries at 0.06324, 0.2, 0.6324, 2.0, 6.324, 20.0 and 63.24 µm diameter, is calculated at each atmospheric model time step (20 min). Within each bin, is assumed constant, where V is particle volume and r is the particle radius, giving a sectional distribution of . Horizontal flux is calculated over a wider size range, with three additional bins with boundaries at 63.24, 200.0, 632.4 and 2000.0 µm diameter.
Flux calculations are based on the method of Marticorena and Bergametti (1995). Horizonal flux in bin i is given by the following:
where ρ is the surface air density in kilograms per cubic metre (kg m−3), B is the bare soil fraction, is the threshold friction velocity for the bin in metres per second (hereafter m s−1), U∗ is the friction velocity excluding orographic effects in m s−1, C is a constant of proportionality set to 2.61 from wind-tunnel experiments, D is a dimensionless tuneable parameter (see Sect. 3.3), and g is the acceleration due to gravity in m s−2. Mi is the mass fraction of the particles in the bin, obtained from soil clay, silt and sand fractions from HWSD data (Nachtergaele et al., 2008), according to the method described in Woodward (2001).
In UKESM1 dust is emitted only from the bare soil fraction of a grid box, though there is also an option in the code to allow emissions from seasonally bare sources, based on the leaf area index (LAI). Dust emissions are prevented if snow is present, if the ground is frozen, on steep slopes, if soil moisture exceeds a threshold (see below), and at coastal points where the lowest-level wind speed over land may be anomalously high. No preferential source terms are used.
The driving fields for the scheme are the model's grid box mean time step mean fields, but Eq. (1) was derived from shorter timescale measurements at single locations. Corrections are therefore needed to account for the effect of spatial and temporal averaging. Here, model friction velocity (in m s−1) is multiplied by a dimensionless tuneable constant k1.
The value of k1 was chosen empirically, as described in Sect. 3.3. Ideally, such a correction would be spatially and temporally variable to account for rapid fluctuations which might be specific to certain conditions; for example, Lunt and Valdes (2002) and Cakmur et al. (2004) related gustiness to surface sensible heat flux, which is typically strongest at midday and within arid regions. These studies suggest that introducing a representation of gustiness can have a large impact and can improve dust simulations, though the magnitude and spatial distribution of the effect appears to be strongly dependent on the parameterisation used. Cakmur et al. (2004) showed that a parameterisation using a linear combination of the gustiness, due to dry and moist convection and turbulent kinetic energy, produced considerable improvements in modelled optical depth in many areas. The use of a global tuning term rather than a realistic representation of gustiness will introduce biases to our simulations, with friction velocity overestimated in some areas at some times and underestimated in others. Though the higher resolution of our models compared to those of Lunt and Valdes (2002) and Cakmur et al. (2004; 1.875∘ × 1.25∘ compared with 3.75∘ × 2.5∘ and 4∘ × 5∘ respectively), together with the shorter time step (20 min compared with 30 min interpolated from 6 h input and 1 h respectively) should allow a somewhat better representation of the smaller-scale and more variable processes, many phenomena important for dust generation are still sub-grid scale.
Dry threshold friction velocity () values were obtained from Bagnold (1941). The values for each of the nine horizontal flux bins are 0.85, 0.72, 0.59, 0.46, 0.33, 0.16, 0.14, 0.18 and 0.28 m s−1. The effect of soil moisture on friction velocity is represented using the method of Fécan et al. (1999), which has been shown to agree well with measurements. The threshold friction velocity for moist soil is related to the dry threshold friction velocity by the following:
where .
FC is the clay fraction and w is volumetric soil moisture. The model provides average soil moisture over the 10 cm deep top soil level (w1). In order to obtain soil moisture near the surface, as well as to correct for the effects of temporal and spatial averaging, the model soil moisture is multiplied by a dimensionless tunable constant k2, which was also set empirically, as follows (see Sect. 3.3):
The highest clay fraction reported in the measurements on which the algorithm was based was 0.2 (Gillette, 1979). However, it subsequently became clear that the single measurement with this high clay fraction was contaminated by upstream dust (Dale Gillette, personal communication, reported in Alfaro and Gomes, 2001). The next-highest clay fraction measured was 0.1. As high clay fractions result in unrealistically high emissions from the dust scheme, a maximum of 0.1 is applied, with higher values of FC being reset to this.
The Fécan et al. (1999) treatment of soil moisture was designed for use in arid or semi-arid areas, and in order to apply it to the whole Earth, a further constraint on dust production from moist soil is required. Dust production is inhibited when soil moisture exceeds a particle-size-dependent threshold (wt), which was chosen to correspond approximately to the maximum soil moisture for which movement was detected in the observations used by Fécan et al. (1999).
The vertical dust flux is calculated for the six emission bins in the range 0.06324 to 63.24 µm, corresponding to the smallest six horizonal flux bins. Total vertical flux relates to total horizontal flux summed across all bins, according to the method of Marticorena and Bergametti (1995), which is based on the measurement data of Gillette (1979). The size distribution across the six vertical flux bins follows that of the equivalent horizontal flux bins. Vertical flux in bin i (Fi), for i = 1 to 6, is given by the following:
Dust is transported as six independent tracers corresponding to the six vertical flux bins. Deposition through below-cloud scavenging, turbulent mixing and sedimentation is included, as described in Woodward (2001). The radiative effects of dust on the atmosphere are simulated with the model's two-stream radiation code (Edwards and Slingo, 1996). Dust radiative properties were derived from the data of Balkanski et al. (2007) for Saharan dust. This is intended to provide the optimum simulation of dust from the Sahara, the world's largest dust source, though the radiative effects of dust from other sources with other mineralogical contents will inevitably be less well modelled (Sokolik and Toon, 1999). No chemical processing of dust in the atmosphere is represented; this is something we hope to include in future versions of the scheme. In UKESM1, the total marine dust deposition flux is passed into the ocean, where it is multiplied by a tuned constant to derive “bioavailable iron” (Yool et al., 2021), which is used by the MEDUSA ocean biogeochemical scheme (Yool et al., 2013) as a nutrient source for plankton growth.
The scheme described here uses the same code as the UM global atmosphere GA7.1 and global coupled GC3.1 configurations but with the following two changes in the settings: (1) the three tuning terms (D, k1 and k2) are different and (2) the emission of dust from seasonally vegetated sources which is allowed in GA7 and GC3.1 is deactivated in UKESM1. The latter was done both because it was unclear whether the simulation of the global distribution of the various plant types would be sufficiently accurate for the purpose and also because the JULES land surface tiling on which the seasonal source code depends had been changed for UKESM1, rendering the associated dust settings invalid. Seasonal sources (see Fig. 10) accounted for less than 10 % of the load in HadGEM3-GC3.1, so this was not expected to have a large impact. The uncertainties associated with the emission scheme are considered in Sect. 7.
3.2 Diagnostics
The model provides a self-consistent set of diagnostics of dust emissions, depositions and mixing ratios (concentrations). While the concentration, wet deposition and dry deposition over water are directly comparable to results from other models and to observations, the emission and dry deposition in source regions are not. Atmospheric lifetime, being derived from these terms, is also not comparable. The emission and dry deposition diagnostics include all particles released from the surface, whether or not they are added to the atmospheric load or interact with the model atmosphere in any way. In the UM the flux of particles released from the surface is calculated first, and then another section of code performs both the mixing into the atmosphere and the dry deposition back to the surface in a single loop. As a result, a fraction of the particles released from the surface is immediately dry deposited and never added to the atmospheric burden. In physical terms the redeposited fraction may be considered to be those particles which fall back to the surface within the model time step. The magnitude of this effect is greater for larger particles due to the size-dependence of sedimentation and, because the particle size range extends to 63 µm, it has a considerable impact on the total emission and deposition diagnostics and also the calculated lifetime.
3.3 Dust tuning
The parameters D, k1 and k2 were tuned to improve agreement between the UKESM1 dust simulation and various observations. The final values chosen were D = 1.0 × 10⁻³, k1 = 1.1, k2 = 0.8. Sets of UKESM1 experiments were run with different values of these parameters, and the simulations were compared with multi-annual means of dust concentration measurements from selected stations of the University of Miami aerosol network (e.g. Prospero et al., 2010), AOD measurements from selected AERONET (AErosol RObotic NETwork) sites (Holben et al., 2001) and size distributions from the FENNEC campaign (Ryder et al., 2013). In addition, the model AOD was compared with MODIS data (Levy et al., 2013) and the dust deposition with measurements collected by Huneeus et al. (2011). These observational datasets were also used for evaluation of the final UKESM1 and HadGEM3-GC3.1 dust simulations, and further information is given in Sect. 5. Note that, as the fully spun-up UKESM1 present-day simulation had a slightly different climate from the versions of the model used for tuning, as described below, the results presented in Sect. 5 do not represent the results of the tuning experiments.
The aim of the tuning process was to obtain the optimum simulation of emissions by correcting for terms and processes not included in the climate model but which impact dust emissions, such as the effect of gustiness, the relation between moisture in the model's top soil level and at the soil surface, etc. In the absence of emission measurements, observations of other dust properties at some distance from the sources must be used for model evaluation. These are affected not only by the emissions but also by transport and deposition processes and, in some cases, by the dust radiative properties. Thus the tuning is inevitably influenced by, and compensates for, any biases in these processes and properties in the dust scheme, in addition to biases in the driving model fields, such as in bare soil fraction, which affected the dust. In an attempt to reduce the effects of these biases, higher importance was given to comparisons with direct observations of dust concentration and size than with observations of properties such as AOD and with observations nearer sources than with observations at remote locations. Correct simulation of near-source concentration and size distribution is also important because the impact on the dust radiative forcing and potential feedbacks will be largest in source areas.
Initial sets of tuning experiments were used to explore the parameter space, finding how the model responded to changes in each of the variables and constraining their range; later experiments focussed on the finer tuning of the variables. Due to time constraints in the development of UKESM1, dust scheme tuning was carried out in parallel with the later stages of the Earth system model (ESM) development. As a consequence of this, tuning terms had to be adjusted on an ongoing basis in response to changes in the driving model, and there was insufficient time for a highly detailed tuning process. Though otherwise not ideal, this parallel development had the advantage that minor changes could be made to other parts of the ESM to improve the dust simulation. In particular, the lai_min term for grasses in JULES was reduced to 0.3, allowing the grasses to spread more readily and improving the simulation of bare soil fraction (Sellar et al., 2019).
The tuning of UKESM1 dust was carried out primarily with UKESM1-CN, the offline chemistry version of UKESM1 (Sellar et al., 2019), as this ran more quickly than the full ESM, and the interactive chemistry was expected to have little impact on the dust. Comparisons of dust simulations from the two versions of the ESM showed only small differences, with the various tuning settings tending to perform similarly in each case. Preindustrial (PI) simulations were used for the tuning as a fully spun-up present-day experiment was not available at that stage. While this meant that the model climate did not match the period of the observations, this discrepancy was likely to have had a relatively small effect compared with the cumulative effect of the many uncertainties in the dust scheme, such as biases in the simulated bare soil fraction, soil moisture and wind speed, resolution-related limitations in capturing some emissions mechanisms and the omission of surface-crusting effects and other poorly understood processes. Tuning tests were also carried out with “pseudo-present-day” experiments, initialised from PI runs but then run to equilibrium with present-day (PD) atmosphere and land use settings. These produced similar results to the main tuning experiments and gave confidence in the use of PI simulations to establish tuning parameters. However, the climate in the fully spun-up present-day UKESM1 simulation reported here was slightly different from that in the tuning runs.
The dust in HadGEM3-GC3.1 was not retuned for this work. HadGEM3 is a widely used model (Williams et al., 2018) which has been regularly updated, with some dust retuning being carried out before the release of a new version if the update had a major effect on the dust. Here we make use of the existing HadGEM3-GC3.1 configuration (Kuhlbrodt et al., 2018), as used for the CMIP6 simulations (Eyring et al., 2016), without any changes, except in experiments H3_TUK_EXSS and H3_TUK_INSS, as described in Sect. 4. The dust tuning parameters had been set to D = 2.25 × 10⁻⁴, k1 = 1.45 and k2 = 0.5.
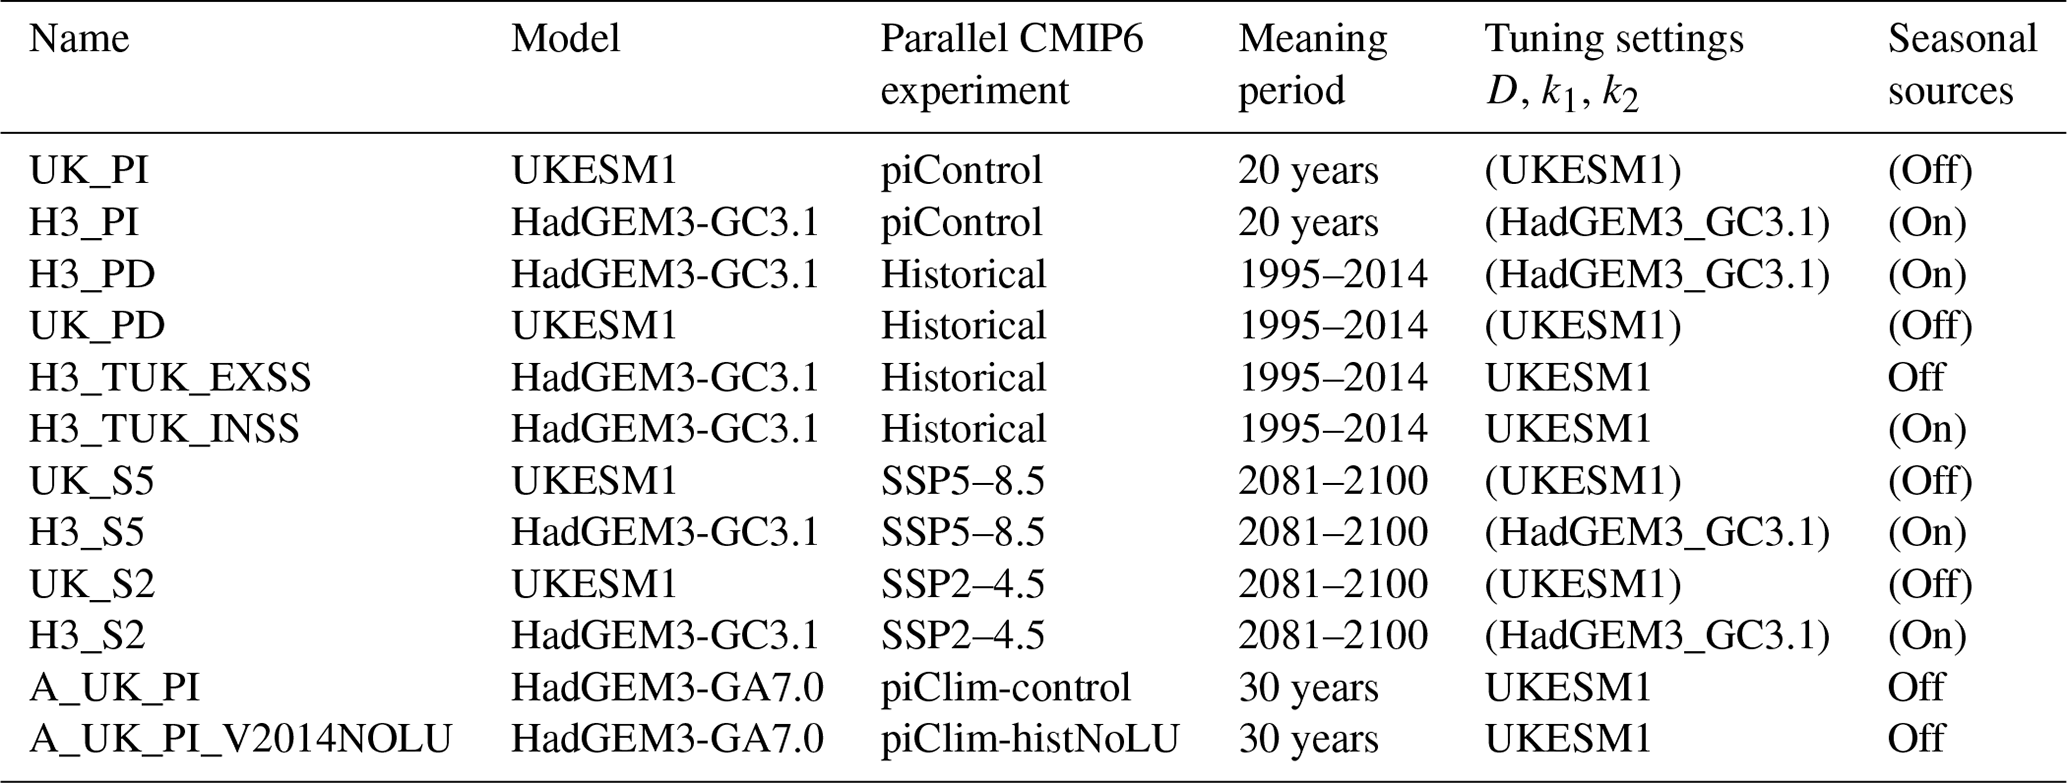
The results presented here were primarily obtained from UKESM1 and HadGEM3-GC3.1 historical experiments parallel to those performed as part of CMIP6 (Eyring et al., 2016) but with extra diagnostics. In order to obtain the diagnostics needed for calculating DRE, a copy of each relevant CMIP6 experiment was run for 20 years with the “double call” method. This involved calling the radiation scheme twice each time step, with the radiative effect of dust excluded from the first call but included in the second which is used to progress the model. The dust DREs are then calculated as the differences between the fluxes from each call. In addition, two parallel HadGEM3-GC3.1 experiments were run. In both of these, the tuning terms were set to UKESM1 values, and in one the seasonal sources were also deactivated. These allowed us to investigate the relative importance of the various differences between the main simulations. Two UKESM1 Atmospheric Model Intercomparison Project (AMIP) experiments from CMIP6 were also used. The experiments are summarised in Table 1.
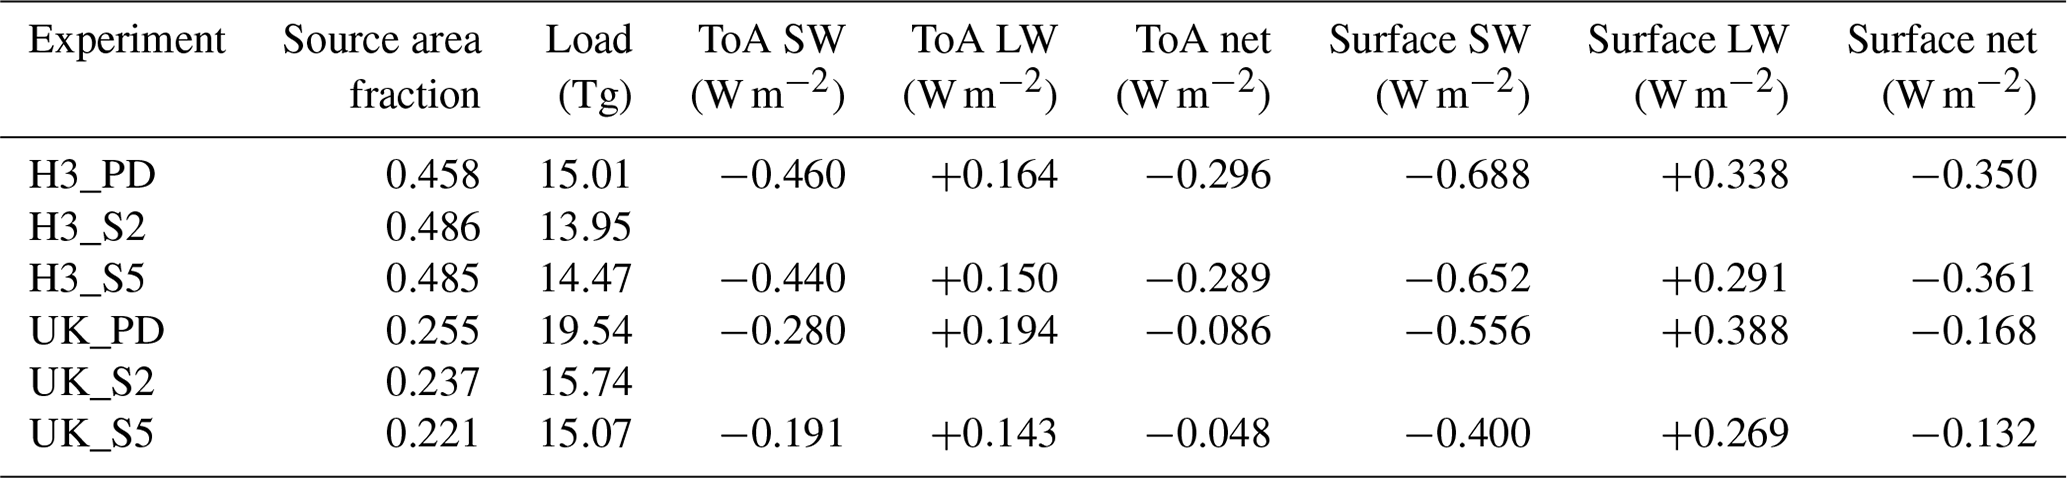
Table 1Summary of experiments. The UKESM1 tuning settings for D, k1 and k2 are 1.0 × 10⁻³, 1.1 and 0.8 respectively; the HadGEM3 settings are 2.25 × 10⁻⁴, 1.45 and 1.1. Tuning settings and seasonal source settings (in parentheses) indicate that the values are the usual ones for the model used in that experiment. For a further explanation of these terms, see Sect. 3.
5.1 Concentration and load
Figure 1 shows dust load from the UKESM1 and HadGEM3-GC3.1 present-day simulations (UK_PD and H3_PD), together with the differences and fractional differences. Both models capture the expected global dust distributions qualitatively well. The UK_PD global load of 19.5 Tg is 30 % higher than the 15.0 Tg H3_PD value. These values span the AeroCom phase III mean of 16.6 Tg and are within the range of 5.7 to 22.3 Tg shown by participating models (Gliß et al., 2021). They are also consistent with the more observationally constrained estimate by Kok et al. (2017) of a PM20 dust load of 23 Tg with a range from 14 to 33 Tg. The greatest differences between the models are over the Sahel, India, the Middle East, Asian midlatitudes and Australia and are predominantly due to differences in the bare soil and associated changes (see Sect. 5.6 and Fig. 8).

Figure 1Dust load (Tg) from H3_PD, UK_PD, difference and fractional difference.
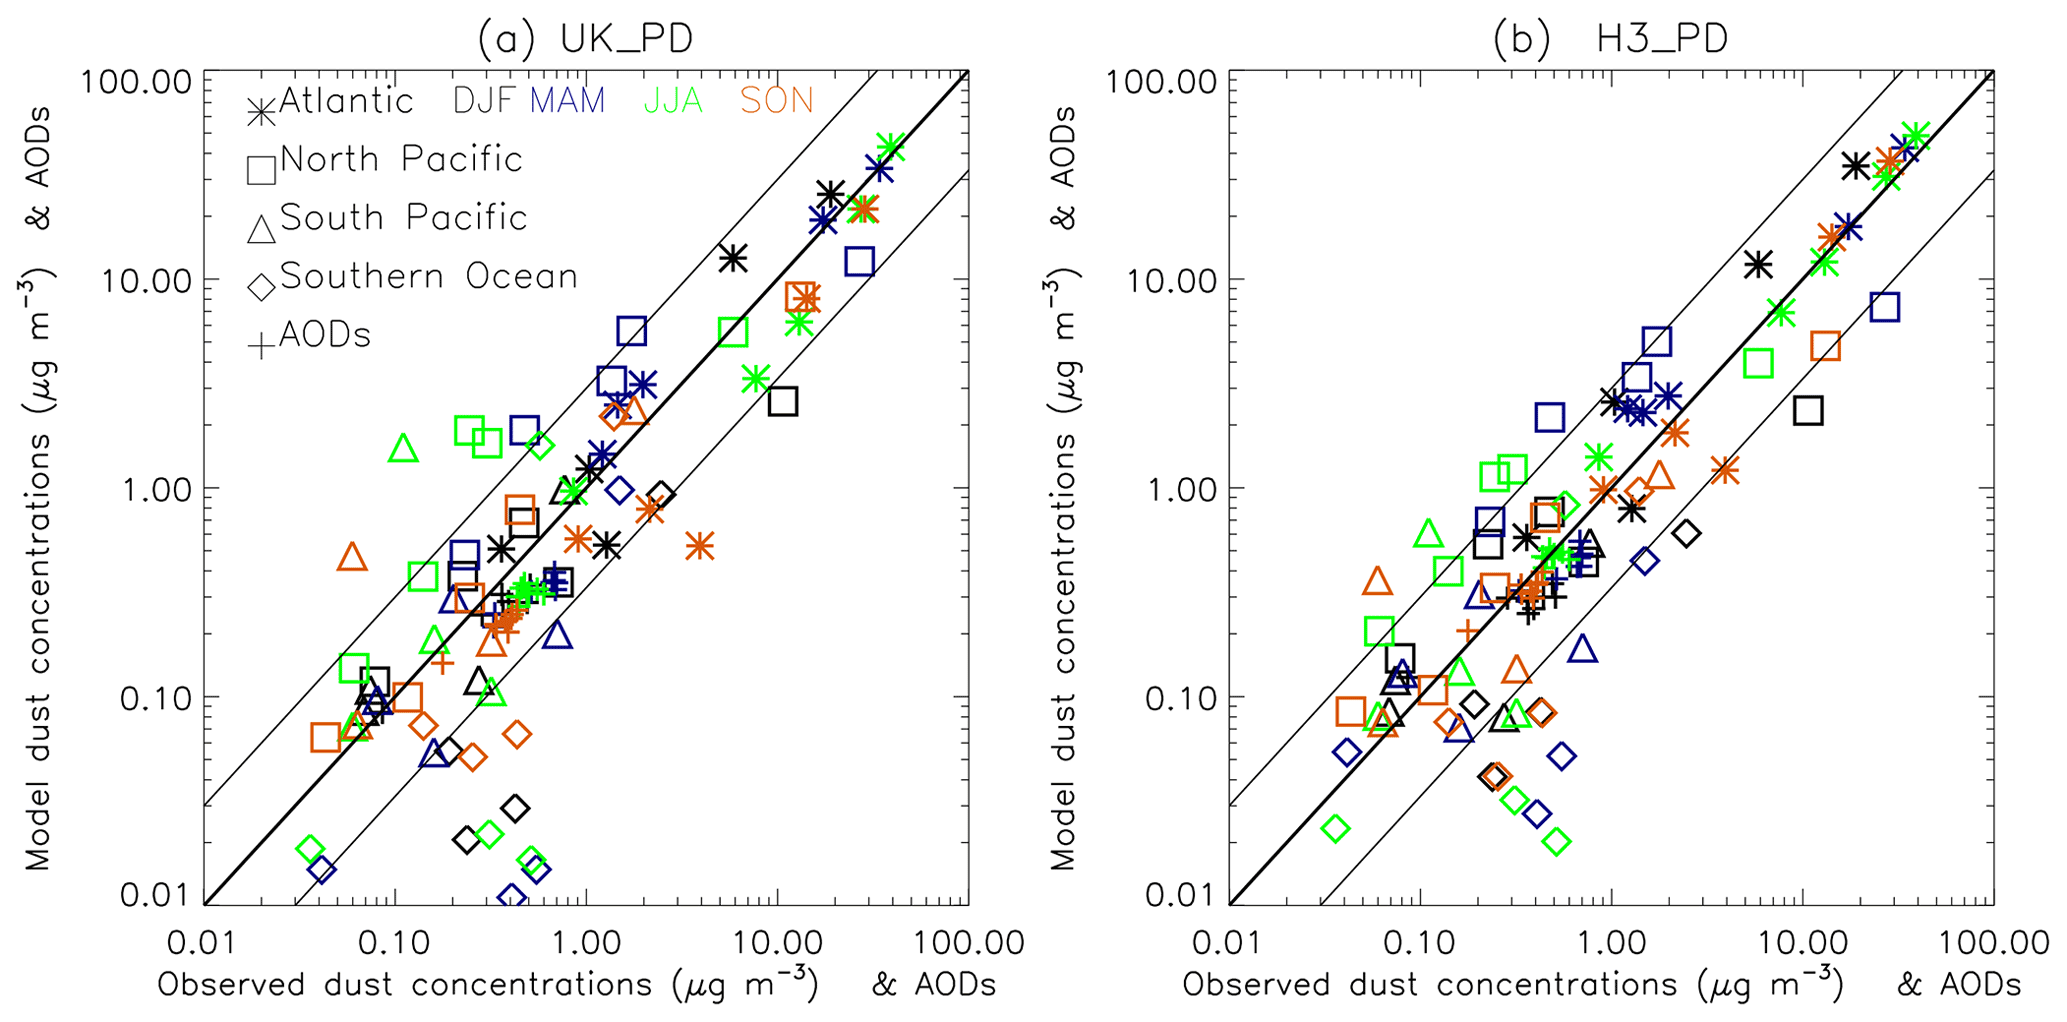
Figure 2Scatterplots of model versus observational multi-annual seasonal mean concentrations at remote marine locations and AODs in dusty areas for (a) UK_PD and (b) H3_PD. Concentrations are from the University of Miami Network stations at Cape Grim, King George Island, Mawson Station, Palmer Station, Funafuti, Nauru, Norfolk Island, American Samoa, Midway, Oahu, Cheju, Fanning, Enewetak, Barbados, Bermuda, Mace Head, Miami, and Izana. AODs are from AERONET V3 at the stations listed in Fig. 4.
Figure 2 shows scatterplots of seasonal mean modelled dust concentrations versus observations from remote sites from the University of Miami network and AERONET sites (Holben et al., 2001) chosen for data availability and dustiness, based on the Ångström exponent (see Sect. 5.3). At least 4 years of monthly data were available for the chosen sites. Both UK_PD and H3_PD show good agreement with the observations, with the models being within a factor of 3 of the observations at most stations for most seasons. The correlation coefficients for the concentration and AOD data shown in Fig. 2 are 0.89 for UKESM1 and 0.87 for HadGEM3-GC3.1. The slight high bias at a few North Pacific stations in spring and summer is increased in UKESM1 due to larger bare soil areas in Asia simulated by TRIFFID, with associated increased wind speed and reduced soil moisture. Similarly, increased bare soil in Australia results in an increased high bias at the nearest South Pacific station. The low biases almost all occur at two stations on the Antarctic Peninsula, where the dust from Patagonia dominates. The concentrations here are likely to be very sensitive to the westerly winds in that region. The bias is worsened in UKESM1 due to a low bias in the simulated bare soil fraction. Overall, the UKESM1 surface concentrations show good agreement with observations, compared with other ESMs (Checa-Garcia et al., 2021). The similarity in the level of performance between UKESM1 and HadGEM3-GC3.1 is noteworthy, given the many extra processes and feedbacks within the ESM and, in particular, its use of interactive vegetation.
5.2 Size distribution
UKESM1 dust was tuned to give better agreement with the size distribution data from the FENNEC campaign (Ryder et al., 2013) than was shown in HadGEM3-GC3.1. These data were particularly useful as they provided measurements near sources where the effects of deposition and transport on the size distribution would be relatively small and, unusually, included data from several instruments for measuring larger particles with diameters above 3 µm. The FENNEC campaign took place in June 2011 in the remote Sahara.
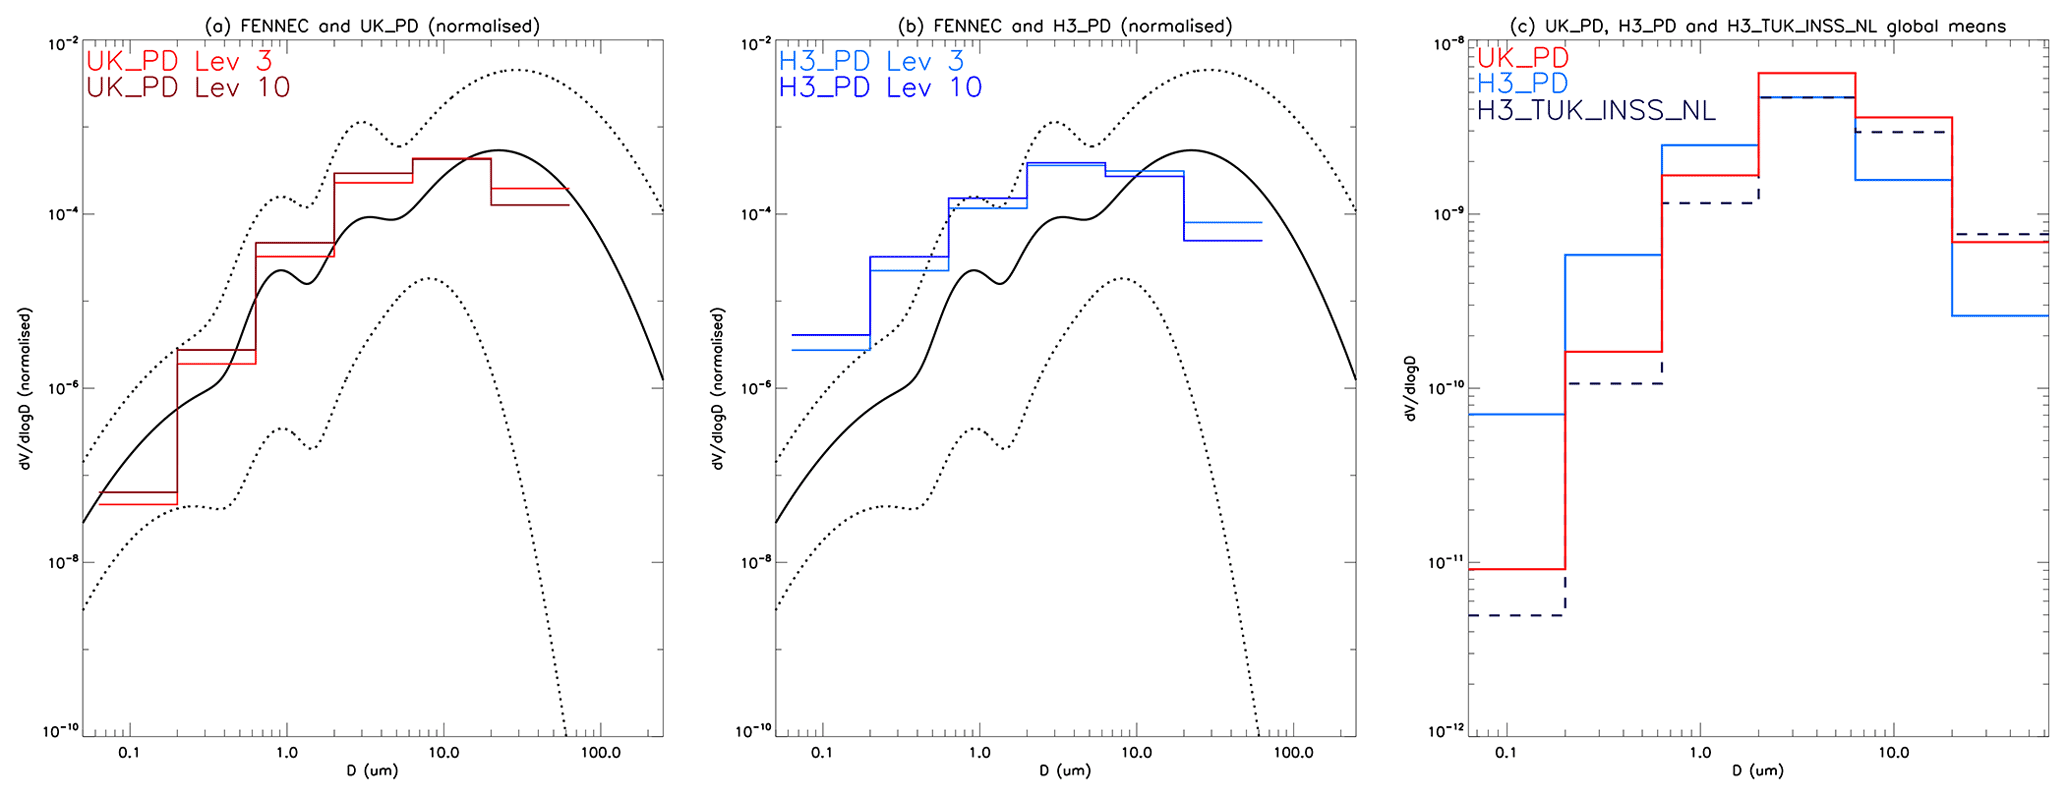
Figure 3Dust volume size distributions, including the (a) normalised distribution from a fit to FENNEC mean, maximum and minimum data (Ryder et al., 2013) and from a multi-annual June mean of UK_PD data averaged over a rectangular area 13–4∘ W, 21∘ S–26∘ N, covering the FENNEC campaign region, for model levels 3 (approx. 96 m) and 10 (approx. 770 m), and corresponding to the height range of most of the FENNEC measurements. (b) Same as panel (a) but for H3_PD. (c) Global mean size distribution from UK_PD, H3_PD and H3_TUK_INSS_NL.
Figure 3 presents normalised volume size distributions from 20-year June means from UK_PD and H3_PD compared with a fit to the FENNEC observations. UK_PD shows good agreement with the observations throughout the size range. The lower-level data have a somewhat greater coarse particle fraction than the higher-level data, as might be expected in a source region, given the short lifetimes of the largest particles. The peak diameter is slightly smaller than in the observations. This would be consistent with the 20-year June mean containing a smaller fraction of freshly emitted particles than were measured in observations which were intended to sample dusty conditions.
H3_PD concentrations overlap with the FENNEC observations, though the overall agreement is poorer, as the model is outside the range of the observations for the two smallest bins, and the peak of the distribution is in bin 4 (2–6 µm diameter), which is rather below the peak diameter of the observations.
5.3 Optical depth
Comparison of monthly mean model AODs with data from AERONET (Holben et al., 2001) sites in dusty areas (Fig. 4) shows that the modest low bias in H3_PD is slightly worsened in UK_PD, though the model mean is within 2 standard deviations of the observations in almost all cases. The stations were selected to obtain as realistic observational climate means as possible, given the considerable variability in dust and the short data record, and to minimise the effects of other aerosols. Sites were chosen from those in potentially dusty areas as having a minimum of 4 years of monthly data, with at least 10 daily means per month, and a monthly mean Ångström exponent (870–440) below 0.5 for at least 10 months of the year. The only sites to fulfil these criteria were Tamanrasset_INM in the Sahara, Cabo Verde off the West African coast and six Sahelian stations all in a narrow band between 12 and 16∘ N.
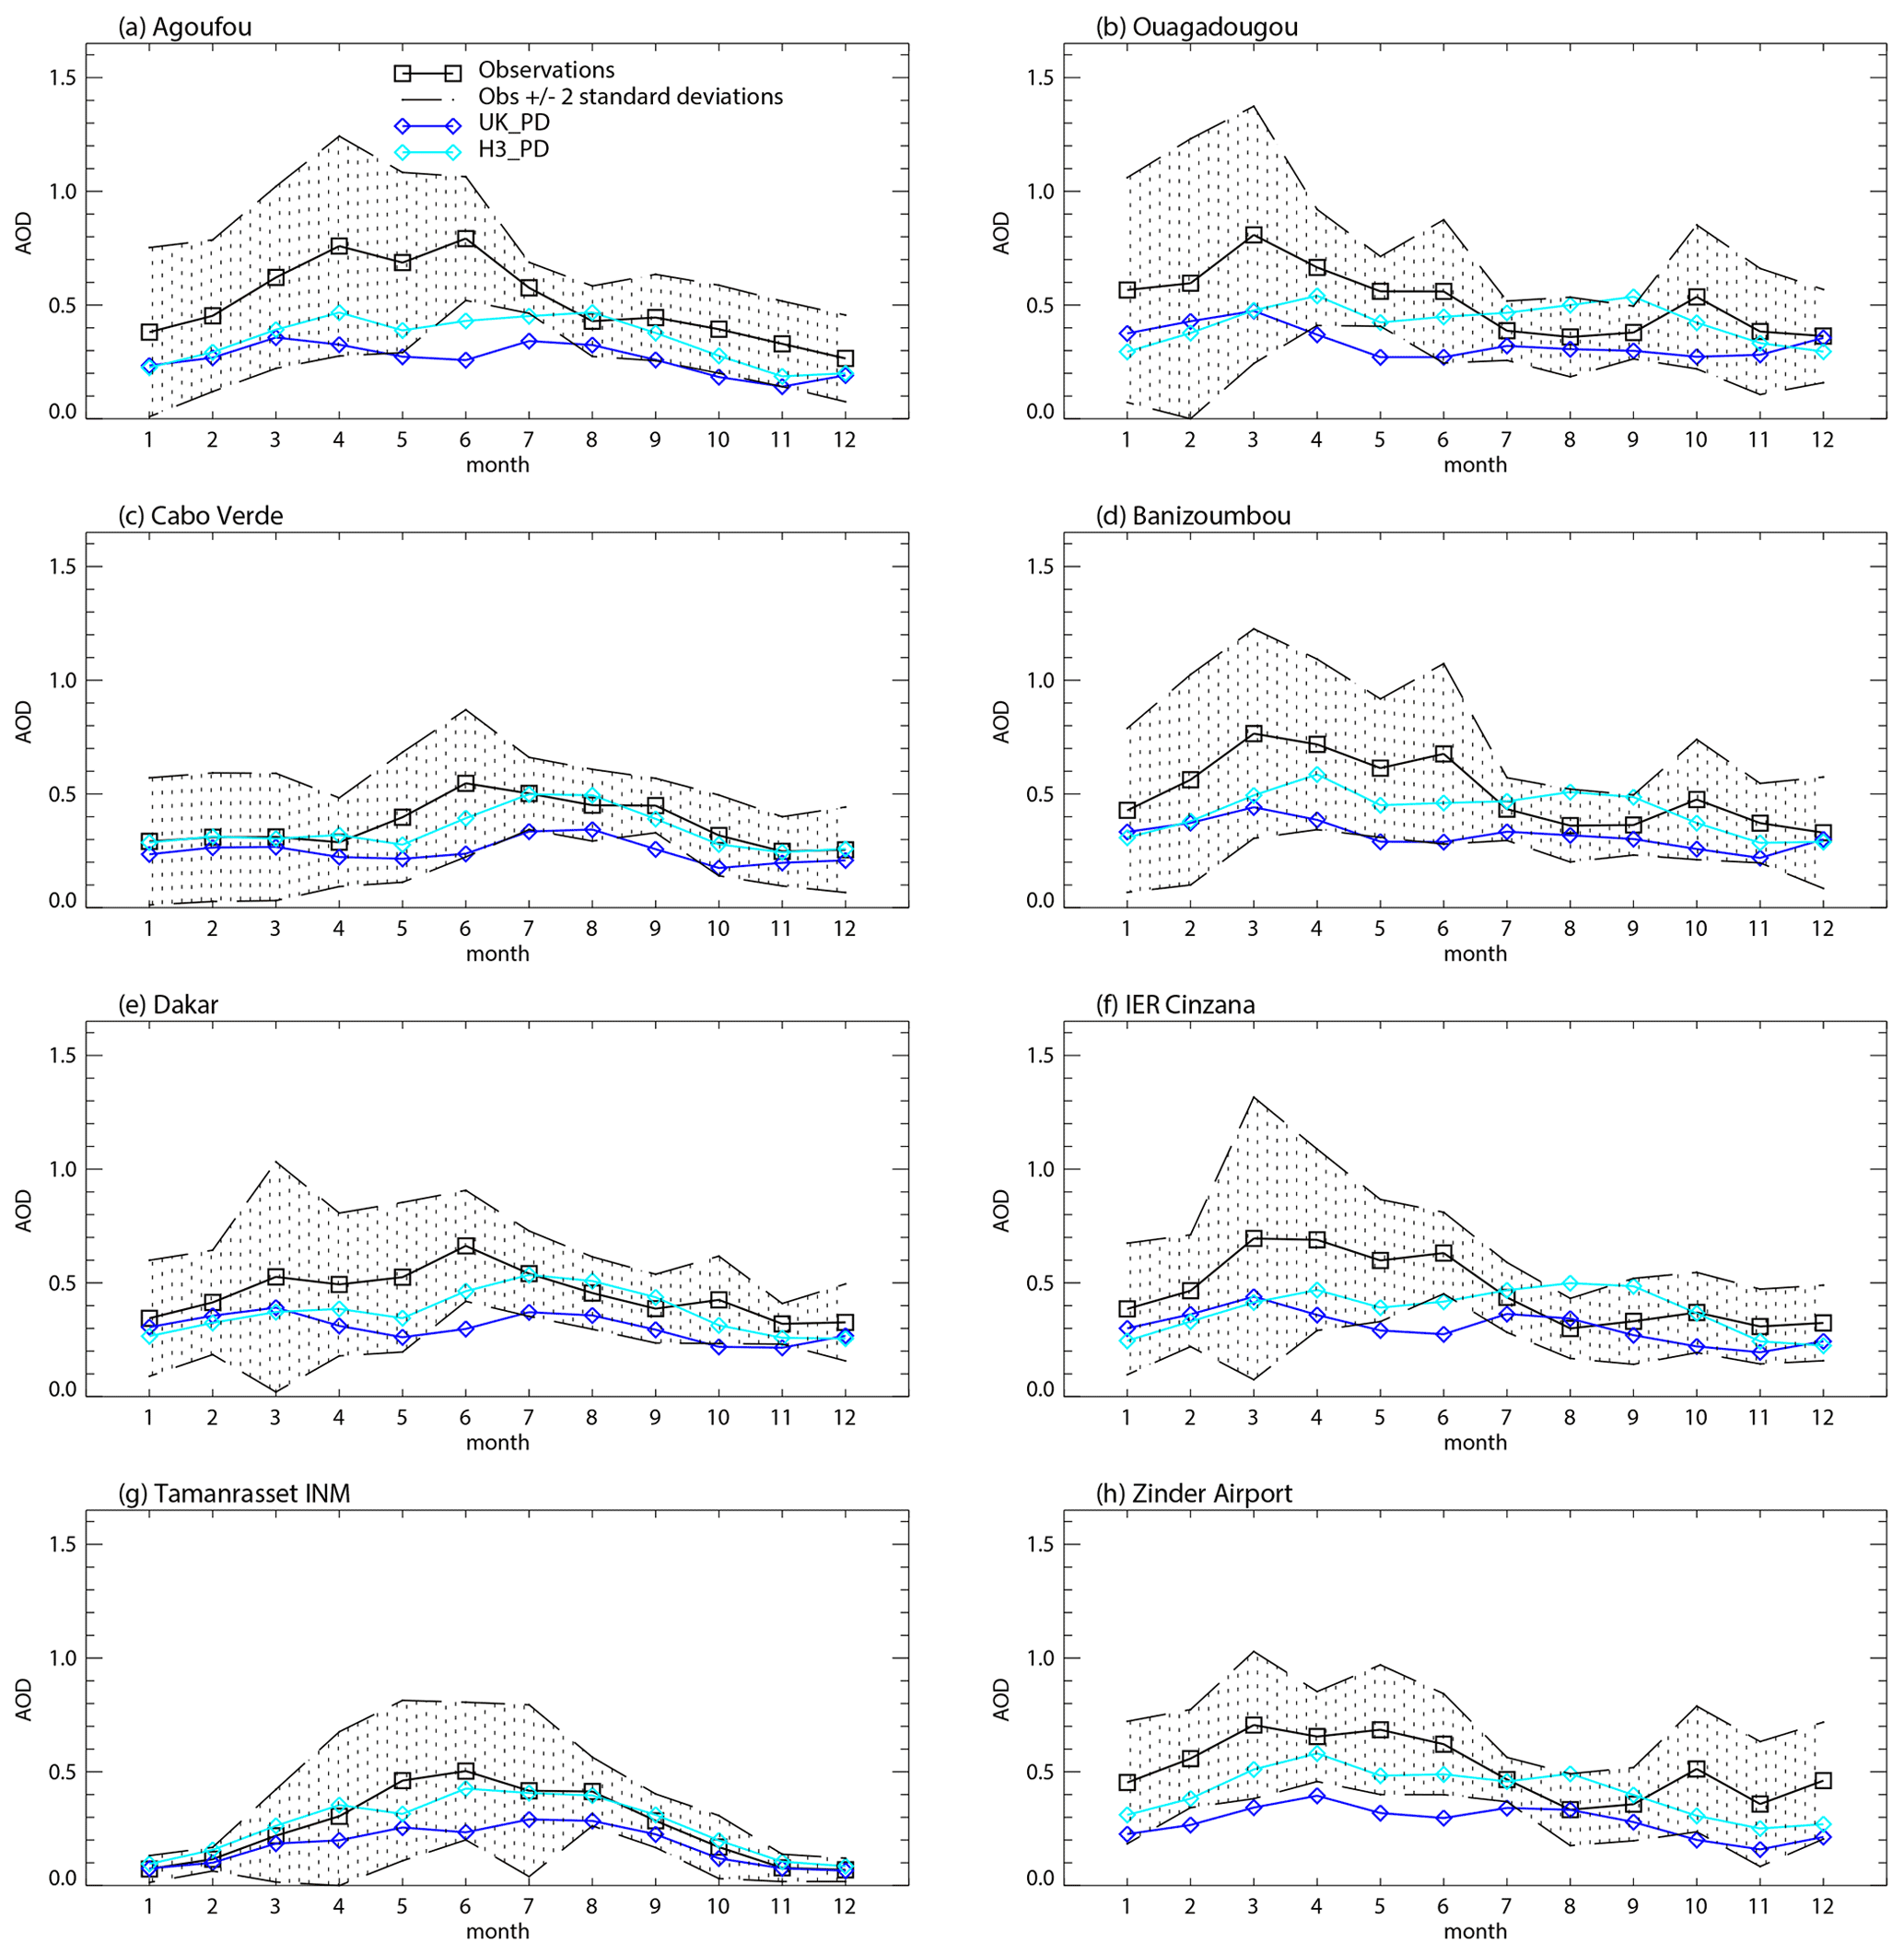
Figure 4Annual cycle of AOD (440 nm) at dust-dominated AERONET stations from UK_PD and H3_PD. Site locations are Agoufou (1.48∘ W, 15.35∘ N), Ouagadougou (1.40∘ W, 12.20∘ N), Cabo Verde (22.94∘ W, 16.73∘ N), Banizoumbou (2.66∘ E, 13.54∘ N), Dakar (19.96∘ W, 14.39∘ N), IER Cinzana (5.93∘ W, 13.28∘ N), Tamanrasset INM (5.53∘ E, 22.79∘ N) and Zinder Airport (8.99∘ E, 13.78∘ N).
The observed multi-annual mean AOD at 440 nm averaged over these AERONET sites is 0.45, while UK_PD simulates 0.28 and H3_PD simulates 0.37. Comparison of the simulations shows that the lower AOD in UK_PD is due to a combination of lower dust optical depth (DOD; 0.13 in UK_PD and 0.19 in H3_PD) with lower optical depth due to other species (0.15 in UK_PD and 0.18 in H3_PD). The lower DOD in UK_PD is caused by the larger particle sizes in that model, as evidenced by the Ångström exponent for the DOD (440–870), which is −0.06 in UK_PD and 0.23 in H3_PD, while the mean atmospheric load at these sites is higher in UK_PD at 540 mg m−2, compared to 340 mg m−2 in H3_PD. The Ångström exponent for the total AOD (440–870) is 0.65 in UK_PD and 0.76 in H3_PD, compared to 0.33, in the AERONET observations. This indicates too low a coarse mode fraction in the simulations, which suggests too little dust, as this is the dominant coarse-mode species at these locations, and the low simulated AODs show that there is no excess of fine-mode aerosol. The slightly better agreement of UK_PD with the observed Ångström exponent may be an indication that the particle size distribution is more realistic than in H3_PD, which would be consistent with the comparisons with FENNEC data, though with the caveat that the potential effects of different concentrations of other aerosol species at the AERONET sites cannot be ignored.
Studies by Marticorena et al. (2010, 2017) have shown that the annual cycle of dust in the western Sahel is related to the timing of the West African Monsoon (WAM) and the annual north–south shift in the Intertropical Convergence Zone (ITCZ). Through winter and early spring, the Harmattan flow brings dust from the Sahara to this region, and the increasing AODs over the first few months of the year are consistent with the annual cycle of Saharan dust, as seen at Tamanrasset INM. From May to October the WAM dominates the region, bringing precipitation and wind from the southwest. During the early part of the monsoon season, strong but sporadic local emission events driven by mesoscale convective systems (MCSs; Caton-Harrison et al., 2019, 2020) produce similar levels of dust to those seen in the dry season. The UK_PD simulations slightly underestimate the AODs due to Saharan dust in the dry season, but the main sources of error appear to be in the timing of the arrival of the WAM, with AODs already decreasing in April, and in particular a failure to simulate the dust production from local sources. These failings are unsurprising, given the difficulties in simulating the WAM and MCSs in an N96 climate model with a resolution of 1.85∘ × 1.25∘ (Marsham et al., 2011; Heinold et al., 2013) and in simulating realistic vegetation cover in this marginal area. In this regard, the performance at Sahelian sites cannot be considered representative of the dust simulation generally. At Tamanrasset, UKESM1 simulates the dry season dust well but underestimates the wet season AOD. Similar patterns are seen in the AOD at Cabo Verde, which is dominated by Saharan dust, though sea salt is also present at this site (Fomba et al., 2014; Ryder et al., 2018). Guiardo et al. (2014) identify four source areas for Tamanrasset. Dust from an area immediately south of the site and from the east Libyan desert affects the site all year, while dust from the western Sahara and the Libya–Tunis border only reach Tamanrasset in the wet season. Some of these areas could be affected by errors in the simulation of the WAM and the position of the ITCZ; wind speed bias could also be involved, as could resolution-related issues, such as difficulties in the simulation of low-level jets or the representation of local orography, in addition to biases in the dust scheme.
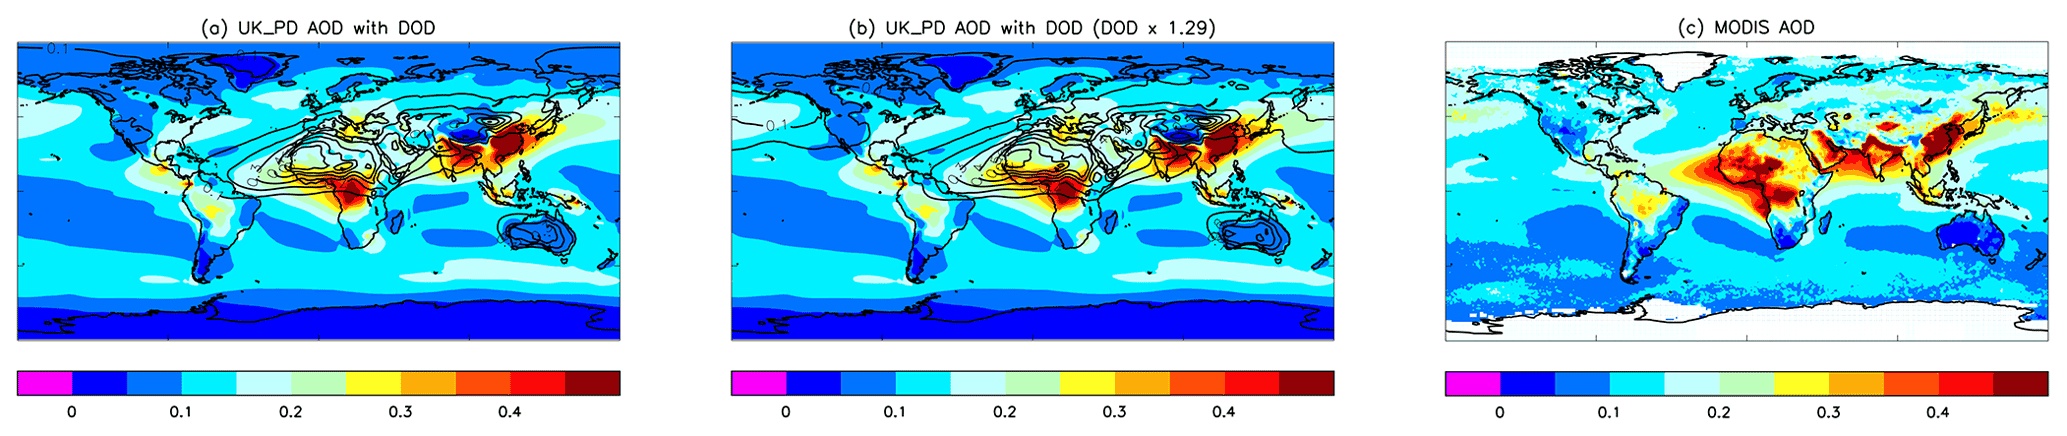
Figure 5AOD (550 nm) from (a) UK_PD, with contours showing the fractional contribution of dust to total AOD. (b) Same as panel (a) but with dust optical depth multiplied by 1.29. (c) MODIS 2003–2012 mean.
Figure 5, which compares the total aerosol optical depth at 550 nm in UK_PD with MODIS data, shows a low bias in the Sahel, as mentioned above, and also in dust from the Bodélé Depression. The Bodélé dust source is very difficult to simulate in global climate models because a resolution of a few tens of kilometres is needed to represent the Bodélé low-level jet, which is responsible for much of the dust emissions (Todd et al., 2007). The dust-dominated AOD over the northern Sahara and the Arabian Peninsula is also low, while over Australia it is too high. The high bias on the southwestern side of the Himalayas and low bias on the northeastern side either suggest that the model may be failing to transport aerosol over the steep orography there or may be associated with other aerosol species. These biases reflect model weaknesses and also the difficulty of finding a single set of tuning terms which gives a good performance against all metrics. The settings which gave improvement in AOD over North Africa resulted in the worsening of biases associated with Asian and Australian dust.
The effects of non-sphericity on the dust particle optical properties were not included in the models. It has been estimated that the extinction efficiency could increase by as much as 29 % (Kok et al., 2017). An indication of the potential effect this might have was estimated by multiplying the UK_PD dust optical depth by a factor of 1.29, which resulted in an improved agreement with the satellite data (Fig. 5).
5.4 Deposition
Though the model deposition diagnostics will not represent observed deposition in source regions (see above), they are comparable to measurements in locations where there are no local emissions. Deposition rates have been evaluated against annual mean measured fluxes from a range of data sources at sites remote from emission areas, as selected by Huneeus et al. (2011), for the evaluation of dust in AeroCom models. These include deposition observations from Ginoux et al. (2001), dust and iron deposition fluxes reported in Mahowald et al. (2009), ice core data from Mahowald et al. (1999) and sediment trap data from the DIRTMAP database (Tegen et al., 2002; Kohfeld and Harrison, 2001). Though this collection of deposition data from 84 sites is one of the most comprehensive available, there are considerable uncertainties associated with the observations, most notably that, although sites with less than 50 d of data were excluded, some of the records are not long enough to be considered climatological (Huneeus et al., 2011). This is particularly problematic for dust fields which show very strong variability, as a large fraction of annual deposition may occur over a few days of the year (Prospero et al., 2010).
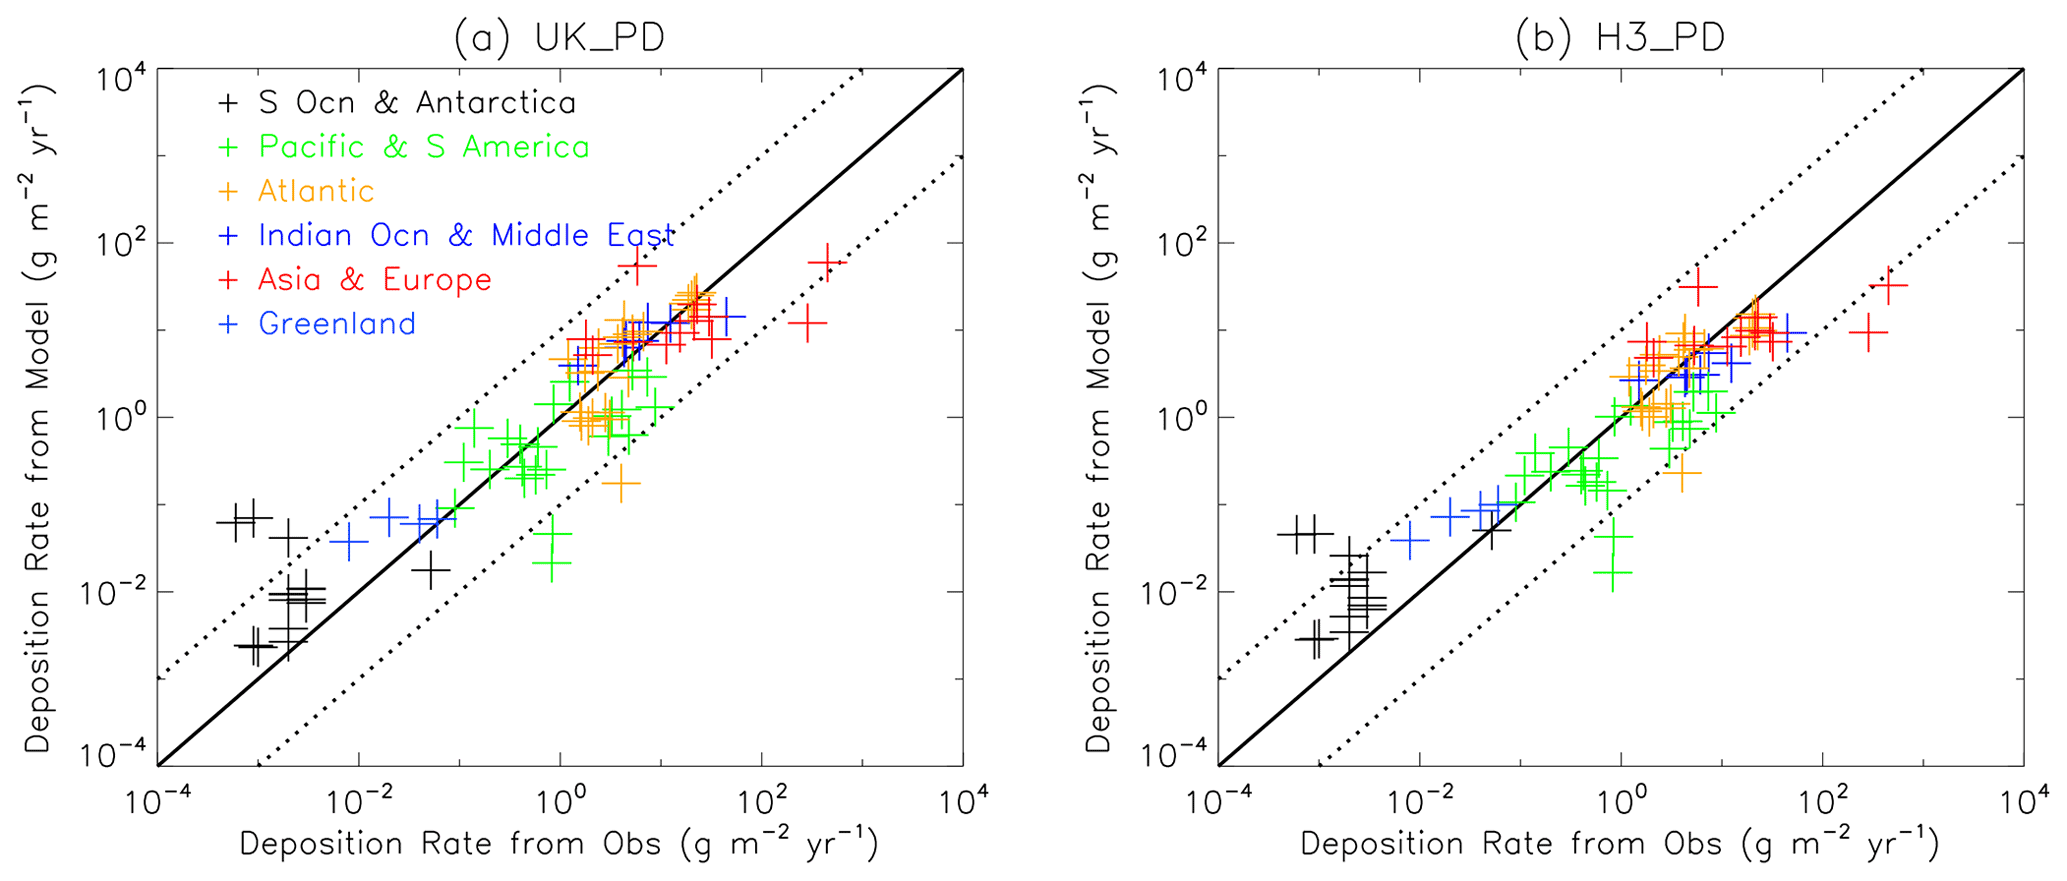
Figure 6Scatterplot of deposition rates (g m−2 yr−1) from UK_PD and H3_PD vs. observations (Huneeus et al., 2011).
A scatterplot of UK_PD mean deposition rates against these observations (Fig. 6) shows that the model agrees reasonably well with the observations, and model results are within a factor of 10 of the observations at most locations. The only area with a noticeable bias is in Antarctica and the Southern Ocean. The four Antarctic stations where the model significantly overestimates deposition rates are very close together near the Dumont station, between 64.60–64.97∘ S and 141.07–141.45∘ E. This localised bias may be due to overestimated wind speed or to the underestimated sea ice cover which has been observed in UKESM1 (Sellar et al., 2019). Where sea ice is lacking, roughness is increased and aerodynamic resistance reduced, leading to increased deposition velocity (Woodward, 2001). Superficially, the results appear broadly comparable to those of the AeroCom models reported in Huneeus et al. (2011), though those data represent the output of models run for a single year, in most cases with winds derived from reanalyses. UKESM1 deposition rates also compare well to those of other ESMs in the CRESCENDO project, as recorded by Checa-Garcia et al. (2021).
5.5 Radiative effects
Figure 7 and Table 2 show the dust direct radiative effect (DRE), which is the change in flux directly due to the presence of dust, excluding any secondary effects. This is calculated using the “double call” method, as described in Sect. 4.
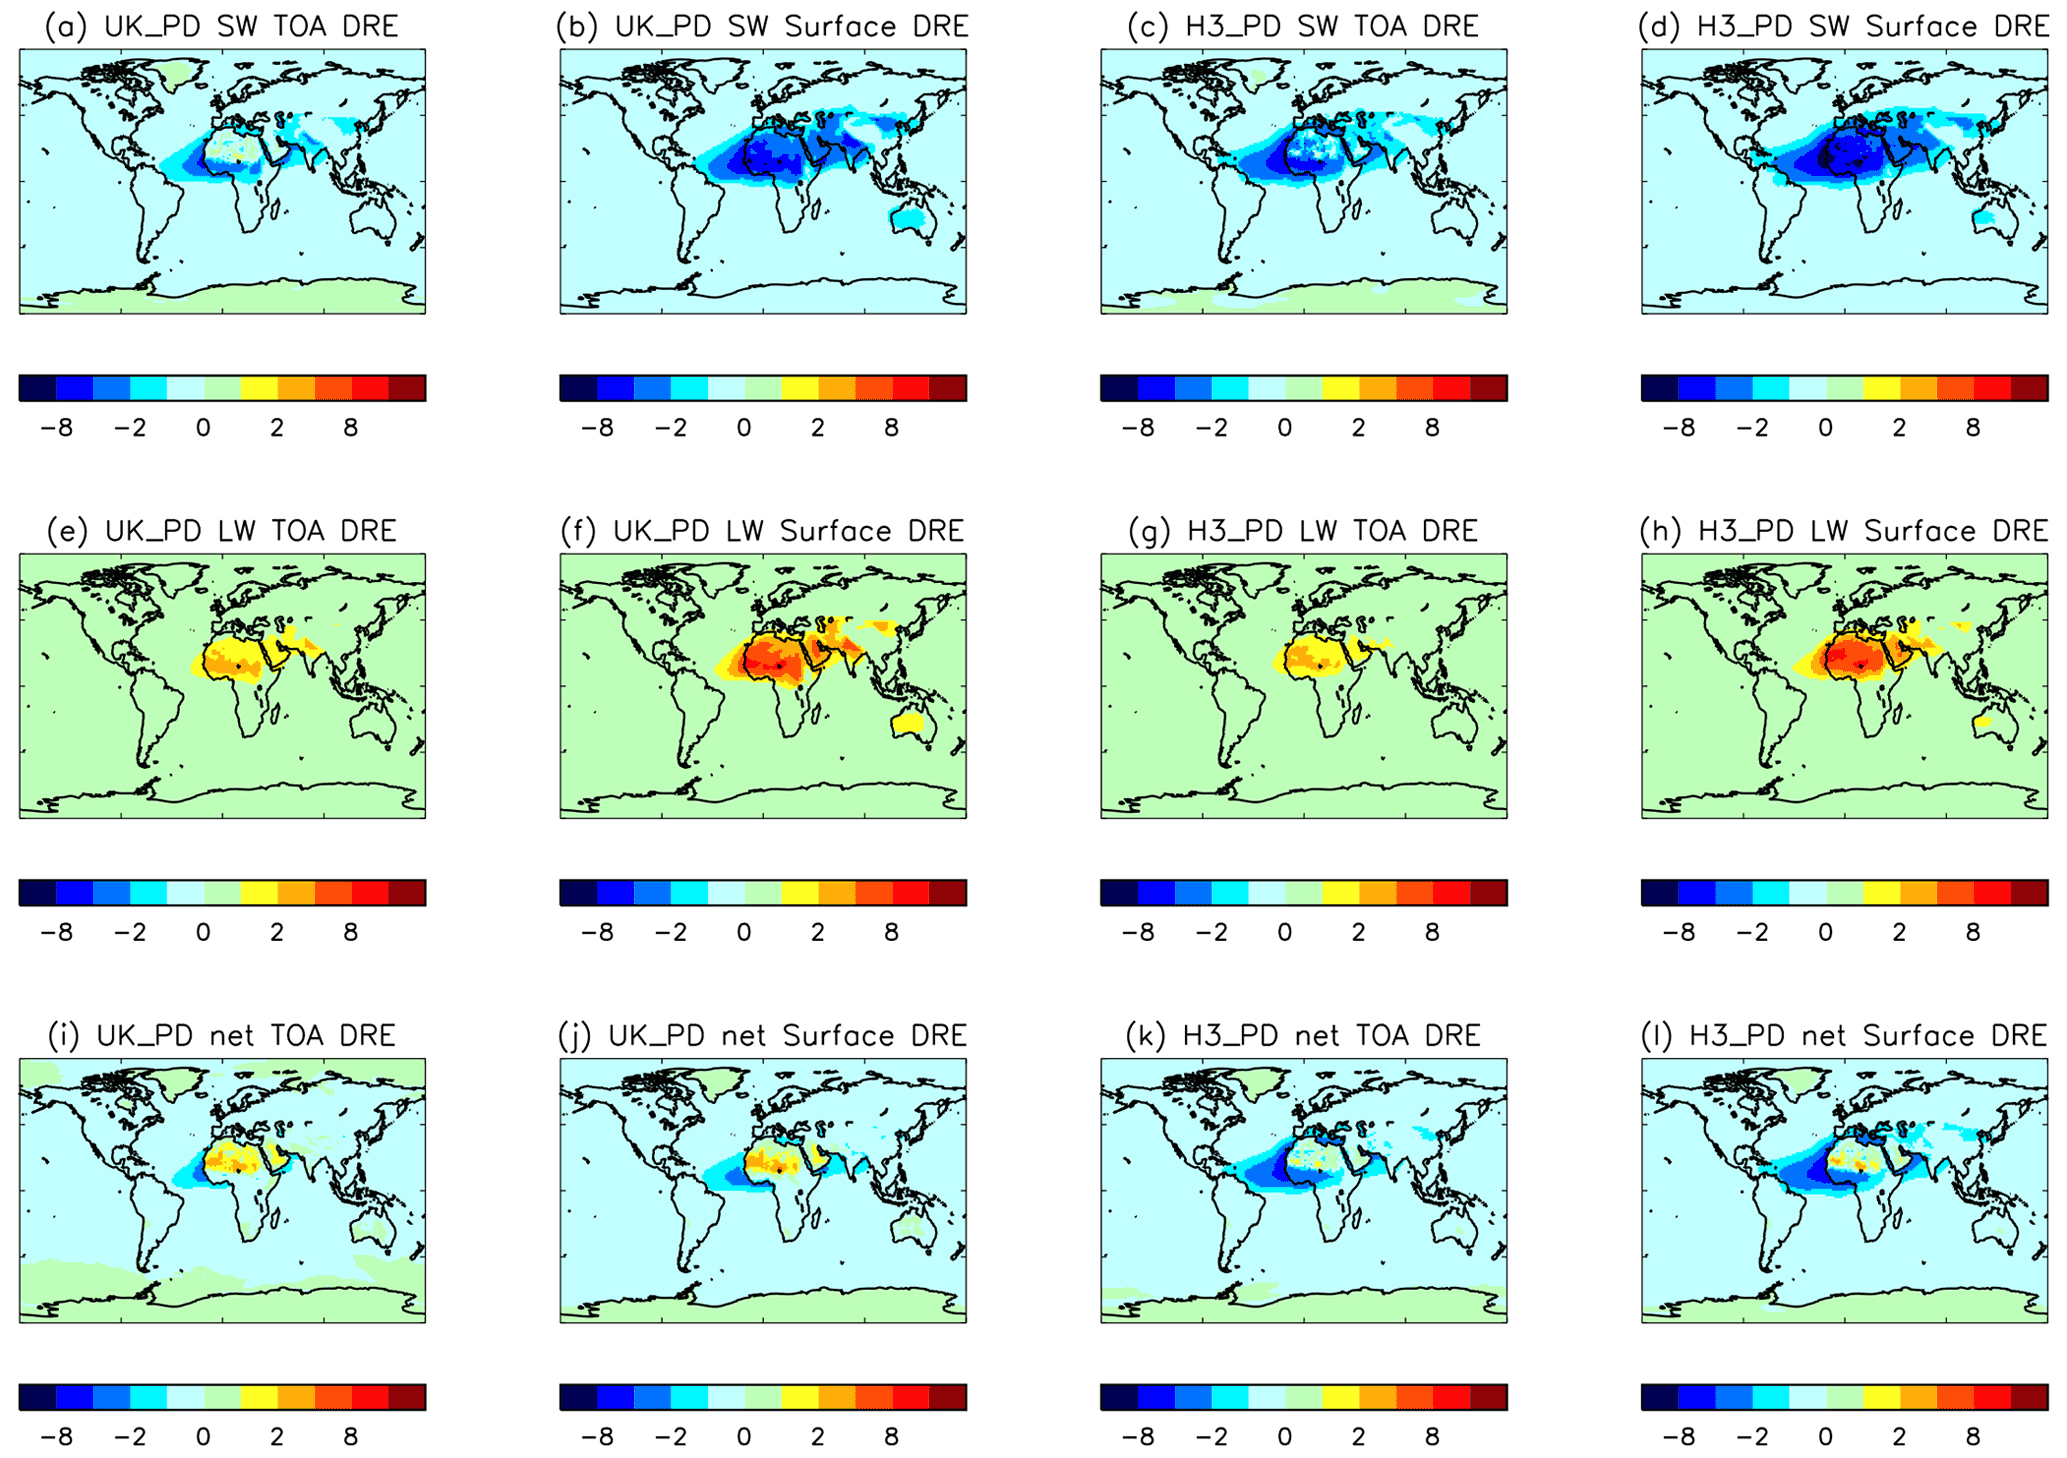
Figure 7Dust direct radiative effects (W m−2) in UK_PD and H3_PD.
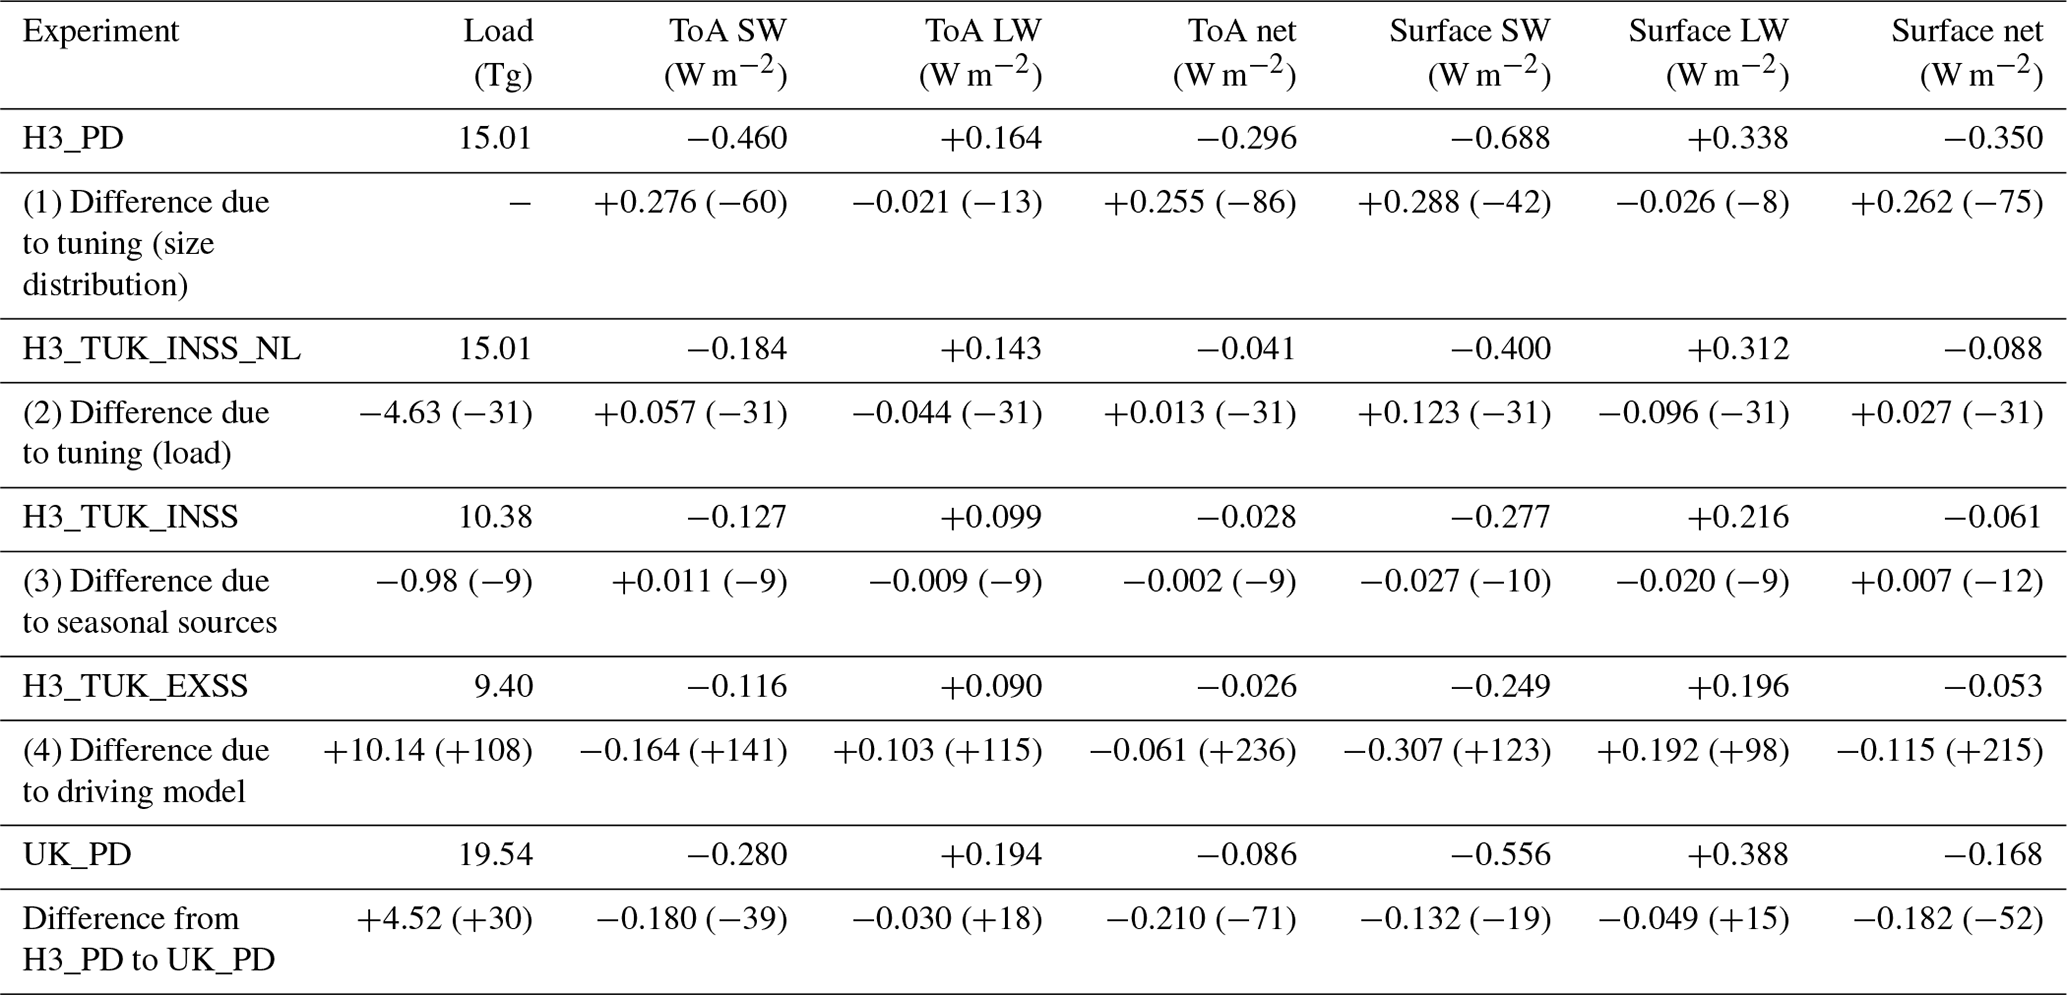
Table 2Global mean load and all-sky direct radiative effects, due to dust in a present-day climate, from various experiments. Alternate rows show experimental results and the absolute differences, followed by percentage differences (in parentheses) between the experiment below and the experiment above.
In UKESM1 dust is generally more reflective than the surface in the shortwave (SW), except over ice and the brightest deserts, with the result that the net downward shortwave at the top of the atmosphere (ToA) is reduced everywhere but over these very light surfaces. The global mean ToA SW dust DRE is −0.280 W m−2 and −0.410 W m−2 in the clear sky (CS). The ToA longwave (LW) DRE is positive everywhere, with higher values over areas of higher load, particularly the Sahara. It has a global mean of 0.194 W m−2 (0.237 W m−2 CS). SW and LW combine to give a positive net DRE over the Sahara, with a maximum of 3.71 W m−2, but partially cancel in most other regions to produce modest positive net values over lighter surfaces and negative net values elsewhere down to −3.05 W m−2 in the Atlantic under the Saharan plume, giving a global mean of only −0.086 W m−2. At the surface the global mean net DRE is −0.168 W m−2, being positive over the brightest surfaces and negative elsewhere, with a maximum of 4.45 W m−2 in the Sahara and a minimum of −3.19 W m−2 under the Saharan plume. The surface SW DRE is negative everywhere and has a global mean of −0.556 W m−2 (−0.679 W m−2 CS); the LW is positive everywhere, with a global mean of 0.388 W m−2 (0.455 W m−2 CS).
In HaGEM3-GC3.1 the global mean net DRE at ToA is −0.269 W m−2, varying between −7.18 and 1.90 W m−2. At the surface the mean is −0.350 W m−2, with a range from −5.75 to 2.88 W m−2. The larger shortwave and smaller longwave effect are associated with the difference in size distribution between the UK_PD and H3_PD simulations, as will be explored in Sect. 5.6.
The relatively small global mean net DREs are the residuals of the partial cancellation of areas of larger positive and negative net DREs, in addition to the partial cancellation of component DREs of different sign, each of which are sensitive to changes in the dust load, spatial distribution, size distribution and radiative properties. As a result, there are large uncertainties associated with estimates of global mean dust DREs.
5.6 Drivers of UKESM1–HadGEM3-GC3.1 differences
Running simulations with almost identical dust schemes in two similar models allows us to explore the impacts of a number of factors on the dust simulation. The causes of the differences between the HadGEM3-GC3.1 and UKESM1 present-day dust load and DREs may be divided into the following four groups: (1) the change in size distribution with retuning, (2) the change in total load due to retuning, (3) the (de-)activation of seasonal sources and (4) the change in driving model. These are investigated using results from H3_PD, UK_PD and two additional experiments representing intermediate configurations. H3_TUK_EXSS is a HadGEM3-GC3.1 experiment with UKESM1 dust tuning and excluding seasonal sources. Comparison of this with UK_PD helps to isolate the effects of the change in model. H3_TUK_INSS is parallel to this but includes seasonal sources to allow investigation of the effect of these sources (see Table 1). Another set of dust DRE results H3_TUK_INSS_NL has been generated by normalising the DREs from H3_TUK_INSS by the ratio of H3_PD load to H3_TUK_INSS load. This allows us to separate the effects of the change in size distribution (from comparing H3_TUK_INSS_NL and H3_PD) from the effects of the load change (from comparing H3_TUK_INSS_NL and H3_TUK_INSS). Global mean volume size distributions from UK_PD, H3_PD and H3_TUK_INSS_NL are shown in Fig. 3c. The implicit assumption that the DREs are proportional to total load for a given size distribution is a reasonable first approximation, although it ignores the feedback between dust DREs and emissions (Miller et al., 2004; Woodage and Woodward, 2014; Kok et al., 2018). Load and DREs from each experiment, together with the differences due to each factor, are listed in Table 2.
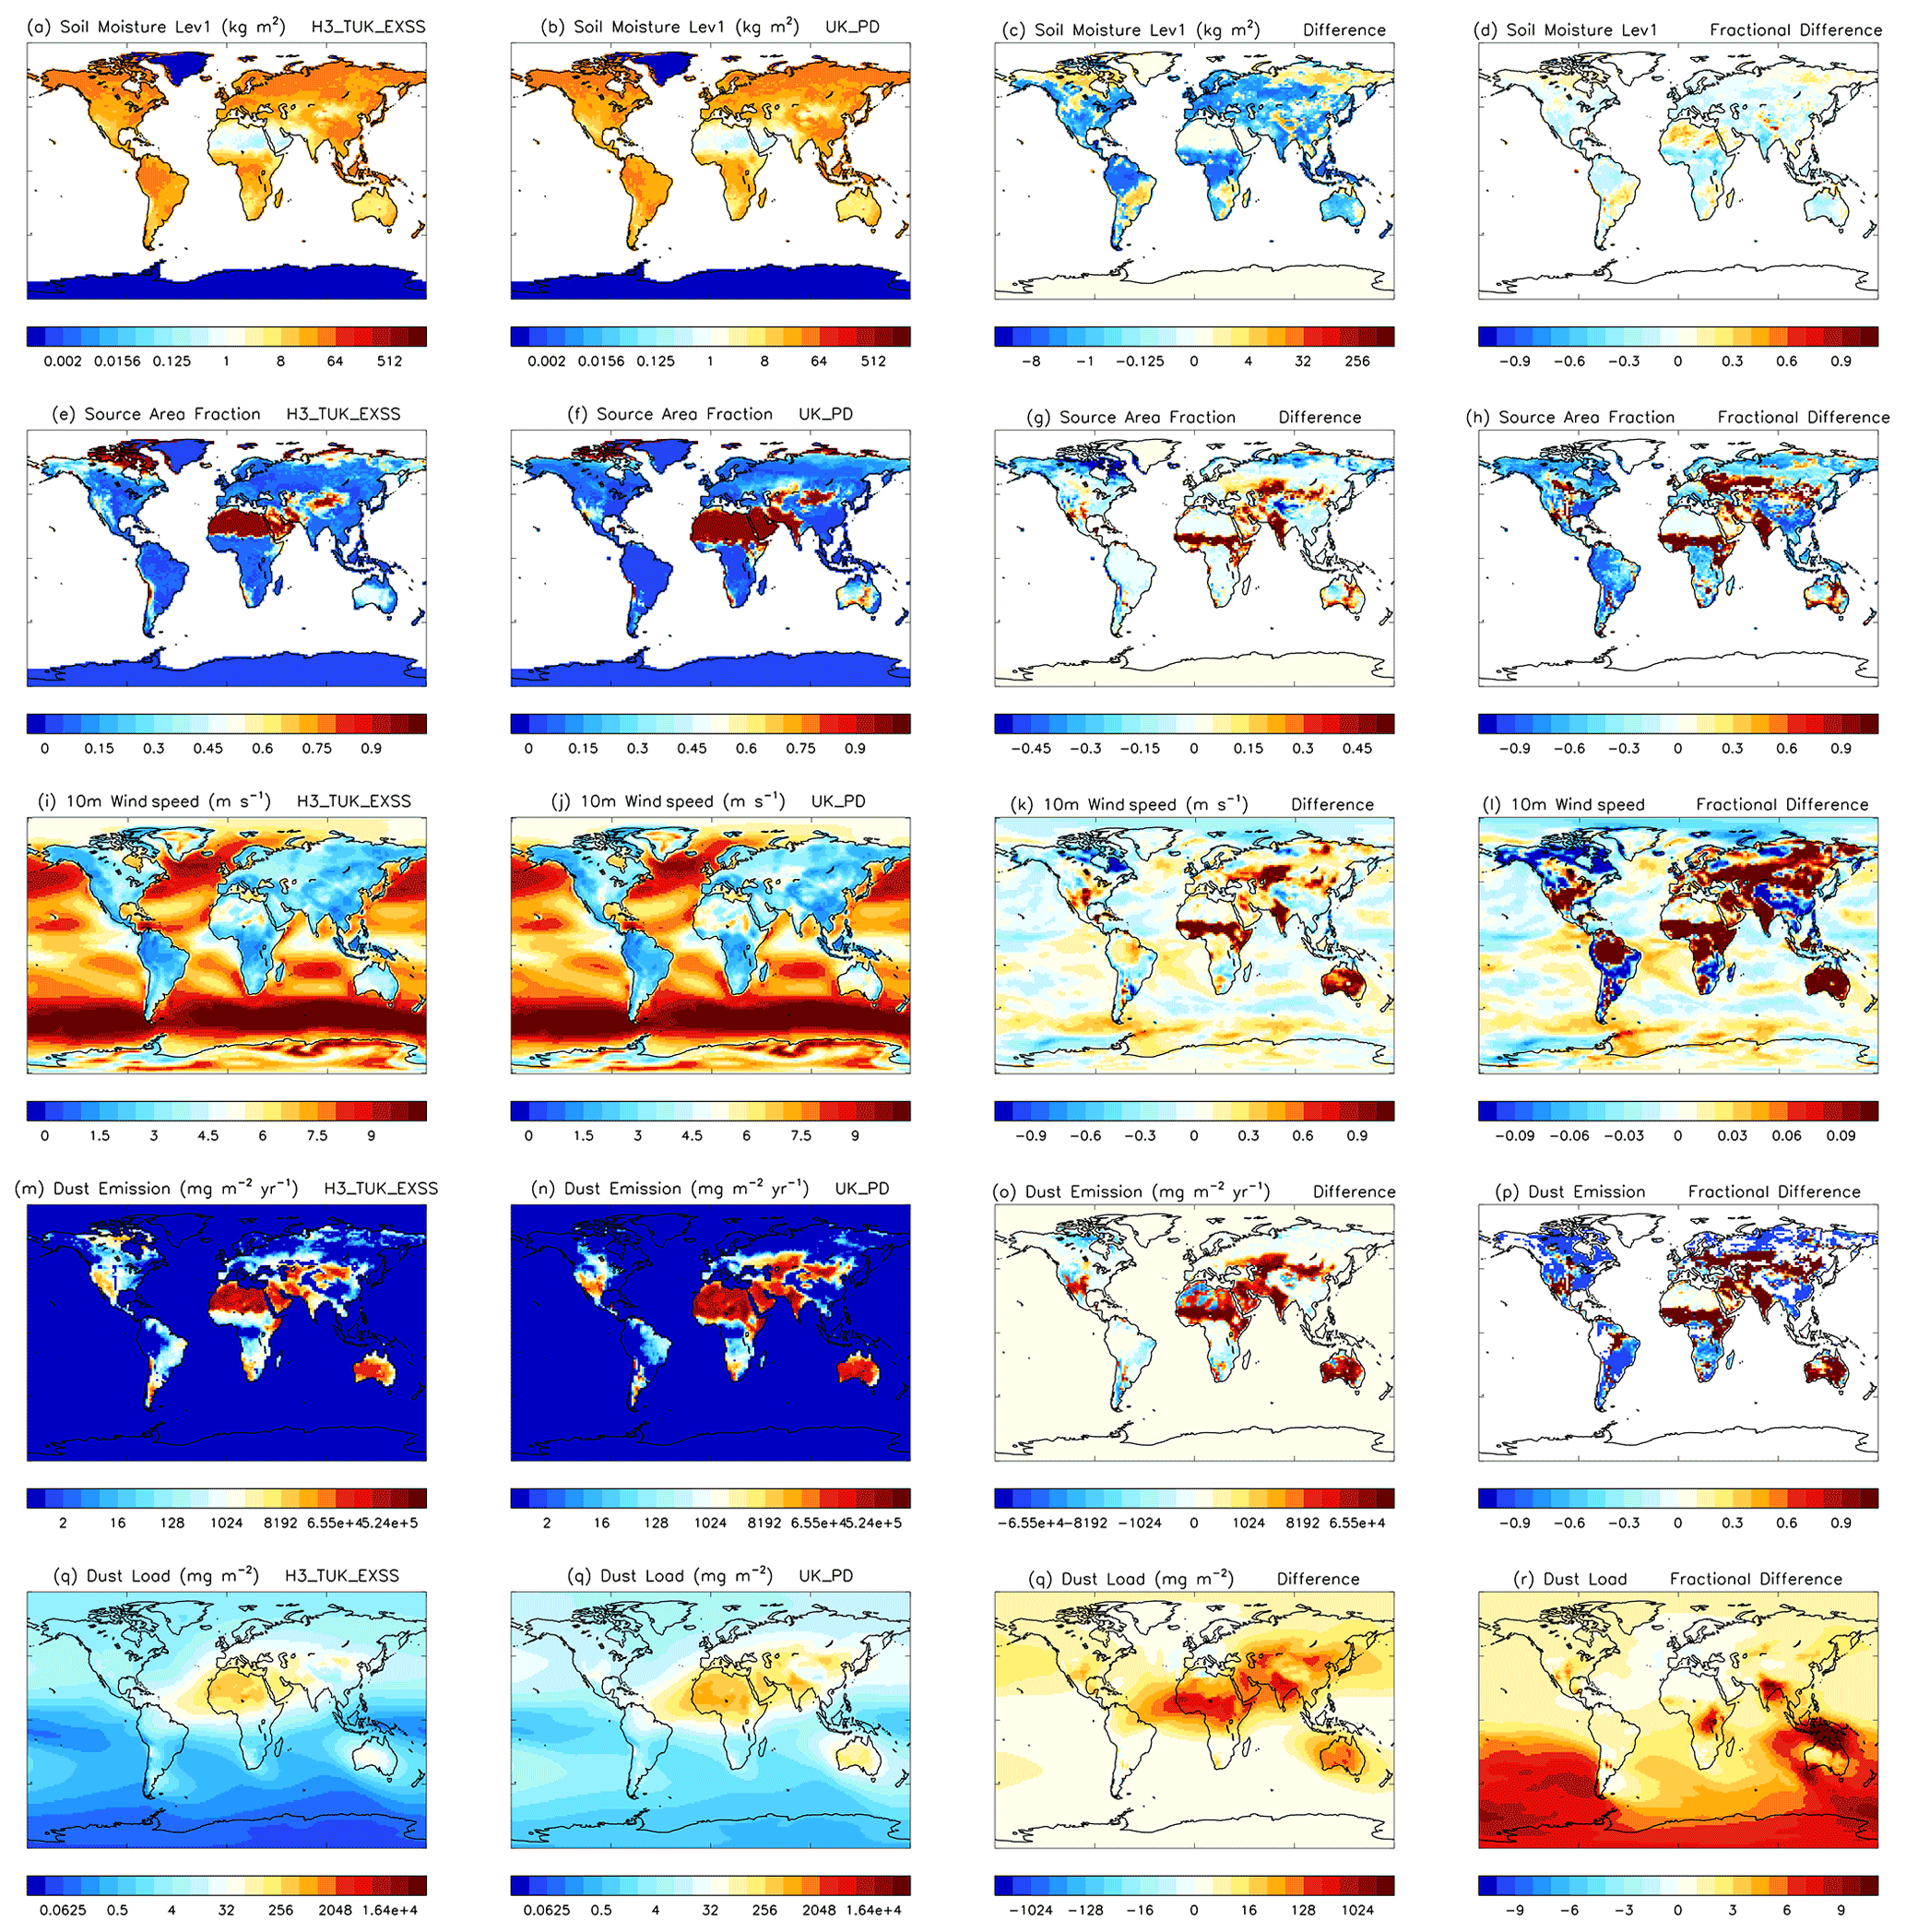
Figure 8Soil moisture in the top model layer, dust source area fraction, 10 m wind speed, dust emission diagnostic and dust load from H3_TUK_EXSS and UK_PD and the differences and fractional differences between experiments.
Overall, the changes from H3_PD to UK_PD result in an increase in total load of 30 %. The load change due to retuning (factor 2) is responsible for a reduction of 31 %, while the disabling of seasonal sources (factor 3) only decreases global load by a further 9 %. The change in driving model (factor 4) more than doubles the load and produces much the largest individual impact on the atmospheric burden. The most important element in this change is the vegetation. The disparity between the bare soil simulated by TRIFFID in UKESM1 and the IGBP climatology used in HadGEM3-GC3.1 accounts for 70 % of the extra emissions in UK_PD compared with H3_TUK_EXSS. The global average bare soil fraction is 0.26 in UK_PD and 0.24 in H3_UK_EXSS, but regional variations are much larger, and their geographic distribution promotes extra dust production in UK_PD. The 29 % of the UK_PD bare soil area that is vegetated in H3_TUK_EXSS is mostly in arid areas at the margins of existing deserts where conditions favour dust emission, while the 25 % of the H3_TUK_EXSS bare soil area that is vegetated in UK_PD is mainly in regions where moisture limits dust emission (Fig. 8g). Areas where there is less vegetation, and thus reduced roughness, might be expected to be associated with higher near-surface wind speed and hence increased evaporation and reduced soil moisture, providing conditions particularly favourable to dust production. This can be seen in the regions of greatest difference between UK_PD and H3_TUK_EXSS such as the Sahel, India and the Kazakh Steppe (Fig. 8g, d, k and o).
Global mean dust net DREs in UKESM1 are smaller than in HadGEM3_GC3.1, despite the larger load (Table 2, Fig. 7). The net surface DRE of −0.168 W m−2 is about half the H3_PD value of −0.350 W m−2, and the −0.086 W m−2 net ToA DRE is less than one-third of the H3_PD value of −0.296 W m−2. These global means are the residuals of the partial cancellation of SW and LW DREs and also of spatial meaning of areas of net DRE with different signs. Change in size distribution consequent on retuning (factor 1) is the factor responsible for the greatest absolute change in the net DREs, due to its large impact in the SW not being balanced by its much smaller LW effect. SW DREs are approximately halved in response to this size distribution change, mainly because of a reduction in the number of finer particles in bin 2 (0.2–0.63 µm), which have a strong SW effect. In contrast, LW DREs are only reduced by about 10 %, chiefly because the alteration in the number of coarser particles is relatively small. In particular, the global number of bin 4 particles (2.0–6.3 µm), which dominate the LW effect, is almost unaltered, with increases in the Saharan plume and northern mid-latitudes balanced by reductions elsewhere, while the numbers of particles in bins 5 and 6 (6.3–63 µm), which are somewhat less radiatively active, are not greatly increased.
6.1 Preindustrial to present-day changes
The global mean preindustrial to present-day dust forcing (defined here as the change in DRE) is small in both models. It is calculated as the difference between dust DREs in the 20-year mean UK_PD (and H3_PD) runs and a 20-year mean from the respective PI control runs. UKESM1 (HadGEM3-GC3.1) simulates a forcing of +0.007 W m−2 (−0.029 W m−2) at ToA and +0.005 W m−2 (−0.038 W m−2) at the surface from a change in dust load of −0.10 Tg (+1.40 Tg).
The role of the vegetation response in the historical dust changes is investigated using the results of atmosphere-only AMIP experiments in which the driving fields, except vegetation, were taken from a UKESM1 preindustrial simulation. In the control experiment (A_UK_PI), the vegetation fields – LAI, canopy height and vegetation fraction – were also taken from the preindustrial simulation; in the parallel A_UK_PI_V2014NOLU experiment, the 2014 vegetation values from a UKESM1 historical experiment which excluded anthropogenic land use changes were used. In both experiments, the dust settings were as in UKESM1. The difference between these simulations gives an estimate of the effect of the change in vegetation alone on dust. The effect of climate change excluding the vegetation response (but including land use change) is estimated from the difference between HadGEM3-GC3.1 simulations H3_PD and H3_PI.
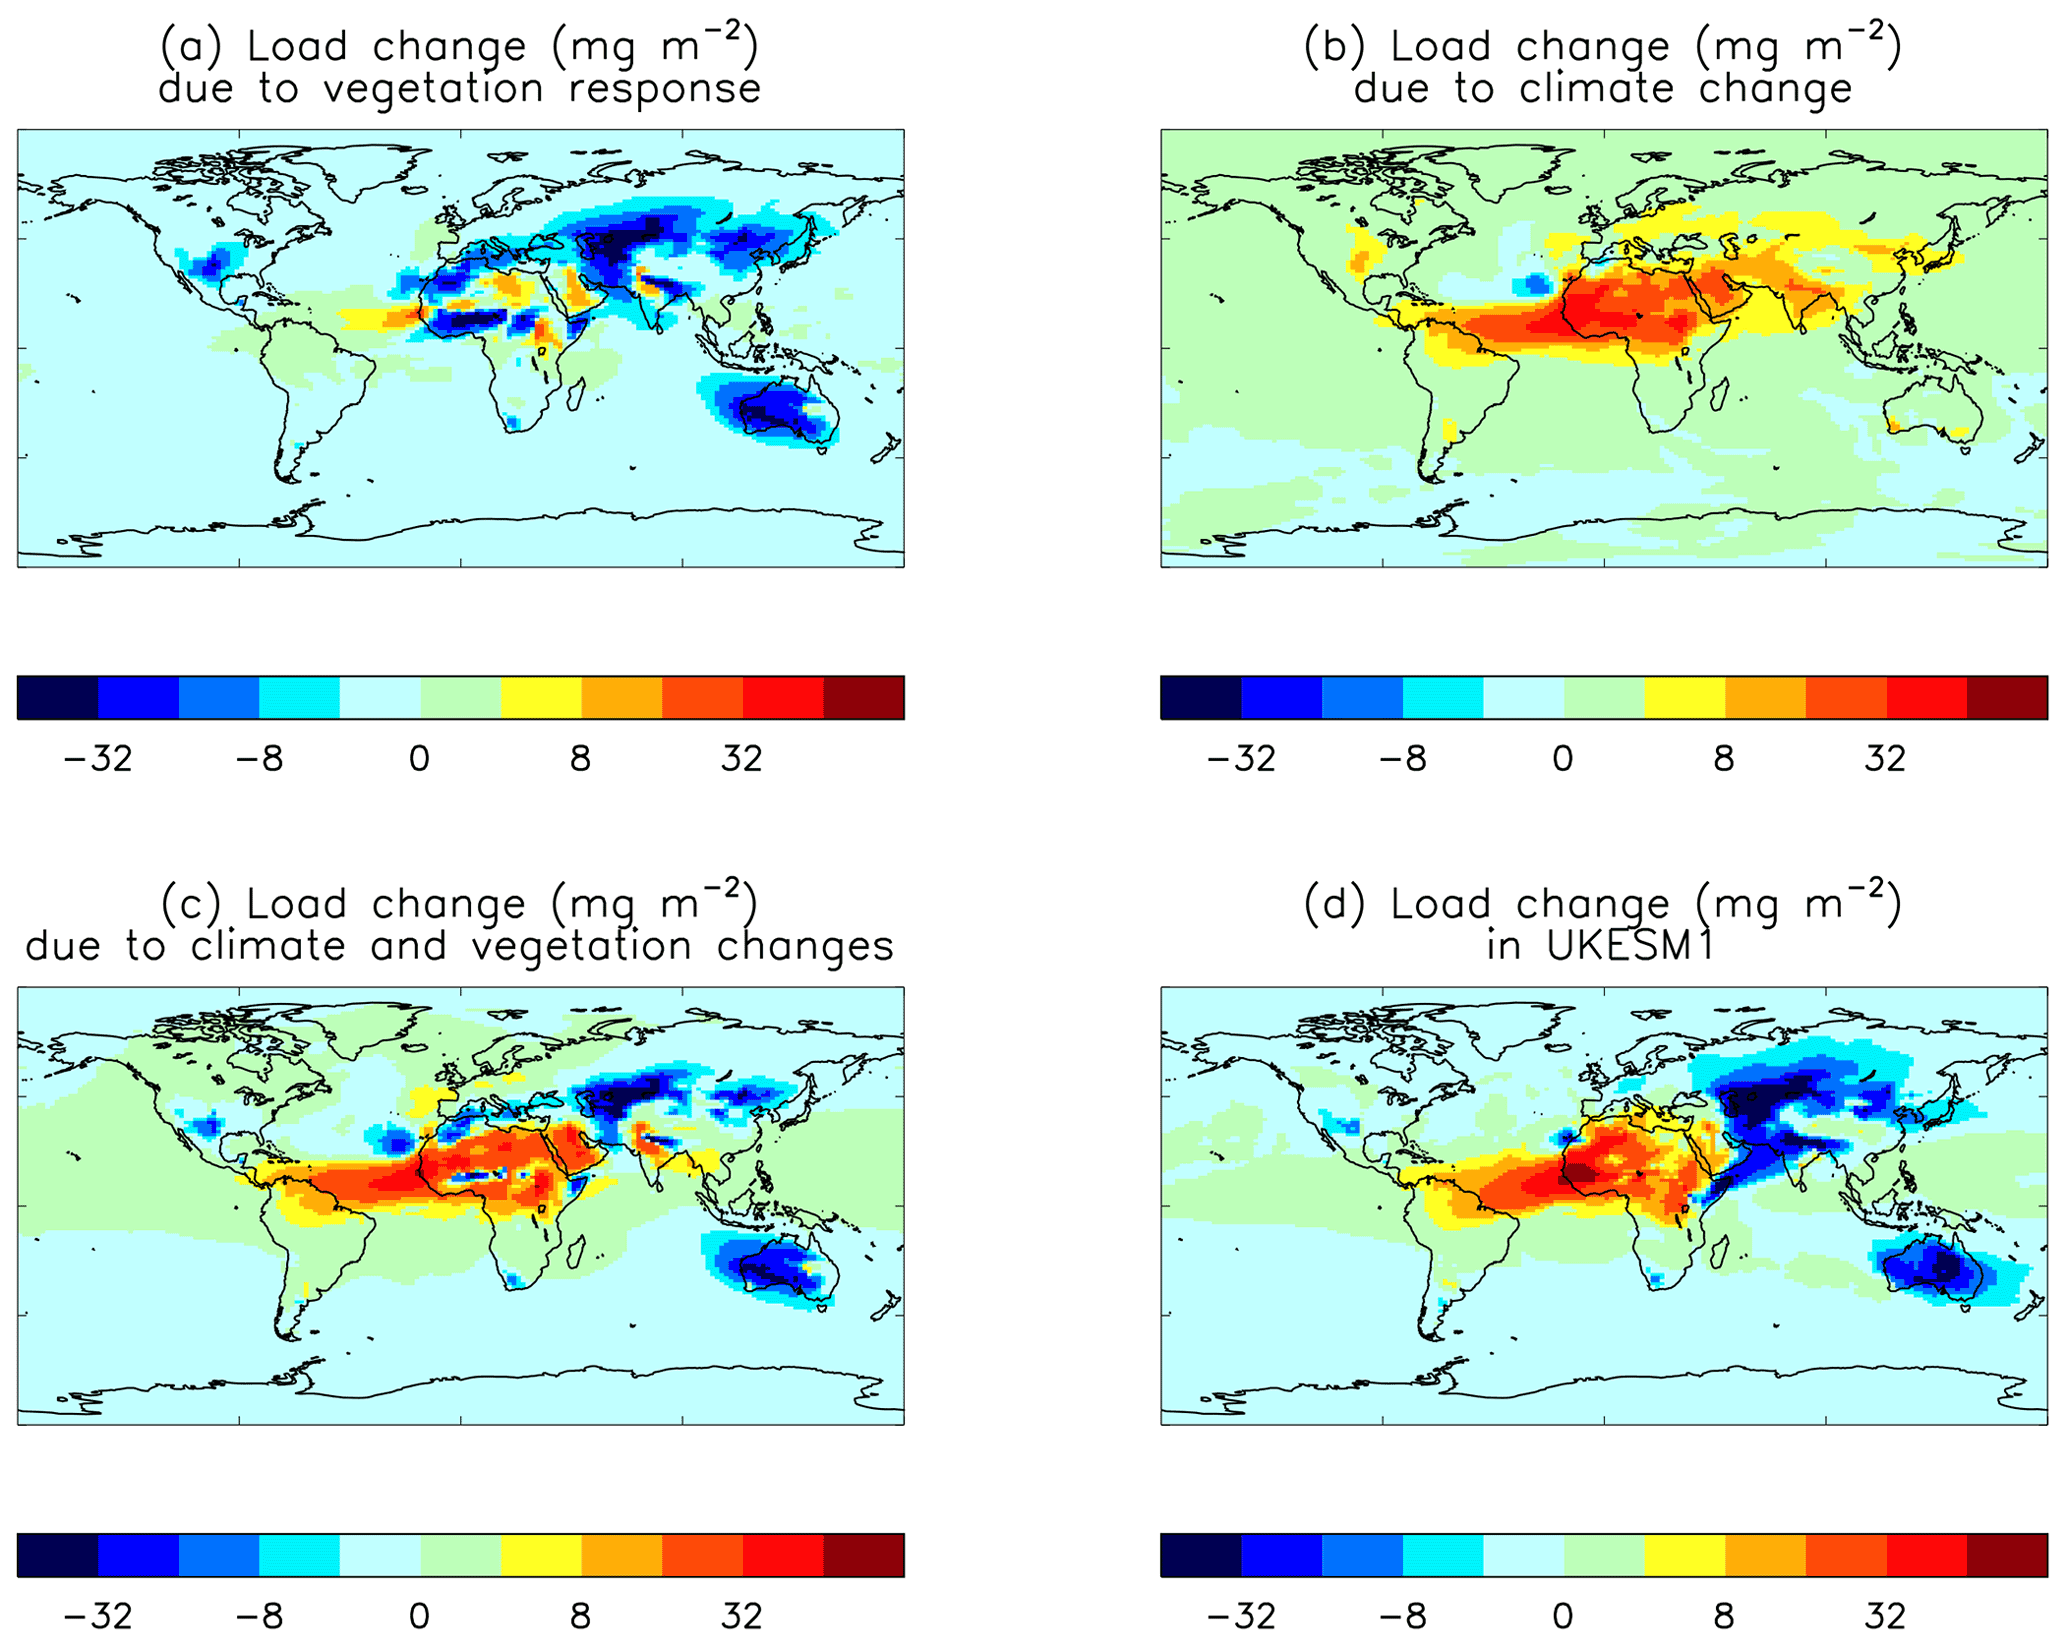
Figure 9Difference in dust load (mg m−2) from the preindustrial to the present day due to changes in vegetation (from A_UK_PI_V2014 − A_UK_PI), due to changes in climate and land use (from H3_PD − H3_PI), the sum of these two (A_UK_PI_V2014 − A_UK_PI) + (H3_PD − H3_PI) and in the full Earth system model (from UK_PD − UK_PI).
Figure 9 shows the differences in dust load, due to vegetation response and to climate estimated in this way, together with the sum of these two changes, and the equivalent change in UKESM1 from the preindustrial UK_PI to the present-day UK_PD. The similarities between the patterns of load change due to the combined vegetation and climate changes and due to the changes in UKESM1 is notable, giving confidence that dust changes simulated by the models are comparable even though the present-day dust is somewhat different. From these experiments the global totals of the PD to PI differences in dust load are −1.04 Tg due to the vegetation response, +1.40 Tg due to climate (and land use) change and −0.10 Tg due to other model differences, including the impact of the extra ESM processes and feedback included in UKESM1. The difference between the UKESM1 PI to PD changes and the sum of the vegetation and climate-driven changes is caused by a combination of the interactions of Earth system processes, the differences between the dust settings in HadGEM3-GC3.1 and UKESM1 and the natural variability in dust. In our models, the impact of the vegetation response on dust was comparable in magnitude, but opposite in sign, to the direct impact of climate change over the historical period.
6.2 Present-day to future changes
The dust changes due to possible future changes in climate are explored using a set of scenario experiments representing future Shared Socioeconomic Pathways (Sellar et al., 2020; Riahi et al., 2017). Means of the last 20 years (2081–2100) of SSP5–8.5 and SSP2–4.5 experiments UK_S5, H3_S5, UK_S2 and H3_S2 are compared with the present-day (1995–2014) period of the historical experiments UK_PD and H3_PD. The Shared Socioeconomic Pathway SSP5–8.5 represents high-end projections of fossil fuel and energy use, food demand and greenhouse gas emissions, assuming fossil-fuelled development; it has a radiative forcing pathway similar to the highest Representative Concentration Pathway, RCP8.5 (Moss et al., 2010; van Vuuren et al., 2011). SSP2–4.5 represents a middle-of-the-road future, with social, economic and technological developments broadly following historical patterns, giving a radiative forcing pathway similar to RCP4.5. The scenario experiments are initialised from the end of the respective historical runs.
Table 3Dust source area fraction, atmospheric load and DRE from simulations of present-day and future climates. (Note that DRE diagnostics were not available for the H3_S2 and UK_S2 experiments.)
Results are summarised in Table 3 and Figs. 11 and 12. UKESM1 simulates a reduction of 23 % in the total dust load from the present day to the end of the SSP5 scenario, with the greatest reductions from the major deserts and only small areas experiencing increases (Fig. 11). In contrast, the global load in HadGEM3-GC3.1 decreases by only 4 %, with smaller local changes than in UKESM1 and reduced emissions from some deserts being almost completely balanced by increases elsewhere (Fig. 12). The equivalent results for SSP2–4.5 are reductions of 19 % for UKESM1 and 7 % for HadGEM3-GC3.1. In each model the pattern of load changes from the present to the end of SSP2–4.5 has a very similar geographical distribution to the equivalent SSP5–8.5 results. This is also true of the main drivers of dust emissions, namely soil moisture, source areas and wind speed. The slightly larger decrease in dust load in H3_S2 compared with H3_S5 is due to minor differences in the residuals from the cancellation of areas of positive and negative change. Given the similarities in the patterns of change in dust and its drivers in both pathways, the following analysis will focus only on the SSP5–8.5 experiments.
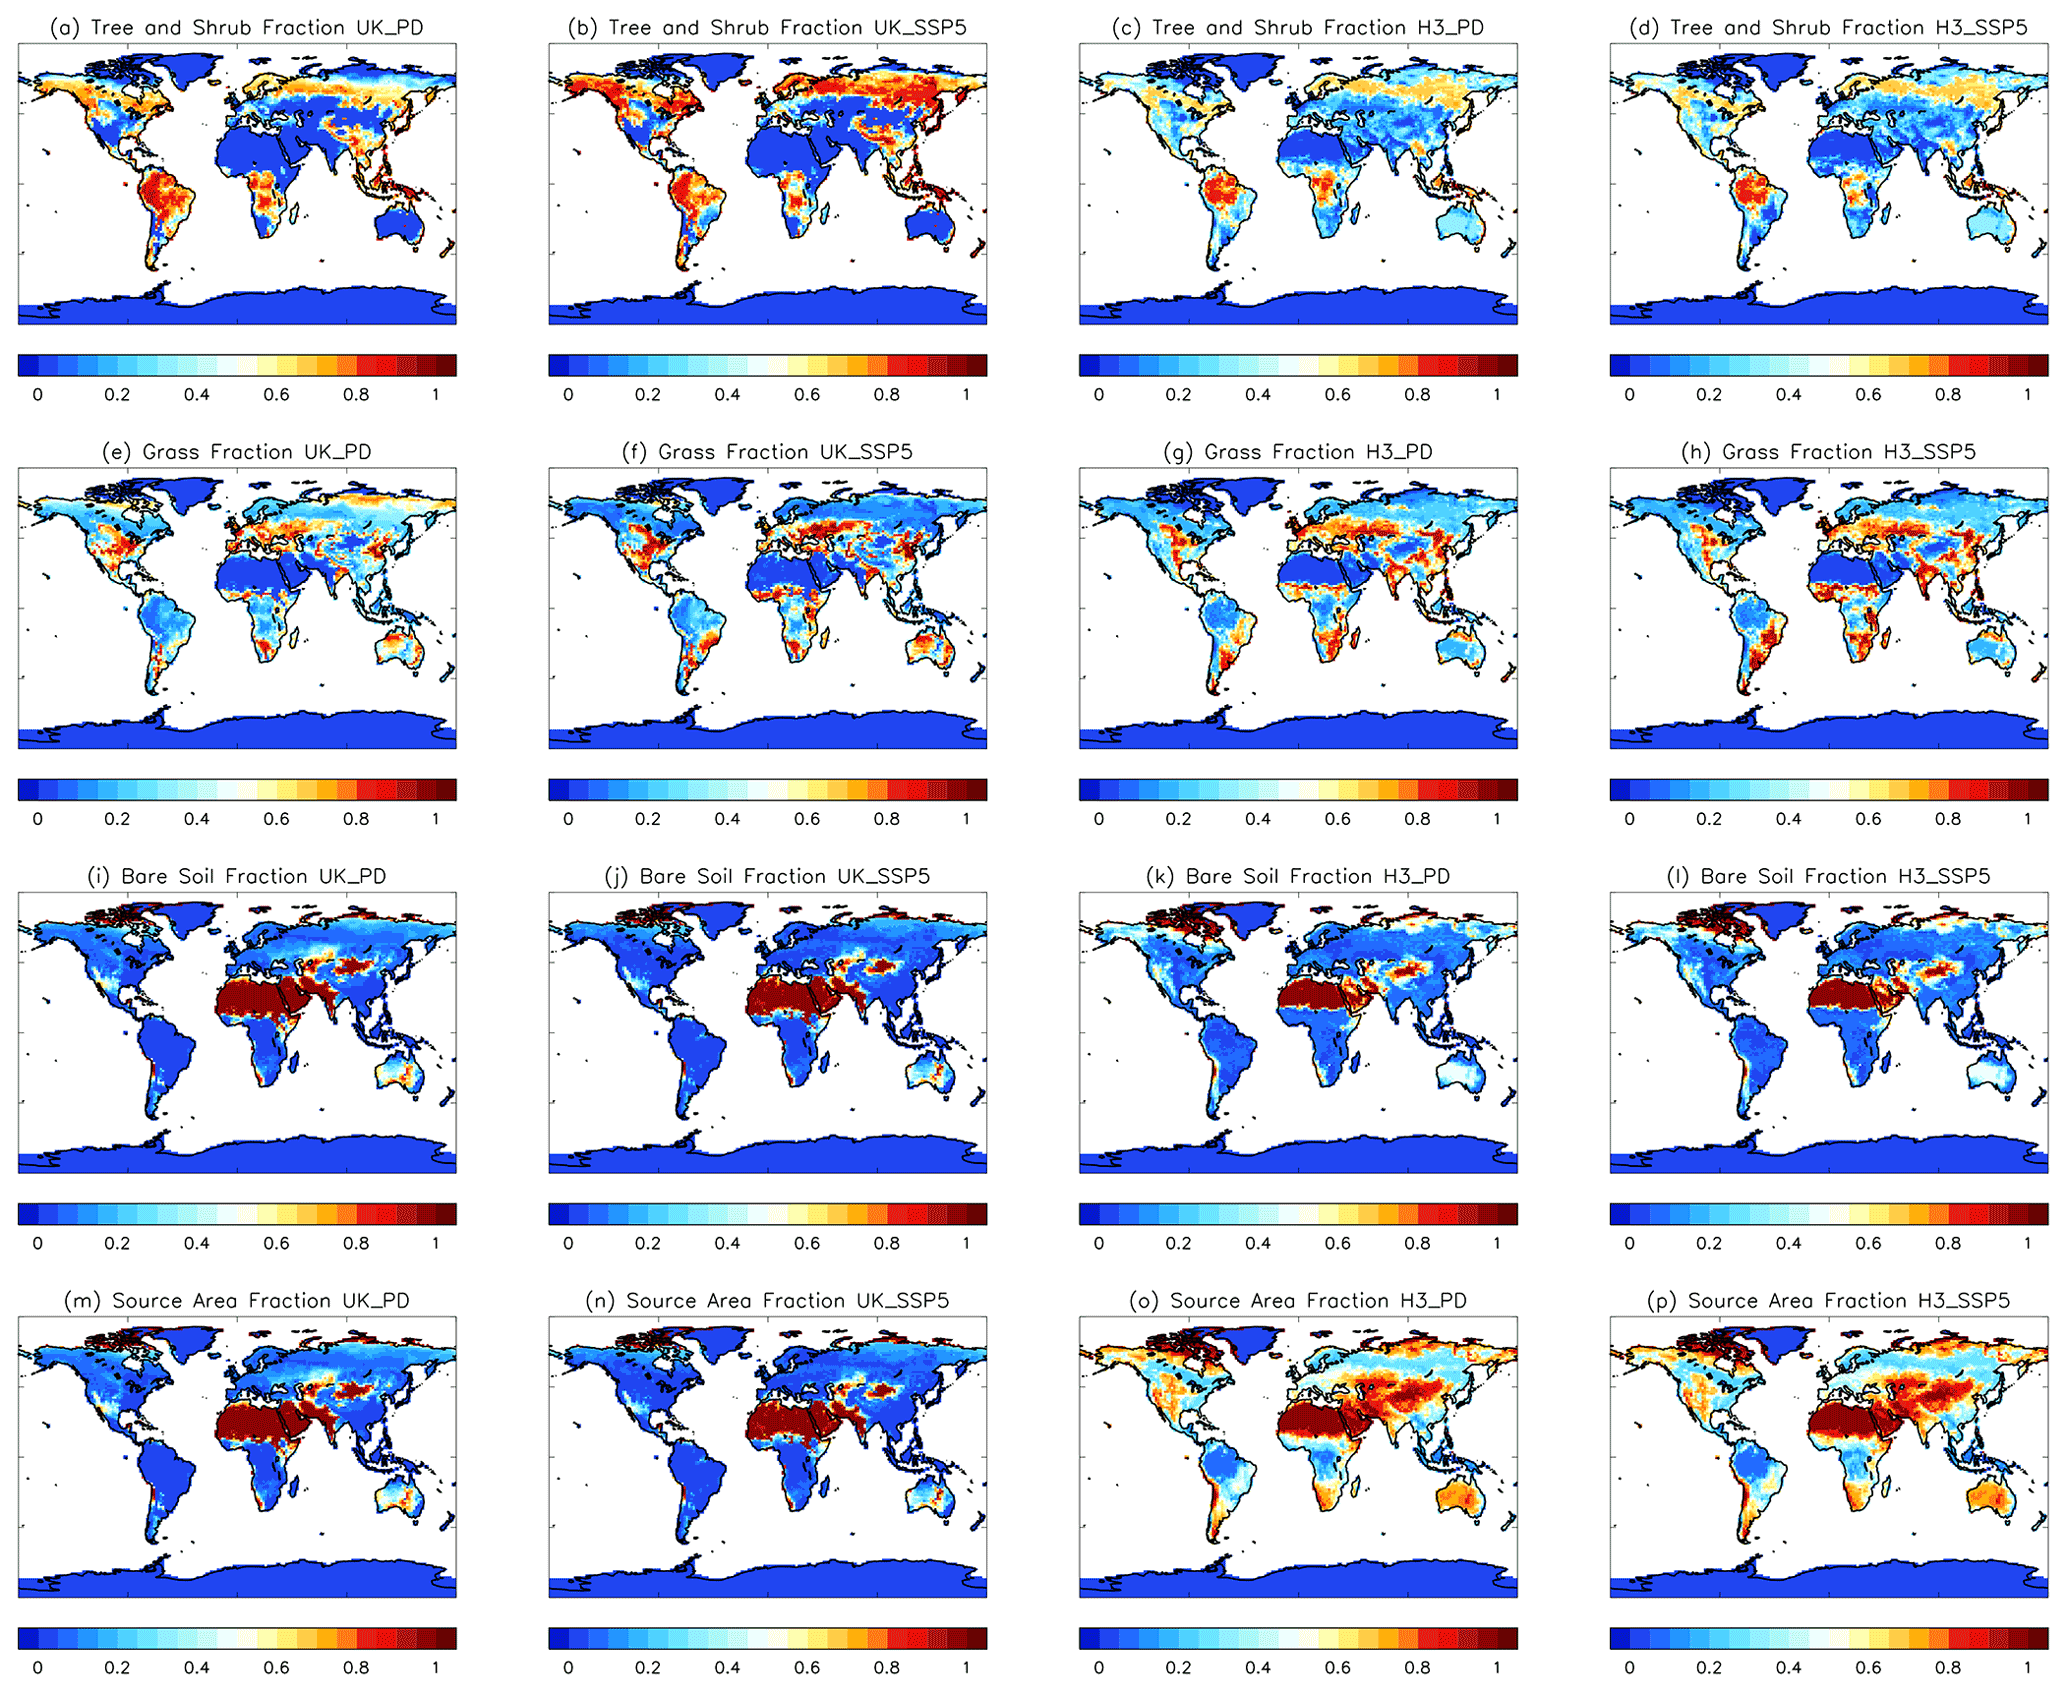
Figure 10Grass fraction, tree and shrub fraction, bare soil fraction and dust source area fraction from UK_PD, UK_SSP5, H3_PD and H3_SSP5. (The H3_PD and H3_SSP5 source areas include seasonal sources.)
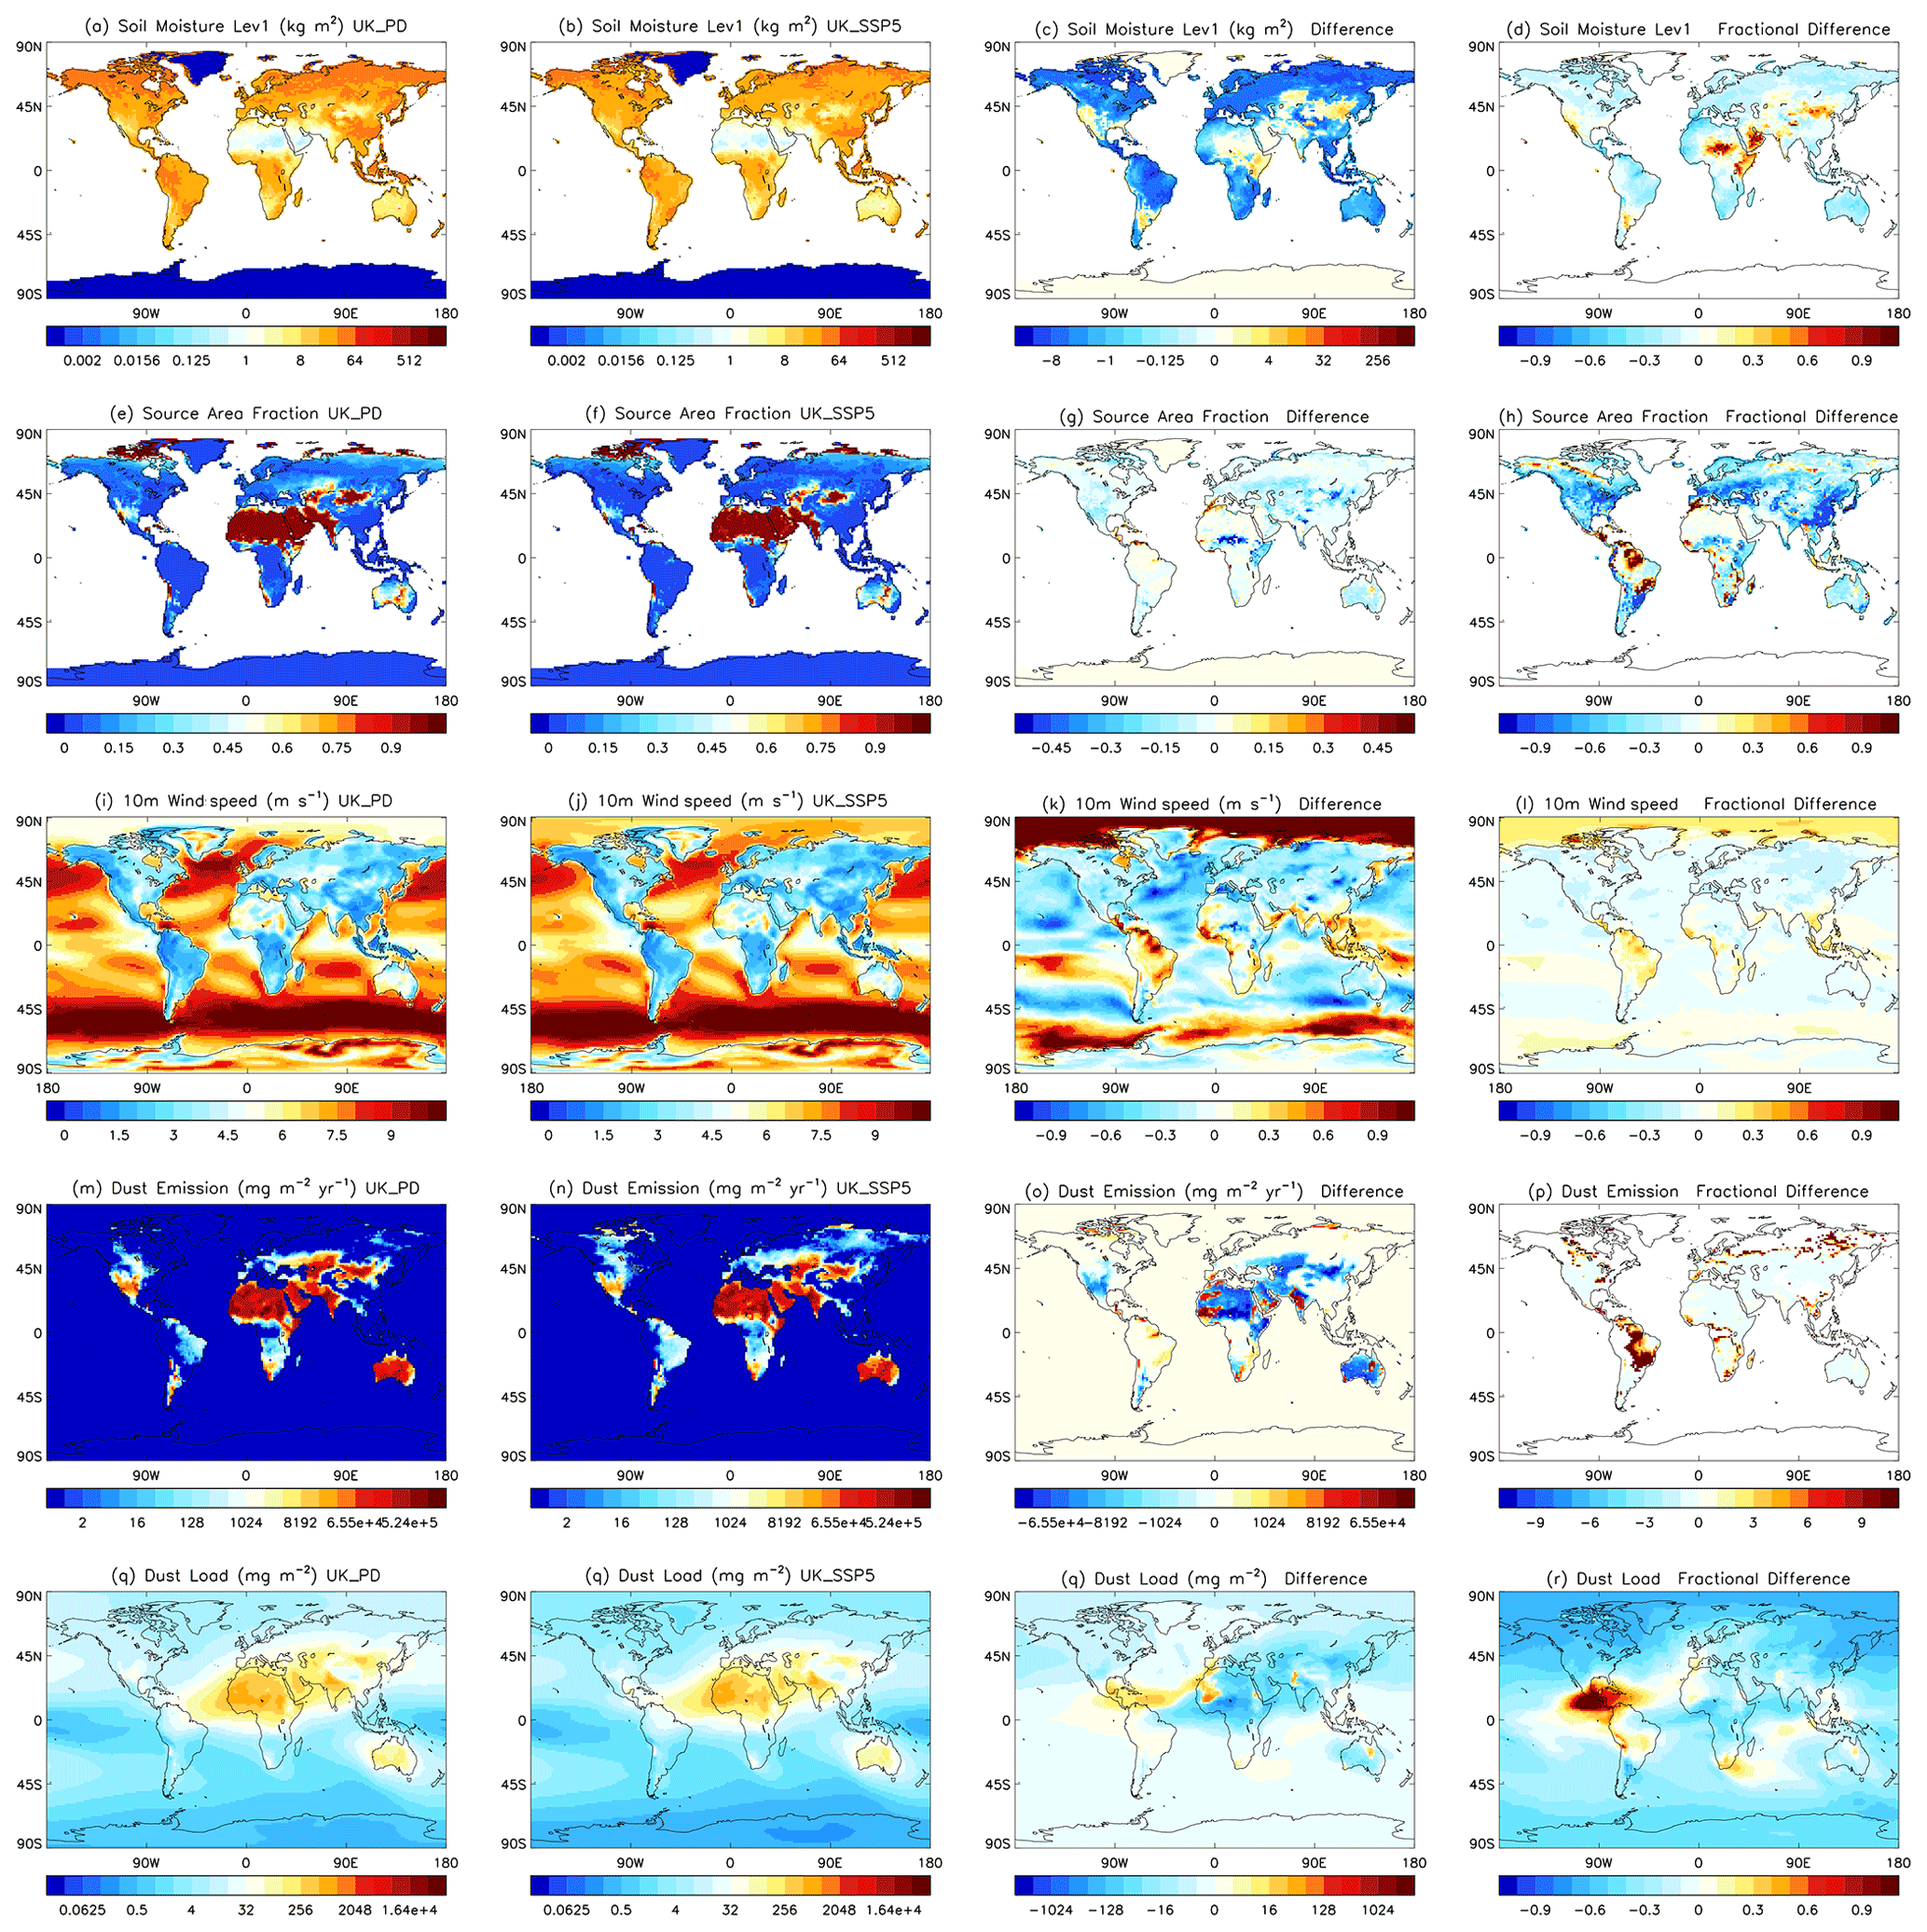
Figure 11Soil moisture in the top layer, dust source area fraction, 10 m wind speed, dust emission diagnostic and dust load from UK_PD and UK_SSP5, together with differences and fractional differences between experiments.
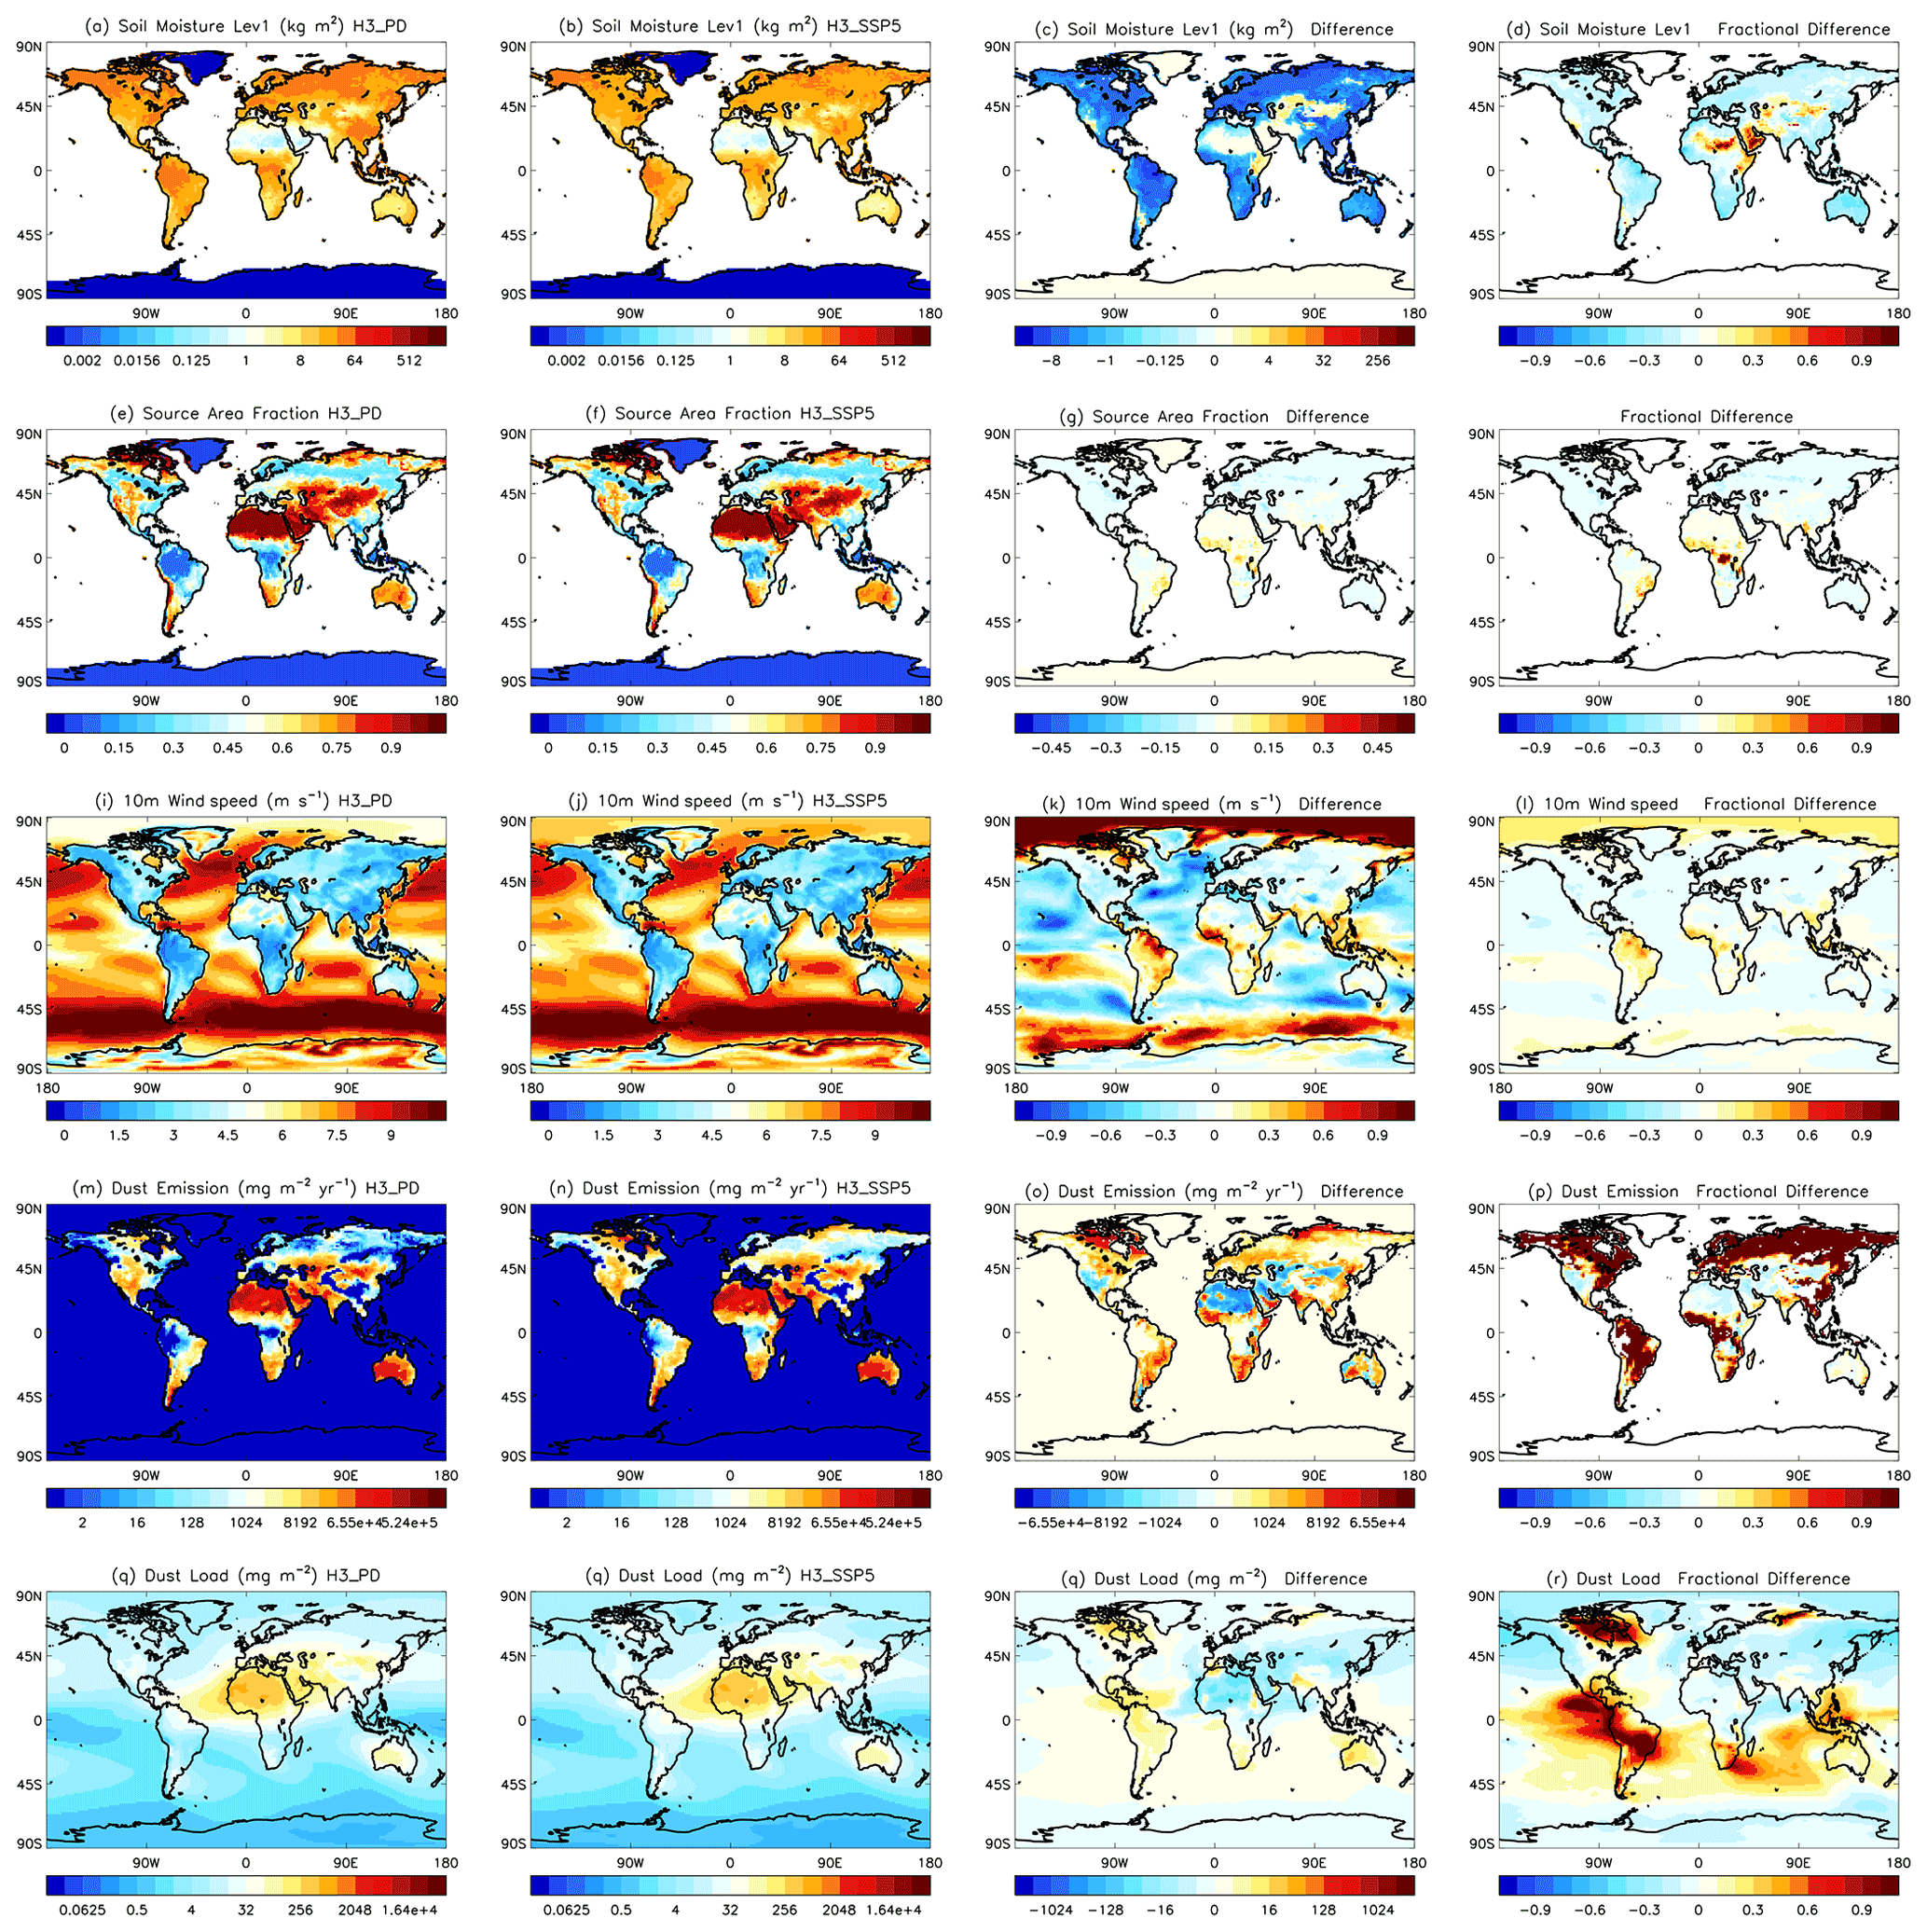
Figure 12As in Fig. 11 but for H3_PD and H3_SSP5.
Comparison of the changes in the drivers of dust emissions helps reveal the causes of the differences between the dust changes in the two models. Source area changes and associated vegetation changes are shown in Fig. 10. In UKESM1, the dynamic vegetation responds to the warming climate and enhanced CO2 by producing increased growth. Areas of bare soil are colonised by grasses, while existing grassland is taken over by shrubs and trees. Land use changes produce the opposite effect. In this case areas of trees are lost to crops (grasses), most notably in sub-Saharan Africa, though this effect is small compared to the climate-driven vegetation changes. The net result is a decrease in bare soil, particularly in mid-latitudes. HadGEM3-GC3.1 vegetation only includes the land use changes, which are represented as changes to the tree, shrub and grass plant functional types. The bare soil fraction is constant, though source areas do show systematic change as dust is produced from seasonally vegetated grass and shrub areas in that model.
Figures 11 and 12 show the changes in dust fields and the drivers of emissions, simulated by UKESM1 and HadGEM3-GC3.1 respectively. The top-level soil moisture in UKESM1 is seen to be reduced in all areas except deserts, giving a global mean loss of 12 %. A similar reduction of 15 % occurs in HadGEM3-GC3.1, suggesting that this effect is mostly a response to the changing climate, mediated by evaporation and somewhat mitigated by the reduction in bare soil fraction in the Earth system model.
In UKESM1 the lowest-level wind speed over land is reduced in northern mid- and high-latitudes, and also in Australia and southern South America, but is increased in parts of the tropics, particularly tropical South America, though not in desert regions. HadGEM3-GC3.1 exhibits similar increases in the tropics, but the mid- and high-latitude reductions are much smaller. This indicates that the tropical increases in wind speed are likely to be primarily a response to the changing climate, while the reductions likely are due to increased roughness produced by vegetation growth in the corresponding areas in UKESM1.
The increase in dust emissions at high latitudes in HadGEM3 is driven predominantly by the reduction in soil moisture and at low latitudes by the increases in wind speed, while the reduced emissions from arid areas are caused by the slightly reduced wind speeds and moister soil in those regions. These processes also occur in UKESM1, but the vegetation-driven loss of bare soil and larger reduction in wind speed have a greater impact, resulting in an enhanced reduction in emissions, with emissions increases occurring in only a few small regions. While there is a global near balance of dust load increases and decreases in HadGEM3-GC3, UKESM1 simulates a global load reduction of 23 % by the end of SSP5–8.5.
The difference in dust responses between the models is much larger than the difference in dust responses between the pathways. HadGEM3-GC3.1 results suggest that the global dust burden dust will remain largely unchanged, whatever socioeconomic pathway is followed, with increases mostly in North and South America and Australia balanced by decreases mainly in North Africa, Asia and Europe. In contrast, in UKESM1 the addition of the extra Earth system process, and particularly the interactive vegetation, results in projections of reduced global total load, with reductions from most of the main desert regions and only a few small areas of increase in the tropics. The global load reduction of 23 %, associated with fossil-fuelled development, is somewhat larger than the 19 % reduction of the middle-of-the-road pathway. We note the non-linearity of this response to forcing, despite the linear response of the source area, and speculate that this may be due to the dust emission process involving non-linear dependence on various factors, which themselves may respond non-linearly to radiative forcing, and that dust feedbacks, which may enhance or limit emissions (e.g. Miller et al., 2004; Woodage and Woodward, 2014), could also introduce non-linearity. Our simulations suggest that the impact of the vegetation response on dust is larger than the direct impact of future climate change, and the differences due to including Earth system processes in the simulations are larger than the differences between pathways.
The reduction in load in UKESM1 results in a decrease in ToA DRE from UK_PD to UK_SP5 of 44 %, though the absolute values are small (−0.086 and −0.048 W m−2). The H3_S5 global mean ToA DRE of −0.29 W m−2 is only 2 % greater than the H3_PD value. In UKESM1 in particular, local changes are much larger than the global mean (Fig. 7).
The simulation of present-day dust in UKESM1 shows good agreement with most of the observations, though the AOD is somewhat low. The performance is generally comparable with that of HadGEM3_GC3.1, despite the extra complexity of the additional processes and feedbacks in the Earth system model. The tuning of the lai_min term for grasses in JULES, which limits the rate at which grasses can spread, was an important factor in this, as it improved the simulation of bare soil fraction in source regions. Some degradation in model performance is to be expected as a cost of the increased complexity, which is included to allow investigation of the feedback processes (Jones et al., 2011). Based on the evaluations performed, it was not found necessary to use preferential sources to add further restrictions to the dust emissions in UKESM1 compared to HadGEM3-GC3.1, so the dust was able to respond to climate-driven changes without any potentially unrealistic constraints. It is, of course, possible that other, as yet unevaluated, properties of the present-day simulations, such as frequency of occurrence of high dust optical depth, might be improved by the use of preferential sources.
Tuning of the dust scheme in the final UKESM1 configuration was limited by time constraints, as is often the case with the development of a model which includes dust. Further work might possibly have resulted in an alternative choice of settings. For example, in the UKESM1.1 model configuration dust was retuned to give better agreement with observations of AODs, though at the expense of agreement with other observations of size distribution and of concentrations in some areas (Mulcahy et al., 2022).
The low bias in AOD in the Saharan plume is the main weakness of the UKESM1 tuning settings, though as AOD depends on dust optical properties in addition to size distribution and concentrations, it is unclear quite how much of this bias is due to tuning. While optical properties are based on observations, they may well not be representative of all Saharan dust. In particular, dust from the Bodélé is made up predominantly of diatomite, which has different physical properties compared with dust from other Saharan sources (Todd et al., 2007). The size distribution was shown to agree well with observations.
The simulation of the Saharan plume is also affected by model resolution. Up to half of the dust emissions from West Africa may be associated with cold pool outflows from moist convection (haboobs), particularly in summer when this fraction is most important (Caton-Harrison et al., 2019, 2020), but the parameterised rather than explicit convection used in the N96 model renders the simulation of these events very difficult (Marsham et al., 2011; Knippertz and Todd, 2012), likely leading to underestimation of emissions in that area. Emissions from the Sahel are probably also underestimated for similar reasons. The omission of dust ageing through chemical processing has the effect of increasing lifetime and therefore increasing dust concentrations remotely from sources, and though this is not a very large effect, the inclusion of ageing could impact the choice of tuning settings, allowing higher Saharan AODs without too much overestimation of the concentrations in other areas. A higher present-day AOD over the Sahara would likely be associated with larger DREs in both the SW and LW, assuming that the size distribution was unchanged. These would still largely cancel, but the net DRE would probably be larger, as would the projected forcings for 2100.
The results demonstrate the crucial role of the particle size distribution in the simulation of the 3D dust distribution and particularly the radiative effects. Comparison of H3_PD with H3_TUK_INSS_NL (and H3_TUK_INSS) shows that quite small shifts in the size distribution towards coarser particles can change the balance of global mean SW and LW DREs so that they almost completely balance, giving net DREs close to zero. The particle size range is the same in all cases, with a maximum diameter of 63 µm, which is larger than many other climate model dust schemes (Huneeus et al., 2011; Checa-Garcia et al., 2021), so the DREs from HadGEM3-GC3.1 already include a relatively large LW effect and, hence, relatively small net DREs.
The DRE results from UKESM1 are consistent with the estimates of Kok et al. (2017), who find that most models underestimate the size of atmospheric dust compared with measurements and use analysis of size and other observations to constrain model estimates of dust ToA DRE to a range between −0.48 and +0.2 W m−2. This compares with a range of results from −0.56 to +0.01 W m−2 as reported in Forster et al. (2007), and more recent studies have also fallen within the latter range (Miller et al., 2006; Balkanski et al., 2007; Mahowald et al., 2006; Albani et al., 2014), though Scanza et al. (2015) have a slightly more positive ToA DRE of +0.05 W m−2. Note that a small net ToA DRE does not necessarily imply a minimal effect on climate. Even globally homogeneous LW–SW compensation has been shown to affect climate (Tilmes et al., 2016), and in the case of dust, regional effects will be important. One mechanism for this is the perturbation of the hydrological cycle by the dust DRE (e.g. Miller et al., 2004; Wilcox et al., 2010; Woodage and Woodward, 2014; Miller et al., 2014).
The response of dust to climate change in each of the models is very different, predominantly due to the direct and indirect impacts of the vegetation changes in UKESM1, which are not included in HadGEM3-GC3.1. This suggests that, in the future, the main anthropogenic impact on dust may be via the change in vegetation consequent on fossil-fuel-driven emissions rather than through the changes in climate variables, while changes in land use have a smaller effect. The differences between the models are greater than the differences between the SSP2 and SSP5 simulations from either model. These results illustrate the importance of including Earth system processes when simulating the response of dust to climate change. Indeed, a realistic future dust simulation may not be possible without including vegetation changes and its effects.
Dust is particularly sensitive to the interactively simulated vegetation in an Earth system model. Marginal areas for vegetation at the edges of deserts may be difficult for a vegetation scheme to simulate realistically but are potentially strong dust sources. Also, where vegetation is lost, not only do source areas increase but the consequent reduced roughness may lead to increased wind speed and, hence, via increased evaporation to reduced soil moisture changes which tend to enhance dust emissions. However, this effect is small in our climate change studies, as vegetation tends to grow rather than die back in response to increased CO2 and a warmer climate.
A feature of the pattern of emission changes, particularly in UKESM1, is the location of areas of large increase very close to areas of large decrease, with a sharp boundary between them. This demonstrates the sensitivity of the dust to the balance of the various driving fields in addition to the high sensitivity to wind speed. Even modest biases in driving model fields could produce shifts in such balances, and the areas of sharp gradients in dust changes are unlikely to be captured correctly by any current schemes and present a challenge for future dust modelling. There are, inevitably, considerable uncertainties associated with such simulations as these. Biases in the driving model can have a significant impact on the dust simulation. Dust production is highly sensitive to friction velocity, but emission only occurs when this exceeds a threshold which depends on soil moisture; hence, biases in model wind speed, precipitation or soil hydrology can have a large impact on dust. Feedbacks, such as those between soil moisture, vegetation cover and wind speed, can exacerbate the effects of biases. Precipitation biases have been noted in both models, particularly along the ITCZ (Williams et al., 2017; Sellar et al., 2019), and these impact soil moisture. In UKESM1 the precipitation biases also affect vegetation, with a lack of monsoon rain resulting in lack of C3 grass and excessive bare soil in India and the Sahel (Sellar et al., 2019). The model resolution limits the realistic representation of some processes, such as mesoscale convective systems, which results in biases in precipitation and dust mobilisation in the Sahel. These biases could be exacerbated by dust–precipitation feedbacks, as demonstrated by Yoshioka et al. (2007). Biases in the bare soil fraction also impact emissions, an effect which will be larger in UKESM1 due to the use of the interactive vegetation scheme. Transport and deposition are also affected by driving model biases, particularly in the circulation and precipitation.
Simplifications, uncertainties and missing processes in the dust scheme will all produce biases and contribute to uncertainty in the results. Seasonal sources are excluded from the scheme because they depend on the distributions of various plant types, and it was not clear whether these could be simulated sufficiently accurately in the ESM. Comparison of experiments H3_TUK_INSS and H3_TUK_EXSS indicates that, without other changes, the omission of seasonal sources would have reduced the load by approximately 10 %, though we have not assessed the realism of dust production from such sources in HadGEM3-GC3.1. The emission scheme ignores some factors, including re-entrainment and the effects of surface crusting and surface geomorphology. The global tuning terms can only compensate for the effects of temporal and spatial averaging very approximately, and the impact of heterogeneous, short-term and sub-grid-scale phenomena such as gustiness cannot be well represented. There are many uncertainties associated with deposition, as the role of such factors as electrical charging, electrophoresis, diffusiophoresis and rear capture in below-cloud scavenging is not yet fully understood. The treatment of deposition here is relatively simple, and in-cloud scavenging is ignored as it is a relatively small effect compared to below-cloud scavenging for insoluble dust. Dust ageing through chemical processing is also ignored. The inclusion of ageing and in-cloud scavenging would be likely to result in lower concentrations remotely from sources. The use of a uniform set of refractive index data for all dust will result in biases in the DRE (Scanza et al., 2015). Lack of observational input data, such as global surface geomorphology, limits the representation of dust. There is also a paucity of data for the validation of dust on climate timescales.
The accuracy of the estimates of the response of dust to climate change is difficult to assess. Any biases, uncertainties and feedbacks in the present-day simulations could well change with changing climate and will inevitably impact the estimates of the dust responses and feedbacks. Factors associated with model resolution, driving fields, limitations of the dust scheme, missing processes or missing feedbacks could all be important. There is some evidence that a climate model may be unable to simulate the observed variability in dust over decadal timescales (Yoshioka et al., 2007; Mahowald et al., 2010), which would be indicative of missing feedbacks and could result in the underestimation of changes in future projections. We have not analysed the variability in the modelled dust compared with observations, though UKESM1 does exhibit higher dust variability than HadGEM3-GC3.1 probably due to the additional processes and feedbacks in the ESM.
Despite the inherent limitations and uncertainties, these results can provide much useful information, provided that the caveats are borne in mind. Further work is required to provide the missing observations, to study the processes affecting dust, and to improve dust schemes and the models driving them, in order to enhance understanding and improve the simulation of the effects of climate change on dust.
The dust scheme used in UKESM1 and HadGEM3-GC3.1 is a development of the Woodward (2001) scheme with an improved emissions parameterisation. It was initially used in HadGEM3 and then retuned for UKESM1. Seasonal sources were also deactivated in UKESM1, reducing dependence on multiple plant types in the interactive vegetation scheme, while having only a small effect on load (less than 10 % in HadGEM3-GC3.1). Evaluation of the UKESM1 present-day dust simulation showed good agreement with observations, comparable with that of HadGEM3-GC3.1. This is particularly encouraging, given the additional uncertainties produced by the extra processes and feedbacks within the Earth system model and the fact that no extra constraints, such as preferential sources, were applied to limit the dust emissions in UKESM1.
The differences between global mean UKESM1 and HadGEM3-GC3.1 present-day DREs have been shown to depend on the change in size distribution consequent on the retuning as much as on the change in driving model. The change in load due to retuning had a lesser impact, and the activation of seasonal sources produced only a small effect. This demonstrates the importance of the simulation of size distribution, which impacts the global dust concentrations through the size-dependent deposition processes and, additionally, impacts DREs through the size-dependent radiative properties. The magnitude of this effect will depend on the choice of refractive index data.
The response of the dust under future socioeconomic pathways is highly model dependent. In HadGEM3-GC3.1 the climate response produces drying of moist soils, which tends to increase emissions slightly, but this is balanced by a small reduction in wind speeds in major source regions leading to the total emissions and load remaining almost unchanged between the present day and 2100. While these processes also occur in UKESM1, a greater impact on dust comes from the vegetation response, which is simulated interactively in this model. Enhanced vegetation growth produces a decrease in bare soil, leading to further reductions in wind speed, both of which result in lower emissions and load. The differences between the models are greater than the differences between the SSP2–4.5 and SSP5–8.5 pathways, and though there are some considerable uncertainties associated with these results, they indicate the importance of including the vegetation response in projections of dust in future climates.
These results provide useful new information about the interactions between dust and climate. They highlight the need to represent the full dust size distribution as realistically as possible and indicate that the effect of doing this may be to reduce the global mean net dust DREs at ToA to a value close to zero (though impacts on climate may be larger, particularly on a regional scale). They also show the importance of including Earth system interactions in dust simulations over climate timescales, as the greatest driver of dust change may be vegetation changes and the consequent modifications to source areas, soil moisture and wind speed.
Information on the UKESM1 configuration and its components and the prerequisites for using it may be found at http://cms.ncas.ac.uk/wiki/UM/Configurations/UKESM (last access: 12 March 2022). Due to intellectual property rights, we cannot provide the source code or documentation papers for the UM or JULES. A number of national meteorological services and research organisations use the UM in collaboration with the Met Office to undertake research, produce forecasts, develop the UM code and build and evaluate Earth system models. The UM is available for use in this way under licence; see http://www.metoffice.gov.uk/research/modelling-systems/unified-model (Met Office, 2022a). JULES is available under licence and free of charge for research purposes; see https://jules-lsm.github.io/access_req/JULES_access.html (Met Office, 2022b).
The simulations used in this work are based on CMIP6 simulations which are archived on the Earth System Grid Federation (ESGF) node https://esgf-node.llnl.gov/projects/cmip6/ (Earth System CoG sponsors and partners, 2019). The model source ID is UKESM1-0-LL for UKESM1 and HadGEM3-GC31-LL for HadGEM3-GC3.1 (https://doi.org/10.22033/ESGF/CMIP6.6113; Tang et al., 2019). AERONET AOD data are available to download from the National Aeronautic and Space Administration Goddard Space Flight Center AERONET Aerosol Robotic Network site (https://aeronet.gsfc.nasa.gov/cgi-bin/webtool_inv_v3, last access: 16 March 2022, AERONET, 2022).
SW was primarily responsible for the development of the dust code and its application in UKESM1 and ran the majority of the experiments and performed the analysis. AAS was scientific manager for UKESM1, coordinated the implementation of the dust code in the ESM and provided invaluable suggestions and comments throughout. YT implemented the dust settings into the UKESM1 model. MS wrote the code for dust deposition into the ocean. AY provided data and advice on deposition of dust to the ocean. ER ran the UK AMIP experiments and advised on their use. AW advised on the lai_min vegetation changes in UKESM1.
The contact author has declared that none of the authors has any competing interests.
Publisher’s note: Copernicus Publications remains neutral with regard to jurisdictional claims in published maps and institutional affiliations.
This study would not have been possible without the work of many staff in the UKESM1 Core Group and the Met Office, who developed the UKESM1 model and set up and ran the CMIP6 experiments. We thank Claire Ryder, for providing information about the FENNEC campaign. We are also grateful to all the researchers who generated the observational data we have used, including those of the University of Miami Aerosol Network and the AERONET community. We thank Didier Tanre, Jean-Louis Rajot, Philippe Goloub, Sidi Baika, Africa Barreto and Mahamadou M. Zakari, for establishing and maintaining the AERONET sites at Agoufou, Ouagadougou, Cabo Verde, Banizoumbou, Dakar, IER Cinzana, Tamanrasset INM and Zinder Airport.
This research has been supported by the UK Government Department for Business, Energy and Industrial Strategy and Department for Food, Environment and Rural Affairs (Met Office Hadley Centre Climate Programme). Marc Stringer has been supported by the Natural Environment Research Council (grant no. NE/N017978/1). Andrew Yool has been supported by EU Horizon 2020 project CRESCENDO (grant no. 641816).
This paper was edited by Susannah Burrows and reviewed by Ron L. Miller and one anonymous referee.
AERONET: AOD V3 data, AERONET [data set], https://aeronet.gsfc.nasa.gov/cgi-bin/webtool_inv_v3, last access: 16 March 2022.
Albani, S., Mahowald, N. M., Perry, A. T., Scanza R. A., Zender, C. S., Heavens, N. G., Maggi, V., Kok, J. F., and Otto-Bleisner, B. L.: Improved dust representation in the Community Atmosphere Model, J. Adv. Model. Earth Syst., 6, 541–570, https://doi.org/10.1002/2013MS000279, 2014.
Alfaro, S. C. and Gomes, L.: Modeling mineral aerosol production by wind erosion: Emission intensities and aerosol size distributions in source areas, J. Geophys. Res.-Atmos., 106, 18075–18084, https://doi.org/10.1029/2000JD900339, 2001.
Archibald, A. T., O'Connor, F. M., Abraham, N. L., Archer-Nicholls, S., Chipperfield, M. P., Dalvi, M., Folberth, G. A., Dennison, F., Dhomse, S. S., Griffiths, P. T., Hardacre, C., Hewitt, A. J., Hill, R. S., Johnson, C. E., Keeble, J., Köhler, M. O., Morgenstern, O., Mulcahy, J. P., Ordóñez, C., Pope, R. J., Rumbold, S. T., Russo, M. R., Savage, N. H., Sellar, A., Stringer, M., Turnock, S. T., Wild, O., and Zeng, G.: Description and evaluation of the UKCA stratosphere–troposphere chemistry scheme (StratTrop vn 1.0) implemented in UKESM1, Geosci. Model Dev., 13, 1223–1266, https://doi.org/10.5194/gmd-13-1223-2020, 2020.
Bagnold, R. A.: The Physics of Blown Sand and Desert Dunes, Methuen, New York, ISBN 978-94-009-5682-7, 1941.
Balkanski, Y., Schulz, M., Claquin, T., and Guibert, S.: Reevaluation of Mineral aerosol radiative forcings suggests a better agreement with satellite and AERONET data, Atmos. Chem. Phys., 7, 81–95, https://doi.org/10.5194/acp-7-81-2007, 2007.
Brooks, R. H. and Corey, A. T.: Hydraulic properties of porous media, Colorado State University, https://doi.org/10.13031/2013.40684, 1964.
Cakmur, R. V., Miller, R. L., and Torres O.: Incorporating the effect of small scale circulations upon dust emission in an AGCM, J. Geophys. Res., 109, D07201, https://doi.org/10.1029/2003JD004067, 2004.
Carslaw, K. S., Boucher, O., Spracklen, D. V., Mann, G. W., Rae, J. G. L., Woodward, S., and Kulmala, M.: A review of natural aerosol interactions and feedbacks within the Earth system, Atmos. Chem. Phys., 10, 1701–1737, https://doi.org/10.5194/acp-10-1701-2010, 2010.
Caton-Harrison, T., Washington, R., and Engelstaedter, S.: A 14-year climatology of Saharan dust emission mechanisms inferred from automatically tracked plumes, J. Geophys. Res.-Atmos., 124, 9665–9690, https://doi.org/10.1029/2019JD030291, 2019.
Caton-Harrison, T., Washington, R., and Engelstaedter, S.: Satellite-derived characteristics of Saharan cold pool outflows during boreal summer, J. Geophys. Res.-Atmos., 126, e2020JD033387, https://doi.org/10.1029/2020JD033387, 2020.
Checa-Garcia, R., Balkanski, Y., Albani, S., Bergman, T., Carslaw, K., Cozic, A., Dearden, C., Marticorena, B., Michou, M., van Noije, T., Nabat, P., O'Connor, F. M., Olivié, D., Prospero, J. M., Le Sager, P., Schulz, M., and Scott, C.: Evaluation of natural aerosols in CRESCENDO Earth system models (ESMs): mineral dust, Atmos. Chem. Phys., 21, 10295–10335, https://doi.org/10.5194/acp-21-10295-2021, 2021.
Collins, W. J., Bellouin, N., Doutriaux-Boucher, M., Gedney, N., Halloran, P., Hinton, T., Hughes, J., Jones, C. D., Joshi, M., Liddicoat, S., Martin, G., O'Connor, F., Rae, J., Senior, C., Sitch, S., Totterdell, I., Wiltshire, A., and Woodward, S.: Development and evaluation of an Earth-System model – HadGEM2, Geosci. Model Dev., 4, 1051–1075, https://doi.org/10.5194/gmd-4-1051-2011, 2011.
Craig, A., Valcke, S., and Coquart, L.: Development and performance of a new version of the OASIS coupler, OASIS3-MCT_3.0, Geosci. Model Dev., 10, 3297–3308, https://doi.org/10.5194/gmd-10-3297-2017, 2017.
Earth System CoG sponsors and partners: WCRP CMIP6 ESGF Node, ESGF [data set], https://esgf-node.llnl.gov/projects/cmip6/ (last access: 14 December 2021), 2019.
Edwards, J. M. and Slingo, A.: Studies with a flexible new radiation code, part 1: Choosing a configuration for a large-scale model, Q. J. Roy. Meteor. Soc., 122, 689–719, https://doi.org/10.1002/qj.49712253107, 1996.
Eyring, V., Bony, S., Meehl, G. A., Senior, C. A., Stevens, B., Stouffer, R. J., and Taylor, K. E.: Overview of the Coupled Model Intercomparison Project Phase 6 (CMIP6) experimental design and organization, Geosci. Model Dev., 9, 1937–1958, https://doi.org/10.5194/gmd-9-1937-2016, 2016.
Fécan, F., Marticorena, B., and Bergametti, G.: Parametrization of the increase of the aeolian erosion threshold wind friction velocity due to soil moisture for arid and semi-arid areas, Ann. Geophysicae, 17, 149–157, https://doi.org/10.1007/s00585-999-0149-7, 1999.
Fomba, K. W., Müller, K., van Pinxteren, D., Poulain, L., van Pinxteren, M., and Herrmann, H.: Long-term chemical characterization of tropical and marine aerosols at the Cape Verde Atmospheric Observatory (CVAO) from 2007 to 2011, Atmos. Chem. Phys., 14, 8883–8904, https://doi.org/10.5194/acp-14-8883-2014, 2014.
Forster, P., Ramaswamy, V., Artaxo, P., Berntsen, T., Betts, R., Fahey, D. W., Haywood, J., Lean, J., Lowe, D. C., Myhre, G., Nganga, J., Prinn, R., Raga, G., Schulz, M., and Dorland, R. V.: Changes in atmospheric constituents and in radiative forcing, in: Climate Change 2007: The Physical Science Basis, Contribution of Working Group I to the Fourth Assessment Report of the Intergovernmental Panel on Climate Change, edited by: Solomon, S., Qin, D., Manning, M., Chen, Z., Marquis, M., Averyt, K. B., Tignor, M., and Miller, H. L., Cambridge University Press, United Kingdom and New York, ISBN: 978-0521-70596-7, 2007.
Gillette, D. A.: Environmental factors affecting dust emission by wind erosion, in: Saharan Dust, edited by: Morales, C. John Wiley, New York, ISBN 9780471996804, 1979.
Ginoux, P., Chin, M., Tegen, I., Prospero, J. M., Holben, B., Dubovik, O., and Lin, S.-J.: Sources and distributions of dust aerosols simulated with the GOCART model, J. Geophys. Res.-Atmos., 106, 20255–20273, https://doi.org/10.1029/2000JD000053, 2001.
Gliß, J., Mortier, A., Schulz, M., Andrews, E., Balkanski, Y., Bauer, S. E., Benedictow, A. M. K., Bian, H., Checa-Garcia, R., Chin, M., Ginoux, P., Griesfeller, J. J., Heckel, A., Kipling, Z., Kirkevåg, A., Kokkola, H., Laj, P., Le Sager, P., Lund, M. T., Lund Myhre, C., Matsui, H., Myhre, G., Neubauer, D., van Noije, T., North, P., Olivié, D. J. L., Rémy, S., Sogacheva, L., Takemura, T., Tsigaridis, K., and Tsyro, S. G.: AeroCom phase III multi-model evaluation of the aerosol life cycle and optical properties using ground- and space-based remote sensing as well as surface in situ observations, Atmos. Chem. Phys., 21, 87–128, https://doi.org/10.5194/acp-21-87-2021, 2021.
Guirado, C., Cuevas, E., Cachorro, V. E., Toledano, C., Alonso-Pérez, S., Bustos, J. J., Basart, S., Romero, P. M., Camino, C., Mimouni, M., Zeudmi, L., Goloub, P., Baldasano, J. M., and de Frutos, A. M.: Aerosol characterization at the Saharan AERONET site Tamanrasset, Atmos. Chem. Phys., 14, 11753–11773, https://doi.org/10.5194/acp-14-11753-2014, 2014.
Heinold, B, Knippertz, P., Marsham, J. H., Fiedler, S., Dixon, N. S., Schepanski, K., Laurent, B., and Tegen, I.: The role of deep convection and nocturnal low-level jets for dust emission in summertime West Africa: Estimates from convection-permitting simulations J. Geophys. Res.-Atmos., 118, 4385–4400, https://doi.org/10.1002/jgrd.50402, 2013.
Holben, B. N., Tanre, D., Smirnov, A., Eck, T. F., Slutsker, I., Abuhassan, N., Newcomb, W. W., Schafer, J., Chatenet, B., Lavenue, F., Kaufman, Y. J., Castle, J. V., Setzer, A., Markham, B., Clark, D., Frouin, R., Halthore, R., Karnieli, A., O'Neill, N. T., Pietras, C., Pinker, R. T., Voss, K., and Zibordi, G.: An emerging ground-based aerosol climatology: Aerosol Optical Depth from AERONET, J. Geophys. Res., 106, 12067–12097, https://doi.org/10.1029/2001JD900014, 2001.
Huneeus, N., Schulz, M., Balkanski, Y., Griesfeller, J., Prospero, J., Kinne, S., Bauer, S., Boucher, O., Chin, M., Dentener, F., Diehl, T., Easter, R., Fillmore, D., Ghan, S., Ginoux, P., Grini, A., Horowitz, L., Koch, D., Krol, M. C., Landing, W., Liu, X., Mahowald, N., Miller, R., Morcrette, J.-J., Myhre, G., Penner, J., Perlwitz, J., Stier, P., Takemura, T., and Zender, C. S.: Global dust model intercomparison in AeroCom phase I, Atmos. Chem. Phys., 11, 7781–7816, https://doi.org/10.5194/acp-11-7781-2011, 2011.
IGBP: Global Soil Data Task (IGBP-DIS, ISO-image of CD), International Geosphere-Biosphere Program, PANGAEA, https://doi.org/10.1594/PANGAEA.869912, 2000.
Jones, C. D., Hughes, J. K., Bellouin, N., Hardiman, S. C., Jones, G. S., Knight, J., Liddicoat, S., O'Connor, F. M., Andres, R. J., Bell, C., Boo, K.-O., Bozzo, A., Butchart, N., Cadule, P., Corbin, K. D., Doutriaux-Boucher, M., Friedlingstein, P., Gornall, J., Gray, L., Halloran, P. R., Hurtt, G., Ingram, W. J., Lamarque, J.-F., Law, R. M., Meinshausen, M., Osprey, S., Palin, E. J., Parsons Chini, L., Raddatz, T., Sanderson, M. G., Sellar, A. A., Schurer, A., Valdes, P., Wood, N., Woodward, S., Yoshioka, M., and Zerroukat, M.: The HadGEM2-ES implementation of CMIP5 centennial simulations, Geosci. Model Dev., 4, 543–570, https://doi.org/10.5194/gmd-4-543-2011, 2011.
Knippertz, P. and Todd, M. C.: Mineral dust aerosols over the Sahara: Meteorological controls on emission and transport and implications for modeling, Rev. Geophys., 50, RG1007, https://doi.org/10.1029/2011RG000362, 2012.
Kohfeld, K. and Harrison, S. P.: DIRTMAP: The geologic record of dust, Earth Sci. Rev., 54, 81–114, https://doi.org/10.1016/S0012-8252(01)00042-3, 2001.
Kok, J. F., Mahowald, N. M., Fratini, G., Gillies, J. A., Ishizuka, M., Leys, J. F., Mikami, M., Park, M.-S., Park, S.-U., Van Pelt, R. S., and Zobeck, T. M.: An improved dust emission model – Part 1: Model description and comparison against measurements, Atmos. Chem. Phys., 14, 13023–13041, https://doi.org/10.5194/acp-14-13023-2014, 2014.
Kok, J. F., Ridley, D. A., Zhou, Q., Miller, R. L., Zhao, C., Heald, C. L., Ward, D. S., Albani, S., and Haustein, K.: Smaller desert dust cooling effect estimated from analysis of dust size and abundance, Nat. Geosci., 10, 274–278, https://doi.org/10.1038/Ngeo2912, 2017.
Kok, J. F., Ward, D. S., Mahowald, N. M., and Evan A. T.: Global and regional importance of the direct dust-climate feedback, Nat. Commun. 9, 241, https://doi.org/10.1038/s41467-017-02620-y, 2018.
Kuhlbrodt, T., Jones, C. G., Sellar, A., Storkey, D., Blockley, E., Stringer, M., and Walton, J.: The low-resolution version of HadGEM3 GC3.1: Development and evaluation for global climate, J. Adv. Model. Earth Syst., 10, 2865–2888, https://doi.org/10.1029/2018MS001370, 2018.
Levy, R. C., Mattoo, S., Munchak, L. A., Remer, L. A., Sayer, A. M., Patadia, F., and Hsu, N. C.: The Collection 6 MODIS aerosol products over land and ocean, Atmos. Meas. Tech., 6, 2989–3034, https://doi.org/10.5194/amt-6-2989-2013, 2013.
Loveland, T. R., Reed, B. C., Ohlen, D. O., Brown, J. F., Zhu, Z., Yang, L., and Merchant, J. W.: Development of a global land cover characteristics database and IGBP DISCover from 1 km AVHRR data, Int. J. Remote Sens., 21, 1303–1330, https://doi.org/10.1080/014311600210191, 2000.
Lunt, D. J. and Valdes, P. J.: The modern dust cycle: Comparison of model results with observations and study of sensitivities, J. Geophys. Res.-Atmos., 107, 4669, https://doi.org/10.1029/2002JD002316, 2002.
Mahowald, N. M., Kohfeld, K., Hansson, M., Balkanski, Y., Harrison, S. P., Prentice, I. C., Schulz, M., and Rodhe, H.: Dust sources and deposition during the last glacial maximum and current climate: A comparison of model results with paleodata from ice cores and marine sediments, J. Geophys. Res.-Atmos., 104, 15895–15916, https://doi.org/10.1029/1999JD900084, 1999.
Mahowald, N. M., Muhs, D. R., Levis, S., Rasch, P. J., Yoshioka, M., Zender, C. S., and Luo, C.: Change in atmospheric mineral aerosols in response to climate: Last glacial period, preindustrial, modern, and doubled carbon dioxide climates, J. Geophys. Res.-Atmos., 111, D10202, https://doi.org/10.1029/2005JD006653, 2006.
Mahowald, N. M., Engelstaedter, S., Luo, C., Sealy, A., Artaxo, P., Benitez-Nelson, C., Bonnet, S., Chen, Y., Chuang, P. Y., Cohen, D. D., Dulac, F., Herut, B., Johansen, A. M., Kubilay, N., Losno, R., Maenhaut, W., Paytan, A., Prospero, J. M., Shank, L. M., and Siefert, R. L.: Atmospheric iron deposition: global distribution, variability, and human perturbations, Ann. Rev. Mar. Sci., 1, 245–278, https://doi.org/10.1146/annurev.marine.010908.163727, 2009.
Mahowald, N. M., Kloster, S., Engelstaedter, S., Moore, J. K., Mukhopadhyay, S., McConnell, J. R., Albani, S., Doney, S. C., Bhattacharya, A., Curran, M. A. J., Flanner, M. G., Hoffman, F. M., Lawrence, D. M., Lindsay, K., Mayewski, P. A., Neff, J., Rothenberg, D., Thomas, E., Thornton, P. E., and Zender, C. S.: Observed 20th century desert dust variability: impact on climate and biogeochemistry, Atmos. Chem. Phys., 10, 10875–10893, https://doi.org/10.5194/acp-10-10875-2010, 2010.
Marsham, J. H., Knippertz, P., Dixon, N. S., Parker, D. J., and Lister G. M. S.: The importance of the representation of deep convection for modeled dust-generating winds over West Africa during summer, Geophys. Res. Lett., 38, L16803, https://doi.org/10.1029/2011GL048368, 2011.
Marticorena, B. and Bergametti G., Modeling the atmospheric dust cycle: 1. Design of a soil-derived dust emission scheme, J. Geophys. Res., 100, 16415–16430, https://doi.org/10.1029/95JD00690, 1995.
Marticorena, B., Chatenet, B., Rajot, J. L., Traoré, S., Coulibaly, M., Diallo, A., Koné, I., Maman, A., NDiaye, T., and Zakou, A.: Temporal variability of mineral dust concentrations over West Africa: analyses of a pluriannual monitoring from the AMMA Sahelian Dust Transect, Atmos. Chem. Phys., 10, 8899–8915, https://doi.org/10.5194/acp-10-8899-2010, 2010.
Marticorena, B., Chatenet, B., Rajot, J. L., Bergametti, G., Deroubaix, A., Vincent, J., Kouoi, A., Schmechtig, C., Coulibaly, M., Diallo, A., Koné, I., Maman, A., NDiaye, T., and Zakou, A.: Mineral dust over west and central Sahel: Seasonal patterns of dry and wet deposition fluxes from a pluriannual sampling (2006–2012), J. Geophys. Res.-Atmos., 122, 1338–1364, https://doi.org/10.1002/2016JD025995, 2017.
Met Office: Unified Model, Met Office [code], http://www.metoffice.gov.uk/research/modelling-systems/unified-model, last access: 12 March 2022a.
Met Office: Jules code access, Met Office [code], https://jules-lsm.github.io/access_req/JULES_access.html, last access: 12 March 2022b.
Miller, R. L., Perlwitz J., and Tegen I.: Feedback upon dust emission by dust radiative forcing through the planetaryboundary layer, J. Geophys. Res., 109, D24209, https://doi.org/10.1029/2004JD004912, 2004.
Miller, R. L., Cakmur, R. V., Perlwitz, J., Geogdzhayev, I. V., Ginoux, P., Koch, D., Kohfeld, K. E., Prigent, C., Ruedy, R., Schmidt, G. A., and Tegen, I.: Mineral dust aerosols in the NASA Goddard Institute for Space Sciences ModelE atmospheric general circulation model, J. Geophys. Res.-Atmos., 111, D06208, https://doi.org/10.1029/2005JD005796, 2006.
Miller, R. L., Knippertz, P., Pérez García-Pando, C., Perlwitz, J. P., and Tegen, I.: Impact of dust radiative forcing upon climate, in: Mineral Dust: A Key Player in the Earth System, edited by: Knippertz, P. and Stuut, J.-B. W., Springer, 327–357, https://doi.org/10.1007/978-94-017-8978-3_13, 2014.
Moss, R. H., Edmonds, J. A., Hibbard, K. A., Manning, M. R., Rose, S. K., Vuuren, D. P. van, Carter, T. R., Emori, S., Kainuma, M., Kram, T., Meehl, G. A., Mitchell, J. F. B., Nakicenovic, N., Riahi, K., Smith, S. J., Stouffer, R. J., Thomson, A. M., Weyant, J. P., and Wilbanks, T. J.: The next generation of scenarios for climate change research and assessment, Nature, 463, 747–756, https://doi.org/10.1038/nature08823, 2010.
Mulcahy, J. P., Johnson, C., Jones, C. G., Povey, A. C., Scott, C. E., Sellar, A., Turnock, S. T., Woodhouse, M. T., Abraham, N. L., Andrews, M. B., Bellouin, N., Browse, J., Carslaw, K. S., Dalvi, M., Folberth, G. A., Glover, M., Grosvenor, D. P., Hardacre, C., Hill, R., Johnson, B., Jones, A., Kipling, Z., Mann, G., Mollard, J., O'Connor, F. M., Palmiéri, J., Reddington, C., Rumbold, S. T., Richardson, M., Schutgens, N. A. J., Stier, P., Stringer, M., Tang, Y., Walton, J., Woodward, S., and Yool, A.: Description and evaluation of aerosol in UKESM1 and HadGEM3-GC3.1 CMIP6 historical simulations, Geosci. Model Dev., 13, 6383–6423, https://doi.org/10.5194/gmd-13-6383-2020, 2020.
Mulcahy, J. P., Jones, C., Rumbold, S., Kuhlbrodt, T., Dittus, A. J., Blockley, E. W., Yool, A., Walton, J., Hardacre, C., Andrews, T., Bodas-Salcedo, A., Stringer, M., de Mora L., Harris, P., Hill, R., Kelley, D., Robertson, E., and Tang, Y.: UKESM1.1: Development and evaluation of an updated configuration of the UK Earth Sytem Model, Geosci. Model Dev. Discuss. [preprint], https://doi.org/10.5194/gmd-2022-113, in review, 2022.
Nachtergaele, F., van Velthuizen, H., Verelst, L., Batjes, N., Dijkshoorn, K., van Engelen, V., Fischer, G., Jones, A., Montanarella, L., Petri, M., Prieler, S., Teixeira, E., Wiberg, D., and Shi, X.: Harmonized World Soil Database (version 1.0), FAO, Rome, Italy and IIASA, Laxenburg, Austria, https://edepot.wur.nl/30776 (last access: 12 March 2022), 2008.
Prospero, J. M., Landing, W. M., and Schulz, M.: African dust deposition to Florida: Temporal and spatial variability and comparisons to models, J. Geophys. Res., 115, D13304, https://doi.org/10.1029/2009JD012773, 2010.
Riahi, K., Van Vuuren, D. P., Kriegler, E., Edmonds, J., O'neill, B. C., Fujimori, S., Bauer, N., Calvin, K., Dellink, R., Fricko, O., Lutz, W., Popp, A., Cuaresma, J. C., Samir K. C., Leimbach, M., Jiang, L., Kram, T., Rao, S., Emmerling, J., Ebi, K., Hasegawa, T., Havlik, P., Humpenöder, F., Da Silva, L. A., Smith, S., Stehfest, E., Bosetti, V., Eom, J., Gernaat, D., Masui, T., Rogelj, J., Strefler, J., Drouet, L., Krey, V., Luderer, G., Harmsen, M., Takahashi, K., Baumstark, L., Doelman, J. C., Kainuma, M., Klimont, Z., Marangoni, G., Lotze-Campen, H., Obersteiner, M., Tabeau, A., and Tavoni M.: The Shared Socioeconomic Pathways and their energy, land use, and greenhouse gas emissions implications: An overview, Global Environ. Chang., 42, 153–168, https://doi.org/10.1016/j.gloenvcha.2016.05.009, 2017.
Ridley, J. K., Blockley, E. W., Keen, A. B., Rae, J. G. L., West, A. E., and Schroeder, D.: The sea ice model component of HadGEM3-GC3.1, Geosci. Model Dev., 11, 713–723, https://doi.org/10.5194/gmd-11-713-2018, 2018.
Ryder, C. L., Highwood, E. J., Rosenberg, P. D., Trembath, J., Brooke, J. K., Bart, M., Dean, A., Crosier, J., Dorsey, J., Brindley, H., Banks, J., Marsham, J. H., McQuaid, J. B., Sodemann, H., and Washington, R.: Optical properties of Saharan dust aerosol and contribution from the coarse mode as measured during the Fennec 2011 aircraft campaign, Atmos. Chem. Phys., 13, 303–325, https://doi.org/10.5194/acp-13-303-2013, 2013.
Ryder, C. L., Marenco, F., Brooke, J. K., Estelles, V., Cotton, R., Formenti, P., McQuaid, J. B., Price, H. C., Liu, D., Ausset, P., Rosenberg, P. D., Taylor, J. W., Choularton, T., Bower, K., Coe, H., Gallagher, M., Crosier, J., Lloyd, G., Highwood, E. J., and Murray, B. J.: Coarse-mode mineral dust size distributions, composition and optical properties from AER-D aircraft measurements over the tropical eastern Atlantic, Atmos. Chem. Phys., 18, 17225–17257, https://doi.org/10.5194/acp-18-17225-2018, 2018.
Ryder, C. L., Highwood, E. J., Walser, A., Seibert, P., Philipp, A., and Weinzierl, B.: Coarse and giant particles are ubiquitous in Saharan dust export regions and are radiatively significant over the Sahara, Atmos. Chem. Phys., 19, 15353–15376, https://doi.org/10.5194/acp-19-15353-2019, 2019.
Scanza, R. A., Mahowald, N., Ghan, S., Zender, C. S., Kok, J. F., Liu, X., Zhang, Y., and Albani, S.: Modeling dust as component minerals in the Community Atmosphere Model: development of framework and impact on radiative forcing, Atmos. Chem. Phys., 15, 537–561, https://doi.org/10.5194/acp-15-537-2015, 2015.
Sellar, A. A., Jones, C. G., Mulcahy, J. P., Tang, Y., Yool, A., Wiltshire, A., O'Connor, F. M., Stringer, M., Hill, R., Palmieri, J., Woodward, S., de Mora, L., Kuhlbrodt, T., Rumbold, S. T., Kelley, D. I., Ellis, R., Johnson, C. E., Walton, J., Abraham, N. L., Andrews, M. B., Andrews, T., Archibald, A. T., Berthou, S., Burke, E., Blockley, E., Carslaw, K., Dalvi, M., Edwards, J., Folberth, G. A., Gedney, N., Griffiths, P. T., Harper, A. B., Hendry, M. A., Hewitt, A. J., Johnson, B., Jones, A., Jones, C. D., Keeble, J., Liddicoat, S., Morgenstern, O., Parker, R. J., Predoi, V., Robertson, E., Siahaan, A., Smith, R. S., Swaminathan, R., Woodhouse, M. T., Zeng, G., and Zerroukat, M.: UKESM1: Description and Evaluation of the U.K. Earth System Model, J. Adv. Model. Earth Syst., 11, 4513–4558, https://doi.org/10.1029/2019MS001739, 2019.
Sellar, A. A., Walton, J., Jones, C. G., Wood, R., Abraham, N. L., Andrejczuk, M., Andrews, M. B., Andrews, T., Archibald, A. T., de Mora, L., Dyson, H., Elkington, M., Ellis, R., Florek, P., Good, P., Gohar, L., Haddad, S., Hardiman, S. C., Hogan, E., Iwi, A., Jones, C. D., Johnson, B., Kelley, D. I., Kettleborough, J., Knight, J. R., Köhler, M. O., Kuhlbrodt, T., Liddicoat, S., Linova-Pavlova, I., Mizielinski, M. S., Morgenstern, O., Mulcahy, J., Neininger, E., O'Connor, F. M., Petrie, R., Ridley, J., Rioual, J. C., Roberts, M., Robertson, E., Rumbold, S., Seddon, J., Shepherd, H., Shim, S., Stephens, A., Teixiera, J. C., Tang, Y., Williams, J., Wiltshire, A., and Griffiths, P. T.: Implementation of U. K. Earth System Models for CMIP6, J. Adv. Model. Earth Syst., 12, e2019MS001946, https://doi.org/10.1029/2019MS001946, 2020.
Sokolik, I. N. and Toon, O. B.: Incorporation of mineralogical composition into models of the radiative properties of mineral aerosol from UV to IR wavelengths, J. Geophys. Res., 104, 9423–9444, https://doi.org/10.1029/1998JD200048, 1999.
Storkey, D., Blaker, A. T., Mathiot, P., Megann, A., Aksenov, Y., Blockley, E. W., Calvert, D., Graham, T., Hewitt, H. T., Hyder, P., Kuhlbrodt, T., Rae, J. G. L., and Sinha, B.: UK Global Ocean GO6 and GO7: a traceable hierarchy of model resolutions, Geosci. Model Dev., 11, 3187–3213, https://doi.org/10.5194/gmd-11-3187-2018, 2018.
Tang, Y., Rumbold, S., Ellis, R., Kelley, D., Mulcahy, J., Sellar, A., Walton, J., and Jones, C.: MOHC UKESM1.0-LL model output prepared for CMIP6 CMIP historical, Version 20220316, Earth System Grid Federation, WCRP [data set], https://doi.org/10.22033/ESGF/CMIP6.6113, 2019.
Tegen, I. and Miller, R.: A general circulation model study on the interannual variability of soil dust aerosol, J. Geophys. Res., 103, 25975–25995, https://doi.org/10.1029/98JD02345, 1998.
Tegen, I., Harrison, S. P., Kohfeld, K., Prentice, I. C., Coe, M., and Heimann, M.: Impact of vegetation and preferential source areas on global dust aerosol: Results from a model study, J. Geophys. Res.-Atmos., 107, AAC 14-1–AAC 14-27, https://doi.org/10.1029/2001JD000963, 2002.
Tilmes, S., Lamarque, J.-F., Emmons, L. K., Kinnison, D. E., Marsh, D., Garcia, R. R., Smith, A. K., Neely, R. R., Conley, A., Vitt, F., Val Martin, M., Tanimoto, H., Simpson, I., Blake, D. R., and Blake, N.: Representation of the Community Earth System Model (CESM1) CAM4-chem within the Chemistry-Climate Model Initiative (CCMI), Geosci. Model Dev., 9, 1853–1890, https://doi.org/10.5194/gmd-9-1853-2016, 2016.
Todd, M. C., Washington, R., Martins, J. V., Dubovik, O., Lizcano, G., M'Bainayel, S., and Engelstaedter, S.: Mineral dust emission from the Bodelé Depression, Northern Chad, during BoDEx 2005, J. Geophys. Res., 112, D06207, https://doi.org/10.1029/2006JD007170, 2007.
van Vuuren, D. P., Edmonds, J., Kainuma, M., Riahi, K., Thomson, A., Hibbard, K., Hurtt, G. C., Kram, T., Krey, V., Lamarque, J.-F., Masui, T., Meinshausen, M., Nakicenovic, N., Smith, S. J., and Rose, S. K.: The representative concentration pathways: an overview, Climatic Change, 109, 5–31, https://doi.org/10.1007/s10584-011-0148-z, 2011.
Walters, D., Baran, A. J., Boutle, I., Brooks, M., Earnshaw, P., Edwards, J., Furtado, K., Hill, P., Lock, A., Manners, J., Morcrette, C., Mulcahy, J., Sanchez, C., Smith, C., Stratton, R., Tennant, W., Tomassini, L., Van Weverberg, K., Vosper, S., Willett, M., Browse, J., Bushell, A., Carslaw, K., Dalvi, M., Essery, R., Gedney, N., Hardiman, S., Johnson, B., Johnson, C., Jones, A., Jones, C., Mann, G., Milton, S., Rumbold, H., Sellar, A., Ujiie, M., Whitall, M., Williams, K., and Zerroukat, M.: The Met Office Unified Model Global Atmosphere 7.0/7.1 and JULES Global Land 7.0 configurations, Geosci. Model Dev., 12, 1909–1963, https://doi.org/10.5194/gmd-12-1909-2019, 2019.
Watanabe, S., Hajima, T., Sudo, K., Nagashima, T., Takemura, T., Okajima, H., Nozawa, T., Kawase, H., Abe, M., Yokohata, T., Ise, T., Sato, H., Kato, E., Takata, K., Emori, S., and Kawamiya, M.: MIROC-ESM 2010: model description and basic results of CMIP5-20c3m experiments, Geosci. Model Dev., 4, 845–872, https://doi.org/10.5194/gmd-4-845-2011, 2011.
Wilcox, E. M., Lau, K. M., and Kim, K.-M.: A northward shift of the North Atlantic Ocean intertropical convergence zone in response to summertime Saharan dust outbreaks. Geophys. Res. Lett., 37, L04804, https://doi.org/10.1029/2009GL041774, 2010.
Williams, K. D., Copsey, D., Blockley, E. W., Bodas-Salcedo, A., Calvert, D., Comer, R., Davis, P., Graham, T., Hewitt, H. T., Hill, R., Hyder, P., Ineson, S., Johns, T. C., Keen, A. B., Lee, R. W., Megann, A., Milton, S. F., Rae, J. G. L., Roberts, M. J., Scaife, A. A., Schiemann, R., Storkey, D., Thorpe, L., Watterson, I. G., Walters, D. N., West, A., Wood, R. A., Woollings, T., and Xavier, P. K.: The Met Office Global Coupled Model 3.0 and 3.1 (GC3.0 and GC3.1) configurations, J. Adv. Model Earth Syst., 10, 357–380, https://doi.org/10.1002/2017MS001115, 2017.
Woodage, M. J. and Woodward, S.: U.K. HiGEM: Impacts of Desert Dust Radiative Forcing in a High-Resolution Atmospheric GCM, J. Climate, 27, 5907-5928, https://doi.org/10.1175/JCLI-D-13-00556.1, 2014.
Woodward, S.: Modeling the atmospheric life cycle and radiative impact of mineral dust in the Hadley Centre climate model, J. Geophys. Res., 106, 18155–18166, https://doi.org/10.1029/2000JD900795, 2001.
Yool, A., Popova, E. E., and Anderson, T. R.: MEDUSA-2.0: an intermediate complexity biogeochemical model of the marine carbon cycle for climate change and ocean acidification studies, Geosci. Model Dev., 6, 1767–1811, https://doi.org/10.5194/gmd-6-1767-2013, 2013.
Yool, A., Palmiéri, J., Jones, C. G., de Mora, L., Kuhlbrodt, T., Popova, E. E., Nurser, A. J. G., Hirschi, J., Blaker, A. T., Coward, A. C., Blockley, E. W., and Sellar, A. A.: Evaluating the physical and biogeochemical state of the global ocean component of UKESM1 in CMIP6 historical simulations, Geosci. Model Dev., 14, 3437–3472, https://doi.org/10.5194/gmd-14-3437-2021, 2021.
Yoshioka, M., Mahowald, N., Conley, A. J., Collins, W. D., Fillmore, D. W., Zender, C. S., and Coleman, D. B.: Impact of desert dust radiative forcing on Sahel precipitation: relative importance of dust compared to sea surface temperature variations, vegetation changes and greenhouse gas warming, J. Climate, 16, 1445–1467, https://doi.org/10.1175/JCLI4056.1, 2007.
- Abstract
- Introduction
- UKESM1
- Dust scheme
- Experiments
- Present-day dust simulations and evaluation
- The response of dust to changing climate
- Discussion
- Conclusions
- Code availability
- Data availability
- Author contributions
- Competing interests
- Disclaimer
- Acknowledgements
- Financial support
- Review statement
- References