the Creative Commons Attribution 4.0 License.
the Creative Commons Attribution 4.0 License.
 | 18 Oct 2022
Quantifying the importance of vehicle ammonia emissions in an urban area of northeastern USA utilizing nitrogen isotopes
Wendell W. Walters
Madeline Karod
Emma Willcocks
Bok H. Baek
Danielle E. Blum
Meredith G. Hastings
Atmospheric ammonia (NH3) is a critical component of our atmosphere that contributes to air quality degradation and reactive nitrogen deposition; however, our knowledge of NH3 in urban environments remains limited. Year-long ambient NH3 and related species were measured for concentrations and the nitrogen isotopic compositions (δ15N) of NH3 and particulate ammonium () were measured to understand the temporal sources and chemistry of NH3 in a northeastern US urban environment. We found that urban NH3 and concentrations were elevated compared to regional rural background monitoring stations, with seasonally significant variations. Local and transported sources of NHx (NH3+ ) were identified using polar bivariate and statistical back trajectory analysis, which suggested the importance of vehicles, volatilization, industry, and stationary fuel combustion emissions. Utilizing a uniquely positive δ15N(NH3) emission source signature from vehicles, a Bayesian stable isotope mixing model (SIMMR) indicates that vehicles contribute 46.8±3.5 % (mean ±1σ) to the annual background level of urban NHx, with a strong seasonal pattern with higher relative contribution during winter (56.4±7.6 %) compared to summer (34.1±5.5 %). The decrease in the relative importance of vehicle emissions during the summer was suggested to be driven by temperature-dependent NH3 emissions from volatilization sources, seasonal fuel-combustion emissions related to energy generation, and change in seasonal transport patterns based on wind direction, back trajectory, and NH3 emission inventory analysis. This work highlights that reducing vehicle NH3 emissions should be considered to improve wintertime air quality in this region.
- Article
(4207 KB) - Full-text XML
-
Supplement
(838 KB) - BibTeX
- EndNote


Ammonia (NH3) is a critical component of the atmosphere and the global nitrogen cycle (Behera et al., 2013; Galloway et al., 2004). As the primary alkaline atmospheric molecule, NH3 plays an important role in neutralizing atmospheric acids, leading to fine particulate matter (PM2.5), including particulate ammonium (), which have important implications for air quality, human health, visibility, and climate change (Behera and Sharma, 2010; Updyke et al., 2012; Wang et al., 2015). Agricultural activities, including fertilizer application and livestock waste, dominate the emission of NH3, accounting for over 60 % of the global inventory (Bouwman et al., 1997); however, there are significant NH3 spatiotemporal variabilities due to its short atmospheric lifetime, typically a few hours to a day, and numerous emission sources (Van Damme et al., 2018). Urban regions have been shown to have elevated levels of NH3 and nitrogen deposition (Plautz, 2018; Joyce et al., 2020; Hu et al., 2014; Decina et al., 2020, 2017), indicating the potential for important non-agricultural emission sources that may disproportionately impact human and environmental health. In recent years, quantifying surface-level NH3 and its deposition products in the US has been a focus of several national monitoring networks, including the Ammonia Monitoring Network (AMoN), the Interagency Monitoring of Protected Visual Environments (IMPROVE), the National Atmospheric Deposition Program (NADP), and the Clean Air Status and Trends Network (CASTNET). However, these measurements are typically conducted in rural locations. Long-term records of NH3 and its deposition products in urban regions are exceedingly scarce, which often leads to models evaluated to observations primarily conducted in rural locations (Paulot et al., 2014).
The NH3 sources contributing to the urban budget remain contested. Several studies have identified vehicle emissions as a major urban NH3 emission source (Sun et al., 2017, 2014; Suarez-Bertoa et al., 2014, 2017). In contrast, other studies have suggested that vehicle emissions are relatively unimportant for urban regions and instead have found evidence for significant local and transported emissions due to temperature-dependent volatilization sources (Hu et al., 2014; Yao et al., 2013; Nowak et al., 2006). Recent satellite observations, taking advantage of the COVID-19 lockdown period, have for the first time confirmed vehicle emissions as a significant localized source of NH3 in an urban region (Cao et al., 2021). However, quantifying the contribution of local urban NH3 emissions to the urban background is complex as it is coupled to meteorological parameters that influence NH3 and particulate ammonium () partitioning, mixing/dispersion of local emissions, and contributions via long-range transport from agricultural regions (Meng et al., 2011; Walker et al., 2004).
The nitrogen stable isotopic composition (δ15N(‰) = [(15Rsample)/(15Rreference)−1]×1000, where 15R is the ratio of 15N 14N, and air is the N isotopic reference) may be a useful chemical fingerprinting tool to track source contributions and validate model apportionments of urban NH3 (Felix et al., 2017, 2013). Indeed, numerous studies have utilized δ15N of NH3 and for source apportionment (e.g., Felix et al., 2017; Pan et al., 2016; Berner and Felix, 2020; Liu et al., 2018; Pan et al., 2018; Wu et al., 2019; Bhattarai et al., 2020; Xiao et al., 2020; Zhang et al., 2021), taking advantage of the suggested lower δ15N signatures of agricultural NH3 emissions relative to fossil fuel combustion (Felix et al., 2013; Chang et al., 2016). In this study, we have characterized the seasonal ambient NHx (NH3+ ) source contributions using concentration and isotope measurements at an urban site in Providence, RI, US, using laboratory-verified and field-tested collection techniques shown to quantitatively collect NHx for accurate and precise δ15N characterizations (Walters and Hastings, 2018; Walters et al., 2019). The study site is a mid-sized coastal city located within the northeastern US megalopolis. This is an important region to monitor because the northeastern US wintertime air quality has not improved as much as expected, despite aggressive reductions of precursor emissions in recent decades (Shah et al., 2018). We have recently characterized the δ15N(NH3) from urban vehicle plumes, which has indicated this source to have a unique positive δ15N signature of 6.6±2.1 ‰ compared to other NH3 sources that tend to have negative δ15N values (Walters et al., 2020). Here we aim to quantify the importance of vehicle NH3 emissions at our urban site. Our study contributes to the first δ15N measurements of speciated NHx in New England and contributes to our understanding of seasonal urban NHx source apportionment in an environment where particulate nitrate () formation is commonly NH3-limited (Park et al., 2004).
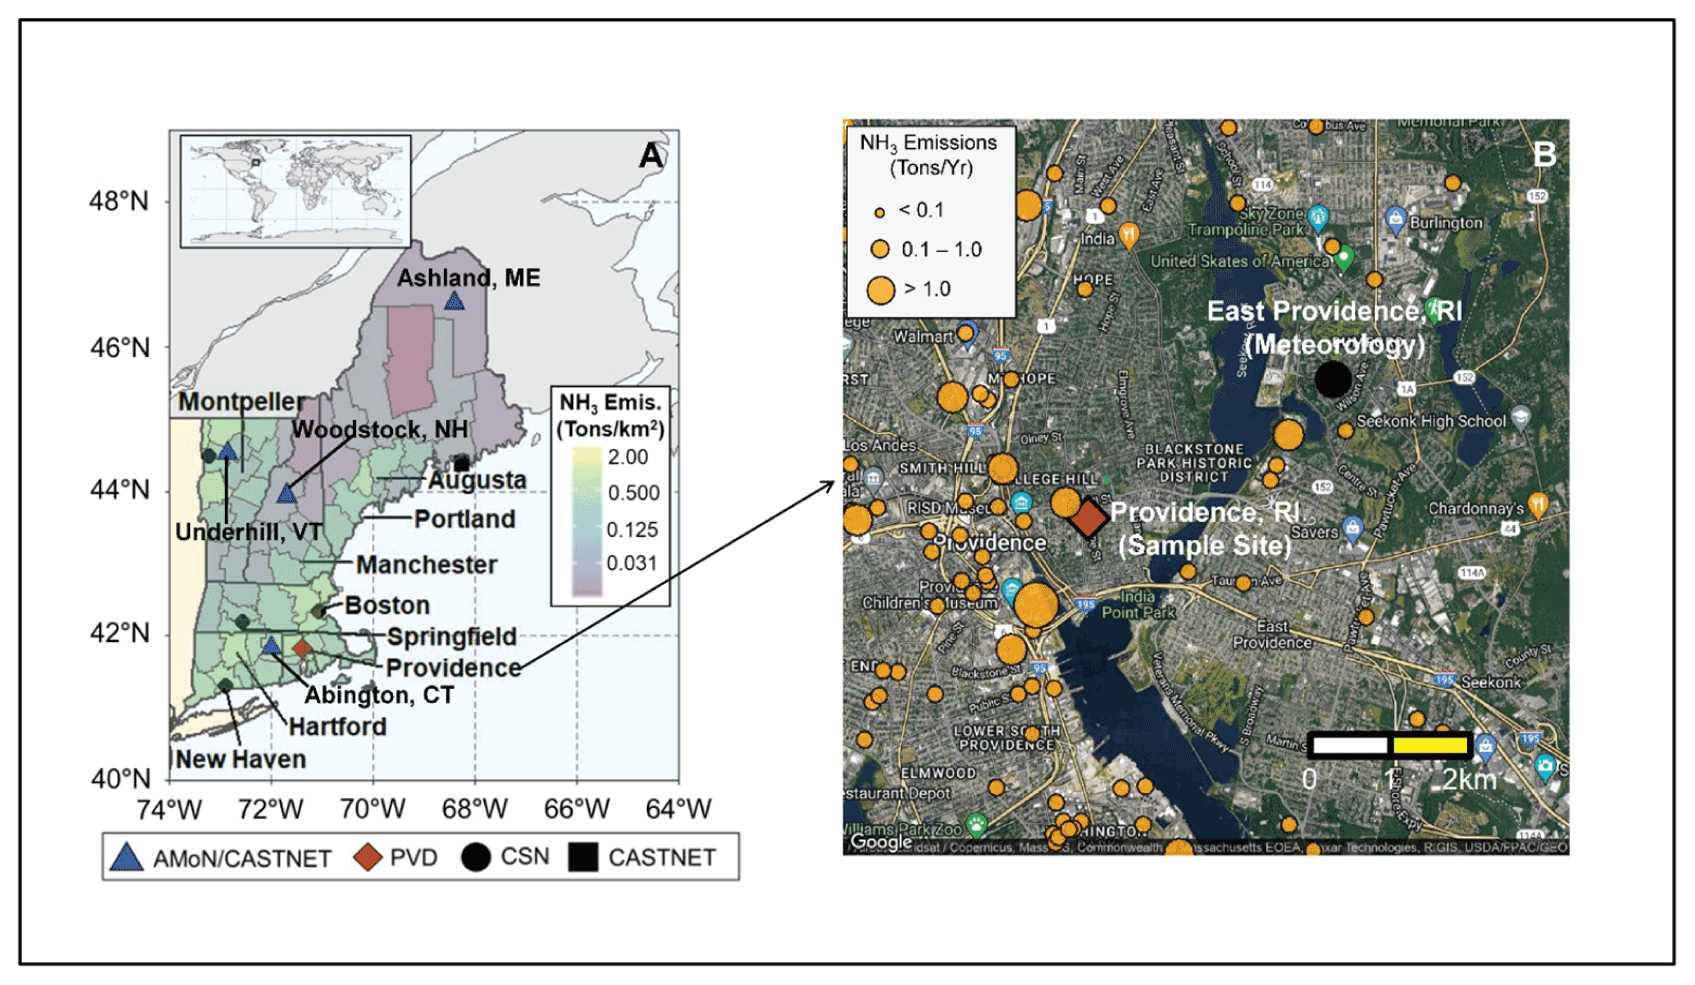
Figure 1Overview of the sampling location in Providence, RI, USA (red diamond) located within New England (a) with the Ammonia Monitoring Network (AMoN)/Clean Air Status and Trends Network (CASTNET; blue triangle), Chemical Speciation Network (CSN; black circle), CASTNET only (black square) monitoring locations indicated. The counties in (a) are color-coded for National Emission Inventory 2014 (NEI-14) NH3 emission densities. The zoomed-in map of Providence, RI, USA is shown in (b) with the sample site location (red diamond), the nearby CSN location with reported meteorology data (black circle) in East Providence, RI, USA, and the NH3 point emission sources from the NEI (orange circles; size-coded to annual NH3 emission) indicated. Image (b) was created using Google Maps (Map data © Google 2019).
2.1 Collection of NHx and associated gases and particles
Simultaneous collections of reactive gases and PM2.5 were conducted using a series of coated glass honeycomb denuders and a downstream filter pack housed in a ChemComb Speciation Cartridge. This sampling system has been extensively evaluated for its ability to speciate between inorganic gases and particulate matter for offline concentration determination (Koutrakis et al., 1993, 1988). Additionally, this system is a suitable technique for the characterization of δ15N(NH3) and δ15N() with a precision of ±0.8 ‰ and ±0.9 ‰ (1σ), respectively (Walters and Hastings, 2018; Walters et al., 2019). Briefly, the sampler consisted of a PTFE-coated inlet to minimize reactive gas loss, a PM2.5 impactor plate, a basic-coated honeycomb denuder (2 % carbonate () +1 % glycerol () in 80:20 water–methanol () solution) to collect acidic gases including nitric acid (HNO3) and sulfur dioxide (SO2), an acid-coated denuder (2 % citric acid () +1 % glycerol () in 20:80 water–methanol () solution) to collect NH3, and a filter pack consisting of a nylon filter and 5 % () citric acid-coated cellulose filter for the collection of . All denuder and filter preparation, handling, and extraction techniques have been previously described (Walters and Hastings, 2018; Walters et al., 2019). The samplers were held vertically to limit the potential for gravitational settling of particles on the denuder surfaces and were housed in a custom-built weather-protected container. Ambient air was sampled at a flow rate of 10 L min−1. Collections were conducted for 24 h (15:00 to 15:00 eastern time (ET) the following day) approximately twice per week in Providence, RI, USA (41.83∘ N, 71.40∘ W) on the rooftop of a building from 6 February 2018 to 1 February 2019 (Fig. 1). The study location is a mid-sized coastal city within New England, with an approximate population of 180 000 and population density of 3800 km−2. The monitoring location is in an urban-mixed use region that includes commercial buildings, residential buildings, highways, and industry with some clear NH3 point sources such as vehicles, residential heating, sewage, and industrial emission.
2.2 Concentration and δ15N(NHx) isotopic analysis
The concentrations of the denuder and filter extraction solutions were analyzed using colorimetry and ion chromatography analytical techniques. The colorimetric analysis included measurements of NH using the indophenol blue method (i.e., US EPA Method 350.1) and NO via diazotization with sulfanilamide dihydrochloride (i.e., US EPA Method 353.2) that was automated by a discrete UV-Vis spectrophotometer (Westco SmartChem). Anion concentrations that included Cl−, NO, and SO were analyzed using ion chromatography (Dionex DX500). The limit of detection (LOD) was approximately 0.5 µmol L−1 for NH and NO and 2 µmol L−1 for Cl−, NO, and SO. The relative standard deviations for all quantified ions were less than 5 %. Laboratory blanks of denuder and filter samples were periodically taken, representing approximately 10 % of the collected samples. The blanks were below our LOD, except for Cl− that had a large and variable blank for both the carbonate denuder and nylon filter, such that these data were not reported in this work.
The determination of δ15N of the NH in the denuder and filter extracts was conducted using a chemical technique that converts NH to NO using an alkaline hypobromite solution and reducing the generated NO to N2O using sodium azide in an acetic acid buffer solution (Zhang et al., 2007). The generated N2O was purified and concentrated using an automated extraction system coupled to a continuous-flow isotope ratio mass spectrometer for δ15N determination as previously described (Walters and Hastings, 2018). In each sample batch, unknowns were calibrated to two internationally recognized NH isotopic reference materials, IAEA-N2 and USGS25, with δ15N values of 20.3 ‰ and −30.3 ‰ (Böhlke et al., 1993; Böhlke and Coplen, 1993), respectively. An in-house NH quality control (δ15N ) and an NO reference material with a known isotope composition (RSIL-N10219; δ15N=2.8 ‰) (Böhlke et al., 2007) were also run intermittently as quality control to monitor the conversion of NO to N2O and system stability across runs. Corrections to determine δ15N(NH) were performed by accounting for isobaric influences, blank effects, and calibrating the unknowns to the internationally recognized δ15N(NH) standards. The correction scheme resulted in an average slope between the measured δ15N(N2O) and the standard δ15N(NH) values of 0.501±0.024 near the theoretical line of 0.500 for the azide/acetic acid reduction method (Zhang et al., 2007; McIlvin and Altabet, 2005). The pooled standard deviations of the isotopic reference materials were ±0.6 ‰ (n=62), ±0.7 ‰ (n=62), ±0.5 ‰ (n=14), and ±1.3 ‰ (n=18), for IAEA-N2, USGS25, in-house NH, and RSIL-N10219, respectively. Due to the numerous steps and potential interferences associated with the employed chemical conversion technique, we established the following quality assurance criteria for our sample unknowns: (1) NH greater than 5 µmol L−1 to combat the significant alkaline hypobromite reagent blank, (2) NO NH ratio less than 5 % since NO is an interferent, and (3) quantitative yield of NH to NO conversion (i.e., incomplete conversion would lead to undesirable δ15N fractionation). These criteria were met for 90 out of 97 NH3 samples and 60 out of 97 samples. The 7 rejected NH3 samples were because of criterion 3, while the rejected NH samples included 18 from criterion 1, 8 from criterion 2, and 11 from criterion 3. The presence of significant amounts of NO was found exclusively on the nylon filters, which likely reflect the influence of NO2 collection as previously demonstrated (Perrino et al., 1988). Replicate measurements of sample unknowns across batch analyses were conducted for approximately 10 % of samples and had an average deviation of ±1.4 ‰.
2.3 Ancillary datasets
Annual emission data of NH3 at the county level were accessed from the US EPA National Emission Inventory 2014 (NEI-14), and chemically speciated gridded hourly NH3 emission data were generated using the Sparse Matrix Operator Kerner Emissions (SMOKE) model (Baek and Seppanen, 2021). The SMOKE processor was initialized using the NEI-2014 emissions modeling platform (EMP) version 7.1, as this was the most recently available NEI at the time of the analysis. The model output was binned by month. Ancillary meteorological parameters were accessed from the Rhode Island Department of Health air monitoring and Chemical Speciation Network (CSN) monitoring station at East Providence (Fig. 1). Data were accessed from co-located Ammonia Monitoring Network (AMoN) and Clean Air Status and Trends Network (CASTNET) stations located within New England (US EPA Region 1) for NH3 and , respectively. These sites included Abington, CT (41.84∘ N, 72.01∘ W), Underhill, VT (44.53∘ N, 72.87∘ W), Woodstock, NH (44.53∘ N, 72.87∘ W), and Ashland, ME (46.60∘ N, 68.41∘ W) (Fig. 1). Archived back trajectories and boundary layer heights were computed using the NOAA Air Resource Lab HYSPLIT model (Stein et al., 2015). Seventy-two-hour back trajectories were calculated arriving at Providence, RI (41.73∘ N, 71.43∘ W) using the North American Mesoscale (NAM) 12 km meteorology initiated at the end of each sampling period. Atmospheric NHx has a lifetime typically on the order of 2.1 d (Paulot et al., 2016), such that the chosen trajectory time should account for the potential of long-range transport of NHx to the sampling site. A new back trajectory was calculated every 3 h for a maximum of 8 trajectories encompassing the 24 h sampling period at 100 m above ground level.
2.4 Statistical analyses
Geospatial statistical analysis that included bivariate wind direction and wind speed polar plots and back-trajectory clustering was conducted using the “open-air” program package using R (Carslaw and Ropkins, 2012). Local NHx source identification was estimated using the conditional bivariate probability function (CBPF) analysis that provides a conditional probability field for high concentrations dependent on wind speed and direction (Uria-Tellaetxe and Carslaw, 2014). It is defined as the following (Eq. 1):
where mΔθ,Δu is the number of samples in the wind sector Δθ with wind speed interval Δu having concentration C greater than a threshold value x, nΔθ,Δu is the total number of samples in that wind direction–speed interval. The threshold values were set as the top 25 % concentration for these analyses. These bivariate polar plots show how a concentration of species varies with wind speed and direction in polar coordinates and are useful in characterizing emission sources (Carslaw and Ropkins, 2012; Carslaw et al., 2006; Tomlin et al., 2009; Zhou et al., 2019). Additionally, source locations that contribute to long-range NHx transport were evaluated using the potential source contribution function (PSCF). This analysis combines atmospheric concentrations with air mass trajectories and uses residence time information to identify air parcels that contribute to high concentrations at a receptor site (Fleming et al., 2012; Pekney et al., 2006; Begum et al., 2005). The PSCF calculation indicates the probability that a source is located at latitude i and longitude j and is calculated as the following (Eq. 2):
where nij is the number of times that the trajectories pass through the cell (i, j) and mij is the number of times that a source concentration was high when the trajectories passed through the cell (i, j), and the criterion for determining mij was defined as the 90th percentile (Carslaw and Ropkins, 2012).
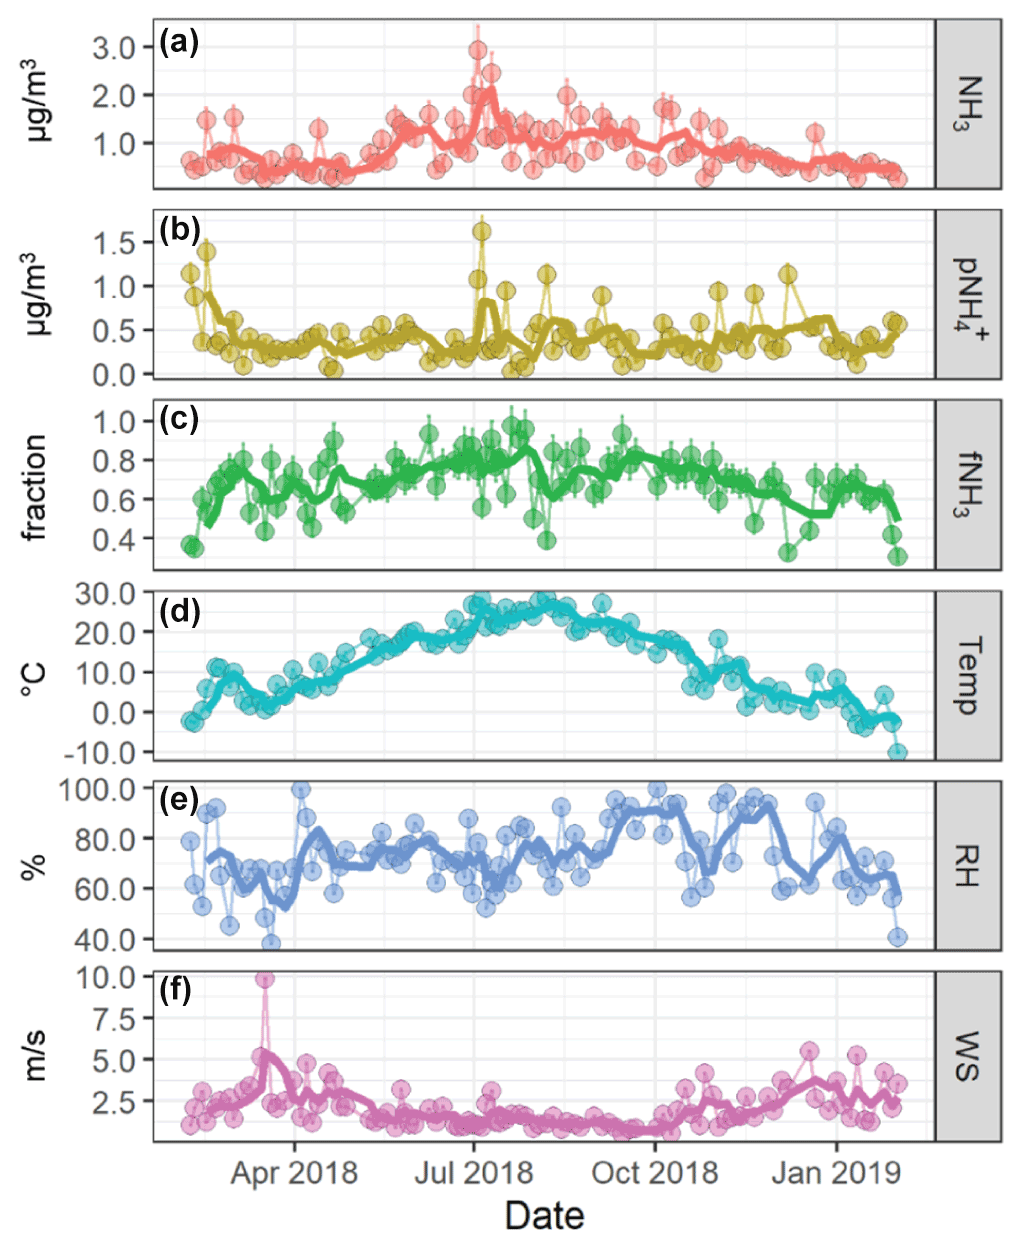
Figure 2Time-series plots of the measured NHx data including (a) NH3, (b) , and (c) fNH3 and the reported meteorology data including (c) temperature (Temp), relative humidity (RH), and wind speed (WS) from February 2018 to February 2019 in Providence, RI, USA. The light data points refer to the 24 h integrated samples (a, b, c) or 24 h averaged meteorology data (d, e, f), and the dark lines represent approximate 2-week moving averages.
3.1 Urban NH3 and temporal concentrations
The urban NH3 and were monitored under a range of meteorological conditions (Fig. 2). The annual NH3 ranged from 0.234 to 2.94 µg m−3 with a mean of 0.890±0.517 µg m−3 (n=97), and ranged from 0.019 to 1.62 µg m−3 with a mean of 0.412±0.287 µg m−3 (n=97). The NHx partitioning between gas and particle phase was quantified as fNH3 (fNH3= NH/(NH mol) and ranged from 0.307 to 0.972 with an average of 0.688±0.141 (n=97). A strong seasonal pattern was observed for both NH3 and fNH3, with the highest values observed during warmer periods. No significant seasonal pattern was observed for that remained relatively consistent throughout each season and characterized by frequent spike events in cold and warm months, including near 4 July, corresponding to a period of significant firework activity.
The NH3 and fNH3 were positively correlated with temperature (r=0.66; p<0.01 & r=0.51; p<0.01; Fig. S1). This relationship was consistent with previous observations in rural and urban locations that suggested NH3 to be influenced by temperature-dependent volatilization (e.g., agriculture, vegetation, sewage, and waste) and evaporation from semi-volatile NH4NO3 particles (Wang et al., 2015; Hu et al., 2014; Yao et al., 2013; Nowak et al., 2006; Yao and Zhang, 2016). Additionally, NH3 was negatively correlated with wind speed (; p<0.01) and mixing height (; p<0.01), indicating the importance of dilution and vertical height to near-surface NH3. The measured was not significantly correlated with any meteorological parameter (Fig. S1). Instead, the annual and seasonal were closely associated with (r=0.69; p<0.01) and (r=0.63; p<0.01). This finding is expected due to the role that NH3 has in neutralizing atmospheric nitric acid and sulfuric acid, leading to aerosols in the form of NH4NO3, NH4HSO4, and NH4SO4.
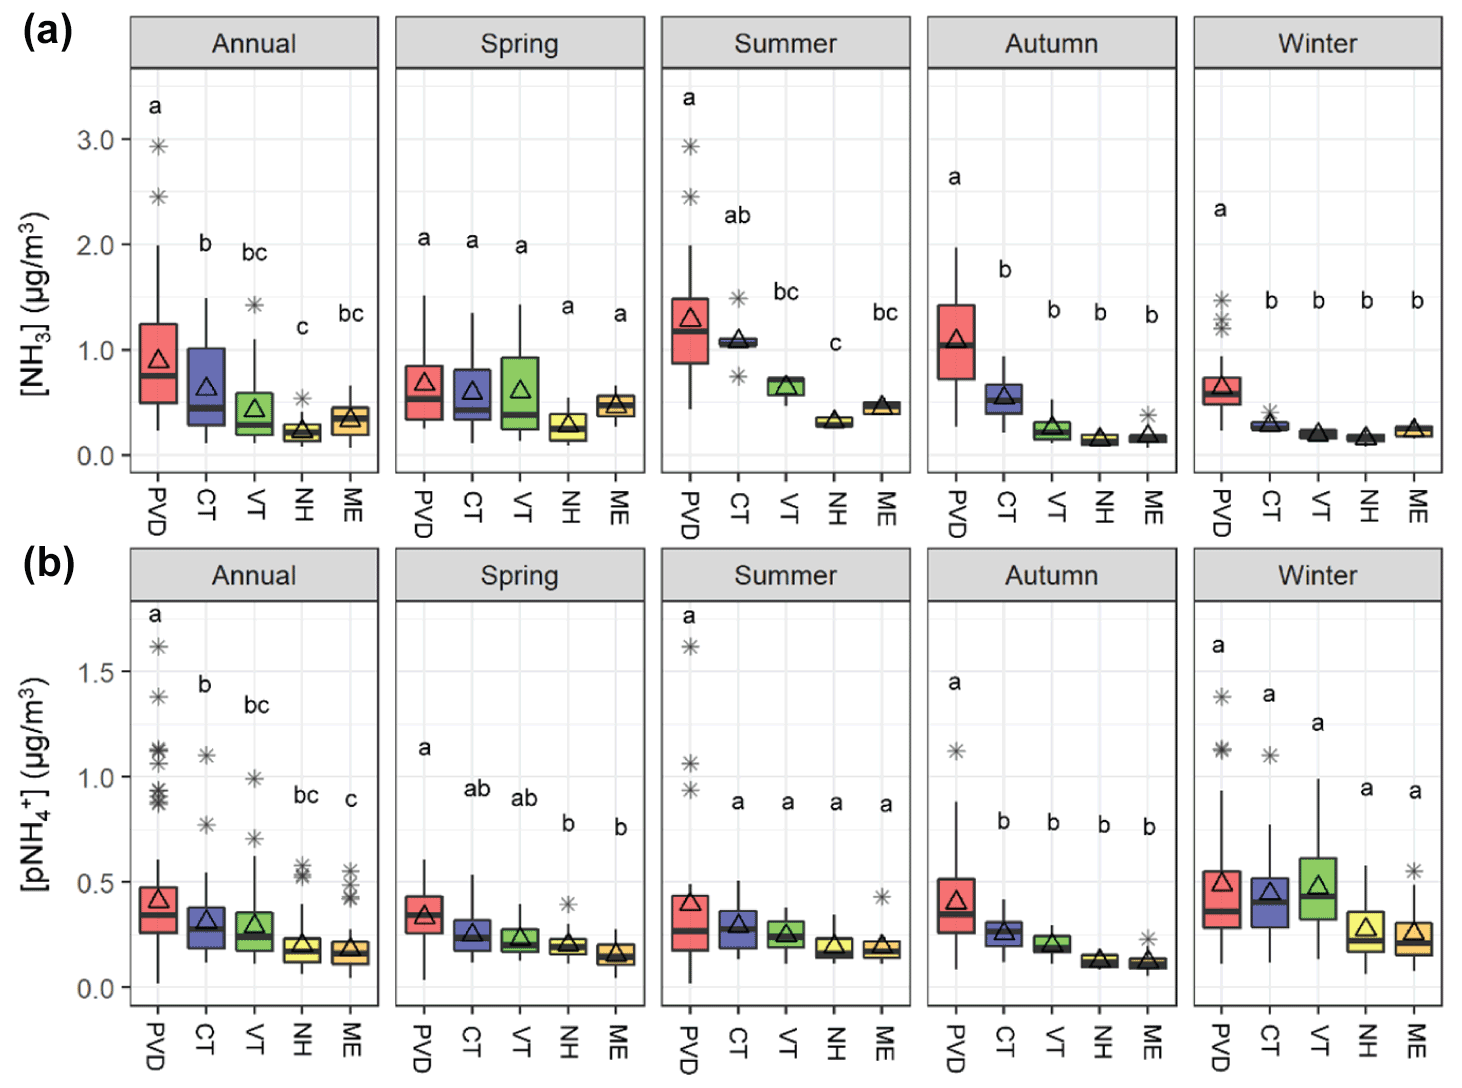
Figure 3Box and whiskers plots that summarize the annual and seasonal (a) NH3 and (b) distributions (lower extreme, lower quartile, median, upper quartile, and upper extreme) with the mean (open triangle) and outlier (black asterisk) at the Providence, RI (PVD) site and the New England AMoN/CASTNET sites including Abington, CT (CT), Underhill, VT (VT), Woodstock, NH (NH), and Ashland, ME (ME). Similar lowercase letters in the box and whiskers plots represent categories with statistically similar values.
3.2 Comparison of urban NH3 and to regional observations
The measured urban NH3 and data from Providence, RI, USA were compared with the nearby regional observations from AMoN/CASTNET sites within New England (Figs. 1 and 3). Overall, the annual average NH3 in Providence, RI was significantly greater (p<0.05) than the regional New England AMoN sites. This finding was generally consistent with the NEI-14 estimates for New England, which tends to show that annual NH3 emission densities were highest for regions near urban locations (Fig. 1). Ammonia (NH3) grouped by season indicates subtle differences in the seasonal profiles at the varying New England sites (Fig. 3a); NH3 at Providence, RI was statistically higher (p<0.05) during winter and autumn than the New England AMoN sites and higher than all sites except for Abington, CT, during summer. During spring, NH3 at Providence, RI was not statistically different from any of the New England AMoN sites, which typically exhibited a springtime NH3 peak that likely reflects the influence and timing of fertilizer application (Felix et al., 2017). We note that there can be large heterogeneity in urban NH3; however, the monitoring site in Providence, RI was specifically chosen since it was away from any direct emission sources and at a raised elevation. The difference in our measured NH3 and reported by AMoN are unlikely to be explained by differences in sampling methodology. We have recently demonstrated that our active denuder sampling technique resulted in NH3 concentrations within 2 %–5 % of that determined from simultaneously deployed passive NH3 collection techniques, which are utilized at AMoN sites (Walters et al., 2020). This result was consistent with previous comparisons between active and passive NH3 sampling techniques (Zhou et al., 2019; Puchalski et al., 2015).
The annual average at the Providence, RI site was also found to be significantly higher than the regional CASTNET sites (p<0.05; Fig. 3b). However, when broken down by season, the Providence, RI site has significantly higher than all the regional CASTNET sites only during autumn (p<0.05). During the winter and summer, the Providence, RI site did not have significantly higher than any of the CASTNET sites. During the spring, was higher in Providence, RI than the two most remote regional CASTNET sites, including Ashland, ME and Woodstock, NH (p<0.05), but not significantly different from the Abington, CT or Underhill, VT sites. It is important to note that methodology differences in the collection of could have significantly influenced the annual differences and seasonal patterns. Our collection method (nylon filter + acid-coated filter) should lead to the quantitative collection of (Walters et al., 2019; Yu et al., 2006). In contrast, collections at the CASTNET sites utilize PTFE filters which could be biased low due to the potential for significant loss of semi-volatile NH4NO3 (Ashbaugh and Eldred, 2004; Yu et al., 2005). The potential for NH4NO3 volatilization should be more significant for warmer temperatures (Ashbaugh and Eldred, 2004; Yu et al., 2005). However, we did not observe a significant difference in summer between the Providence, RI and regional CASTNET sites. Thus, the influence of sampling methodologies on the spatiotemporal patterns remains difficult to quantify.
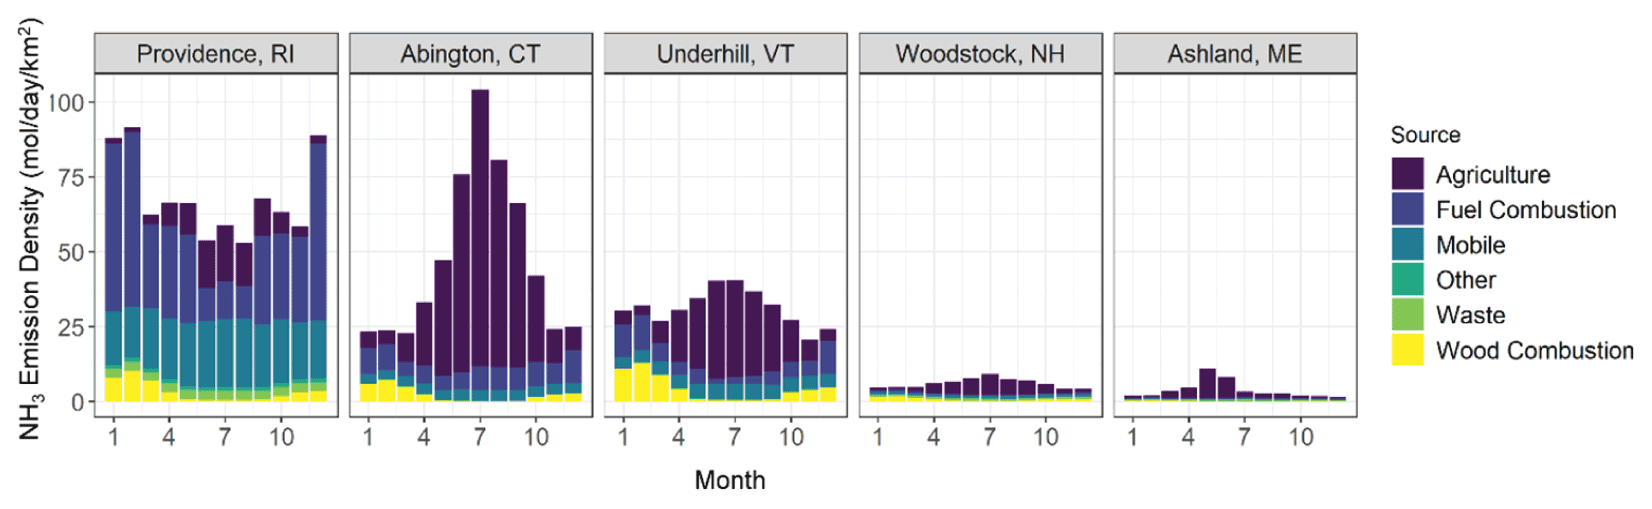
Figure 4Monthly-based NH3 emission densities speciated between agricultural, fuel combustion, mobile, other, waste, and wood combustion computed by the SMOKE model for the NH3 monitoring sites in the counties of New England.
Localized NH3 emissions likely play an important role in contributing to the observed elevated urban NHx and the spatiotemporal patterns across New England (Fig. 4). The NEI-14 emission profiles at the AMoN sites indicated that agricultural activities drive the seasonal NH3 emissions, while non-agricultural sources, including stationary fuel combustion (electricity generating units and residential heating) and vehicles, were important during winter but their relative contributions significantly decreased during warmer periods. In contrast, the annual NH3 emission in Providence, RI were dominated by fuel-combustion emissions. The total NH3 emission density in Providence, RI had less seasonal variability than the regional AMoN/CASTNET locations despite a potential seasonal change in emissions with relatively high contributions from residential heating (i.e., oil, gas, wood combustion) during winter compared to summer. We note that natural gas and oil stationary fuel combustion, which is predicted to be the main NH3 emission source at our urban study site as well as in other major urban areas in regions with a large heating demand (Zhou et al., 2019), has a highly uncertain NH3 emission factor established from limited studies conducted before 1982 (Muzio and Arand, 1976; Cass et al., 1982). Additionally, it has recently been pointed out that vehicle NH3 emission, another major source of urban NH3, might be underpredicted by at least a factor of 2 in the NEI (Sun et al., 2017; Fenn et al., 2018).
3.3 Urban δ15N of urban NHx
Measurements of δ15N at the Providence, RI monitoring site were utilized to enhance understanding of source contributions to urban NHx. The measured δ15N(NH3) ranged from −21.4 ‰ to −2.0 ‰ with an average of (n=90), and δ15N() ranged from −7.4 ‰ to 17.5 ‰ with a mean of 4.9±6.2 ‰ (n=60) (Fig. 5). The measured δ15N data were binned by season that included winter (December, January, February), spring (March, April, May), summer (June, July, August), and autumn (September, October, November). The δ15N(NH3) was statistically higher during spring (, n=21 ()) compared to the other seasons (summer , n=21; autumn , n=21; winter , n=18, p<0.05). The δ15N() also indicated significant seasonality with lower values during summer (0.4±4.9 ‰, n=18) compared to autumn (7.4±4.8 ‰, n=15) and winter (9.0±5.8 ‰ ; n=14) (p<0.05). However, springtime δ15N() (4.1±5.2 ‰, n=13) was not statistically different from any season.
The δ15N of atmospheric NH3 and reflects a combination of source effects from different NH3 emission sources and isotopic equilibrium between NH3 and that has been shown to have a large influence on setting the N isotopic distribution between these molecules (Walters et al., 2018; Savard et al., 2017; Kawashima and Ono, 2019). Indeed, the annual δ15N() was statistically higher than δ15N(NH3) (p<0.01), reflecting the contributions from the nitrogen isotope exchange reactions between NH3 and NH, which tends to elevate the δ15N() relative to δ15N(NH3) (Walters et al., 2018; Kawashima and Ono, 2019; Urey, 1947). The isotope difference or isotope enrichment factor () between δ15N() and δ15N(NH3) was calculated as the following (Eq. 3):
The Δδ15N ranged from −0.1 ‰ to 34.1 ‰ and averaged 17.6±7.8 ‰ (n=56) (Fig. 6). There was a strong seasonal Δδ15N pattern with higher values during colder periods, and Δδ15N was weakly correlated with temperature (, p<0.01; Fig. S1) suggesting that these values were difficult to predict. The observed Δδ15N was significantly lower than the expected temperature-dependent theoretical isotopic equilibrium values between NH3 and NH of 35±3 ‰ at 25 ∘C (Walters et al., 2018) and previous field Δδ15N observations (Savard et al., 2017), indicating that incomplete isotopic equilibrium between NH3 and was achieved at the study site. This result has important implications for previous δ15N source apportionment studies of NH3 and , which commonly utilize an assumed and theoretically calculated phase-dependent fractionation (e.g., Zhang et al., 2021; Pan et al., 2016; Gu et al., 2022a, b; Berner and Felix, 2020). A potential explanation for the observed incomplete isotopic equilibrium would be that localized NH3 emissions perturbed the isotopic equilibrium between NH3 and , which may take tens of minutes to several hours to be achieved (Kim et al., 1993). Indeed, previous laboratory dynamic flow chamber experiments have demonstrated that fresh NH3 emissions tend to result in Δδ15N values below the theoretically predicted value (Kawashima and Ono, 2019). Additionally, there may be other contributing isotope effects between NH3 and , such as the hypothesized kinetic isotope effect associated with NH3 diffusion to an aerosol surface leading to a lower δ15N() value compared to δ15N(NH3) (Pan et al., 2016). The observed Δδ15N seasonality remains difficult to explain. Still, we speculate that it may be related to higher localized emissions of NH3 during warmer periods that perturb the NH3 isotope equilibrium and/or seasonal changes in PM chemical compositions (Pan et al., 2016), such as higher NH4NO3 during colder months.
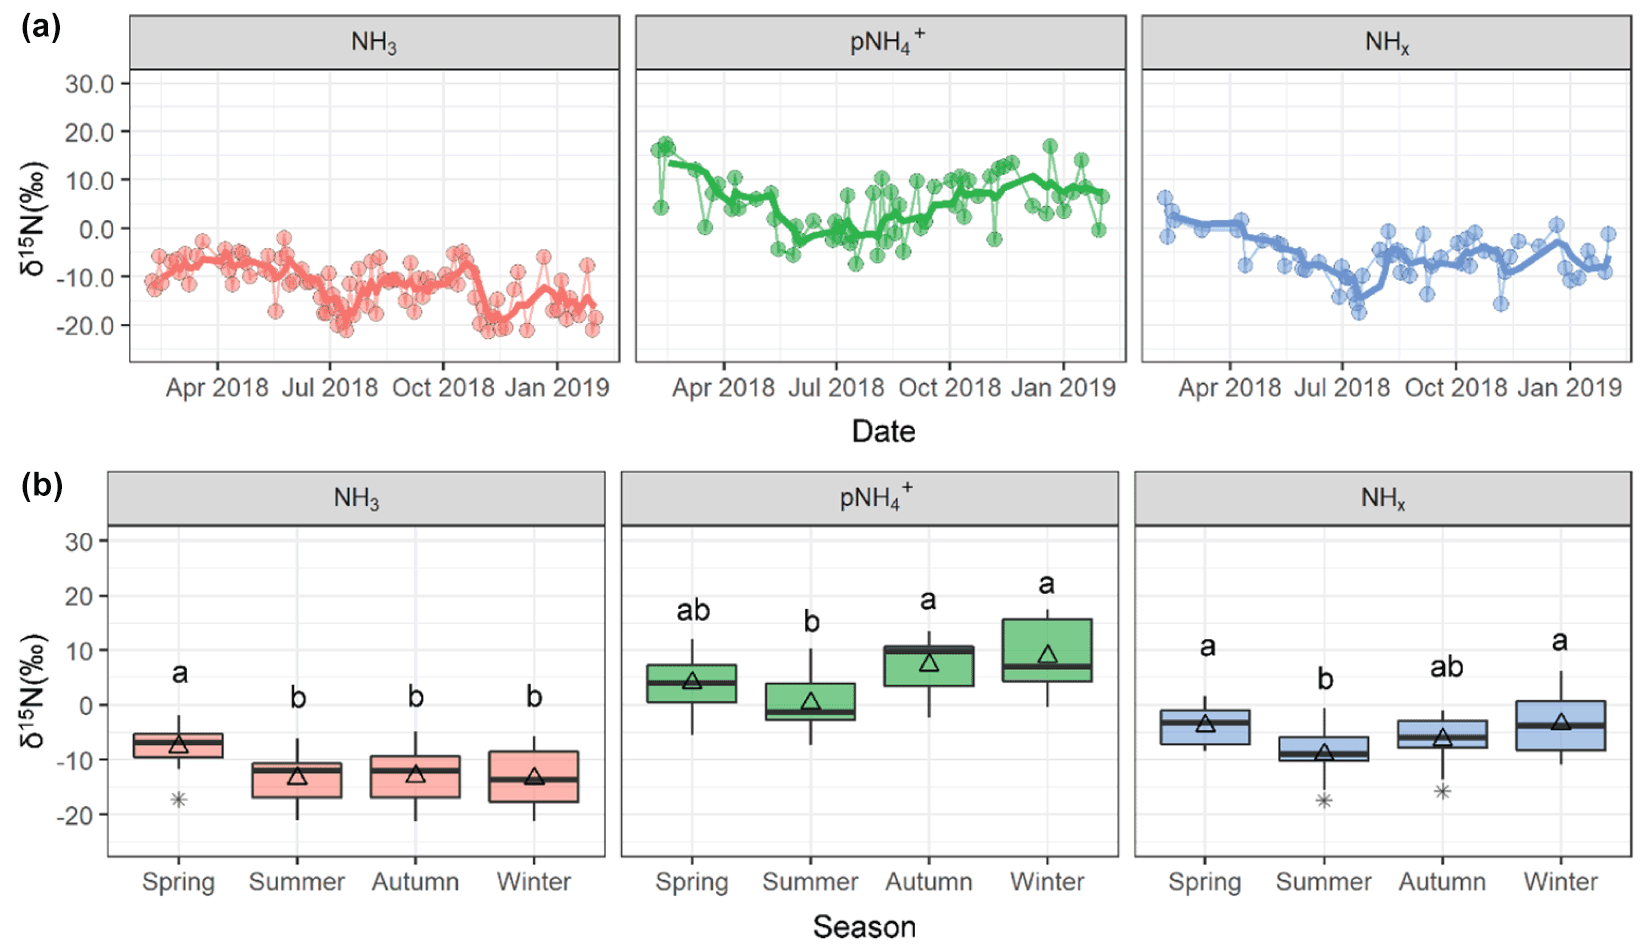
Figure 5Measured δ15N data of NH3, , and NHx collected in Providence, RI, including (a) time series and (b) seasonal box and whisker plots summarizing the distributions (lower extreme, lower quartile, median, upper quartile, and upper extreme) with the mean (open triangle) and outlier (black asterisk). Similar lowercase letters in the box and whisker plots represent categories with statistically similar values.
To account for the complex phase-dependence on δ15N variabilities, we calculated δ15N(NHx) according to the following (Eq. 4):
The annual δ15N(NHx) ranged from −17.4 ‰ to 6.3 ‰ and averaged (n=56) (Fig. 5). There was significant seasonality with lower values during summer (, n=18) compared to winter (, n=13) and spring (, n=10). The autumn δ15N(NHx) (, n=15) was not significantly different from any season. The δ15N(NHx) is independent of the phase δ15N fractionation, such that it should be a robust tracer reflecting the integrated source contributions and physical processing from locally emitted and transported NH3 and . Therefore, the δ15N(NHx) observations would suggest a seasonal change in sources of NHx with increased relative emissions from a source with a high δ15N(NH3) value during the colder periods of winter and spring and a lower δ15N(NH3) value during summer. Vehicle emissions have an elevated δ15N(NH3) value of 6.6±2.1 ‰ (Walters et al., 2020; Song et al., 2021), such that the relative importance of vehicle emissions to NHx in Providence, RI may have increased during colder seasons. The observed δ15N(NHx) decrease during summer and increase in [NH3] might suggest increased emissions from temperature-dependent emission sources with a relatively low δ15N(NH3) signature, such as volatilization (Felix et al., 2013; Freyer, 1978; Heaton, 1987; Chang et al., 2016; Hristov et al., 2009). There were often large δ15N(NHx) variations within each season, which may be related to wind direction shifts and varying contributions from local urban NH3 emission sources and long-range transport of NHx.
The physical processing of NH3 could have also played an important role in the observed δ15N(NHx) seasonal trends. The enrichment factor associated with NH3 dry deposition has not been measured directly. Still, it has been suggested to be low (∼4 ‰) based on the physical processing of NH3 in a vehicle tunnel (Walters et al., 2020). This result would suggest that as NH3 undergoes dry deposition, the pool of δ15N(NH3) in the atmosphere becomes slightly depleted as the heavier 15NH3 is preferentially deposited. The increased temperatures during summer and autumn would have increased the amount of dry deposited NH3 that re-volatilized into the atmosphere (Behera et al., 2013). Ammonia (NH3) volatilization has been shown to have a significant fractionation effect leading to the emission of NH3 depleted in 15N (Hristov et al., 2009; Frank et al., 2004). Further work is needed to refine our understanding of the bidirectional exchange of NH3 and its impact on δ15N; however, we expect this process would have contributed to lower δ15N(NHx) values during the warmer periods due to increased temperature-dependent NH3 volatilization.
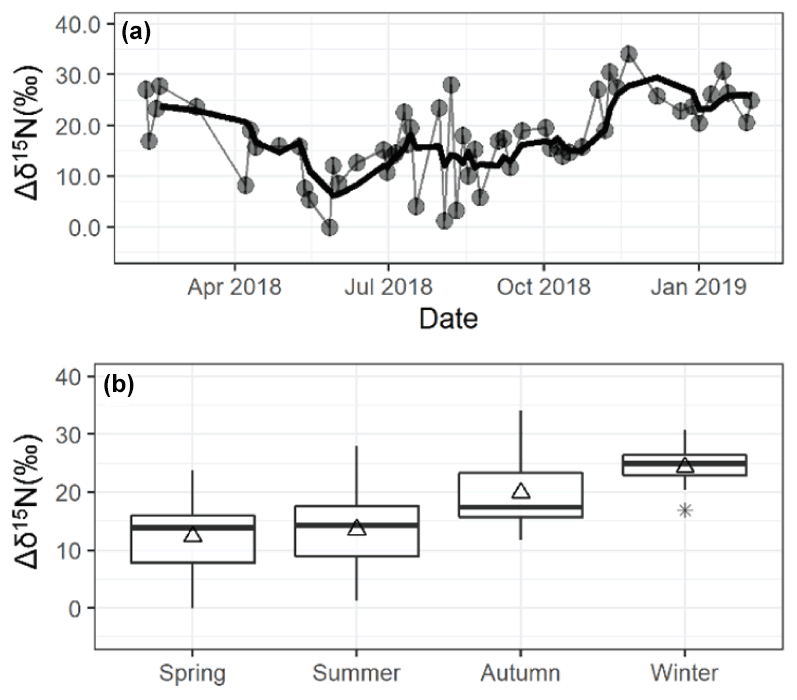
Figure 6Seasonal Δδ15N data at the monitoring site in Providence, RI. In panel (a), the light data points and lines represent the observations, and the thick lines are four-point (∼2 weeks) moving averages. Panel (b) shows a box and whisker plot summarizing the seasonal distributions (lower extreme, lower quartile, median, upper quartile, and upper extreme) with the mean (open triangle) and outlier (black asterisk).
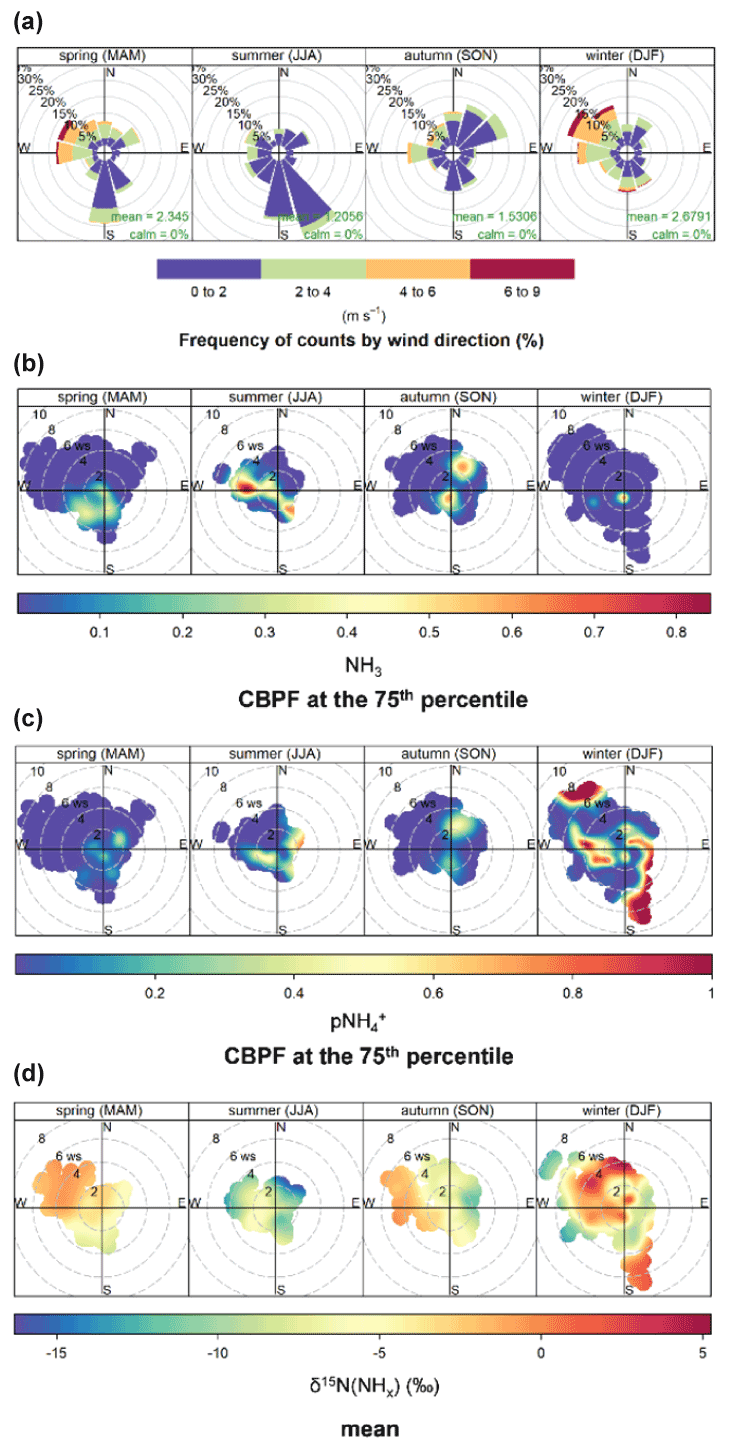
Figure 7Overview of (a) wind rose plots and polar bivariate (wind direction and wind speed) plots of the conditional bivariate probability function (CBPF) for (b) NH3 and (c) , and (d) mean δ15N(NHx) in Providence, RI, sorted by season.
3.4 Identifying urban local sources of NHx
Wind data and bivariate plot statistical analysis were utilized to investigate local and transported sources of urban NHx. The local wind data indicated a clear shift in wind direction and speed from generally faster winds from the west/northwest during winter to slower winds from the south/southeast and northeast during summer (Fig. 7). Wind direction and wind speed polar bivariate CBPF plots of NH3 and indicated relatively high probability under conditions of low wind speeds (i.e., <2 m s−1) for all seasons, suggesting the importance of local emitted NH3 sources and formation. These elevated CBPF probabilities were also associated with winds from the southeast to west, the direction of I-195 and I-95, major interstate highways, and industrial sources (Fig. 1). The highest δ15N(NHx) values within each season were observed with winds from these directions, implicating the importance of vehicle emissions, which have an elevated δ15N(NH3) signature of 6.6±2.1 ‰ compared to other NH3 sources that tend to have δ15N(NH3) values below 0 ‰, including available industrial δ15N(NH3) emissions (Walters et al., 2020).
Additionally, high conditional probability function (CPF) probabilities for both NH3 and were observed during the warmer seasons of summer and autumn from moderate winds (2–4 m s−1) from the northeast and west. This result may implicate local temperature-dependent NH3 emission sources such as sewage lines, trash cans, soil emissions from green spaces, and regional transport (Hu et al., 2014; Sutton et al., 2000; Pandolfi et al., 2012; Reche et al., 2012; Meng et al., 2011; Galán Madruga et al., 2018; Zhou et al., 2019). These winds were associated with a relatively low δ15N(NHx), consistent with volatilization contributions with a low δ15N(NH3) emission signature between −56.1 ‰ to −10.3 ‰ based on livestock waste and fertilizer studies (Heaton, 1987; Freyer, 1978; Felix et al., 2013; Chang et al., 2016). Low CPF probabilities for both NH3 and were generally associated with high wind speeds (i.e., >4 m s−1), reflecting the dilution of these pollutants and strong background mixing. An exception to this trend was observed for during the winter, with elevated CPF probabilities with high wind speeds indicating the importance of long-range transport. Interestingly, there was a seasonal difference in δ15N(NHx) from this wind profile, with high values during the cold seasons and low values during summer, suggesting that the background NHx had larger contributions from vehicle emissions and volatilization during the cold and warm seasons, respectively.
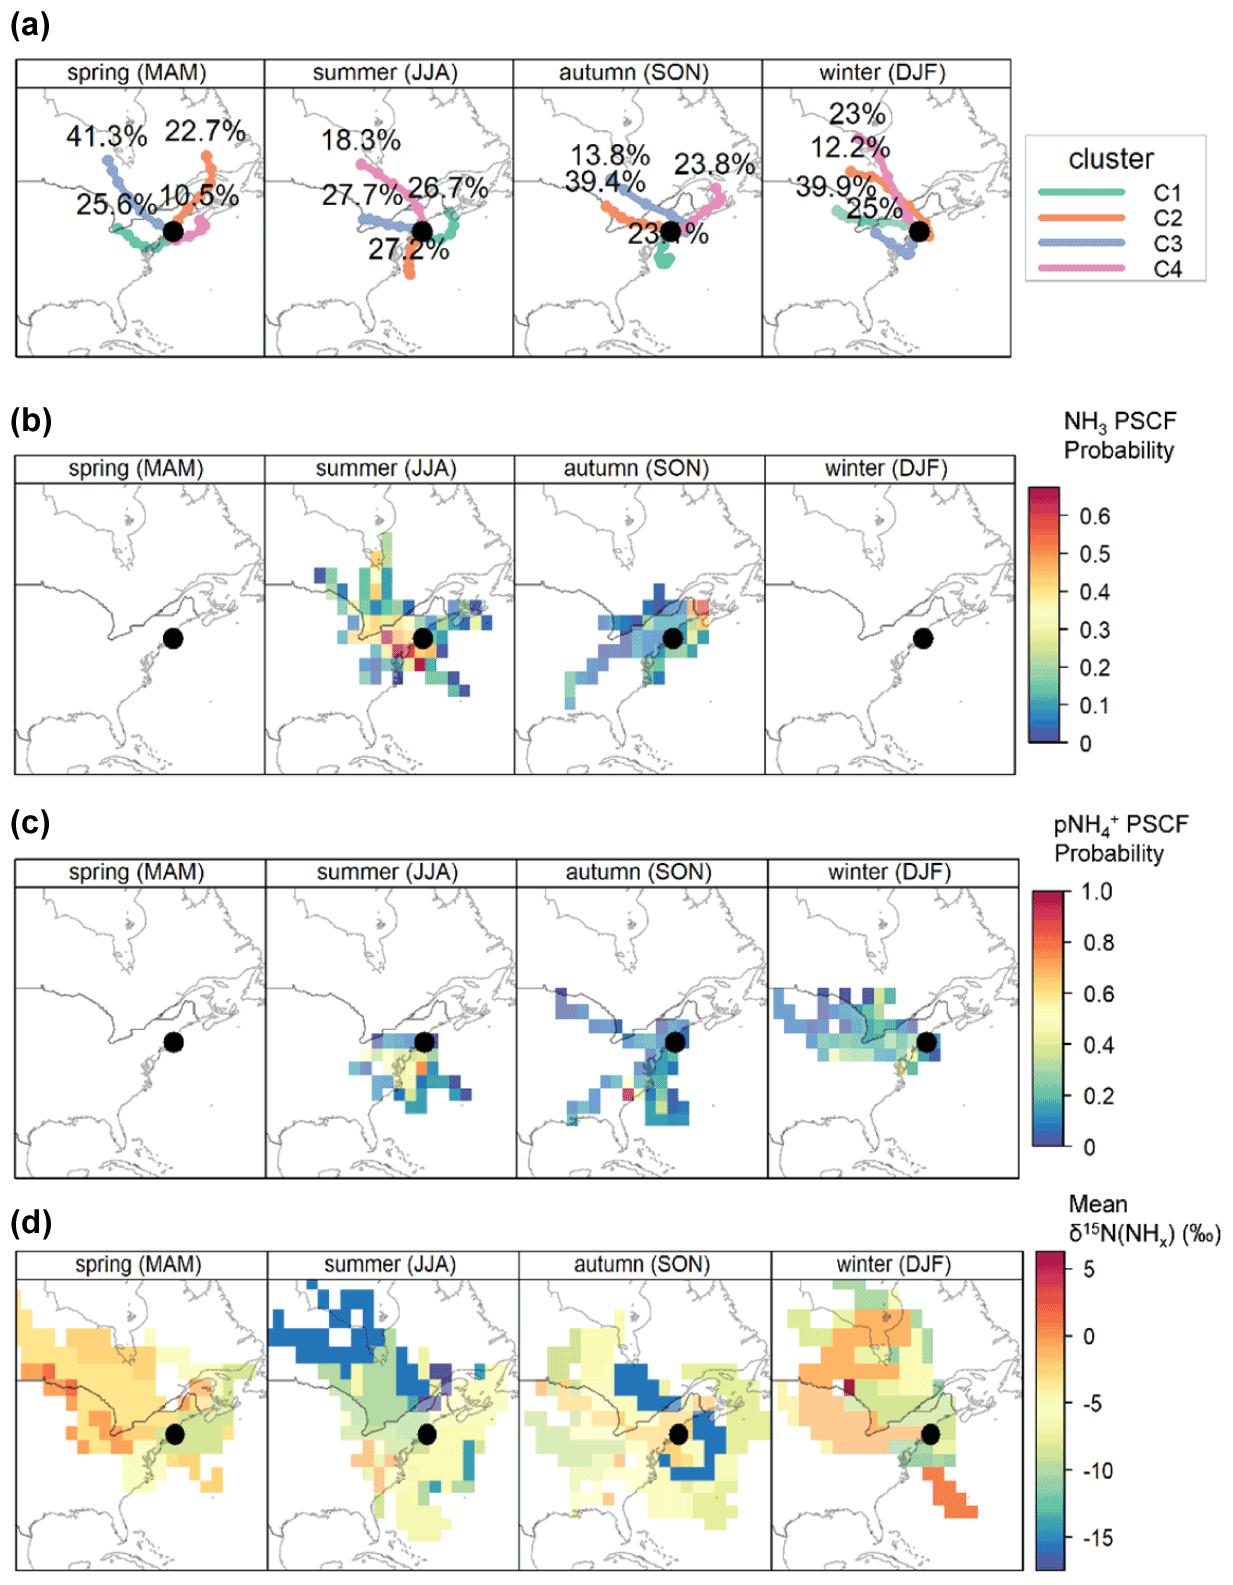
Figure 8Influence of long-range transport including (a) clustered seasonal air mass back trajectories, (b) seasonal NH3 potential source contribution function (PSCF) probability, (c) seasonal NH3 PSCF probability, and (d) seasonal air mass back trajectory δ15N(NHx) mean values.
3.5 Role of long-range transport as a source of urban NHx
Air mass back trajectories and PSCF analysis were utilized to identify source locations of transported NH3 and to Providence, RI. The clustered seasonal air mass back trajectories indicated a shift in the seasonal air mass origin, with winds originating from the north and west during winter with higher contributions of air masses derived from the south and along the coast during summer (Fig. 8). During summer and autumn, potentially significant NH3 and source regions originated over the Mid-Atlantic, Midwestern USA (the Midwest), Atlantic coast, Southeastern USA, Southeastern Ontario, and Southeastern Quebec. These regions have significant agricultural-related NH3 emissions, such as fertilizer application, livestock waste, and significant urban and industrial activities. Transport from these regions tended to have relatively low mean δ15N(NHx) values (i.e., −15 ‰ to −5 ‰), consistent with transport of volatilized agricultural NH3 emissions that favor the release of isotopically light 14NH3 (Heaton, 1987; Freyer, 1978; Felix et al., 2013; Chang et al., 2016) and available industrial emissions with a reported low δ15N(NH3) value of −20.1 ‰ from a steel factory (Heaton, 1987). We also note that NH3 deposition and re-volatilization during transport of any NH3 emission source may also lead to significant isotope fractionation as NH3 is transported downwind. Because NH3 volatilization has been shown to lead to the initial release of NH3 depleted in 15N, it is reasonable to assume that this long-range transported NH3 would contribute low δ15N(NH3) (Frank et al., 2004; Hristov et al., 2009). Thus, low δ15N(NH3) values from the identified important contribution regions during the warmer seasons may also reflect the bidirectional exchange of NH3 as it is long-range transported downwind from agricultural, urbanized, and industrialized regions. Available ground-based monitoring data indicate that the identified source regions tend to have elevated ambient NH3 and , consistent with these regions as potential NH3 and source contributors to Providence, RI (Fig. S2). Additionally, the Atlantic coast may represent contributions from ocean NH3 flux expected to increase during warmer periods (Paulot et al., 2015), which has been suggested to have low δ15N values (Jickells et al., 2003).
Elevated PSCF probabilities were identified for during the winter from the Mid-Atlantic and the Midwest, which is consistent with available ground-based observations that tend to peak during this period due to ambient conditions that favor the formation of NH4NO3 (Fig. S2). This transport region tended to have relatively high mean δ15N(NHx) values (e.g., −5 ‰ to 0 ‰) from the Midwest and relatively low mean from the Mid-Atlantic (). Across USA, NH3 was lowest during winter due to decreased agricultural activities (Fig. S2). Indeed, the NEI-14 indicates that the relative importance of non-agricultural NH3 sources increases during winter (Fig. 4), such that the higher δ15N(NHx) values deriving from the Midwest may reflect the regional importance of sources with an elevated δ15N(NH3) value such as vehicles and/or fuel combustion. Lower mean δ15N(NHx) values derived from the Mid-Atlantic may suggest that agricultural emissions such as animal housing remain an important wintertime NHx source contributor to Providence, RI. Additionally, there could be contributions from stationary fuel combustion that have a reported δ15N(NH3) signature of −14.6 ‰ to −11.3 ‰ (Felix et al., 2013), and contributions from upwind volatilized NH3 emissions from Canada.
3.6 Urban NHx source apportionment
The NHx source contributions at Providence, RI, including local and transported emissions, were quantified using a stable isotope mixing model (SIMMR; Parnell et al., 2010). The model was initiated using the measured δ15N(NHx) values and assuming that vehicles, volatilization, stationary fuel combustion (i.e., residential fuel combustion, industrial fuel combustion, energy generating units), and industry were the main sources, as evidenced by the local wind direction and back trajectory analysis and the NEI-14 predictions. Biomass burning, while a significant global source of NH3 (Behera et al., 2013), was not considered in the mixing model since there was insufficient evidence from the local wind direction and long-range transport analysis that it was a major contributing source to our study location. Further, the NEI-14 predicted residential wood combustion represented less than 5 % of the annual emission of NH3 in the Providence County, with seasonal variation, including higher relative emissions during the colder months (Fig. 4). Still, potassium (K+), a common biomass burning tracer, from PM2.5 samples collected from the nearby CSN site in East Providence, RI, was not significantly correlated with NH3 (r=0.019; p=0.857) and weakly correlated with (r=0.233; p=0.022), excluding an outlier on 4 July (Fig. S3). We acknowledge that there are additional miscellaneous NH3 sources in an urban environment, including pets, household products, and humans (Ampollini et al., 2019; Sutton et al., 2000; Li et al., 2020); however, we assumed that these sources were negligible compared to the main identified emission sources. Excluding biomass burning and other miscellaneous sources of NH3 was not expected to impact the goal of the mixing model calculations, which was to estimate the relative amounts of the main identified NH3 emission sources and their temporal variation at the study site in Providence, RI.
The source apportionment results are sensitive to the number of considered sources, their designated δ15N(NH3) emission signatures, and uncertainty. The input δ15N(NH3) emission source signatures were deliberately chosen from sampling methodologies that have utilized active sampling approaches, as it has been well-documented from several studies that passive samplers result in a δ15N(NH3) bias and could be unreliable (Pan et al., 2020; Kawashima et al., 2021; Walters et al., 2020). Fertilization application is a significant source of NH3 emissions globally and within USA. However, fertilizer application represents a small component of the overall agricultural emissions at our site (∼1.8 %) and within our region (7.1 %; US EPA Region 1) based on the NEI-14. Further, fertilization-related NH3 emissions tend to peak during spring; however, we neither identified any significant NHx long-range transport region nor observed a relative decrease in δ15N(NHx) during spring, which would be consistent with a suspected low fertilizer volatilization δ15N(NH3) emission signature. Thus, fertilizer application was not directly considered in our source apportionment model but lumped into the considered volatilization category.
The input source values for vehicles, stationary fuel combustion/industry, and volatilization were fixed at 6.6±2.1 ‰ (Walters et al., 2020), (Heaton, 1987; Freyer, 1978), and (Freyer, 1978; Heaton, 1987; Hristov et al., 2009; Frank et al., 2004). Stationary fuel combustion and industry δ15N(NH3) emission signatures were grouped due to their similar values (Sect. S1 in the Supplement). The volatilization δ15N(NH3) emission signature represents integrated volatilization measurements conducted in animal sheds (Freyer, 1978; Heaton, 1987), and measurements that include monitoring volatilization as a function of time, which indicate significant δ15N(NH3) variability (Hristov et al., 2009; Frank et al., 2004). The volatilization category represented waste volatilization from agricultural activities and urban sources (i.e., sewer, trash, green spaces) and transported NH3 that has re-volatilized to the atmosphere because of NH3 bidirectional exchange. Further details on our rationale for the chosen source δ15N values are provided in the “Supporting information” section (Sect. S1).
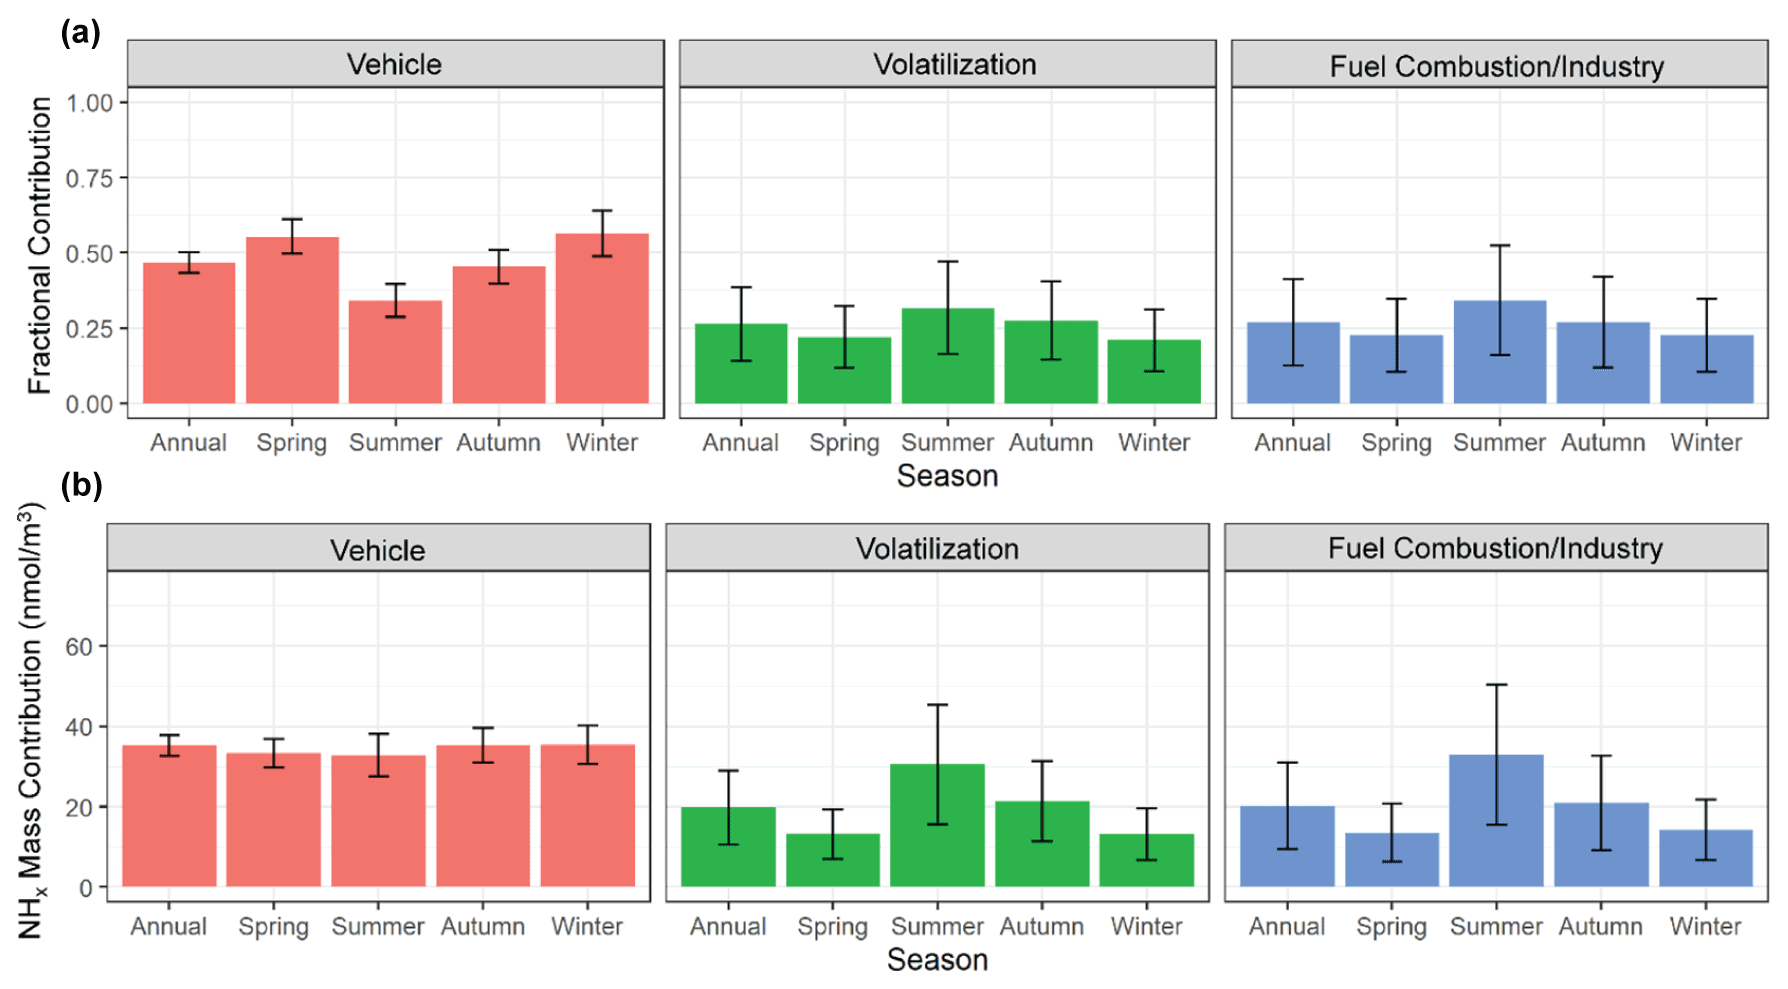
Figure 9The calculated mean (a) fractional contribution and (b) mass-weighted contribution of the major identified emission sources (vehicle, volatilization, fuel combustion/industry) to NHx in Providence, RI, utilizing a stable isotope mixing model (SIMMR). The error bars represent the standard deviation of the model simulations.
The mixing model predicts the relative fractional contributions of vehicles, volatilization, and stationary fuel combustion/industry emissions of (mean ±σ) 46.8±3.5 %, 26.3±12.3 %, and 26.9±14.4 % to the annual NHx background in Providence, RI (Fig. 9a). The relative contribution of vehicle emissions had a strong seasonal profile with higher contributions during the colder seasons of winter (56.4±7.6 %) and spring (55.4±5.8 %) compared to the warmer seasons of summer (34.1±5.5 %) and autumn (45.4±5.5 %). The relative contribution for volatilization and stationary fuel combustion/industry was predicted to peak during summer with means of 31.7±15.4 % and 34.2±18.2 %, compared to winter with means of 20.9±10.3 %, 22.6±12.1 %, respectively. The annual and seasonal mass-weighted contributions of the considered sources were calculated utilizing the NHx concentrations (Fig. 9b). Overall, vehicles tended to be a consistent source of urban NHx with contributions of 35.2±2.6, 33.3±3.5, 32.8±5.3, 35.2±4.3, and 35.4±4.8 nmol m−3 for the annual, spring, summer, autumn, and winter, respectively. The mass-weighted contributions for both volatilization and fuel combustion follow their relative fractional profiles with significant seasonal patterns that peaked during summer compared to winter, respectively. Based on the NEI-14, wind direction, and long-range transport analysis (Figs. 4, 7, and 8), we suspect the relative contribution of vehicle emissions diminished during summer due to the increased importance of temperature-dependent NH3 volatilization emissions, increased energy consumption due to cooling demands, and/or change in transport over heavily industrialized regions such as highly urbanized Toronto and the East Coast shoreline. The exact NH3 volatilization source remains unclear. However, there was evidence of significant contributions from local urban volatilization (i.e., sewage, waste, urban green spaces) and long-range transport from regional agricultural regions and over the ocean.
The source apportionment results were compared with the predicted NH3 emissions from the NEI-14. We acknowledge that this comparison may not yield quantitative results because the NEI-14 was at a county-level resolution, and our single study site may not represent all the county-level NH3 emission predictions; however, this comparison may yield a qualitative understanding in the uncertainties of urban NHx. Overall, the seasonally consistent mass-weighted contribution of vehicle emissions from the mixing model source apportionment results was consistent with the NEI-14 that predicts nearly uniform vehicle emissions throughout the year (Fig. 4). However, the NEI-14 predicts a lower contribution of annual vehicle emissions in our study location of 31.9 % compared to our mixing model results (46.8±3.5 %). Our mixing model source apportionment results indicate a relatively low fractional and mass-weighted contribution for stationary fuel combustion for winter. Contrastingly, the NEI-14 indicated that residential fuel (natural gas and oil) combustion was the largest emission source of NH3 at our study site, the rural CASTNET sites, and other cities during periods of significant heating demands (Zhou et al., 2019). While we acknowledge that the stationary fuel combustion δ15N(NH3) emission signatures were uncertain, the mixing model and seasonal NH3 results would suggest that residential NH3 emissions were overpredicted in the NEI-14, while vehicle emissions may be underpredicted. Thus, vehicle and fuel-combustion emission factors may need to be revisited to more accurately model urban NH3 and predict its human and ecological impacts.
Elevated urban NHx concentrations were observed in Providence, RI, relative to regional background monitoring stations in New England. Mixing model δ15N(NHx) source apportionment results utilizing δ15N(NHx) suggest that vehicles represent an important source of urban NHx with strong seasonal variability. The relative contribution of vehicle emissions was highest during winter/spring, which is significant because NH3 emissions may contribute to the elevated PM2.5 observed during this time in the Eastern USA (Shah et al., 2018). Reductions in vehicle ammonia emissions may represent a promising way to mitigate the adverse impacts of elevated urban NH3 concentrations and yield positive benefits for ecosystems and human health. However, vehicle NH3 emissions result from the technology used to combat vehicle NOx and CO emissions. Decreasing vehicle NH3 emissions may not be achievable until vehicle-fleet electrification. Expanding national observational networks to include urban measurements of NH3 and δ15N(NHx) are needed to monitor urban trends and design future regulatory NH3 fossil-fuel-related emission reductions.
This work demonstrated that nitrogen isotopic analysis allows for further refinement of our understanding and quantification of urban NHx sources, laying the foundation for future source apportionment studies. Utilizing a laboratory-verified collection method suitable for NHx speciation and isotope analysis was critical for accurate source apportionment due to the observed complex phase-dependent δ15N isotope fractionation between NH3 and . Future studies should improve our understanding of the drivers behind NH3 and phase δ15N fractionation, including controlled chamber studies and field observations, which may also provide important insights into controls on NH3 gas-to-particle-phase conversion. Still, this work highlights the need to improve our δ15N(NH3) emission source values, particularly for our volatilization, industry, and fuel-combustion sources, to enhance the quality of the source apportionment results.
Data presented in this article are available on the Harvard Dataverse at https://doi.org/10.7910/DVN/JHMBRI (Walters, 2022) and in the Supplement.
The supplement related to this article is available online at: https://doi.org/10.5194/acp-22-13431-2022-supplement.
WWW, MK, and MGH designed varying aspects of the field sampling plan. WWW, MK, and DEB carried out the field measurements. WWW, MK, and DEB conducted all laboratory analyses of data. EW contributed spatial analysis of data. BHB contributed emission modeling of the presented data. WWW prepared the article with contributions from all co-authors.
The contact author has declared that none of the authors has any competing interests.
Publisher's note: Copernicus Publications remains neutral with regard to jurisdictional claims in published maps and institutional affiliations.
We thank Ruby Ho for sampling and laboratory assistance. We are grateful to Paul Theroux of RI-DEM/RI-DOH for access and support at the RI-DEM air-monitoring sites.
This research has been supported by the National Science Foundation (grant no. AGS-1624618) and the Institute at Brown for Environment and Society, Brown University (grant no. GR300123).
This paper was edited by Drew Gentner and reviewed by two anonymous referees.
Ampollini, L., Katz, E. F., Bourne, S., Tian, Y., Novoselac, A., Goldstein, A. H., Lucic, G., Waring, M. S., and DeCarlo, P. F.: Observations and Contributions of Real-Time Indoor Ammonia Concentrations during HOMEChem, Environ. Sci. Technol., 53, 8591–8598, https://doi.org/10.1021/acs.est.9b02157, 2019.
Ashbaugh, L. L. and Eldred, R. A.: Loss of particle nitrate from teflon sampling filters: effects on measured gravimetric mass in California and in the IMPROVE network, J. Air Waste Manage., 54, 93–104, https://doi.org/10.1080/10473289.2004.10470878, 2004.
Baek, B. H. and Seppanen, C.: CEMPD/SMOKE: SMOKE v4.8.1 Public Release (January 29, 2021), Zenodo, https://doi.org/10.5281/zenodo.4480334, 2021.
Begum, B. A., Kim, E., Jeong, C.-H., Lee, D.-W., and Hopke, P. K.: Evaluation of the potential source contribution function using the 2002 Quebec forest fire episode, Atmos. Environ., 39, 3719–3724, 2005.
Behera, S. N. and Sharma, M.: Investigating the potential role of ammonia in ion chemistry of fine particulate matter formation for an urban environment, Sci. Total Environ., 408, 3569–3575, 2010.
Behera, S. N., Sharma, M., Aneja, V. P., and Balasubramanian, R.: Ammonia in the atmosphere: a review on emission sources, atmospheric chemistry and deposition on terrestrial bodies, Environ. Sci. Pollut. R., 20, 8092–8131, 2013.
Berner, A. H. and Felix, J. D.: Investigating ammonia emissions in a coastal urban airshed using stable isotope techniques, Sci. Total Environ., 707, 134952, https://doi.org/10.1016/j.scitotenv.2019.134952, 2020.
Bhattarai, N., Wang, S., Xu, Q., Dong, Z., Chang, X., Jiang, Y., and Zheng, H.: Sources of gaseous NH3 in urban Beijing from parallel sampling of NH3 and , their nitrogen isotope measurement and modeling, Sci. Total Environ., 747, 141361, https://doi.org/10.1016/j.scitotenv.2020.141361, 2020.
Böhlke, J. K. and Coplen, T. B.: Reference and intercomparison materials for stable isotopes of light elements, in: Proceedings of the IAEA-TECDOC-825 Consultants Meeting Held in Vienna, Vienna, Austria, 1–3 December 1993.
Bohlke, J. K., Gwinn, C. J., and Coplen, T. B.: New Reference Materials for Nitrogen-Isotope-Ratio Measurements, Geostandard. Newslett., 17, 159–164, https://doi.org/10.1111/j.1751-908X.1993.tb00131.x, 1993.
Böhlke, J. K., Smith, R. L., and Hannon, J. E.: Isotopic analysis of N and O in nitrite and nitrate by sequential selective bacterial reduction to N2O, Anal. Chem., 79, 5888–5895, 2007.
Bouwman, A. F., Lee, D. S., Asman, W. A. H., Dentener, F. J., Van Der Hoek, K. W., and Olivier, J. G. J.: A global high-resolution emission inventory for ammonia, Global Biogeochem. Cy., 11, 561–587, 1997.
Cao, H., Henze, D. K., Cady-Pereira, K., McDonald, B. C., Harkins, C., Sun, K., Bowman, K. W., Fu, T.-M., and Nawaz, M. O.: COVID-19 Lockdowns Afford the First Satellite-Based Confirmation That Vehicles Are an Under-recognized Source of Urban NH3 Pollution in Los Angeles, Environ. Sci. Technol. Lett., 9, 3–9, https://doi.org/10.1021/acs.estlett.1c00730, 2021.
Carslaw, D. C. and Ropkins, K.: Openair–an R package for air quality data analysis, Environ. Modell. Softw., 27, 52–61, 2012.
Carslaw, D. C., Beevers, S. D., Ropkins, K., and Bell, M. C.: Detecting and quantifying aircraft and other on-airport contributions to ambient nitrogen oxides in the vicinity of a large international airport, Atmos. Environ., 40, 5424–5434, 2006.
Cass, G. R., Gharib, S., Peterson, M., and Tilden, J. W.: The origin of ammonia emissions to the atmosphere in an urban area, Open file report, 82–6, 1982.
Chang, Y., Liu, X., Deng, C., Dore, A. J., and Zhuang, G.: Source apportionment of atmospheric ammonia before, during, and after the 2014 APEC summit in Beijing using stable nitrogen isotope signatures, Atmos. Chem. Phys., 16, 11635–11647, https://doi.org/10.5194/acp-16-11635-2016, 2016.
Decina, S. M., Templer, P. H., Hutyra, L. R., Gately, C. K., and Rao, P.: Variability, drivers, and effects of atmospheric nitrogen inputs across an urban area: emerging patterns among human activities, the atmosphere, and soils, Sci. Total Environ., 609, 1524–1534, 2017.
Decina, S. M., Hutyra, L. R., and Templer, P. H.: Hotspots of nitrogen deposition in the world's urban areas: a global data synthesis, Front. Ecol. Environ., 18, 92–100, https://doi.org/10.1002/fee.2143, 2020.
Felix, D. J., Elliott, E. M., Gish, T. J., McConnell, L. L., and Shaw, S. L.: Characterizing the isotopic composition of atmospheric ammonia emission sources using passive samplers and a combined oxidation-bacterial denitrifier approach, Rapid Commun. Mass Spectrom., 27, 2239–2246, 2013.
Felix, J. D., Elliott, E. M., and Gay, D. A.: Spatial and temporal patterns of nitrogen isotopic composition of ammonia at U.S. ammonia monitoring network sites, Atmos. Environ., 150, 434–442, https://doi.org/10.1016/j.atmosenv.2016.11.039, 2017.
Fenn, M. E., Bytnerowicz, A., Schilling, S. L., Vallano, D. M., Zavaleta, E. S., Weiss, S. B., Morozumi, C., Geiser, L. H., and Hanks, K.: On-road emissions of ammonia: An underappreciated source of atmospheric nitrogen deposition, Sci. Total Environ., 625, 909–919, https://doi.org/10.1016/j.scitotenv.2017.12.313, 2018.
Fleming, Z. L., Monks, P. S., and Manning, A. J.: Untangling the influence of air-mass history in interpreting observed atmospheric composition, Atmos. Res., 104, 1–39, 2012.
Frank, D. A., Evans, R. D., and Tracy, B. F.: The role of ammonia volatilization in controlling the natural 15N abundance of a grazed grassland, Biogeochemistry, 68, 169–178, https://doi.org/10.1023/B:BIOG.0000025736.19381.91, 2004.
Freyer, H. D.: Seasonal trends of and nitrogen isotope composition in rain collected at Jülich, Germany, Tellus, 30, 83–92, 1978.
Galán Madruga, D., Fernandez Patier, R., Puertas, S., García, R., and Cristóbal López, A.: Characterization and local emission sources for ammonia in an urban environment, B. Environ. Contam. Tox., 100, 593–599, 2018.
Galloway, J. N., Dentener, F. J., Capone, D. G., Boyer, E. W., Howarth, R. W., Seitzinger, S. P., Asner, G. P., Cleveland, C., Green, P., and Holland, E.: Nitrogen cycles: past, present, and future, Biogeochemistry, 70, 153–226, 2004.
Gu, M., Pan, Y., Sun, Q., Walters, W. W., Song, L., and Fang, Y.: Is fertilization the dominant source of ammonia in the urban atmosphere?, Sci. Total Environ., 838, 155890, https://doi.org/10.1016/j.scitotenv.2022.155890, 2022a.
Gu, M., Pan, Y., Walters, W. W., Sun, Q., Song, L., Wang, Y., Xue, Y., and Fang, Y.: Vehicular Emissions Enhanced Ammonia Concentrations in Winter Mornings: Insights from Diurnal Nitrogen Isotopic Signatures, Environ. Sci. Technol., 56, 1578–1585, https://doi.org/10.1021/acs.est.1c05884, 2022b.
Heaton, T. H. E.: 15N14N ratios of nitrate and ammonium in rain at Pretoria, South Africa, Atmos. Environ., 21, 843–852, 1987.
Hristov, A. N., Zaman, S., Vander Pol, M., Ndegwa, P., Campbell, L., and Silva, S.: Nitrogen losses from dairy manure estimated through nitrogen mass balance and chemical markers, J. Environ. Qual., 38, 2438–2448, 2009.
Hu, Q., Zhang, L., Evans, G. J., and Yao, X.: Variability of atmospheric ammonia related to potential emission sources in downtown Toronto, Canada, Atmos. Environ., 99, 365–373, https://doi.org/10.1016/j.atmosenv.2014.10.006, 2014.
Jickells, T. D., Kelly, S. D., Baker, A. R., Biswas, K., Dennis, P. F., Spokes, L. J., Witt, M., and Yeatman, S. G.: Isotopic evidence for a marine ammonia source, Geophys. Res. Lett., 30, 1374, https://doi.org/10.1029/2002GL016728, 2003.
Joyce, E. E., Walters, W. W., Roy, E. L., Clark, S. C., Schiebel, H., and Hastings, M. G.: Highly concentrated atmospheric inorganic nitrogen deposition in an urban, coastal region in the US, Environ. Res. Commun., 2, 081001, https://doi.org/10.1088/2515-7620/aba637, 2020.
Kawashima, H. and Ono, S.: Nitrogen Isotope Fractionation from Ammonia Gas to Ammonium in Particulate Ammonium Chloride, Environ. Sci. Technol., 53, 10629–10635, https://doi.org/10.1021/acs.est.9b01569, 2019.
Kawashima, H., Ogata, R., and Gunji, T.: Laboratory-based validation of a passive sampler for determination of the nitrogen stable isotope ratio of ammonia gas, Atmos. Environ., 245, 118009, https://doi.org/10.1016/j.atmosenv.2020.118009, 2021.
Kim, Y. P., Seinfeld, J. H., and Saxena, P.: Atmospheric gas-aerosol equilibrium I. Thermodynamic model, Aerosol Sci. Technol., 19, 157–181, 1993.
Koutrakis, P., Wolfson, J. M., and Spengler, J. D.: An improved method for measuring aerosol strong acidity: results from a nine-month study in St Louis, Missouri and Kingston, Tennessee, Atmos. Environ., 22, 157–162, 1988.
Koutrakis, P., Sioutas, C., Ferguson, S. T., Wolfson, J. M., Mulik, J. D., and Burton, R. M.: Development and evaluation of a glass honeycomb denuder/filter pack system to collect atmospheric gases and particles, Environ. Sci. Technol., 27, 2497–2501, 1993.
Li, M., Weschler, C. J., Beko, G., Wargocki, P., Lucic, G., and Williams, J.: Human ammonia emission rates under various indoor environmental conditions, Environ. Sci. Technol., 54, 5419–5428, 2020.
Liu, J., Ding, P., Zong, Z., Li, J., Tian, C., Chen, W., Chang, M., Salazar, G., Shen, C., and Cheng, Z.: Evidence of rural and suburban sources of urban haze formation in China: a case study from the Pearl River Delta region, J. Geophys. Res.-Atmos., 123, 4712–4726, 2018.
McIlvin, M. R. and Altabet, M. A.: Chemical Conversion of Nitrate and Nitrite to Nitrous Oxide for Nitrogen and Oxygen Isotopic Analysis in Freshwater and Seawater, Anal. Chem., 77, 5589–5595, https://doi.org/10.1021/ac050528s, 2005.
Meng, Z. Y., Lin, W. L., Jiang, X. M., Yan, P., Wang, Y., Zhang, Y. M., Jia, X. F., and Yu, X. L.: Characteristics of atmospheric ammonia over Beijing, China, Atmos. Chem. Phys., 11, 6139–6151, https://doi.org/10.5194/acp-11-6139-2011, 2011.
Muzio, L. J. and Arand, J. K.: Homogeneous Gas Phase Decomposition of Oxides of Nitrogen. Tustin, CA, KVB Incorporated, Electric Power Research Institute report FP-253, Project, 461, 1976.
Nowak, J. B., Huey, L. G., Russell, A. G., Tian, D., Neuman, J. A., Orsini, D., Sjostedt, S. J., Sullivan, A. P., Tanner, D. J., Weber, R. J., Nenes, A., Edgerton, E., and Fehsenfeld, F. C.: Analysis of urban gas phase ammonia measurements from the 2002 Atlanta Aerosol Nucleation and Real-Time Characterization Experiment (ANARChE), J. Geophys. Res.-Atmos., 111, D17308, https://doi.org/10.1029/2006JD007113, 2006.
Pan, Y., Tian, S., Liu, D., Fang, Y., Zhu, X., Zhang, Q., Zheng, B., Michalski, G., and Wang, Y.: Fossil Fuel Combustion-Related Emissions Dominate Atmospheric Ammonia Sources during Severe Haze Episodes: Evidence from 15N-Stable Isotope in Size-Resolved Aerosol Ammonium, Environ. Sci. Technol., 50, 8049–8056, https://doi.org/10.1021/acs.est.6b00634, 2016.
Pan, Y., Tian, S., Liu, D., Fang, Y., Zhu, X., Gao, M., Gao, J., Michalski, G., and Wang, Y.: Isotopic evidence for enhanced fossil fuel sources of aerosol ammonium in the urban atmosphere, Environ. Pollut., 238, 942–947, 2018.
Pan, Y., Gu, M., Song, L., Tian, S., Wu, D., Walters, W. W., Yu, X., Lü, X., Ni, X., and Wang, Y.: Systematic low bias of passive samplers in characterizing nitrogen isotopic composition of atmospheric ammonia, Atmos. Res., 243, 105018, https://doi.org/10.1016/j.atmosres.2020.105018, 2020.
Pandolfi, M., Amato, F., Reche, C., Alastuey, A., Otjes, R. P., Blom, M. J., and Querol, X.: Summer ammonia measurements in a densely populated Mediterranean city, Atmos. Chem. Phys., 12, 7557–7575, https://doi.org/10.5194/acp-12-7557-2012, 2012.
Park, R. J., Jacob, D. J., Field, B. D., Yantosca, R. M., and Chin, M.: Natural and transboundary pollution influences on sulfate-nitrate-ammonium aerosols in the United States: Implications for policy, J. Geophys. Res.-Atmos., 109, D15204, https://doi.org/10.1029/2003JD004473, 2004.
Parnell, A. C., Inger, R., Bearhop, S., and Jackson, A. L.: Source partitioning using stable isotopes: coping with too much variation, PloS one, 5, e9672, https://doi.org/10.1371/journal.pone.0009672, 2010.
Paulot, F., Jacob, D. J., Pinder, R. W., Bash, J. O., Travis, K., and Henze, D. K.: Ammonia emissions in the United States, European Union, and China derived by high-resolution inversion of ammonium wet deposition data: Interpretation with a new agricultural emissions inventory (MASAGE_NH3), J. Geophys. Res.-Atmos., 119, 4343–4364, https://doi.org/10.1002/2013JD021130, 2014.
Paulot, F., Jacob, D. J., Johnson, M. T., Bell, T. G., Baker, A. R., Keene, W. C., Lima, I. D., Doney, S. C., and Stock, C. A.: Global oceanic emission of ammonia: Constraints from seawater and atmospheric observations, Global Biogeochem. Cy., 29, 1165–1178, https://doi.org/10.1002/2015GB005106, 2015.
Paulot, F., Ginoux, P., Cooke, W. F., Donner, L. J., Fan, S., Lin, M.-Y., Mao, J., Naik, V., and Horowitz, L. W.: Sensitivity of nitrate aerosols to ammonia emissions and to nitrate chemistry: implications for present and future nitrate optical depth, Atmos. Chem. Phys., 16, 1459–1477, https://doi.org/10.5194/acp-16-1459-2016, 2016.
Pekney, N. J., Davidson, C. I., Zhou, L., and Hopke, P. K.: Application of PSCF and CPF to PMF-modeled sources of PM2.5 in Pittsburgh, Aerosol Sci. Technol., 40, 952–961, 2006.
Perrino, C., De Santis, F., and Febo, A.: Uptake of nitrous acid and nitrogen oxides by nylon surfaces: Implications for nitric acid measurement, Atmos. Environ., 22, 1925–1930, https://doi.org/10.1016/0004-6981(88)90081-9, 1988.
Plautz, J.: Piercing the haze, Science, 361, 1060–1063, https://doi.org/10.1126/science.361.6407.1060, 2018.
Puchalski, M. A., Rogers, C. M., Baumgardner, R., Mishoe, K. P., Price, G., Smith, M. J., Watkins, N., and Lehmann, C. M.: A statistical comparison of active and passive ammonia measurements collected at Clean Air Status and Trends Network (CASTNET) sites, Environ. Sci.-Proc. Imp., 17, 358–369, 2015.
Reche, C., Viana, M., Pandolfi, M., Alastuey, A., Moreno, T., Amato, F., Ripoll, A., and Querol, X.: Urban NH3 levels and sources in a Mediterranean environment, Atmos. Environ., 57, 153–164, https://doi.org/10.1016/j.atmosenv.2012.04.021, 2012.
Savard, M. M., Cole, A., Smirnoff, A., and Vet, R.: δ15N values of atmospheric N species simultaneously collected using sector-based samplers distant from sources – Isotopic inheritance and fractionation, Atmos. Environ., 162, 11–22, https://doi.org/10.1016/j.atmosenv.2017.05.010, 2017.
Shah, V., Jaeglé, L., Thornton, J. A., Lopez-Hilfiker, F. D., Lee, B. H., Schroder, J. C., Campuzano-Jost, P., Jimenez, J. L., Guo, H., Sullivan, A. P., Weber, R. J., Green, J. R., Fiddler, M. N., Bililign, S., Campos, T. L., Stell, M., Weinheimer, A. J., Montzka, D. D., and Brown, S. S.: Chemical feedbacks weaken the wintertime response of particulate sulfate and nitrate to emissions reductions over the eastern United States, P. Natl. Acad. Sci. USA, 115, 8110–8115, https://doi.org/10.1073/pnas.1803295115, 2018.
Song, L., Walters, W. W., Pan, Y., Li, Z., Gu, M., Duan, Y., Lü, X., and Fang, Y.: 15N natural abundance of vehicular exhaust ammonia, quantified by active sampling techniques, Atmos. Environ., 255, 118430, https://doi.org/10.1016/j.atmosenv.2021.118430, 2021.
Stein, A. F., Draxler, R. R., Rolph, G. D., Stunder, B. J., Cohen, M. D., and Ngan, F.: NOAA's HYSPLIT atmospheric transport and dispersion modeling system, B. Am. Meteorol. Soc., 96, 2059–2077, 2015.
Suarez-Bertoa, R., Zardini, A. A., and Astorga, C.: Ammonia exhaust emissions from spark ignition vehicles over the New European Driving Cycle, Atmos. Environ., 97, 43–53, https://doi.org/10.1016/j.atmosenv.2014.07.050, 2014.
Suarez-Bertoa, R., Mendoza-Villafuerte, P., Riccobono, F., Vojtisek, M., Pechout, M., Perujo, A., and Astorga, C.: On-road measurement of NH3 emissions from gasoline and diesel passenger cars during real world driving conditions, Atmos. Environ., 166, 488–497, https://doi.org/10.1016/j.atmosenv.2017.07.056, 2017.
Sun, K., Tao, L., Miller, D. J., Khan, M. A., and Zondlo, M. A.: On-Road Ammonia Emissions Characterized by Mobile, Open-Path Measurements, Environ. Sci. Technol., 48, 3943–3950, https://doi.org/10.1021/es4047704, 2014.
Sun, K., Tao, L., Miller, D. J., Pan, D., Golston, L. M., Zondlo, M. A., Griffin, R. J., Wallace, H. W., Leong, Y. J., Yang, M. M., Zhang, Y., Mauzerall, D. L., and Zhu, T.: Vehicle Emissions as an Important Urban Ammonia Source in the United States and China, Environ. Sci. Technol., 51, 2472–2481, https://doi.org/10.1021/acs.est.6b02805, 2017.
Sutton, M. A., Dragosits, U., Tang, Y. S., and Fowler, D.: Ammonia emissions from non-agricultural sources in the UK, Atmos. Environ., 34, 855–869, 2000.
Tomlin, A. S., Smalley, R. J., Tate, J. E., Barlow, J. F., Belcher, S. E., Arnold, S. J., Dobre, A., and Robins, A.: A field study of factors influencing the concentrations of a traffic-related pollutant in the vicinity of a complex urban junction, Atmos. Environ., 43, 5027–5037, 2009.
Updyke, K. M., Nguyen, T. B., and Nizkorodov, S. A.: Formation of brown carbon via reactions of ammonia with secondary organic aerosols from biogenic and anthropogenic precursors, Atmos. Environ., 63, 22–31, 2012.
Urey, H. C.: The thermodynamic properties of isotopic substances, J. Chem. Soc., 7, 562–581, 1947.
Uria-Tellaetxe, I. and Carslaw, D. C.: Conditional bivariate probability function for source identification, Environ. Modell. Softw., 59, 1–9, 2014.
Van Damme, M., Clarisse, L., Whitburn, S., Hadji-Lazaro, J., Hurtmans, D., Clerbaux, C., and Coheur, P.-F.: Industrial and agricultural ammonia point sources exposed, Nature, 564, 99–103, 2018.
Walker, J. T., Whitall, D. R., Robarge, W., and Paerl, H. W.: Ambient ammonia and ammonium aerosol across a region of variable ammonia emission density, Atmos. Environ., 38, 1235–1246, https://doi.org/10.1016/j.atmosenv.2003.11.027, 2004.
Walters, W.: Data for “Quantifying the Importance of Vehicle Ammonia Emissions in an Urban Area of the Northeastern US Utilizing Nitrogen Isotopes”, Harvard Dataverse, V1, https://doi.org/10.7910/DVN/JHMBRI, 2022.
Walters, W. W. and Hastings, M. G.: Collection of Ammonia for High Time-Resolved Nitrogen Isotopic Characterization Utilizing an Acid-Coated Honeycomb Denuder, Anal. Chem., 90, 8051–8057, https://doi.org/10.1021/acs.analchem.8b01007, 2018.
Walters, W. W., Chai, J., and Hastings, M. G.: Theoretical Phase Resolved Ammonia–Ammonium Nitrogen Equilibrium Isotope Exchange Fractionations: Applications for Tracking Atmospheric Ammonia Gas-to-Particle Conversion, ACS Earth Space Chem., 79–89, https://doi.org/10.1021/acsearthspacechem.8b00140, 2018.
Walters, W. W., Blum, D. E., and Hastings, M. G.: Selective Collection of Particulate Ammonium for Nitrogen Isotopic Characterization Using a Denuder–Filter Pack Sampling Device, Anal. Chem., 7586–7594, https://doi.org/10.1021/acs.analchem.9b00151, 2019.
Walters, W. W., Song, L., Chai, J., Fang, Y., Colombi, N., and Hastings, M. G.: Characterizing the spatiotemporal nitrogen stable isotopic composition of ammonia in vehicle plumes, Atmos. Chem. Phys., 20, 11551–11567, https://doi.org/10.5194/acp-20-11551-2020, 2020.
Wang, S., Nan, J., Shi, C., Fu, Q., Gao, S., Wang, D., Cui, H., Saiz-Lopez, A., and Zhou, B.: Atmospheric ammonia and its impacts on regional air quality over the megacity of Shanghai, China, Sci. Rep., 5, 15842, https://doi.org/10.1038/srep15842, 2015.
Wu, L., Ren, H., Wang, P., Chen, J., Fang, Y., Hu, W., Ren, L., Deng, J., Song, Y., and Li, J.: Aerosol ammonium in the urban boundary layer in Beijing: insights from nitrogen isotope ratios and simulations in summer 2015, Environ. Sci. Tech. Lett., 6, 389–395, 2019.
Xiao, H.-W., Wu, J.-F., Luo, L., Liu, C., Xie, Y.-J., and Xiao, H.-Y.: Enhanced biomass burning as a source of aerosol ammonium over cities in central China in autumn, Environ. Pollut., 266, 115278, https://doi.org/10.1016/j.envpol.2020.115278, 2020.
Yao, X. and Zhang, L.: Trends in atmospheric ammonia at urban, rural, and remote sites across North America, Atmos. Chem. Phys., 16, 11465–11475, https://doi.org/10.5194/acp-16-11465-2016, 2016.
Yao, X., Hu, Q., Zhang, L., Evans, G. J., Godri, K. J., and Ng, A. C.: Is vehicular emission a significant contributor to ammonia in the urban atmosphere?, Atmos. Environ., 80, 499–506, https://doi.org/10.1016/j.atmosenv.2013.08.028, 2013.
Yu, X.-Y., Lee, T., Ayres, B., Kreidenweis, S. M., Collett, J. L., and Malm, W.: Particulate Nitrate Measurement Using Nylon Filters, J. Air Waste Manage., 55, 1100–1110, https://doi.org/10.1080/10473289.2005.10464721, 2005.
Yu, X.-Y., Lee, T., Ayres, B., Kreidenweis, S. M., Malm, W., and Collett, J. L.: Loss of fine particle ammonium from denuded nylon filters, Atmos. Environ., 40, 4797–4807, https://doi.org/10.1016/j.atmosenv.2006.03.061, 2006.
Zhang, L., Altabet, M. A., Wu, T., and Hadas, O.: Sensitive measurement of 15N/14N (δ15) at natural abundance levels in fresh and saltwaters, Anal. Chem., 79, 5297–5303, 2007.
Zhang, Y., Liu, X., Fang, Y., Liu, D., Tang, A., and Collett, J. L.: Atmospheric Ammonia in Beijing during the COVID-19 Outbreak: Concentrations, Sources, and Implications, Environ. Sci. Technol. Lett., 8, 32–38, https://doi.org/10.1021/acs.estlett.0c00756, 2021.
Zhou, C., Zhou, H., Holsen, T. M., Hopke, P. K., Edgerton, E. S., and Schwab, J. J.: Ambient Ammonia Concentrations Across New York State, J. Geophys. Res.-Atmos., 124, 8287–8302, https://doi.org/10.1029/2019JD030380, 2019.