the Creative Commons Attribution 4.0 License.
the Creative Commons Attribution 4.0 License.
 | 12 Oct 2022
Observation of secondary ice production in clouds at low temperatures
Paul J. DeMott
Ivan Heckman
Mengistu Wolde
Earle Williams
David J. Smalley
Michael F. Donovan
Ice particles play an important role in precipitation formation and radiation balance. Therefore, an accurate description of ice initiation in the atmosphere is of great importance for weather prediction models and climate simulations. Despite the abundance of ice crystals in the atmosphere, the mechanisms for their formation remain not well understood. There are two major sets of mechanisms of ice initiation in the atmosphere: primary nucleation and secondary ice production. Secondary ice production occurs in the presence of preexisting ice, which results in an enhancement of the concentration of ice particles. Until recently, secondary ice production was mainly attributed to the rime-splintering mechanism, known as the Hallett–Mossop process, which is active in a relatively narrow temperature range from −3 to −8 ∘C. The existence of the Hallett–Mossop process was well supported by in situ observations. The present study provides an explicit in situ observation of secondary ice production at temperatures as low as −27 ∘C, which is well outside the range of the Hallett–Mossop process. This observation expands our knowledge of the temperature range of initiation of secondary ice in clouds. The obtained results are intended to stimulate laboratory and theoretical studies to develop physically based parameterizations for weather prediction and climate models.
- Article
(5848 KB) - Full-text XML
-
Supplement
(1475 KB) - BibTeX
- EndNote


Ice particles in Earth's atmosphere play a crucial role in the modulation of precipitation and radiation transfer and eventually affect the hydrological cycle and climate on a global scale (e.g., Hong et al., 2016; Matus and L'Ecuyer, 2017; Bacer et al., 2021). Despite their important role, a description of cloud processes involving ice particles is a subject of numerous challenges and uncertainties (e.g., Seinfeld et al., 2016). Understanding the mechanisms of ice initiation in the atmosphere is of a great importance for developing physically based parameterizations in weather prediction models and climate simulations (e.g., Muench and Lohmann, 2020).
There are two major mechanisms of ice formation in the atmosphere that are usually referred to as “primary” and “secondary”. Primary ice production begins with the nucleation of ice particles either homogeneously in droplets supercooled below −38 ∘C or heterogeneously on the surface of ice-nucleating particles (INPs) through freezing of associated water or potentially directly from the vapour phase via deposition nucleation (e.g., Kanji et al., 2017). In contrast, secondary ice production (SIP) occurs in the presence of preexisting ice particles (e.g., Cantrell and Heymsfield, 2005; Field et al., 2017). Numerous observations have shown that the concentration of INPs in the atmosphere is generally lower than the concentration of cloud ice particles, and the difference between them may reach several orders of magnitude (e.g., Hobbs, 1969; Mossop, 1985; Ladino et al., 2017). While the co-occurrence of both types of observations is still rare, the accumulated observations lead to the understanding that, in many cases, primary ice production cannot explain the concentrations of ice particles observed in clouds (Mossop, 1985; Cantrell and Heymsfield, 2005; Field et al., 2017). The excess of the ice particle concentration over that of INPs was attributed to initiation of ice due to secondary ice production processes. At present, secondary ice production is recognized as one of the major sources of ice particles in the atmosphere at temperatures above the temperature of homogeneous freezing but with poor understanding as to the ways this comes about. It is worth noting that simulations of simple cloud situations do support closure of INPs and ice concentrations (Heymsfield et al., 1977; Eidhammer et al., 2010; Field et al., 2012).
There are six mechanisms identified as potential sources of SIP: (1) fragmentation during droplet freezing, (2) the rime-splintering (Hallett–Mossop) process, (3) fragmentation due to ice–ice collision, (4) ice particle fragmentation due to thermal shock, (5) fragmentation of sublimating ice, and (6) the activation of ice-nucleating particles in transient supersaturation around freezing drops. A detailed review of these six SIP mechanisms is provided in Korolev and Leisner (2020).
For many years, the rime splintering (Hallett–Mossop – HM) mechanism (Hallett and Mossop, 1974; Mossop and Hallett, 1974) was considered to be the main source of secondary ice in clouds. This perception of secondary ice initiation had been adopted by the cloud-modelling community, and most of numerical cloud simulations described secondary ice production with the help of the HM process only (e.g., Morrison, 2005; Bacer et al., 2021, and many others). Since the HM mechanism is active at relatively high temperatures ranging from −3 to −8 ∘C (Hallett and Mossop, 1974; Mossop and Hallett, 1974), secondary ice particles were activated in the numerical cloud simulations in this temperature range only, whereas outside the HM process temperature range ice initiation was assigned to primary ice nucleation only. Such an approach may lead to underrepresentation of the role of secondary ice and result in biases in simulations (e.g., Qu et al., 2022; Huang et al., 2021).
Recent laboratory studies (Lauber et al., 2018; Keinert et al., 2020) showed that droplet breakup during freezing may contribute to formation of secondary ice at temperatures colder than the HM process. Observations of glaciation of convective clouds also suggest that SIP may take place at temperatures colder than −8 ∘C (e.g., Lawson et al., 2015, 2017).
The other four SIP mechanisms mentioned above may also contribute to ice formation outside the HM mechanism temperature range. In this regard, it is worth noting recent attempts to numerically explore the effects of various SIP mechanisms across a wide temperature range (e.g., Phillips et al., 2017; Sullivan et al., 2018; Qu et al., 2019). However, parameterizations of SIP in cloud models are of debatable accuracy because the efficiencies of SIP mechanisms and the environmental conditions required for initiation of SIP are not understood at a fundamental level.
In situ observation of SIP is a challenging task. The most common way of identifying SIP is based on comparisons of the observed concentration of ice particles and the concentration of INPs. Since in situ airborne measurements of INPs are not always possible, the INP concentration may be assessed from statistical dependence of INP concentration versus temperature (e.g., Kanji et al., 2017). Despite the fact that the INP concentration, at a specific temperature, may vary within 4 orders of magnitude (e.g., Kanji et al., 2017), the observed concentration of ice particles frequently exceeds the maximum possible INP concentration. Direct airborne in situ observation of the SIP process is hindered by high aircraft speeds (typically >100 m s−1), low sampling statistics of cloud particles, poor spatial coverage, and a limited capability to perform Lagrangian measurements. In many cases, SIP particles may travel a long distance from the location of their origin to the location of their observation via sedimentation, turbulent diffusion, or convective updrafts. Depending on their age, the secondary particles experience metamorphoses of shape and size due to varying ambient supersaturation S and temperature T and riming. The concentration of SIP particles may also change due to the turbulent mixing, sedimentation, and aggregation. Therefore, in situ observation of secondary ice particles at the moment of their origin is in many ways a matter of luck, i.e., whether an aircraft intersects the SIP cloud region at the right time and the right location.
There is a large number of past and recent in situ observations of SIP within the HM temperature range (e.g., Hallett et al., 1978; Crawford et al., 2012; Keppas et al., 2017; Lasher-Trapp et al., 2016; Lauber et al., 2021; Li et al., 2021; Luke et al., 2021; Ramelli et al., 2021, to name a few). However, there are fewer observations of SIP outside the HM temperature range (e.g., Hobbs, 1969; Costa et al., 2017; Lawson et al., 2017, 2022; Mignani et al., 2019; Korolev et al., 2020; Pasquier et al., 2022). Most of these studies reported observations of enhanced concentration of ice particles which exceeded expected concentration of INPs at the temperature of observation. These enabled conclusions about their secondary production nature. However, location and environmental conditions associated with their origin and the age of the secondary ice particles mostly remained unknown.
This study presents an explicit observation of SIP in a strongly constrained cloud region at temperatures as low as −27 ∘C. This expands our knowledge of the temperature range of clouds where SIP may occur. The results of this study are important for the understanding of one of the fundamental mechanisms of ice initiation in clouds. It is also expected that these observational results will stimulate further laboratory studies aimed at the exploration of SIP at low temperatures.
The measurements were collected from the National Research Council Canada (NRC) Convair 580 research aircraft during the Buffalo Area Icing and Radar Study (BAIRS II) field campaign. The NRC Convair 580 was heavily instrumented for cloud microphysical measurements. The following instrumentation has been used in the frame of this study. Measurements of the ice particle number concentration, ice water content (IWC), medium mass diameter (MMD), and maximum size of particles (Dmax) were extracted from composite particle size distributions measured by imaging optical array probes (OAPs). These included a SPEC Inc. (Boulder, CO) two-dimensional stereo probe (2DS; Lawson et al., 2006) and a SPEC High Volume Precipitation Spectrometer (HVPS; Lawson et al., 1998). Cloud droplet size distributions were measured by both a Particle Measuring Systems (PMS) forward-scattering spectrometer probe (FSSP; Knollenberg, 1981) and a Droplet Measurement Technologies (DMT) cloud droplet probe (CDP; Lance et al., 2010). High-resolution particle images were measured with the SPEC Cloud Particle Imager (CPI; Lawson et al., 2001). A Rosemount icing detector was used for detection of liquid water at T<4 ∘C (Mazin et al., 2001). Vertical velocity was measured by the Rosemount (RSM) 858 (Williams and Marcotte, 2000) and Aventech AIMMS-20 (Aircraft-Integrated Meteorological Measurement System; Beswick et al., 2008). Measurements of the air temperature were made with the Rosemount total-air temperature probes (model 102DJ1CG; Lawson and Cooper, 1990; Friehe and Khelif, 1992). Dew and frost point temperatures were extracted from water vapour humidity measured by the LI-COR LI-7000 probe (LI-COR, 2007). The Convair 580 was also equipped with an NRC airborne W-band (NAW) radar with Doppler capability (Wolde and Pazmany, 2005). The collected cloud microphysical data were processed and analyzed with the help of the ECCC (Environment and Climate Change Canada) D2G software.
Figure 1 shows the time series of selected cloud microphysical and state parameters associated with the studied cloud segment. The data were collected during “porpoising” along the cloud top of the precipitating cirrocumulus–nimbostratus (Cc–Ns) cloud system (Fig. 1j). The Cc–Ns was overlaid by another thin cirrostratus (Cs) layer with the cloud top at approximately 8 km, which was separated from the lower Cc–Ns by a few hundred metres of a cloud-free layer. The morphology of the cloud top can be seen from the GOES-16 (Geostationary Operational Environmental Satellite) satellite visible and infrared images in Fig. S1 in the Supplement.
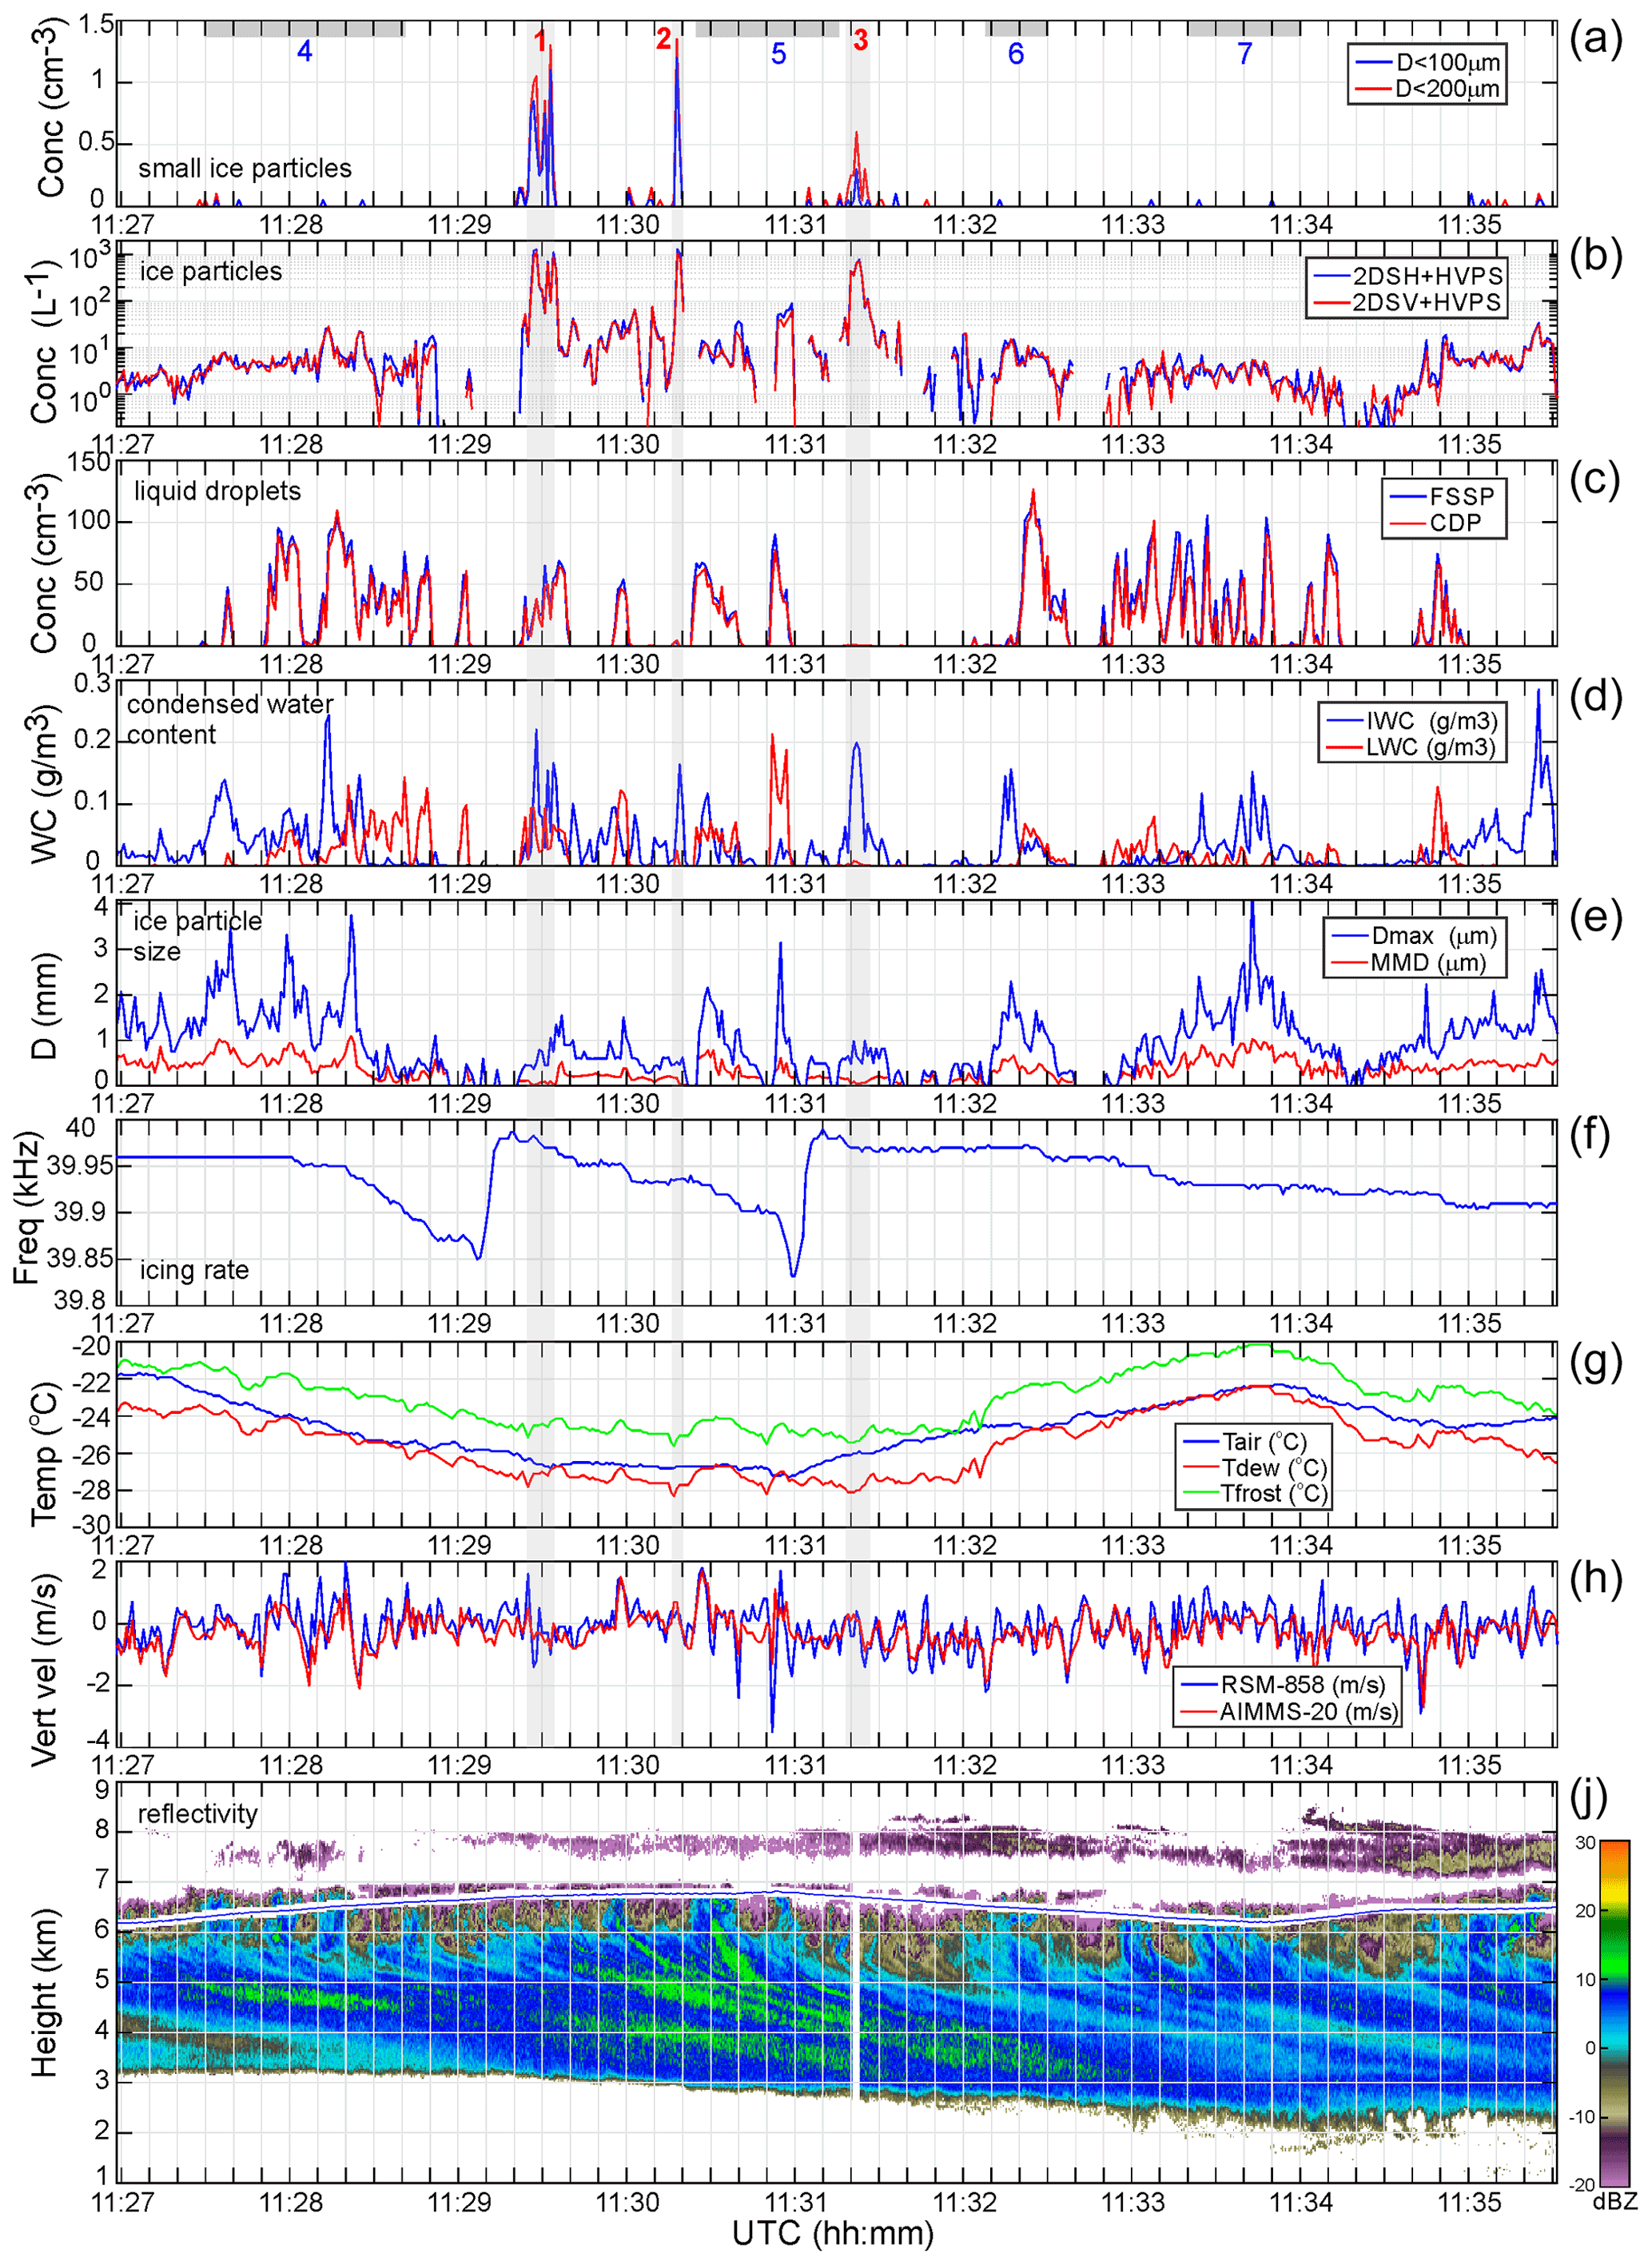
Figure 1Time series of selected measurements: (a) concentration of small pristine ice crystals with sizes smaller than 100 and 200 µm assessed from CPI data; (b) concentration of ice particles >50 µm measured by 2DS, with H and V referring to the horizontal and vertical channels; (c) concentration of cloud droplets with 2 µm µm measured by FSSP and CDP; (d) IWC and LWC calculated from 2DS + HVPS and FSSP measurements, respectively; (e) maximum ice particle size and median mass diameter of ice particles extracted from 2DS + HVPS data; (f) Rosemount icing detector frequency; (g) air, dew point, and frost point temperatures measured by a LI-COR LI-7000; (h) vertical wind velocity measured by RSM-858 and AIMMS-20; and (j) reflectivity measured by W-band radar.
The aircraft altitude during the porpoising changed between 6200 and 6800 m (Fig. 1j), and the temperature varied from −22 to −27 ∘C (Fig. 1g). From a microphysical standpoint, the environment in the studied cloud was highly inhomogeneous, consisting of intermittent mixed-phase and ice cloud segments. The presence of supercooled liquid water is verified by the changing frequency of a vibrating icing cylinder (Fig. 1f), when passing through the liquid-containing cloud regions (Fig. 1c and d). The horizontal extension of mixed-phase cloud regions varied from a few hundred metres to a few kilometres (Fig. 1c and d), with liquid water content (LWC) peaking up to 0.2 g m−3. The concentration of liquid droplets of the mixed-phase clouds was from 46 cm−3, peaking up to 120 cm−3 (Fig. 1c), and the mean volume diameter (MVD) changed between 8 and 15 µm. The probability density function and size distributions of cloud droplet concentration and LWC are shown in Fig. S2.
The high variability in the cloud microstructure was likely induced by an intense turbulence. The vertical velocity varied from −2 to +2 m s−1 with σ=0.6 m s−1 (Fig. 1h). Vertical velocity Uz>0.1 to 0.5 m s−1 is sufficient to activate liquid water in preexisting ice clouds (Korolev and Mazin, 2003) and maintain a mixed-phase environment (Hill et al., 2014; Field et al., 2014). The interaction between ice particles and newly formed liquid droplets will occur through riming and Wegener–Bergeron–Findeisen (WBF) processes (Wegener, 1911; Bergeron, 1935; Findeisen, 1938), which may result in a complete depletion of liquid water by ice particles and glaciation of the mixed-phase cloud. Intense turbulence may also stimulate entrainment of the dry air through the cloud top. This will result in the evaporation of cloud droplets and ice particles, which contributes to a further increase in cloud inhomogeneity and expedites glaciation.
Figure 1b shows the time series of cloud particles concentration with a maximum dimension Dmax>40 µm, which was calculated from a composite particle size distribution measured by the 2DS and HVPS. The 2DS binary imagery does not allow for segregation of the phase state of small ice particles (Dmax<80 µm) because of poor pixel resolution (Korolev et al., 2017). However, analysis of the high-resolution CPI imagery (2.3 µm) suggests that no droplets with Dmax>40 µm were present in these cloud regions, and therefore, particles with Dmax>40 µm can be considered to be ice with a high level of confidence.
The most striking observation in the studied cloud is three cloud segments indicated by numbers 1–3 in Fig. 1a with the concentration of ice particles varying in the range of L−1 (Fig. 1a and b). However, elsewhere around these cloud segments, the background concentration of ice particles varied from 0.4 to 30 L−1 at the 5th and 95th percentiles, respectively, with the mean value of 7.5 L−1 (Fig. S3). There is nearly 2–3 orders of magnitude of difference between the background and enhanced ice concentrations, and simultaneous measurements of high ice concentrations by two independent instruments (Fig. 1a and b) exclude explanation of this observation by statistical fluctuations of particle counts.
Figure 2 shows a sequence of the high-resolution CPI images measured during a traverse through the cloud region with segments 1 and 2 (Fig. 1a, 11:28:22–11:30:34 UTC). As shown in Fig. 2, the particles inside the regions of enhanced ice concentration are mostly small facetted hexagonal plates and columns, whereas outside regions 1–3, the ice particles have irregular shape and many of them are covered by fresh or aged rime.
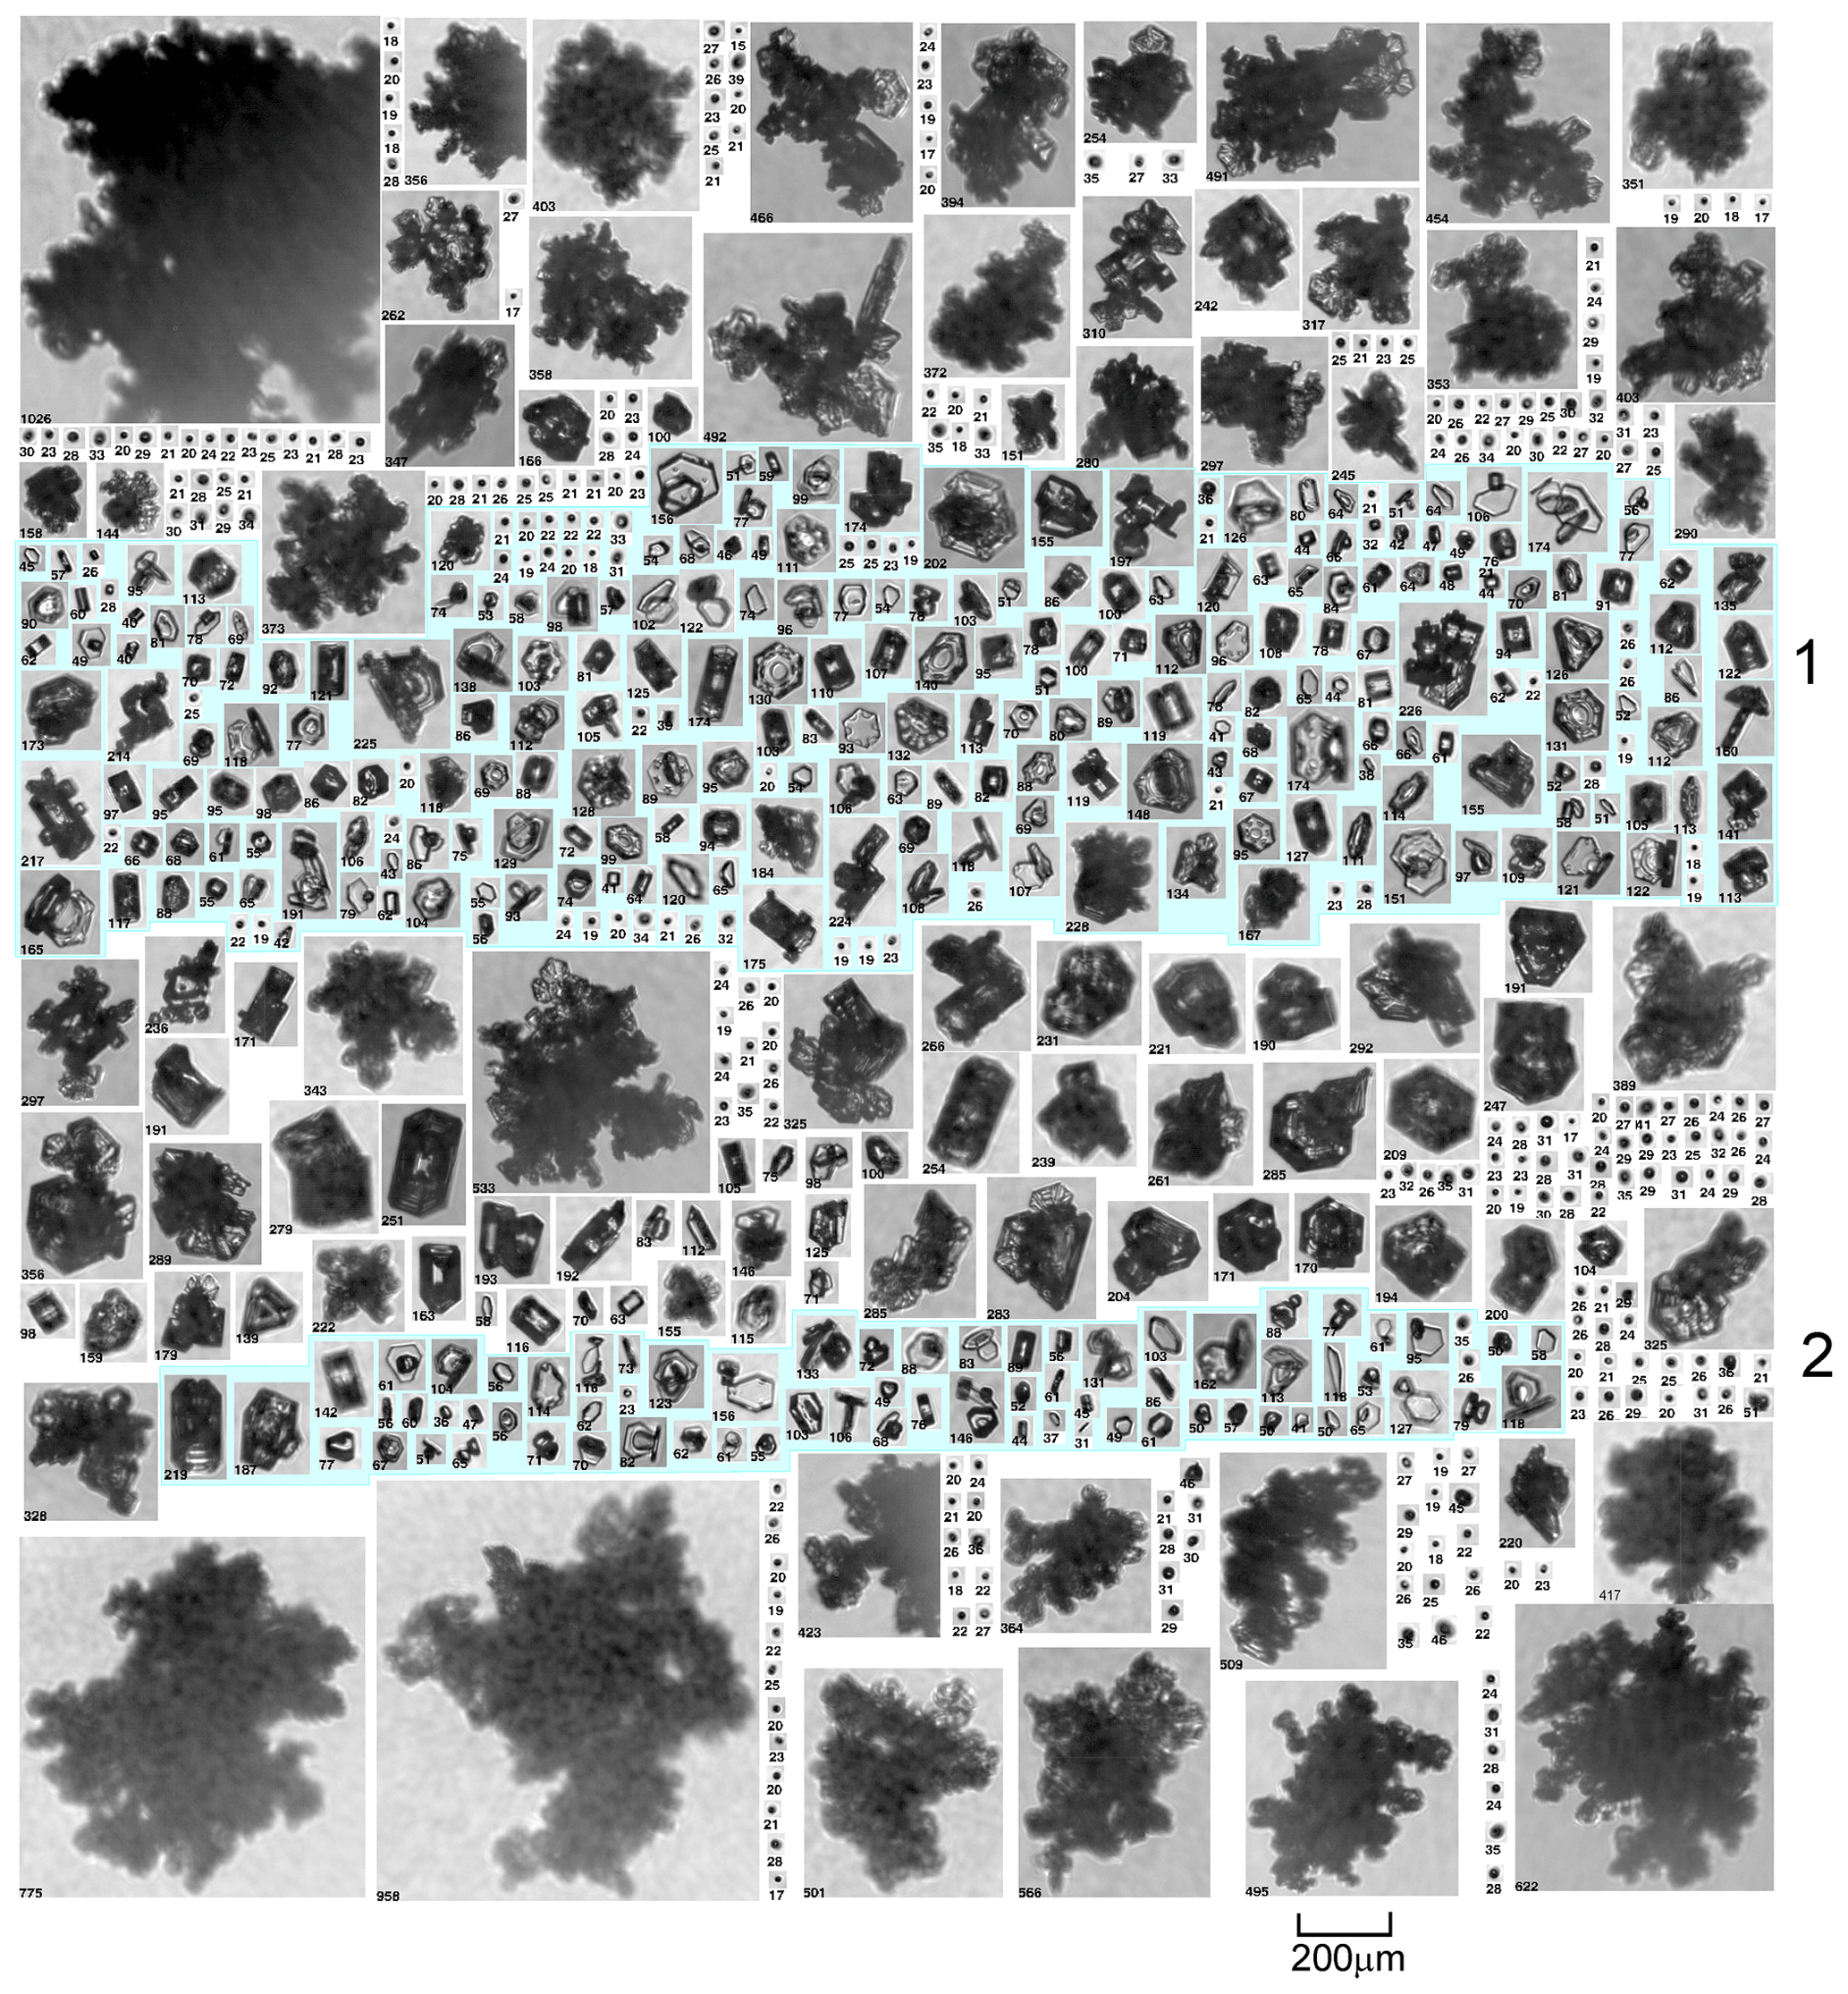
Figure 2Images of cloud particles sampled by CPI during a traverse of a cloud shown in Fig. 1. First image at 11:28:22 UTC; last image at 11:30:34 UTC. The numbers on the left bottom corner of each image indicate the maximum image size in micrometres. The images associated with the high ice concentration cloud regions 1 and 2 in Fig. 1a appear on a blue background.
Figure 3 presents average composite size and mass distributions measured by 2DS and HVPS probes in seven cloud segments shown in Fig. 1a. Three of these segments are associated with the cloud regions with enhanced concentrations (1–3, Fig. 1a), and the other four are associated with the neighbouring regions 4–7, indicated by grey strips in Fig. 1a. In Fig. 3, the distributions in the cloud segments with high concentration (1–3, red) are grouped close to each other, and they are quite different from the distributions (4–7, blue) in the neighbouring cloud regions. The maximum particle size Dmax in cloud segments 1–3 is limited to a range of 400–600 mm, whereas in the background cloud segments 4–7 the Dmax values reach 1.5 to 2 mm. The time series of Dmax and mean mass diameter (MMD) are also shown in Fig. 1e.

Figure 3Size (a) and mass (b) distributions of cloud ice particles measured by 2DS and HVPS in cloud regions in Fig. 1 indicated by numbers 1–7. Size and mass distributions 1–3 (red) correspond to the cloud regions with high concentration of small ice particles; 4–7 (blue) correspond to the cloud regions with aged ice.
The obtained observations suggest that the formation of a high concentration of small ice particles in cloud regions 1–3 can be attributed to a physical process rather than to the statistics of sampling. A valid question arises: what is the mechanism responsible for the formation of the high-concentration regions?
Based on INP in situ measurements, the maximum concentration of primary ice particles at ∘C may vary from approximately 10−1 to 1000 L−1 (e.g., Kanji et al., 2017; Petters and Wright, 2015). Therefore, the observed concentration Nice=1200 L−1 might be explained by primary ice nucleation. On the other hand, the background concentration of ice particles in the neighbouring cloud regions is systematically lower by 1–2 orders of magnitude than Nice in cloud segments 1–3 (Fig. 1b). It would be reasonable to assume that the primary ice particles were initiated by the same population of INPs, giving a concentration of ice varying between 0.4 and 30 L−1. The rapid increase in the concentration of INPs by 1–2 orders of magnitude in a spatially limited area is an unlikely explanation. Such spatial inhomogeneities of the INP concentration would be rapidly mixed with the surrounding environment due to turbulent diffusion. Assessment of the turbulent energy dissipation rate (ε) from Fig. 1h and the maximal horizontal extension (L) of cloud segments 1–3 from Fig. 1a yields m2 s−3 and L≈103 m, respectively. Therefore, the mixing time could be assessed as s. Such a mixing time is shorter than the age of the existing Cc–Ns cloud layer from the GOES-16 satellite imagery by at least 1 h. At timescales τ>τm the spatial variations of the INPs will be homogenized due to mixing with the ambient environment. Therefore, the explanation of the enhanced concentration of ice particles due to spatial inhomogeneity of the INP concentration can be ruled out.
Another possibility explaining the enhanced ice concentration may be related to the droplet freezing. The rate of droplet freezing has been assessed here with the help of Bigg's equation (Bigg, 1953; Khain et al., 2021). For the droplet size distribution averaged over the cloud span (Fig. S2a) it was found that at −27 ∘C the rate of droplet freezing is approximately L−1 s−1 (see the Supplement). Therefore, in order to reach an enhanced ice concentration of the order of 103 L−1 the residence time of the cloud parcel should be h. This is an unrealistically long residence time for a cloud parcel in a stratiform cloud layer at a depth of a few hundred metres. During this time the turbulent diffusion will smear the entire cloud parcel as well as ice particles mitigating formation of sharp gradients of ice concentration as in Fig. 1a and b. All these aspects make the “droplet freezing” hypothesis insufficient to explain the observed enhanced concentration of ice. The enhanced concentration of ice can possibly be explained by seeding from the cirrus cloud overlaying the Cc–Ns layer (Fig. 1j). However, the W-band radar measurements indicated that the two cloud layers were separated by approximately 500 m with no radar return (Fig. 1j; 11:29–11:32 UTC). On the other hand, measurements of humidity during occasional climbing above the cloud top of the Cc–Ns layer (not in Fig. 1) showed that the two cloud layers were separated by dry air. The dry layer will hinder seeding due to sublimation of ice particles. A few random ice particles, which may survive sublimation in the dry layer and can reach the Cc–Ns layer, are unlikely to explain the high concentration of ice in segments 1–3. Therefore, seeding from the overlaid cirrus cloud also does not seem to be a feasible explanation of high ice concentration.
Secondary ice production appears to be the most plausible reason of the enhanced concentration of ice in cloud segments 1–3. This explanation is supported by the numerous small pristine ice particles in these cloud regions (Fig. 2). Very similar small pristine ice crystals were observed in the studies of Korolev et al. (2020) and Lauber et al. (2021) at subfreezing temperatures.
The size of individual facetted ice crystals in cloud segments 1–3 with enhanced ice concentration varied from 26 to approximately 170 µm (segment 1, Fig. 2), from 31 to approximately 142 µm (segment 2, Fig. 2), and from 61 to approximately 250 µm (segment 3, not shown). Ice particles with larger sizes are either polycrystalline, aggregates, or rimed. The size span between the smallest and largest crystals indicates that the SIP occurred not instantly but rather was extended over some time. Assuming the initial size of secondary ice particle is 5 µm (Korolev et al., 2020) and the humidity is saturated over liquid water, the time required to grow ice particles to the maximum size indicated above can be estimated as approximately 160 s (segment 1), 115 s (segment 2), and 360 s (segment 3).
In reality, the in-cloud humidity is continuously changing because of mixing with the neighbouring environment, and on average it has a tendency to decrease due to depletion of water vapour by ice particles. Therefore, the above assessment yields a lower estimate of the ice crystals growth time. The actual growth time will be longer given the lower RH compared to its saturated-over-water value.
Figure 1g shows a time series of the frost point (Tf), dew point (Td), and air temperature (Ta). These temperatures enable assessment of relative humidity over ice RHice. As seen from Fig. 1g in cloud regions with high ice concentrations, the cloud environment was always supersaturated with respect to ice (i.e., Tf>Ta), and RHice varied in the ranges of 112 % % (segment 1), 113 % % (segment 2), and 107 % % (segment 3). Saturation over water was reached in segment 1 (i.e., when Td≈Ta), whereas segments 2 and 3 were undersaturated with respect to water.
Supercooled liquid droplets might have been initially present in segments 1–3 before the SIP process had begun. However, the initiation of a large amount of secondary ice would intensify the WBF process and expedite glaciation of the mixed-phase environment. Assuming an initial LWC =0.1 g m−3 and a concentration of ice particles Nice=500–1000 L−1, the assessment of the glaciation time (Korolev and Mazin, 2003) yields τgl=60–90 s.
This obtained assessment of the glaciation time and growth time of ice crystals allows for an estimate of the age of SIP in cloud segments 1–3, which is approximately 2–5 min. The following growth of ice particles will result in their sedimentation and formation of virgae, which are quite noticeable in the W-band radar returns in Fig. 1j. Luke et al. (2021) observed similar virgae in Arctic stratiform clouds in regions associated with SIP.
At that stage it does not seem feasible to identify which SIP mechanism is responsible for the observed enhancement of ice concentration. Observation of heavily rimed particles suggests that the rime-splintering mechanisms might be active. Unfortunately, early experimental studies of rime splintering were mainly focused on relatively high temperatures (e.g., Aufdermaur and Johnson, 1972; Hallett and Mossop, 1974; Mossop, 1976; Heymsfield and Mossop, 1984; Saunders and Hosseini, 2001), and there were no published results on efficiency of rime splintering at temperatures lower than −18 ∘C (Latham and Mason, 1961). Droplet breakup during freezing is another plausible SIP mechanism to explain the observations (Lauber et al., 2018; Keinert et al., 2020; Staroselsky et al., 2021). It is worth mentioning that the droplet breakup during freezing and rime splintering is supported by the presence of liquid phase in this layer. Absence of supercooled liquid in segments 2 and 3 may be explained by glaciation of the mixed-phase environment. Developed shapes of rimed ice particles (Fig. 2) with a large number of seemingly fragile branches suggests the ice–ice collisional breakup mechanism is another plausible candidate for explaining the enhanced concentration of ice (Vardiman, 1978; Takahashi et al., 1995). Shattering of fragile ice branches resulting from a thermal shock during freezing (e.g., King and Fletcher, 1976) and ice nucleation in high-supersaturated wakes behind riming ice particles (e.g., Gagin, 1972; Prabhakaran et al., 2020) also cannot be ruled out. However, fragmentation during ice sublimation (Oraltay and Hallet, 1989; Bacon et al., 1998) appears to be the least plausible mechanism, since no undersaturated environment was observed in the studied cloud layer (Fig. 1g).

Figure 4Images of clouds with ice virga. Optically dense cores of the clouds sourcing the virga indicate presence of liquid droplets. Figures courtesy of (a) Kaufung/Alamy Stock Photo/CRDP4A and (b) Martin Gudd (Institute for Professional Weather Education, https://www.weather-education.de, last access: 7 October 2022).
As follows from the above, no clear preferences could be granted to any of the six potential SIP mechanisms. However, in absence of credible experimental data on efficiency and environmental conditions required for each SIP mechanism, the above discussion on the feasibility of an SIP mechanism bears a speculative character. It is worth mentioning that an unknown mechanism responsible for the observed enhanced concentration of ice also cannot be ruled out.
It is interesting to note that, in the stratiform layers, SIP occurred in spatially localized cells where the necessary and sufficient conditions for SIP initiation were met. The horizontal extension of the SIP regions in Fig. 1a is estimated to vary from approximately 500 m to 1 km.
The obtained results can be illustrated by pictures of altocumulus and altostratus clouds with virgae in Fig. 4. The optical density of the main bodies of the clouds indicates that these clouds are dominated by liquid droplets. Ice clouds usually have lower optical density, and they are more transparent given the lower concentration of ice particles compared to that of liquid droplets. The streaky structure of the virgae with relatively small vertical extension of the clouds in Fig. 4 indicates that the particles precipitating out of the clouds are ice. Usually, formation of liquid precipitation requires deep liquid layers compared to those in Fig. 4. A specific point of the photos in Fig. 4 is that virgae of ice particles did not extend across the entire cloud but rather formed in very local regions. Such a formation of is unlikely to be explained by primary nucleation due to spatial fluctuations of INPs, which formed a region with an enhanced concentration of INPs. The most plausible explanation is that the virgae in Fig. 4 are a result of SIP at the locations where the relevant SIP conditions were satisfied.
This is a first explicit in situ observation of SIP at temperatures down to −27 ∘C. This expands our understanding of the temperature range where SIP may occur in natural clouds. Even though laboratory studies suggest that SIP may take place at temperatures colder than that relevant to the HM process, there were no unambiguous observations of SIP in natural clouds at temperatures as low as −27 ∘C. The obtained results are important to stimulate laboratory and theoretical studies to identify SIP mechanisms at low temperatures. One of the key objectives along this way is finding necessary and sufficient conditions for SIP. This would facilitate development of physically based parameterizations for numerical weather predictions (NWPs) and climate models.
The cloud microphysical datasets are available on Zenodo (https://doi.org/10.5281/zenodo.7075925, Korolev and Heckman, 2022).
The supplement related to this article is available online at: https://doi.org/10.5194/acp-22-13103-2022-supplement.
AK conceptualized the project, collected and analyzed data, and drafted the paper. PJD interpreted data regarding INPs and ice particle concentration. IH processed data. MW organized the Convair 580 flight operation and collected and processed radar data. EW, DJS, and MFD arranged the BAIRS II (2017 Buffalo Area Icing and Radar Study) field campaign and wrote, reviewed, and edited the manuscript.
The contact author has declared that none of the authors has any competing interests.
Many thanks go to the NRC and ECCC tech personal for the integration of the airborne instrumentation on board the NRC Convair 580, probes' maintenance, and data collection. Special thanks go to the NRC pilots Anthony Brown and Robert Erdos for operation of the NRC Convair 580 during data collection. The authors are grateful to the reviewer Thomas Leisner and Alex Khain for their valuable comments.
Paul J. DeMott was supported by the US National Science Foundation (grant no. 1917519). Participation of the Lincoln Laboratory, Massachusetts Institute of Technology, in BAIRS II was supported by the Federal Aviation Administration (FAA) (Air Force contract no. FA8702-15-D-0001). Environment and Climate Change Canada (ECCC), Transport Canada (TC) and the NRC RAIR (Reducing Aviation Icing Risk) program contributed funding for the BAIRS II campaign.
Any opinions, findings, conclusions, or recommendations expressed in this material are those of the authors and do not necessarily reflect the views of the FAA and TC.
Publisher’s note: Copernicus Publications remains neutral with regard to jurisdictional claims in published maps and institutional affiliations.
This paper was edited by Alexander Laskin and reviewed by Thomas Leisner.
Aufdermaur, A. N. and Johnson D. A.: Charge separation due to riming in an electric field, Q. J. Roy. Meteor. Soc., 98, 369–382, https://doi.org/10.1002/qj.49709841609, 1972.
Bacer, S., Sullivan, S. C., Sourdeval, O., Tost, H., Lelieveld, J., and Pozzer, A.: Cold cloud microphysical process rates in a global chemistry–climate model, Atmos. Chem. Phys., 21, 1485–1505, https://doi.org/10.5194/acp-21-1485-2021, 2021.
Bacon, N. J., Swanson, B. D., Baker, M. B., and Davis, E. J.: Breakup of levitated frost particles, J. Geophys. Res.-Atmos., 103, 13763–13775, https://doi.org/10.1029/98JD01162, 1998.
Bergeron, T.: On the physics of clouds and precipitation. Proces Verbaux de l'Association de Météorologie, International Union of Geodesy and Geophysics, Imprimerie Paul Dupont, Paris, France, 156–178, 1935.
Beswick, K. M., Gallagher, M. W., Webb, A. R., Norton, E. G., and Perry, F.: Application of the Aventech AIMMS20AQ airborne probe for turbulence measurements during the Convective Storm Initiation Project, Atmos. Chem. Phys., 8, 5449–5463, https://doi.org/10.5194/acp-8-5449-2008, 2008.
Bigg, E. K.: The formation of atmospheric ice crystals by the freezing of droplets, Q. J. Roy. Meteor. Soc., 79, 51–519, https://doi.org/10.1002/qj.49707934207, 1953.
Cantrell, W. and Heymsfield, A. J.: Production of Ice in Tropospheric Clouds: A Review, B. Am. Meteorol. Soc., 86, 795–808, https://doi.org/10.1175/BAMS-86-6-795, 2005.
Costa, A., Meyer, J., Afchine, A., Luebke, A., Günther, G., Dorsey, J. R., Gallagher, M. W., Ehrlich, A., Wendisch, M., Baumgardner, D., Wex, H., and Krämer, M.: Classification of Arctic, midlatitude and tropical clouds in the mixed-phase temperature regime, Atmos. Chem. Phys., 17, 12219–12238, https://doi.org/10.5194/acp-17-12219-2017, 2017.
Crawford, I., Bower, K. N., Choularton, T. W., Dearden, C., Crosier, J., Westbrook, C., Capes, G., Coe, H., Connolly, P. J., Dorsey, J. R., Gallagher, M. W., Williams, P., Trembath, J., Cui, Z., and Blyth, A.: Ice formation and development in aged, wintertime cumulus over the UK: observations and modelling, Atmos. Chem. Phys., 12, 4963–4985, https://doi.org/10.5194/acp-12-4963-2012, 2012.
Eidhammer, T., DeMott, P. J., Prenni, A. J., Petters, M. D., Twohy, C. H., Rogers, D. C., Stith, J., Heymsfield A., Wang, Z., Pratt, K. A., Prather, K. A., Murphy, S. M., Seinfeld, J. H., Subramanian, R., and Kreidenweis, S. M.: Ice initiation by aerosol particles: Measured and predicted ice nuclei concentrations versus measured ice crystal concentrations in an orographic wave cloud, J. Atmos. Sci., 67, 2417–2436, https://doi.org/10.1175/2010JAS3266.1, 2010.
Field, P., Hill, A., Furtado, K., and Korolev, A.: Mixed-phase clouds in a turbulent environment. Part 2: Analytic treatment. Q. J. Roy. Meteor. Soc., 140, 870–880, https://doi.org/10.1002/qj.2175, 2014.
Field, P. R., Heymsfield, A. J., Shipway, B. J., DeMott, P. J., Pratt, K. A., Rogers, D. C., Stith, J., and Prather K. A.: Ice in clouds experiment–layer clouds. Part II: Testing characteristics of heterogeneous ice formation in lee wave clouds, J. Atmos. Sci., 69, 1066–1079, https://doi.org/10.1175/JAS-D-11-026.1, 2012.
Field, P. R., Lawson, R. P., Brown, P. R. A., Lloyd, G., Westbrook, C., Moisseev, D., Miltenberger, A., Nenes, A., Blyth, A., Choularton, T., Connolly, P., Bühl, J., Crosier, J., Cui, Z., Dearden, C., DeMott, P., Flossmann, A. I., Heymsfield, A. J., Huang, Y. H., Kalesse, H., Kanji, Z. A., Korolev, A., Kirchgaessner, A., Lasher-Trapp, S., Leisner, T., McFarquhar, G., Phillips, V., Stith, J., and Sullivan, S.: Secondary Ice Production: Current State of the Science and Recommendations for the Future, Meteor. Monogr., 58, 7.1–7.20, https://doi.org/10.1175/AMSMONOGRAPHS-D-16-0014.1, 2017.
Findeisen, W.: Kolloid-meteorologische Vorgänge bei Niederschlagsbildung, Meteorol. Z., 55, 121–133, 1938.
Friehe, C. A. and Khelif, D.: Fast-response aircraft temperature sensors, J. Atmos. Ocean. Technol., 9, 784–795, https://doi.org/10.1175/1520-0426(1992)009<0784:FRATS>2.0.CO;2, 1992.
Gagin, A.: Effect of supersaturation on the ice crystal production by natural aerosols, Journal de Recherches Atmosphériques, 6, 175–185, 1972.
Hallett, J. and Mossop, S. C.: Production of secondary ice particles during the riming process, Nature, 249, 26–28, https://doi.org/10.1038/249026a0, 1974.
Hallett, J., Sax, R. I., Lamb, D., and Murty, A. S. R.: Aircraft measurements of ice in Florida cumuli, Q. J. Roy. Meteor. Soc., 104, 631–651, https://doi.org/10.1002/qj.49710444108, 1978.
Heymsfield, A. J.: Precipitation Development in Stratiform Ice Clouds: A Microphysical and Dynamical Study, J. Atmos. Sci., 34, 367–381, https://doi.org/10.1175/1520-0469(1977)034<0367:PDISIC>2.0.CO;2, 1977.
Heymsfield, A. J. and Mossop, S. C.: Temperature dependence of secondary ice crystal production during soft hail growth by riming, Q. J. Roy. Meteor. Soc., 110, 765–770, https://doi.org/10.1002/qj.49711046512, 1984.
Hill, A., Field, P., Furtado, K., Korolev, A., and Shipway, B. J.: Mixed-phase clouds in a turbulent environment: Part 1 – Large-eddy simulation experiments, Q. J. Roy. Meteor. Soc., 140, 855–869, https://doi.org/10.1002/qj.2177, 2014.
Hobbs, P. V.: Ice Multiplication in Clouds, J. Atmos. Sci., 26, 315–318, https://doi.org/10.1175/1520-0469(1969)026<0315:IMIC>2.0.CO;2, 1969.
Hong, Y., Liu, G., and Li, J.-L. F.: Assessing the Radiative Effects of Global Ice Clouds Based on CloudSat and CALIPSO Measurements, J. Climate, 29, 7651–7674, https://doi.org/10.1175/JCLI-D-15-0799.1, 2016.
Huang, Y., Wu, W., McFarquhar, G. M., Wang, X., Morrison, H., Ryzhkov, A., Hu, Y., Wolde, M., Nguyen, C., Schwarzenboeck, A., Milbrandt, J., Korolev, A. V., and Heckman, I.: Microphysical processes producing high ice water contents (HIWCs) in tropical convective clouds during the HAIC-HIWC field campaign: evaluation of simulations using bulk microphysical schemes, Atmos. Chem. Phys., 21, 6919–6944, https://doi.org/10.5194/acp-21-6919-2021, 2021.
Kanji, Z. A., Ladino, L. A., Wex, H., Boose, Y., Burkert-Kohn, M., Cziczo, D. J., and Krämer, M.: Overview of Ice Nucleating Particles, Meteor. Monogr., 58, 1.1–1.33, https://doi.org/10.1175/AMSMONOGRAPHS-D-16-0006.1, 2017.
Keinert, A., Spannagel, D., Leisner, T., and Kiselev, A.: Secondary ice production upon freezing of freely falling drizzle droplets, J. Atmos. Sci., 77, 2959–2967, https://doi.org/10.1175/JAS-D-20-0081.1, 2020.
Keppas, S. Ch., Crosier, J., Choularton, T. W., and Bower, K. N.: Ice lollies: An ice particle generated in supercooled conveyor belts, Geophys. Res. Lett., 44, 5222–5230, https://doi.org/10.1002/2017GL073441, 2017.
Khain, A., Pinsky, M., and Korolev, A.: Combined effect of the Bergeron-Findeisen mechanism and large eddies on microphysics of mixed-phase stratiform clouds, J. Atmos. Sci., 79, 383–407, https://doi.org/10.1175/JAS-D-20-0269.1, 2021.
King, W. D. and Fletcher, N. H.: Thermal Shock as an Ice Multiplication Mechanism. Part I. Theory, J. Atmos. Sci., 33, 85–96, https://doi.org/10.1175/1520-0469(1976)033<0085:TSAAIM>2.0.CO;2, 1976.
Knollenberg, R. G.: Techniques for probing cloud microstructure, in: Clouds their Formation, Optical Properties, and Effects, edited by: Hobbs, P. V. and Deepak, A., Academic Press, 15–91, ISBN: 0-12-350720-0, 1981.
Korolev, A. and Heckman, I.: Data used in “Observation of secondary ice production in clouds at low temperatures”, Zenodo [data set], https://doi.org/10.5281/zenodo.7075925, 2022.
Korolev, A. and Leisner, T.: Review of experimental studies of secondary ice production, Atmos. Chem. Phys., 20, 11767–11797, https://doi.org/10.5194/acp-20-11767-2020, 2020.
Korolev, A., McFarquhar, G., Field, P. R., Franklin, C., Lawson, P., Wang, Z., Williams, E., Abel, S. J., Axisa, D., Borrmann, S., Crosier, J., Fugal, J., Krämer, M., Lohmann, U., Schlenczek, O., Schnaiter, M., and Wendisch, M.: Mixed-Phase Clouds: Progress and Challenges, Meteor. Monogr., 58, 5.1–5.50, https://doi.org/10.1175/AMSMONOGRAPHS-D-17-0001.1, 2017.
Korolev, A., Heckman, I., Wolde, M., Ackerman, A. S., Fridlind, A. M., Ladino, L. A., Lawson, R. P., Milbrandt, J., and Williams, E.: A new look at the environmental conditions favorable to secondary ice production, Atmos. Chem. Phys., 20, 1391–1429, https://doi.org/10.5194/acp-20-1391-2020, 2020.
Korolev, A. V. and Mazin, I. P.: Supersaturation of water vapor in clouds, J. Atmos. Sci., 60, 2957–2974, 2003.
Ladino, L. A., Korolev, A., Heckman, I., Wolde, M., Fridlind, A. M., and Ackerman, A. S.: On the role of ice-nucleating aerosol in the formation of ice particles in tropical mesoscale convective systems, Geophys. Res. Lett., 44, 1574–1582, https://doi.org/10.1002/2016GL072455, 2017.
Lance, S., Brock, C. A., Rogers, D., and Gordon, J. A.: Water droplet calibration of the Cloud Droplet Probe (CDP) and in-flight performance in liquid, ice and mixed-phase clouds during ARCPAC, Atmos. Meas. Tech., 3, 1683–1706, https://doi.org/10.5194/amt-3-1683-2010, 2010.
Lasher-Trapp, S., Leon, D. C., DeMott, P. J., Villanueva-Birriel, C. M., Johnson, A. V., Moser, D. H., Tully, C. S., and Wu, W.: A multisensor investigation of rime splintering in tropical maritime cumuli, J. Atmos. Sci., 73, 2547–2564, https://doi.org/10.1175/JAS-D-15-0285.1, 2016.
Latham, J. and Mason, B. J.: Generation of electric charge associated with the formation of soft hail in thunderclouds, P. Roy. Soc. Lond. A Mat., 260, 237–249, https://doi.org/10.1098/rspa.1961.0052, 1961.
Lauber, A., Kiselev, A., Pander, T., Handmann, P., and Leisner, T.: Secondary Ice Formation during Freezing of Levitated Droplets, J. Atmos. Sci., 75, 2815–2826, https://doi.org/10.1175/JAS-D-18-0052.1, 2018.
Lauber, A., Henneberger, J., Mignani, C., Ramelli, F., Pasquier, J. T., Wieder, J., Hervo, M., and Lohmann, U.: Continuous secondary-ice production initiated by updrafts through the melting layer in mountainous regions, Atmos. Chem. Phys., 21, 3855–3870, https://doi.org/10.5194/acp-21-3855-2021, 2021.
Lawson, R. P. and Cooper, W. A.: Performance of some airborne thermometers in clouds, J. Atmos. Ocean. Technol., 7, 480–494, https://doi.org/10.1175/1520-0426(1990)007<0480:POSATI>2.0.CO;2, 1990.
Lawson, R. P., Stewart, R. E., and Angus, L. J.: Observations and numerical simulations of the origin and development of very large snowflakes. J. Atmos. Sci., 55, 3209–3229, https://doi.org/10.1175/1520-0469(1998)055<3209:OANSOT>2.0.CO;2, 1998.
Lawson, R. P., Baker, B. A., Schmitt, C. G., and Jensen, T. L.: An overview of microphysical properties of Arctic 1145 clouds observed in May and July 1998 during FIRE ACE, J. Geophys. Res.-Atmos., 106, 14989–15014, https://doi.org/10.1029/2000JD900789, 2001.
Lawson, R. P., O'Connor, D., Zmarzly, P., Weaver, K., Baker, B., Mo, Q., and Jonsson, H.: The 2D-S (Stereo) Probe: Design and Preliminary Tests of a New Airborne, High-Speed, High-Resolution Particle Imaging Probe, J. Atmos. Ocean. Tech., 23, 1462–1477, https://doi.org/10.1175/JTECH1927.1, 2006.
Lawson, R. P., Woods, S., and Morrison, H.: The microphysics of ice and precipitation development in tropical cumulus clouds, J. Atmos. Sci., 72, 2429–2445, https://doi.org/10.1175/JAS-D-14-0274.1, 2015.
Lawson, R. P., Korolev, A. V., DeMott, P. J., Heymsfield, A. J., Bruintjes, R. T., Wolff, C. A., Woods, S., Patnaude, R. J., Jensen, J. B., Moore, K. A., Heckman, I., Rosky, E., Haggerty, J., Perkins, R. J., Fisher T., and Hill, T. C. J.: The Secondary Production of Ice in Cumulus Experiment (SPICULE), B. Am. Meteorol. Soc., accepted, 2022.
Lawson, P., Gurganus, C., Woods, S., and Bruintjes, R.: Aircraft Observations of Cumulus Microphysics Ranging from the Tropics to Midlatitudes: Implications for a “New” Secondary Ice Process, J. Atmos. Sci., 74, 2899–2920, https://doi.org/10.1175/JAS-D-17-0033.1, 2017.
Li, H., Korolev, A., and Moisseev, D.: Supercooled liquid water and secondary ice production in Kelvin–Helmholtz instability as revealed by radar Doppler spectra observations, Atmos. Chem. Phys., 21, 13593–13608, https://doi.org/10.5194/acp-21-13593-2021, 2021.
LI-COR: LI-7000 COH2O Analyzer Instruction Manual, https://www.licor.com/env/pdf/gas_analyzers/7000/LI-7000Manual.pdf (last access: 7 October 2022), 2007.
Luke, E. P., Yang, F., Kollias, P., Vogelmann, A. M., and Maahn, M.: New insights into ice multiplication using remote-sensing observations of slightly supercooled mixed-phase clouds in the Arctic, Proc. Natl. Acad. Sci. USA, 118, e2021387118, https://doi.org/10.1073/pnas.2021387118, 2021.
Matus, A. V. and L'Ecuyer, T. S.: The role of cloud phase in Earth's radiation budget, J. Geophys. Res.-Atmos., 122, 2559–2578, https://doi.org/10.1002/2016JD025951, 2017.
Mazin, I. P., Korolev, A. V., Heymsfield, A., Isaac, G. A., and Cober, S. G.: Thermodynamics of Icing Cylinder for Measurements of Liquid Water Content in Supercooled Clouds, J. Atmos. Ocean. Tech., 18, 543–558, https://doi.org/10.1175/1520-0426(2001)018<0543:TOICFM>2.0.CO;2, 2001.
Mignani, C., Creamean, J. M., Zimmermann, L., Alewell, C., and Conen, F.: New type of evidence for secondary ice formation at around −15 ∘C in mixed-phase clouds, Atmos. Chem. Phys., 19, 877–886, https://doi.org/10.5194/acp-19-877-2019, 2019.
Morrison, H., Curry, J. A., and Khvorostyanov, V. I.: A new double moment microphysics scheme for application in cloud and climate models. Part I: Description, J. Atmos. Sci., 62, 1665–1677, 2005.
Mossop, S. C.: Production of secondary ice particles during the growth of graupel by riming, Q. J. Roy. Meteor. Soc., 102, 45–57, https://doi.org/10.1002/qj.49710243104, 1976.
Mossop, S. C.: The Origin and Concentration of Ice Crystals in Clouds, B. Am. Meteorol. Soc., 66, 264–273, https://doi.org/10.1175/1520-0477(1985)066<0264:TOACOI>2.0.CO;2, 1985.
Mossop, S. C. and Hallett, J.: Ice Crystal Concentration in Cumulus Clouds: Influence of the Drop Spectrum, Science, 186, 632–634, https://doi.org/10.1126/science.186.4164.632, 1974.
Muench, S. and Lohmann, U.: Developing a cloud scheme with prognostic cloud fraction and two moment microphysics for ECHAM-HAM, J. Adv. Model. Earth Sy., 12, e2019MS001824, https://doi.org/10.1029/2019MS001824, 2020.
Oraltay, R. G. and Hallett, J.: Evaporation and melting of ice crystals: A laboratory study, Atmos. Res., 24, 169–189, https://doi.org/10.1016/0169-8095(89)90044-6, 1989.
Pasquier, J. T., Henneberger, J., Ramelli, F., Lauber, A., David, R. O., Wieder, J., Carlsen, T., Gierens, R., Maturilli, M., and Lohmann, U.: Conditions favorable for secondary ice production in Arctic mixed-phase clouds, Atmos. Chem. Phys. Discuss. [preprint], https://doi.org/10.5194/acp-2022-314, in review, 2022.
Petters, M. D. and Wright, T. P.: Revisiting ice nucleation from precipitation samples, Geophys. Res., Lett., 42, 8758–8766, https://doi.org/10.1002/2015GL065733, 2015.
Phillips, V., Yano, J-I., Formenton, M., Ilotoviz, E., Kanawade, V., Kudzotsa, I., Sun, J., Bansemer, A. Detwiler, A., Khain, A. P., and Tessendorf, S.: Ice multiplication by break-up in ice-ice collisions. Part 2: Numerical simulations, J. Atmos. Sci., 74, 2789–2811, 2017.
Prabhakaran, P., Kinney, G., Cantrell, W., Shaw, R. A., and Bodenschatz, E.: High Supersaturation in the Wake of Falling Hydrometeors: Implications for Cloud Invigoration and Ice Nucleation, Geophys. Res. Lett., 47, e2020GL088055, https://doi.org/10.1029/2020GL088055, 2020.
Qu, Y., Khain, A., Phillips, V., Ilotoviz, E., Shpund, J., Patade, S., and Chen, B.: The role of ice splintering on microphysics of deep convective clouds forming under different aerosol conditions: simulations using the model with spectral bin microphysics, J. Geophys. Res., 125, e2019JD031312, https://doi.org/10.1029/2019JD031312, 2019.
Qu, Z., Korolev, A., Milbrandt, J. A., Heckman, I., Huang, Y., McFarquhar, G. M., Morrison, H., Wolde, M., and Nguyen, C.: The impacts of secondary ice production on microphysics and dynamics in tropical convection, Atmos. Chem. Phys., 22, 12287–12310, https://doi.org/10.5194/acp-22-12287-2022, 2022.
Ramelli, F., Henneberger, J., David, R. O., Bühl, J., Radenz, M., Seifert, P., Wieder, J., Lauber, A., Pasquier, J. T., Engelmann, R., Mignani, C., Hervo, M., and Lohmann, U.: Microphysical investigation of the seeder and feeder region of an Alpine mixed-phase cloud, Atmos. Chem. Phys., 21, 6681–6706, https://doi.org/10.5194/acp-21-6681-2021, 2021.
Saunders, C. P. R. and Hosseini, A. S.: A laboratory study of the effect of velocity on Hallett–Mossop ice crystal multiplication, Atmos. Res., 59, 3–14, https://doi.org/10.1016/S0169-8095(01)00106-5, 2001.
Seinfeld, J. H., Bretherton, C., Carslaw, K. S., Coe, H., DeMott, P. J., Dunlea, E. J., Feingold, G., Ghan, S., Guenther, A. B., Kahn, R., Kraucunas, I., Kreidenweis, S. M., Molina, M. J., Nenes, A., Penner, J. E., Prather, K. A., Ramanathan, V., Ramaswamy, V., Rasch, P. J., Ravishankara, A. R., Rosenfeld, D., Stephens, G., and Wood, R.: Improving our fundamental understanding of the role of aerosol-cloud interactions in the climate system, P. Natl. Acad. Sci. USA, 113, 5781–5790, https://doi.org/10.1073/pnas.1514043113, 2016.
Staroselsky, A., Acharya, R., and Khain, A.: Toward a theory of the evolution of drop morphology and splintering by freezing, J. Atmos. Sci., 78, 3181–3204, https://doi.org/10.1175/JAS-D-20-0029.1, 2021.
Sullivan, S. C., Hoose, C., Kiselev, A., Leisner, T., and Nenes, A.: Initiation of secondary ice production in clouds, Atmos. Chem. Phys., 18, 1593–1610, https://doi.org/10.5194/acp-18-1593-2018, 2018.
Takahashi, T., Nagao, Y., and Kushiyama, Y.: Possible High Ice Particle Production during Graupel–Graupel Collisions, J. Atmos. Sci., 52, 4523–4527, https://doi.org/10.1175/1520-0469(1995)052<4523:PHIPPD>2.0.CO;2, 1995.
Vardiman, L.: The Generation of Secondary Ice Particles in Clouds by Crystal–Crystal Collision, J. Atmos. Sci., 35, 2168–2180, https://doi.org/10.1175/1520-0469(1978)035<2168:TGOSIP>2.0.CO;2, 1978.
Wegener, A.: Thermodynamik der Atmosphäre, J. A. Barth, Leipzig, Germany, 1911.
Williams, A. and Marcotte, D.: Wind measurements on a maneuvering twin-engine turboprop aircraft accounting for flow distortion. J. Atmos. Ocean. Technol., 17, 795–810, https://doi.org/10.1175/1520-0426(2000)017<0795:WMOAMT>2.0.CO;2, 2000.
Wolde, M. and Pazmany, A.: NRCC dual-frequency airborne radar for atmospheric research, 32nd Int. Conf. on Radar Meteorology, Albuquerque, NM, 24–28 October 2005, Amer. Meteor. Soc., P1R.9, https://ams.confex.com/ams/32Rad11Meso/techprogram/paper_96918.htm (last access: 7 October 2022), 2005.