the Creative Commons Attribution 4.0 License.
the Creative Commons Attribution 4.0 License.
 | 29 Sep 2022
Technical note: Use of PM2.5 to CO ratio as an indicator of wildfire smoke in urban areas
Brendan Schnieder
Daniel Inouye
Wildfires and their resulting smoke are an increasing problem in many regions of the world. However, identifying the contribution of smoke to pollutant loadings in urban regions can be challenging at low concentrations due to the presence of the usual array of anthropogenic pollutants. Here we propose a method using the difference in PM2.5 to CO emission ratios between smoke and typical urban pollution. For temperate wildfires, the mean emission ratio of PM2.5 to CO is in the range of 0.14–0.18 g PM2.5 g CO−1, whereas typical urban emissions have a PM2.5 to CO emissions ratio that is lower by a factor of 2–20. This gives rise to the possibility of using this ratio as an indicator of wildfire smoke. We use observations at a regulatory surface monitoring site in Sparks, NV, for the period of May–September 2018–2021. There were many smoke-influenced periods from numerous California wildfires that burned during this period. Using a PM2.5 CO threshold of 30.0 , we can split the observations into smoke-influenced and no-smoke periods. We then develop a Monte Carlo simulation, tuned to local conditions, to derive a set of PM2.5 CO values that can be used to identify smoke influence in urban areas. From the simulation, we find that a smoke enhancement ratio of 140 best fits the observations, which is significantly lower than the ratio observed in fresh smoke plumes (e.g., 200–300 ). The most likely explanation for this difference is loss of PM2.5 during dilution and transport to warmer surface layers. We find that the PM2.5 CO ratio in urban areas is an excellent indicator of smoke and should prove to be useful to identify biomass burning influence on the policy-relevant concentrations of both PM2.5 and O3. Using the results of our Monte Carlo simulation, this ratio can also quantify the influence of smoke on urban PM2.5.
- Article
(747 KB) - Full-text XML
- BibTeX
- EndNote


In the US, smoke has become an increasingly challenging problem due to a significant increase in the area burned by wildfires (Zhuang et al., 2021; Kalashnikov et al., 2022; McClure and Jaffe, 2018). Data from the National Interagency Fire Center (http://www.nifc.gov, last access: 10 September 2022) showed that between the early 1980s and 2021, the decadal average annual area burned by wildfires in the US increased by almost a factor of 3, from 1.1 to 3.0 million hectares per year. Multiple factors were responsible for this increase, including climate change, increasing human ignitions and past forest management (Jaffe et al., 2020).
Primary emissions from fires include fine particulate matter with a diameter of less than 2.5 µm (PM2.5), carbon monoxide (CO), nitrogen oxides (NOx= NO + NO2) and hundreds of volatile organic compounds (VOCs), which include many toxic and hazardous air pollutants (Akagi et al., 2011; Permar et al., 2021). Furthermore, atmospheric chemistry leads to O3 and other secondary products. The cumulative impact of these emissions has substantial health implications (e.g., Ebi et al., 2021; O'Dell et al., 2020, 2021; Gan et al., 2020; Doubleday, 2020; Sorenson et al., 2021).
Smoke at the surface can originate from nearby or distant fires (e.g., DeBell et al., 2004; Jaffe et al., 2004; Teakles et al., 2017; Rogers et al., 2020). Satellites can provide an exceptional geospatial view of fires and the occurrence and transport of smoke (e.g., Duncan et al., 2014; Jaffe et al., 2020; Kahn, 2020; O'Neill et al., 2021; Holloway et al., 2021). However, with very few exceptions, satellite data provide little to no vertical information directly. Modeling of smoke transport and exposure is challenging for a number of reasons, including uncertainties in emissions, plume injection heights and model resolution (Lu et al., 2016; O'Neill et al., 2021; Ye et al., 2021). It is possible to measure unique smoke tracers, such as acetonitrile (CH3CN) (Singh et al., 2012; Chandra et al., 2020), but these measurements are not routinely performed at surface sites and also have some anthropogenic sources (Huangfu et al., 2021).
Wildfire emissions are chemically distinct from industrial and vehicle emissions in having very high PM2.5 emissions per unit of fuel burned. Table 1 shows emissions ratios (ERs) of PM2.5 CO, expressed on a gram per gram basis along with observed and calculated normalized enhancement ratios (NERs, ΔPM2.5 ΔCO), for smoke and non-smoke sources. The PM2.5 CO ERs from temperate wildfires are at least a factor of 1.9 greater than the same ER for anthropogenic emissions. Comparing the PM2.5 CO ERs from wildfires with vehicle emissions, we see that wildfires emit 15–19 times the amount of PM2.5 per unit of CO emitted. Using these ERs we can estimate NERs (ΔPM2.5 ΔCO), assuming no chemical or physical loss of either species (also shown in Table 1). Observed NERs will reflect not only the emissions but also chemical and physical processing (plus any background contribution). The observed NERs in urban areas with no smoke (21–66, mean of 37 ) are much closer to the estimated NERs for vehicle emissions, which is reasonable given these are usually the largest source of both PM2.5 and CO in urban areas.
The observed smoke NERs appear to fall into two groups. At the surface, mean smoke NERs are in the range of 103–128 , whereas in fresh plumes aloft, the mean values are 201–339 . The values aloft are much closer to the mean NER (220 ) calculated from the most recent compilation of ERs for temperate forests (Andreae, 2019). Selimovic et al. (2019, 2020) noted that the PM2.5 CO NER in ground-level smoke is about half of that observed from aircraft or free tropospheric observations. This was most likely caused by a reduction in aerosol mass from evaporation of organic aerosols due to higher surface temperatures and greater downstream dilution. These past observations present a fairly consistent picture showing that PM2.5 CO NER for surface smoke is about 3–4 times greater than the NER for typical urban observations in the absence of smoke, based on the values given in Laing et al. (2017).
Table 1Emission ratios (ERs) and observed NERs for non-smoke and smoke conditions. ERs are converted into NERs using a pressure of one atmosphere and temperature of 273 K (STP). This calculation assumes no loss of either PM2.5 or CO. For observed ERs and NERs, the study mean is given, with the range (if reported) shown in parentheses.
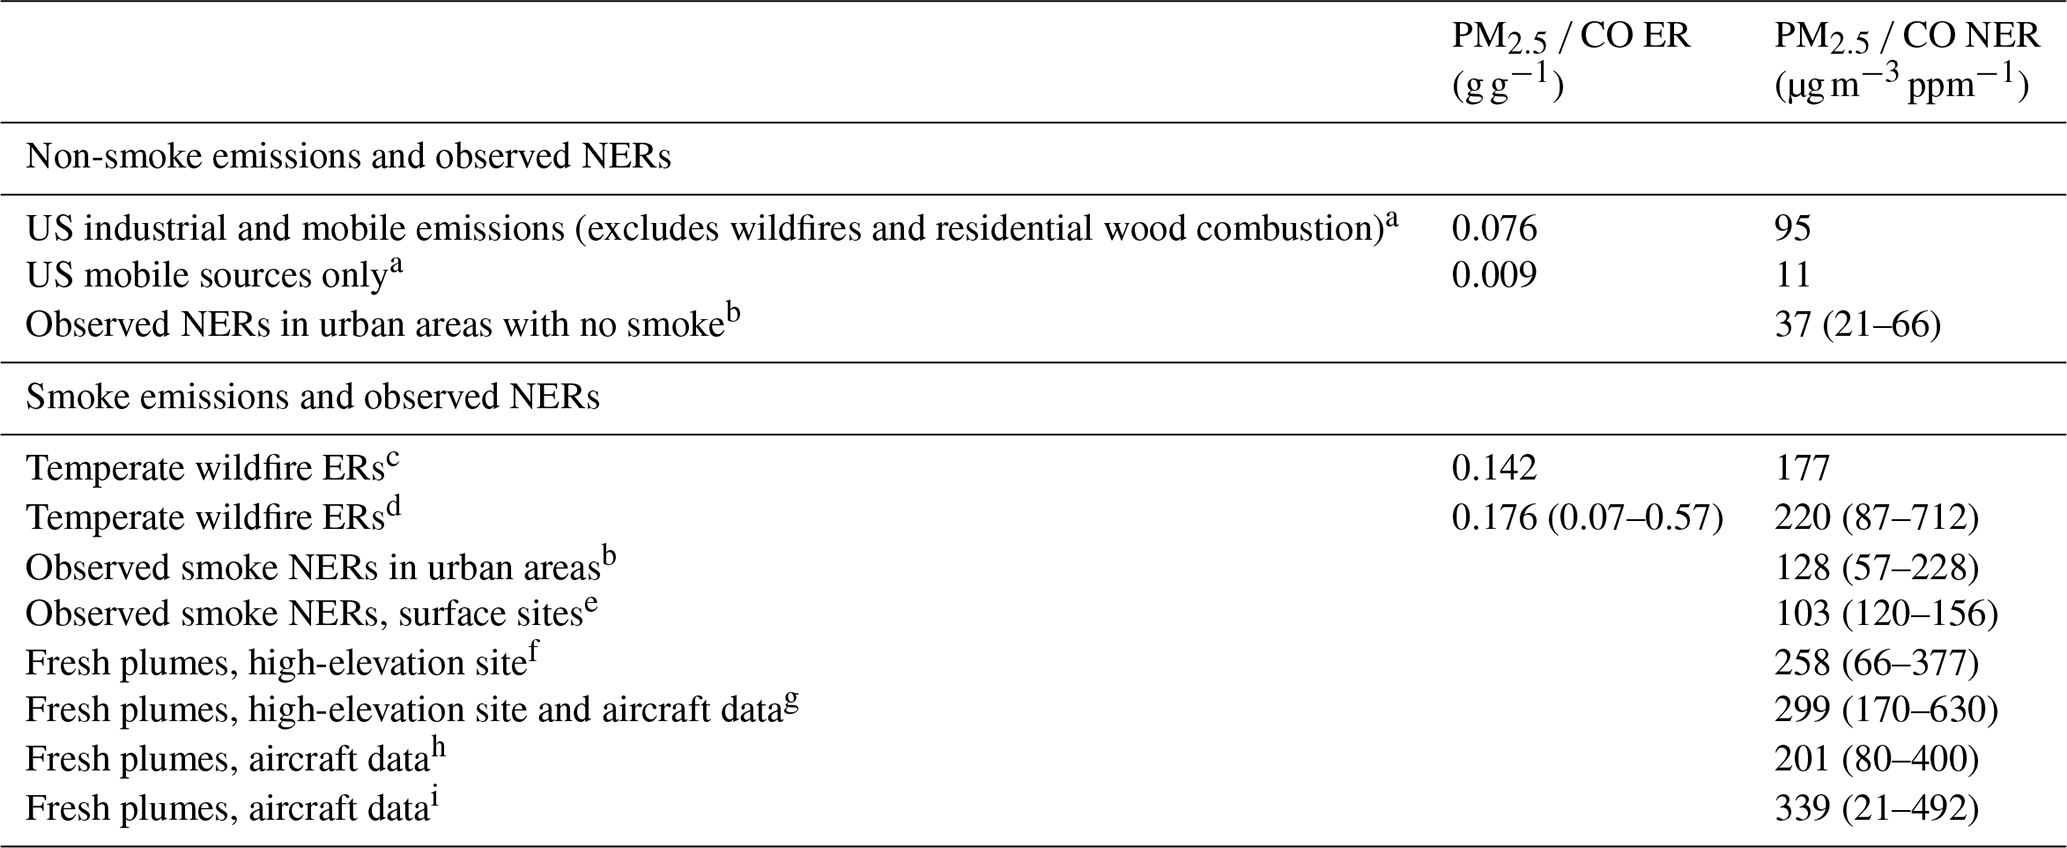
a Data from the EPA's 2017 National Emission Inventory (U.S. EPA, 2022). b Data from Laing et al. (2017). c Data from Akagi et al. (2011). d Data from Andreae (2019). e Data from Selimovic et al. (2020). f Data from Briggs et al. (2016). Scattering values are reported at STP and converted to PM2.5 using a dry mass scattering coefficient of 3.5 m2 g−2. g Data from Collier et al. (2016). This value includes refractory PM1. Values are adjusted to STP. h Data from Garofalo et al. (2019). This value includes only the organic, non-refractory PM1 fraction; however, this is likely more than 90 % of total PM2.5 mass. Values are adjusted to STP. i Data from Kleinman et al. (2020). This value includes only the non-refractory PM1 mass. Values are adjusted to STP.
The very different PM2.5 to CO NERs for typical urban air and smoke events suggest that the observed ratios can be used to derive the smoke contribution to surface PM2.5 concentrations (Laing et al., 2017; Xiu et al., 2022). To examine this hypothesis, we used data from a monitoring site in Sparks, NV, near Reno, a region that has been heavily influenced by smoke in the past several years due to the large number and extent of California wildfires. Data from this region were used to examine the role of high PM2.5 exposure from smoke on COVID-19 incidence (Kiser et al., 2021). From the Sparks, NV, observations, we developed a quantitative model using a Monte Carlo simulation (Baez and Tweed, 2013) that provides a range of probabilistic results that can be compared to observations. We found that this method appears to reasonably quantify the smoke contribution in an urban area.
For this analysis, we use daily mean PM2.5 and CO concentrations for May–September 2018–2021 from the Sparks, NV, air quality monitoring site (EPA AQS identification no. 320311005) near Reno, NV, that is operated by the Washoe (NV) County Health District, Air Quality Management Division. The site uses instruments and standards that are consistent with the national EPA requirements (40 CFR Part 58) and report data into the EPA's national Air Quality System (AQS). The Sparks site has near-continuous measurements of PM2.5, CO and O3. We used data for May–September 2018–2021 to avoid complications with sources from residential wood combustion. Data were obtained from the EPA AirData site (https://www.epa.gov/outdoor-air-quality-data, last access: 10 September 2022), except for 2021 data, which were obtained from AirNow-Tech, a web-based data resource operated for the U.S. EPA (https://www.airnowtech.org/, last access: 10 September 2022). Instrumentation at the Sparks site included a MetOne model 1020 beta attenuation monitor (BAM) for PM2.5, a Teledyne API model 300 EU non-dispersive IR monitor for CO and a Teledyne API model T400 UV O3 analyser. These instruments have stated detection limits (DLs) of 1 µg m−3, 20 ppb and 0.4 ppb, respectively. Because there were some zero and very low values, PM2.5 concentrations less than the DL were set to 1 µg m−3. This impacted less than 2 % of the dataset. No below-DL values were reported for the CO or O3 data. As an indication of overhead smoke, we used the daily smoke polygon product from the NOAA Hazard Mapping System-Fire and Smoke Product (hereafter simply HMS). The smoke polygon product is created by expert image analysts that digitize smoke plume extent a few times per day based on analysis of GOES-16 and GOES-17 ABI True Color Imagery available during daylight hours. More details on HMS can be found in Rolph et al. (2009), Kaulfus et al. (2017) and Brey et al. (2018). We note that HMS can sometimes miss thin smoke plumes, especially in the presence of clouds (Buysse et al., 2019). Buysse et al. (2019) found that there is enhanced surface PM2.5 on 30 %–70 % of the days with overhead HMS smoke, depending on the location.
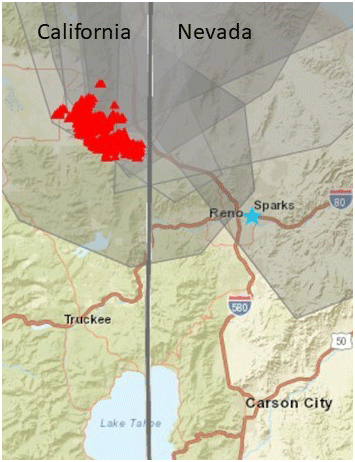
Figure 1NOAA HMS smoke and fire location for 16 August 2020. The Loyalton fire is burning in California near the Nevada border at this time. The blue star shows the location of the Sparks, NV, monitoring site, which is approximately 35–45 km from the fire. This map was created from the AirNowTech site (https://www.airnowtech.org/, last access: 10 September 2022).
Figure 1 shows one example of the HMS smoke product for the Loyalton fire on 16 August 2020, which was about 35–45 km from the Sparks monitoring site. This fire started on 14 August 2020 and burned for approximately 1 month. In total, this fire burned approximately 20 000 ha in the Tahoe and Humboldt-Toiyabe National Forests. On 16 August 2020, the daily mean PM2.5 and CO concentrations were 38 µg m−3 and 0.43 ppm at the Sparks, NV, monitoring site. Washoe County is located due east of the California–Nevada border, so smoke from many fires in California is often transported to the Sparks monitor. Table 2 shows data for the number of days that exceeded the U.S. National Ambient Air Quality Standards (NAAQS) for PM2.5 (2006 24 h standard, daily mean of 35 µg m−3) and O3 (2015 8 h O3 standard, maximum daily 8 h mean of 0.070 ppm) for the Sparks monitoring site, along with the annual area burned in California. While 2020 was the highest year on record for the area burned in CA for the past 2 decades, 2021 was the second highest year and had a greater number of days in Reno that exceeded the NAAQS. Note that 2019 was a particularly low fire year in CA, and there were no exceedances of either the daily PM2.5 or O3 NAAQS at the Sparks monitoring site. Overall, for this time period (May–September 2018–2021), 200 out of 612 d had overhead HMS smoke at the Sparks monitoring location. The PM2.5 CO smoke criteria are discussed later in this section.
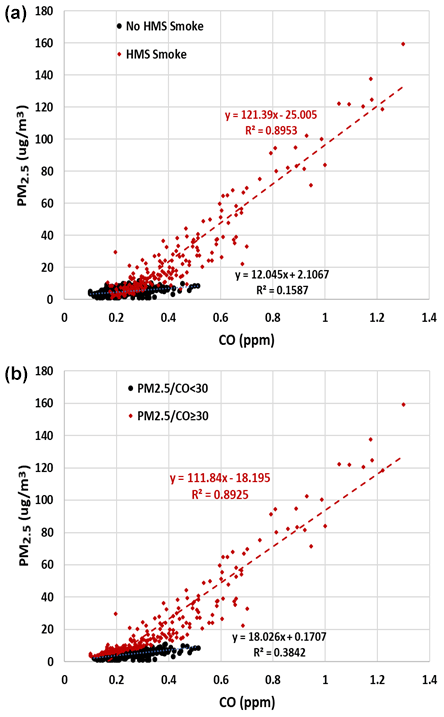
Figure 2Observed PM2.5 vs. CO for May–September data (1 May 2018–31 August 2021). Each point is the daily mean of observed values segregated by (a) overhead HMS smoke product or (b) PM2.5 CO threshold of 30.0 .
Table 2California area burned, overhead HMS smoke days, and days over the U.S. National Ambient Air Quality Standard at Sparks, NV, for PM2.5 (daily mean of 35 µg m−3) and O3 (70 ppb, 8 h average). The smoke criteria (indicated by *) uses a PM2.5 CO ratio of 30.0 , as discussed later in text.
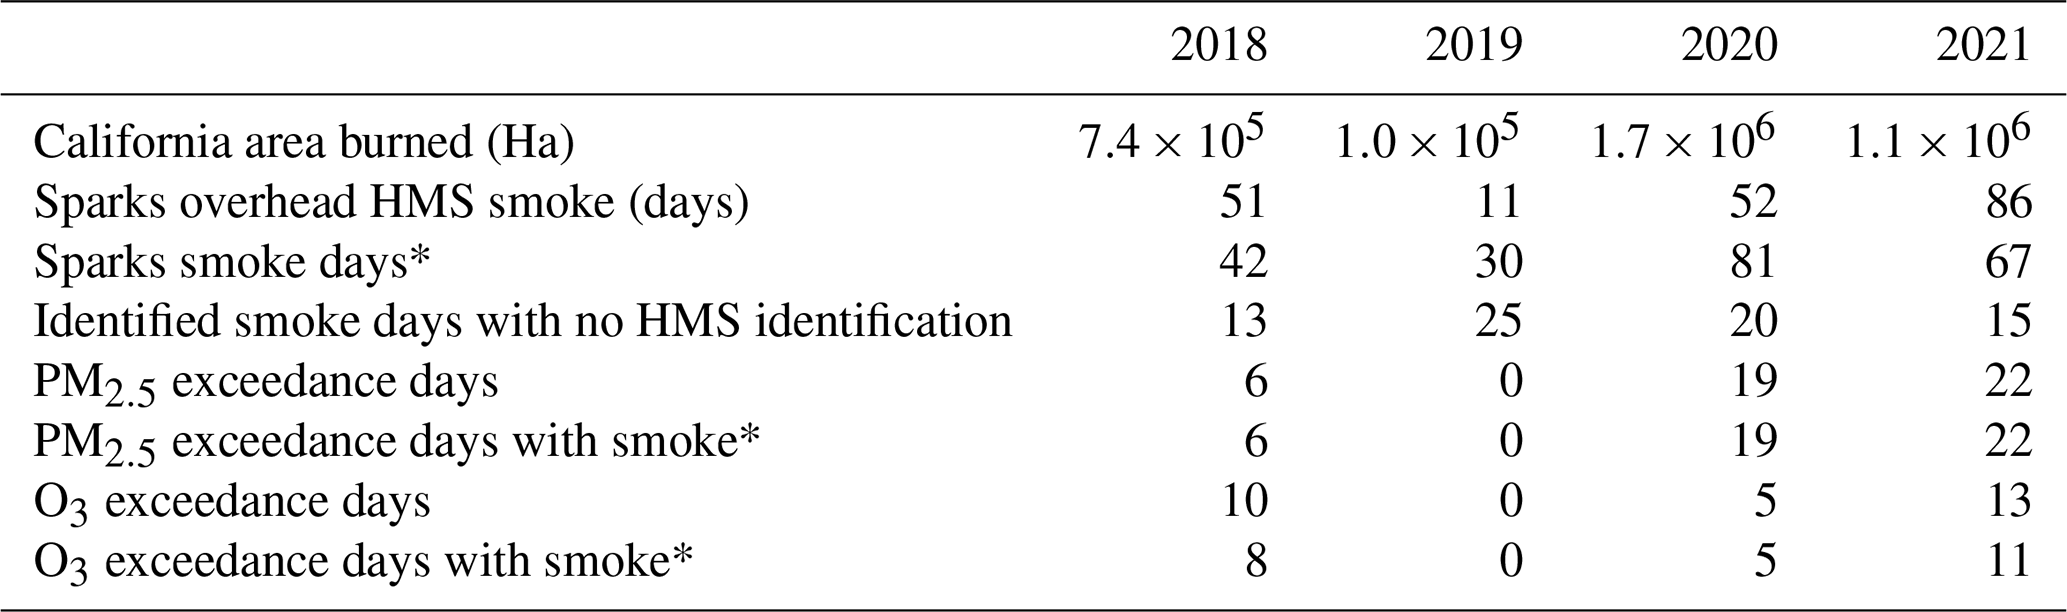
Figure 2 shows the daily PM2.5 vs. CO concentrations for May–September 2018–2021, segregated for smoke vs. non-smoke conditions. The data are segregated using (1) the HMS smoke product and (2) a PM2.5 CO ratio ≥30.0. The value of 30.0 was chosen based, in part, on the work of Laing et al. (2017) and on evaluation of likely smoke influence. We found the slopes and correlations were not strongly influenced by the choice of PM2.5 CO ratio. For example, using a ratio of <20, <30, <40 and <50 we get slopes of 16.5, 18.0, 23.4 and 33.9 µg m−3 per part per million, an increasing pattern (as would be expected). We found that smoke influence can be observed on some days at a PM2.5 CO ratio as low as 32. An example of this is 5 August 2018, when extensive and heavy smoke blanketed most of California, Nevada and other western states. PM2.5 and CO concentrations at Sparks were 22 µg m−3 and 0.68 ppm, respectively, for a PM2.5 CO ratio of 32. The relatively low ratio implies significant mixing of this smoke event with air containing a lower ratio, but the high PM2.5 concentrations and widespread smoke are consistent with a significant smoke influence on that day. Using the PM2.5 CO ratio to segregate the data, we found an improved correlation of PM2.5 and CO in the lower range of ratios compared with using the HMS as an indicator (Fig. 2).
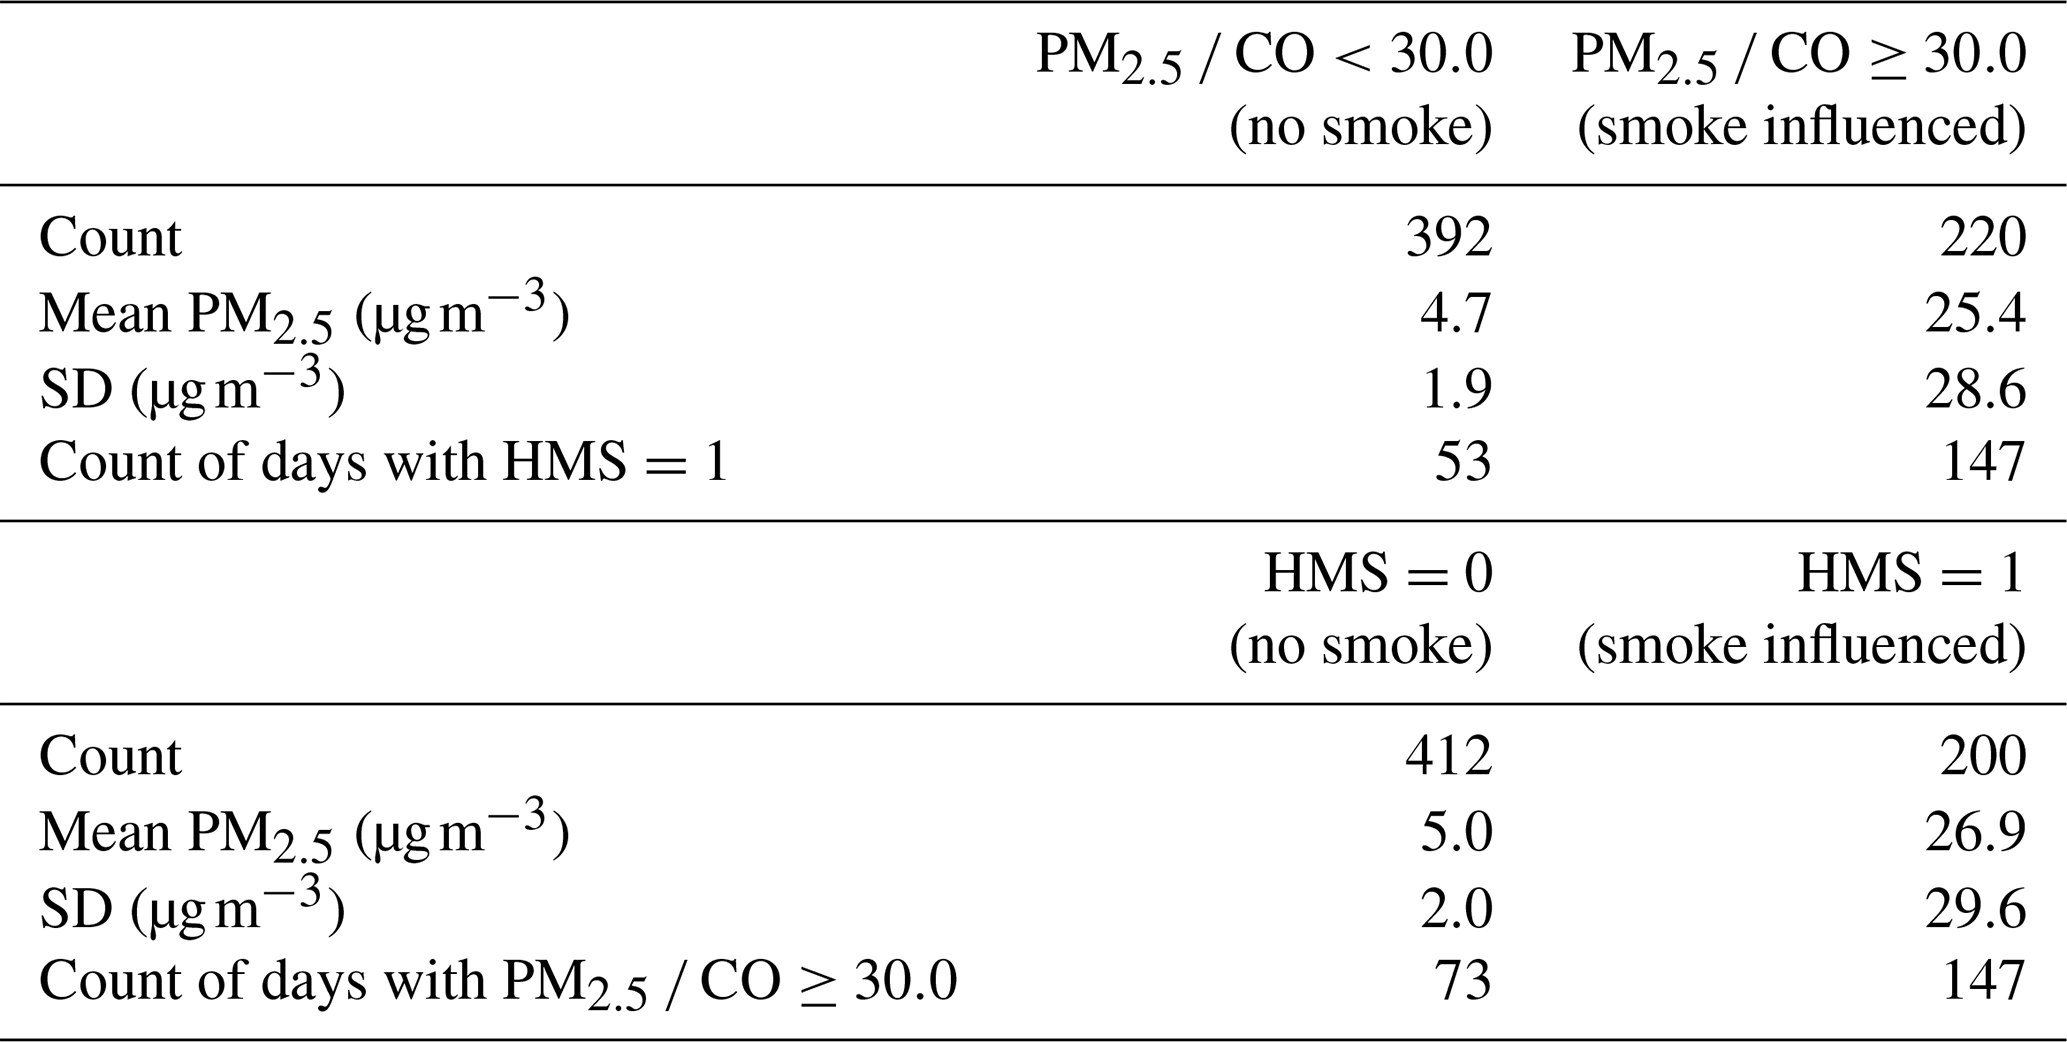
Table 3 summarizes the results. There are 612 d in the analysis, where 200 d have a positive HMS smoke identification and 220 d have PM2.5 CO ratios ≥30. There are 73 d with PM2.5 CO ratios ≥30 but without a positive HMS smoke identification and 53 d that have a positive HMS smoke identification but a low PM2.5 CO ratio (<30). The first category (high PM2.5 CO ratio but no HMS smoke) can be considered a false negative (smoke is present but not detected by HMS), whereas the second category (HMS smoke present but low PM2.5 CO ratios) can be considered a false positive. While there is relatively little difference between the mean and SD of the smoke-influenced and non-smoke data, the improved correlation suggests that the PM2.5 CO ratio is a better way to segregate the dataset. The exact choice of PM2.5 CO ratio depends on the certainty required. This is discussed in more detail using a Monte Carlo simulation, as described below.
Table 3Sparks daily PM2.5 and CO data for May–September 2018–2021, segregated by the PM2.5 CO ratio and by overhead HMS smoke.
We used the PM2.5 and CO data to develop a Monte Carlo simulation of the PM2.5 CO ratio for Reno using the following relationships:
where Rurban and Rsmoke are the NERs (ΔPMCO) to represent urban emissions and smoke, respectively. The smoke terms in Eqs. (1) and (2) were non-zero on one-third of the days, corresponding to the fractional incidence of HMS smoke. We explored a range of values for Rurban and Rsmoke as shown in Table 4. The parameters α and β were used to represent the log-normal distributions for urban PM2.5 with and without smoke PM2.5, respectively. Equations (1) and (2) include a background contribution to represent natural, biogenic and intercontinental sources of PM2.5 and CO. The background concentrations were set to 2 µg m−3 for PM2.5 and 0.2 ppm for CO. These background values were estimated based on observations from 2019, a low fire year, from a rural continental site (West Yellowstone, MT, AQS no. 300310017) and a marine background site (Cheeka Peak, WA, AQS no. 530090013). During the May–September 2019 period the West Yellowstone mean values for PM2.5 and CO were 2.5 µg m−3 and 0.24 ppm, whereas at the Cheeka Peak site the mean values were 2.1 µg m−3 and 0.08 ppm. Median values were very similar at both sites. We note that PM2.5 concentrations were similar at both sites, whereas CO was higher at the continental site. Given that Sparks, NV, is a continental and inland location, the West Yellowstone, MT, concentrations are likely more representative of its background concentrations. We also examined a range of background values for CO (0.1–0.2 ppm) and PM2.5 (1–3 µg m−3) and found little influence on the conclusions.
The Monte Carlo simulations estimate a range of observed PM2.5 and CO concentrations using Eqs. (1) and (2). The simulation computes 10 000 concentrations, where α, β, Rurban and Rsmoke are allowed to vary independently with values as defined in Table 4. These values were chosen to be consistent with the mean and SD of the non-smoke (α) and smoke (β) datasets, respectively, excluding the contribution from background concentrations. Note that the Monte Carlo simulations are intended to reflect the bulk distributions, so there is no correspondence between an individual day in the simulation and any particular day in the observations.

Figure 3PM2.5 CO ratio () vs. PM2.5. The black dots show the observations, and the blue diamonds, red circles and green squares show the influence of the Rsmoke parameter for the urban + smoke simulations. The simulation results are binned in 10 µg m−3 intervals centered on the indicated values. For these Monte Carlo simulations, Rurban is fixed at 40. Error bars show 1σ in the middle simulation. One observation is not shown (PM2.5 CO ratio of 122 and a PM2.5 concentration of 159 µg m−3).
Table 4Parameter values used in the Monte Carlo simulations. For the Rurban and Rsmoke parameters, multiple mean values are considered.
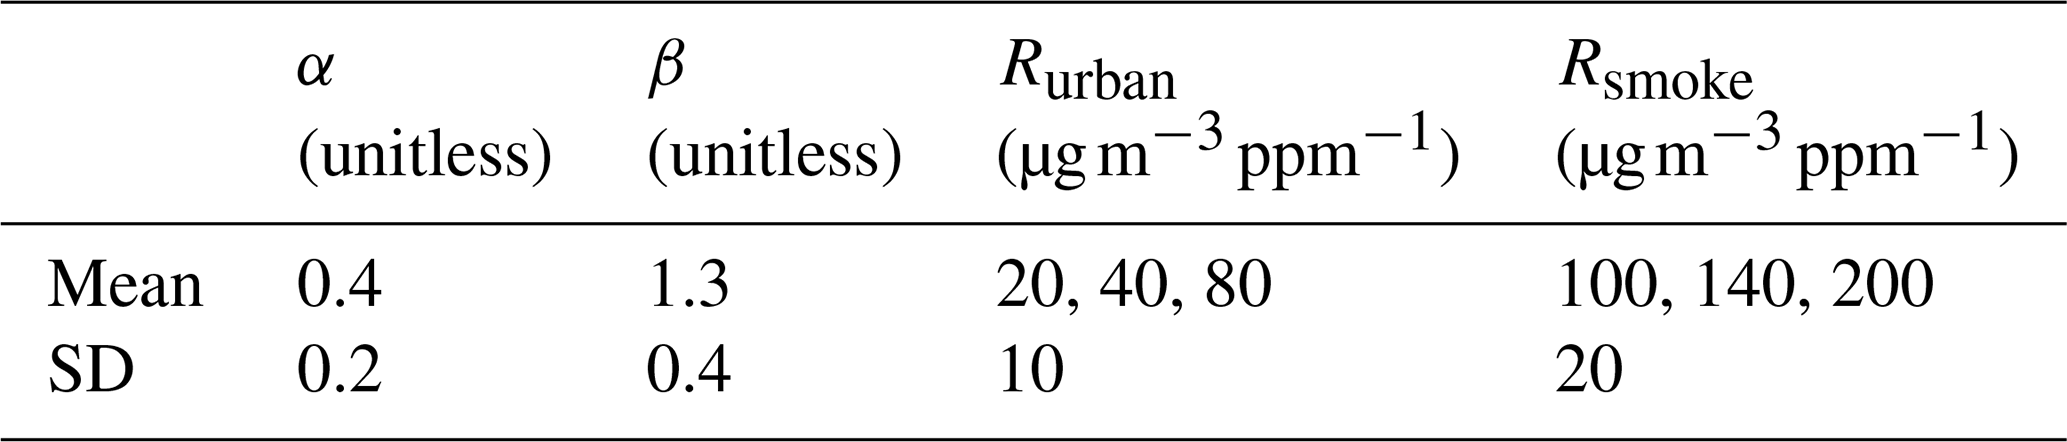
Figure 3 shows results of the simulation with varying mean values for the Rsmoke parameter. Even at very high PM2.5 concentrations, the observed PM2.5 CO ratio never exceeded 125 . The simulation suggests an optimum Rsmoke value of 140 . Thus, consistent with the work of Laing et al. (2017) and Selimovic et al. (2019, 2020), we found that the best-fit NER values at the surface were much lower than NERs reported for fresh or free tropospheric smoke plumes (200–300 ).
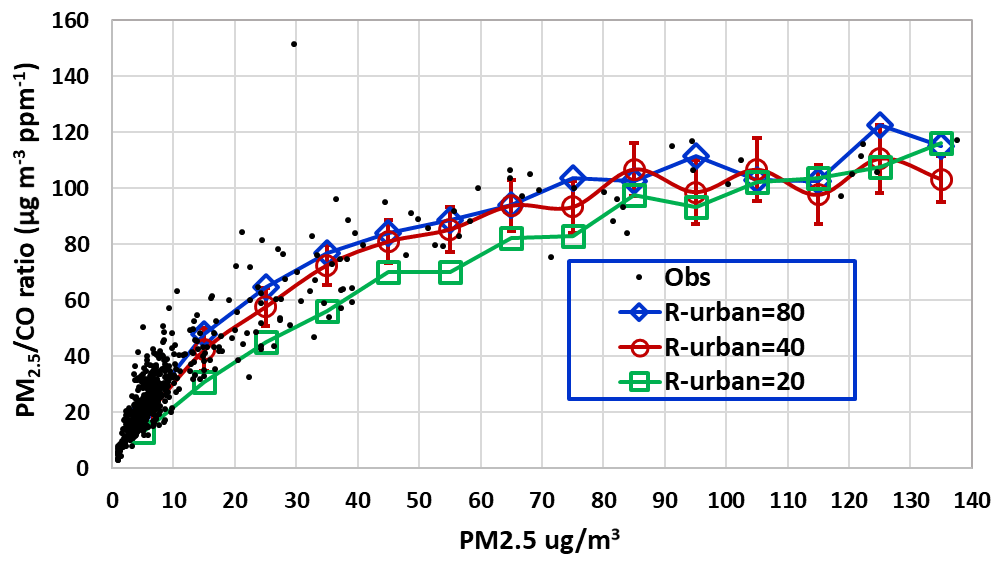
Figure 4PM2.5 CO ratio () vs. PM2.5. The black dots show the observations, and the blue diamonds, red circles and green squares show the influence of the Rurban parameter on the Monte Carlo simulations. The simulation results are binned in 10 µg m−3 intervals centered on the indicated values. For these simulations, Rsmoke is fixed at 140. Error bars show 1σ in the middle simulation. One observation is not shown (PM2.5 CO ratio of 122 and a PM2.5 concentration of 159 µg m−3).
Figure 4 shows the results of the simulations with varying values for the Rurban parameter. The best value of Rurban was more difficult to discern. At high PM2.5 concentrations and PM2.5 CO ratios, Rurban has very little influence on the simulated values. At the low range of PM2.5 concentrations, a value of 20 is clearly too low, but there is little difference between the other values so it is not clear which value is optimal. This parameter should reflect the primary PM2.5 and CO emissions in the area, plus contributions from secondary organic aerosol (e.g., Nault et al., 2021). For Washoe County, NV (the county containing Reno and Sparks), the EPA's 2017 National Emissions Inventory gives primary emissions of PM2.5 and CO of 1630 and 61 082 t per year, excluding wildfires and residential wood combustion. This corresponds to a PM2.5 CO emission ratio of 0.034 g PM2.5 g CO−1 or an enhancement ratio of 39 . Important constraints on using the Monte Carlo approach to discern the urban, non-smoke PM2.5 CO NER are limitations on the instrumentation and the impact of background concentrations at low PM2.5 and CO concentrations. Nonetheless, we found that using an Rurban parameter of either 40 or 80 has little influence on our results at higher PM2.5 concentrations. For the rest of this analysis, we used an Rsmoke value of 140 and an Rurban value of 40.
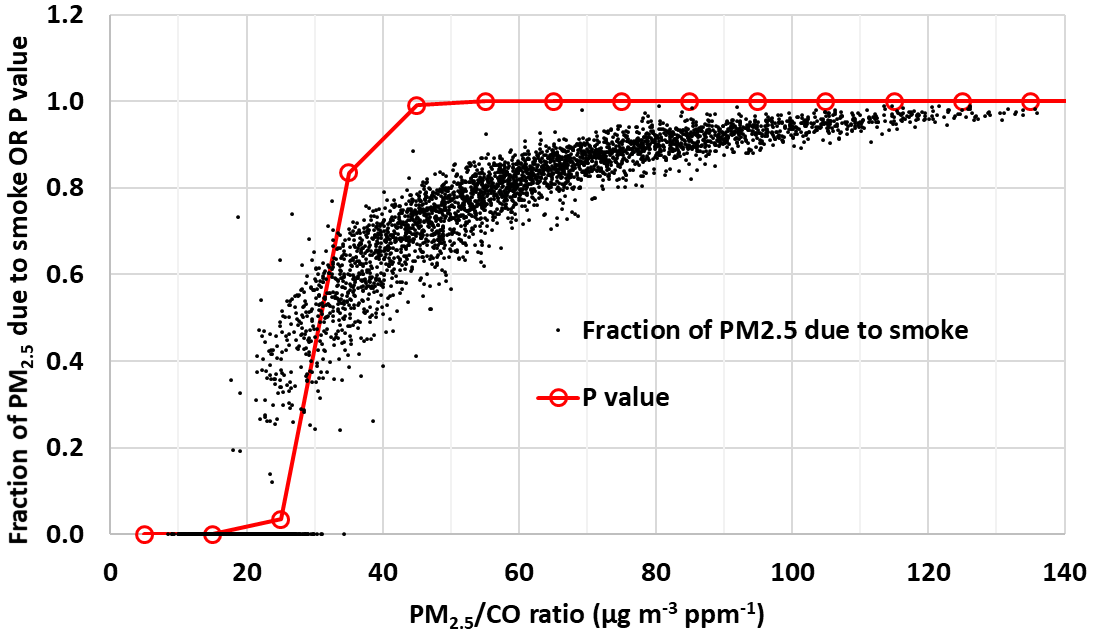
Figure 5Fraction of PM2.5 due to smoke vs. the PM2.5 CO ratio () as calculated from the Monte Carlo simulations. We note that the Monte Carlo simulations give a probabilistic relationship. So, for example, at a PM2.5 CO ratio of between 30 and 40 , 83 % of the points have more than half of the PM2.5 due to smoke. The open red circles show the probability that more than 50 % of the PM2.5 is due to smoke within each PM2.5 CO bin.
Figure 5 shows the fractional smoke contribution to PM2.5 vs. the PM2.5 CO NER from the Monte Carlo simulations. As specified in the model setup, two-thirds of the points have no smoke contribution. These have a mean PM2.5 CO value of 17, with a range of 6–34. As the Monte Carlo simulations represent a probabilistic approach, we can also look at the likelihood that a given set of points has a specific degree of smoke influence. Figure 5 shows the probability that a given set of PM2.5 CO ratios (binned in units of 10) has more than 50 % of the PM2.5 due to smoke. Thus, starting with the PM2.5 CO bin of 30–40, we have a very high probability (0.83) that more than 50 % of the PM2.5 mass is due to smoke and at a bin of 40–50 we have near certainty (0.993) that more than 50 % of the PM2.5 mass is due to smoke.
We can use the information in Fig. 5 to evaluate the likelihood that smoke contributed to the days with high PM2.5 or O3, as shown in Table 2. The years 2018, 2020 and 2021 all had a significant number of exceedances days (over the NAAQS), whereas the low fire year of 2019 had none. Using a PM2.5 CO value of 30.0 which, based on the Monte Carlo simulation, implies that smoke contributes more than half of the total PM2.5 on 85 % of days. Even using a smoke criteria of PM2.5 CO of 45, we found no change in the number of smoke-influenced days. Not surprisingly, the PM2.5 CO criteria identified all of the PM2.5 exceedance days as smoke influenced, using either smoke criteria (35 or 45). For O3, the results show that 24 out of the 28 exceedance days were smoke influenced using either criteria. While the PM2.5 CO ratio can quantitatively estimate the fraction of PM2.5 due to smoke (e.g., Fig. 5), we note that this approach cannot provide a quantitative estimate of the smoke contribution to the O3 levels. Other tools would be needed to quantify the smoke contribution to the MDA8 O3 values (e.g., Ninneman and Jaffe, 2021; Jaffe, 2021; Gong et al., 2017). Nonetheless, the results shown in Table 2 demonstrate that the PM2.5 CO ratio can identify days with a strong smoke signature.
The large difference in PM2.5 CO emission ratios between typical urban pollution and wildfire smoke gives rise to very different observed NERs in urban areas for non-smoke and smoke-influenced conditions. We used PM2.5 and CO data for May through September, when residential wood combustion is minimal, to develop a Monte Carlo simulation of the resulting ratios. We find that the Monte Carlo simulation that includes both smoke and non-smoke NERs can accurately reproduce the observed NERs and provide a measure of smoke influence in an urban area. The model supports earlier work that found the PM2.5 CO NER in biomass-burning-influenced plumes at surface sites is approximately half of that observed in fresh emissions and in cooler environments. This is likely caused by loss of PM2.5 mass during transport due to dilution and warmer temperatures at surface sites. For the Sparks, NV, monitoring site we found that at a PM2.5 CO ratio of 35 biomass burning contributed more than half of the total PM2.5 on 85 % of days. To apply the Monte Carlo simulation at other sites requires that the parameters in Table 4 be adjusted to fit the local data. The Rurban parameter would need to be adjusted based on local emissions and observations, and the α and β parameters would need to be fit based on the observed non-smoke and smoke concentrations, respectively.
This analysis demonstrates that it is possible to identify wildfire smoke at the surface based on commonly measured air pollutants with high confidence. While satellite data can also identify smoke influence, these have both high false positive and negative rates, meaning that many days identified by satellite products as having overhead smoke show little or no influence at the surface and many days that have smoke at the surface are missed by the HMS product. We conclude that the observed PM2.5 CO ratio provides a more robust signal of surface smoke in urban areas with no false positives.
All data used in this analysis are publicly available from the EPA via the AirData site (https://www.epa.gov/outdoor-air-quality-data; US EPA, 2022a) and the AirnowTech site (https://www.airnowtech.org/; US EPA, 2022b).
DAJ designed the study and wrote the manuscript. BS and DI helped identify useful sites and reviewed the analysis.
The contact author has declared that none of the authors has any competing interests.
Publisher's note: Copernicus Publications remains neutral with regard to jurisdictional claims in published maps and institutional affiliations.
The authors acknowledge helpful comments from Nathan May and Matthew Ninneman.
This research has been supported by the National Oceanic and Atmospheric Administration (grant no. NA17OAR431001).
This paper was edited by Eleanor Browne and reviewed by Farren L. Herron-Thorpe and one anonymous referee.
Akagi, S. K., Yokelson, R. J., Wiedinmyer, C., Alvarado, M. J., Reid, J. S., Karl, T., Crounse, J. D., and Wennberg, P. O.: Emission factors for open and domestic biomass burning for use in atmospheric models, Atmos. Chem. Phys., 11, 4039–4072, https://doi.org/10.5194/acp-11-4039-2011, 2011.
Andreae, M. O.: Emission of trace gases and aerosols from biomass burning – an updated assessment, Atmos. Chem. Phys., 19, 8523–8546, https://doi.org/10.5194/acp-19-8523-2019, 2019.
Baez, J. C. and Tweed, D.: Monte Carlo methods in Climate Science, Math Horizons, November 2013, https://www.maa.org/sites/default/files/pdf/horizons/baeztweed_nov13.pdf, last access: May 2022.
Brey, S. J., Ruminski, M., Atwood, S. A., and Fischer, E. V.: Connecting smoke plumes to sources using Hazard Mapping System (HMS) smoke and fire location data over North America, Atmos. Chem. Phys., 18, 1745–1761, https://doi.org/10.5194/acp-18-1745-2018, 2018.
Briggs, N. L., Jaffe, D. A., Gao, H., Hee, J. R., Baylon, P. M., Zhang, Q., Zhou, S., Collier, S. C., Sampson, P. D., and Cary, R. A.: Particulate matter, ozone, and nitrogen species in aged wildfire plumes observed at the Mount Bachelor Observatory, Aerosol Air Qual. Res., 16, 3075–3087, https://doi.org/10.4209/aaqr.2016.03.0120, 2016.
Buysse, C. E., Kaulfus, A., Nair, U., and Jaffe, D. A.: Relationships between particulate matter, ozone, and nitrogen oxides during urban smoke events in the western US, Environ. Sci. Technol., 53, 12519–12528, https://doi.org/10.1021/acs.est.9b05241, 2019.
Chandra, B. P., McClure, C. D., Mulligan, J., and Jaffe, D. A.: Optimization of a method for the detection of biomass-burning relevant VOCs in urban areas using thermal desorption gas chromatography mass spectrometry, Atmosphere, 11, 276, https://doi.org/10.3390/atmos11030276, 2020.
Collier, S., Zhou, S., Onasch, T. B., Jaffe, D. A., Kleinman, L., Sedlacek, A. J., Briggs, N. L., Hee, J., Fortner, E., Shilling, J. E., Worsnop, D., Yokelson, R. J., Parworth, C., Ge, X., Xu, J., Butterfield, Z., Chand, D., Dubey, M. K., Pekour, M. S., Springston, S., and Zhang, Q.: Regional Influence of Aerosol Emissions from Wildfires Driven by Combustion Efficiency: Insights from the BBOP Campaign, Environ. Sci. Technol., 50, 8613–8622, https://doi.org/10.1021/acs.est.6b01617, 2016.
DeBell, L. J., Talbot, R. W., Dibb, J. E., Munger, J. W., Fischer, E. V., and Frolking, S. E.: A major regional air pollution event in the northeastern United States caused by extensive forest fires in Quebec, Canada, J. Geophys. Res.-Atmos., 109, D19305, https://doi.org/10.1029/2004jd004840, 2004.
Doubleday, A., Schulte, J., Sheppard, L., Kadlec, M., Dhammapala, R., Fox, J., and Busch Isaksen, T.: Mortality associated with wildfire smoke exposure in Washington State, 2006–2017: a case-crossover study, Environ. Health, 19, 4, https://doi.org/10.1186/s12940-020-0559-2, 2020.
Duncan, B. N., Prados, A. I., Lamsal, L. N., Liu, Y., Streets, D. G., Gupta, P., Hilsenrath, E., Kahn, R. A., Nielsen, J. E., Beyersdorf, A. J., Burton, S. P., Fiore, A. M., Fishman, J., Henze, D. K., Hostetler, C. A., Krotkov, N. A., Lee, P., Lin, M., Pawson, S., Pfister, G., Pickering, K. E., Pierce, R. B., Yoshida, Y., and Ziemba, L. D.: Satellite data of atmospheric pollution for U.S. air quality applications: Examples of applications, summary of data end-user resources, answers to FAQs, and common mistakes to avoid, Atmos. Environ., 94, 647–662, https://doi.org/10.1016/j.atmosenv.2014.05.061, 2014.
Ebi, K. L., Vanos, J., Baldwin, J. W., Bell, J. E., Hondula, D. M., Errett, N. A., Hayes, K., Reid, C. E., Saha, S., Spector, J., and Berry, P.: Extreme weather and climate change: Population health and health system implications, Annu. Rev. Publ. Health, 42, 293–315, https://doi.org/10.1146/annurev-publhealth-012420-105026, 2021.
Gan, R. W., Liu, J., Ford, B., O'Dell, K., Vaidyanathan, A., Wilson, A., Volckens, J., Pfister, G., Fischer, E. V., Pierce, J. R., and Magzamen, S.: The association between wildfire smoke exposure and asthma-specific medical care utilization in Oregon during the 2013 wildfire season, J. Expo, Sci. Environ. Epidemiol., 30, 618–628, https://doi.org/10.1038/s41370-020-0210-x, 2020.
Garofalo, L. A., Pothier, M. A., Levin, E. J. T., Campos, T., Kreidenweis, S. M., and Farmer, D. K.: Emission and evolution of submicron organic aerosol in smoke from wildfires in the western United States, ACS Earth Space Chem., 3, 1237–1247, https://doi.org/10.1021/acsearthspacechem.9b00125, 2019.
Gong, X., Kaulfus A., Nair, U., and Jaffe, D. A.: Quantifying O3 impacts in urban areas due to wildfires using a Generalized Additive Model, Environ. Sci. Tech., 55, 13216–13223, https://doi.org/10.1021/acs.est.7b03130, 2017.
Holloway, T., Miller, D., Anenberg, S., Diao, M., Duncan, B., Fiore, A. M., Henze, D. K., Hess, J., Kinney, P. L., Liu, Y., Neu, J. L., O'Neill, S. M., Odman, M. T., Pierce, R. B., Russell, A. G., Tong, D., West, J. J., and Zondlo, M. A.: Satellite monitoring for air quality and health, Annu. Rev. Biomed. Data Sci., 4, 417–447, https://doi.org/10.1146/annurev-biodatasci-110920-093120, 2021.
Huangfu, Y., Yuan, B., Wang, S., Wu, C., He, X., Qi, J., deGouw, J., Warneke, C., Gilman, J. B., Wistahler, A., Karl, T., Graus, M., Jobson, B. T., and Shao, M.: Revisiting acetonitrile as tracer of biomass burning in anthropogenic-influenced environments, Geophys. Res. Lett., 48, e2020GL092322, https://doi.org/10.1029/2020GL092322, 2021.
Jaffe, D.: Evaluation of Ozone Patterns and Trends in 8 Major Metropolitan Areas in the U.S. Final project report for CRC Project A-124, Coordinating Research Council, Alpharetta, GA, http://crcao.org/wp-content/uploads/2021/04/CRC-Project-A-124-Final-Report_Mar2021.pdf (last access: 10 September 2022), March 2021.
Jaffe, D. A., Bertschi, I., Jaegle, L., Novelli, P., Reid, J. S., Tanimoto, H., Vingarzan, R., and Westphal, D. L.: Long-range transport of Siberian biomass burning emissions and impact on surface ozone in western North America, Geophys. Res. Lett., 31, L16106, https://doi.org/10.1029/2004GL020093, 2004.
Jaffe, D. A., O'Neill, S. M., Larkin, N. K., Holder, A. L., Peterson, D. L., Halofsky, J. E., and Rappold, A. G.: Wildfire and prescribed burning impacts on air quality in the United States, J. Air Waste Manage. Assoc., 70, 583–615, https://doi.org/10.1080/10962247.2020.1749731, 2020.
Kahn, R.: A global perspective on wildfires, Eos, 101, https://doi.org/10.1029/2020EO138260, 2020.
Kalashnikov, D. A., Schnell, J. L., Abatzoglou, J. T., Swain, D. L., and Singh, D.: Increasing co-occurrence of fine particulate matter and ground-level ozone extremes in the western United States, Sci. Adv., 8, eabi9386, https://doi.org/10.1126/sciadv.abi9386, 2022.
Kaulfus, A. S., Nair, U., Jaffe, D., Christopher, S. A., and Goodrick, S.: Biomass burning smoke climatology of the United States: implications for particulate matter air quality, Environ. Sci. Technol., 51, 11731–11741, https://doi.org/10.1021/acs.est.7b03292, 2017.
Kiser, D., Elhanan, G., Metcalf, W. J., Schneider B., and Grzymski J. J. SARS-CoV-2 test positivity rate in Reno, Nevada: association with PM2.5 during the 2020 wildfire smoke events in the western United States, J. Expo. Sci. Environ. Epidemiol., 31, 797–803, https://doi.org/10.1038/s41370-021-00366-w, 2021.
Kleinman, L. I., Sedlacek III, A. J., Adachi, K., Buseck, P. R., Collier, S., Dubey, M. K., Hodshire, A. L., Lewis, E., Onasch, T. B., Pierce, J. R., Shilling, J., Springston, S. R., Wang, J., Zhang, Q., Zhou, S., and Yokelson, R. J.: Rapid evolution of aerosol particles and their optical properties downwind of wildfires in the western US, Atmos. Chem. Phys., 20, 13319–13341, https://doi.org/10.5194/acp-20-13319-2020, 2020.
Laing, J. R., Jaffe, D. A., Slavens, A. P., Li, W. T., and Wang, W. X.: Can ΔPMCO and ΔNOCO enhancement ratios be used to characterize the influence of wildfire smoke in urban areas?, Aerosol Air Qual. Res., 17, 2413–2423, https://doi.org/10.4209/aaqr.2017.02.0069, 2017.
Lu, X., Zhang, L., Yue, X., Zhang, J., Jaffe, D. A., Stohl, A., Zhao, Y., and Shao, J.: Wildfire influences on the variability and trend of summer surface ozone in the mountainous western United States, Atmos. Chem. Phys., 16, 14687–14702, https://doi.org/10.5194/acp-16-14687-2016, 2016.
McClure, C. D. and Jaffe, D. A.: US particulate matter air quality improves except in wildfire-prone areas, P. Natl. Acad. Sci. USA, 115, 7901–7906, https://doi.org/10.1073/pnas.1804353115, 2018.
Nault, B. A., Jo, D. S., McDonald, B. C., Campuzano-Jost, P., Day, D. A., Hu, W., Schroder, J. C., Allan, J., Blake, D. R., Canagaratna, M. R., Coe, H., Coggon, M. M., DeCarlo, P. F., Diskin, G. S., Dunmore, R., Flocke, F., Fried, A., Gilman, J. B., Gkatzelis, G., Hamilton, J. F., Hanisco, T. F., Hayes, P. L., Henze, D. K., Hodzic, A., Hopkins, J., Hu, M., Huey, L. G., Jobson, B. T., Kuster, W. C., Lewis, A., Li, M., Liao, J., Nawaz, M. O., Pollack, I. B., Peischl, J., Rappenglück, B., Reeves, C. E., Richter, D., Roberts, J. M., Ryerson, T. B., Shao, M., Sommers, J. M., Walega, J., Warneke, C., Weibring, P., Wolfe, G. M., Young, D. E., Yuan, B., Zhang, Q., de Gouw, J. A., and Jimenez, J. L.: Secondary organic aerosols from anthropogenic volatile organic compounds contribute substantially to air pollution mortality, Atmos. Chem. Phys., 21, 11201–11224, https://doi.org/10.5194/acp-21-11201-2021, 2021.
Ninneman, M. and Jaffe, D. A.: The impact of wildfire smoke on ozone production in an urban area: Insights from field observations and photochemical box modeling, Atmos. Environ., 267, 118764, https://doi.org/10.1016/j.atmosenv.2021.118764, 2021.
O'Dell, K., Hornbrook, R. S., Permar, W., Levin, E. J. T., Garofalo, L. A., Apel, E. C., Blake, N. J., Jarnot, A., Pothier, M. A., Farmer, D. K., Hu, L., Campos, T., Ford, B., Pierce, J. R., and Fischer, E. V.: Hazardous air pollutants in fresh and aged western US wildfire smoke and implications for long-term exposure, Environ. Sci. Technol., 54, 11838–11847, https://doi.org/10.1021/acs.est.0c04497, 2020.
O'Dell, K., Bilsback, K., Ford, B., Martenies, S. E., Magzamen, S., Fischer, E. V., and Pierce, J. R.: Estimated mortality and morbidity attributable to smoke plumes in the United States: not just a western US problem, GeoHealth, 5, e2021GH000457, https://doi.org/10.1029/2021GH000457, 2021.
O'Neill, S. M., Diao, M., Raffuse, S., Al-Hamdan, M., Barik, M., Jia, Y., Reid, S., Zou, Y., Tong, D., West, J. J., Wilkins, J., Marsha, A., Freedman, F., Vargo, J., Larkin, N. K., Alvarado, E., and Loesche, P.: A multi-analysis approach for estimating regional health impacts from the 2017 Northern California wildfires, J. Air Waste Manage. Assoc., 71, 791–814, https://doi.org/10.1080/10962247.2021.1891994, 2021.
Permar, W., Wang, Q., Selimovic, V., Wielgasz, C., Yokelson, R. J., Hornbrook, R. S., Hills, A. J., Apel, E. C., Ku, I.-T., Zhou, Y., Sive, B. C., Sullivan, A. P., Collett Jr., J. L., Campos, T. L., Palm, B. B., Peng, Q., Thornton, J. A., Garofalo, L. A., Farmer, D. K., Kreidenweis, S. M., Levin, E. J. T., DeMott, P. J., Flocke, F., Fischer, E. V., and Hu, L.: Emissions of trace organic gases from western U.S. wildfires based on WE-CAN aircraft measurements, J. Geophys. Res.-Atmos., 126, e2020JD033838, https://doi.org/10.1029/2020JD033838, 2021.
Rogers, H. M., Ditto, J. C., and Gentner, D. R.: Evidence for impacts on surface-level air quality in the northeastern US from long-distance transport of smoke from North American fires during the Long Island Sound Tropospheric Ozone Study (LISTOS) 2018, Atmos. Chem. Phys., 20, 671–682, https://doi.org/10.5194/acp-20-671-2020, 2020.
Rolph, G. D., Draxler, R. R., Stein, A. F., Taylor, A., Ruminski, M. G., Kondragunta, S., Zeng, J., Huang, H. C., Manikin, G., McQueen, J. T., and Davidson, P. M.: Description and verification of the NOAA Smoke Forecasting System: the 2007 fire season, Weather Forecast., 24, 361–378, https://doi.org/10.1175/2008waf2222165.1, 2009.
Selimovic, V., Yokelson, R. J., McMeeking, G. R., and Coefield, S.: In situ measurements of trace gases, PM, and aerosol optical properties during the 2017 NW US wildfire smoke event, Atmos. Chem. Phys., 19, 3905–3926, https://doi.org/10.5194/acp-19-3905-2019, 2019.
Selimovic, V., Yokelson, R. J., McMeeking, G. R., and Coefield, S.: Aerosol mass and optical properties, smoke influence on O3, and high NO3 production rates in a western U.S. city impacted by wildfires, J. Geophys. Res.-Atmos., 125, e2020JD032791, https://doi.org/10.1029/2020JD032791, 2020.
Singh, H. B., Cai, C., Kaduwela, A., Weinheimer, A., and Wisthaler, A.: Interactions of fire emissions and urban pollution over California: Ozone formation and air quality simulations, Atmos. Environ., 56, 45–51, https://doi.org/10.1016/j.atmosenv.2012.03.046, 2012.
Sorensen, C., House, J. A., O'Dell, K., Brey, S. J., Ford, B., Pierce, J. R., Fischer, E. V., Lemery, J., and Crooks, J. L.: Associations between wildfire-related PM2.5 and intensive care unit admissions in the United States, 2006–2015, GeoHealth, 5, e2021GH000385, https://doi.org/10.1029/2021GH000385, 2021.
Teakles, A. D., So, R., Ainslie, B., Nissen, R., Schiller, C., Vingarzan, R., McKendry, I., Macdonald, A. M., Jaffe, D. A., Bertram, A. K., Strawbridge, K. B., Leaitch, W. R., Hanna, S., Toom, D., Baik, J., and Huang, L.: Impacts of the July 2012 Siberian fire plume on air quality in the Pacific Northwest, Atmos. Chem. Phys., 17, 2593–2611, https://doi.org/10.5194/acp-17-2593-2017, 2017.
U.S. Environmental Protection Agency: 2017 National Emissions Inventory (NEI) Data, https://www.epa.gov/air-emissions-inventories/2017-national-emissions-inventory-nei-data, last access: 21 January 2022.
US EPA: Air Data: Air Quality Data Collected at Outdoor Monitors Across the US, US EPA [data set], https://www.epa.gov/outdoor-air-quality-data, last access: 10 September 2022a.
US EPA: AirNow, US EPA [data set], https://www.airnowtech.org/, last access: 10 September 2022b.
Xiu, M., Jayaratne, R., Thai, P., Christensen, B., Zing, I., Liu, X., and Morawska, L. Evaluating the applicability of the ratio of PM2.5 and carbon monoxide as source signatures, Environ. Pollut., 306, 119278, https://doi.org/10.1016/j.envpol.2022.119278, 2022.
Ye, X., Arab, P., Ahmadov, R., James, E., Grell, G. A., Pierce, B., Kumar, A., Makar, P., Chen, J., Davignon, D., Carmichael, G. R., Ferrada, G., McQueen, J., Huang, J., Kumar, R., Emmons, L., Herron-Thorpe, F. L., Parrington, M., Engelen, R., Peuch, V.-H., da Silva, A., Soja, A., Gargulinski, E., Wiggins, E., Hair, J. W., Fenn, M., Shingler, T., Kondragunta, S., Lyapustin, A., Wang, Y., Holben, B., Giles, D. M., and Saide, P. E.: Evaluation and intercomparison of wildfire smoke forecasts from multiple modeling systems for the 2019 Williams Flats fire, Atmos. Chem. Phys., 21, 14427–14469, https://doi.org/10.5194/acp-21-14427-2021, 2021.
Zhuang, Y., Fu, R., Santer, B. D., Dickinson, R. E., and Hall, A.: Quantifying contributions of natural variability and anthropogenic forcings on increased fire weather risk over the western United States, P. Natl. Acad. Sci. USA, 118, e2111875118, https://doi.org/10.1073/pnas.2111875118, 2021.