the Creative Commons Attribution 4.0 License.
the Creative Commons Attribution 4.0 License.
 | 21 Sep 2022
Parameterizations of size distribution and refractive index of biomass burning organic aerosol with black carbon content
Biao Luo
Qicong Song
Weiwei Hu
Wei Li
Yuwen Peng
Duohong Chen
Dingli Yue
Min Shao
Biomass burning organic aerosol (BBOA) impacts significantly on climate directly through scattering and absorbing solar radiation and indirectly through acting as cloud condensation nuclei. However, fundamental parameters in the simulation of BBOA radiative effects and cloud activities such as size distribution and refractive index remain poorly parameterized in models. In this study, biomass burning events with high combustion efficiency characterized by a high black carbon (BC) to BBOA ratio (0.22 on average) were frequently observed during autumn in the Pearl River Delta region, China. An improved absorption Ångström exponent (AAE) ratio method considering both variations and spectral dependence of black carbon AAE was proposed to differentiate brown carbon (BrC) absorptions from total aerosol absorptions. BBOA size distributions, mass scattering and absorption efficiency were retrieved based on the changes in aerosol number size distribution, scattering coefficients and derived BrC absorptions that occurred with BBOA spikes. Geometric mean diameter of BBOA volume size distribution Dgv depended largely on combustion conditions, ranging from 245 to 505 nm, and a linear relationship between Dgv and was achieved. The retrieved real part of the BBOA refractive index ranges from 1.47 to 1.64, with evidence showing that its variations might depend largely on combustion efficiency, which is rarely investigated in existing literature but which however requires further comprehensive investigations. Retrieved imaginary parts of BBOA refractive index (mi,BBOA) correlated highly with (R>0.88) but differ a lot from previous parameterization schemes. The reason behind the inconsistency might be that single formula parameterizations of mi,BBOA over the whole range were used in previous studies which might deviate substantially for specific ranges. Thus, a new scheme that parameterizes wavelength-dependent mi,BBOA was presented, which filled the gap for field-based BBOA absorptivity parameterizations of >0.1. These findings have significant implications for simulating BBOA climate effects and suggest that linking both BBOA refractive index and BBOA volume size distributions to BC content might be a feasible and a good choice for climate models.
- Article
(3824 KB) - Full-text XML
- Companion paper
-
Supplement
(2597 KB) - BibTeX
- EndNote


Biomass burning organic aerosol (BBOA) emitted from natural and anthropogenic fire activities represents a major fraction of atmospheric primary organic aerosols and impacts significantly on climate and regional air quality directly through scattering and absorbing solar radiation and indirectly through acting as cloud condensation nuclei (Saleh et al., 2014, 2015; Q. Wang et al., 2016; Zhang et al., 2020; L. Liu et al., 2020). BBOA size distributions are crucial for simulating aerosol–cloud interactions, and BBOA scattering plays a significant role in direct aerosol cooling effects and local visibility degradation. BBOA is also a major contributor to atmospheric brown carbon (BrC) on a global scale (Q. Wang et al., 2016) because of its non-negligible light absorption contribution in the near-ultraviolet to visible wavelength. Accurate representations of BBOA size distributions, scattering and absorption in climate models are crucial for BBOA radiative forcing simulations, and bias in biomass burning absorption representations in models can result in a biomass burning radiative forcing range from cooling to warming (Brown et al., 2021). BBOA size distribution and refractive index are fundamental parameters in the simulation of BBOA radiative effects and cloud activities; however, they remain poorly parameterized in models. Currently, our comprehensive knowledge of BBOA optical and physical properties is primarily obtained from laboratory measurements (Janhäll et al., 2010; Saleh et al., 2013; McClure et al., 2020). Although field measurements of biomass burning events were reported by many studies (Laskin et al., 2015), however, only a few of them focused simultaneously on both BBOA size distributions and optical properties (Reid et al., 2005a, b; Laing et al., 2016), and their parameterizations were reported by few studies. Comprehensive field measurements and simultaneous characterization of BBOA size distributions, scattering and absorption properties, and retrieval of real and imaginary parts of BBOA refractive index, as well as their parameterizations, remain lacking, hindering the accurate representation of BBOA size distributions and refractive index in climate models.
In situ field-measured aerosols are mixtures of different aerosol components emitted from different sources and formed through different pathways. The BBOA mass concentrations might be identified through source apportionment of organic aerosols using the positive matrix factorization (PMF) technique on the basis of aerosol mass spectrometer measurements (Kuang et al., 2021). However, the BBOA size distributions, BBOA scattering properties and BBOA light absorptions are usually quite difficult to separate from properties of the entire aerosol populations. As a result, BBOA physical properties such as size distribution, mass scattering efficiency (MSE), mass absorption efficiency (MAE) and refractive index of biomass burning aerosols characterized through in situ field measurements are usually not specific to BBOA (Laing et al., 2016). Especially the parameterization of the imaginary part of the BBOA refractive index (mi,BBOA) has received wide attention in recent years due to its critical role in BBOA absorptivity representation in climate models (Saleh, 2020). However, the currently available parameterization schemes were primarily based on laboratory experiments, with very few field-measurement-based results available (Lu et al., 2015). Liu et al. (2021) observed the evolution of mi,BBOA in a real atmospheric environment chamber for different fire conditions at hourly scales after emission under different oxidation conditions. Still, the spectral dependence parameterization of mi,BBOA on the basis of in situ field measurements covering a wavelength range from ultraviolet to near-infrared remains lacking.
The key reason limiting the on-line characterization of BBOA refractive index based on the real atmosphere measurements is that the on-line accurate quantification of BrC light absorption has been a challenge due to the entanglement of black carbon (BC) absorption. Many studies have shown that the distinct difference between BC and BrC spectral absorption characteristics represented by the Ångström law can be used to segregate BrC absorptions from measured total aerosol absorptions by assuming a constant absorption Ångström exponent (AAE) of BC (AAEBC) (de Sá et al., 2019; X. Wang et al., 2016; Yang et al., 2009). The BrC absorption retrieval accuracy of this constant AAE method depends highly on the representativeness of used AAEBC. Results of field and laboratory studies demonstrated that AAEBC varies under different pollution and emission conditions (Zhang et al., 2019; Laskin et al., 2015). Model simulations and field observations show that AAEBC is affected by many factors such as BC mixing state, morphology, BC mass size distribution and optical wavelength, and values of AAEBC can reach up to 1.6 for specific wavelength pairs (Lack and Cappa, 2010). Recent studies have modified the AAE method through a better consideration of AAEBC variations. Zhang et al. (2019) used the AAE880–990 obtained from real-time Aethalometer measurements as AAEBC, considering that aerosol absorptions at near-infrared wavelengths are associated only with BC. Other studies determined AAEBC through Mie theory simulations using constrained BC mass or BC mixing states as inputs (Li et al., 2019; Wang et al., 2018; Qin et al., 2018; X. Wang et al., 2016). Wang et al. (2018) found remarkable AAEBC wavelength dependence and a relatively stable ratio for AAEBC of certain wavelength ranges, which could be used to represent spectral dependence of AAEBC. However, this ratio method proposed by Wang et al. (2018) assumes that BrC absorption contributes negligibly at 520 nm, which might bring some uncertainties and cannot be used to retrieve the spectral characterization of BrC absorption for wavelengths near and beyond 520 nm.
In this study, aerosol chemical compositions, size distributions, and aerosol scattering and absorption coefficients were measured at a rural site in the Pearl River Delta (PRD) region of China, where biomass burning events frequently occurred in autumn and played significant roles in regional air quality (Liu et al., 2014). An improved method considering both variations and spectral dependence of AAEBC was proposed to quantify the BrC absorption spectral dependence from 370 to 660 nm. The differential method was applied to biomass burning events to estimate BBOA scattering and absorption properties, as well as BBOA size distributions. The combination of identified BBOA size distributions, MSE and MAE was used to retrieve the real and imaginary parts of BBOA refractive index using the Mie theory, based on which the parameterizations of BBOA size distributions and refractive index using the ratio were investigated.
2.1 Field measurements
Field measurements were performed from 30 September to 17 November 2019 at a rural site in Heshan county, Guangdong Province, China. The site is located at the top of a small hill surrounded by small villages and residential towns, and it usually experiences air masses from cities of the highly industrialized PRD region. This site is authorized as a supersite operated by the provincial environmental monitoring authority, and therefore continuous qualified measurements of meteorological parameters such as air temperature, relative humidity (RH), wind speed and wind direction, as well as pollutant measurements such as of carbon monoxide, ozone and nitrogen oxides, are carried out. Physical and chemical properties of ambient aerosol were comprehensively measured during this field campaign, including multi-wavelength (450, 525, 635 nm) aerosol scattering coefficient (nephelometer, Aurora 3000) measurements under nearly dry (RH <30 %) and controlled but fixed RH conditions using humified nephelometer system (Kuang et al., 2020), multi-wavelength absorption measurements using an Aethalometer (Magee, AE33; Drinovec et al., 2015), aerosol size distribution measurements using a scanning mobility particle sizer (SMPS, TSI 3080) and an aerodynamic particle sizer (APS, TSI Inc., Model 3321), and aerosol chemical composition measurements using a soot particle aerosol mass spectrometer. The AE33 measurements were only valid from 30 September to 31 October. Continuous and stable measurements of aerosol chemical composition using the aerosol mass spectrometer measurements were valid from 10 October onwards. More details on the site and instrument set-up can be found in Kuang et al. (2021).
Accurate AAE and absorption measurements are crucial for the BrC quantification. Results of previous comparison studies of aerosol absorption measurements between the AE33 and photoacoustic soot spectrometer demonstrated that AAE will only be slightly influenced by the particle collection of AE33 on the filter (Saleh et al., 2013; Zhao et al., 2020). However, aerosol absorption values measured by AE33 bear uncertainties associated with loading and multiple scattering effects. Dual-spot mode was applied in AE33 measurements for dealing with the Aethalometer loading effect. A multiple-scattering correction factor (C) was used to convert the measured attenuation coefficient (bATN) by AE33 to the absorption coefficient of ambient aerosols (babs) at each wavelength through . C is considered to be dependent on filter tape (Drinovec et al., 2015), and aerosol chemical compositions (Wu et al., 2009; Collaud Coen et al., 2010). Results of Yus-Díez et al. (2021) showed that C values increased considerably when single scattering albedo (SSA) is higher than 0.95. However, as shown in Fig. S5, SSA is much lower than 0.95 during this field campaign with an average of 0.78. Moreover, the filter tape 8060 was used for AE33 during this field campaign. Zhao et al. (2020) evaluated C of filter tape 8060 through comparing AE33 measurements with a three-wavelength photoacoustic soot spectrometer, and their results demonstrated that C is almost independent of wavelength and differs little among measurements of different locations. Thus the wavelength-independent C of filter tape 8060 of 2.9 recommended by Zhao et al. (2020) was used, and this value is also almost the median value of C ranges used in Kasthuriarachchi et al. (2020).
2.2 Aerosol mass spectrometer measurements
The size-resolved aerosol chemical compositions of dried aerosol particles with aerodynamic diameter less than 1 µm were measured using a soot particle aerosol mass spectrometer (SP-AMS, Aerodyne Research, Inc., Billerica, MA, USA). As discussed in Kuang et al. (2021), the mass concentrations of aerosol chemical compositions from SP-AMS were validated by offline PM2.5 filter measurements, SMPS aerosol volume concentration measurements and online measurements for inorganic aerosol components. The source identification of organic aerosols was conducted using the PMF method based on the high-resolution organic aerosol (OA) data collected in V-mode (only tungsten vaporizer). As introduced in Sect. S1 of the Supplement, six OA factors were identified based on the best performance criteria of PMF quality parameters, and more details about the determination factor number and factor sources are presented in Sect. S1. Two primary OA factors include BBOA () and hydrocarbon-like organic aerosols (HOAs, containing cooking emissions, ). The other four factors were associated with secondary formations or ageing processes: (1) more oxygenated organic aerosols (MOOAs, , associated with regional air mass (Kuang et al., 2021)), (2) less oxygenated organic aerosols (LOOAs, , related to daytime photochemical formation), (3) nighttime-formed organic aerosols (Night-OAs, , highly correlated with nitrate with r=0.67, and exhibiting sharp increases during the evening) and (4) aged BBOA (aBBOA, , exhibiting similar diurnal behaviour to LOOA with strong daytime production). The mass spectral profile and time series of these organic aerosol factors are shown in Fig. S2, and details about the determination of these factors are introduced in Sect. S1. The BBOA factor will be the focus of this study. On the basis of the scheme proposed by Kuwata et al. (2012), the density of BBOA (ρBBOA) and HOA was estimated as 1.25 and 1.15 g cm−3 with and as inputs and is used in this study.
2.3 Quantification of BrC absorptions based on the light absorption wavelength dependence measurements
BrC absorbs significantly at near-UV and short-visible wavelengths but exhibits strong wavelength dependence (Saleh, 2020). The deconvolution of the spectral dependence of measured aerosol light absorption has been a common method to retrieve the BrC and BC absorption distribution:
where σa(λ) represents measured total aerosol absorption at wavelength λ, σBC(λ) the absorption associated with BC (includes influences of BC size distributions and mixing states, etc.), and σBrC(λ) the light absorption contributed by BrC. The spectral dependence of BC absorption was usually accounted for using the Ångström exponent law (Laskin et al., 2015), which describes BC absorption as , where K is a constant factor associated with BC mass concentration. The traditional method usually assumes a constant AAEBC of 1 (de Sá et al., 2019) or a wavelength-independent AAEBC derived from near-infrared absorption measurements by assuming that the BrC absorption is negligible at near-infrared wavelengths. For example, σBC(880 nm) and σBC(950 nm) measured by AE33 can be used to formulate the spectral dependence of aerosol absorptions associated with BC as the following:
However, several recent modelling studies using Mie theory and BC measurements demonstrated that AAEBC varies as a function of wavelength, and the wavelength-independent assumption of AAEBC will bring large uncertainties into BrC calculation (Li et al., 2019; Wang et al., 2018). Wang et al. (2018) found AAEBC, 520–880 and AAEBC, 370–520 differed much from each other – however, the ratio varied little – and thus proposed an AAE ratio method to obtain real-time AAEBC, 370–520 and further deduced σBC(370 nm). This method assumes that BrC contributes negligibly at 520 nm, which might introduce uncertainties. In addition, this method is not applicable in retrieving the spectral dependence of BrC absorption because only the ratio was used. This modified wavelength-dependent AAE differentiation method was further partially adopted by Li et al. (2019), using AAEBC, 370–520 to account for spectral dependence of BC absorption for wavelengths <520 nm and AAEBC, 520–880 for wavelengths >520 nm; thus the wavelength-dependent AAEBC was partially but not thoroughly considered.
In this study, we introduce an AAE ratio to take spectral dependence of AAEBC into account and use on-line measurements of AAE950–880 as AAEBC, 950–880 under the assumption of negligible absorption contributions of BrC at wavelengths of 880 and 950 nm. Thus, absorption measurements of 370, 470, 530, 590 and 660 nm can be used to retrieve the spectral dependence of BrC absorptions.
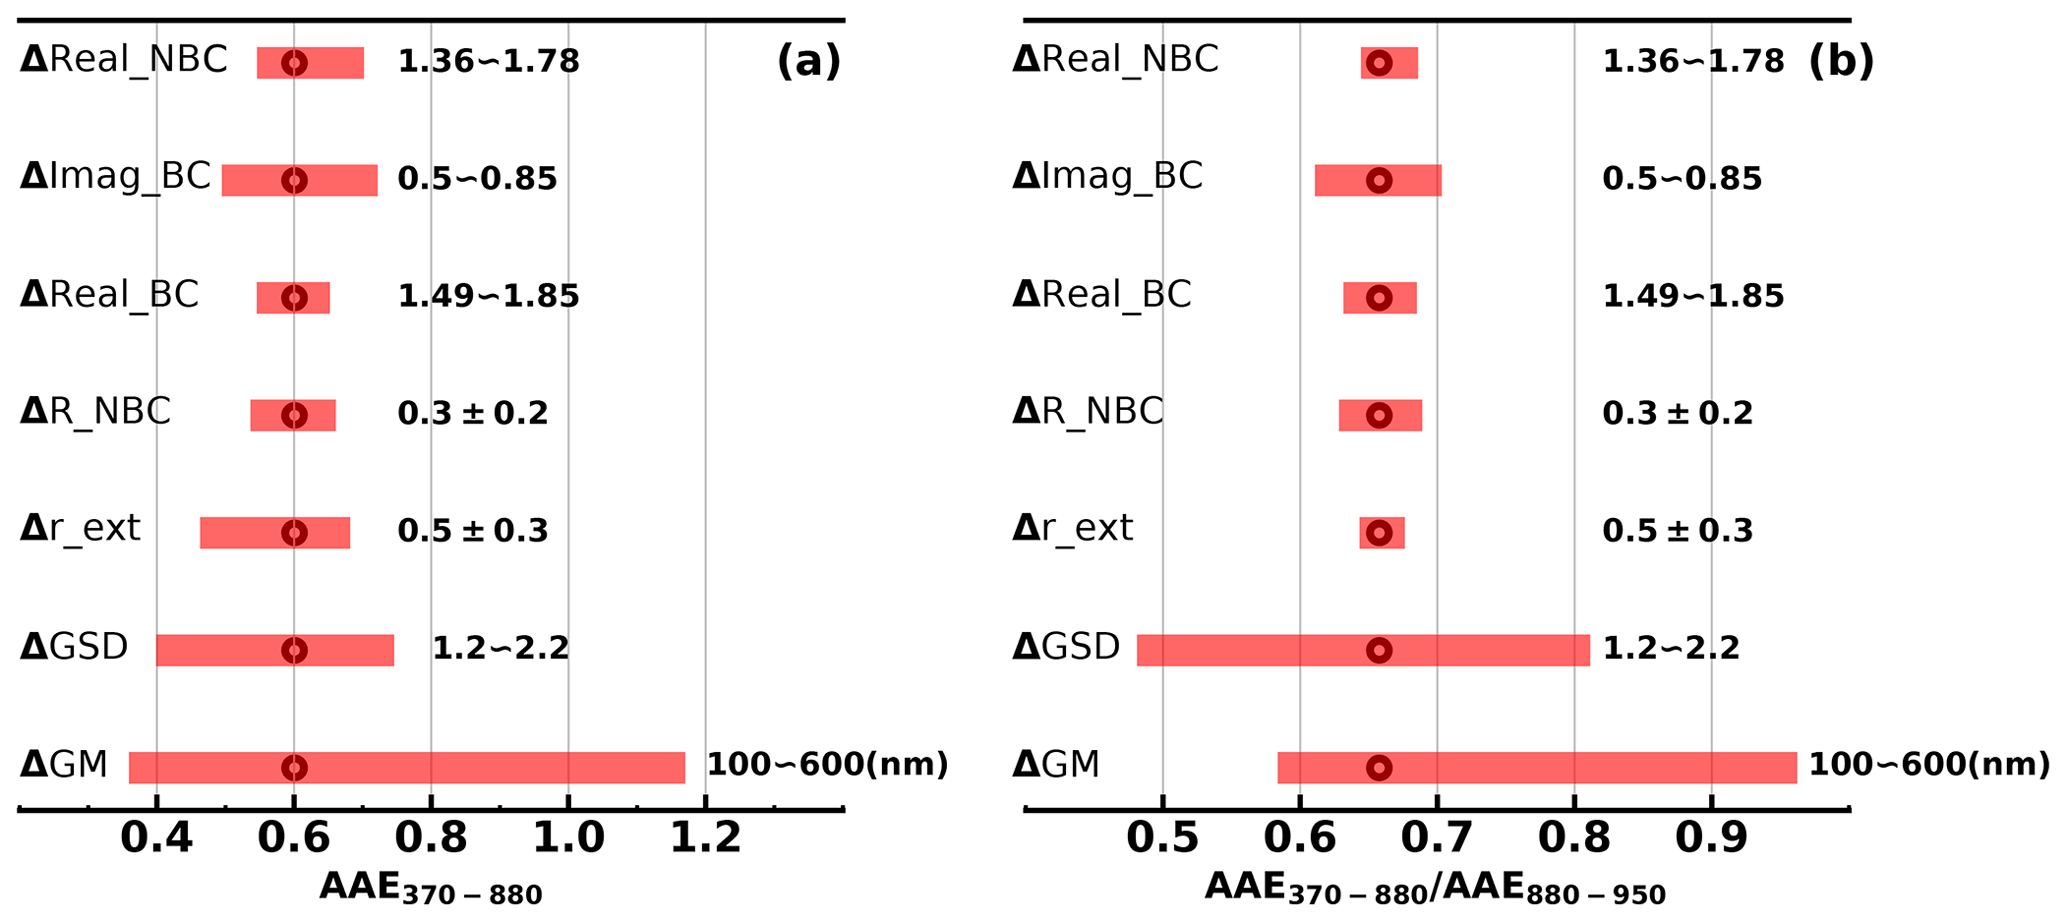
Figure 1Changes in perturbations associated with (a) AAEBC, 370–880 and (b) of different parameters. Perturbation ranges of parameters are shown on the right side of the bar.
RAAE (λ) is influenced by many factors such as BC refractive index, coating shell refractive index, BC mixing state and BC mass size distributions (Li et al., 2019). A sensitivity experiment following the method of Li et al. (2019) is initiated to explore impacts of these optical and mixing state parameters on AAEBC, λ–880 and RAAE (λ); more details are available in Supplement Sect. S1. These parameters include the real part of the refractive index of BC coating materials and BC-free particles (Real_NBC), real and imaginary parts of refractive index of the BC core (Real_BC and Imag_BC), the mass fraction of externally mixed BC (r_ext), the number fraction of BC-free particles (R_NBC), geometric standard deviation (GSD), and geometric mean diameter (GM) of BC mass size distributions. Note that the imaginary parts of the refractive index of BC particle coating materials and BC-free particles were not perturbed in these simulations and were treated as zero under the assumption of materials other than BC being non-absorbing. In order to separate effects of BC and BrC on AAEλ–880 changes, this assumption must be made to obtain AAEBC, λ–880 variations associated only with BC absorption changes. Thus, the defect of this method is that the entangling effects of BrC coating on BC particles in AAEBC, λ–880 variations are not considered. Impacts of these parameters on AAEBC, 370–880 and RAAE (370) are investigated through perturbation parameters within atmospherically relevant ranges reported in previous studies (Bond et al., 2013; Tan et al., 2016; Zhao et al., 2019), and ranges of these parameters are listed in Fig. 1. The results of AAEBC, 370–880 are shown in Fig. 1a. It shows that variations of both refractive index of BC and coating materials and BC mixing states have non-negligible influences on AAEBC, 370–880; however, the BC mass size distributions represented by geometric standard deviation (GSD) and geometric mean diameter (GM) of BC mass size distribution play the most important roles. Nevertheless, for results of shown in Fig. 1b, when fixing the BC mass size distribution, exhibited much smaller variations, and even the refractive index of BC and shell or mixing state varied within atmospherically relevant ranges.
The result of sensitivity studies shown in Fig. 1b confirmed the applicability of the proposed new AAE ratio method under constrained BC mass size distributions. The elemental carbon fragments (Cx) retrieved from SP-AMS measurements cannot be used to quantify BC mass concentrations due to the lack of calibration parameters; however, its size distributions generally represent the relative contributions of BC mass within different diameter ranges. The real-time measured normalized Cx distributions are therefore used to distribute total BC mass to different diameter bins to calculate RAAE (λ), and the average normalized Cx distribution is shown in Fig. S6. The average and standard deviations of RAAE (370), RAAE (470), RAAE (520), RAAE (590) and RAAE (660) are 0.79 (±0.044), 0.85 (±0.038), 0.88 (±0.035), 0.9 (±0.035) and 0.93 (±0.031), respectively. Based on this method, the spectral dependence of BrC absorption can be derived as the following:
Results of previous studies (Saleh, 2020; Yu et al., 2021) demonstrated that non-negligible BrC absorptions at the near-infrared range and results of Hoffer et al. (2017) demonstrated that the absorption coefficient of tar balls at 880 nm is more than 10 % of that at 470 nm. During this campaign, the average aerosol absorption at 880 nm is 26.7 Mm−1, derived average BrC absorption at 470 nm is 11.5 Mm−1, 10 % of BrC absorption at 470 nm accounts for on average 4.2 % of aerosol absorption at 880 nm, and the realistic BrC contribution at 880 nm is likely lower considering that tar balls represent the most efficient BrC. Thus, the assumption that negligible absorption contributions of BrC at wavelengths of 880 and 950 nm when deriving AAEBC, 950–880 from AE33 measurements holds in most cases when BC dominates. In addition, the key part of our newly proposed method is considering the spectral dependence of AAEBC through the ratio RAAE (λ) and AAEBC, 950–880; however, the accurate AAEBC, 950–880 derivations need the robust performance of AE33 at both 880 and 950 nm. Thus quality assurance of these measurements should be warranted before using the AAEBC, 950–880.
3.1 Dominant contribution of BBOA to BrC absorption
Biomass burning plumes around the observation site were frequently observed during this field campaign at dusk as shown in Fig. S7a and d and only sometimes during daytime periods (Fig. S7b, c). The average diurnal variations of resolved primary OA factors including both BBOA and HOA are presented in Fig. S8, in which average diurnal profiles of both BBOA and HOA exhibited sharp increases around 18:00 local time (LT), which should be associated with frequently observed biomass burning events and supper cooking in villages and towns near this site. However, diurnal behaviours of BBOA and HOA differ much from about 06:00 to 16:00 LT. HOA exhibited continuous decreases during this daytime period, which was associated with boundary layer processes and re-partitioning due to increasing temperature. The BBOA showed almost continuous but slow increases from morning to the afternoon, indicating strong daytime emissions of BBOA as shown in Fig. S7b and c, although not as prominent as the BBOA emission just before the fall of nighttime. The probability distribution of the ratio is also shown in Fig. S8b, which shows that the ratio reached beyond 2 in 57 % conditions with an average of 3.3, which demonstrates that biomass burning was a dominant primary aerosol emission source during this field campaign.
The observed AAEs between different wavelengths and 880 nm of total aerosol absorption are shown in Fig. 2a, and the average values of AAE370–880, AAE470–880, AAE520–880, AAE590-880, AAE660–880 and AAE950–880 are 1.17, 1.23, 1.18, 1.15, 1.08 and 1.04. The scatter plots of AAE370–880 and the ratio shown in Fig. 2b show that AAE370–880 was highly correlated with (r=0.8), indicating strong influences of BBOA on aerosol absorption wavelength dependence. The BrC absorption at multiple wavelengths are extracted using the improved AAE ratio method introduced in Sect. 2, and statistical ranges of BrC absorption, as well as their contributions to total aerosol absorption, are shown in Fig. 2d. Average values of derived σBrC at 370, 470, 520, 590 and 660 nm are 19.1, 11.5, 6.4, 3.45 and 1.13 Mm−1, and their contributions to total aerosol absorption are 23 %, 18 %, 12 %, 8 % and 3 %, respectively. Similar to some previous studies (Tao et al., 2020; Qin et al., 2018), these results shows that the contributions of BrC to aerosol absorption at wavelengths of less than 590 nm are not negligible. The derived time series of σBrC,370 are shown in Fig. S9d, depicting BBOA varying quite consistently with σBrC,370 and with high correlations (correlation coefficients between σBrC at 370, 470, 520, 590 and 660 nm and BBOA reaching 0.9, 0.83, 0.8, 0.76 and 0.69), suggesting that BBOA was the dominant contributor to BrC absorption.

Figure 2(a) Probability distribution of AAE between different wavelengths and 880 nm. (b) Correlations between AAE370–880 and mass ratio of BBOA and BC. (c) Correlations between the BrC absorption coefficients at 370 nm and the BBOA mass loadings. (d) Box-and-whisker plots of BrC absorption fractions at different wavelengths.
3.2 Identification of BBOA size distributions and their parameterizations
During the observation period, BBOA contributed dominantly to BrC absorptions, and notable biomass burning events represented by BBOA mass concentration spikes as shown in Fig. S9 frequently occurred. Events with BBOA increasing suddenly, drastically and continuously within a half hour to several hours were identified as BBOA spikes. We do not have a criterion on this, and we choose spikes artificially. These identified spikes generally last about 0.5–1.5 h (from the beginning to the peak). The used BBOA spikes were shaded in Fig. S9, and some of identified spikes were not used because of the missing particle number size distribution measurements. These biomass burning spikes are related with biomass burning plumes that swept over the observation site; thus the difference between aerosol properties measured before and during these spikes can represent the properties of biomass burning aerosols. Theses spikes usually occurred during supper cooking time (∼ 18:00 LT), and typical biofuels used for cooking are mainly vegetation fuels such as local woods. SMPS directly measures the aerosol particle number size distribution (PNSD), thus also providing particle volume size distribution measurements (PVSD). Figure 3a shows the average differences of mass concentrations of different aerosol components of identified spikes with simultaneous valid SMPS data. Ammonium nitrate (AN) and ammonium sulfate (AS) were determined as the dominant form of ammonium, sulfate and nitrate ions during this field campaign and paired using the scheme proposed by Gysel et al. (2007). Note that the Δ shown in Fig. 3a and also hereafter means the difference between that variable before BBOA increases and when BBOA reaches its peak (the definition of the BBOA spike; these peaks are also marked in Fig. S9), corresponding to the start and end of BBOA increase. It shows that inorganic aerosol components increased a little bit, which is consistent with previous studies (Hecobian et al., 2011; Pratt et al., 2011) showing that biomass burning emits tiny amounts of inorganic aerosol. However, it is difficult to quantify how much of these inorganic aerosol increases was attributed to biomass burning emissions because the biomass burning spikes were usually observed during the periods with secondary nitrate formation (Kuang et al., 2021). Secondary organic aerosol components changed a little, with the slight increase in aBBOA suggesting plumes were aged a little bit. Obvious increases in HOA were observed, but the most prominent increase was BBOA. The average ratio for cases when BC measurements were valid was 0.22, suggesting the observed biomass burning events are likely flaming and burning conditions with high combustion efficiency (Reid et al., 2005b; McClure et al., 2020). The cooking-related organic aerosol could not be separated from HOA in PMF analysis. The co-increase in HOA is due to the fact that these identified spikes occurred during periods of supper cooking as discussed before.
The average aerosol particle number and volume size distribution differences (ΔPNSD and ΔPVSD) calculated as the PNSD and PVSD differences between those at the BBOA peak concentration and those before the BBOA spikes are shown in Fig. 3b, and the example of calculating ΔPNSD and ΔPVSD is shown in Fig. S10. The average ΔPVSD can be well fitted using two log-normal modes (Mode 1 and Mode 2); the dominant one is BBOA, and the other is mostly associated with HOA according to the aerosol mass changes. Geometric mean (Dgv) and standard deviation (σg) values of the two PVSD log-normal modes are 180 and 390 and 1.46 and 1.5, respectively. In addition, the SP-AMS measurements provide organic aerosol size distributions with vacuum aerodynamic diameter (Dva), and their average distribution difference of organic aerosols during these spikes is also shown in Fig. S11 and could be generally fitted well using two log-normal modes of BBOA and HOA. The Dgv,Dva and σg values of the identified modes were 175 and 395 and 1.46 and 1.55, respectively. Dva and mobility diameter Dp of the SMPS were related through the effective density of particles as , where ρe is the aerosol effective density and CS a factor related to aerosol shape, for which a value of 0.8 was adopted (Jayne et al., 2000). Based on densities of BBOA and HOA introduced in Sect. 2.2, identified Dgv of BBOA and HOA from SP-AMS measurements of 395 and 190 nm, which were quite close to the Dgv identified from SMPS measurements, further confirming the results from SMPS measurements. The average ΔPNSD is shown in Fig. 3b, displaying a number concentration peak near 90 nm; however, influences of HOA need to be excluded to identify biomass burning PNSD modes. As shown in Fig. 3b, converting the identified BBOA and HOA ΔPVSD modes to ΔPNSD modes cannot explain the observed PNSD difference, and the remaining mode is log-normal and peaks at 70 nm. These results indicate that two modes existed for biomass burning aerosols during this campaign, which is consistent with findings of previous studies (Okoshi et al., 2014; J. Liu et al., 2020).
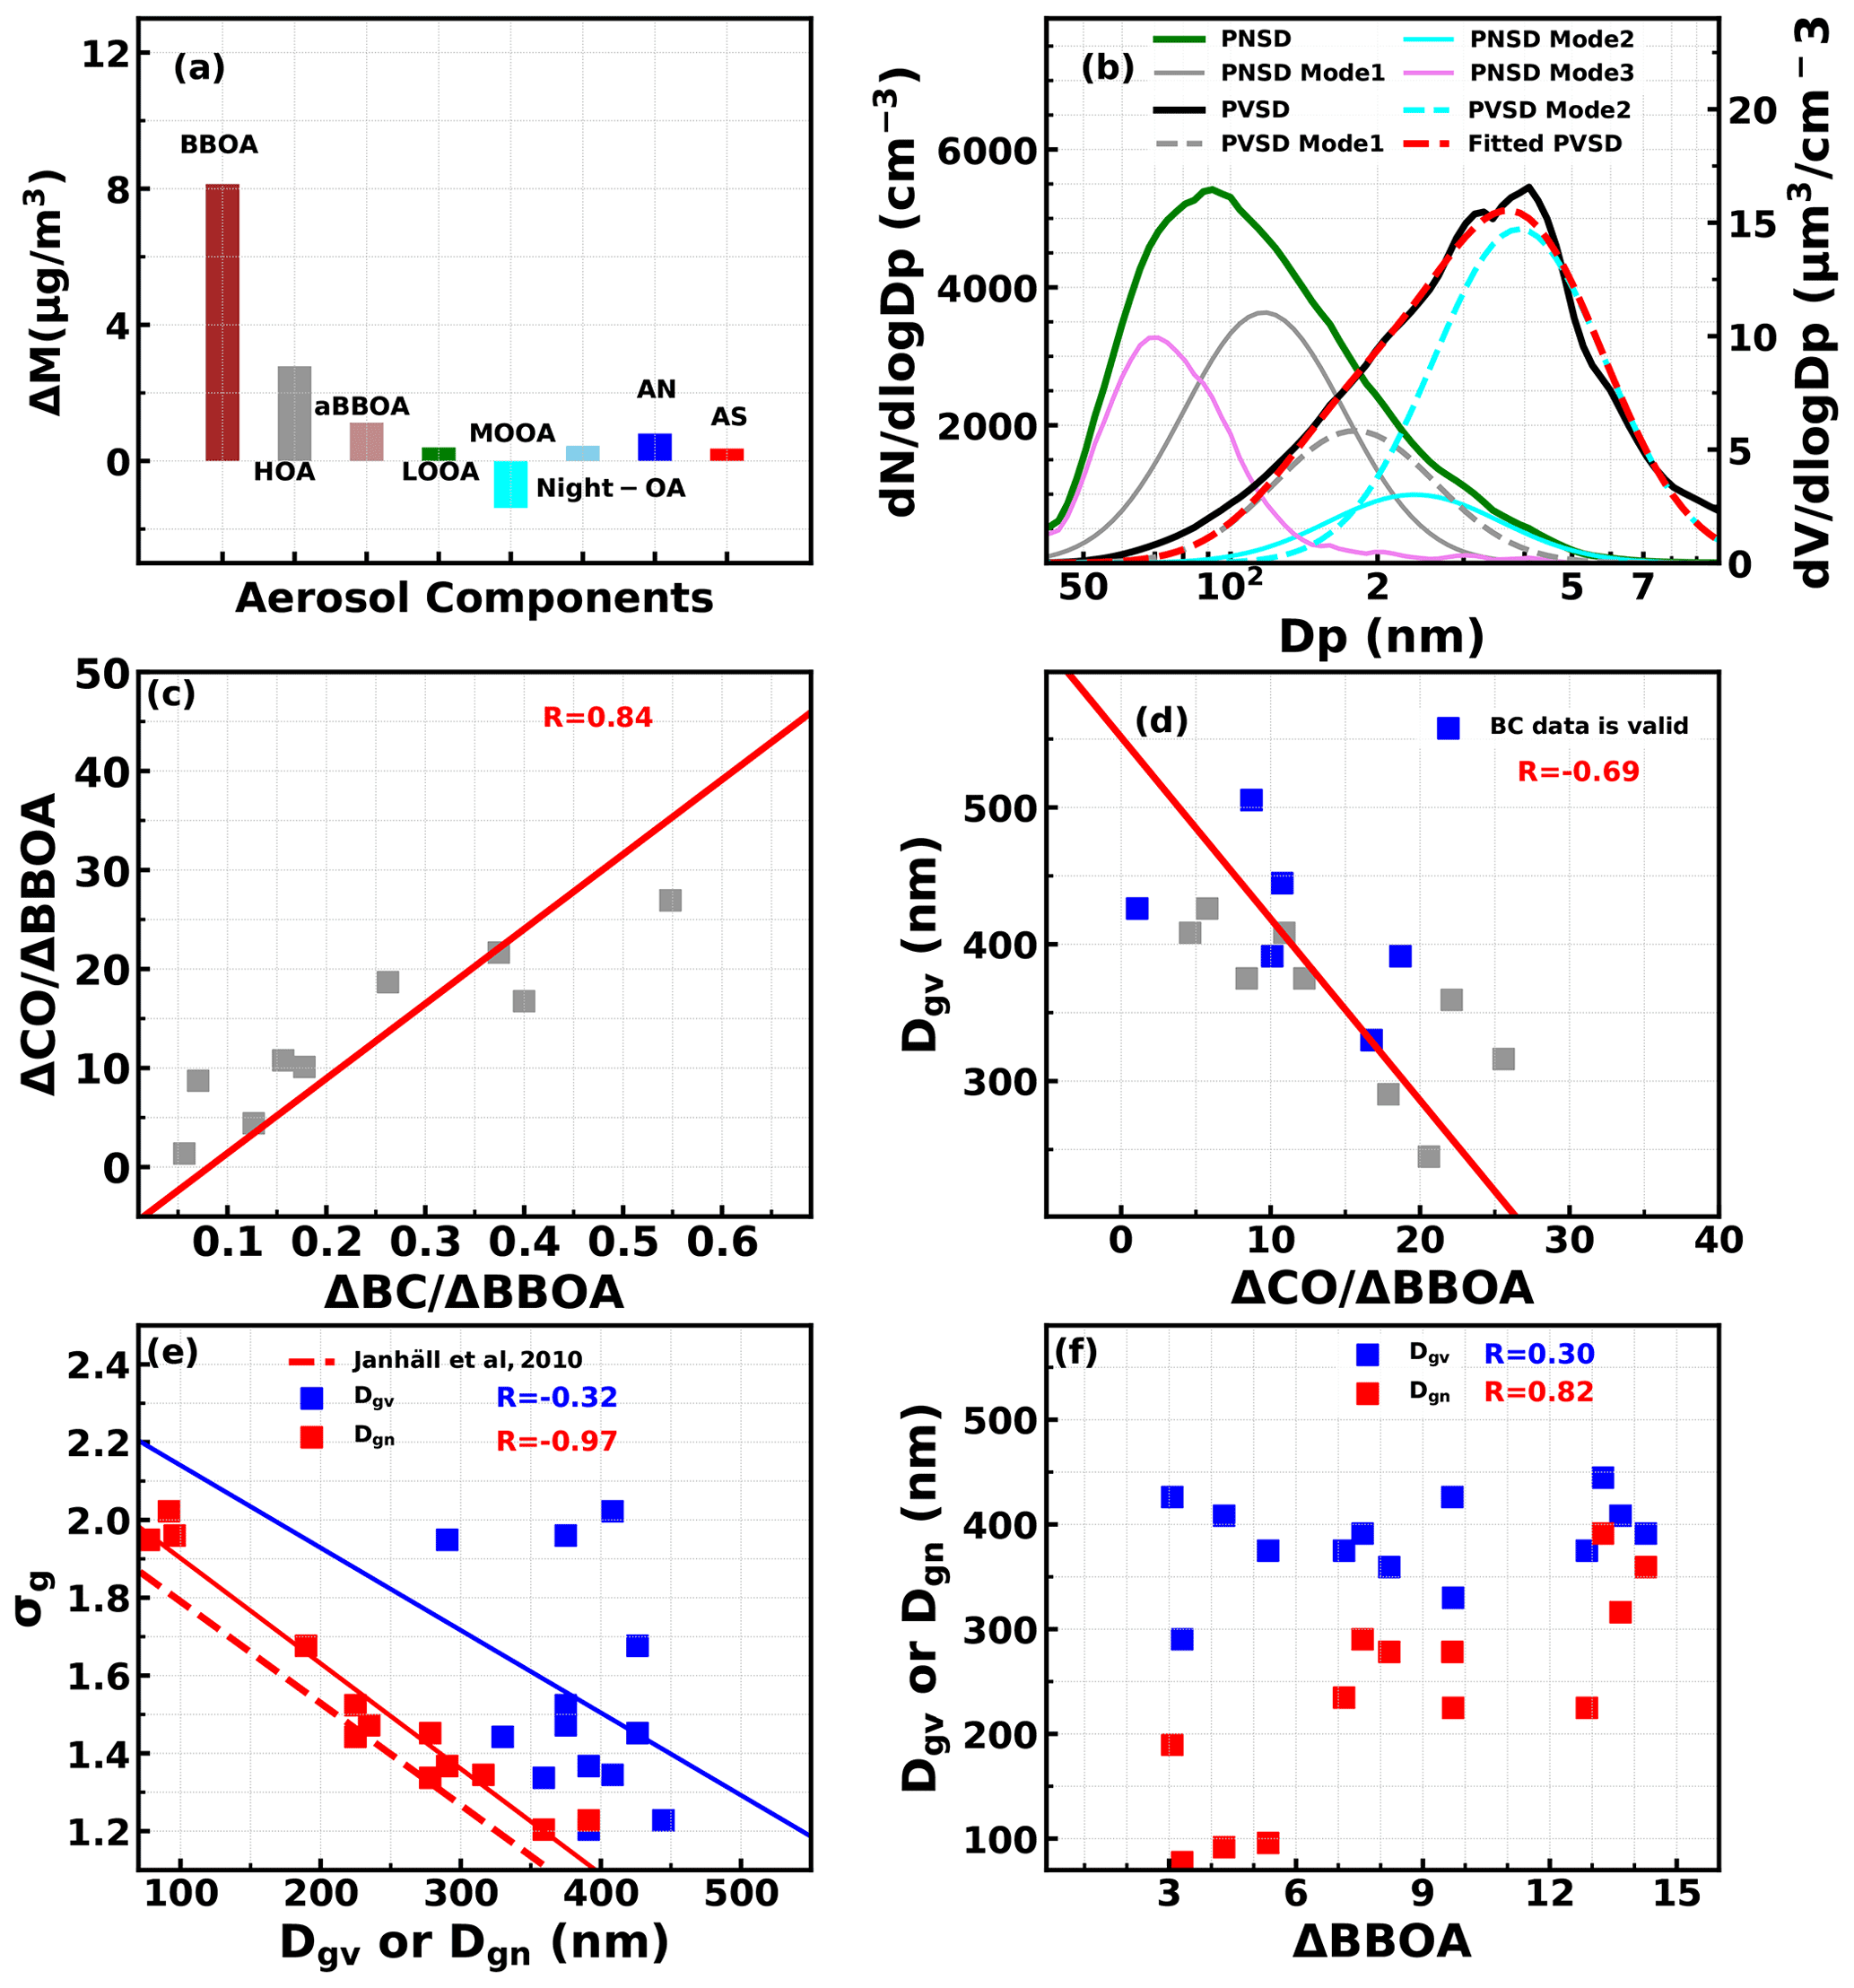
Figure 3(a) Average differences of aerosol components before and after BBOA spikes. (b) Corresponding particle average number and volume size distribution difference (ΔPNSD and ΔPVSD). (c) Relationship between and . (d) The relationships between identified Dgv of BBOA spikes and corresponding (ppb (ug m−3)−1). (e) Relationship between retrieved Dgv and σg, as well as Dgv and σg. (f) Relationships between Dgv or Dgn and ΔBBOA.
For spikes where ΔBBOA dominated the mass changes, the Dgv and σg of BBOA PVSD was retrieved by fitting the larger mode of Δ PVSD, with retrieved results shown in Fig. 3d and e. The retrieved Dgv ranged from 245 to 505 nm with an average of 380 nm. Physicochemical properties of biomass burning emissions depended largely on combustion conditions. The ratio is a proxy of biomass combustion efficiencies (McClure et al., 2020), and it was found that was highly correlated with (Fig. 3c, R=0.84). Thus, was also used as a proxy for combustion efficiency in this study. Higher corresponds to higher combustion efficiency. Retrieved Dgv values were moderately but negatively correlated with (), and a linear relationship Dgv=551–13.3 × was derived. This result is qualitatively consistent with previous studies that biomass burning aerosols were mainly in the accumulation mode, and their average sizes generally decreased as the combustion efficiency increased (Reid and Hobbs, 1998; Janhäll et al., 2010). Retrieved σg ranges from 1.2 to 2.0 with an average of 1.5 and is negatively and weakly correlated with Dgv (). Reid et al. (2005b) reported that Dgv is typically in the range of 250 to 300 nm with the σg on the order of 1.6 to 1.9 for freshly generated smoke and 30 to 80 nm larger for aged smoke with smaller σg (1.4 to 1.6). Levin et al. (2010) performed laboratory combustion of various wildland fuels and reported Dgv of 200 to 570 nm and σg of 1.68 to 2.97. The average Dgv and σg is near the reported Dgv range of Reid et al. (2005b) for aged smoke. The geometric mean of PNSD (Dgn) values is converted from retrieved Dgv and σg and also shown in Fig. 3e. Dgn ranges from 88 to 391 nm with an average of 235 nm. The average Dgn is similar to the reported average Dgn of aged smoke but the range is even beyond the range (100–300 nm) for both fresh and aged smoke reported by Janhäll et al. (2010), in which literature-published Dgn is reviewed, and also beyond the range (about 130–240 nm) reported in Laing et al. (2016) for aged biomass burning aerosol from wildfires in Siberia and the western USA. Similar with results of Janhäll et al. (2010), σg is highly but negatively correlated with Dgn (). The derived linear relationship σg=2.17–0.0027 × Dgn is close to that reported in Janhäll et al. (2010) (Fig. 3e). Janhäll et al. (2010) defined the fresh smoke as plumes younger than 1 h, but aged smoke is mostly plumes older than 1 d. The aged smoke in Laing et al. (2016) were also transported over 4–10 d. However, the smoke plumes reported in this study occurred during supper cooking time and swept over the observation site lasting about 1–3 h (from the beginning to BBOA concentration fall back the background levels), which is consistent with the time needed for cooking, which means that the age of plumes are on the order of hours and near-freshly emitted. This is indirectly confirmed by the observed changes in particle number concentrations in that the small Aitken mode dominates the particle number concentrations (Fig. 3b), because coagulation is quick and should cause a significant decrease in number concentrations of Aitken mode aerosols on timescales of hours (Sakamoto et al., 2015; Laing et al., 2016; Sakamoto et al., 2016). These results demonstrate that Dgn and Dgv vary over a wide range for near-freshly emitted BBOA from vegetation fire smoke. Laing et al. (2016) reported that Dgn was highly correlated with plume aerosol mass concentrations (PMs) but not with any normalized variable such as . Similar results were obtained in this study (Fig. 3f). The derived Dgn was weakly correlated () with but highly correlated with ΔBBOA (R=0.82). The new finding here is that Dgv correlated obviously with but weakly with ΔBBOA. As discussed in implications, BBOA volume size distributions determine BBOA bulk optical properties; thus accurate representations of BBOA volume size distributions in climate models might be more important than accurate representations of BBOA number size distributions.
3.3 BBOA mass scattering efficiency and retrieval of the real part of the BBOA refractive index
The measured aerosol scattering coefficients at 525 nm (σsp,525) during BBOA spikes were used to calculate the MSEs using the differential method, thereby retrieving the real part of the BBOA refractive index (mR) on the basis of Mie theory. Truncation error, non-ideality of light source and RH conditions need to be corrected in the calculation of σsp,525 values under dry condition. The truncation error and non-ideality of light source were corrected using the empirical formula provided by Qiu et al. (2021). RH0 in the dry nephelometer was in the range of 20 % to 45 % with an average of 31 % and corrected by considering measured aerosol optical hygroscopicity through , where κsca is the optical hygroscopicity parameter derived from aerosol light scattering enhancement factor measurements (Kuang et al., 2017). To quantify MSEBBOA, MSEs of other aerosol components are needed. Using the paired campaign average size distributions of AS and AN (Fig. S3), MSEs of AS and AN were calculated as 4.6 and 4.8 m2 g−1, which were identical to those identified by Tao et al. (2019) during autumn at an urban area in this region but much higher than average values reported in Hand and Malm (2007). Through the analysis of the OA distribution measured by SP-AMS, it was found that the size distribution of secondary organic aerosol (SOA) can be represented by two log-normal modes (Fig. S4). One is aBBOA, and the other one includes MOOA, Night-OA, and MOOA. Thus, the MSE of MOOA, Night-OA and LOOA (MSESOA) was determined to be 6.3 m2 g−1, and MSEaBBOA was 4.5 m2 g−1. MSEHOA was calculated to be 3.2 m2 g−1 using the size distribution identified in Fig. 3b. MSEBC was calculated as 2.8 m2 g−1 using the average normalized Cx fragment distributions, which was also very close to the MSE of elemental carbon determined by Tao et al. (2019) (2.6 m2 g−1). The changes in aerosol scattering coefficients associated only with BBOA can be calculated as
More details about the MSE calculations of these components can be found in Sect. S1. In addition, to minimize the influences of uncertainties of used MSEs of other aerosol components on MSEBBOA derivations, only spikes with sum changes in ΔAS, ΔAN, ΔNight-OA, ΔMOOA, ΔLOOA and ΔaBBOA accounting for less than 25 % of ΔBBOA were used. Average changes in aerosol components for these spikes are shown in Fig. 4a, with changes in most individual aerosol components being almost negligible.
As shown in Fig. 4b, the derived Δσsp,525 associated with BBOA was highly correlated with ΔBBOA (R=0.91). MSEBBOA ranged from 3.1 to 7.5 m2 g−1 with an average of 5.3 m2 g−1. Reid et al. (2005a) reviewed the MSEs of biomass burning (MSEBB) aerosols and reported a range of 3.2–4.2 m2 g−1 for temperate and boreal fresh smoke and larger for corresponding aged smoke (4.3 m2 g−1). McMeeking et al. (2005) theoretically calculated the MSEs of smoke-influenced aerosols and reported a MSE range of 3–6 m2 g−1. Levin et al. (2010) conducted MSEBB measurements of fresh biomass burning smoke of various fuel types and reported a MSEBB range of 1.6 to 5.7 m2 g−1. Laing et al. (2016) reported a MSEBB range of 2.5 to 4.7 for aged biomass burning aerosols of wildfires, and a similar range was reported by Briggs et al. (2017). However, no study has specifically investigated MSEBBOA variations, which are very crucial for biomass burning aerosol climate effect simulations, since aerosol components in models are usually separately represented (Riemer et al., 2019). Although organic aerosols usually dominate mass concentration of biomass burning aerosols, the reported MSEBBOA range is generally higher than previously reported MSEBB ranges, which are likely associated with the fact that MSEBB includes influences of low scattering efficiency components such as BC. Another reason for this is that the identified geometric mean size of BBOA in this study was generally larger than those reported before. Many studies have shown that aerosol size distributions have crucial impacts on MSE variations (Hand and Malm, 2007). Both Levin et al. (2010) and Laing et al. (2016) have reported that MSEBB of biomass burning aerosols was highly correlated with Dgn. The relationship between MSEBBOA and Dgn and Dgv was investigated (Fig. 4c, only six points with both Dgv and σg retrieval are available). Unlike results of previous studies, MSEBBOA was positively but weakly correlated with Dgn (R=0.44). However, MSEBBOA was highly correlated with Dgv (R=0.86) and exhibited a non-linear response with the increase in Dgv. The non-linear increase phenomenon was reported first but confirmed by Mie theory simulations by assuming a fixed σg of 1.5 under varying conditions of Dgv and refractive index (Fig. 4c).
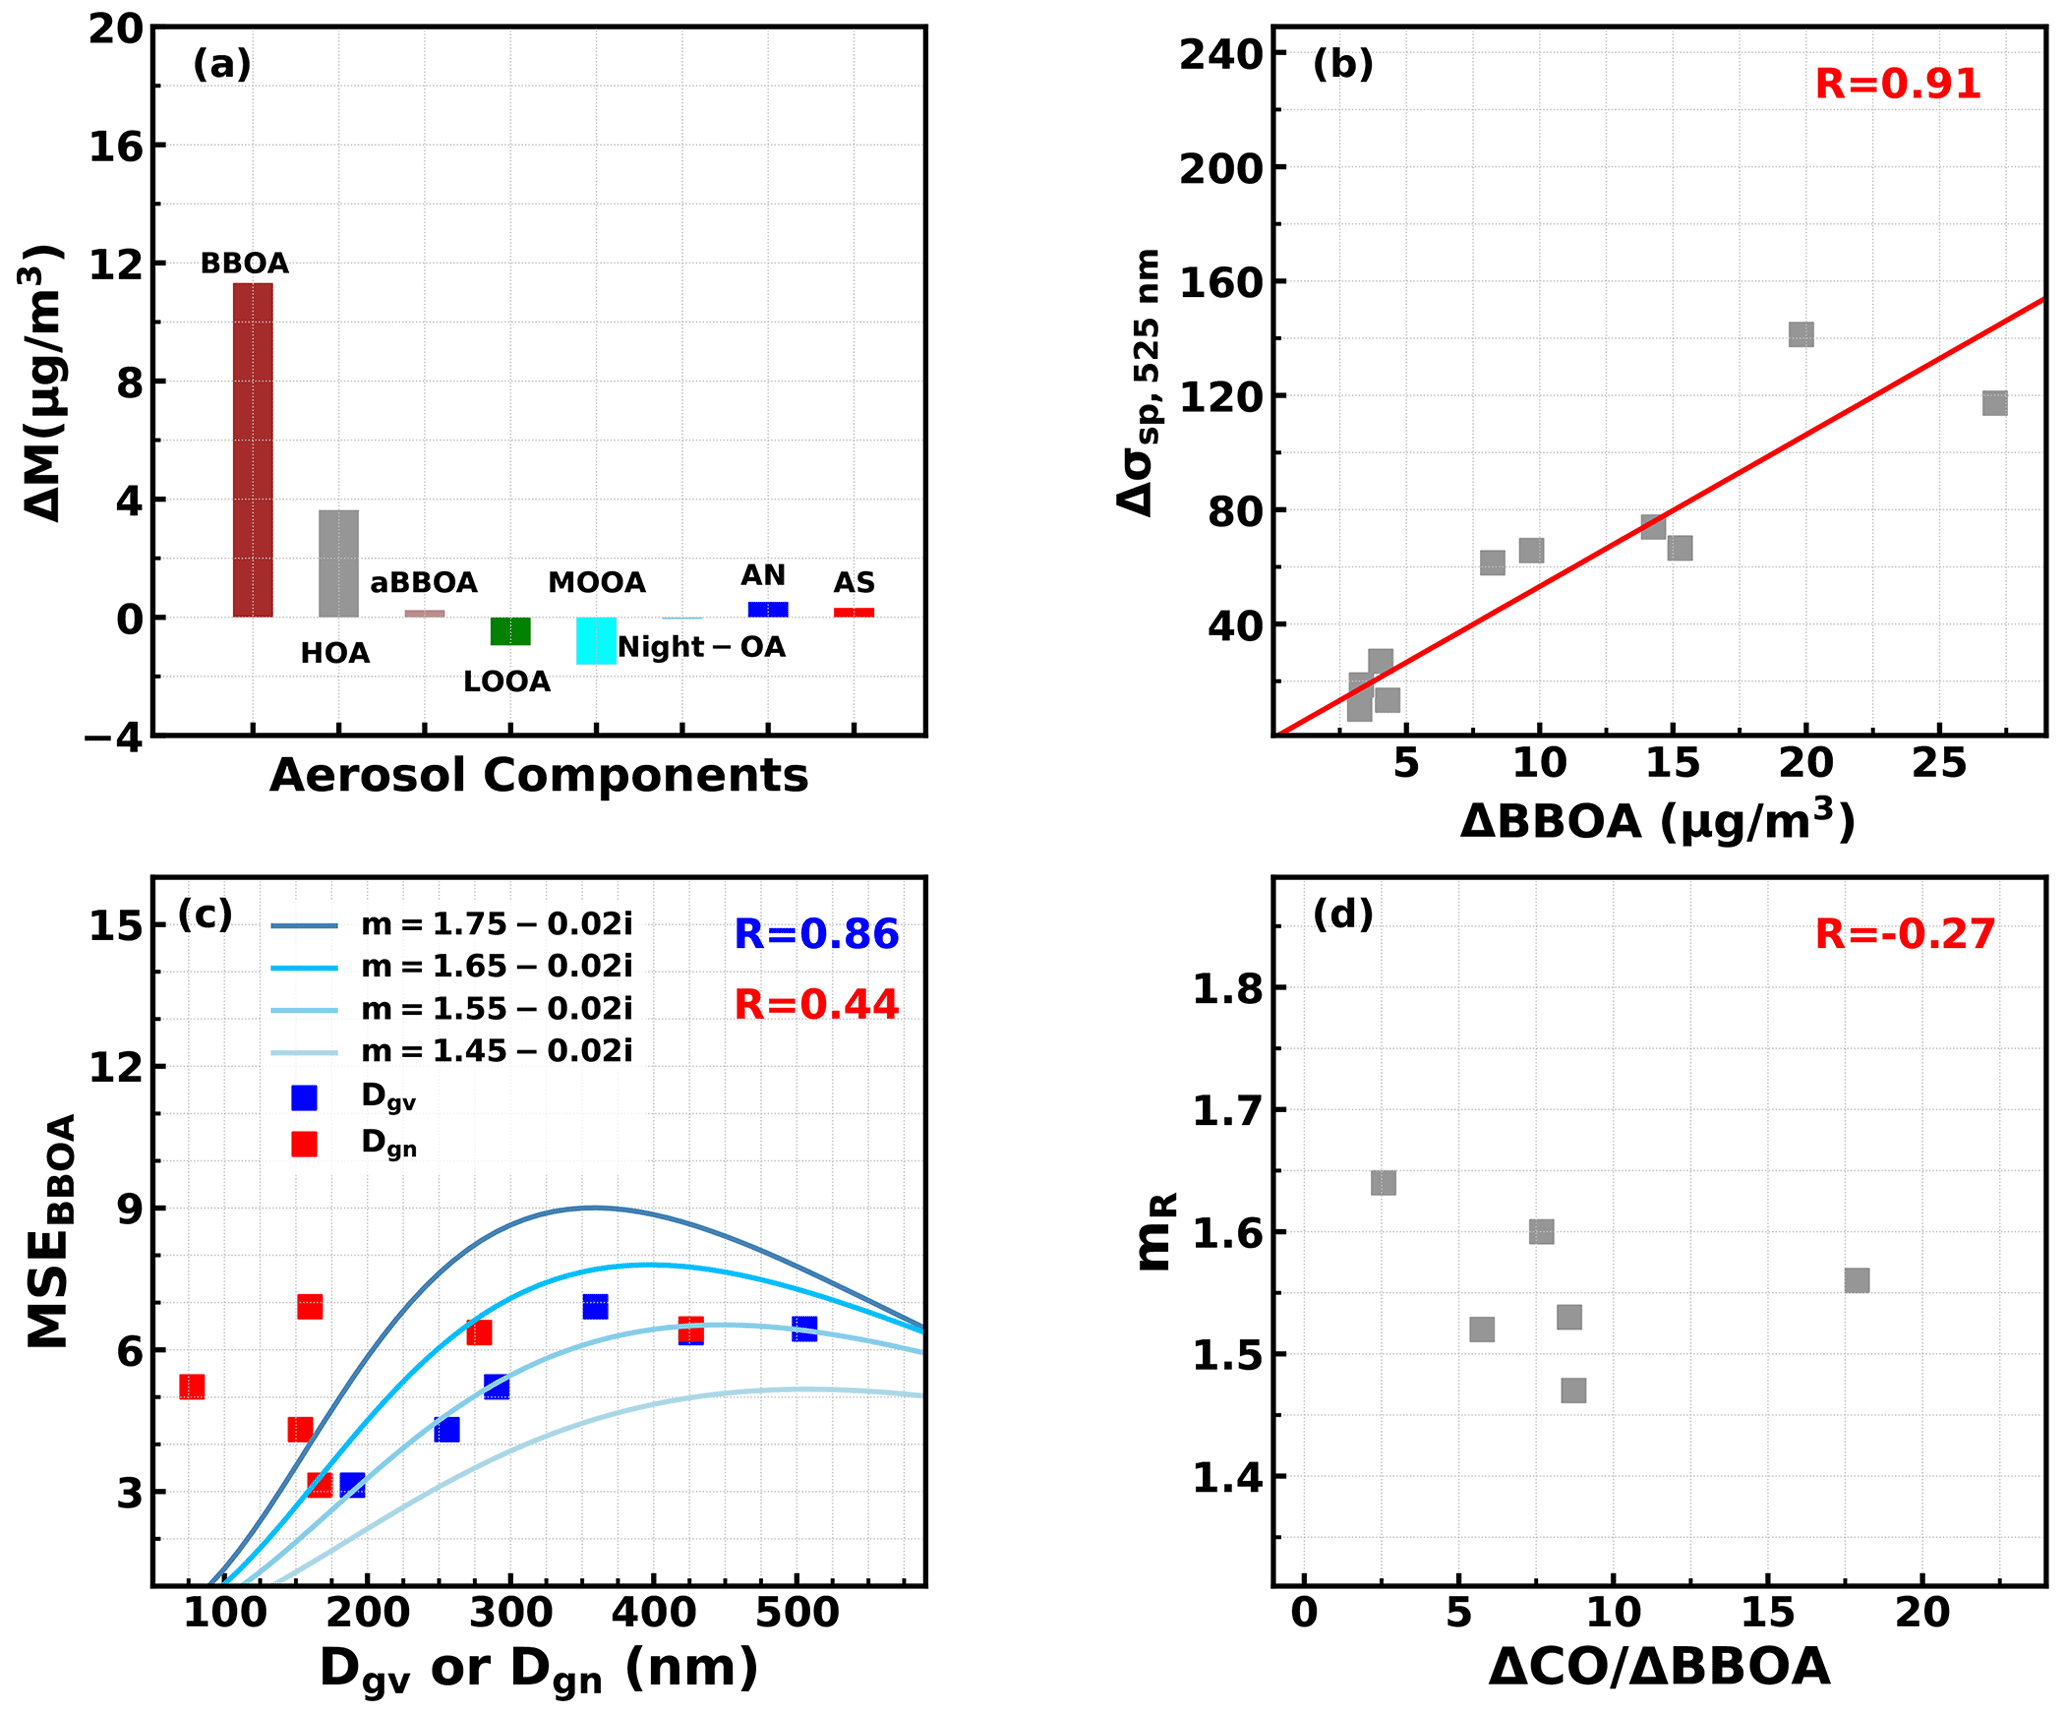
Figure 4(a) Average differences of aerosol components between nearest background and the peak of BBOA spikes. (b) Relationships between derived Δσsp at 525 nm only associated with BBOA and ΔBBOA. (c) Relationships between retrieved MSEBBOA and Dgn or Dgv. (d) Relationship between retrieved mR and .
Aerosol refractive index was a fundamental parameter in simulating aerosol optical properties in models. However, aerosol refractive index investigations specific to BBOA are scarce because the direct retrieval of an aerosol refractive index at least needs accurate and simultaneous representations of MSEBBOA, BBOA density and BBOA size distribution shape. Only a few studies have indirectly retrieved mR of biomass-burning-related aerosols. For example, McMeeking et al. (2005) and Levin et al. (2010) have retrieved mR of biomass burning or smoke-influenced aerosols through using an iterative algorithm to match measured size distributions of different principles (mobility-related size versus optical size), and the reported mR ranges were 1.56 to 1.59 and 1.41 to 1.61, respectively. In this study, mR values of BBOA were retrieved using Mie theory with MSEBBOA, Dgn, σg and BBOA density as inputs as introduced in Sect. S1.4 of the Supplement. This method assumes the external mixing of BBOA with other aerosol components, which is due to characteristics and dominant contribution of freshly emitted BBOA to observed mass changes for identified biomass burning plumes. Note that the retrieval of mR would also be affected by the imaginary part of BBOA refractive index (mi,BBOA), and the mi,BBOA parameterization as a function of introduced in the next section was used. Retrieved mR ranges from 1.47 to 1.64 with an average of 1.56. If mR changes from 1.47 to 1.64, it can result in a double MSEBBOA for given BBOA size distributions. Thus, the reported mR,BBOA range was wide with respect to MSE simulations and needs to be carefully parameterized in climate modes. The BBOA refractive index is determined by its chemical structure; thus its variation might be associated with fire combustion conditions. The relationship between mR,BBOA and was further investigated and is shown in Fig. 4d. For below 10 ppb (µg m−3)−1, mR was negatively correlated with () and thus like , which, however, was not as significant (). These results demonstrate that fire combustion conditions might have significant impacts on mR,BBOA, which, however, needs further investigation.
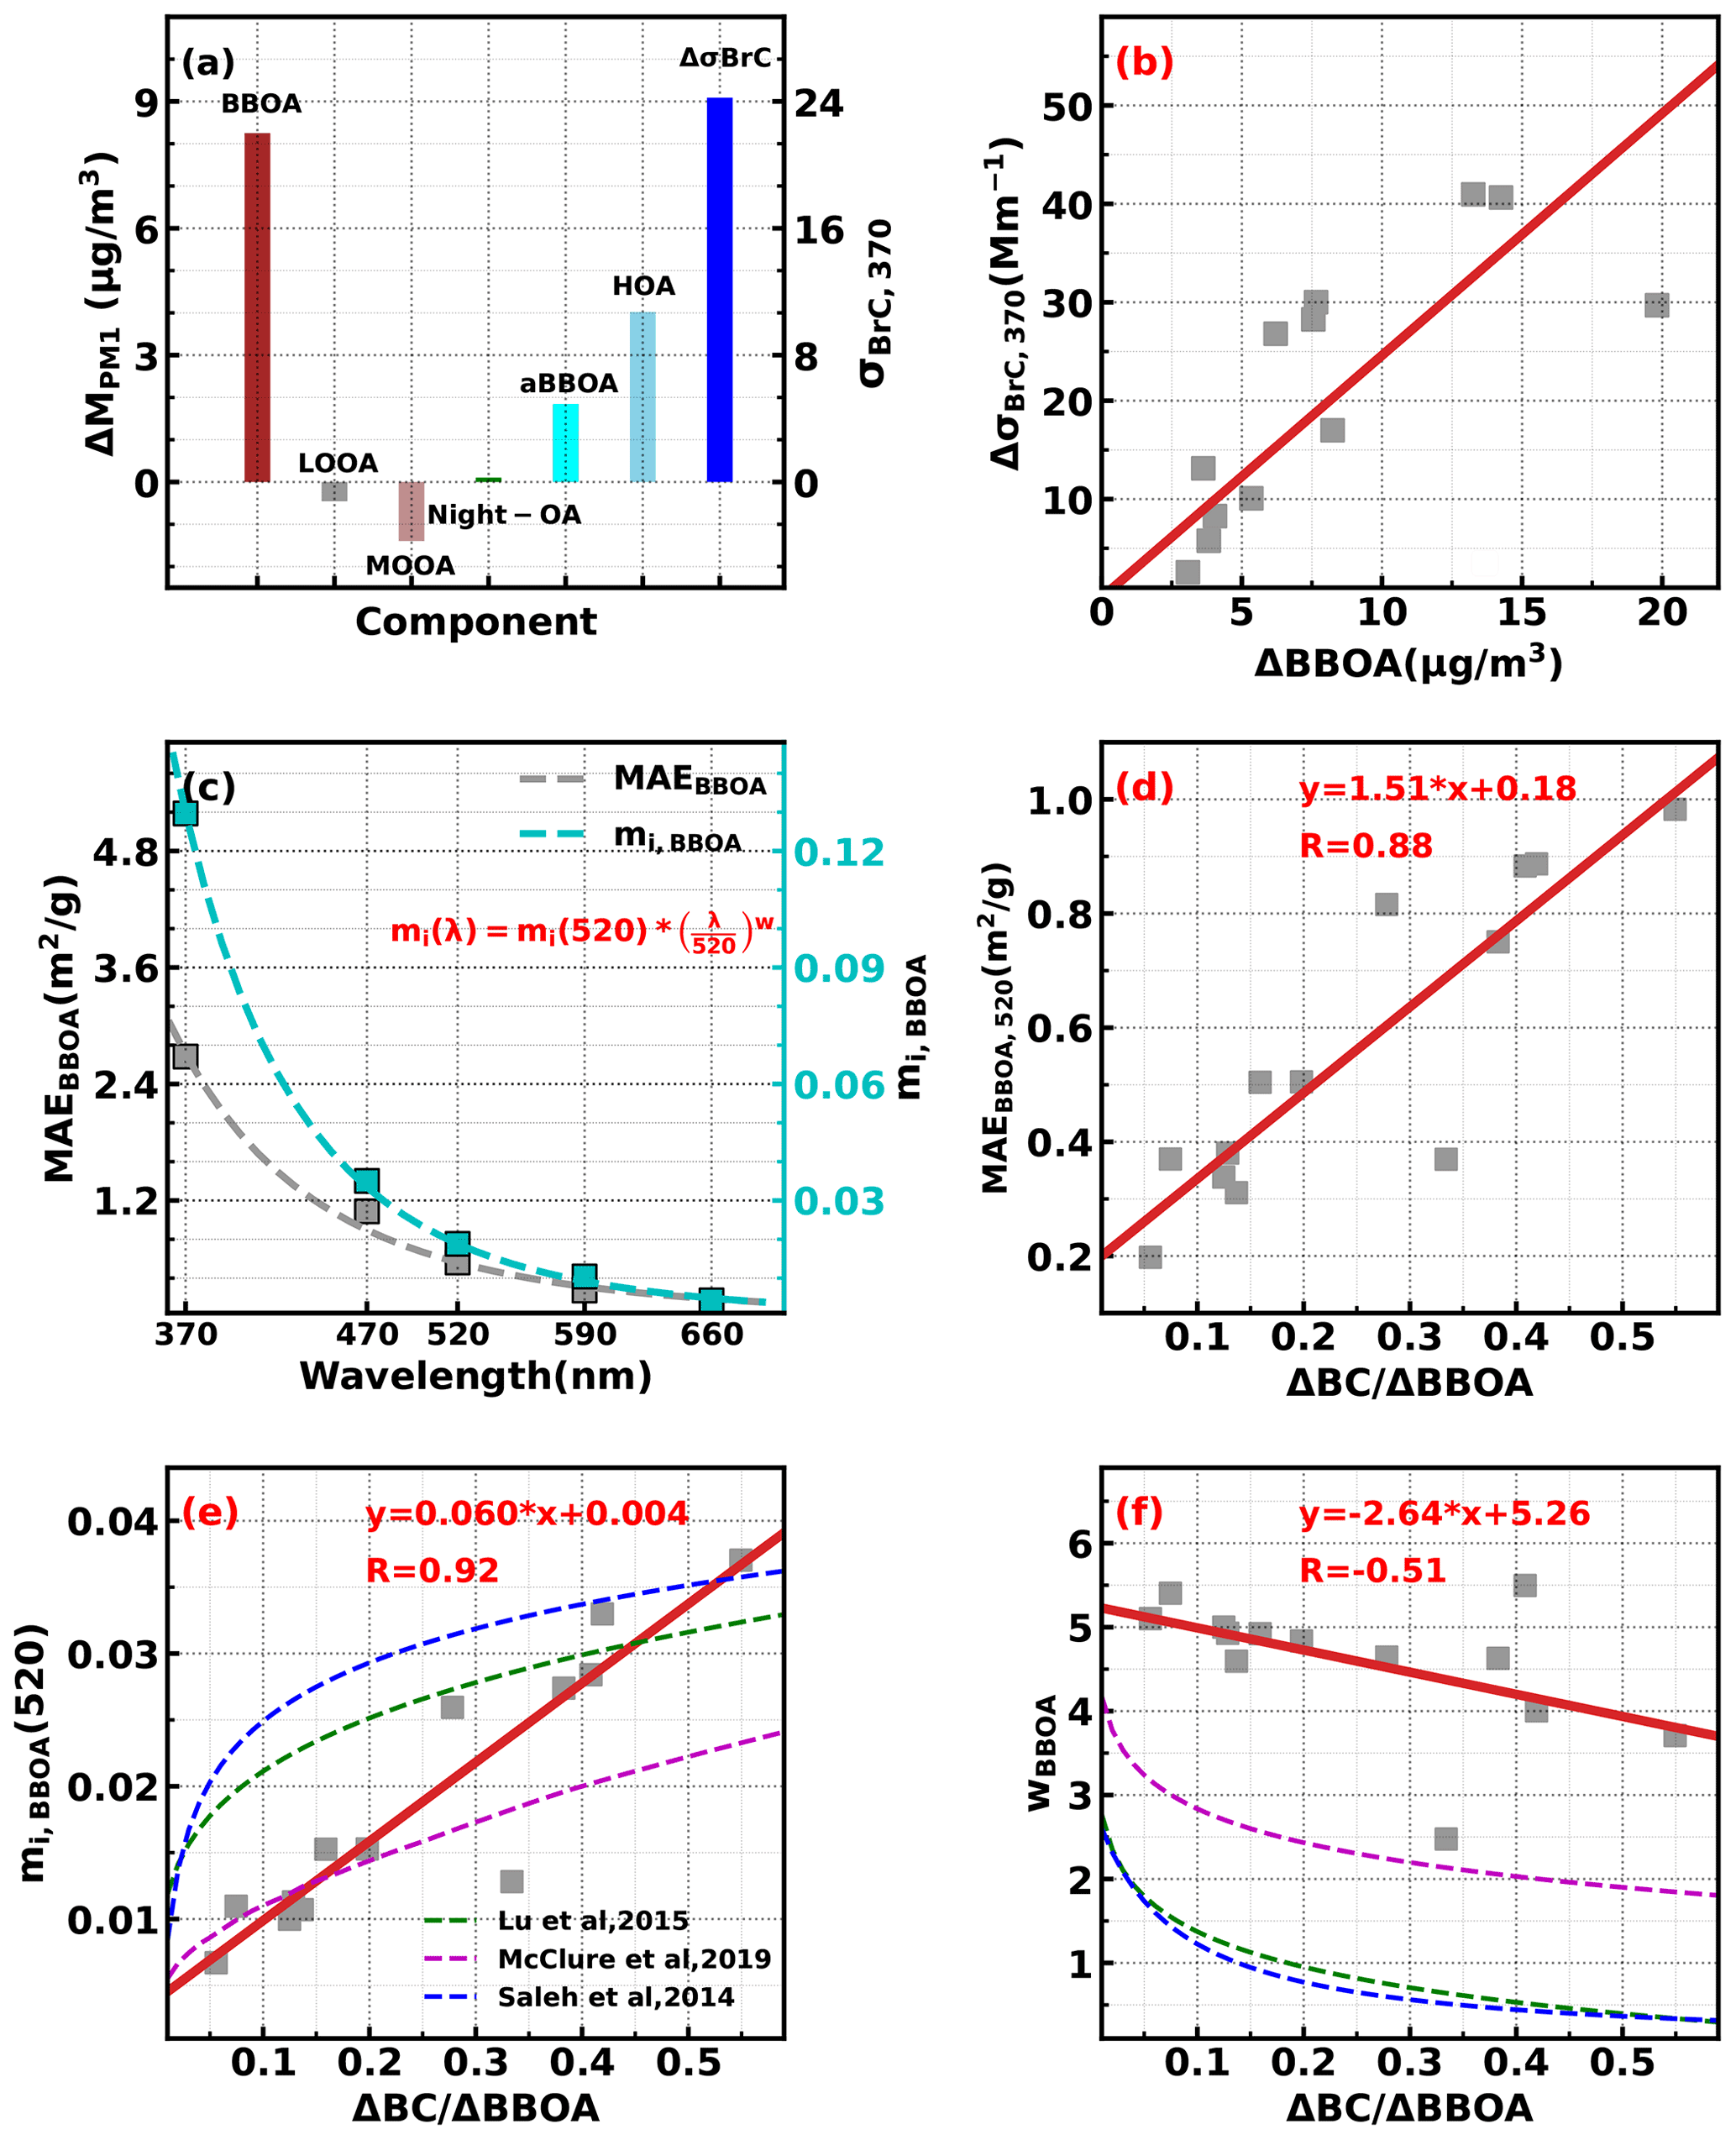
Figure 5(a) Average changes in organic aerosol components for BBOA spikes when BC measurements are available. (b) Relationships between derived ΔσBrC at 525 nm only associated with BBOA and ΔBBOA. (c) Average spectral dependence of MAEBBOA and mi,BBOA. (d) Relationship between MAEBBOA at 525 nm and . (e) Relationship between mi,BBOA at 520 nm and ΔBC/ΔBBOA. (f) Relationship between the spectral dependence parameter wBBOA and .
3.4 BBOA mass absorption efficiency and parameterizations of the spectral dependence of the imaginary part of the BBOA refractive index
Derived BrC absorptions of BBOA spikes were used to calculate MAEBBOA and retrieve mi,BBOA in combination with retrieved BBOA size distributions using Mie theory. Average changes in organic aerosol components for spikes with available σBrC values are shown in Fig. 5a. ΔBBOA dominated the mass changes; however, there were non-negligible changes for aBBOA, HOA and MOOA. The average MAEHOA, MAEaBBOA and MAEMOOA are estimated using multilinear regression for all data points as shown in Fig. S12 with values at 370 nm of 0.1, 0.96 and 0.9 m2 g−1, respectively. Thus the ΔσBrC,BBOA can be derived as
As shown in Fig. 5b, ΔσBrC,BBOA was moderately correlated with ΔBBOA (R=0.65), suggesting MAEBBOA differs much among identified plumes. Derived MAEBBOA exhibited strong wavelength dependence, and average values at wavelengths of 370, 470, 520, 590 and 660 nm were 2.46, 0.99, 0.53, 0.28 and 0.11 m2 g−1, respectively. Figure 5c shows the spectral dependence of MAEBBOA and retrieved mi,BBOA(λ), and the formula form that parameterizes the spectral dependence was consistent with previous studies (Saleh et al., 2014). BBOA absorption properties depended largely on combustion conditions, consistent with results of previous studies (Saleh et al., 2014; Lu et al., 2015; Pokhrel et al., 2016; Xie et al., 2017; Cheng et al., 2019; McClure et al., 2020), and both MAEBBOA and retrieved mi,BBOA (520) were highly and linearly correlated with (Fig. 5d and e). Results regarding mi,BBOA(λ) parameterizations as a function of of previous studies are also shown in Fig. 5e. Results of Saleh et al. (2014) and Lu et al. (2015) at 550 nm were higher for in the range of 0.05 to 0.4. The curve of McClure et al. (2020) described well the mi,BBOA variations for less than 0.2. The mi,BBOA spectral dependence parameter wBBOA ranged from 2.5 to 5.5 with an average of 4.7 and was linearly and negatively correlated with and much higher than those reported in Saleh et al. (2014) and Lu et al. (2015). Note that the parameterization schemes established in Saleh et al. (2014) and Lu et al. (2015) were based on datasets with most data points have <0.1. The wBBOA was also higher than the fitted line of McClure et al. (2020) but was, however, actually consistent with the wBBOA range reported in Fig. 5c of McClure et al. (2020) for a range of 0.1 to 0.55. This result implies that a single formula that parameterizes mi,BBOA over a wide (combustion efficiency) range might lead to significant bias for specific ranges. As shown in Fig. 1 of Lu et al. (2015), field-based mi,BBOA retrievals for >0.1 are quite scarce, which hinders the accurate parameterization of mi,BBOA within the range of this study. The combination of mi,BBOA(520) and wBBOA shown in Fig. 5e and f would bring a new parameterization scheme of mi,BBOA(λ) spectral dependence, which would fill the gap for field-based BBOA absorptivity parameterizations of >0.1.
Findings of BBOA size distributions and real and imaginary parts of BBOA refractive index in this study have important implications for climate modelling of BBOA radiative effects. The volume-dominant mode of biomass burning aerosols contributes dominantly to aerosol mass, which is most important for BBOA scattering and absorption properties. The volume-dominant mode also contributed dominantly to number concentration for the diameter range of >150 nm, and this diameter range played the dominant role in BBOA aerosols as cloud condensation nuclei (Chen et al., 2019). However, previous studies usually parameterized geometric mean diameter Dgn as a function of combustion conditions. It was found that BBOA mass scattering efficiency correlated well with the volume geometric mean diameter Dgv but correlated poorly with Dgn, which was in contradiction to previous results (Levin et al., 2010; Laing et al., 2016) that BBOA mass scattering efficiency was highly correlated with Dgn. However, the simulation results shown in Fig. S13 explain the contrast, which is that aerosol scattering efficiency was very sensitive to σg changes for fixed Dgn; however, they are much less sensitive to σg changes for Dgv, and retrieved σg varied over a wide range from 1.2 to 2 in this study. In addition, it was found that Dgn correlated poorly with normalized parameters such as , whereas Dgv correlated highly with . Therefore, representing BBOA volume size distribution of the volume-dominant mode as a function of combustion conditions in climate models might be a better choice if using only one size distribution mode (Stier et al., 2005; Dentener et al., 2006); however, further and synthesized research on this topic is needed. In view of this, on the basis of the relationships between and , the Dgv was parameterized as and might be applicable in climate models (Saleh, 2020).
The real part of BBOA refractive mR,BBOA was a fundamental parameter for simulating BBOA scattering properties in climate models; however, a constant was usually used due to the lack of adequate parameterizations (Brown et al., 2021). Significant changes were found in mR,BBOA in this study (1.47 to 1.64), and the variations were likely closely associated with changes in fire combustion conditions represented by . For BBOA refractive index, the imaginary part (mi,BBOA) is currently recommended to be parameterized as a function of ratio (Saleh et al., 2014), which is supported by results of several studies (Lu et al., 2015; McClure et al., 2020). Results of this study suggest that it might be also feasible to parameterize mi,BBOA as a function of ; however, this needs further comprehensive investigations.
The imaginary part of BBOA refractive index, mi,BBOA, plays crucial role in representing BBOA absorptivity in climate models. Linear relationships between mi,BBOA and the spectral dependence parameter wBBOA and are reported for the first time in this study. The observed ratio (0.05 to 0.55) is located within the upper range of previously reported values. Few measurements regarding aerosol refractive index and size distributions are available in this range, and no research has focused on parameterizations of the BBOA refractive index in this specific range; thus results of this study have partially filled this gap. Results of McClure et al. (2020) demonstrate that a sigmoidal curve fits well the mi,BBOA variations for a wide range of ratios (10−5 to 10); however, the mi,BBOA variations are not well captured by the fitted curve for >0.1. We recommend more sophisticated parameterizations of mi,BBOA under different ranges.
The data used in this study are available from the corresponding authors upon request: Ye Kuang (kuangye@jnu.edu.cn) and Shan Huang (shanhuang_eci@jnu.edu.cn).
The supplement related to this article is available online at: https://doi.org/10.5194/acp-22-12401-2022-supplement.
YK and SH designed this experiment, and YK conceived and led this research. BL and YK wrote the manuscript. SH and WH led the SP-AMS measurements and particle number size distribution measurements with the help of QS and WL. SH performed the PMF analysis and Cx fragment analysis, and revised the manuscript. MS and BY planned this campaign. DC and DY provided permission to conduct the campaign at the Heshan supersite and made data available from the site. YP provided pictures of biomass burning plumes and helped analyse trace gas measurements.
The contact author has declared that none of the authors has any competing interests.
Publisher's note: Copernicus Publications remains neutral with regard to jurisdictional claims in published maps and institutional affiliations.
We want to thank the two reviewers for their helpful comments and suggestions.
This research has been supported by the National Natural Science Foundation of China (grant nos. 41805109 and 41807302). National Key Research and Development Program of China (grant nos. 2017YFC0212803, 2016YFC0202206), Key-Area Research and Development Program of Guangdong Province (grant no. 2019B110206001), Special Fund Project for Science and Technology Innovation Strategy of Guangdong Province (grant no. 2019B121205004), Guangdong Natural Science Funds for Distinguished Young Scholar (grant no. 2018B030306037), and Guangdong Innovative and Entrepreneurial Research Team Program (grant no. 2016ZT06N263).
This paper was edited by Stefania Gilardoni and reviewed by two anonymous referees.
Bond, T. C., Doherty, S. J., Fahey, D. W., Forster, P. M., Berntsen, T., DeAngelo, B. J., Flanner, M. G., Ghan, S., Kärcher, B., Koch, D., Kinne, S., Kondo, Y., Quinn, P. K., Sarofim, M. C., Schultz, M. G., Schulz, M., Venkataraman, C., Zhang, H., Zhang, S., Bellouin, N., Guttikunda, S. K., Hopke, P. K., Jacobson, M. Z., Kaiser, J. W., Klimont, Z., Lohmann, U., Schwarz, J. P., Shindell, D., Storelvmo, T., Warren, S. G., and Zender, C. S.: Bounding the role of black carbon in the climate system: A scientific assessment, J. Geophys. Res.-Atmos., 118, 5380–5552, https://doi.org/10.1002/jgrd.50171, 2013.
Briggs, N. L., Jaffe, D. A., Gao, H., Hee, J. R., Baylon, P. M., Zhang, Q., Zhou, S., Collier, S. C., Sampson, P. D., and Cary, R. A.: Particulate Matter, Ozone, and Nitrogen Species in Aged Wildfire Plumes Observed at the Mount Bachelor Observatory, Aerosol Air Qual. Res., 16, 3075–3087, https://doi.org/10.4209/aaqr.2016.03.0120, 2017.
Brown, H., Liu, X., Pokhrel, R., Murphy, S., Lu, Z., Saleh, R., Mielonen, T., Kokkola, H., Bergman, T., Myhre, G., Skeie, R. B., Watson-Paris, D., Stier, P., Johnson, B., Bellouin, N., Schulz, M., Vakkari, V., Beukes, J. P., van Zyl, P. G., Liu, S., and Chand, D.: Biomass burning aerosols in most climate models are too absorbing, Nat. Commun., 12, 277, https://doi.org/10.1038/s41467-020-20482-9, 2021.
Chen, L., Li, Q., Wu, D., Sun, H., Wei, Y., Ding, X., Chen, H., Cheng, T., and Chen, J.: Size distribution and chemical composition of primary particles emitted during open biomass burning processes: Impacts on cloud condensation nuclei activation, Sci. Total Environ., 674, 179–188, https://doi.org/10.1016/j.scitotenv.2019.03.419, 2019.
Cheng, Z., Atwi, K., Onyima, T., and Saleh, R.: Investigating the dependence of light-absorption properties of combustion carbonaceous aerosols on combustion conditions, Aerosol Sci. Tech., 53, 419–434, https://doi.org/10.1080/02786826.2019.1566593, 2019.
Collaud Coen, M., Weingartner, E., Apituley, A., Ceburnis, D., Fierz-Schmidhauser, R., Flentje, H., Henzing, J. S., Jennings, S. G., Moerman, M., Petzold, A., Schmid, O., and Baltensperger, U.: Minimizing light absorption measurement artifacts of the Aethalometer: evaluation of five correction algorithms, Atmos. Meas. Tech., 3, 457–474, https://doi.org/10.5194/amt-3-457-2010, 2010.
de Sá, S. S., Rizzo, L. V., Palm, B. B., Campuzano-Jost, P., Day, D. A., Yee, L. D., Wernis, R., Isaacman-VanWertz, G., Brito, J., Carbone, S., Liu, Y. J., Sedlacek, A., Springston, S., Goldstein, A. H., Barbosa, H. M. J., Alexander, M. L., Artaxo, P., Jimenez, J. L., and Martin, S. T.: Contributions of biomass-burning, urban, and biogenic emissions to the concentrations and light-absorbing properties of particulate matter in central Amazonia during the dry season, Atmos. Chem. Phys., 19, 7973–8001, https://doi.org/10.5194/acp-19-7973-2019, 2019.
Dentener, F., Kinne, S., Bond, T., Boucher, O., Cofala, J., Generoso, S., Ginoux, P., Gong, S., Hoelzemann, J. J., Ito, A., Marelli, L., Penner, J. E., Putaud, J.-P., Textor, C., Schulz, M., van der Werf, G. R., and Wilson, J.: Emissions of primary aerosol and precursor gases in the years 2000 and 1750 prescribed data-sets for AeroCom, Atmos. Chem. Phys., 6, 4321–4344, https://doi.org/10.5194/acp-6-4321-2006, 2006.
Drinovec, L., Močnik, G., Zotter, P., Prévôt, A. S. H., Ruckstuhl, C., Coz, E., Rupakheti, M., Sciare, J., Müller, T., Wiedensohler, A., and Hansen, A. D. A.: The “dual-spot” Aethalometer: an improved measurement of aerosol black carbon with real-time loading compensation, Atmos. Meas. Tech., 8, 1965–1979, https://doi.org/10.5194/amt-8-1965-2015, 2015.
Gysel, M., Crosier, J., Topping, D. O., Whitehead, J. D., Bower, K. N., Cubison, M. J., Williams, P. I., Flynn, M. J., McFiggans, G. B., and Coe, H.: Closure study between chemical composition and hygroscopic growth of aerosol particles during TORCH2, Atmos. Chem. Phys., 7, 6131–6144, https://doi.org/10.5194/acp-7-6131-2007, 2007.
Hand, J. L. and Malm, W. C.: Review of aerosol mass scattering efficiencies from ground-based measurements since 1990, J. Geophys. Res.-Atmos., 112, D16203, https://doi.org/10.1029/2007JD008484, 2007.
Hecobian, A., Liu, Z., Hennigan, C. J., Huey, L. G., Jimenez, J. L., Cubison, M. J., Vay, S., Diskin, G. S., Sachse, G. W., Wisthaler, A., Mikoviny, T., Weinheimer, A. J., Liao, J., Knapp, D. J., Wennberg, P. O., Kürten, A., Crounse, J. D., Clair, J. St., Wang, Y., and Weber, R. J.: Comparison of chemical characteristics of 495 biomass burning plumes intercepted by the NASA DC-8 aircraft during the ARCTAS/CARB-2008 field campaign, Atmos. Chem. Phys., 11, 13325–13337, https://doi.org/10.5194/acp-11-13325-2011, 2011.
Hoffer, A., Tóth, Á., Pósfai, M., Chung, C. E., and Gelencsér, A.: Brown carbon absorption in the red and near-infrared spectral region, Atmos. Meas. Tech., 10, 2353–2359, https://doi.org/10.5194/amt-10-2353-2017, 2017.
Janhäll, S., Andreae, M. O., and Pöschl, U.: Biomass burning aerosol emissions from vegetation fires: particle number and mass emission factors and size distributions, Atmos. Chem. Phys., 10, 1427–1439, https://doi.org/10.5194/acp-10-1427-2010, 2010.
Jayne, J. T., Leard, D. C., Zhang, X., Davidovits, P., Smith, K. A., Kolb, C. E., and Worsnop, D. R.: Development of an Aerosol Mass Spectrometer for Size and Composition Analysis of Submicron Particles, Aerosol Sci. Tech., 33, 49–70, https://doi.org/10.1080/027868200410840, 2000.
Kasthuriarachchi, N. Y., Rivellini, L.-H., Adam, M. G., and Lee, A. K. Y.: Light Absorbing Properties of Primary and Secondary Brown Carbon in a Tropical Urban Environment, Environ. Sci. Technol., 54, 10808–10819, https://doi.org/10.1021/acs.est.0c02414, 2020.
Kuang, Y., Zhao, C., Tao, J., Bian, Y., Ma, N., and Zhao, G.: A novel method for deriving the aerosol hygroscopicity parameter based only on measurements from a humidified nephelometer system, Atmos. Chem. Phys., 17, 6651–6662, https://doi.org/10.5194/acp-17-6651-2017, 2017.
Kuang, Y., He, Y., Xu, W., Zhao, P., Cheng, Y., Zhao, G., Tao, J., Ma, N., Su, H., Zhang, Y., Sun, J., Cheng, P., Yang, W., Zhang, S., Wu, C., Sun, Y., and Zhao, C.: Distinct diurnal variation in organic aerosol hygroscopicity and its relationship with oxygenated organic aerosol, Atmos. Chem. Phys., 20, 865–880, https://doi.org/10.5194/acp-20-865-2020, 2020.
Kuang, Y., Huang, S., Xue, B., Luo, B., Song, Q., Chen, W., Hu, W., Li, W., Zhao, P., Cai, M., Peng, Y., Qi, J., Li, T., Wang, S., Chen, D., Yue, D., Yuan, B., and Shao, M.: Contrasting effects of secondary organic aerosol formations on organic aerosol hygroscopicity, Atmos. Chem. Phys., 21, 10375–10391, https://doi.org/10.5194/acp-21-10375-2021, 2021.
Kuwata, M., Zorn, S. R., and Martin, S. T.: Using Elemental Ratios to Predict the Density of Organic Material Composed of Carbon, Hydrogen, and Oxygen, Environ. Sci. Technol., 46, 787–794, https://doi.org/10.1021/es202525q, 2012.
Lack, D. A. and Cappa, C. D.: Impact of brown and clear carbon on light absorption enhancement, single scatter albedo and absorption wavelength dependence of black carbon, Atmos. Chem. Phys., 10, 4207–4220, https://doi.org/10.5194/acp-10-4207-2010, 2010.
Laing, J. R., Jaffe, D. A., and Hee, J. R.: Physical and optical properties of aged biomass burning aerosol from wildfires in Siberia and the Western USA at the Mt. Bachelor Observatory, Atmos. Chem. Phys., 16, 15185–15197, https://doi.org/10.5194/acp-16-15185-2016, 2016.
Laskin, A., Laskin, J., and Nizkorodov, S. A.: Chemistry of Atmospheric Brown Carbon, Chem. Rev., 115, 4335–4382, https://doi.org/10.1021/cr5006167, 2015.
Levin, E. J. T., McMeeking, G. R., Carrico, C. M., Mack, L. E., Kreidenweis, S. M., Wold, C. E., Moosmüller, H., Arnott, W. P., Hao, W. M., Collett Jr, J. L., and Malm, W. C.: Biomass burning smoke aerosol properties measured during Fire Laboratory at Missoula Experiments (FLAME), J. Geophys. Res.-Atmos., 115, D18210, https://doi.org/10.1029/2009JD013601, 2010.
Li, Z., Tan, H., Zheng, J., Liu, L., Qin, Y., Wang, N., Li, F., Li, Y., Cai, M., Ma, Y., and Chan, C. K.: Light absorption properties and potential sources of particulate brown carbon in the Pearl River Delta region of China, Atmos. Chem. Phys., 19, 11669–11685, https://doi.org/10.5194/acp-19-11669-2019, 2019.
Liu, D. T., Li, S. Y., Hu, D. W., Kong, S. F., Cheng, Y., Wu, Y. Z., Ding, S., Hu, K., Zheng, S. R., Yan, Q., Zheng, H., Zhao, D. L., Tian, P., Ye, J. H., Huang, M. Y., and Ding, D. P.: Evolution of Aerosol Optical Properties from Wood Smoke in Real Atmosphere Influenced by Burning Phase and Solar Radiation, Environ. Sci. Technol., 55, 5677–5688, https://doi.org/10.1021/acs.est.0c07569, 2021.
Liu, J., Li, J., Zhang, Y., Liu, D., Ding, P., Shen, C., Shen, K., He, Q., Ding, X., Wang, X., Chen, D., Szidat, S., and Zhang, G.: Source apportionment using radiocarbon and organic tracers for PM2.5 carbonaceous aerosols in Guangzhou, South China: contrasting local- and regional-scale haze events, Environ. Sci. Technol., 48, 12002–12011, https://doi.org/10.1021/es503102w, 2014.
Liu, J., Andersson, A., Zhong, G., Geng, X., Ding, P., Zhu, S., Cheng, Z., Zakaria, M. P., Bong, C. W., Li, J., Zheng, J., Zhang, G., and Gustafsson, Ö.: Isotope constraints of the strong influence of biomass burning to climate-forcing Black Carbon aerosols over Southeast Asia, Sci. Total Environ., 744, 140359, https://doi.org/10.1016/j.scitotenv.2020.140359, 2020.
Liu, L., Cheng, Y., Wang, S., Wei, C., Pöhlker, M. L., Pöhlker, C., Artaxo, P., Shrivastava, M., Andreae, M. O., Pöschl, U., and Su, H.: Impact of biomass burning aerosols on radiation, clouds, and precipitation over the Amazon: relative importance of aerosol–cloud and aerosol–radiation interactions, Atmos. Chem. Phys., 20, 13283–13301, https://doi.org/10.5194/acp-20-13283-2020, 2020.
Lu, Z., Streets, D. G., Winijkul, E., Yan, F., Chen, Y., Bond, T. C., Feng, Y., Dubey, M. K., Liu, S., Pinto, J. P., and Carmichael, G. R.: Light Absorption Properties and Radiative Effects of Primary Organic Aerosol Emissions, Environmental Sci. Technol., 49, 4868–4877, https://doi.org/10.1021/acs.est.5b00211, 2015.
McClure, C. D., Lim, C. Y., Hagan, D. H., Kroll, J. H., and Cappa, C. D.: Biomass-burning-derived particles from a wide variety of fuels – Part 1: Properties of primary particles, Atmos. Chem. Phys., 20, 1531–1547, https://doi.org/10.5194/acp-20-1531-2020, 2020.
McMeeking, G. R., Kreidenweis, S. M., Carrico, C. M., Lee, T., Collett Jr., J. L., and Malm, W. C.: Observations of smoke-influenced aerosol during the Yosemite Aerosol Characterization Study: Size distributions and chemical composition, J. Geophys. Res.-Atmos., 110, D09206, https://doi.org/10.1029/2004JD005389, 2005.
Okoshi, R., Rasheed, A., Chen Reddy, G., McCrowey, C. J., and Curtis, D. B.: Size and mass distributions of ground-level sub-micrometer biomass burning aerosol from small wildfires, Atmos. Environ., 89, 392–402, https://doi.org/10.1016/j.atmosenv.2014.01.024, 2014.
Pokhrel, R. P., Wagner, N. L., Langridge, J. M., Lack, D. A., Jayarathne, T., Stone, E. A., Stockwell, C. E., Yokelson, R. J., and Murphy, S. M.: Parameterization of single-scattering albedo (SSA) and absorption Ångström exponent (AAE) with for aerosol emissions from biomass burning, Atmos. Chem. Phys., 16, 9549–9561, https://doi.org/10.5194/acp-16-9549-2016, 2016.
Pratt, K. A., Murphy, S. M., Subramanian, R., DeMott, P. J., Kok, G. L., Campos, T., Rogers, D. C., Prenni, A. J., Heymsfield, A. J., Seinfeld, J. H., and Prather, K. A.: Flight-based chemical characterization of biomass burning aerosols within two prescribed burn smoke plumes, Atmos. Chem. Phys., 11, 12549–12565, https://doi.org/10.5194/acp-11-12549-2011, 2011.
Qin, Y. M., Tan, H. B., Li, Y. J., Li, Z. J., Schurman, M. I., Liu, L., Wu, C., and Chan, C. K.: Chemical characteristics of brown carbon in atmospheric particles at a suburban site near Guangzhou, China, Atmos. Chem. Phys., 18, 16409–16418, https://doi.org/10.5194/acp-18-16409-2018, 2018.
Qiu, J., Tan, W., Zhao, G., Yu, Y., and Zhao, C.: New correction method for the scattering coefficient measurements of a three-wavelength nephelometer, Atmos. Meas. Tech., 14, 4879–4891, https://doi.org/10.5194/amt-14-4879-2021, 2021.
Reid, J. S. and Hobbs, P. V.: Physical and optical properties of young smoke from individual biomass fires in Brazil, J. Geophys. Res.-Atmos., 103, 32013–32030, https://doi.org/10.1029/98JD00159, 1998.
Reid, J. S., Eck, T. F., Christopher, S. A., Koppmann, R., Dubovik, O., Eleuterio, D. P., Holben, B. N., Reid, E. A., and Zhang, J.: A review of biomass burning emissions part III: intensive optical properties of biomass burning particles, Atmos. Chem. Phys., 5, 827–849, https://doi.org/10.5194/acp-5-827-2005, 2005a.
Reid, J. S., Koppmann, R., Eck, T. F., and Eleuterio, D. P.: A review of biomass burning emissions part II: intensive physical properties of biomass burning particles, Atmos. Chem. Phys., 5, 799–825, https://doi.org/10.5194/acp-5-799-2005, 2005b.
Riemer, N., Ault, A. P., West, M., Craig, R. L., and Curtis, J. H.: Aerosol Mixing State: Measurements, Modeling, and Impacts, Rev. Geophys., 57, 187–249, https://doi.org/10.1029/2018RG000615, 2019.
Sakamoto, K. M., Allan, J. D., Coe, H., Taylor, J. W., Duck, T. J., and Pierce, J. R.: Aged boreal biomass-burning aerosol size distributions from BORTAS 2011, Atmos. Chem. Phys., 15, 1633–1646, https://doi.org/10.5194/acp-15-1633-2015, 2015.
Sakamoto, K. M., Laing, J. R., Stevens, R. G., Jaffe, D. A., and Pierce, J. R.: The evolution of biomass-burning aerosol size distributions due to coagulation: dependence on fire and meteorological details and parameterization, Atmos. Chem. Phys., 16, 7709–7724, https://doi.org/10.5194/acp-16-7709-2016, 2016.
Saleh, R., Hennigan, C. J., McMeeking, G. R., Chuang, W. K., Robinson, E. S., Coe, H., Donahue, N. M., and Robinson, A. L.: Absorptivity of brown carbon in fresh and photo-chemically aged biomass-burning emissions, Atmos. Chem. Phys., 13, 7683–7693, https://doi.org/10.5194/acp-13-7683-2013, 2013.
Saleh, R., Robinson, E. S., Tkacik, D. S., Ahern, A. T., Liu, S., Aiken, A. C., Sullivan, R. C., Presto, A. A., Dubey, M. K., Yokelson, R. J., Donahue, N. M., and Robinson, A. L.: Brownness of organics in aerosols from biomass burning linked to their black carbon content, Nat. Geosci., 7, 647–650, https://doi.org/10.1038/Ngeo2220, 2014.
Saleh, R., Marks, M., Heo, J., Adams, P. J., Donahue, N. M., and Robinson, A. L.: Contribution of brown carbon and lensing to the direct radiative effect of carbonaceous aerosols from biomass and biofuel burning emissions, J. Geophys. Res.-Atmos., 120, 10285–10296, https://doi.org/10.1002/2015JD023697, 2015.
Saleh, R.: From Measurements to Models: Toward Accurate Representation of Brown Carbon in Climate Calculations, Current Pollution Reports, 6, 90–104, https://doi.org/10.1007/s40726-020-00139-3, 2020.
Stier, P., Feichter, J., Kinne, S., Kloster, S., Vignati, E., Wilson, J., Ganzeveld, L., Tegen, I., Werner, M., Balkanski, Y., Schulz, M., Boucher, O., Minikin, A., and Petzold, A.: The aerosol-climate model ECHAM5-HAM, Atmos. Chem. Phys., 5, 1125–1156, https://doi.org/10.5194/acp-5-1125-2005, 2005.
Tan, H., Liu, L., Fan, S., Li, F., Yin, Y., Cai, M., and Chan, P. W.: Aerosol optical properties and mixing state of black carbon in the Pearl River Delta, China, Atmos. Environ., 131, 196–208, https://doi.org/10.1016/j.atmosenv.2016.02.003, 2016.
Tao, J., Zhang, Z., Wu, Y., Zhang, L., Wu, Z., Cheng, P., Li, M., Chen, L., Zhang, R., and Cao, J.: Impact of particle number and mass size distributions of major chemical components on particle mass scattering efficiency in urban Guangzhou in southern China, Atmos. Chem. Phys., 19, 8471–8490, https://doi.org/10.5194/acp-19-8471-2019, 2019.
Tao, J., Surapipith, V., Han, Z., Prapamontol, T., Kawichai, S., Zhang, L., Zhang, Z., Wu, Y., Li, J., Li, J., Yang, Y., and Zhang, R.: High mass absorption efficiency of carbonaceous aerosols during the biomass burning season in Chiang Mai of northern Thailand, Atmos. Environ., 240, 117821, https://doi.org/10.1016/j.atmosenv.2020.117821, 2020.
Wang, J., Nie, W., Cheng, Y., Shen, Y., Chi, X., Wang, J., Huang, X., Xie, Y., Sun, P., Xu, Z., Qi, X., Su, H., and Ding, A.: Light absorption of brown carbon in eastern China based on 3-year multi-wavelength aerosol optical property observations and an improved absorption Ångström exponent segregation method, Atmos. Chem. Phys., 18, 9061–9074, https://doi.org/10.5194/acp-18-9061-2018, 2018.
Wang, Q., Saturno, J., Chi, X., Walter, D., Lavric, J. V., Moran-Zuloaga, D., Ditas, F., Pöhlker, C., Brito, J., Carbone, S., Artaxo, P., and Andreae, M. O.: Modeling investigation of light-absorbing aerosols in the Amazon Basin during the wet season, Atmos. Chem. Phys., 16, 14775–14794, https://doi.org/10.5194/acp-16-14775-2016, 2016.
Wang, X., Heald, C. L., Sedlacek, A. J., de Sá, S. S., Martin, S. T., Alexander, M. L., Watson, T. B., Aiken, A. C., Springston, S. R., and Artaxo, P.: Deriving brown carbon from multiwavelength absorption measurements: method and application to AERONET and Aethalometer observations, Atmos. Chem. Phys., 16, 12733–12752, https://doi.org/10.5194/acp-16-12733-2016, 2016.
Wu, D., Mao, J., Deng, X., Tie, X., Zhang, Y., Zeng, L., Li, F., Tan, H., Bi, X., Huang, X., Chen, J., and Deng, T.: Black carbon aerosols and their radiative properties in the Pearl River Delta region, Sci. China Ser. D, 52, 1152–1163, https://doi.org/10.1007/s11430-009-0115-y, 2009.
Xie, M., Hays, M. D., and Holder, A. L.: Light-absorbing organic carbon from prescribed and laboratory biomass burning and gasoline vehicle emissions, Scientific Reports, 7, 7318, https://doi.org/10.1038/s41598-017-06981-8, 2017.
Yang, M., Howell, S. G., Zhuang, J., and Huebert, B. J.: Attribution of aerosol light absorption to black carbon, brown carbon, and dust in China – interpretations of atmospheric measurements during EAST-AIRE, Atmos. Chem. Phys., 9, 2035–2050, https://doi.org/10.5194/acp-9-2035-2009, 2009.
Yu, Z., Cheng, Z., Magoon, G. R., Hajj, O. E., and Saleh, R.: Characterization of light-absorbing aerosols from a laboratory combustion source with two different photoacoustic techniques, Aerosol Sci. Tech., 55, 387–397, https://doi.org/10.1080/02786826.2020.1849537, 2021.
Yus-Díez, J., Bernardoni, V., Močnik, G., Alastuey, A., Ciniglia, D., Ivančič, M., Querol, X., Perez, N., Reche, C., Rigler, M., Vecchi, R., Valentini, S., and Pandolfi, M.: Determination of the multiple-scattering correction factor and its cross-sensitivity to scattering and wavelength dependence for different AE33 Aethalometer filter tapes: a multi-instrumental approach, Atmos. Meas. Tech., 14, 6335–6355, https://doi.org/10.5194/amt-14-6335-2021, 2021.
Zhang, A., Wang, Y., Zhang, Y., Weber, R. J., Song, Y., Ke, Z., and Zou, Y.: Modeling the global radiative effect of brown carbon: a potentially larger heating source in the tropical free troposphere than black carbon, Atmos. Chem. Phys., 20, 1901–1920, https://doi.org/10.5194/acp-20-1901-2020, 2020.
Zhang, G., Peng, L., Lian, X., Lin, Q., Bi, X., Chen, D., Li, M., Li, L., Wang, X., and Sheng, G.: An Improved Absorption Ångström Exponent (AAE)-Based Method for Evaluating the Contribution of Light Absorption from Brown Carbon with a High-Time Resolution, Aerosol Air Qual. Res., 19, 15–24, https://doi.org/10.4209/aaqr.2017.12.0566, 2019.
Zhao, G., Tao, J., Kuang, Y., Shen, C., Yu, Y., and Zhao, C.: Role of black carbon mass size distribution in the direct aerosol radiative forcing, Atmos. Chem. Phys., 19, 13175–13188, https://doi.org/10.5194/acp-19-13175-2019, 2019.
Zhao, G., Yu, Y., Tian, P., Li, J., Guo, S., and Zhao, C.: Evaluation and Correction of the Ambient Particle Spectral Light Absorption Measured Using a Filter-based Aethalometer, Aerosol Air Qual. Res., 20, 1833–1841, https://doi.org/10.4209/aaqr.2019.10.0500, 2020.