the Creative Commons Attribution 4.0 License.
the Creative Commons Attribution 4.0 License.
 | 08 Sep 2022
Measurement report: The 10-year trend of PM2.5 major components and source tracers from 2008 to 2017 in an urban site of Hong Kong, China
Wing Sze Chow
Kezheng Liao
X. H. Hilda Huang
Ka Fung Leung
Alexis K. H. Lau
Fine particulate matter (PM2.5) remains a major air pollutant of significant public health concern in urban areas. Long-term monitoring data of PM2.5 chemical composition and source-specific tracers provide essential information for the identification of major sources as well as evaluation and planning of control measures. In this study, we present and analyze a 10-year dataset of PM2.5 major components and source-specific tracers (e.g., levoglucosan, hopanes, K+, Ni, V, Al, and Si) collected over the period of 2008–2017 in an urban site in Hong Kong, China. The time series of pollutants were analyzed by the seasonal and trend decomposition using the locally estimated scatter plot smoothing (LOESS) method and general least squares with the autoregressive moving average method. Bulk PM2.5 and all its major components displayed a significant decline of varying degrees over the decade. PM2.5 was reduced by 40 % at −1.5 . PM2.5 components that are predominantly influenced by local vehicular emissions showed the steepest decline, with nitrate decreasing by −66 %, elemental carbon by −60 %, and hopanes by −75 %, confirming effective control of local vehicular emissions. For components that are significantly impacted by regional transport and secondary formation, they had a notably lower percentage reduction, with sulfate declining by −40 % and organic carbon by −23 %, reflecting complexity in their region-wide contributing sources and formation chemistry. Levoglucosan and K+, two tracers for biomass burning, differed in their reduction extent, with K+ at −60 % and levoglucosan at −47 %, indicating they likely track different biomass burning types. Dust components in PM2.5 also decreased, by −37 % for Al and −46 % for Si. The year of 2011 was an anomaly in the overall trend in having higher concentrations of PM2.5 and components than its adjacent years, and the long time series analysis attributed the anomaly to unusually lower rainfall associated with strong La Niña events. This 10-year trend analysis based on measurements exemplifies the utility of chemical composition data in support of an evidence-based approach for control policy formulation.
- Article
(4565 KB) - Full-text XML
-
Supplement
(2369 KB) - BibTeX
- EndNote


Air pollution controls are of both local and global importance. Their effectiveness needs to be periodically reviewed for optimizing options to improve air quality and minimize environmental impacts. Particulate matter with aerodynamic diameter less than 2.5 µm, namely fine particulate matter (PM2.5), is a major air pollutant. It is a significant contributor to visibility reduction and climate change and has detrimental effects on human health (Yang et al., 2018; Zhao et al., 2013; Lippmann and Chen, 2009; Ko et al., 2007; Kim et al., 2006; Cheung et al., 2005). Hong Kong, located in the southern coastal part of China, is an important part of the Guangdong–Hong Kong–Macau Greater Bay Area (GBA), which includes the Pearl River Delta (PRD) region in Guangdong plus Hong Kong and Macao. The Hong Kong government has been assiduous in controlling the local emission via the Air Pollution Control Ordinance, in addition to cooperating with the neighboring Guangdong and Macao governments on formulating control policies to reduce air pollution emissions in the area (HKEPD, 2021a). Ambient monitoring of criteria air pollutants plays an important role in verifying the effectiveness of control policies. For example, from 2006 to 2018, large reductions were documented for sulfur dioxide (−81 %), nitrogen dioxide (−28 %), and PM10 (−36 %) in terms of annual average concentrations (HKEPD, 2019, 2020), reflecting the benefits from a series of SO2, NO2, and PM reduction measures (Table S8 in the Supplement).
PM2.5 was introduced as a criteria pollutant in Hong Kong in 2004, while its online monitoring preceded 5 years earlier at three sites (Tap Mun, Tung Chung, Tsuen Wan) in 1999. PM2.5 mass was added as a monitoring parameter in 2015 to the PRD Regional Air Quality Monitoring Network, which has included 23 sites in the GBA since 2015. The monitoring data indicate that while substantial progress has been made in lowering the pollution level of PM2.5, from 38 µg m−3 in 1999 to 15 µg m−3 in 2020 (Fig. 1a), the current level still notably exceeds the most updated air quality guideline of an annual average of 5 µg m−3 as recommended by the World Health Organization (World Health Organization, 2021). This reality highlights the need for continued efforts to further identify specific emission sources such that effective management strategies can be formulated. Different from criteria gaseous pollutants, PM2.5 is a complex mixture containing inorganic components (e.g., sulfate, nitrate, and ammonium), elemental carbon (EC), organic carbon (OC) (consisting of tens of thousands of individual organic compounds), and metal oxides. The accumulation of PM2.5 pollution could come from direct emissions from human activities and biogenic sources and/or atmospheric formation processes. Additionally, changes in air quality could be masked by variations in atmospheric dispersion conditions on daily, seasonal, and annual bases. The multiple layers of complexity mean that PM2.5 mass concentration alone is insufficient to identify contributing sources or to attribute a reduction in PM2.5 to a particular control measure. This is evident from Fig. 1b, which shows the percentage changes vary significantly among PM2.5 components, using the dataset to be discussed in this work as an illustration.
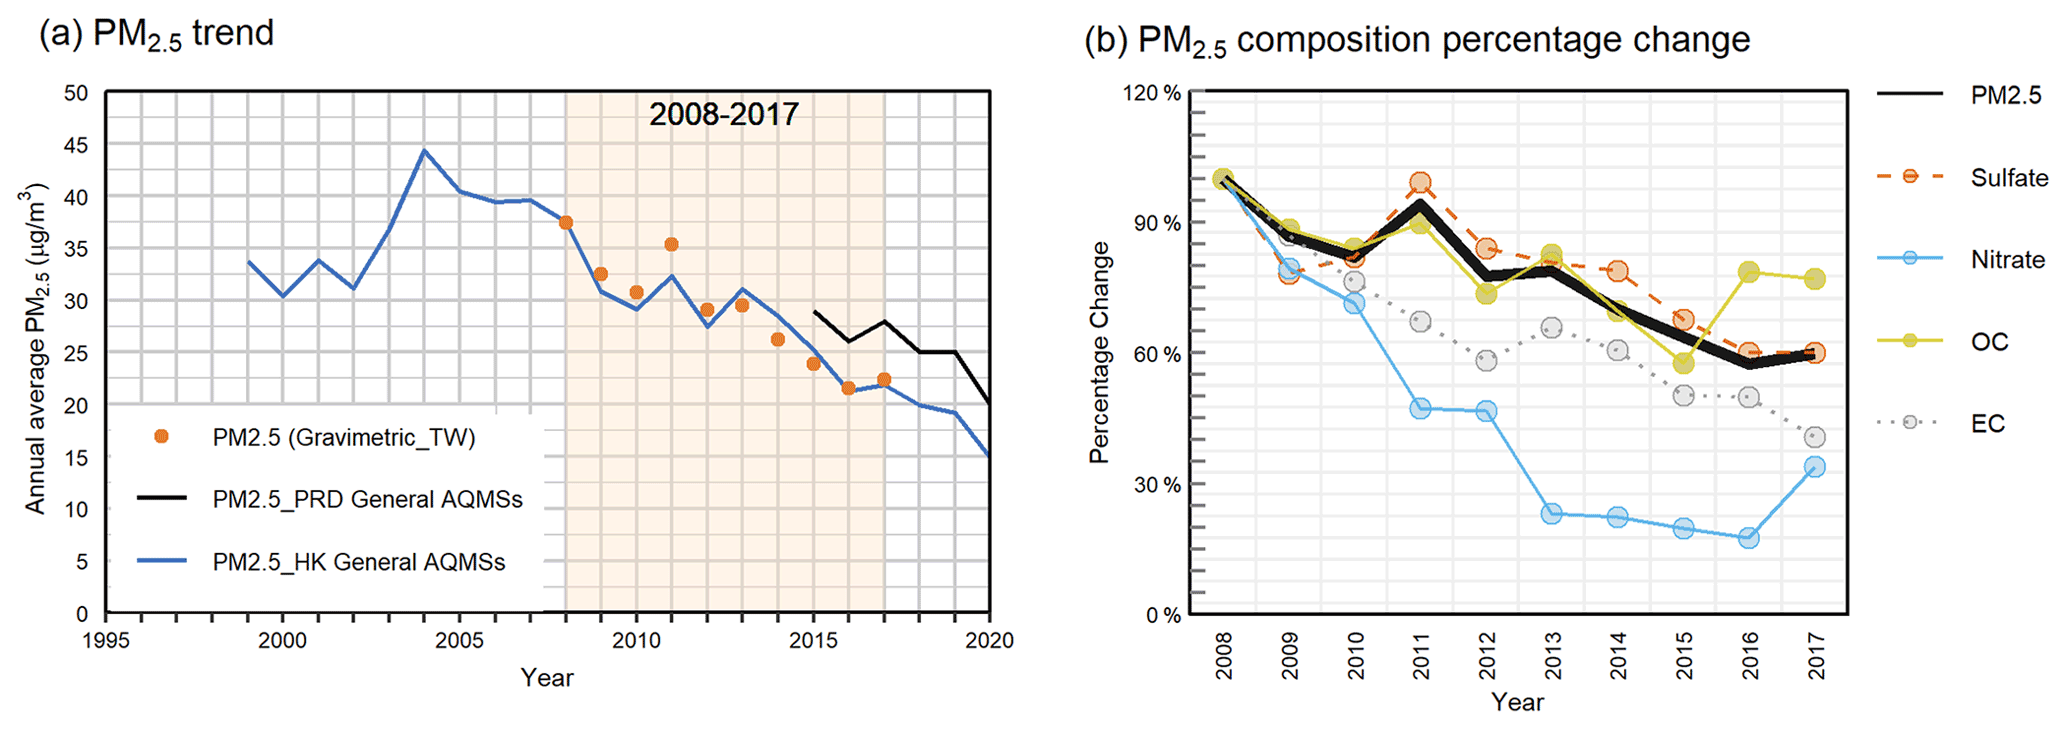
Figure 1(a) Trend of annual average PM2.5 in Hong Kong for the period of 1999–2020 and the PRD regionwide average PM2.5 during 2015–2020. The regionwide annual PM2.5 is the average of 23 monitoring stations in the PRD Regional Air Quality Monitoring Network, including three stations located in Hong Kong. The shaded period (2008–2017) has available PM2.5 major components and select source tracers at Tsuen Wan (TW), an urban site in Hong Kong, with the yellow dots representing gravimetrically determined PM2.5 concentrations from the collected filter samples at TW. (b) The percentage changes of PM2.5 and its major composition at TW using 2008 as the base year.
The speciated analysis of PM2.5, in particular the measurement of source-specific marker species, provides valuable information for understanding the sources, formation, and evolution of the PM pollution. Long time series of such chemically specific data would, on the other hand, potentially allow for the discernment of meaningful trends that are not apparent in one-time field projects as well as establish long-term knowledge about representative urban/regional aerosol chemistry. However, long-term measurements of PM2.5 species in China are very limited, more so for the source-specific markers. Our research team launched a filter-based PM2.5 monitoring program in mid-2007 at Tsuen Wan (TW), an urban location, and has maintained the operation since then. Our monitoring program adopts a regular sampling schedule of one 24 h sample every 6 d to ensure temporal representativeness. High-volume samples were also collected to allow for sufficient aerosol materials for analysis of organic source markers (e.g., hopanes for vehicular emissions and levoglucosan for biomass burning emissions). Starting from 2011, Hong Kong Environmental Protection Department (HKEPD) established a regular PM2.5 chemical speciation monitoring network, with TW as one of its monitoring stations and adopting a 1-in-6 d sampling schedule as well (e.g., Yu et al., 2012). The field sampling, laboratory analyses, quality check/quality assurance, and data validation were conducted according to the same set of standard operating procedures which are in reference to those recommended by the US Environmental Protection Agency (Chow and Watson, 1998; USEPA, 2016). The laboratory analyses of PM2.5 mass and major components (water-soluble ions, OC, EC, and elements) were performed by our research team except for samples from the year of 2015, which were analyzed by the Desert Research Institute (Chow et al., 2016). This set of filter samples allows us to observe the long-term trend of PM2.5 major components and source tracers and to examine variations in aerosol sources affecting Hong Kong urban atmosphere for the 10-year period of 2008–2017.
Studies of PM2.5 speciation data derived using a consistent sampling and analysis methodology over a period of as long as a decade and as early as 2008 are few and far between in China and elsewhere in Asia. A few multi-year studies were documented in the literature. One study covered a rural site (Wanqinsha) in the GBA in the fall and winter seasons over 6 years (2007–2012) (Fu et al., 2014). In the second study, PM2.5 speciation covered six sites in Foshan, a populated city in the GBA, in winter and summer seasons over 7 years (2008–2014) (Tan et al., 2016). In the third study, PM2.5 samples were collected in urban Beijing from 2011 to 2015 (Lang et al., 2017). Unfortunately, these long-term studies did not follow regular sampling schedules throughout the annual cycle. Some months of the year were not sampled, biasing their temporal representativeness in tracking long-term trends of PM2.5 composition. Recently, the Chinese Central Government set up the National Aerosol Composition Monitoring Network in 2017 with a view to evaluating the effectiveness of its “2+26” strategy for improving air quality (Chen et al., 2019; Dao et al., 2019). This nationwide monitoring program is expected to generate high-quality PM2.5 composition data in the long run. Yet, a long-term dataset is not available due to the limited operating period.
In this work, we analyzed the trends of PM2.5 and its major components and individual source marker molecules/elements by the seasonal and trend decomposition with locally estimated scatter plot smoothing (LOESS), a robust method for extracting trend components from concentration time series (Cleveland et al., 1990), and cross-compared the results with the non-parametric Mann–Kendall test and Sen's slope. The objectives are to quantify the 10-year variations in PM2.5 chemical composition and to characterize how major local and regional sources impacting PM2.5 pollution in Hong Kong have varied in the decade. The aim of this work is to provide a well-scrutinized long-term dataset of PM2.5 chemical composition and a sound analysis of source implications for an urban location in southern China to support studies of control measure evaluation and formulation.
2.1 PM2.5 chemical speciation data
PM2.5 filter samples were collected on a 24 h basis (midnight to midnight) once every 6 d from 2008 to 2017 at Tsuen Wan (TW, N, E), an urban air quality monitoring station (AQMS) in Hong Kong. TW is a station surrounded by residential and commercial buildings and located about 3.3 km north of the city's international shipping port (Kwai Chung and Tsing Yi Container Terminals). Both high-volume and mid-volume samplers were equipped at the station. The high-volume sampler (Andersen Instrument, Smyrna, GA, USA) was loaded with a pre-baked 20 cm×25 cm quartz fiber filter and operated at a flow of 1.13 m3 min−1. Two types of mid-volume samplers were used in the course of 10 years. From 2008 to 2010, a RAAS four-channel mid-volume sampler (Andersen Instrument, Smyrna, GA, USA) was operated, and the configuration of the four channels was as below: Channels 1 and 4 sampling at 16.7 L min−1 and loaded with one 47 mm Teflon filter and one 47 mm quartz filter and Channels 2 and 3 sampling at a flow rate of 7.3 L min−1 and loaded with one 47 mm nylon filter and one 47 mm quartz filter. From 2011 to 2017, two mid-volume samplers (Partisol R&P, Model 2025, Albany, NY, USA) were operated side by side to collect one Teflon and one quartz fiber filter at 16.7 L min−1. After the collections, the 47 mm Teflon filters were stored in Petri dishes, and the 47 mm quartz filters were stored in the dishes lined with aluminum foil. The dishes were sealed with parafilm, while the 20 cm×25 cm quartz filters were folded in half and stored in aluminum foil. All the filters were packed in a thermal bag for transportation to the laboratory and refrigerated under 4 ∘C before chemical analysis. Field blanks were collected at a frequency of 10 % of a sampler's routine operating frequency. They were used to monitor contamination throughout the process from sampling to analysis and for background correction. The field blank filters were stored and analyzed following the same procedures as those of PM2.5 sample filters for quality assurance purposes. A total of 592 sets of filter samples were collected, each set consisting of one 20 cm×25 cm filter and multiple 47 mm filter samples for a sampling day.
A suite of chemical speciation analysis was conducted on the collected sample filters (Table 1). Specifically, the 47 mm Teflon filters were used to determine the PM2.5 mass concentrations by gravimetric analysis and the trace element concentrations by energy-dispersive X-ray fluorescence spectrometry (XRF). The Nylon filters from 2008–2010 and the quartz filters from 2011–2017 were used to quantify the concentrations of major ions (, , Cl−, , Na+, K+, Ca2+, and Mg2+) by ion chromatography (IC). OC and EC were measured by a thermal–optical transmittance (TOT) method. Concentrations of saccharides were analyzed by high-performance anion-exchange chromatography coupled with pulsed amperometric detection (HPAEC-PAD) (Kuang et al., 2015). Non-polar organic compounds, including alkanes, polycyclic aromatic hydrocarbons, and hopanes, were quantified by a method coupling in-injection port thermal desorption gas chromatography with mass spectrometry (TD-GC/MS) (Ho and Yu, 2004; Ho et al., 2008).
Table 1PM2.5 and list of components targeted for trend analysis and their measurement methods.
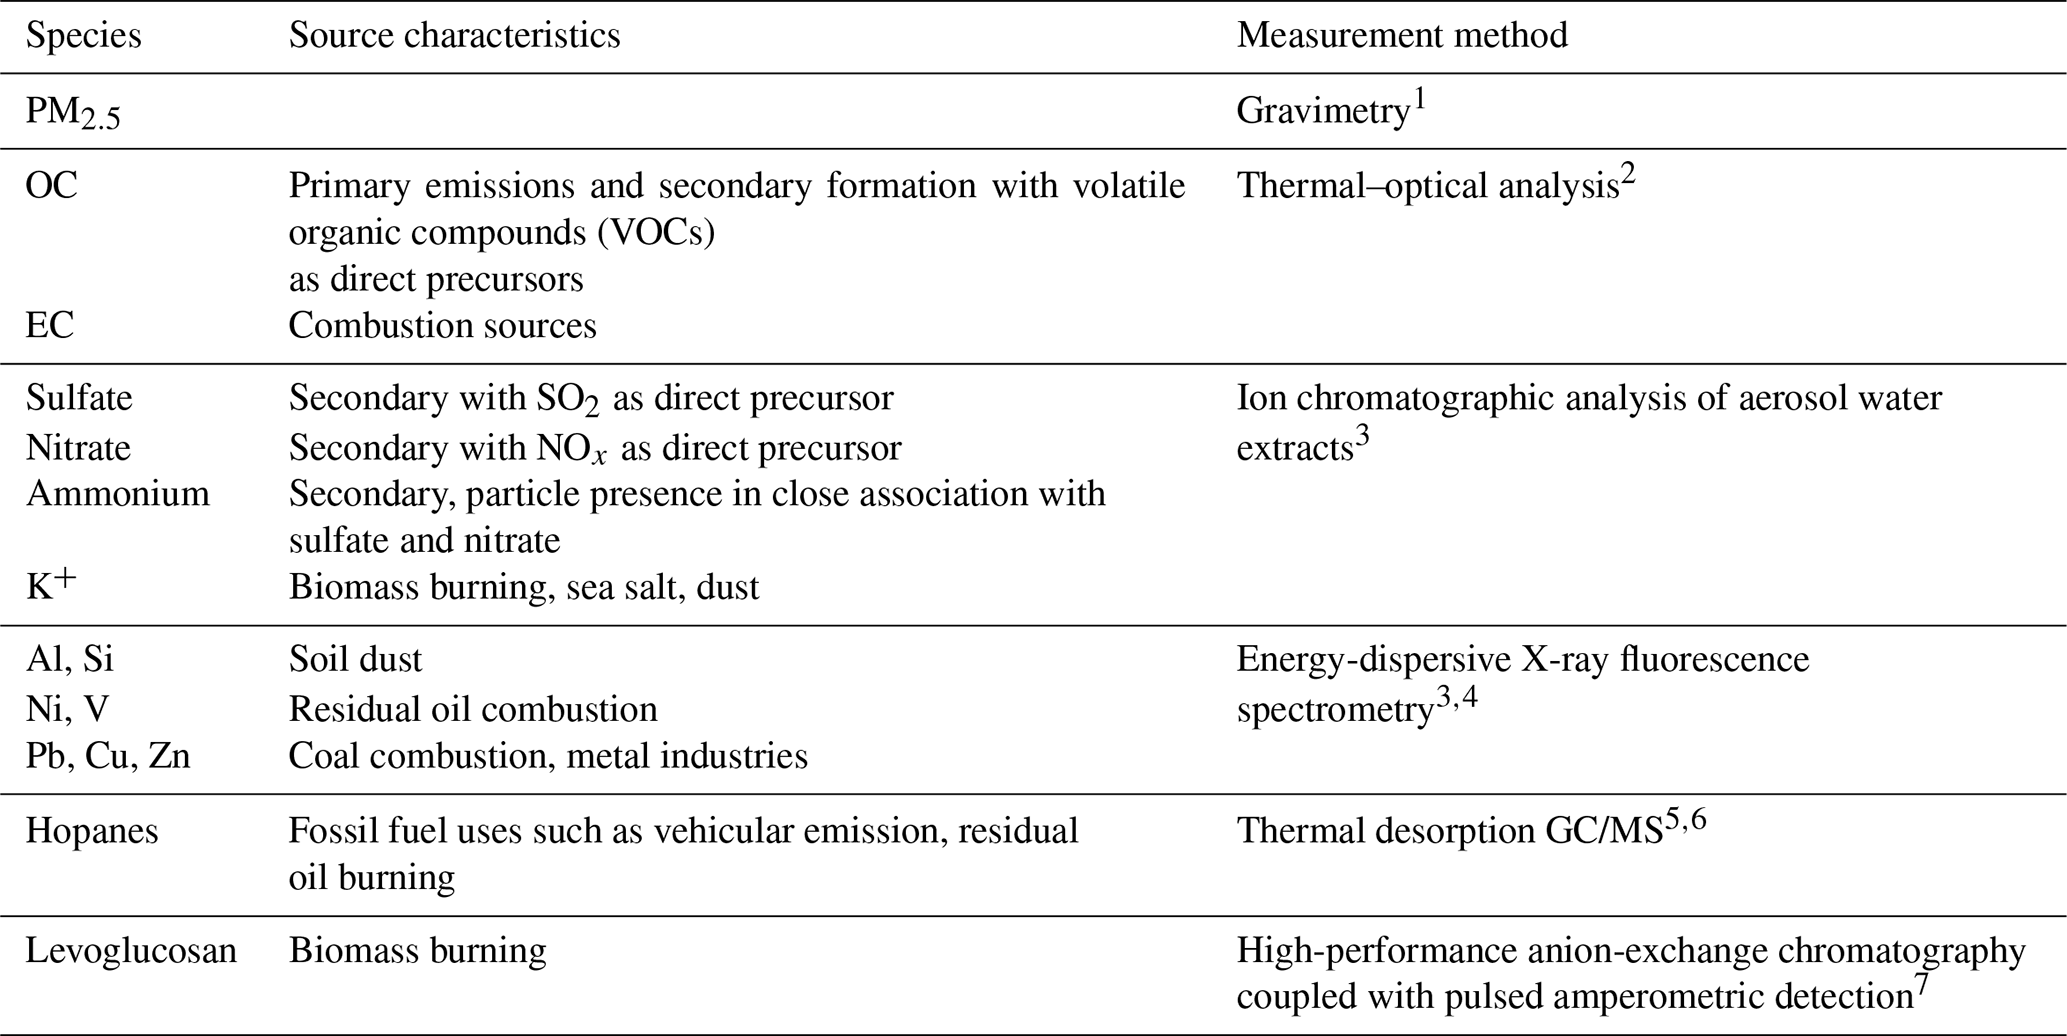
1 USEPA (2016). 2 Chow et al. (2007). 3 Huang et al. (2014). 4 Watson et al. (1999). 5 Ho and Yu (2004). 6 Ho et al. (2008). 7 Kuang et al. (2015).
Data validation on the PM2.5 speciation was carried out at three levels according to the publication “Guideline on Speciated Particulate Monitoring” prepared for the USEPA by Chow and Watson (1998). Level I validation mainly consists of flagging measurements that deviate from procedures through reviewing sampling log sheets and field quality check records and identifying invalid values. Level II validation checks the internal consistency among data from different analyses, involving the following: (1) comparing a sum of measured chemical species vs. PM2.5 mass concentrations, (2) comparing total sulfur by XRF vs. sulfate by IC, (3) comparing total potassium by XRF and soluble potassium by IC), (4) calculating anion/cation balances, and (5) examining time series data to identify and investigate outliers. Level III validation is part of the data interpretation process, mainly focusing on identification of unusual values through parallel consistency tests with other independent datasets.
Details of analytical procedures and data validation are documented in our previous studies (Huang et al., 2014; Chow et al., 2022) and in a series of project reports (Yu et al., 2012, 2013, 2014, 2015; Yu and Zhang, 2017, 2018; Chow et al., 2016), which are available at http://www.epd.gov.hk/epd/english/environmentinhk/air/studyrpts/pm25_study.html (last access: 3 February 2022). See Yu et al. (2022) for dataset access details.
2.2 Gaseous pollutant and meteorological parameter data
Criteria gaseous pollutant data (CO, SO2, O3, and NOx) and meteorological parameters at TW are from the network of air quality monitoring station operated by the HKEPD. The criteria gaseous pollutant data are available from the HKEPD Environmental Protection Interactive Centre (https://cd.epic.epd.gov.hk/EPICDI/air/download/, last access: 17 June 2021), while the meteorological parameters can be retrieved from the Atmospheric and Environmental database provided by the Environmental Central Facility from the Hong Kong University of Science and Technology (HKUST ENVF, http://envf.ust.hk/dataview/gts/current/, last access: 20 June 2021). The temporal variations of gaseous pollutants serve as additional data valuable for exploring the effects of changes in precursor gases on the secondary formed PM2.5 constituents (e.g., sulfate and/or nitrate). The decadal time series of temperature, relative humidity (RH), wind speed and direction, and precipitation at the site are summarized in Sect. S1 in the Supplement.
2.3 Seasonal and trend decomposition with the LOESS method (STL)
For the evaluation of the overall trend of time series independently of seasonal influence, the season and trend decomposition was adopted to decompose a time series (Yv) into three components: the trend component (Tv), the seasonal component (Sv), and the remainder (Rv) in an additive or a multiplicative manner, as per Eq. (1a) and (1b) (Cleveland et al., 1990).
The STL algorithm is performed via LOESS under two iterative loops. In comparison with other time series decomposition techniques, such as the simplest moving average (MA) method (Molugaram and Rao, 2017), the STL method has more flexibility in parameter tuning, as well as higher robustness to counterpart the influences from outliers. A detailed description about its algorithm is provided in Sect. S2 in the Supplement. The STL method has been readily implemented and widely tested in most programming languages such as R and Python. In this study, we utilized the STL function in the stlplus package in R for the following calculation.
Before applying the STL method, we manually inspected the data and removed data points exceeding the upper quartile by 3 times the interquartile range (i.e., ) to avoid the influence of extreme concentrations on the trend slope (Singh et al., 2021; Bigi and Ghermandi, 2014). The concentration data were found lognormally distributed in Q–Q plots as shown in Figs. S5 and S6 in the Supplement. Thus, log-transformation and monthly averaging were applied to create a normally distributed time series with even time intervals to cope with the assumptions of the STL model.
2.4 Generalized least squares–autoregressive moving average (GLS-ARMA) model
The trend curves from the STL method are often too irregular to be described verbally or quantitatively. This prompts us to seek a method that allows for calculation of an overall changing rate for the trend component for further analysis. When dealing with time series data with autocorrelation (i.e., the current value (Yv) depends on its lagged values (Yv−h)), generalized least squares (GLS), instead of ordinary least squares (OLS), is more suitable for the quantification of the changing rate of the time series. In GLS, the covariance matrix (and so the residuals) can be estimated by an autoregressive moving average (ARMA(p,q)) model. Specifically, the ARMA(p,q) model assumes that the current value (Xt) is influenced by its p-order of lagged values (Xt−h) and q-order of lagged residuals (εt−i) with the corresponding coefficients ϕh and θi as shown in Eq. (2).
The determination of p and q in an ARMA(p,q) model is achieved by minimizing model selection criteria such as Akaike's Information Criterion (AIC) and Bayesian Information Criterion (BIC). A model with a smaller AIC or BIC value is deemed more likely to generate the data that we obtain, while taking both probability likelihood and model simplicity into consideration. Despite the differences in assumptions, theoretically AIC and BIC give similar results in most cases (Shumway and Stoffer, 2017). In our study, we calculated AIC, AICc (a bias-corrected AIC), and BIC. As tabulated in Table S1 in the Supplement, these criteria indicators show no significant difference in terms of the parameter selection outcomes. Thus, hereafter only BIC values are reported when determining the slope of each GLS-ARMA model analysis. The details of the methodology of this hybrid STL–GLS-ARMA method are provided in Sect. S3 in the Supplement.
2.5 Comparison with other trend analysis methods
Additional trend analysis methods were explored to cross-validate the results from the GLS-ARMA method. First, Sen's slope method (Wilcox, 2017), a non-parametric method, was performed on the same dataset to calculate the changing rate. In Sen's slope method, we first run a Mann–Kendall test to see whether the overall trend of the annual averages is monotonic. Then the median of the slopes for all pairwise data points is computed and defined as Sen's slope. Second, an exponential trend estimation was computed using the compound annual growth rate (CAGR) for each pairwise combination of annually averaged values using Eq. (3).
where and are the annual averaged time series at time tn and t0, respectively. Like Sen's slope method, the overall trend of a species is represented by the median value of all the CAGR results. Testing the agreement between the linear and nonlinear approaches helps in validating the overall trend analysis results. Details of the CAGR results are provided in Sect. S7 in the Supplement.
3.1 PM2.5 composition
PM2.5 and its major components collected over the decade are displayed in time series of monthly averages in Fig. 2a and annual averages in Fig. 2b. The time series of individual samples are provided in Fig. S3 in the Supplement. Under influence of the monsoon winds, the four seasons in Hong Kong are well distinguished in their meteorological characteristics, with summer and winter being the two longest seasons and each lasting approximately 4 months. The four seasons are approximately spring from 16 March to 14 May, summer from 15 May to 15 September, fall from 16 September to 15 November, and winter from 16 November to 15 March (Chin, 1986). Under the influence of the Asian monsoon, the northerly prevailing winds carry dry and polluted northern continental air masses to Hong Kong in wintertime, whereas prevailing southerly and southeasterly monsoon winds in summertime bring largely clean marine air masses from the South China Sea or the northwestern Pacific Ocean. As a result, PM2.5 and other pollutants show distinct winter–summer contrast in their source origins and in concentration levels (Yu et al., 2004). In summer, local emissions have a dominant influence, while in winter, the regional/super-regional pollution significantly elevated air pollutant levels. We thus show separate time series for summer and winter seasonal average PM2.5 chemical composition in Fig. 2c and d, and a discussion of the source trend according to seasons of summer and winter provides a more direct understanding of source variations over the years. Spring and fall, being two short and transient seasons, display more variable and mixed influences from both local and regional/super-regional sources (Fig. S4 in the Supplement). Their time series are less useful for tracking decadal source variations and are therefore not discussed in this paper.
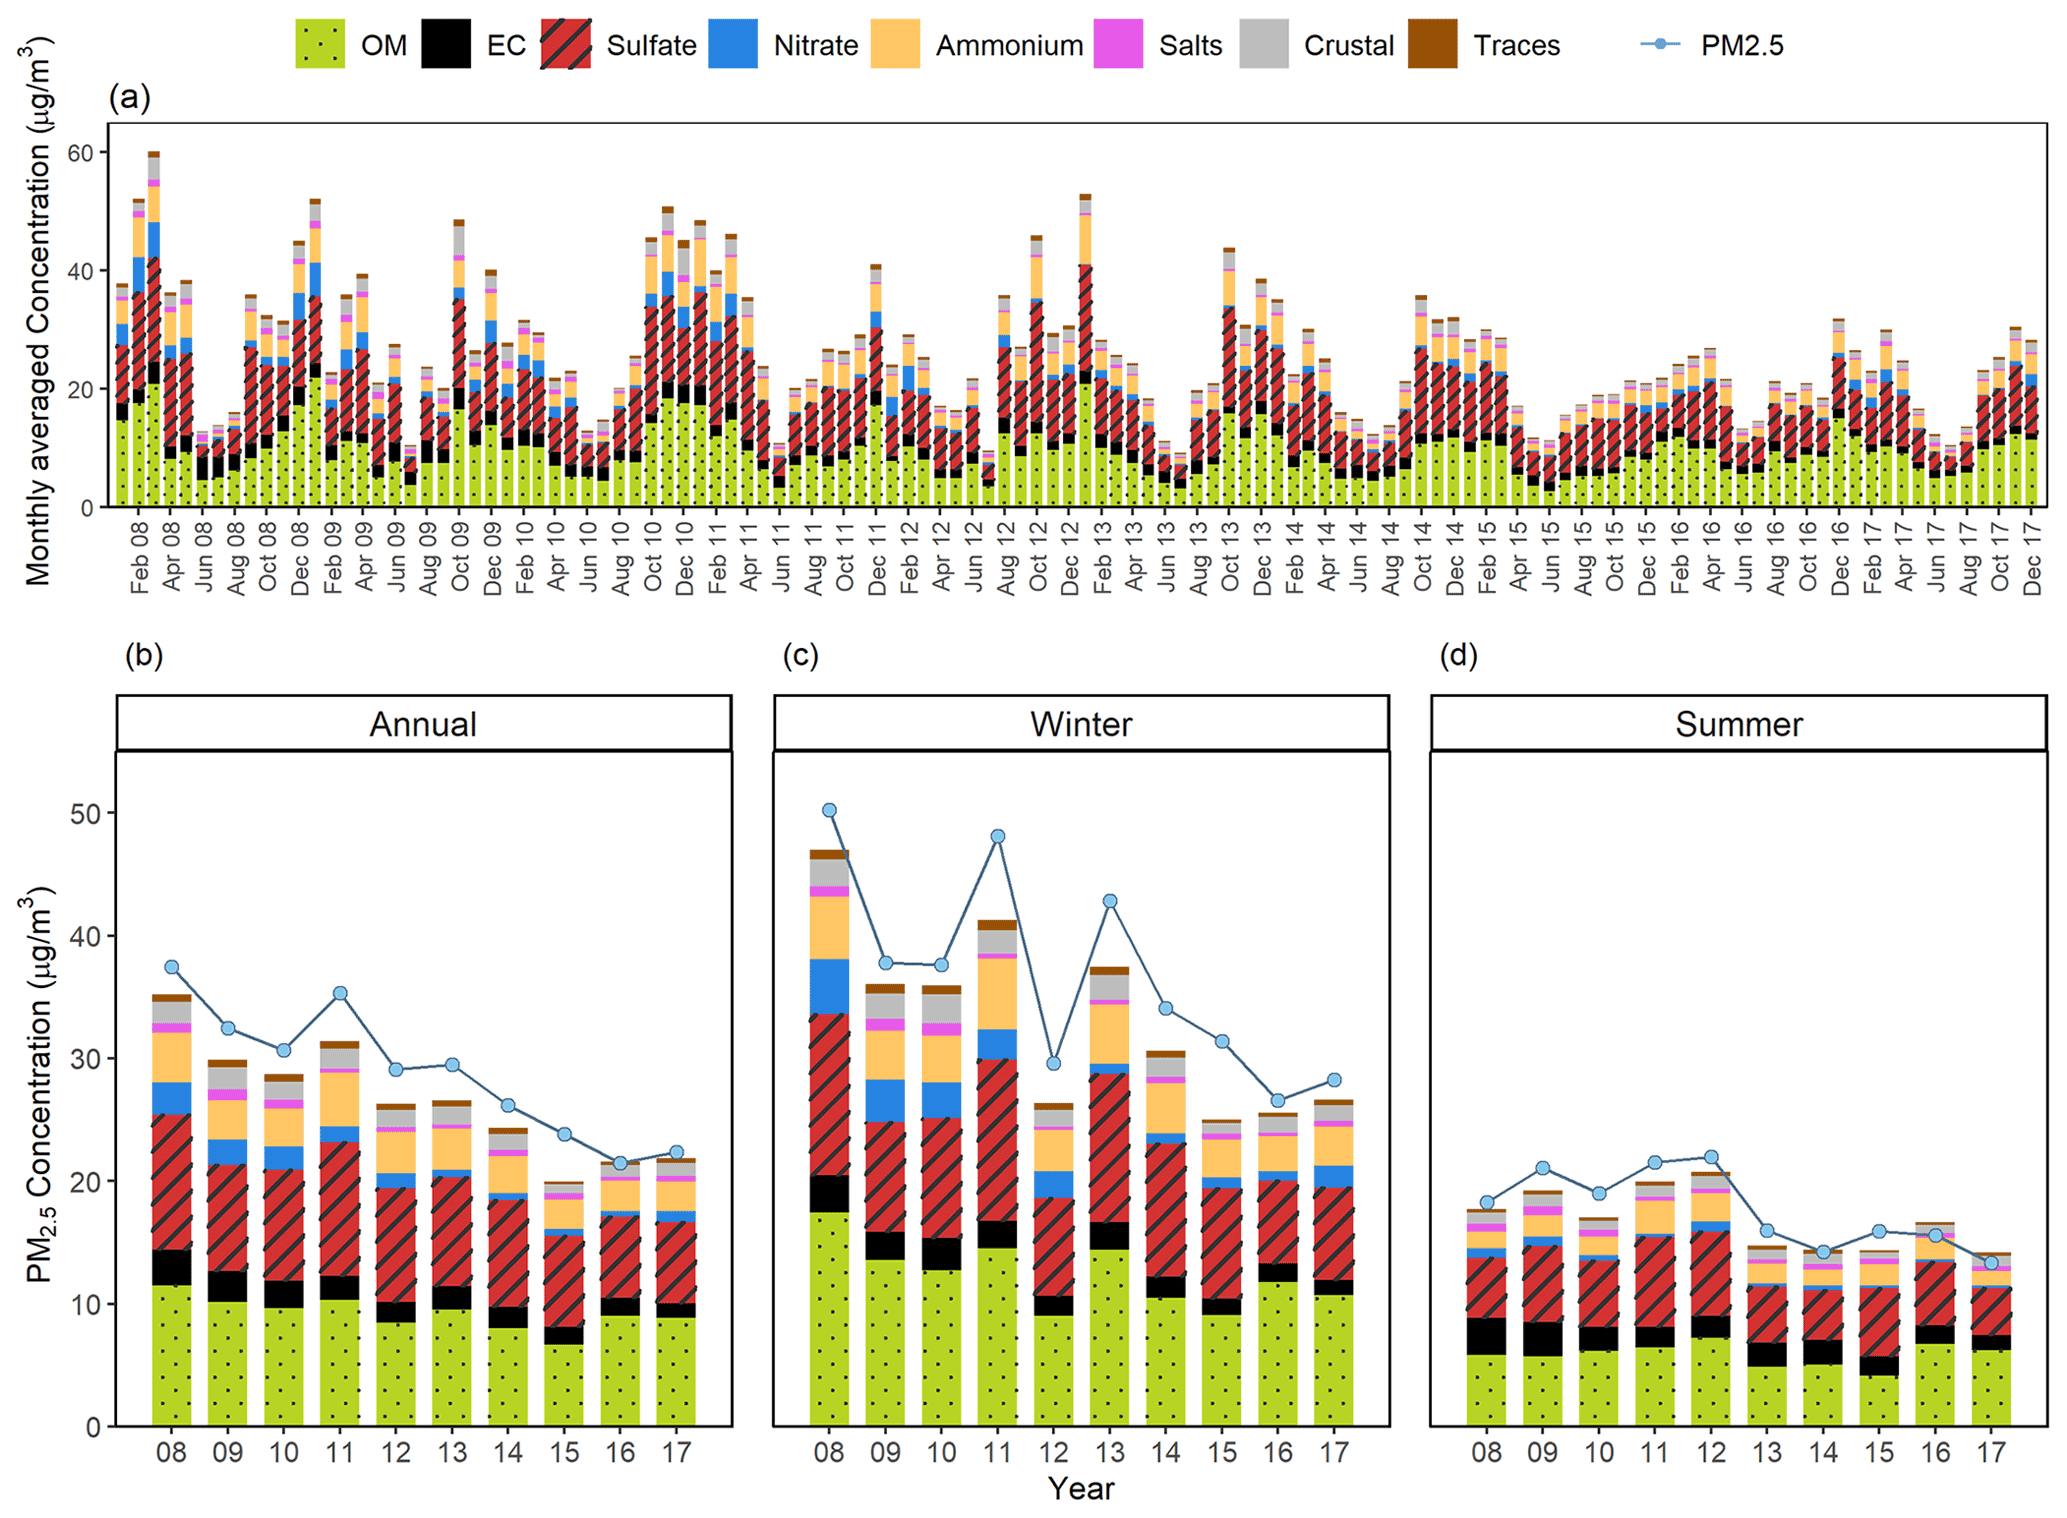
Figure 2Time series of PM2.5 chemical composition from 2008 to 2017 in the form of (a) monthly averages, (b) annual average, (c) winter seasonal averages, and (d) summer seasonal averages. In the legends, “Salts” includes Na+ and Cl−; “Crustal” represents crustal materials, computed to be ; and “Tracers” includes elements other than Na, Cl, S, K, Al, Si, Ca, and Fe. OM refers to organic matter and is computed as 1.4⋅OC.
As shown in Fig. 2, an overall decline trend is clearly seen in both bulk PM2.5 and its major components over the decade of 2008–2017. Sulfate and organic matter (OM) remain to be the top two dominant PM2.5 components throughout the decade and for both winter and summer seasons. Significant monthly variations are also evident, with highest concentrations in the winter months and the lowest in the summer months. The highest winter month average could be more than double the lowest summer average concentration in a same year, clearly indicating the significant contribution of regional/super-regional pollution to PM2.5 in Hong Kong. Comparing Fig. 2c and d, we see that the mass reductions in the summer season over the decade are much less in comparison with those seen for the winter; however, a continuous decline in EC is clear in the decade-long time series of the summer averages, indicating success in controlling local EC sources (i.e., vehicular emissions). A quantitative description of the 10-year trends for PM2.5, its major components and source tracers will be provided in the ensuing sections.
For a simple illustration of the 10-year change in PM2.5 chemical composition, the average chemical compositions in the starting and the ending year of the decade are compared in Fig. 3. On the annual average basis, the top four major components remain to be the same, i.e., OM, sulfate, ammonium, and nitrate, collectively accounting for a comparably ∼84 % of PM2.5 in 2008 and 2017, despite 10 years apart. Among the four top contributors, OM has gained a few percent, while nitrate has been reduced by a few percent in proportional importance. The 10-year compositional changes are more prominent in the seasonal averages. For winter PM2.5, the relative importance of OM increased (up from 35 % in 2008 % to 39 % in 2017), while the relative abundance of nitrate decreased (down from 9.1 % to 6.6 %), as well as EC (down from 6.1 % to 4.4 %). For summer PM2.5, the most significant compositional changes are also OM (up from 32 % to 44 %), EC (down from 17 % to 8.5 %), and nitrate (down from 4.3 % to 1.7 %). The proportional decrease of EC was most notable, reflecting the effectiveness of local vehicular emissions control measures. “Salt”, consisting of Na+ and Cl−, was a very minor part of PM2.5, accounting for less than 4 % in all years.
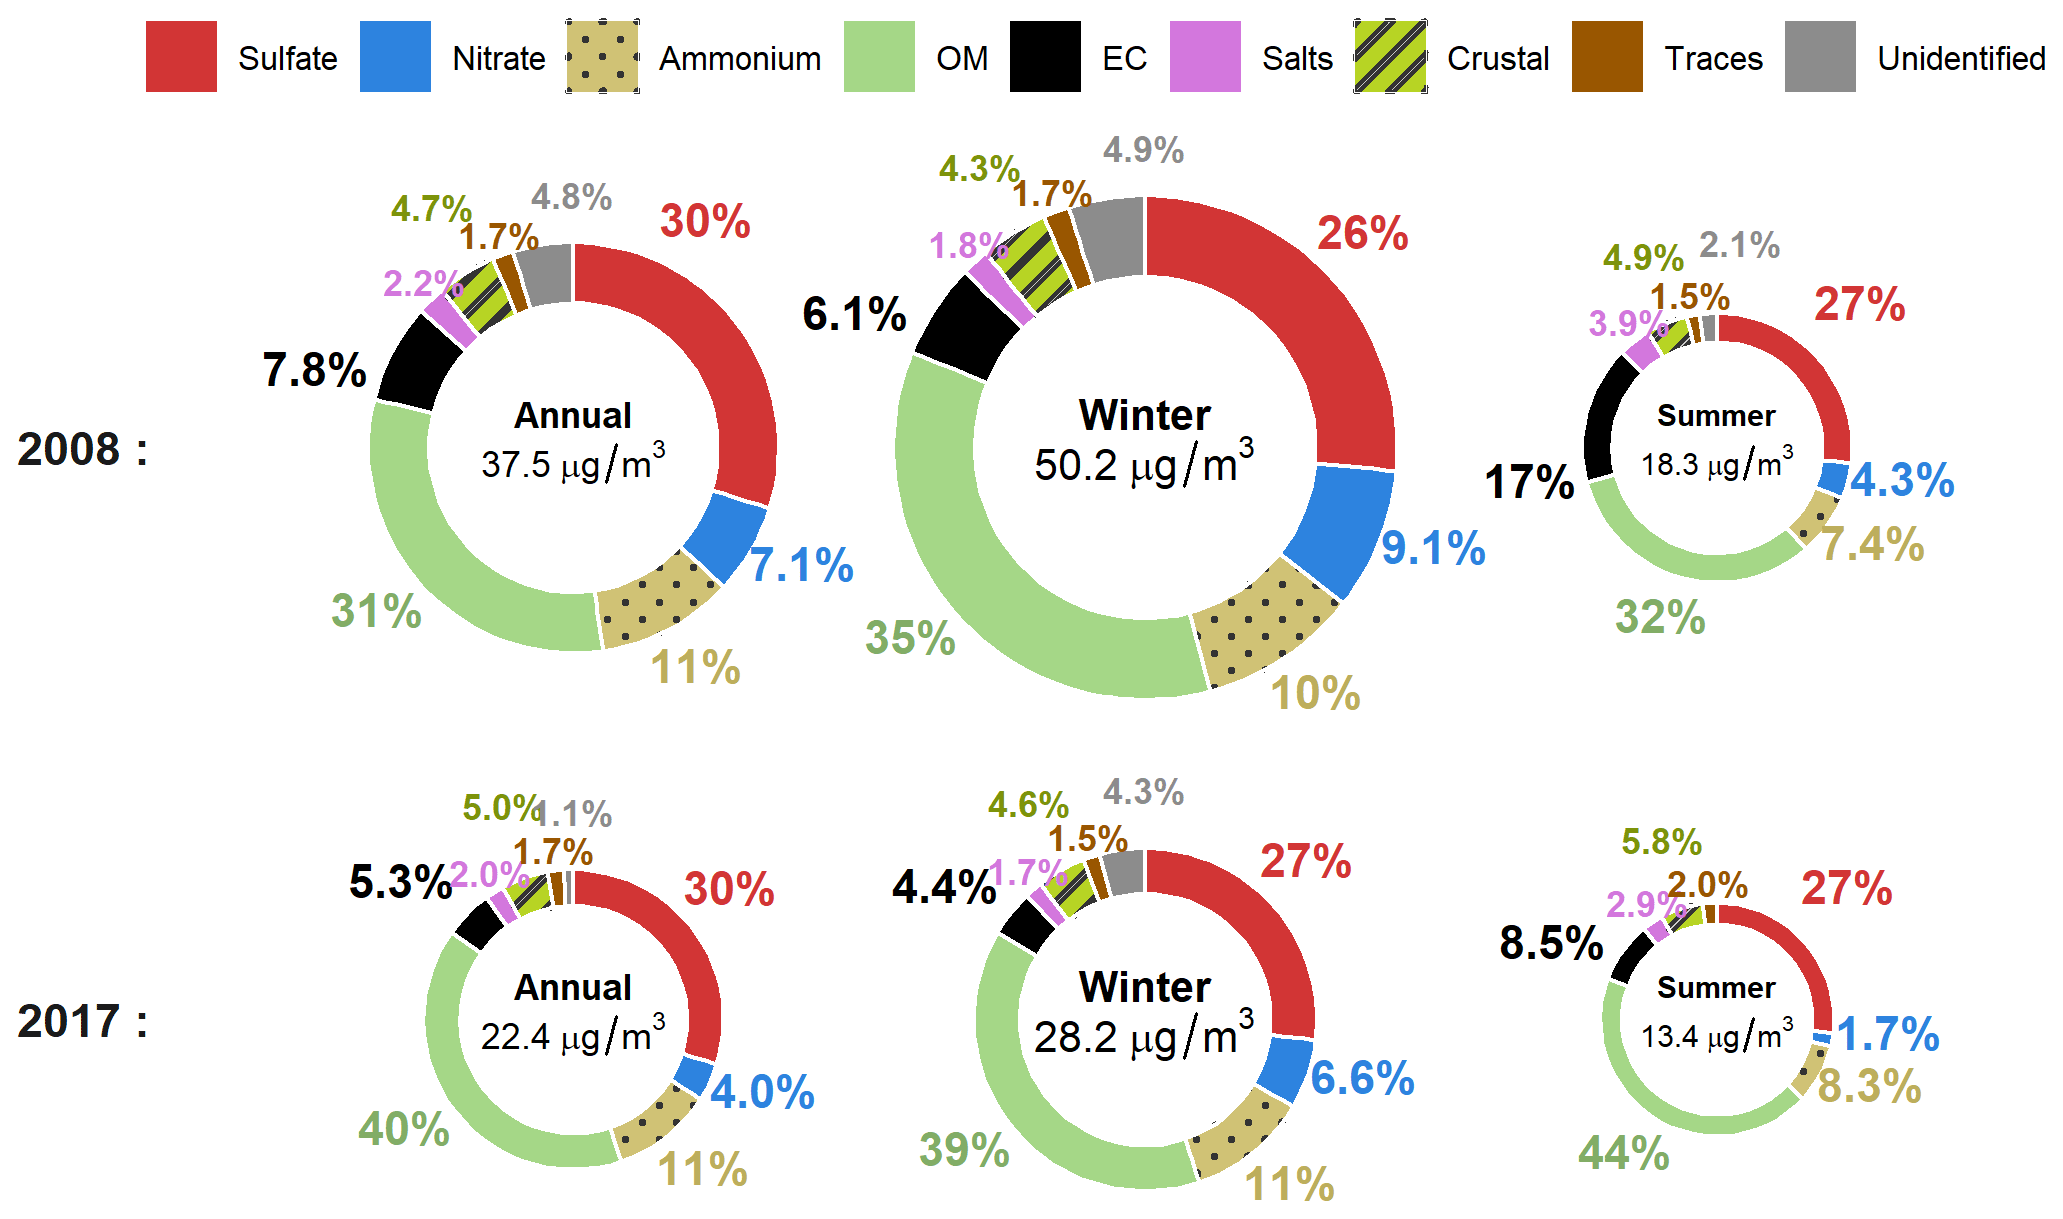
Figure 3Comparison of average PM2.5 compositions between the starting year (2008) and the ending year (2017) of the decade. In each year, three averages are shown, corresponding to annual, winter, and summer, and the donut size is proportional to the PM2.5 concentration.
3.2 Annual trend analysis
Previous studies that examined the annual trend of pollutants for evaluation of pollutants reduction in Hong Kong adopted a simple method of comparing annual average values (HKEPD, 2020; Zhang et al., 2018; Lu et al., 2013; Yuan et al., 2013). While this approach avoids the autocorrelation issue – the lag value of variables (Yt−h) influences the current value (Yt) in time series – it would suffer increased bias due to the sacrifice of the sample size for estimation. In comparison, STL is a more robust method for extracting trend components from concentration time series (Cleveland et al., 1990), with the autocorrelation issue accounted for by GLS-ARMA (Shumway and Stoffer, 2017). The STL–GLS-ARMA method has been adopted in a few studies analyzing air pollutant trends (e.g., Anttila and Tuovinen, 2010; Bigi and Ghermandi, 2014). It is found that STL–GLS-ARMA has the advantage of retaining more degrees of freedom on sample population and thus producing a more accurate estimate than the ordinary least-squares method.
We applied STL–GLS-ARMA to the monthly average concentrations of PM2.5 mass and individual species, including major components (, , , OC, and EC) and source-specific molecular or elemental tracers (i.e., K+, Al, Si, V, Ni, Pb, Zn, Cu, hopanes, and levoglucosan), as well as the routinely monitored criteria gaseous pollutants (CO, SO2, NOx, and O3) (Fig. 4). Table 2 summarizes the slopes obtained from the GLS-ARMA, Sen's slope method, and percentage change of each species over 2008–2017, together with the annual average concentration data in 2008 and 2017. The results from both the slope-determining methods were in good agreement for all the PM2.5 species. The GLS-ARMA trend slopes are significantly less than zero at a p level of <0.001 for all PM2.5 measurement parameters, except for V and levoglucosan, which are significant at a higher p level (0.01 and 0.05, respectively). For Sen's slopes, they are less than zero at a lower p level of 0.01 for most species and at p=0.05 for levoglucosan and are not significant at p>0.05 for V and hopanes. Such differences reflect the superiority of the GLS-ARMA method arising from retaining more degrees of freedom on the sample population. Thus, we will adopt the GLS-ARMA slopes in commenting the 10-year changing rate in later discussion.
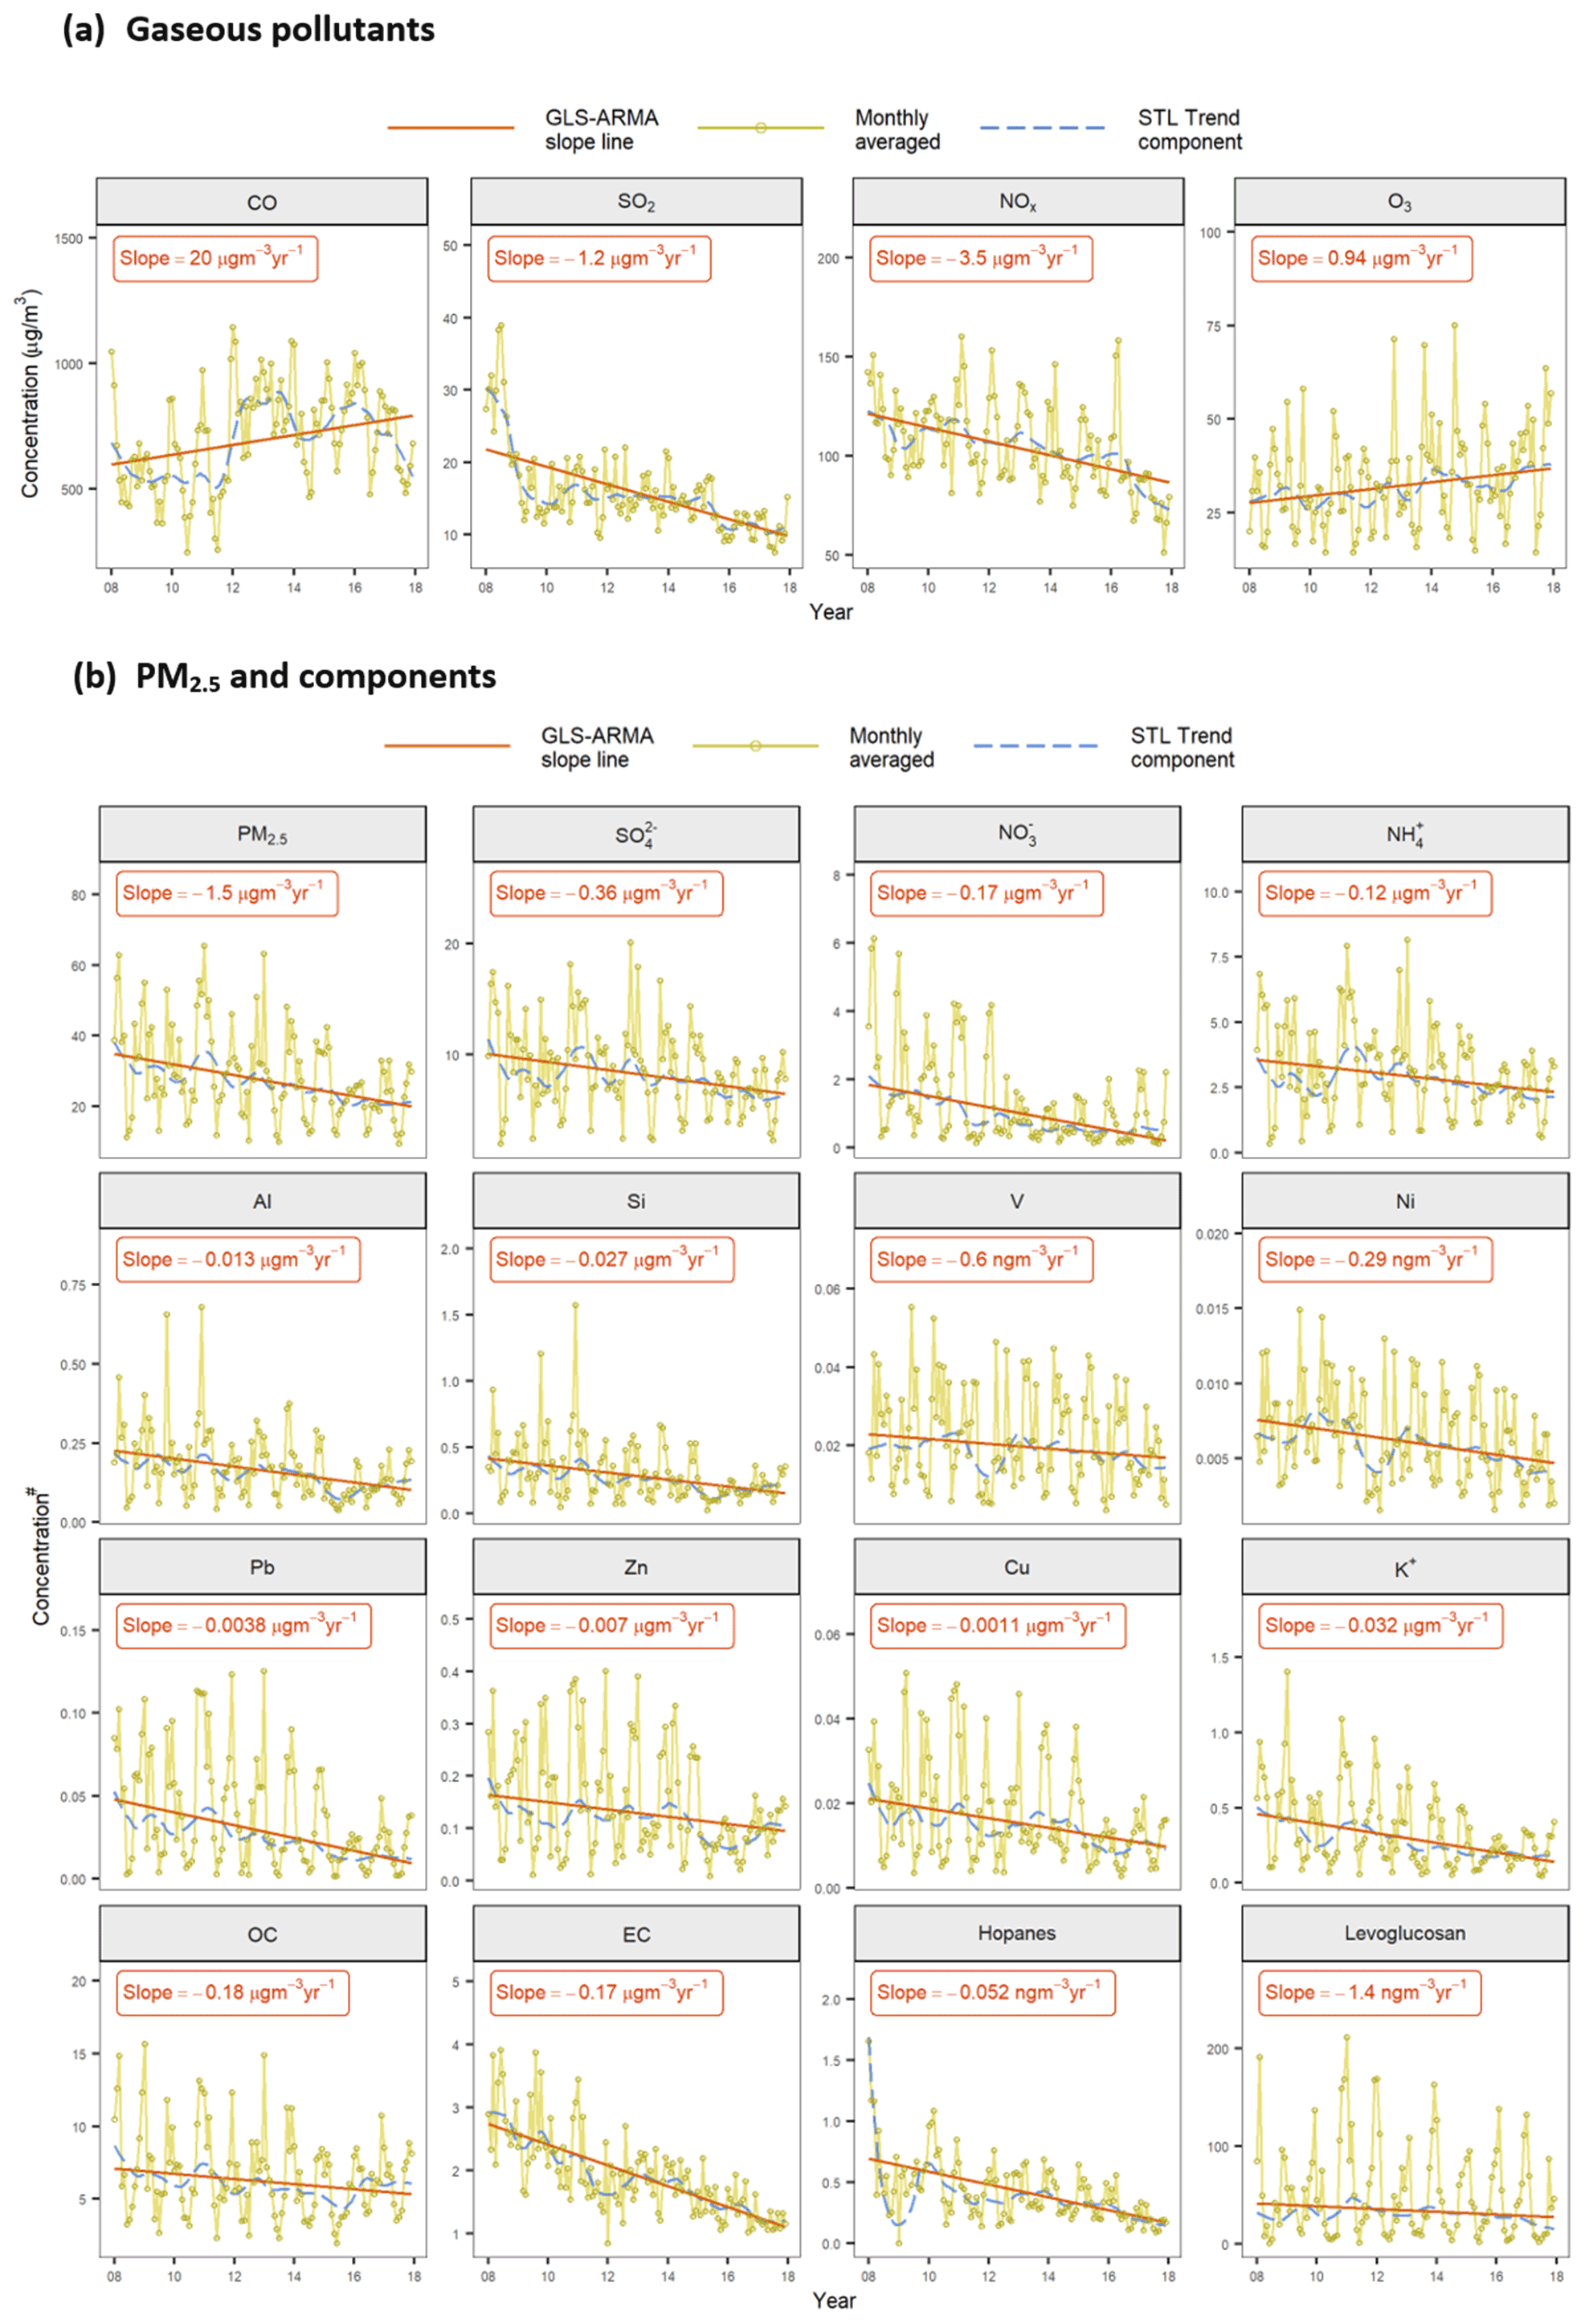
Figure 4(a) Gaseous and (b) PM2.5 pollutant data over 2008–2017: monthly concentrations (yellow), trend component (blue), and the slope line of trend determined by GLS-ARMA method (red). Note that the concentrations of hopanes and levoglucosan are in nanograms per cubic meter (ng m−3), while the others are in micrograms per cubic meter (µg m−3).
Table 2Summary of the decadal trend slopes and percent changes from 2008 to 2017 obtained with the GLS-ARMA analysis of the deseasonalized time series and with Sen's slope from annual averaged time series.
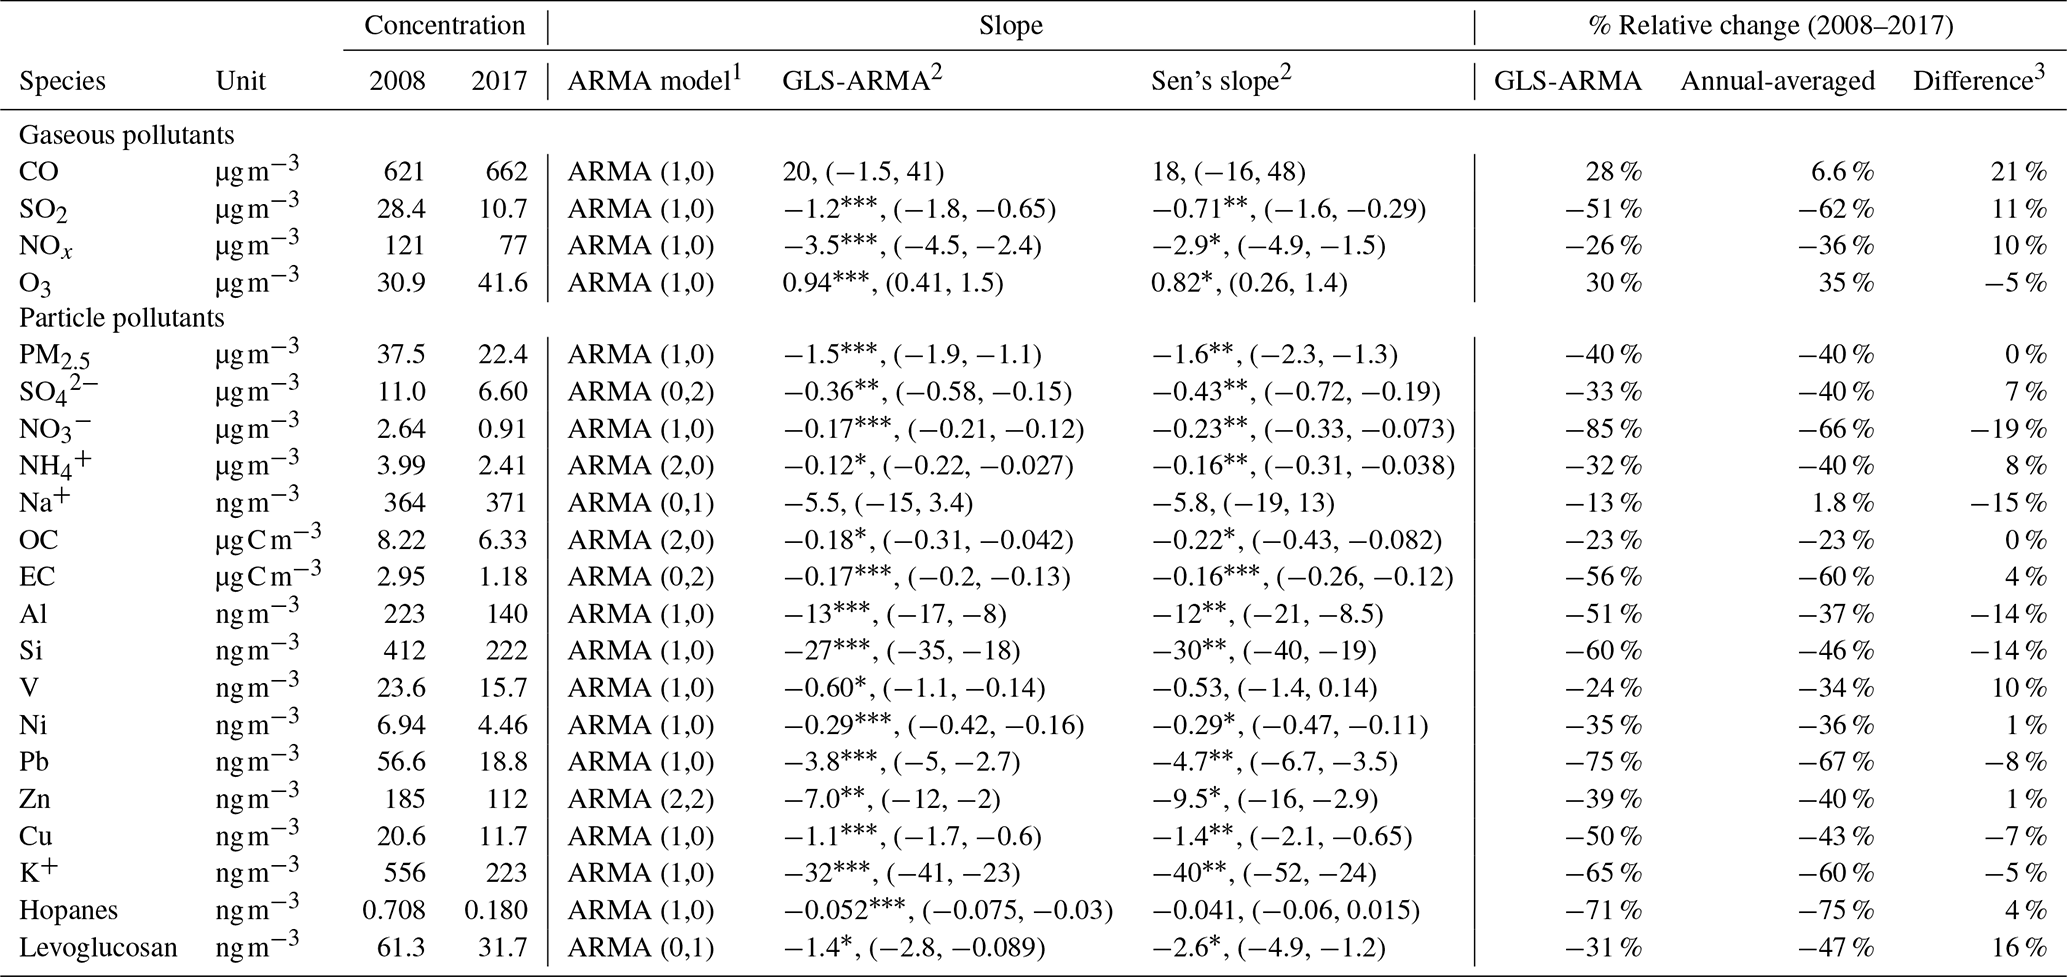
1 The optimal ARMA model parameters were selected by BIC. 2 Numbers in parentheses denote the 95 % confident interval for the slope value, while asterisks denote that the slope significantly differs from zero: ∗ p<0.05, p<0.01, p<0.001. 3 The difference between the two methods (GLS-ARMA − annual-averaged).
From the results of the STL–GLS-ARMA method, a declining rate of 1.5 was estimated for the PM2.5 mass. This decline was significantly attributed by the top two major components, namely sulfate accounting for 24 % (Slope: −0.36 ) and OM 17 % ( ), respectively. Ammonium, nitrate, and EC decreased in a similar rate in mass concentration unit (, , EC: −0.12, −0.17, −0.17 ); they accounted for a similar percentage at around 8.0 %–11 % each and a combined 31 % of the overall PM2.5 reduction. Meanwhile, other components such as biomass burning markers (K+ and levoglucosan), industrial and coal combustion tracers (Zn and Pb), and crustal materials (Al, Si, and Ca) altogether explain the remaining 28 % of PM2.5 depletion. Note that the tracer species only account for a minute amount of mass; however, they are indicative of other unmeasured PM2.5 components co-emitted with these sources.
The percentage changes during the decade are calculated using the annual average in 2008 and 2017 and are listed in Table 2. With the GLS-ARMA model fitted data, we can also calculate the percentage changes. Comparing the two approaches, the GLS-ARMA method yields higher percentage drops in K+, , Al, Si, Pb, and Cu than those calculated using annually averaged data. This could be explained by the different concentration levels fitted by the GLS-ARMA model. The underestimated concentration in 2017 by GLS-ARMA results from the flattened variation in the later years (Fig. 4), hence the higher percentage changes in these species. This problem was less obvious for species with smoother declines such as SO2, NOx, OC, EC, V, Ni, and hopanes. Therefore, the differences in percentage change between the two methods helped on identifying the different changing characteristics along the time series.
The annual percent change rates computed using CAGR, summarized in Fig. S13 and Table S5 in the Supplement, show a good agreement with those from the linear approaches (i.e., GLS-ARMA and Sen's slope). In general, the exponential approach of the CAGR method estimates a larger decline than the GLS-ARMA method. The maximum difference occurs with (−10 %). The relative constant concentration levels in the later years were particularly observed in , which would imply a faster reduction in an exponential variation model and thus result in a larger discrepancy. The absolute differences for all the other species are less than 5 %. For simplicity, we confine the trend discussion to results from the linear approaches.
The 10-year percentage change in PM2.5 is −40 %. Sulfate and ammonium, with nearly identical decrease trajectories due to their close chemical linkage, have percentage drops that closely match the drop of bulk PM2.5 (Fig. 1b and Table 2). Other major components, however, differ in their percentage reductions from the reduction of bulk PM2.5, with the reduction in nitrate (−66 %) and EC (−60 %) exceeding that of bulk PM2.5, while OC (−23 %) falls below that of bulk PM2.5. Such results reveal the effectiveness of control measures in lowering EC and sulfate and the increasing importance of OC in addressing PM2.5 pollution in the coming years.
3.3 Trend analysis of winter and summer data
As discussed in Sect. 3.1, PM2.5 levels and dominant sources are distinctly different in winter and summer. The two seasons merit separate analysis of their 10-year trends. This is further supported by correlation and hierarchical clustering analysis of year-by-year data, the results of which are shown in Fig. 5 using 2008 and 2017 as examples. Figure 5 reveals that the measurement variables segregate into two clusters marked in black and pink linkage lines, respectively, and they broadly correspond to one group of pollutants known to be significantly influenced by regional/super-regional sources (e.g., OC, sulfate, nitrate, , K+, Pb, Zn, and Cu) and a second group of species with dominant contributions from local sources (i.e., NOx, EC, hopanes, Ni, and V). The regional sources have strong seasonality under the influence of the monsoon winds. It is of interest to note that SO2 shifted from the local cluster to the regional cluster over the decade, reflecting the changing relative importance of local vs. regional emission sources of SO2 over the years (see Sect. S3 for more details).
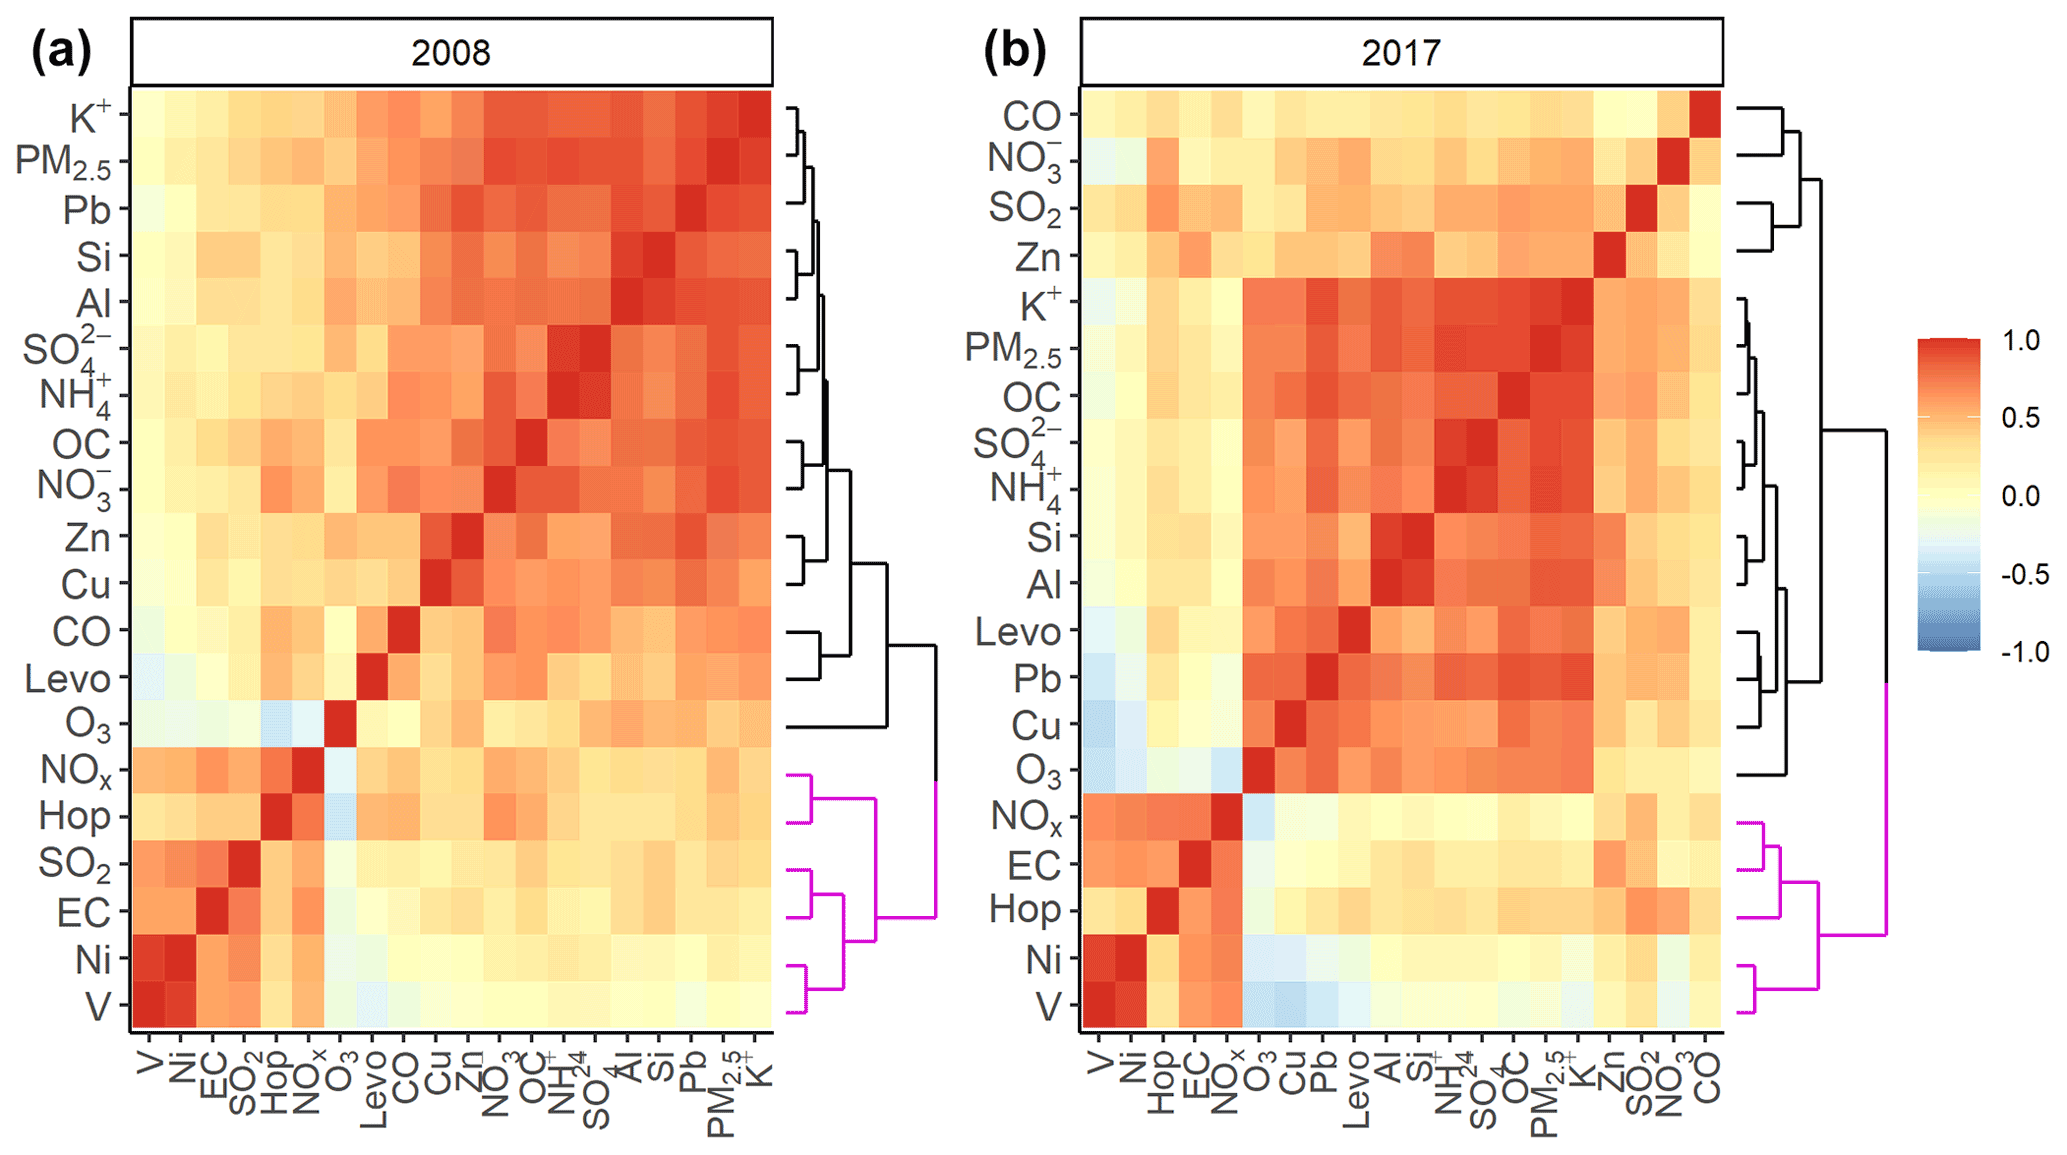
Figure 5Correlation matrix of gaseous and particulate pollutants with hierarchical clustering results at 2008 (a) and at 2017 (b). Clusters: pink – local sources; black – regional sources.
Figure 6 shows the 10-year variations of the seasonal average concentrations of PM2.5 and selected components for winter and summer. Season-specific values for Sen's slopes are listed in Table 3, expressed in both mass concentration change rate per year and percent change rate per year. The latter unit allows for a direct comparison of relative source strength changes of local and regional sources by removing the impact of meteorological factors (e.g., boundary layer height) on ambient concentrations. Seen in Table 3, Sen's slope for bulk PM2.5 is significantly different seasonally, at −2.0 in winter vs. −0.67 in summer, while the percentage decline rates are comparable, at −3.9 % yr−1 in winter and −3.7 % yr−1 in summer. In alignment with the species segregation revealed in Fig. 5, the group of regional species shows significantly larger decrease rates in mass concentration in winter than in summer, but the group of local species (EC, V, and Ni) displays a comparable value for Sen's slope in both seasons. It is worth noting that summer OC does not show a discernable increase or decrease trend over the decade, but winter OC shows a decreasing trend with a slope of −0.45 (Fig. 6). Such a stark contrast indicates a significant seasonal difference in OC sources and their underlying driving factors. This also implies that measures to lower the OC contribution in PM2.5 must consider the strong seasonality of its sources.
Table 3Summary of the seasonal variation estimated by Sen's slope.

1 Asterisks in the table denote that the slope significantly differs from zero: ∗ p<0.05, p<0.01, p<0.001. 2 Sen's slopes in these two columns are obtained on normalized concentrations against those in 2008, thus providing percentage change rates relative to 2008, with the unit of percentage per year (% yr−1). 3 Sen's slope for wintertime OC is significant at a p level of 0.11.

Figure 6The 10-year variations of seasonal average concentrations of PM2.5 and selected components for the winter (blue) and summer (orange) from 2008 to 2017. Red lines indicate Sen's slope, and dashed blue lines indicate the 95 % confidence intervals.
Considering the diverged seasonality among major components and source tracers, we individually examine in the subsequent sections the trend characteristics of the major PM2.5 constituents and important sources that have effective tracer data.
3.4 Secondary inorganic aerosol components
The three secondary inorganic aerosol components, namely sulfate, nitrate, and ammonium, are constantly prominent components of the PM2.5 and make up 43 %–47 % of PM2.5 mass over the decade. Their ambient abundances exhibit a strong seasonality, with the winter concentrations more than double the summer concentrations. Seasonally, the wintertime levels changed by −0.50, −0.38, and −0.16 in mass concentration change rate and at −3.8 %, −8.4 %, and −3.2 % yr−1 in percentage change rate for sulfate, nitrate, and ammonium, respectively. The summertime level changed by −0.17, −0.05, and −0.02 in mass concentration change rate and at −3.5 %, −6.3 %, and −1.4 % yr−1 in percentage change rate for sulfate, nitrate, and ammonium, respectively (Table 3). They are significant drivers of PM2.5 decline.
While the direct precursor for sulfate is SO2, the reduction of SO2 does not necessarily translate to proportional reduction in sulfate, as various oxidants (e.g., hydroxyl radical, hydrogen peroxide, and ozone) participate in the oxidation formation of sulfate from SO2, and the role of each oxidant is highly dynamic in both temporal and spatial scale (e.g., Xue et al., 2019). Nevertheless, it is informative to compare the changing rates of SO2 and sulfate. As a criteria gaseous pollutant, SO2 has been extensively studied, and its emission inventories for Hong Kong and Guangdong province are available (HKEPD, 2021b; Li et al., 2017; Zheng et al., 2018). The SO2 emission inventory data for our study decade are shown in Sect. S3. The top two sources for SO2 emissions in Hong Kong are power plants and marine vessels, while the major SO2 sources in Guangdong are power plants and industries (Fig. S8 in the Supplement). The emission and ambient concentration trends of SO2, normalized to 2018, are examined in Fig. S8c, showing that the yearly variation of ambient SO2 concentrations at TW was similar to the total SO2 emission trend from Hong Kong and SO2 emission from power plants in Guangdong. Overall, the changes in ambient SO2 concentrations at TW during the 10-year period are consistent with the SO2 emissions estimated for the GBA.
Over the decade, sulfate dropped by 40 % in annual average concentration, lagging behind the 62 % drop recorded for SO2 (Table 2). A close examination of the 10-year time series of monthly concentrations of SO2 and sulfate side by side (Fig. 7) shows temporally uneven reduction. The steepest drop in ambient SO2 occurred in 2008–2009 (from 28.4 to 15.6 µg m−3, a reduction of 45 %), corresponding to the significant SO2 emission resulting from the mandated switch to ultra-low S (<0.005 wt %) for all commercial and industrial processes in 2008 (Fig. S9 in the Supplement). During the same period, sulfate dropped by 22 % from 11.0 µg m−3 in 2008 to 8.6 µg m−3 in 2009. Between 2009–2014, both ambient SO2 and sulfate dropped by the same small percent (∼4 %) and varied in a narrow range of 14.6–16.2 µg m−3 for SO2 and 8.66–9.03 µg m−3 for sulfate. Between 2015–2017, the introduction of SO2 reduction measures targeting power plants and shipping industry (Fig. S9) led to a decrease of SO2 by 22 % (from 13.8 to 10.7 µg m−3), while sulfate only dropped by 11 % (from 7.45 to 6.60 µg m−3) (Fig. 7). Evidently, the discrepant changing rates of ambient SO2 and sulfate confirm that sulfate reduction is generally not proportional to local SO2 reduction because of nonlinear formation chemistry of sulfate and a significant contribution to sulfate from regional transport (Chen et al., 2021; Chow et al., 2022).
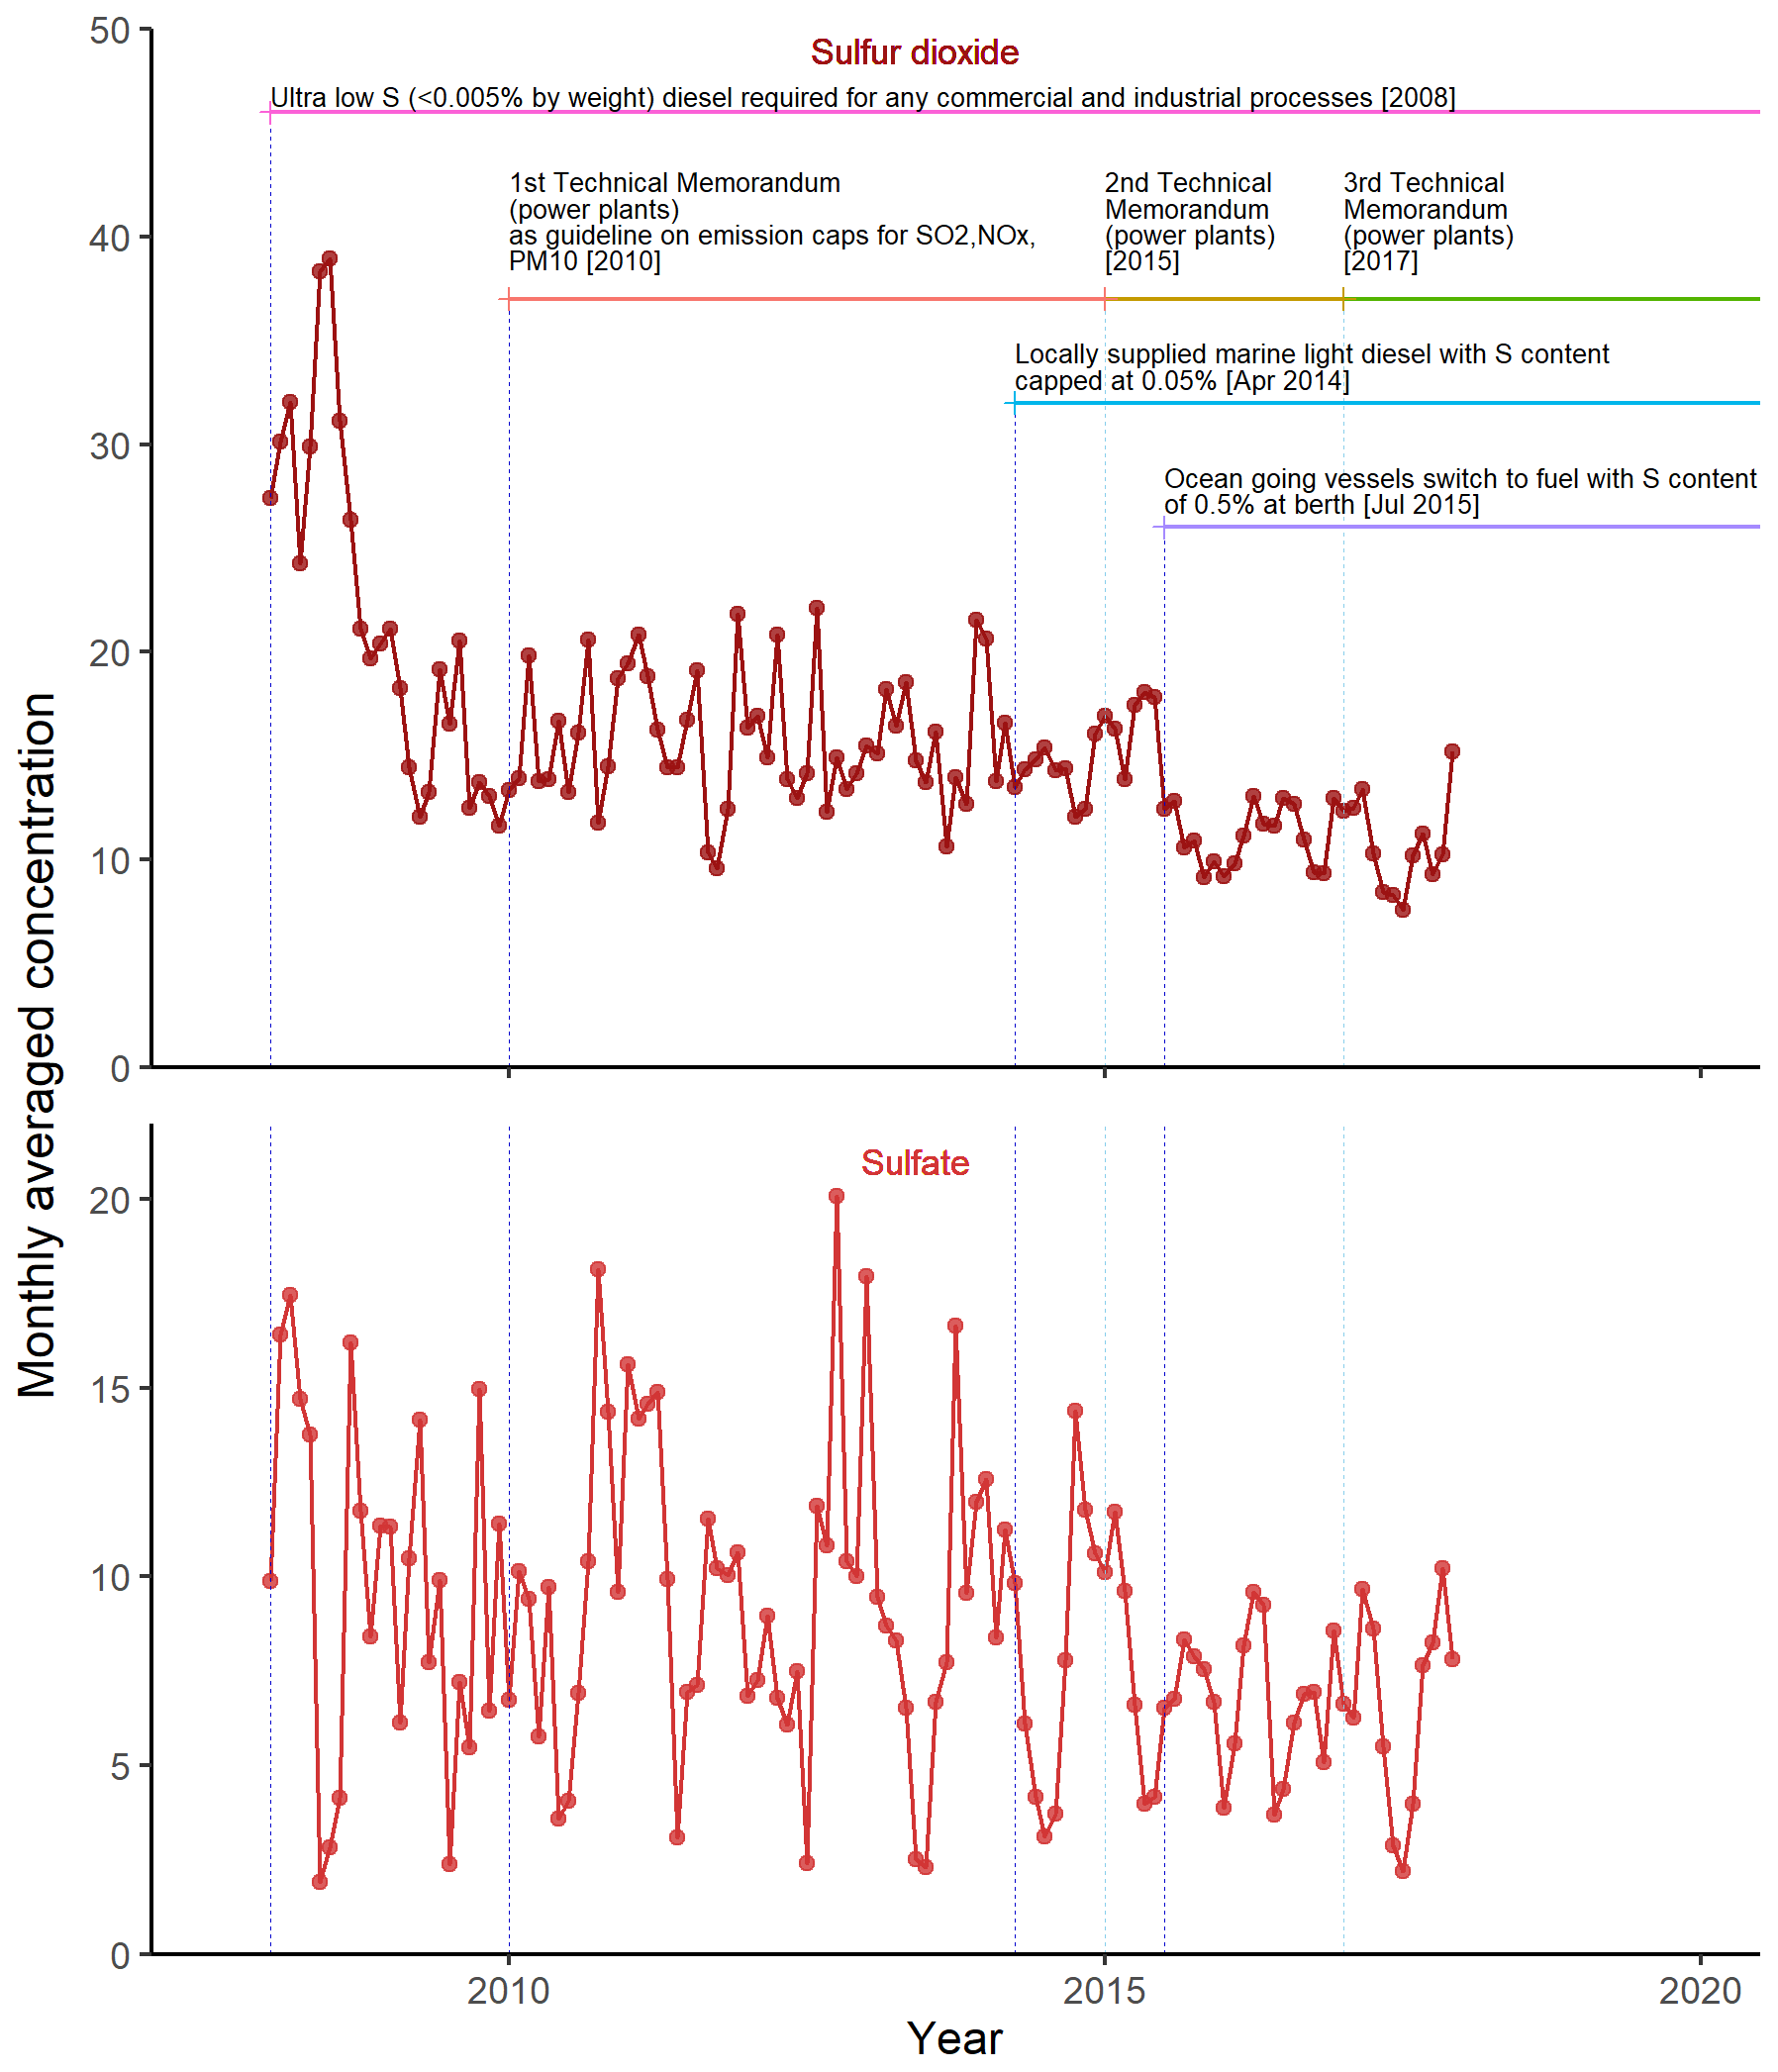
Figure 7The 10-year variation of monthly SO2 and sulfate concentration. The significant SO2 emission control measures implemented in Hong Kong are indicated in the top plot. The unit of concentration is micrograms per cubic meter (µg m−3).
The very origin of PM2.5 , i.e., reaction of ammonia with sulfate aerosol, dictates its close association with sulfate. This relationship is expectedly confirmed in the excellent correlation of with sulfate in all the years (Fig. 5). As NH3 is generally abundantly supplied, the variation of closely tracks that of sulfate, as confirmed in our dataset.
It is well established that PM2.5 nitrate is a secondarily formed product from NOx oxidation (e.g., Griffith et al., 2015). Like the formation of sulfate, the involvement of multiple oxidants (e.g., hydroxy radical, O3) creates significant complexity so that a proportional relationship is not expected between variations of NOx and nitrate (Xue et al., 2014b). Additionally, atmospheric physical conditions, such as temperature and RH, also strongly influence the partitioning of nitrate between gas and particle phase. Comparing the reduction rates of NOx and nitrate, we note that over the decade nitrate dropped by 66 %, higher than the reduction rate of 36 % for NOx (Table 2). While the deviation from proportionality reflects the nonlinear formation chemistry of nitrate, the higher reduction rate in nitrate is seemingly counterintuitive. Unlike sulfate, which predominantly exists in the particle phase, nitrate could be either present as nitric acid in the gas phase or as ammonium nitrate partitioning between gas–particle phases. Additionally, nitrate could significantly partition to coarse particles (PM2.5−10) (Xue et al., 2014a). Thus, PM2.5 nitrate, mainly existing in the form of ammonium nitrate, only represents a fraction of the total nitrate. This provides possibility for a higher PM2.5 nitrate reduction rate than its precursor NOx. Zhang et al. (2018) examined the PM10 chemical speciation data in Hong Kong that spans 18 years (1998–2015) and found nitrate in PM10 increased from 2002 to 2011 then decreased afterwards. Such an observation indirectly indicates that the significant presence of nitrate in coarse PM could lead to divergent trends of nitrate in PM10 and PM2.5. A more detailed consideration with the aid of modeling would be needed in order to reveal the variation extent of total nitrate and the distribution of different nitrate forms. Such an exploration requires efforts going beyond the current project, and it is therefore not pursued.
3.5 Components dominated by local emissions – vehicular and shipping emissions
It has been recognized that on-road vehicles and marine vessels are two major local emission sources for ambient PM2.5 in Hong Kong (Guo et al., 2009; Li et al., 2012; Cheng et al., 2015; Chow et al., 2022). A steadily decreasing trend was observed in the concentration levels of typical vehicular emission tracers: EC and hopanes. Over the 10-year period, annual average EC and hopanes decreased by 60 % and 75 % in mass concentration and at a rate of −0.17 and −0.052 , respectively. These significant reductions indicate the effectiveness of an array of control measures that have been implemented by the government since 2008 (Fig. 8). Most notably, they include (1) replacing pre-Euro IV diesel commercial vehicles with higher Euro standards vehicles since 2007, (2) implementing the Statutory Ban against idling of motor vehicle engines in 2011, and (3) the imposition of the emission control for petrol and LPG vehicles in 2014. It is worth noting that the vehicular traffic local to the sampling site has increased by ∼20 % over the decade if we use the traffic flow count through Shing Mun Tunnel, a tunnel less than 5 km away from the site, as an indicator (Fig. S2 in the Supplement). Despite the increase of vehicles on the road, the decrease of ambient EC and hopanes is unambiguous, which serves as strong evidence for the effectiveness of vehicular emission controls. On a separate yet relevant note, Wang et al. (2018) sampled and compared both gaseous and particulate pollutants from fresh vehicular emissions in the Shing Mun Tunnel in 2003 and 2015 and found that OM and EC decreased by −70 % and −80 % from 2003 to 2015, respectively. This adds more measurement-based evidence for the overall decrease in PM2.5 burden from local vehicular emissions.
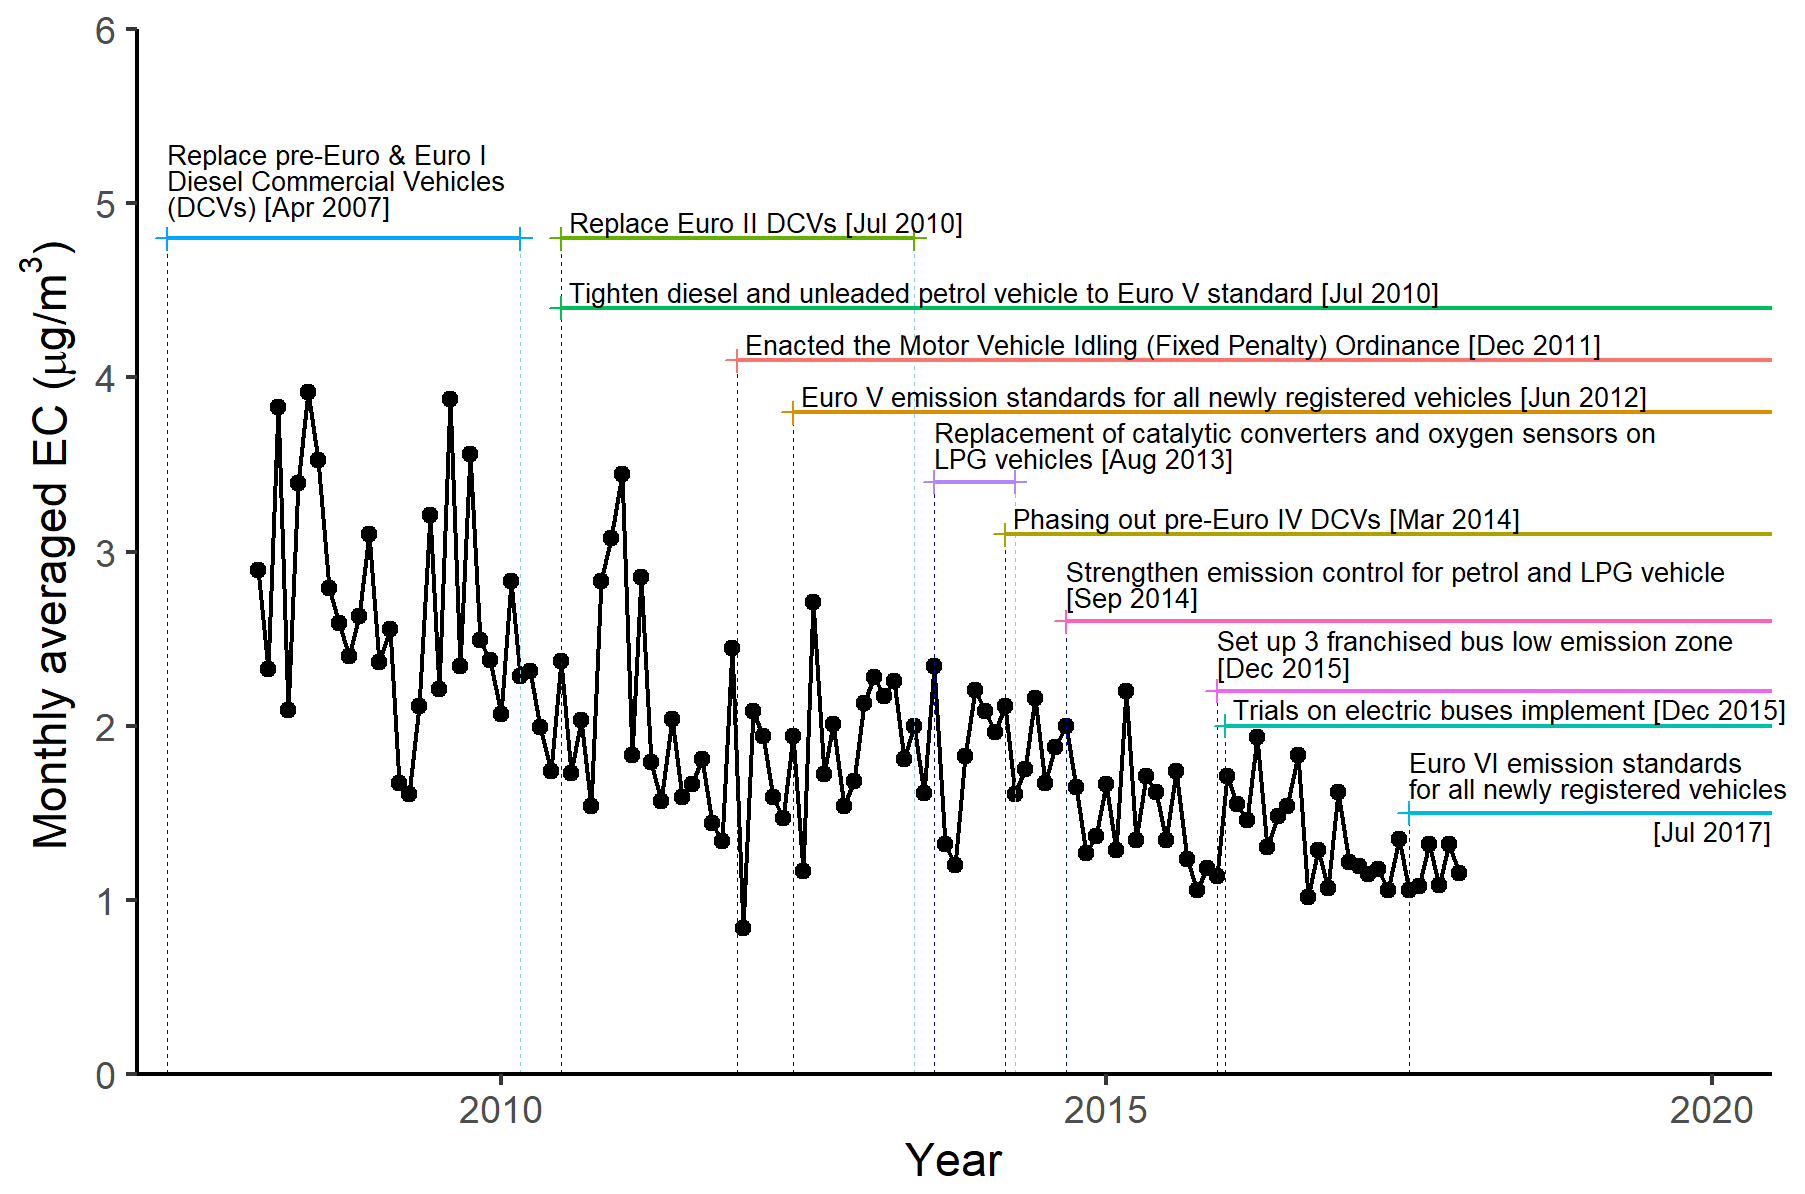
Figure 8The 10-year variation of monthly EC concentration. The significant vehicular emission control measures implemented in Hong Kong are indicated in the plot.
The concentration levels of shipping emission tracers (V and Ni) were reduced by 34 % and 36 % by mass concentration and at a rate of −0.60 and −0.29 (Table 2), respectively. The percent reduction of V and Ni is less than that of vehicular emission tracers because their decreasing trends were not obvious until 2015 (Sect. S5 in the Supplement) when shipping emission control policy was first introduced in Hong Kong to reduce SO2 emission (HKEPD, 2021a).
3.6 Species significantly influenced by regional emission sources – biomass burning, industrial/coal combustion, and dust sources
Biomass burning, industrial/coal combustion, and dust are well-recognized regional sources that influence PM pollution in Hong Kong (e.g., Zhang et al., 2018; Chow et al., 2022). Our source apportionment study of PM2.5 at six sites in Hong Kong in 2015 shows that combined industrial and coal combustion accounted for 12 %–20 %, biomass burning 2 %–13 %, and dust 4 %–8 % of PM2.5 (Chow et al., 2022). The marker chemicals for these sources are among the chemical composition data monitored, allowing us to track the long-term trend of these sources.
Levoglucosan, an abundant primary product formed during pyrolysis of cellulose, is a highly specific tracer of biomass burning emissions (Simoneit et al., 1999). K+ is also abundantly emitted from biomass burning, especially crop residue burning. In studies without levoglucosan data, K+ is frequently used as a biomass burning tracer. However, K+ is a less specific tracer, due to contributions from other sources such as coal combustion, dust, and sea salt (e.g., Yu et al., 2018; Chow et al., 2022). The clustering analysis results show K+ and levoglucosan were moderately correlated and fell into two different clusters in the same group of regional origin (Fig. 5). Comparing the 10-year variations of these two tracers, we found that their reduction extents differed significantly, with K+ at −60 % and levoglucosan at −47 % over the decade. When examined seasonally (Fig. 6 and Table 3), they showed more distinct differences. Specifically, wintertime K+ showed a definitive decline trend at a rate of −7.5 % yr−1 (p<0.01), while the decline of wintertime levoglucosan (−3.9 % yr−1) could not be discerned from zero according to the statistical test at p<0.05 (Table 3). The lack of a clear declining trend of wintertime levoglucosan could be visually verified in Fig. 6. Further, both summertime K+ and levoglucosan did not show a clear decreasing trend either (Fig. 6 or Table 3). The inconsistency between K+ and levoglucosan could be explained if one considers that they track different types of biomass burning. Specifically, K+ is a better marker for emissions from burning crop residues, which are typically enriched in K+, while levoglucosan, a thermal pyrolysis product of cellulose, is commonly found in burning of all types of vegetative biomass including hill fires. The inconsistent trends between winter and summer could also be rationalized considering their different source regions, i.e., the PRD region and northern China during the winter vs. South Asia in the summertime. Overall, the chemical tracer data indicate crop residue burning has been reduced over the decade, perhaps indicating some success in measures such as prohibiting crop burning and crop straw utilization recently implemented in China (Ren et al., 2019). The lack of a consistent declining trend in levoglucosan, on the other hand, implies that biomass burning remains largely uncontrolled and will continue to be a significant PM pollution source. We also acknowledge that the 10-year trend in an organic tracer like levoglucosan could be affected by long-term change in atmospheric oxidation capacity, which would exert its impact through atmospheric degradation kinetics.
The three metal species, Pb, Zn and Cu, have been consistently detected in the PM2.5 samples over the decade, providing opportunities to probe their associated sources. The three display a strong seasonal contrast, with wintertime concentration levels more than twice those in the summer for Cu and Zn and 5 times for Pb. The strong seasonality is a characteristic indication for their regional/super-regional origin, consistent with the cluster analysis results (Fig. 5).
Cu and Zn are associated with metal processing industries. Over the decade, the Zn level in the winter has been dropping steadily, at a rate of −6.6 % yr−1, while the wintertime Cu dropped at a rate of −5.8 % yr−1. On the other hand, their summertime change rates were indiscernible from zero (Fig. 6 and Table 3). Cumulatively, from 2008 to 2017, approximately 40 % reduction was realized for these two metals (Table 2). The significant reductions were likely indicators of benefits from industrial upgrading following the promulgation and implementation of the Guangdong “double transfer” policy (industry and labor transfer away from primary industries) since 2009 (Zhong et al., 2013; Yang and Zhu, 2017).
Pb is likely dominated by coal combustion. This source deduction is derived from data collected from a different project, in which we deployed an online XRF spectrometer to monitor hourly concentrations of As, Se, and Pb in Hong Kong from August 2019 to February 2021. The data show strong correlations of Pb with As and Se (R>0.80) (Fig. S7 in the Supplement), two well-known tracers for coal combustion (Tian et al., 2010), providing compelling supporting evidence for coal combustion as a dominant source for Pb. Over the decade, wintertime Pb has displayed a continuous dropping trend at a rate of −7.7 % yr−1, implying effectiveness in reducing coal combustion emissions in the PRD region and in northern China. It is also worth noting that in the last 3 years (2015–2017) of the study decade, the reduction of the three metals stalled, suggesting that more stringent actions are needed for further reduction in the upcoming years.
Al and Si are classical marker elements for dust particles. They have also decreased over the decade, by −37 % for Al and −46 % for Si. The two elements are highly correlated (R: 0.54 in 2015 and 0.87–0.97 in the other years), reflecting their common material sources and spatial origins. They display a distinct seasonality common to the regional sources; i.e., wintertime abundance is notably higher than the summertime. The decreasing rates for wintertime concentrations (−5.3 % yr−1 for Al and −7.0 % yr−1 for Si) are more significant than the summertime in terms of both mass concentration and percentage change (Table 3). The decline became flat in 2016–2017 (Sect. S5), indicating that the current policies started to be less sufficient in reducing the dust contribution.
3.7 El Niño–Southern Oscillation events
A closer examination reveals that in the overall monotonic trend component (blue dotted line in Fig. 4) of most PM species (PM2.5, , , etc.), 2011 is an anomaly year showing higher concentrations than the preceding and the succeeding years. This resemblance in patterns across the various PM2.5 components implies that a macro-factor, for example, sporadic meteorological El Niño/La Niña events, might be at play in influencing the temporal variation.
El Niño–Southern Oscillation (ENSO) events randomly occur during the irregular changes of oceanic temperature among the tropical Pacific Ocean, with El Niño events associated with increase in ocean temperature and La Niña events associated with decrease in ocean temperature. During the events, atmospheric pressure above the Pacific Ocean changes and thus causes the shift of the Walker circulation as well as the distortion of pollutant airflow towards Hong Kong (Yim et al., 2019). The El Niño effect typically leads to a rise in rainfall, less northerly/northeasterly winds, and higher wind speed in Hong Kong (Wang et al., 2019; Yim et al., 2019), thus enhancing the dispersion of regional pollutants. The La Niña effect is associated with opposite changes in rainfall and wind, thus impeding the dispersion of air pollutants. Over the decade, there were two El Niño and three La Niña events that lasted for at least 2 months. The strength of ENSO can be classified by the Niño 3.4 index based on the averaged sea surface temperature (SST) anomalies in the Pacific Ocean region. This classification scheme results in five broad groups (Table S6 in the Supplement), that is, neutral (0–0.49), weak (0.5–0.99), moderate (1–1.49), strong (1.5–1.99), and very strong (≥2) (the numbers in the parentheses indicate the SST anomaly). The rainfall, wind direction, and wind speed at TW under each level of ENSO events were compared with those on the normal days (i.e., neutral event) and are summarized in Figs. 9 and S14 in the Supplement. The rainfall during all El Niño events was close to that during neutral conditions in Hong Kong, but there was a notable reduction of rainfall during strong La Niña events. In terms of wind conditions, more westerly air masses (wind direction >180∘) were transported during very strong El Niño and moderate to strong La Niña events, while the elevated wind speed generally occurred during weak to moderate El Niño events.
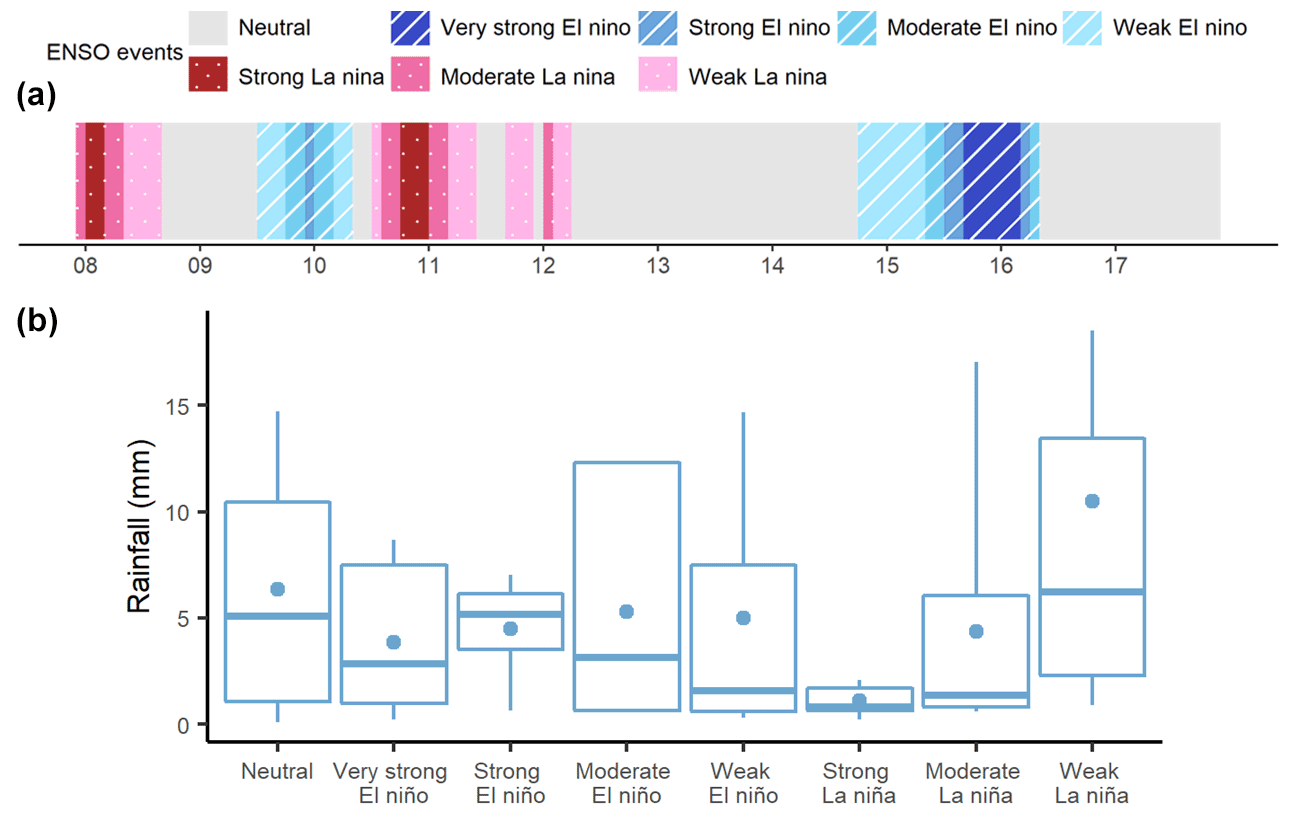
Figure 9The temporal variation in strength of ENSO events in the 2008–2017 period (a) and the changes of rainfall (b) under different strength levels of ENSO events.
The changes in meteorological conditions were hard to be visualized and quantified. To better investigate the effect of ENSO in Hong Kong, a multiple linear regression (MLR) was established between the observed concentrations and a list of meteorological variables including temperature (Temp), RH, seasonal components, and ENSO events, as shown in Eq. (4). For simplicity, the definitions of seasons here are based on calendar months, with spring corresponding to March–April, summer to May–August, fall to September–October, and winter to November–February.
where Xm is the monthly averaged time series, β's are the coefficients of parametric variables (i.e., Year, Temperature, RH), and δ's are the coefficients of two dummy variables (i.e., season and ENSO event).
This MLR equation explains additional variance by the ENSO variables (0.63 %–11.7 %) without any multicollinearity issue (i.e., generalized variance inflation factor <5). The prediction from this model is reasonable, producing a slope of ∼0.8 and R values of 0.58–0.86. Briefly, the coefficients for the year (β1's) capture the decline of species and approximately match the GLS-ARMA results. Seasonal variations were successfully reflected by the coefficients for season (δ1's), temperature (β2), or RH (β3) (Table S7 in the Supplement). For example, positive summer coefficients in VNi indicate higher in summer, negative spring coefficients in levoglucosan indicate higher in winter, and negative temperature coefficients in hopanes indicate stronger gas-particle partition or degradation (Table S7).
The random ENSO events impose different impacts on gaseous and particle pollutants. Significant enhancement of SO2 and NOx (i.e., p value of ) was found to be owing to the La Niña effect, while no changes were observed for O3 (Fig. S15 in the Supplement). Conversely, significant and positive coefficients of the strong La Niña effect were obtained for all PM2.5 pollutants except V and Ni. The coefficient was particularly high and positive for some (, , , OC, and levoglucosan, δ2, strong La Niña from 1.6 to 61) but less for some regional source species (Pb, Cu, δ2, strong La Niña from 0.0089 to 0.029) (Fig. S15). In other words, the concentration of these species was typically high under strong La Niña events in comparison with neutral days. This could be explained by the significantly suppressed rainfall during the strong La Niña event (Fig. 9), where the highly water-soluble ions and levoglucosan were removed to a lesser extent via wet deposition and thus maintained higher concentrations than the normal days. Regardless of the significant level of coefficients, the El Niño effects are generally opposite to the La Niña effect, implying that the enhancement of pollution dispersion/deposition could happen during El Niño events (Table S7).
In this study, we analyzed the 10-year (2008–2017) time series of PM2.5, its major components, and selected source markers in an urban site in Hong Kong by the STL–GLS-ARMA method. The dataset was obtained by following a regular 1-in-6 d sampling schedule that ensures temporal representativeness and adheres to well-established chemical speciation analysis protocols adopted by the USEPA. In addition, organic molecule marker compounds (i.e., levoglucosan and hopanes) were also measured for this 10-year sample set. Such a long time series of PM2.5 chemical composition data derived using a consistent sampling and analysis methodology is rare in China and elsewhere in Asia, thus providing uniquely valuable data to support studies of control measure evaluation and formulation for the region and offering a useful reference for other provinces in China in evaluating emission control policies.
All PM2.5 components were found reduced, with the overall PM2.5 mass dropping at −1.5 and by a cumulative rate of 40 % (from 37.5 to 22.4 µg m−3). The individual contributors to the PM2.5 reduction are sulfate (−0.36 ), OM (−0.25 ), nitrate and EC (each at −0.17 ), ammonium (−0.12 ), and others (−0.39 ). A disproportional reduction was noted between the precursor gases SO2 (−62 %) and NOx (−36 %) and their secondary products (−40 %) and (−66 %) because of the complexity in their formation chemistry and formation process spatial scale not confined locally to Hong Kong. A steadily declining trend in EC and hopanes was recorded, achieving a cumulative decrease of 60 % and 75 %, respectively, in their ambient concentrations. These reductions verify the effectiveness of a series of control measures to reduce vehicular emissions by the Hong Kong government. In comparison, the reduction of OC was more modest, at 23 %, which reflects the many more contributing sources as well as important secondary formation contribution to OC.
Two biomass burning tracers, K+ and levoglucosan, displayed strong seasonality in both ambient abundance and 10-year variation trend, the PRD and northern China being the source region in the wintertime and South Asia being the source region in the summertime. Wintertime K+ showed a definitive decline trend at a rate of −7.5 % yr−1 and a cumulative −60 % reduction, while the decline of wintertime levoglucosan was hardly discernable from zero. In the summertime, neither K+ nor levoglucosan showed a clear decreasing trend. The two tracers track different types of biomass burning, with K+ more representative of crop residue burning and levoglucosan tracking the burning of cellulose. Collectively, the biomass burning tracers indicate that crop straw burning has been reduced over the decade but that biomass burning remains a largely uncontrolled regional/super-regional PM2.5 source for Hong Kong.
The 10-year data of Zn, Cu, and Pb showed a cumulative reduction of −40 %, −43 %, and −67 %, respectively. All three metals had strong seasonality, with winter concentrations much higher than the summertime, the metal processing industries/coal combustion from the GBA region and northern China being the source regions. Their significant reductions in wintertime (−6.6 %, −5.8 %, and −7.7 % yr−1 for Zn, Cu, and Pb, respectively) suggested benefits from measures such as industrial upgrading and coal combustion emission reduction that were implemented over the decade. The reduction for all three metals in the last 3 years (2015–2017) had stalled, signaling new measures are needed for their further reduction. Dust in Hong Kong's PM2.5 mainly comes from a regional contribution. The dust components in PM2.5 decreased, by −37 % for Al and −46 % for Si, over the decade, indicating success in controlling dust generation activities in the region.
Finally, the long time series reveals that 2011 is an anomaly year in that most PM2.5 components were elevated above the adjacent years. By establishing a multiple linear regression model, we show that the heightened strong La Niña events in 2011 resulted in unusually low rainfall, which in turn reduced the removal via wet deposition of aerosol constituents. In conclusion, the long-term chemical speciation data of PM2.5 starting as early as 2008 in Hong Kong, one of the important cities in the Great Bay Area, could be useful for a multitude of purposes related to understanding decadal-scale atmospheric composition change and evaluating significant control policies for the region and the nation.
Measurement data used in this study are available in the data repository maintained by HKUST (https://doi.org/10.14711/dataset/EHHRBZ, Yu et al., 2022).
The supplement related to this article is available online at: https://doi.org/10.5194/acp-22-11557-2022-supplement.
WSC and JZY formulated the overall design of the study. WSC, KFL, and XHHH carried out the chemical analyses for tracers and key major components and data validation. WSC analyzed the data with contributions from KL, AKHL, and JZY. WSC and JZY prepared the manuscript with contributions from all co-authors.
The contact author has declared that none of the authors has any competing interests.
The content of this paper does not necessarily reflect the views and
policies of the Hong Kong Special Administrative Region of the People's
Republic of China Government, nor does mention of trade names or commercial
products constitute an endorsement or recommendation of their use.
Publisher's note: Copernicus Publications remains neutral
with regard to jurisdictional claims in published maps and
institutional affiliations.
We thank the Hong Kong Environmental Protection Department (HKEPD) for making part of the PM2.5 compositional data available for this work.
This research has been supported by the Environment and Conservation Fund (grant no. ECF99/2017).
This paper was edited by Willy Maenhaut and reviewed by two anonymous referees.
Anttila, P. and Tuovinen, J.: Trends of primary and secondary pollutant concentrations in Finland in 1994–2007, Atmos. Environ., 44, 30–41, https://doi.org/10.1016/j.atmosenv.2009.09.041, 2010.
Bigi, A. and Ghermandi, G.: Long-term trend and variability of atmospheric PM10 concentration in the Po Valley, Atmos. Chem. Phys., 14, 4895–4907, https://doi.org/10.5194/acp-14-4895-2014, 2014.
Chen, W., Chen, Y., Huang, Y., Lu, X., Yu, J. Z., Fung, J. C. H., Lin, C., Yan, Y., Peng, L., Louie, P. K. K., Tam, F. C. V., Yue, D., Lau, A. K. H., and Zhong, L.: Source apportionment of fine secondary inorganic aerosol over the Pearl River Delta region using a hybrid method, Atmos. Pollut. Res., 12, 101061, https://doi.org/10.1016/j.apr.2021.101061, 2021.
Chen, Z., Chen, D., Wen, W., Zhuang, Y., Kwan, M.-P., Chen, B., Zhao, B., Yang, L., Gao, B., Li, R., and Xu, B.: Evaluating the “2+26” regional strategy for air quality improvement during two air pollution alerts in Beijing: variations in PM2.5 concentrations, source apportionment, and the relative contribution of local emission and regional transport, Atmos. Chem. Phys., 19, 6879–6891, https://doi.org/10.5194/acp-19-6879-2019, 2019.
Cheng, Y., Lee, S., Gu, Z., Ho, K., Zhang, Y., Huang, Y., Chow, J. C., Watson, J. G., Cao, J., and Zhang, R.: PM2.5 and PM10−2.5 chemical composition and source apportionment near a Hong Kong roadway, Particuology, 18, 96–104, https://doi.org/10.1016/j.partic.2013.10.003, 2015.
Cheung, H., Wang, T., Baumann, K., and Guo, H.: Influence of regional pollution outflow on the concentrations of fine particulate matter and visibility in the coastal area of southern China, Atmos. Environ., 39, 6463–6474, https://doi.org/10.1016/j.atmosenv.2005.07.033, 2005.
Chin, P. C.: Climate and weather, in: A Geography of Hong Kong, edited by: Chiu, T. N. and So, C. L., Oxford University Press, New York, 69–85, ISBN 0195840631, 1986.
Chow, J. C. and Watson, J. G.: Guideline on Speciated Particulate Monitoring, prepared for the United States Environmental Protection Agency, http://www3.epa.gov/ttnamti1/files/ambient/pm25/spec/drispec.pdf (last access: 30 January 2022), 1998.
Chow, J. C., Watson J. G., Chen, L. W., Chang, M. C., Robinson, N. F., Trimble, D., and Kohl S.: The IMPROVE_A temperature protocol for thermal/optical carbon analysis: maintaining consistency with a long-term database, J. Air Waste Manage., 57, 1014–1023, https://doi.org/10.3155/1047-3289.57.9.1014, 2007.
Chow, J. C, Watson, J. G., Cropper, P. M., Wang, X. L., and Kohl, S. D.: Measurements and validation for the twelve-months particulate matter study in Hong Kong, 2015, https://www.epd.gov.hk/epd/english/environmentinhk/air/studyrpts/pm25_study.html (last access: 3 February 2022), 2016.
Chow, W. S., Huang, X. H. H., Leung, K. F., Huang, L., Wu, X., and Yu, J. Z.: Molecular and elemental marker-based source apportionment of fine particulate matter at six sites in Hong Kong, China, Sci. Total Environ., 813, 152652, https://doi.org/10.1016/j.scitotenv.2021.152652, 2022.
Cleveland, R. B., Cleveland, W. S., and Terpenning, I.: STL: A seasonal-trend decomposition procedure based on loess, J. Off. Stat., 6, 3, 1990.
Dao, X., Lin, Y. C., Cao, F., Di, S. Y., Hong, Y., Xing, G., Li, J., Fu, P., and Zhang, Y. L.: Introduction to the national aerosol chemical composition monitoring network of China: Objectives, current status, and outlook, B. Am. Meteorol. Soc., 10, ES337–ES351, https://doi.org/10.1175/BAMS-D-18-0325.1, 2019.
Fu, X., Wang, X. M., Guo, H., Cheung, K., Ding, X., Zhao, X., He, Q., Gao, B., Zhang, Z., Liu, T., and Zhang, Y.: Trends of ambient fine particles and major chemical components in the Pearl River Delta region: observation at a regional background site in fall and winter, Sci. Total Environ., 497–498, 274–281, https://doi.org/10.1016/j.scitotenv.2014.08.008, 2014.
Griffith, S. M., Huang, X. H. H., Louie, P. K. K., and Yu, J. Z.: Characterizing the thermodynamic and chemical composition factors controlling PM2.5 nitrate: Insights gained from two years of online measurements in Hong Kong, Atmos. Environ., 122, 864–875, https://doi.org/10.1016/j.atmosenv.2015.02.009, 2015.
Guo, H., Ding, A. J., So, K. L., Ayoko, G., Li, Y. S., and Hung, W. T.: Receptor modeling of source apportionment of Hong Kong aerosols and the implication of urban and regional contribution, Atmos. Environ., 43, 1159–1169, https://doi.org/10.1016/j.atmosenv.2008.04.046, 2009.
HKEPD (Hong Kong Environmental Protection Department): 2017 Hong Kong emission inventory report, https://www.epd.gov.hk/epd/sites/default/files/epd/data/2017_Emission_Inventory_Report_Eng.pdf (last access: 9 January 2022), 2019.
HKEPD (Hong Kong Environmental Protection, Department): Guangdong-Hong Kong-Macao Pearl River Delta regional air quality monitoring network – A report of monitoring results in 2019, Environmental Protection Department the Government of the Hong Kong Special Administrative Region, 1–38, https://www.epd.gov.hk/epd/sites/default/files/epd/english/resources_pub/publications/files/PRD_2019_report_en.pdf (last access: 21 July 2021), 2020.
HKEPD (Hong Kong Environmental Protection Department): A concise guide to the air pollution control ordinance, https://www.epd.gov.hk/epd/english/environmentinhk/air/guide_ref/guide_apco.html#introduction (last access: 26 June 2022), 2021a.
HKEPD (Hong Kong Environmental Protection Department): Data & Statistics – Hong Kong Air Pollutant Emission Inventory, https://www.epd.gov.hk/epd/english/environmentinhk/air/data/emission_inve.html (last access: 22 June 2022), 2021b.
Ho, S. S. H. and Yu, J. Z.: In-injection port thermal desorption and subsequent gas chromatography–mass spectrometric analysis of polycyclic aromatic hydrocarbons and n-alkanes in atmospheric aerosol samples, J. Chromatogr. A, 1059, 121–129, https://doi.org/10.1016/j.chroma.2004.10.013, 2004.
Ho, S. S. H., Yu, J. Z., Chow, J. C., Zielinska, B., Watson, J. G., Sit, E. H. L., and Schauer, J. J.: Evaluation of an in-injection port thermal desorption-gas chromatography/mass spectrometry method for analysis of non-polar organic compounds in ambient aerosol samples, J. Chromatogr. A, 1200, 217–227, https://doi.org/10.1016/j.chroma.2008.05.056, 2008.
Huang, X. H. H., Bian, Q., Ng, W. M., Louie, P. K. K., and Yu, J. Z.: Characterization of PM2.5 major components and source investigation in suburban Hong Kong: A one year monitoring study, Aerosol Air Qual. Res., 14, 237–250, https://doi.org/10.4209/aaqr.2013.01.0020, 2014.
Kim, Y. J., Kim, K. W., Kim, S. D., Lee, B. K., and Han, J. S.: Fine particulate matter characteristics and its impact on visibility impairment at two urban sites in Korea: Seoul and Incheon, Atmos. Environ., 40, 593–605, https://doi.org/10.1016/j.atmosenv.2005.11.076, 2006.
Ko, F. W. S., Tam, W., Wong, T. W., Lai, C. K. W., Wong, G. W. K., Leung, T., Ng, S. S. S., and Hui, D. S. C.: Effects of air pollution on asthma hospitalization rates in different age groups in Hong Kong, Clin. Exp. Allergy, 37, 1312–1319, https://doi.org/10.1111/j.1365-2222.2007.02791.x, 2007.
Kuang, B. Y., Lin, P., Huang, X. H. H., and Yu, J. Z.: Sources of humic-like substances in the Pearl River Delta, China: positive matrix factorization analysis of PM2.5 major components and source markers, Atmos. Chem. Phys., 15, 1995–2008, https://doi.org/10.5194/acp-15-1995-2015, 2015.
Lang, J., Zhang, Y., Zhou, Y., Cheng, S., Chen, D., Guo, X., Chen, S., Li, X., Xing, X., and Wang, H.: Trends of PM2.5 and chemical composition in Beijing, 2000–2015, Aerosol Air Qual. Res., 17, 412–425, https://doi.org/10.4209/aaqr.2016.07.0307, 2017.
Li, M., Liu, H., Geng, G., Hong, C., Liu, F., Song, Y., Tong, D., Zheng, B., Cui, H., Man, H., Zhang, Q., and He, K.: Anthropogenic emission inventories in China: a review, Natl. Sci. Rev., 4, 834–866, https://doi.org/10.1093/nsr/nwx150, 2017.
Li, Y. J., Yeung, J. W. T., Leung, T. P. I., Lau, A. P. S., and Chan, C. K.: Characterization of organic particles from incense burning using an aerodyne high-resolution time-of-flight aerosol mass spectrometer, Aerosol Sci. Tech., 46, 654–665, https://doi.org/10.1080/02786826.2011.653017, 2012.
Lippmann, M. and Chen, L.: Health effects of concentrated ambient air particulate matter (CAPs) and its components, Crit. Rev. Toxicol., 39, 865–913, https://doi.org/10.3109/10408440903300080, 2009.
Lu, Q., Zheng, J., Ye, S., Shen, X., Yuan, Z., and Yin, S.: Emission trends and source characteristics of SO2, NOx, PM10 and VOCs in the Pearl River Delta region from 2000 to 2009, Atmos. Environ., 76, 11–20, https://doi.org/10.1016/j.atmosenv.2012.10.062, 2013.
Molugaram, K. and Rao, G. S.: Chap. 12 – Analysis of time series, in: Statistical Techniques for Transportation Engineering, edited by: Molugaram, K. and Rao, G. S., Butterworth-Heinemann, 463–489, https://doi.org/10.1016/B978-0-12-811555-8.00012-X, 2017.
Ren, J., Yu, P., and Xu, X: Straw utilization in China – status and recommendations, Sustainability, 11, 1762, https://doi.org/10.3390/su11061762, 2019.
Shumway, R. H. and Stoffer, D. S.: Time series analysis and its applications: With R examples, Springer, New York, ISBN 9781441978646, 2017.
Simoneit, B. R., Schauer, J. J., Nolte, C. G., Oros, D. R., Elias, V. O., Fraser, M. P., Rogge, W. F., and Cass, G. R.: Levoglucosan, a tracer for cellulose in biomass burning and atmospheric particles, Atmos. Environ., 33, 173–182, https://doi.org/10.1016/S1352-2310(98)00145-9, 1999.
Singh, V., Singh, S., and Biswal, A.: Exceedances and trends of particulate matter (PM2.5) in five Indian megacities, Sci. Total Environ., 750, 141461, https://doi.org/10.1016/j.scitotenv.2020.141461, 2021.
Tan, J., Duan, J., Ma, Y., He, K., Cheng, Y., Deng, S. X., Huang, Y. L., and Si-Tu, S. P.: Long-term trends of chemical characteristics and sources of fine particle in Foshan City, Pearl River Delta: 2008–2014, Sci. Total Environ., 565, 519–528, https://doi.org/10.1016/j.scitotenv.2016.05.059, 2016.
Tian, H. Z., Wang, Y., Xue, Z. G., Cheng, K., Qu, Y. P., Chai, F. H., and Hao, J. M.: Trend and characteristics of atmospheric emissions of Hg, As, and Se from coal combustion in China, 1980–2007, Atmos. Chem. Phys., 10, 11905–11919, https://doi.org/10.5194/acp-10-11905-2010, 2010.
USEPA (United State Environmental Protection Agency): Quality assurance guidance document 2.12 – monitoring PM2.5 in ambient air using designated reference or class I equivalent methods, https://www3.epa.gov/ttnamti1/files/ambient/pm25/qa/m212.pdf (last access: 6 February 2022), 2016.
Wang, X., Ho, K., Chow, J. C., Kohl, S. D., Chan, C. S., Cui, L., Lee, S. F., Chen, L. A., Ho, S. S. H., Cheng, Y., and Watson, J. G.: Hong Kong vehicle emission changes from 2003 to 2015 in the Shing Mun tunnel, Aerosol Sci. Tech., 52, 1085–1098, https://doi.org/10.1080/02786826.2018.1456650, 2018.
Wang, X., Zhong, S., Bian, X., and Yu, L.: Impact of 2015–2016 El niño and 2017–2018 la niña on PM2.5 concentrations across China, Atmos. Environ., 208, 61–73, https://doi.org/10.1016/j.atmosenv.2019.03.035, 2019.
Watson, J. G., Chow, J. C., and Frazier, C. A.: X-ray fluorescence analysis of ambient air samples, in: Elemental Analysis of Airborne Particles, Vol. 1, edited by: Landsberger, S. and Creatchman, M., Gordon and Breach Science, Amsterdam, the Netherlands, 67–96, ISBN 9789056996277, 1999.
Wilcox, R.: Chap. 10 – Robust regression, in: Introduction to Robust Estimation and Hypothesis Testing, 4th edn., edited by: Wilcox, R., Academic Press, 517–583, https://doi.org/10.1016/B978-0-12-804733-0.00010-X, 2017.
World Health Organization: WHO global air quality guidelines: particulate matter (PM2.5 and PM10), ozone, nitrogen dioxide, sulfur dioxide and carbon monoxide, World Health Organization, https://apps.who.int/iris/handle/10665/345329 (last access: 30 January 2022), 2021.
Xue, J., Yuan, Z., Lau, A. K. H., and Yu, J. Z.: Insights into factors affecting nitrate in PM2.5 in a polluted high NOx environment through hourly observations and size distribution measurements, J. Geophys. Res.-Atmos., 119, 4888–4902, https://doi.org/10.1002/2013JD021108, 2014a.
Xue, J., Yuan, Z., Yu, J. Z., and Lau, A. K. H.: An observation-based model for secondary inorganic aerosols, Aerosol Air Qual. Res., 14, 862–878, https://doi.org/10.4209/aaqr.2013.06.0188, 2014b.
Xue, J., Yu, X., Yuan, Z., Griffith, S. M., Lau, A. K. H., Seinfeld, J. H., and Yu, J. Z.: Efficient control of atmospheric sulfate production based on three formation regimes, Nat. Geosci., 12, 977–982, https://doi.org/10.1038/s41561-019-0485-5, 2019.
Yang, J. and Zhu, S.: Effect of industrial transfer policy on the evolution of regional product structure: Based on the “Double Transfer” policy in Guangdong Province, Trop. Geogr., 37, 452–461, https://doi.org/10.13284/j.cnki.rddl.002971, 2017.
Yang, Y., Tang, R., Qiu, H., Lai, P., Wong, P., Thach, T., Allen, R., Brauer, M., Tian, L., and Barratt, B.: Long term exposure to air pollution and mortality in an elderly cohort in Hong Kong, Environ. Int., 117, 99–106, https://doi.org/10.1016/j.envint.2018.04.034, 2018.
Yim, S. H. L., Hou, X., Guo, J., and Yang, Y.: Contribution of local emissions and transboundary air pollution to air quality in Hong Kong during El niño-Southern Oscillation and heatwaves, Atmos. Res., 218, 50–58, https://doi.org/10.1016/j.atmosres.2018.10.021, 2019.
Yu, J., Yan, C., Liu, Y., Li, X., Zhou, T., and Zheng, M.: Potassium: A Tracer for Biomass Burning in Beijing?, Aerosol Air Qual. Res., 18, 2447–2459, https://doi.org/10.4209/aaqr.2017.11.0536, 2018.
Yu, J. Z. and Zhang, T.: Measurements and validation for the twelve-months particulate matter study in Hong Kong, 2016, https://www.epd.gov.hk/epd/english/environmentinhk/air/studyrpts/pm25_study.html (last access: 5 February 2022), 2017.
Yu, J. Z. and Zhang, T.: Measurements and validation for the twelve-months particulate matter study in Hong Kong, 2017, https://www.epd.gov.hk/epd/english/environmentinhk/air/studyrpts/pm25_study.html (last access: 5 February 2022), 2018.
Yu, J. Z., Tung, J. W. T., Wu, A. W. M., Lau, A. K. H., Louie, P. K. K., and Fung, J. C. H.: Abundance and seasonal characteristics of elemental and organic carbon in Hong Kong PM10, Atmos. Environ., 38, 1511–1521, https://doi.org/10.1016/j.atmosenv.2003.11.035, 2004.
Yu, J. Z., Huang, X. H. H., and Ng, W. M.: Measurements and validation for the twelve-months particulate matter study in Hong Kong, 2011, https://www.epd.gov.hk/epd/english/environmentinhk/air/studyrpts/pm25_study.html (last access: 5 February 2022), 2012.
Yu, J. Z., Huang, X. H. H., and Ng, W. M.: Measurements and validation for the twelve-months particulate matter study in Hong Kong, 2012, https://www.epd.gov.hk/epd/english/environmentinhk/air/studyrpts/pm25_study.html (last access: 5 February 2022), 2013.
Yu, J. Z., Huang, X. H. H, Zhang, T., and Ng, W. M.: Measurements and validation for the twelve-months particulate matter study in Hong Kong, 2013, https://www.epd.gov.hk/epd/english/environmentinhk/air (last access: 5 February 2022), 2014.
Yu, J. Z., Huang, X. H. H., Zhang, T., and Ng, W. M.: Measurements and validation for the twelve-months particulate matter study in Hong Kong, 2014, https://www.epd.gov.hk/epd/english/environmentinhk/air/studyrpts/pm25_study.html (last access: 5 February 2022), 2015.
Yu, J. Z., Chow, W. S., and Huang, X. H. H.: Ten-year (2008–2017) PM2.5 major components and select tracers at Tsuen Wan, Hong Kong, DataSpace@HKUST [data set], https://doi.org/10.14711/dataset/EHHRBZ, 2022.
Yuan, Z., Yadav, V., Turner, J. R., Louie, P. K. K., and Lau, A. K. H.: Long-term trends of ambient particulate matter emission source contributions and the accountability of control strategies in Hong Kong over 1998–2008, Atmos. Environ., 76, 21–31, https://doi.org/10.1016/j.atmosenv.2012.09.026, 2013.
Zhang, X., Yuan, Z., Li, W., Lau, A. K. H., Yu, J. Z., Fung, J. C. H., Zheng, J., and Yu, A. L. C.: Eighteen-year trends of local and non-local impacts to ambient PM10 in Hong Kong based on chemical speciation and source apportionment, Atmos. Res., 214, 1–9, https://doi.org/10.1016/j.atmosres.2018.07.004, 2018.
Zhao, M., Zhang, Y., Ma, W., Fu, Q., Yang, X., Li, C., Zhou, B., Yu, Q., and Chen, L.: Characteristics and ship traffic source identification of air pollutants in China's largest port, Atmos. Environ., 64, 277–286, https://doi.org/10.1016/j.atmosenv.2012.10.007, 2013.
Zheng, B., Tong, D., Li, M., Liu, F., Hong, C., Geng, G., Li, H., Li, X., Peng, L., Qi, J., Yan, L., Zhang, Y., Zhao, H., Zheng, Y., He, K., and Zhang, Q.: Trends in China's anthropogenic emissions since 2010 as the consequence of clean air actions, Atmos. Chem. Phys., 18, 14095–14111, https://doi.org/10.5194/acp-18-14095-2018, 2018.
Zhong, L. J., Louie, P. K. K., Zheng, J. Y., Yuan, Z. B., Yue, D. L., Ho, J. W. K., and Lau, A. K. H.: Science–policy interplay: air quality management in the Pearl River Delta region and Hong Kong, Atmos. Environ., 76, 3–10, https://doi.org/10.1016/j.atmosenv.2013.03.012, 2013.