the Creative Commons Attribution 4.0 License.
the Creative Commons Attribution 4.0 License.
 | 26 Aug 2022
Numerical simulation of the impact of COVID-19 lockdown on tropospheric composition and aerosol radiative forcing in Europe
Simon F. Reifenberg
Anna Martin
Matthias Kohl
Sara Bacer
Zaneta Hamryszczak
Ivan Tadic
Lenard Röder
Daniel J. Crowley
Horst Fischer
Katharina Kaiser
Johannes Schneider
Raphael Dörich
John N. Crowley
Laura Tomsche
Andreas Marsing
Christiane Voigt
Andreas Zahn
Christopher Pöhlker
Bruna A. Holanda
Ovid Krüger
Ulrich Pöschl
Mira Pöhlker
Patrick Jöckel
Marcel Dorf
Ulrich Schumann
Jonathan Williams
Birger Bohn
Joachim Curtius
Hardwig Harder
Hans Schlager
Jos Lelieveld
Aerosols influence the Earth's energy balance directly by modifying the radiation transfer and indirectly by altering the cloud microphysics. Anthropogenic aerosol emissions dropped considerably when the global COVID-19 pandemic resulted in severe restraints on mobility, production, and public life in spring 2020. We assess the effects of these reduced emissions on direct and indirect aerosol radiative forcing over Europe, excluding contributions from contrails. We simulate the atmospheric composition with the ECHAM5/MESSy Atmospheric Chemistry (EMAC) model in a baseline (business-as-usual) and a reduced emission scenario. The model results are compared to aircraft observations from the BLUESKY aircraft campaign performed in May–June 2020 over Europe. The model agrees well with most of the observations, except for sulfur dioxide, particulate sulfate, and nitrate in the upper troposphere, likely due to a biased representation of stratospheric aerosol chemistry and missing information about volcanic eruptions. The comparison with a baseline scenario shows that the largest relative differences for tracers and aerosols are found in the upper troposphere, around the aircraft cruise altitude, due to the reduced aircraft emissions, while the largest absolute changes are present at the surface. We also find an increase in all-sky shortwave radiation of 0.21 ± 0.05 W m−2 at the surface in Europe for May 2020, solely attributable to the direct aerosol effect, which is dominated by decreased aerosol scattering of sunlight, followed by reduced aerosol absorption caused by lower concentrations of inorganic and black carbon aerosols in the troposphere. A further increase in shortwave radiation from aerosol indirect effects was found to be much smaller than its variability. Impacts on ice crystal concentrations, cloud droplet number concentrations, and effective crystal radii are found to be negligible.
- Article
(2800 KB) - Full-text XML
- BibTeX
- EndNote


Aerosols play a pivotal role in both air pollution and climate change. They have large impact on human health (Lelieveld et al., 2015, 2020), impose a negative (net) effective radiative forcing (Bellouin et al., 2020), and are a large source of uncertainty in climate change assessments. A reduction in the cooling effect by a decreased aerosol burden necessitates stronger reductions of greenhouse gases (GHGs) for a targeted net radiative forcing (Larson and Portmann, 2019; Myhre et al., 2013).
Owing to the central importance of aerosol particles, the reduced emissions resulting from drastic restrictions on mobility, industry, and public life during the COVID-19 “lockdowns” in early 2020 (hereafter referred to as “lockdown”) (Barré et al., 2021; Evangeliou et al., 2021; Guevara et al., 2021; Le Quéré et al., 2020) sparked a plethora of publications on the subsequent effects on local, regional, and global air pollution (see, for instance, He et al., 2020; Liu et al., 2020; Petetin et al., 2020; Tobías et al., 2020; Venter et al., 2020; Mertens et al., 2021).
We recognize that reduced emissions during lockdown do not necessarily translate into improved air quality, as primary pollutants take part in a complex set of chemical processes, which need to be included in a thorough analysis (Kroll et al., 2020). For instance, although ozone was reported to be reduced in the free troposphere in the Northern Hemisphere (Steinbrecht et al., 2021), the reduced emissions of the nitrogen oxides NO and NO2 led to an increase in ozone concentrations in urban locations, as an important short-term sink (reaction with NO) was reduced (e.g., Gkatzelis et al., 2021; Sicard et al., 2020; Mertens et al., 2021). This illustrates how the complex (photo-)chemistry and the nonlinearity of the underlying chemical system have to be described and analyzed within the framework of a dynamic atmospheric chemistry model. A chemistry climate model with appropriate chemistry furthermore enables a direct comparison of baseline and reduced emissions within the same synoptic background conditions, complementary to a purely observation-based approach. Many works are present in the literature that investigate the climatic effect of COVID-19 lockdown (e.g., Lee et al., 2021; Forster et al., 2020; Gettelman et al., 2021). Of particular importance is the CovidMIP intercomparison project, where 12 global chemistry climate model were used to investigate the impact of COVID-19 lockdown on the radiation (Jones et al., 2021; Lamboll et al., 2021), with special focus on aerosol–radiation interaction.
The interaction of aerosols with radiation and their climatic impact can be categorized into two types: (i) direct effects by impact on radiation fluxes and (ii) indirect effects through changes in cloud physical and optical properties.
The direct effects include absorption and scattering of electromagnetic waves, whereby aerosol particles, most prominently black carbon (BC), absorb incoming solar radiation, which leads to warming of the ambient air and decreases solar irradiance in the layers below. In addition, aerosols scatter incident radiation back to space, leading to a net cooling of the climate system on average. These processes depend on the size, shape, and chemical composition of the aerosols and on the wavelength of the radiation. In addition, the net effect depends on the surface albedo (Shindell et al., 2013; Yoon et al., 2019; Bellouin et al., 2020). The reduced emissions in spring 2020 are thus expected to affect aerosol radiative forcing. A reduction in the backscattering of solar radiation is expected to result in warming, which is offset by the anticipated cooling effect through a reduction of black carbon emissions, and the net effect may vary vertically and horizontally. For instance, Gettelman et al. (2021) reported a simulated net warming at the surface and in the lower troposphere in most regions caused by enhanced insolation at the surface and cooling in upper layers of the troposphere due to reduced absorption by black carbon. They also determined a difference in the clear-sky net shortwave (SW) flux at the top of the atmosphere (TOA) of up to 0.1 W m−2 globally in May 2020 between simulations with and without reduced emissions, i.e., less outgoing SW radiation due to the lockdown. Complementing the analyses regarding these more immediate effects, Forster et al. (2020) estimate a short-term warming driven by a weakened aerosol cooling through reduced sulfur dioxide (SO2) emissions, followed by a cooling of 0.010 ± 0.005 K by 2030 in reference to a baseline scenario.
In addition to the aerosol direct effects on the radiation budget, aerosol particles have several indirect effects. Aerosol particles serve as cloud condensation nuclei and thus can potentially alter cloud properties, such as cloud albedo, cloud droplet number concentration, formation processes, precipitation, and cloud lifetime (see, for instance, Bellouin et al., 2020; Christensen et al., 2020; Lohmann and Feichter, 2005; Twomey, 1959). In turn, clouds also affect aerosols. Clouds convert precursor gases into aerosol particles through heterogeneous chemistry (Ervens et al., 2011; Lelieveld and Heintzenberg, 1992; McMurry and Wilson, 1983) and, at the same time, remove aerosols and soluble gases from the atmosphere by precipitation (“wet deposition”). Radiative forcing from aerosol cloud interactions is very challenging to quantify, and it is strongly model dependent (Hong et al., 2016; Gasparini and Lohmann, 2016; Myhre et al., 2013). Recently, satellite data have been used to quantify changes in clouds in regions with COVID-reduced air traffic in 2020 (Quaas et al., 2021; Gettelman et al., 2021). With respect to contrails, Schumann et al. (2021a, b) find a substantial reduction of contrail cirrus optical thickness and radiative forcing during the lockdown period.
Complex models like as the one used by the CovidMIP, however, are most effective when accompanied by observational data, as the capability of the models to reproduce the real atmosphere is unclear, especially when the anthropogenic emissions are strongly perturbed as in the case of the COVID-19 lockdown. Furthermore, as the reduced emissions have different effect on the atmospheric composition depending also on the altitude, the observational data should cover large regions of the troposphere. Despite the large presence of observations at the surface during the COVID-19 lockdown (Gkatzelis et al., 2021), the free and upper troposphere presented comparably almost no in situ measurements against which the model could be validated. One notable exception is the BLUESKY field campaign (Voigt et al., 2021): from 16 May to 9 June 2020 in situ measurements of trace gases and trace particles were conducted in the atmosphere over European urban areas and the North Atlantic flight corridor with the High Altitude and Long Range (HALO) research aircraft and a second research aircraft, Falcon (see Fig. 1 for flight paths). Comprehensive measurements of trace gas and aerosol compositions were conducted, providing a unique set of observations that can be used to validate model results.
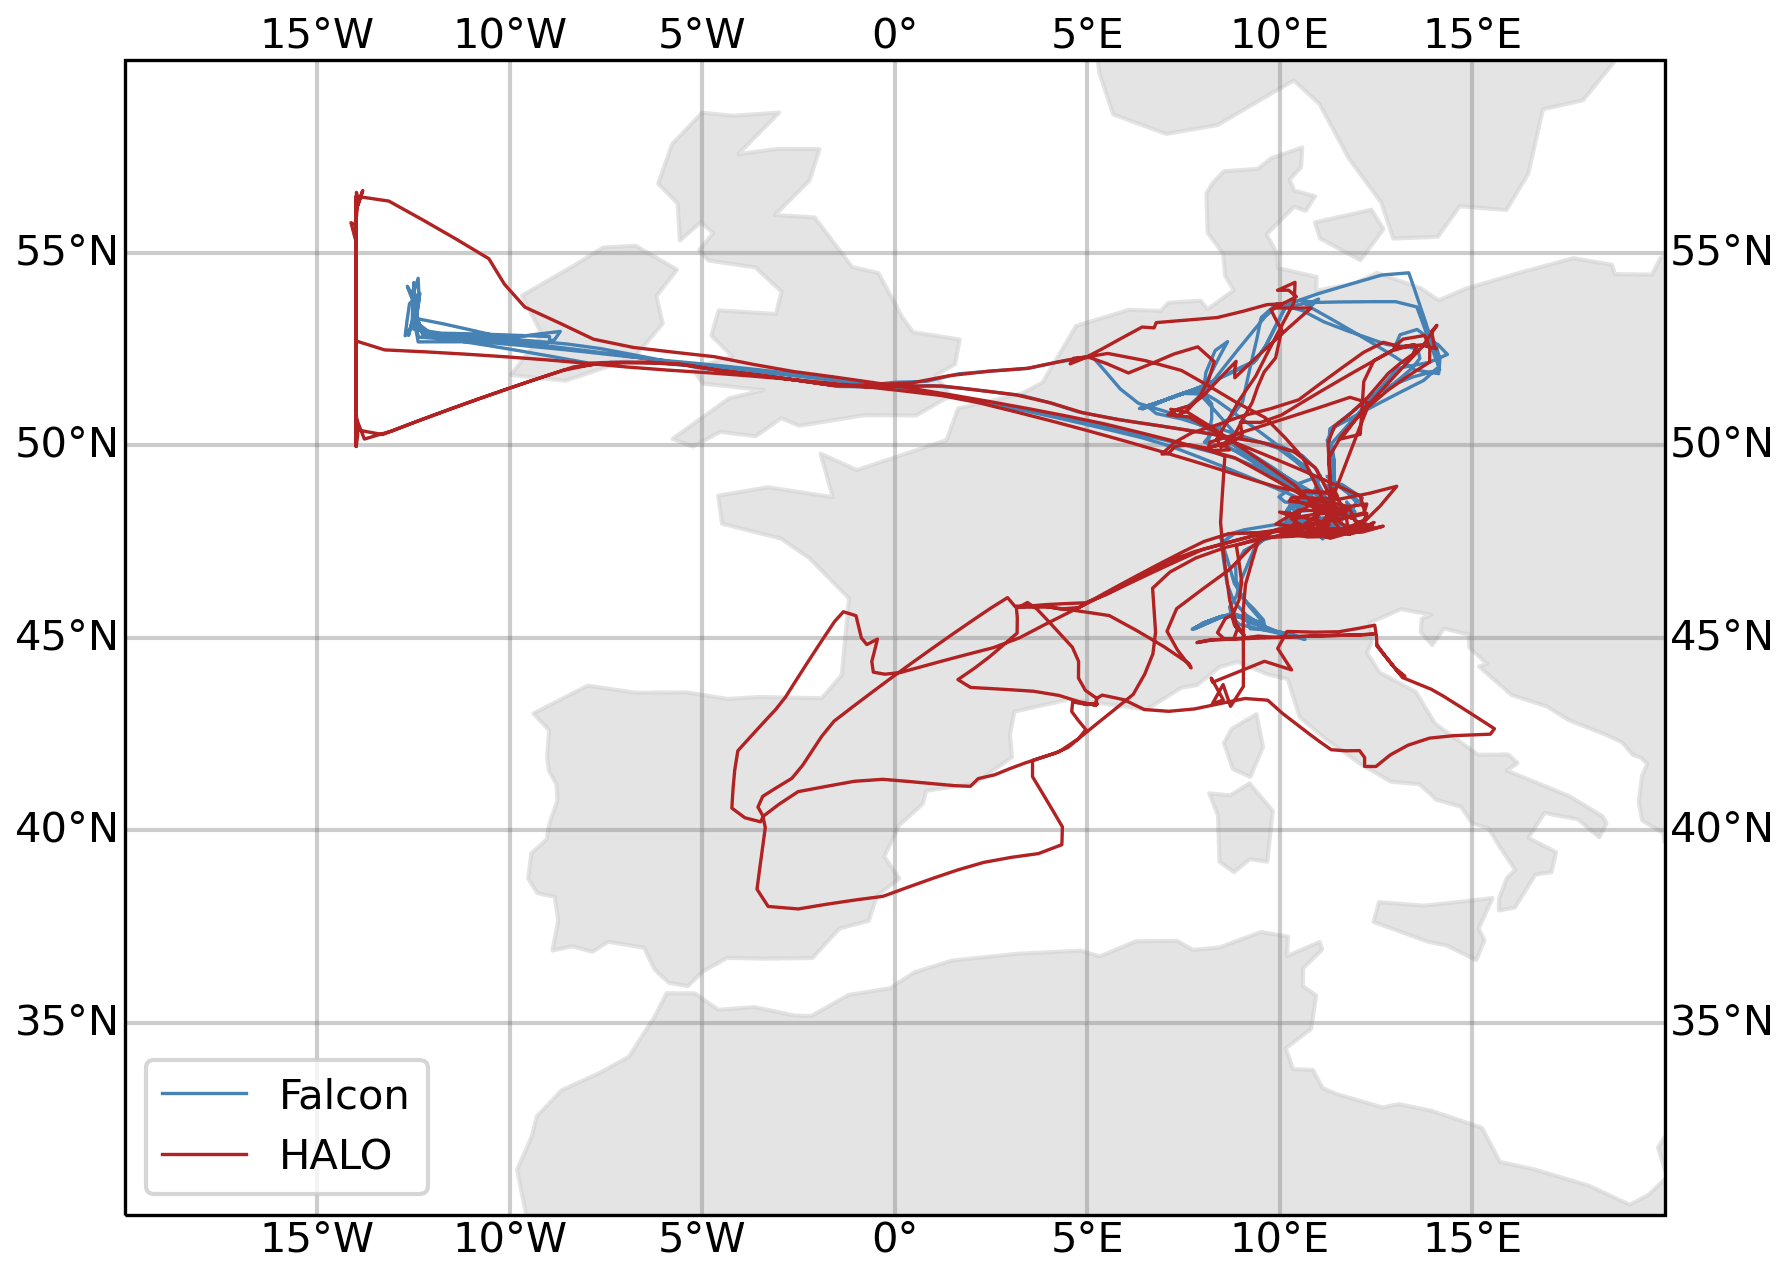
Figure 1Tracks of conducted flights during the BLUESKY campaign (16 May to 9 June 2020). Colors denote the aircraft: Falcon (blue) and HALO (red).
Using an observation-guided model, the COVID-19 lockdown provided an opportunity to examine how the climate system reacts to perturbations such as abruptly reduced air pollution emissions. The COVID-19 lockdown may also serve to assess the impact of economic recovery with respect to climate change mitigation: for instance, Forster et al. (2020) show that investments aimed at a “green” opposed to a fossil-fueled recovery can reduce projected warming by 0.3 K by 2050, with only negligible contributions from the lockdown.
In the present study, we simulate the chemical composition of the atmosphere in Europe in spring 2020 under a reduced-emission scenario and a baseline scenario with a state-of-the-art climate and chemistry simulation system, constraining atmospheric dynamics by reanalysis meteorological data. We use the BLUESKY observational data set of trace gases and aerosols obtained during an aircraft measurement campaign in Europe during the COVID-19 lockdown in summer 2020 to evaluate the model results. We then quantify the effects of the lockdown on radiative transfer in the atmosphere, particularly the change in shortwave fluxes and shortwave heating rates attributable to a reduced aerosol burden in Europe. Furthermore, we examine the impacts of the reduced emissions on cloud properties, including potential changes of the radiative forcing caused by indirect aerosol effects.
2.1 Model data
The ECHAM5/MESSy Atmospheric Chemistry (EMAC) model is a numerical chemistry and climate simulation system that includes submodels describing tropospheric and middle-atmospheric processes and their interaction with oceans, land, and human influences (Jöckel et al., 2016). It uses the second version of the Modular Earth Submodel System (MESSy2) to link multi-institutional computer codes. The core atmospheric model is the fifth-generation European Centre Hamburg general circulation model (ECHAM5, Roeckner et al., 2006).
For the present study we applied EMAC (ECHAM5 version 5.3.02, MESSy version 2.55.0) in T63L47MA resolution, i.e., with a spherical truncation of T63 (corresponding to a quadratic Gaussian grid of approx. 1.8∘ by 1.8∘ in latitude and longitude) with 47 vertical hybrid pressure levels up to 1 Pa. Roughly 22 levels are included in the troposphere, and the model has a time step of 300 s. The dynamics of the EMAC model has been weakly nudged in the troposphere (Jeuken et al., 1996; Jöckel et al., 2006; Löffler et al., 2016) towards the ERA5 meteorological reanalysis data (Hersbach et al., 2020) of the European Centre for Medium-Range Weather Forecasts (ECMWF) to represent the actual day to day meteorology in the troposphere.
The setup of the chemistry submodels for this study is similar to the one presented by Jöckel et al. (2016, simulation RC1–aero–07) but with the addition of the submodel ORACLE (Tsimpidi et al., 2014) for the organic chemistry calculation and with stratospheric heterogeneous chemistry neglected. Initial conditions for the meteorology were also taken from the ERA-Interim reanalysis data, while the ones for the chemical composition were from previous EMAC simulations (Pozzer et al., 2022). In addition, the anthropogenic emissions used are based on CAMS-GLOB-ANTv4.2 (Granier et al., 2019). To reproduce the effect of lockdown on the emissions, we adopted the reduction coefficient for Europe as in Guevara et al. (2021) for the sectors of energy production (ENE), road transport (TRO), and industrial processes (IND). The reduced emissions were averaged for the period 19 to 26 April (i.e., the last available week in the data set), and applied (for each country) for March, April, May, and June. For aviation (AVI) we adopted the same method, although we applied the estimated factor to the entire aviation emissions, without any country distinction.
Atmospheric aerosols are described via a two-moment aerosol scheme, which predicts number concentration and mass mixing ratio of the aerosol modes (Pringle et al., 2010). This scheme takes into account various physical and chemical processes of aerosols, such as coagulation, aging, condensation, and gas–aerosol partitioning (Fountoukis and Nenes, 2007). Convective cloud processes are accounted for using the framework of Tost et al. (2006), based on the convection schemes of Tiedtke (1989) and Nordeng (1994). Convective cloud microphysics does not take into account the influence of aerosols on liquid droplet or ice formation processes and is solely based on temperature and vertical velocity. In EMAC, the vertical velocity is given by the sum of the grid mean vertical velocity and the turbulent contribution (Brinkop and Roeckner, 1995), and thus one single updraft velocity is used for the whole grid cell. Large-scale stratiform clouds are described by the CLOUD submodel, which, in the setup applied here, uses a two-moment cloud microphysics scheme for cloud droplets and ice crystals (Lohmann et al., 1999, 2007; Lohmann and Kärcher, 2002) and solves the prognostic equations for specific humidity, liquid cloud mixing ratio, ice cloud mixing ratio, cloud droplet number concentration (CDNC), and ice crystal number concentration (ICNC). The model setup without cloud–aerosol interactions uses the original ECHAM5 cloud microphysical scheme (Lohmann and Roeckner, 1996) and a statistical cloud cover scheme including prognostic equations for the distribution moments (Sundqvist et al., 1989). Details on the cloud microphysical scheme can be found in Roeckner et al. (2003, and references therein).
Cloud droplet formation in the model setup without cloud–aerosol interaction is computed by the “unified activation framework”, an advanced physically based parameterization (Kumar et al., 2009; Karydis et al., 2011) that combines the κ-Köhler theory (Petters and Kreidenweis, 2007) for the activation of soluble aerosols with the Frenkel–Halsey–Hill adsorption activation theory (Kumar et al., 2009) for the droplet activation due to water adsorption onto insoluble aerosols. Ice formation occurs via homogeneous ice nucleation following the parameterization of Barahona and Nenes (2009) and heterogeneous ice nucleation of insoluble dust, insoluble black carbon, and glassy organics following Phillips et al. (2013). In the cirrus regime (T≤238.15 K), the effect of preexisting ice crystals and the competition for the available water vapor between homogeneous and heterogeneous ice nucleation mechanisms are taken into account (Bacer et al., 2018). Given the high contribution of instantaneous freezing (Bacer et al., 2021), the ICNC in the cirrus regime was modified according to Neubauer et al. (2019) in order to reduce the artificial homogeneous freezing of dry aerosol particles independent of the availability of water vapor. Other microphysical processes related to cloud droplets and ice crystals, like phase transitions, autoconversion, aggregation, accretion, evaporation, and melting, are also taken into account by the CLOUD submodel. The cloud cover is computed diagnostically with the scheme of Sundqvist et al. (1989), which is based on the grid-mean relative humidity.
The aerosol forcing of the EMAC model has been investigated, and here we report the effective radiative forcing of the aerosol–radiation interaction (ERFari) and the effective radiative forcing of the aerosol–cloud interaction (ERFaci), based on the definition of Myhre et al. (2013). Following the work of Lelieveld et al. (2019), the EMAC model, in a setup very similar to ours, simulates a radiative forcing global mean of all anthropogenic aerosols at TOA (top of the atmosphere) of −0.46 ± 0.01 and −1.2 ± 0.1 W m−2 for ERFari and ERFari + ERFaci, respectively. At the BOA (bottom of the atmosphere) the model simulates −1.6 ± 0.02 and −2.1 ± 0.1 W m−2 for ERFari and ERFari + ERFaci, respectively.
We performed four simulations, all covering the period from January 2019 to July 2020.
-
BASE, i.e., standard (“baseline”) emissions, without cloud–aerosol interaction;
-
RED, i.e., reduced emissions due to lockdown, without cloud–aerosol interaction;
-
BASECLOUD, which was like BASE but with aerosol–cloud interaction;
-
REDCLOUD, which was like RED but with aerosol–cloud interaction.
In all simulations performed, the impact of different aerosol concentrations on the radiation (discussed in Sect. 4.2.1) is diagnosed but not used by the general circulation model, which instead adopts an aerosol climatology (Pringle et al., 2010). Similarly, changes in the tracers (e.g., ozone) do not influence the radiation, which is calculated with a greenhouse gas climatology.
The model evaluation is performed with the RED simulation, while its difference with the BASE simulation is used to evaluate the impact of the reduced emissions during the lockdown. Simulation RED and BASE have identical binary dynamics (Deckert et al., 2011), i.e., they reproduce numerically exactly the same dynamics, as no feedback between chemistry and dynamic is present. In contrast, in REDCLOUD and BASECLOUD the aerosol–cloud interaction is activated following the work of Lohmann and Hoose (2009); Bacer et al. (2018), leading to modification of cloud properties and therefore to changes in radiation and dynamics. The simulations REDCLOUD and BASECLOUD are only used for estimating the indirect effects of aerosols (see Sect. 4.2.2).
2.2 BLUESKY observational data
We compare simulated trace gas and aerosol abundances to a comprehensive set of observations obtained during the BLUESKY campaign (Voigt et al., 2021). In situ measurements of trace gases and trace particles were conducted at the end of May 2022 in the atmosphere over Europe with the Falcon and HALO research aircraft. In total 8 and 12 flights were conducted with the HALO and the Falcon, respectively (Fig. 1).
We compare aerosol mass concentrations of black carbon (BC, size range between 70 and 500 nm), sulfate (), nitrate (), ammonium (), organic aerosol particles (ORG, all from 40 to 800 nm), and aerosol particle number concentrations (between 250 nm to 40 µm). These are complemented by volume mixing ratios of carbon monoxide (CO), ozone (O3), nitric oxide (NO), hydrogen peroxide (H2O2), peroxyacetyl nitrate (PAN), nitric acid (HNO3), and sulfur dioxide (SO2). Details regarding instrumentation are provided by Voigt et al. (2021). We additionally use air temperature T, wind speed, and specific humidity q to assess the quality of the reproduced synoptic conditions that are constrained (nudged) in the model. For the comparison, the model output was sampled during runtime by the submodel S4D (Jöckel et al., 2016), following the flight tracks of the field campaign and with a time frequency of 5 min.
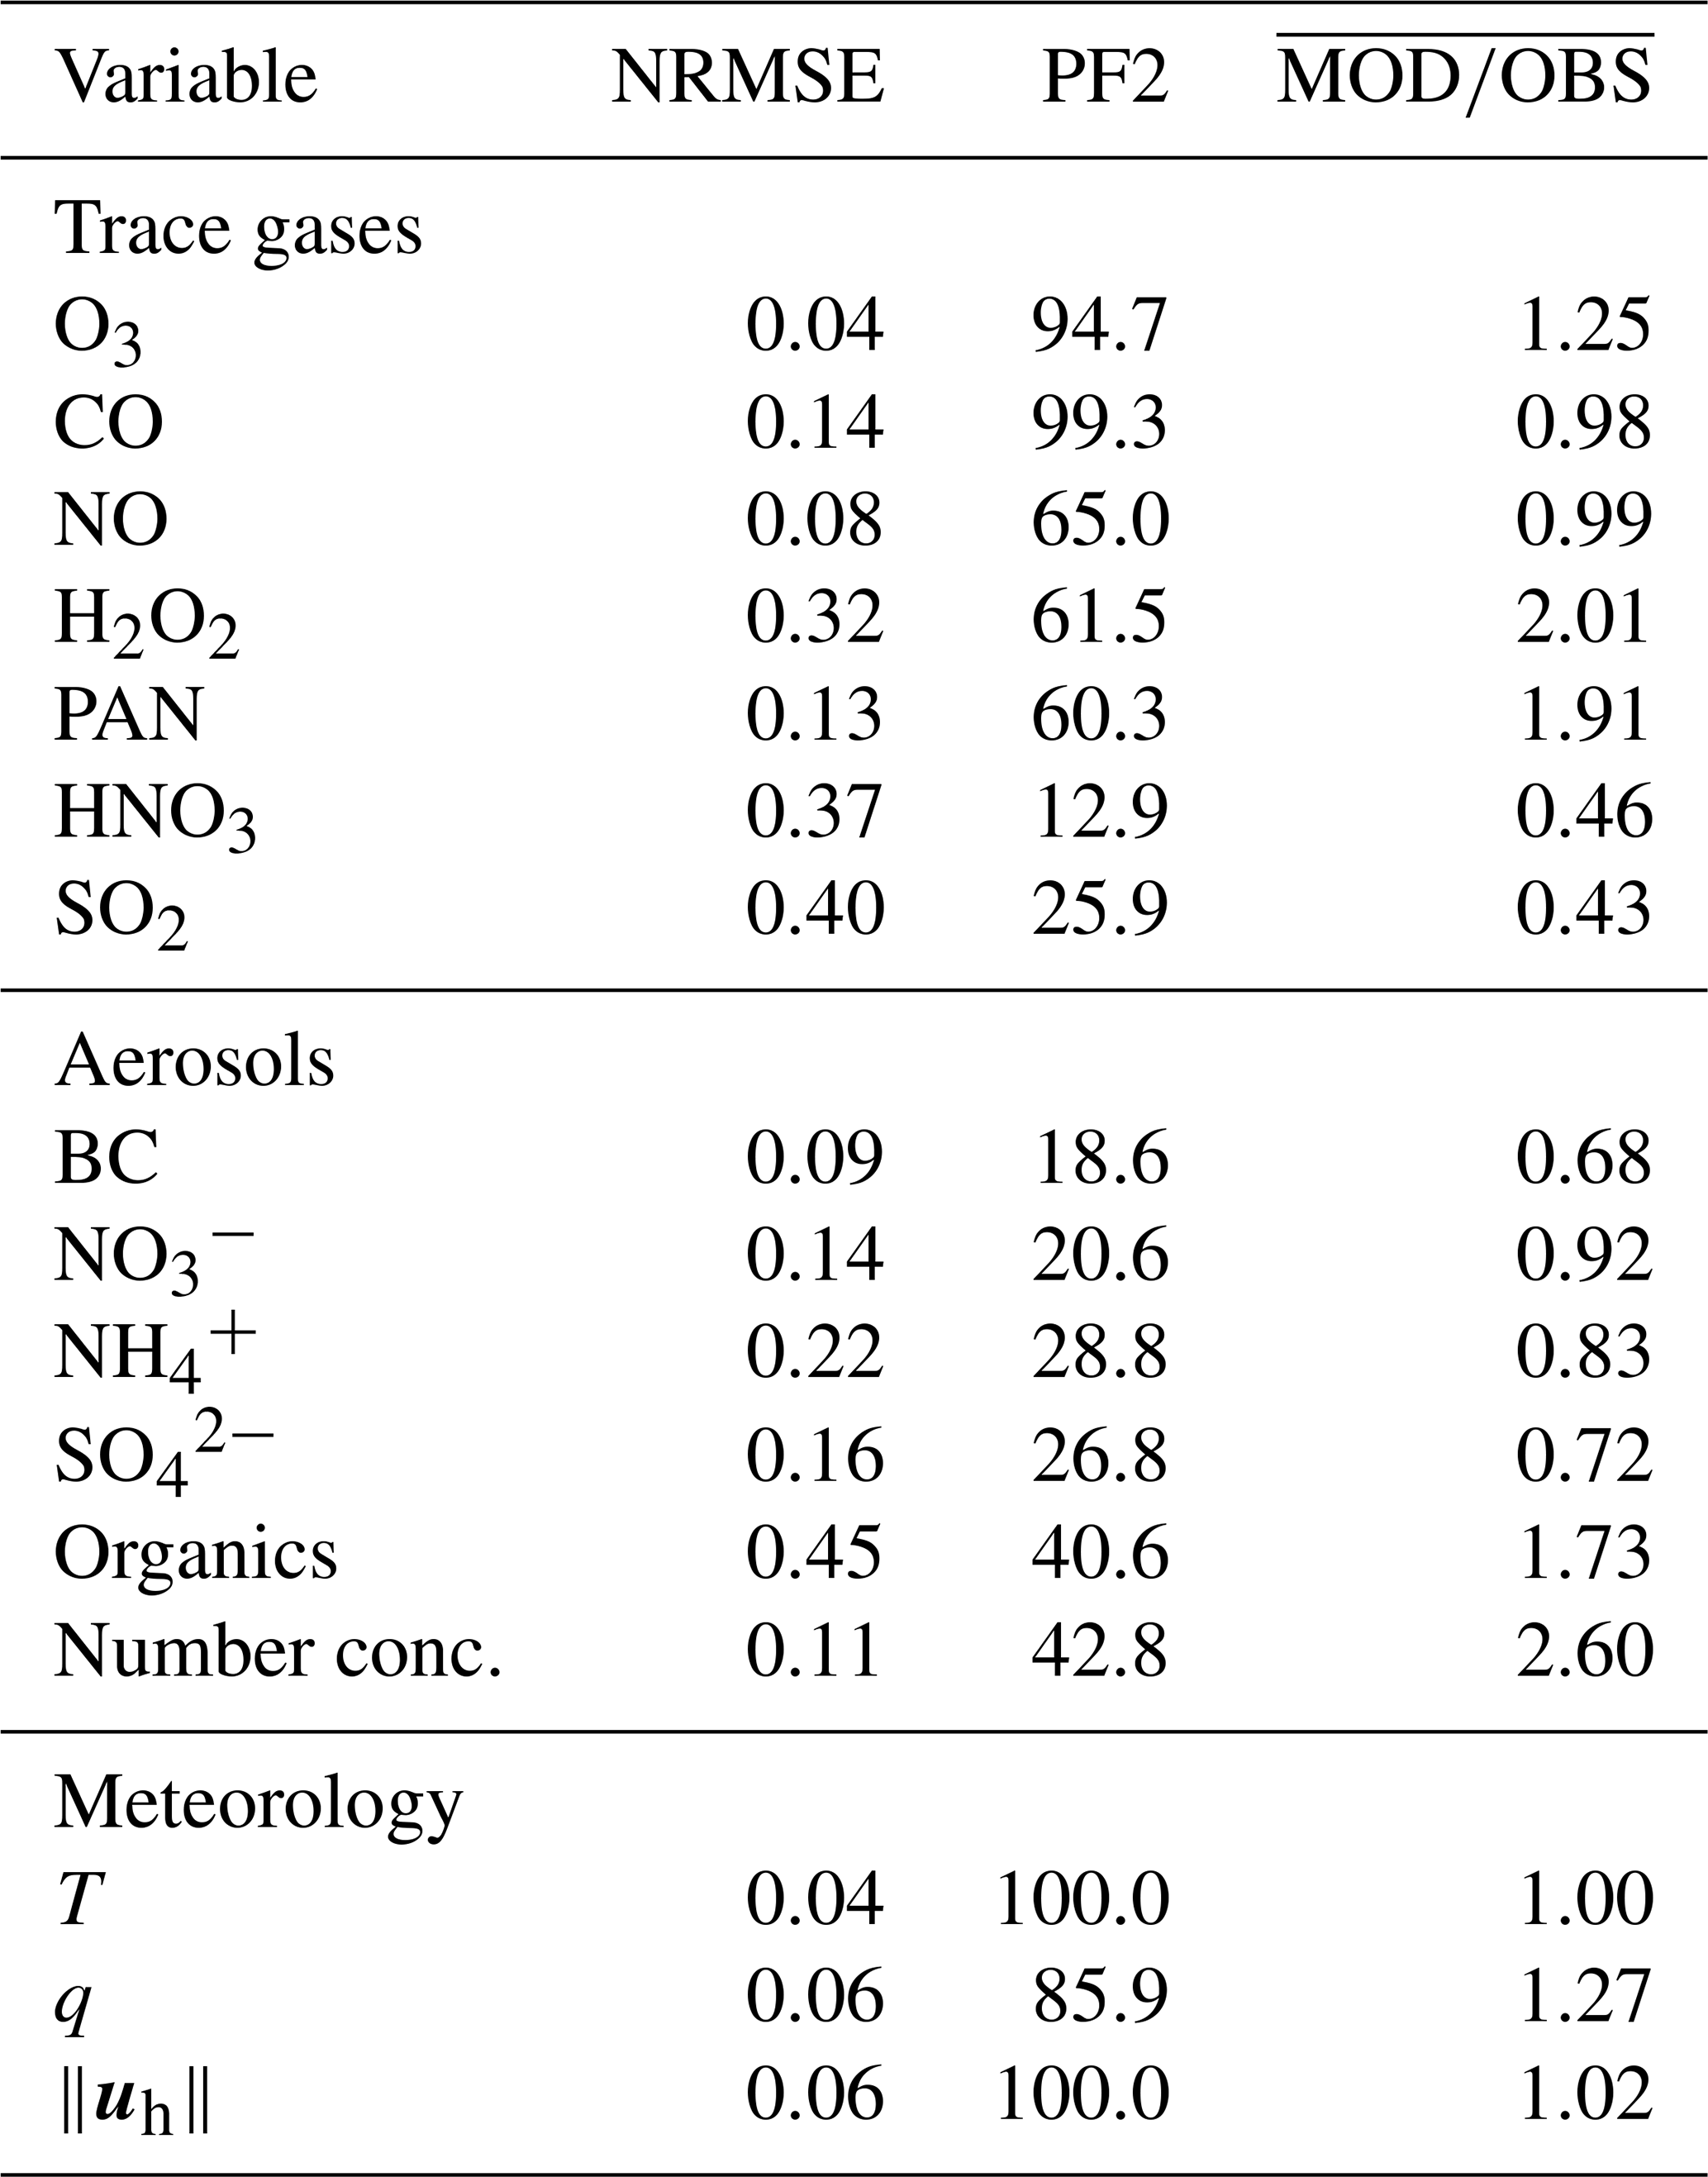
The ambient air temperature T is reproduced very well by the model; the average ratio of observed and simulated T is equal to 1.00 with a normalized root-mean-squared error of 0.04 (NRMSE; RMSE divided by range of observations). The vertical temperature profile is matched in the lower and free troposphere with a slight underestimation of observed temperatures towards the upper troposphere (Fig. 2), which confirms the quality of the nudged data. Specific humidity q, a quantity that is not subject to nudging, is also captured reasonably well in the model, (NRMSE=0.06), as 85.9 % of simulated values lie within a factor of 2 of the observations, and yet they are slightly overestimated (see Fig. 2 and Table 1). In addition, horizontal wind speed is also reproduced accurately with a low NRMSE (0.06) and an average ratio of 1.02.
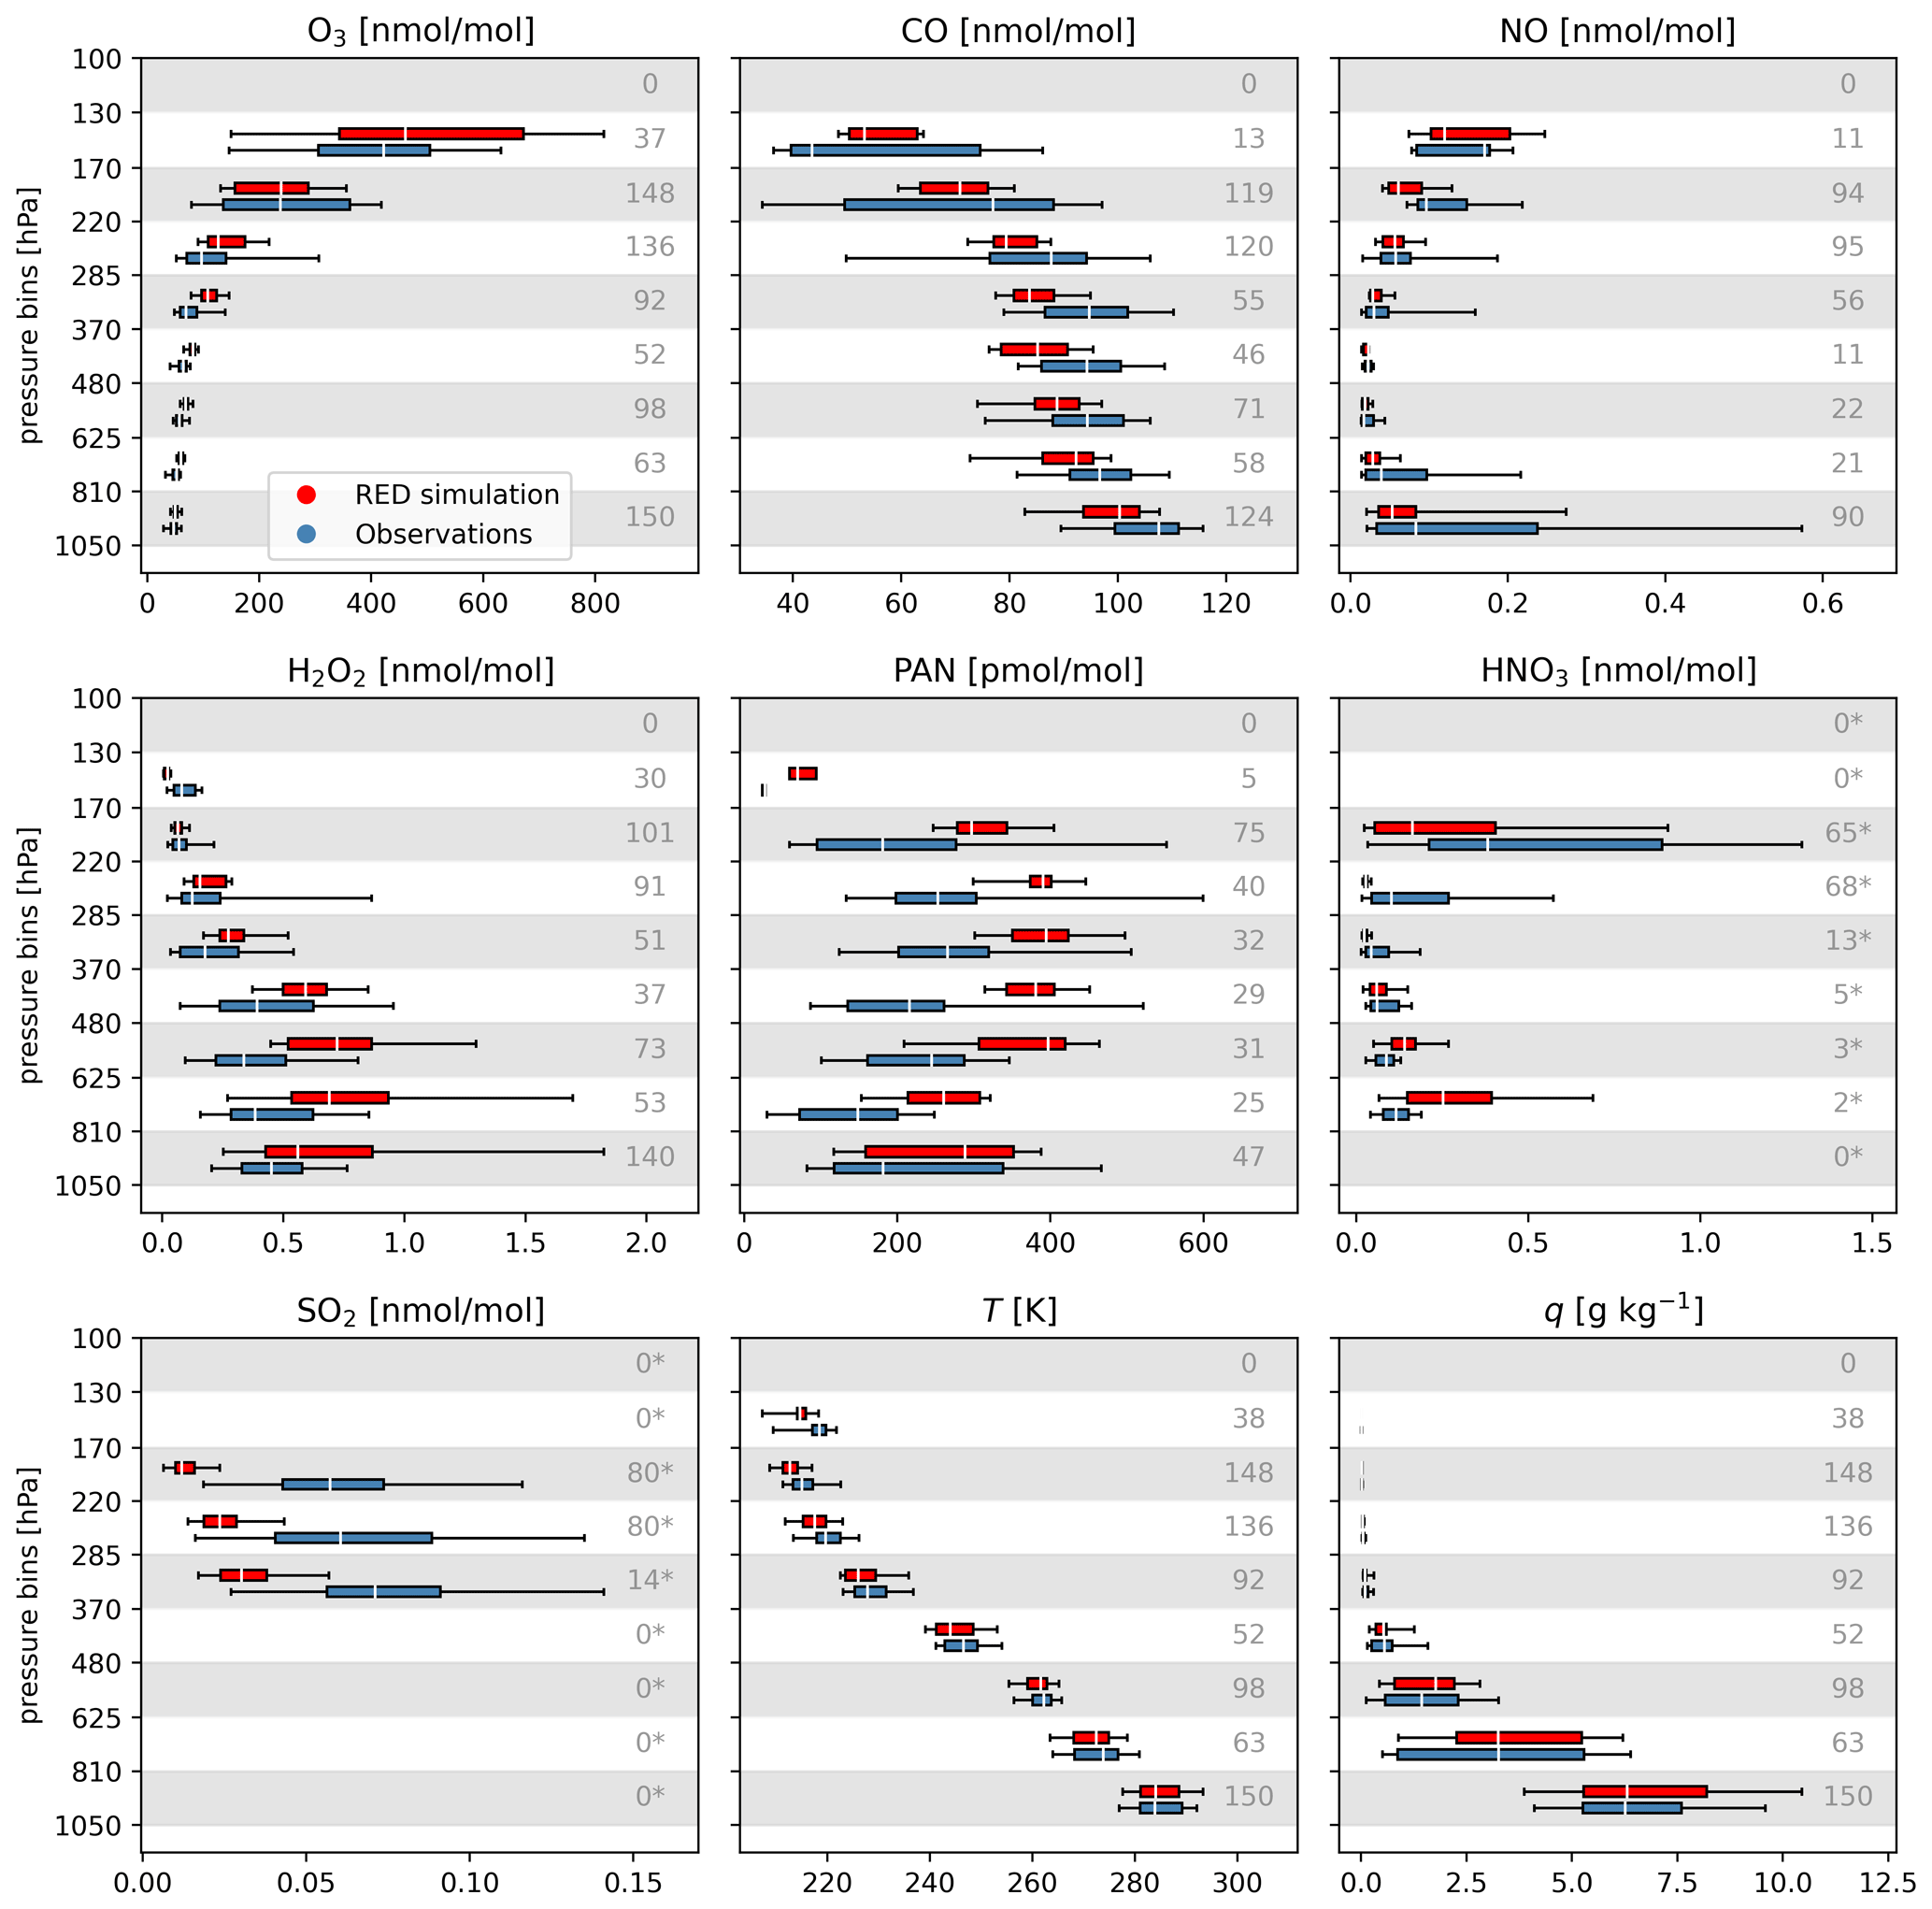
Figure 2Vertical distribution of simulated (red, simulation RED) and observed (blue) tracer mixing ratios and two meteorological variables (T and q), represented by box–whisker plots for pressure bins. The white line marks the median, the box corresponds to lower and upper quartiles, the whiskers represent the 5th–95th percentile. The grey numbers on the right indicate the sample size (number of observed and interpolated simulated data points) for each pressure bin. Simulated values are from the RED simulation, i.e., with reduced emissions and no aerosol–cloud interactions. For HNO3 and SO2 (measured onboard the Falcon aircraft, shown by the grey number marked with asterisks) the domain average of the model results over Europe at the corresponding altitude were used, not the values sampled online on the flight track.
Table 1Summary of model–observation comparison. The same spatiotemporal location was used for all simultaneously available points. NRMSE is the root-mean-squared error normalized by the range of the observations. PF2 denotes the percentage of model points within a factor of 2 of the observations. The column is the average of the simulated and observed data ratios.
Overall, the agreement between the meteorological variables from the model and those observed in the BLUESKY campaign indicates successful initialization and nudging of meteorological variables and that the meteorological conditions during the relevant time period are simulated adequately. As the model is not nudged in the stratosphere or boundary layer (the nudging coefficient is maximal in the free troposphere, Jöckel et al., 2006), the deviation in the upper troposphere between model results and observational data are to be expected due to the intrinsic model dynamics, which deviates from the nudging data. Nevertheless, the temperature bias is much lower than in other EMAC studies, despite the use of same nudging method and coefficients (Jöckel et al., 2016), due to the initialization and shorter simulation time in this work. As temperature and humidity are important quantities regarding cloud formation and accurate wind vectors are key for representing advective processes, the following analyses of atmospheric composition and the effects on radiative transfer build on an accurate representation of the meteorological state of the model.
3.1 Trace gases
More than 94 % of simulated ozone (O3) mixing ratios are within a factor of 2 of the observations (“PF2” value) and the normalized root-mean-squared error of 0.04 is low, with improvements from previous evaluation of the same model (Jöckel et al., 2016). Nevertheless, the model seems to slightly overestimate the observations, as already pointed out in various studies (e.g., Jöckel et al., 2016).
Simulated carbon monoxide (CO) mixing ratios are also in good agreement with the observations, and virtually all simulated values lie within a factor of 2 of the observations. However, especially at lower altitudes, the simulated mixing ratios underestimate the observed values, although the difference between average observations and average model results are well within their respective variability, and the shape of the vertical profile is qualitatively well reproduced. The same holds for nitric oxide (NO), which exhibits a C-shaped profile. The NRMSE for NO is low (0.08) and the average ratio of simulated to observed mixing ratio is 0.99; however, more than a third of simulated values deviate more than a factor of 2 from the observations due to the high variability of this tracer. Specifically, the range of the observed mixing ratios close to the surface is not well reproduced by the model, which results from the short lifetime of NO and the challenge in reproducing its local variation by a global model.
Hydrogen peroxide (H2O2) and peroxyacetyl nitrate (PAN) are less well represented, the average ratios of simulated to observed mixing ratio (2.01 for H2O2 and 1.91 for PAN) indicate an overestimation by the model. Nevertheless, for both species about two-thirds of the simulated points are still within a factor of 2 of the observations (see Fig. 2), and the measured dependence on altitude is captured by the model.
Sulfur dioxide (SO2) was sampled predominantly at high altitudes between 370 to 170 hPa, where it is strongly underestimated by the model. We hypothesize that the systematic underestimation of SO2 concentrations is due to model shortcomings within the stratospheric aerosol chemistry, which will be discussed briefly as part of the following Sect. 3.2. All in all, as summarized in Table 1, there is reasonable agreement between observed and simulated mixing ratios of the trace gases investigated.
3.2 Aerosols
In the comparison between model results and aerosol observations, the instrumental cutoffs have been taken into account; the aerosol log-normal modes in the model have been integrated only in the appropriate range to have a reasonable comparison. In addition, all the measurements and model results are based on location pressure and temperature and are not normalized to Standard Temperature and Pressure (STP).
The vertical profile of the measured aerosol number concentration is qualitatively reproduced (see Fig. 3, with logarithmic scale on the x axis), with a minimum at ≃300 hPa and a maximum at the surface. In the lowest-altitude pressure bin, the range and median of the observations and model results match very well. There are some deviations between 850 and 480 hPa, where simulated number concentrations are larger than the observed ones, although this overestimation is well within the observations' variability. This overestimation dominates the average ratio of modeled to measured values (2.60, see Table 1).
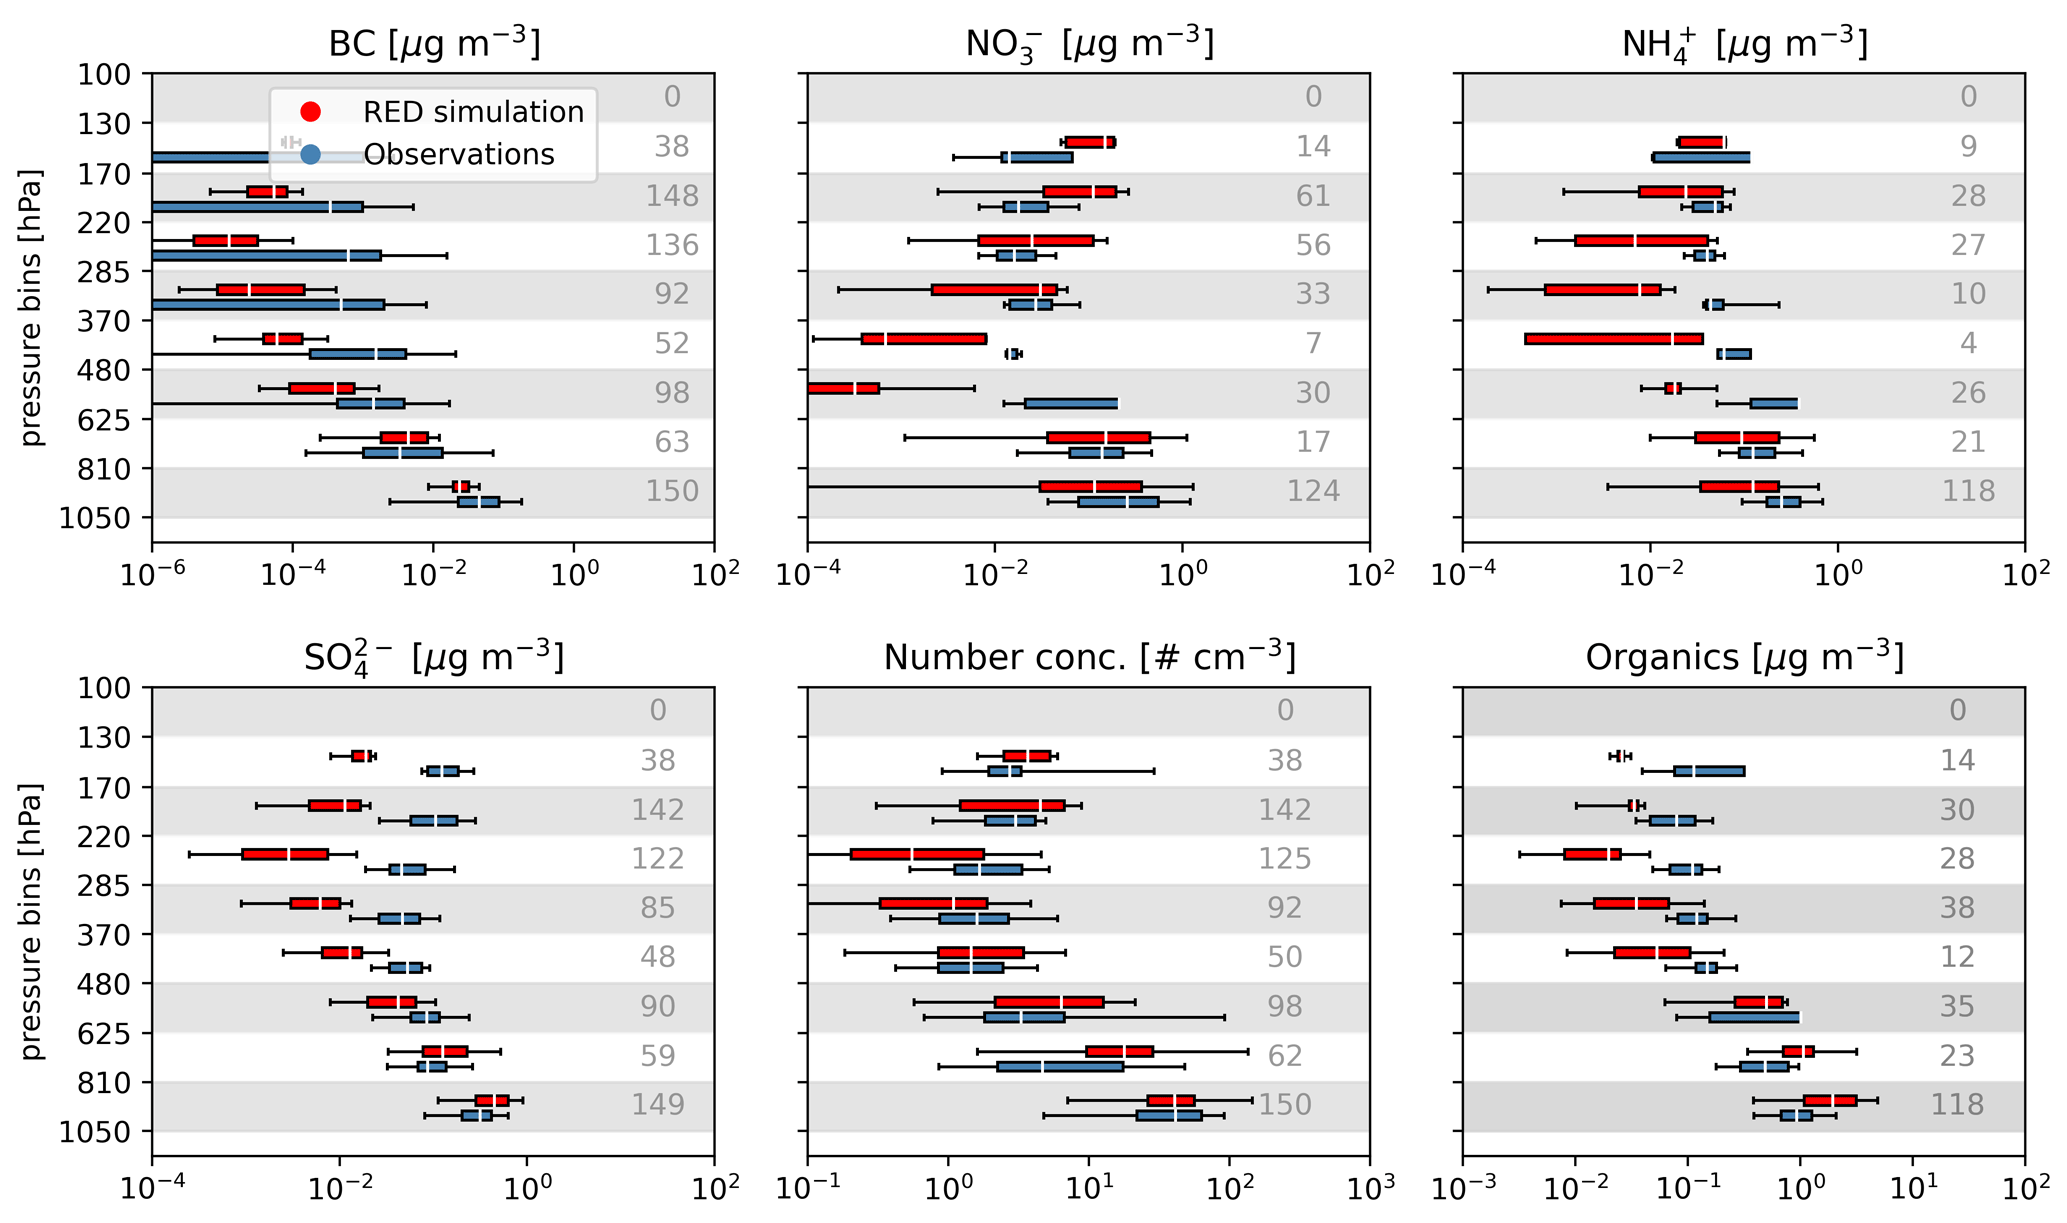
Figure 3The same as Fig. 2 but for aerosols. Please note the logarithmic scale on the x axis.
The measured black carbon (BC) concentrations are captured well by the model close to the surface, while the observational variability is underestimated at high altitudes. The NRMSE of 0.09 is relatively low, as the higher abundance closer to the surface – that is, closer to the sources – is well represented, both in terms of magnitude and variability. A detail analysis of the black carbon concentration simulated with the EMAC model during the BLUESKY campaign can be found in Krüger et al. (2022).
Sulfate () exhibits qualitatively similar features to BC; the relatively high concentrations observed in the lower troposphere are matched by the simulated concentrations, yet there is a significant underestimation of sulfate aerosol concentrations in the upper troposphere.
Between 1050 and 625 hPa simulated organic aerosol concentrations are somewhat larger in the model than in reality; the shape of the vertical profile is, however, qualitatively reproduced.
Nitrate () and ammonium () concentrations close to the surface are generally well reproduced. While at higher altitudes the simulated agrees with the observations, simulated nitrate is too high, which is probably related to the co-located underestimation of sulfate.
The results of the model–measurement comparison are summarized in Table 1. We can observe that there is generally reasonable agreement between simulated and observed trace gases and aerosols with some deviation of the aerosol concentrations, especially in the mid-upper troposphere.
A single emission source causing the model underestimation of BC and sulfate aerosol concentrations in the upper troposphere, e.g., a localized plume of pollution, is judged unlikely, as BC and do not correlate (r<0.01, p=0.90): in fact, mapping observed concentrations to ozone (a tracer of stratospheric air) and carbon monoxide (a tracer of tropospheric air) reveals that high concentrations coincide with high ozone (r=0.83, p<0.01) and low carbon monoxide (, p<0.01) (Fig. 4). A similar, yet weaker, correspondence can be found in the simulated data (see Fig. 4). The strong correlation with ozone in the upper troposphere implies a stratospheric source of sulfate aerosols in both model and reality. It is noteworthy that a precursor for sulfate aerosols, sulfur dioxide, is also systematically underestimated. We assume hence that the high SO2 abundance measured in the upper troposphere has stratospheric origin and is from volcanic eruptions. Many small- and medium-sized eruptions were reported in the year prior to the BLUESKY campaign (https://volcano.si.edu, last access: 30 October 2021), but their influence on the upper troposphere and lower stratosphere is yet to be quantified. We tested this by injecting high levels of SO2 in the stratosphere in additional simulations, mimicking volcanic eruptions that had enough energy to reach the stratosphere, i.e., Raikoke (June) and Ulawun (June and August) in 2019 (see de Leeuw et al., 2021; Kloss et al., 2021). However, this did not affect the concentrations of and significantly (not shown). A partial increase of was obtained by including the volcanic eruption of Taal in January 2020. Nevertheless, this is still not enough to bring the model results close to the observations. We therefore conclude that our observed underestimation of is of stratospheric origin, although it is not fully clear what caused it.
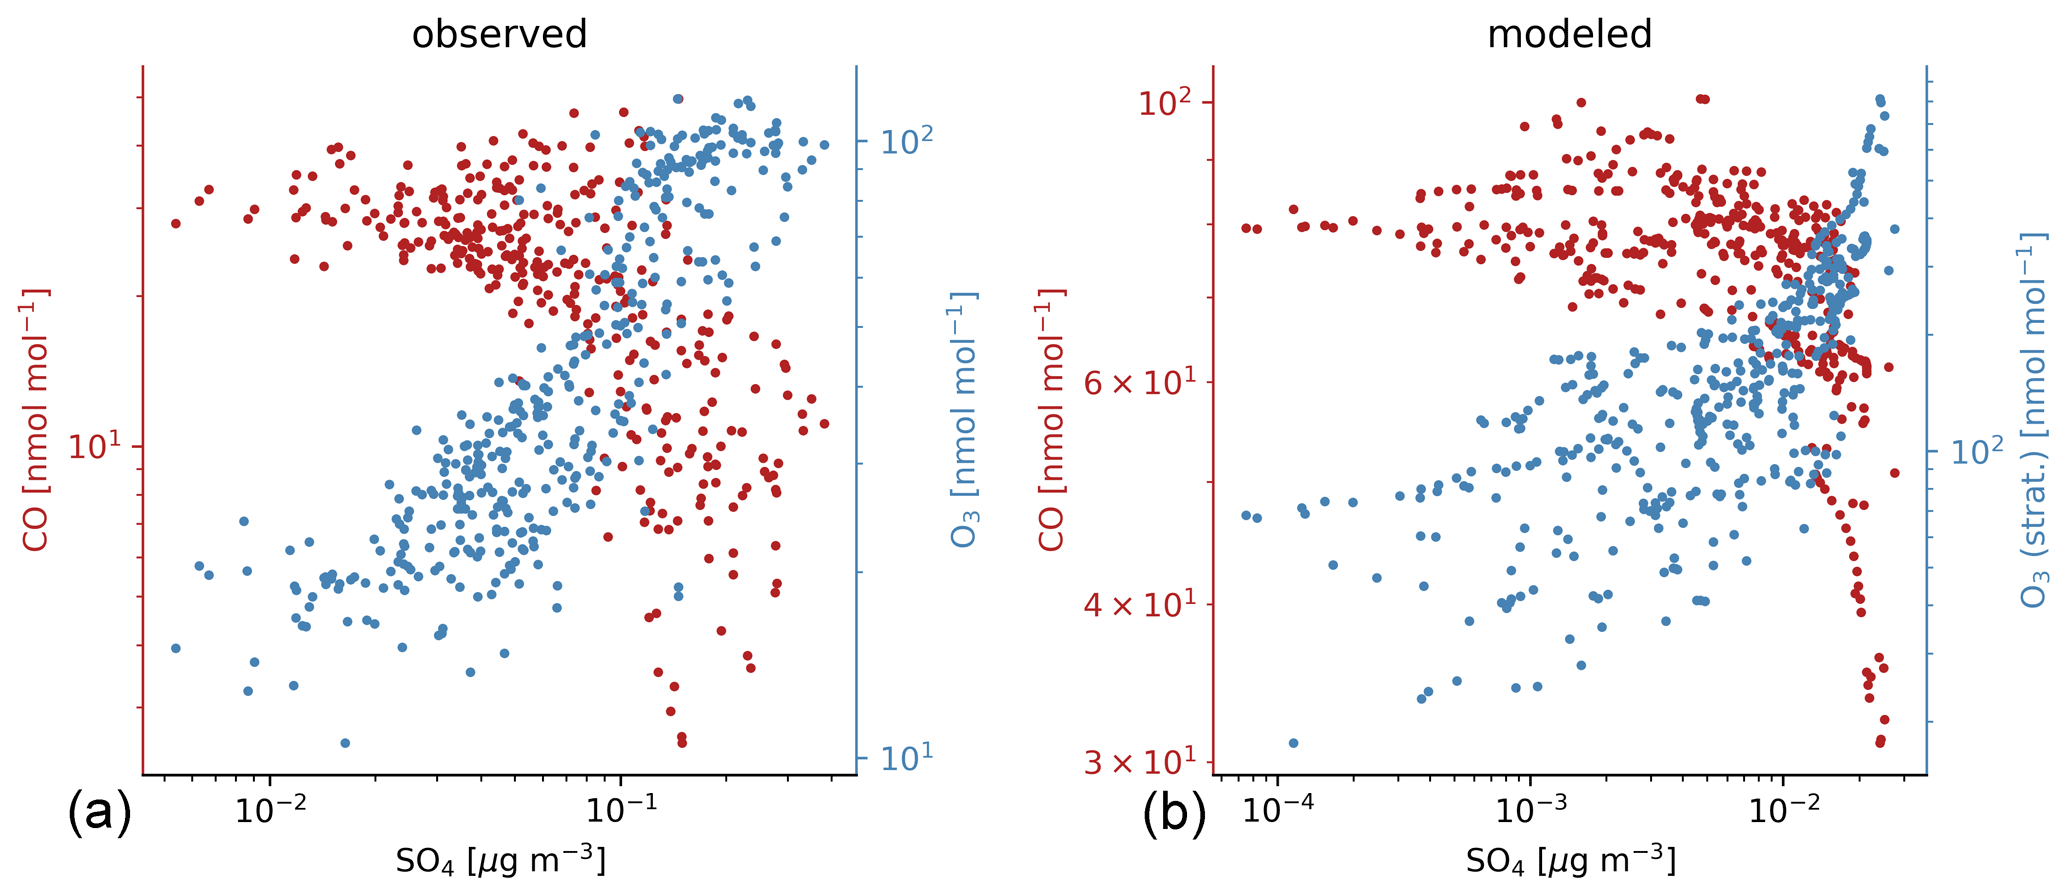
Figure 4Scatter plot of co-located SO4, CO (red), and O3 (blue) abundance between 350 and 150 hPa from observations (a) and the RED simulation (b).
A further partition of the region of interest into three subregions (central Europe, southern Europe, Atlantic) did not reveal substantial spatial dependencies of model deviation from observations (not shown).
To quantify the effect of the lockdown, we use the baseline simulations (BASE and BASECLOUD) in the analyses. We focus on May 2020, as this time period is covered by the measurement campaign and the atmosphere can be expected to have adjusted to the impact of abruptly reduced emissions. We also analyze the impact in an area encompassing Europe (the region of study), i.e., over a longitude–latitude box from −20 to 20∘ E and 30 to 60∘ N (exactly the depicted map sector in Fig. 1).
4.1 Impact on tracers and aerosols
As no difference in dynamics between RED and BASE simulations are present, any chemical differences between these simulations are purely attributable to the different emissions during the lockdown period, as these are the only changes between these two simulations, and the consequent different chemical regimes.
In general, while large absolute changes are expected at the surface, in the upper troposphere (UT) we find the largest relative changes due to the strong influence of the local emissions and to the low mixing ratios of most of the species investigated (see Fig. 5). Large relative changes in the UT are found for NO, SO2, and BC, with a strong reduction (∼50 % or more) in the region between 200 and 300 hPa, i.e., the typical aircraft cruise altitude. The reduced air traffic during the lockdown period greatly decreased the emissions of nitrogen oxides into the UT, and the effects of the lockdown on other tracers in the UT are mostly a result of this strong reduction. Hydroxyl radicals (OH) decrease by roughly 20 % in the UT and 5 % elsewhere in the troposphere, a direct effect of a reduced OH recycling by NOx. Despite the reduced OH, carbon monoxide does not increase due to the decrease in the direct emissions. The overall effect of the lockdown for most tracers is a combination of reduced emissions and reduced sinks (i.e., oxidation via OH): while this is well balanced for CO (changes on the order of few percent), for SO2 the emission reductions are larger than the decrease in the reaction with OH, causing its mixing ratio to be reduced (up to 50 % in the UT) compared to the baseline scenario.
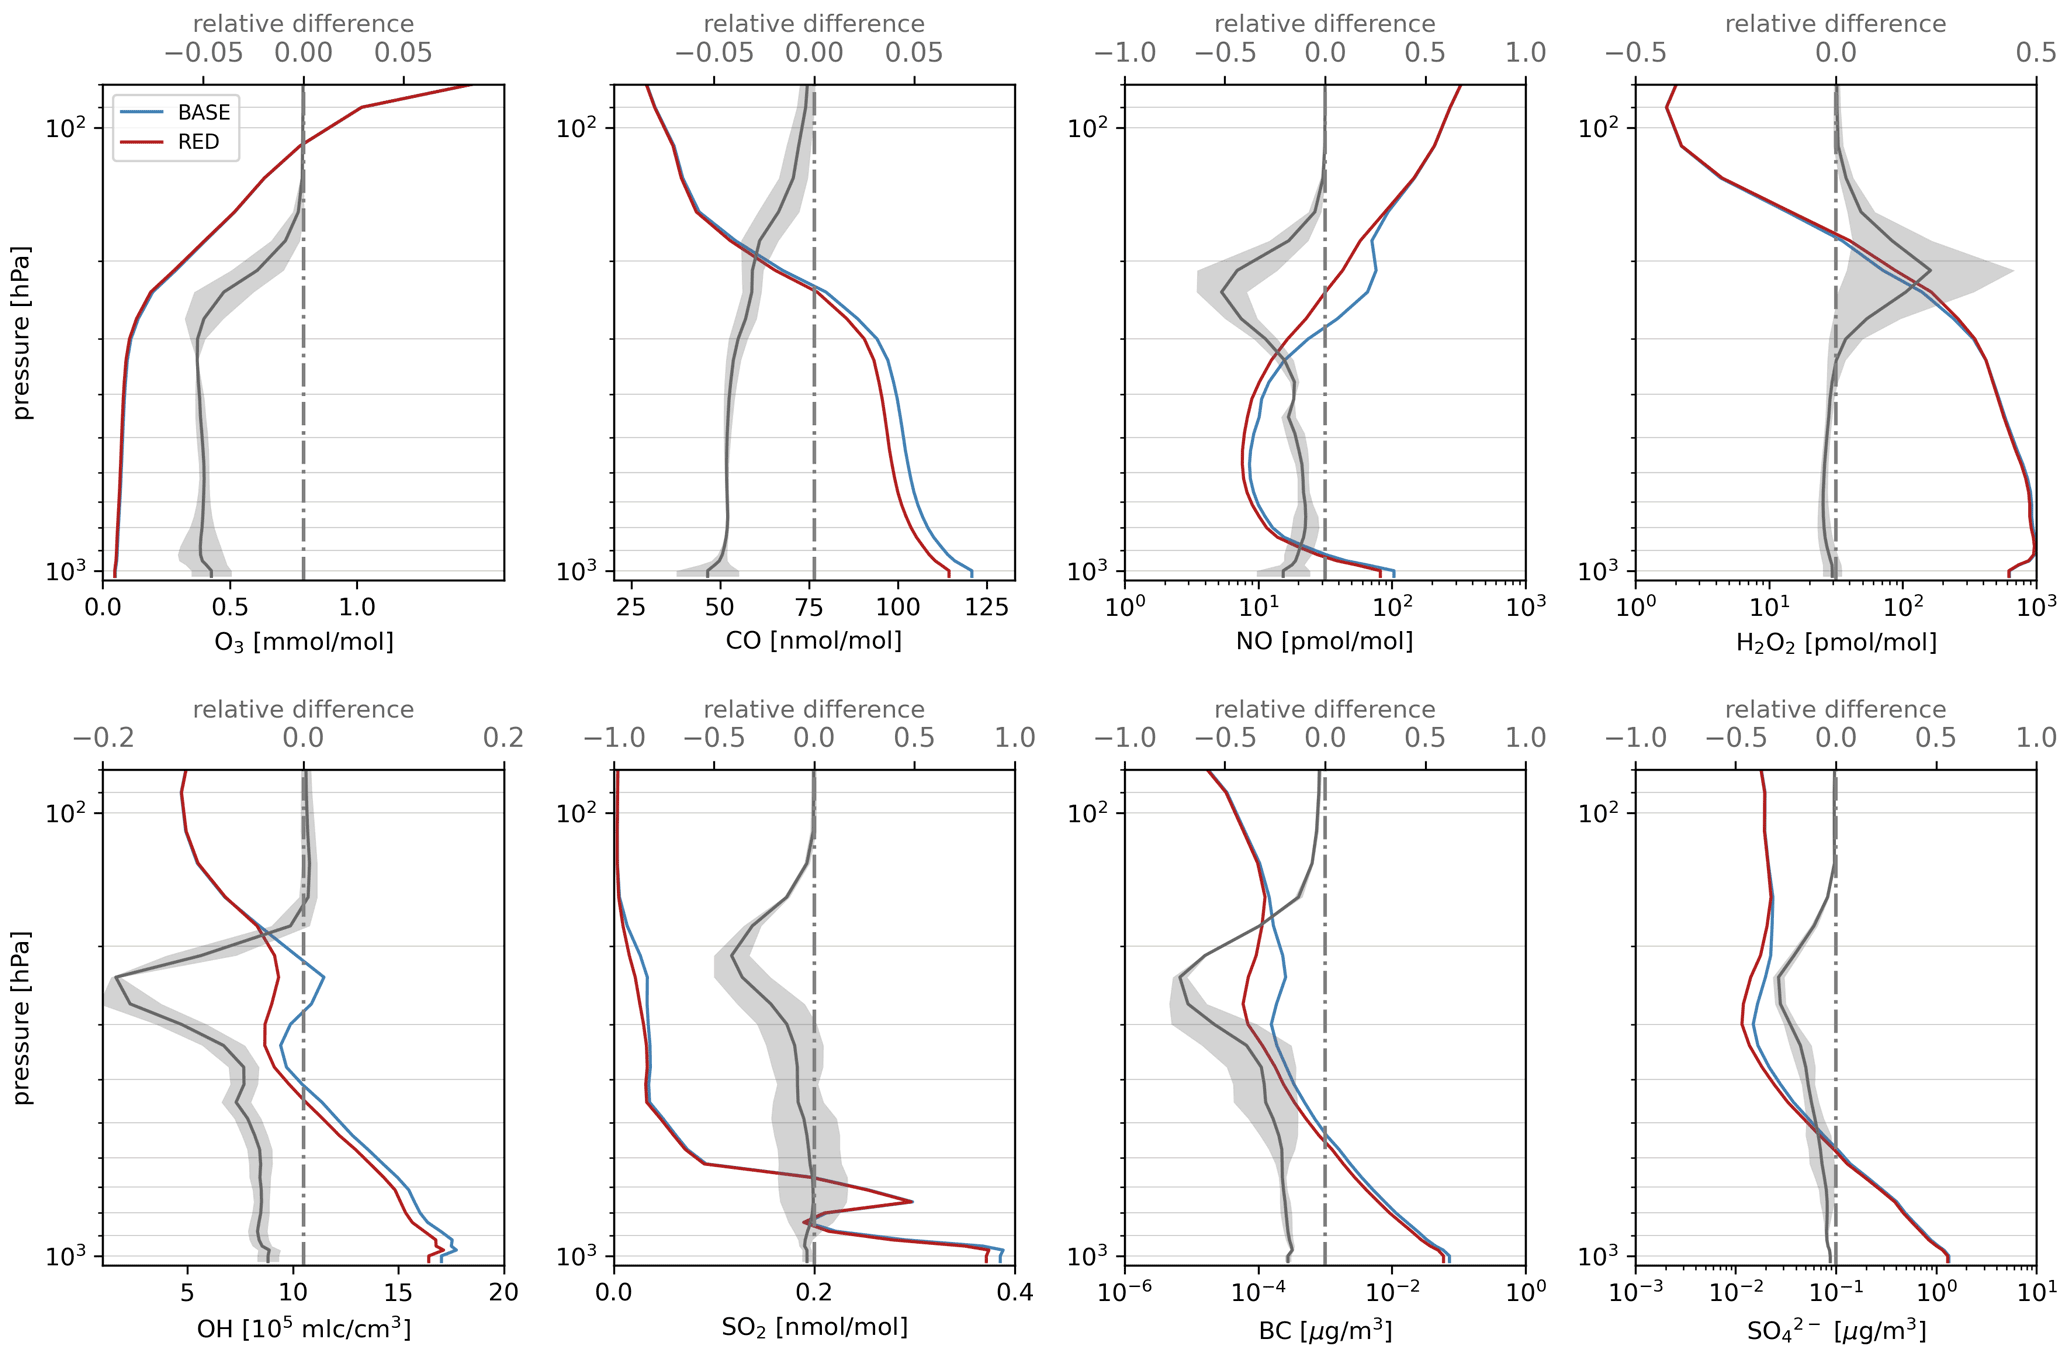
Figure 5Vertical profiles from BASE and RED simulations and their relative difference (). The grey area represents 1 standard deviation of the spatial–temporal mean (grey line). Please note the different scales for the relative differences.
Similar to the trace gases, for most aerosols the lockdown reduces their concentration mostly at the surface, although the largest relative differences are simulated in the UT due to the low concentration at these altitudes. For example, sulfate is subject to a large relative change in the UT but to much larger absolute changes close to the surface, mimicking the changes in SO2 (see also Fig. 6). Furthermore, BC decreases significantly in the whole troposphere due to the strong reduction of the emissions both at the surface and in the UT (from aircraft).
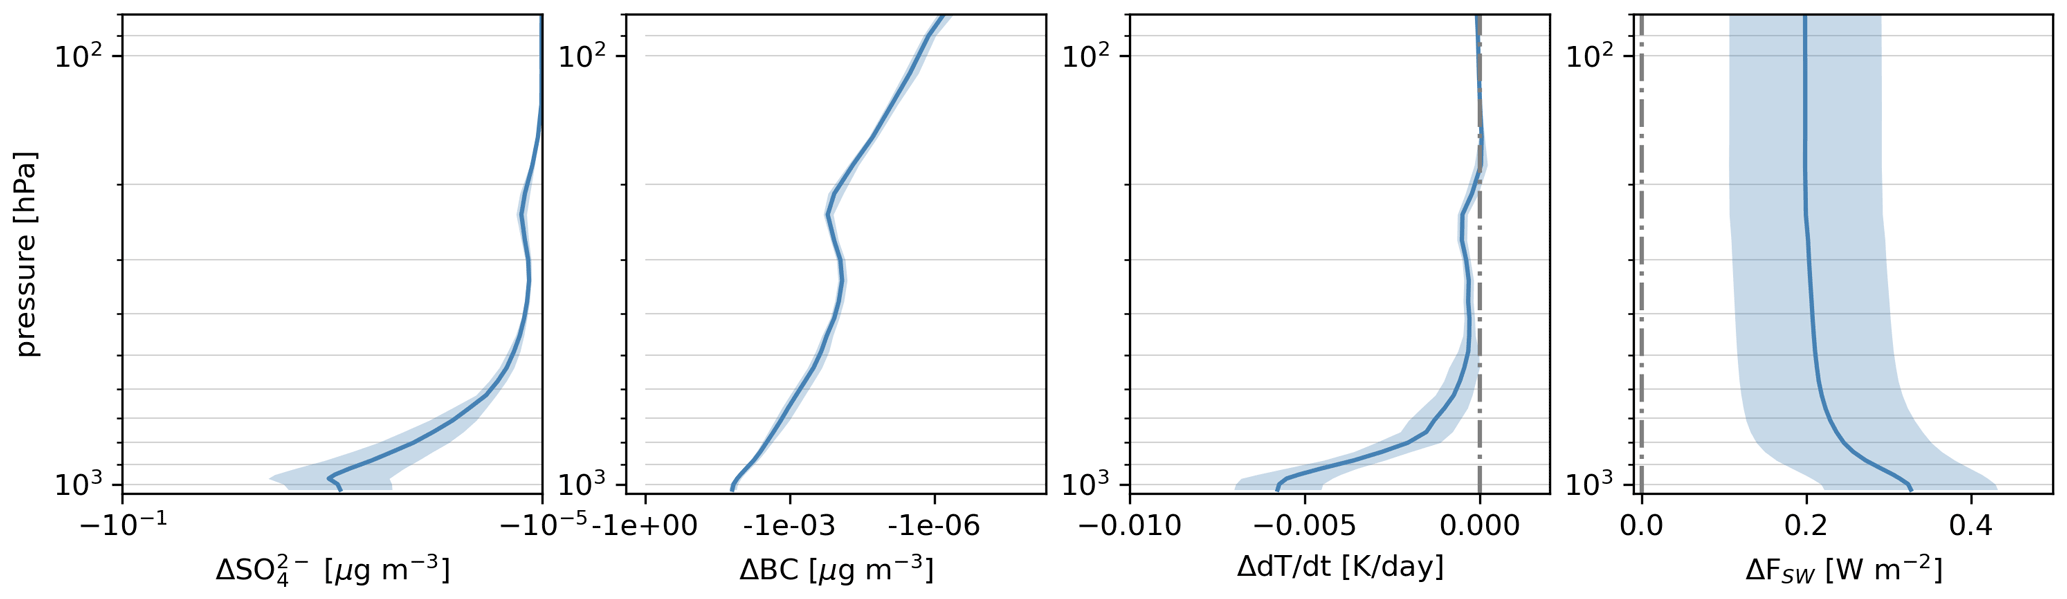
Figure 6Vertical profiles of the difference in monthly mean sulfate mass concentration (), black carbon mass concentration (BC), heating rate (), and net shortwave flux (FSW) between the reduced emission scenario RED and the standard emission scenario BASE. Shortwave flux and shortwave heating are derived under clear-sky conditions. The shading indicates 1 standard deviation of the monthly mean difference. Note the logarithmic horizontal axis for the two plots on the left.
While the changes in CO and NO can be considered significant and representative of the real atmospheric changes (due to the low bias at all tropospheric levels between model results and observations), changes in the aerosol components should be considered with caution, as these are generally smaller than the bias between the model results and the observations.
4.2 Impact on shortwave radiation
As the model is nudged in the troposphere (i.e., constrained air temperature with prescribed sea surface temperatures) and free to adjust dynamics of the stratosphere, we report here RF (radiative forcing) values (Myhre et al., 2013). For the same reason (i.e. tropospheric nudging), we mostly focus the analyses on the shortwave flux FSW and its induced heating rate in the area encompassing Europe, as these are directly influenced by the aerosols changes and are not strongly influenced by the numerical forcing.
4.2.1 Direct effects
Aerosols directly impact the radiation balance by absorption and scattering of electromagnetic waves. Compared to the baseline emissions, the monthly mean sulfate (and inorganic aerosols, not shown) and black carbon concentrations are reduced in the entire troposphere, with a strong relative reduction at the commercial flight level (around 200 hPa; see Fig. 6). Furthermore, the mean aerosol (number) concentrations were reduced in the scenario with reduced emissions due to lockdown throughout the whole air column (see Fig. 8 and Sect. 4.2.2), with the reduction being most pronounced between 300 and 200 hPa. Based on model results from a sensitivity simulation, where only the aircraft emissions were reduced compared to the BASE simulation, we estimated that more than 90 % of the reduced aerosol numbers between 300 and 200 hPa over Europe are due to reduced aircraft emissions.
We calculate the simulated difference in the downwelling shortwave flux between simulation RED and STD, i.e., the impact of the reduced emissions on the SW radiation. Here only the aerosol contribution is estimated, removing any radiative effect from changes in trace gases (e.g., ozone) within the Europe longitude–latitude box for May 2020. The differences are largest over continental central Europe and lowest over northern Scandinavia (Fig. 7), with no large spatial gradients over Europe. In virtually all regions there is more downwelling shortwave radiation in the reduced-emission scenario. Spatially averaged at ground level within the European domain, there is an increase of 0.33 ± 0.10 W m−2 under clear-sky conditions (i.e., no clouds) compared to the baseline scenario, while at the TOA the increase is 0.20 ± 0.09 W m−2. This increase, together with the reduced heating rates of ambient air, is indicative of a reduction in shortwave scattering and absorption, due to the reduced inorganic aerosol and black carbon concentrations, i.e., the lockdown contributed to make the atmosphere more transparent to SW radiation. The column-integrated contribution of backscatter and absorption can be estimated from the radiation values at TOA and surface, indicating that during lockdown the total backscatter (clear sky) of SW radiation has been decreased by 0.26 ± 0.07 W m−2, while the total absorption (clear sky) was decreased by 0.06 ± 0.05 W m−2. Based on an additional sensitivity simulations, in which only individual emissions (i.e., of BC, SO2, NO) have been reduced, we found that slightly more than one-third of the absorption reduction is caused by the BC decrease.
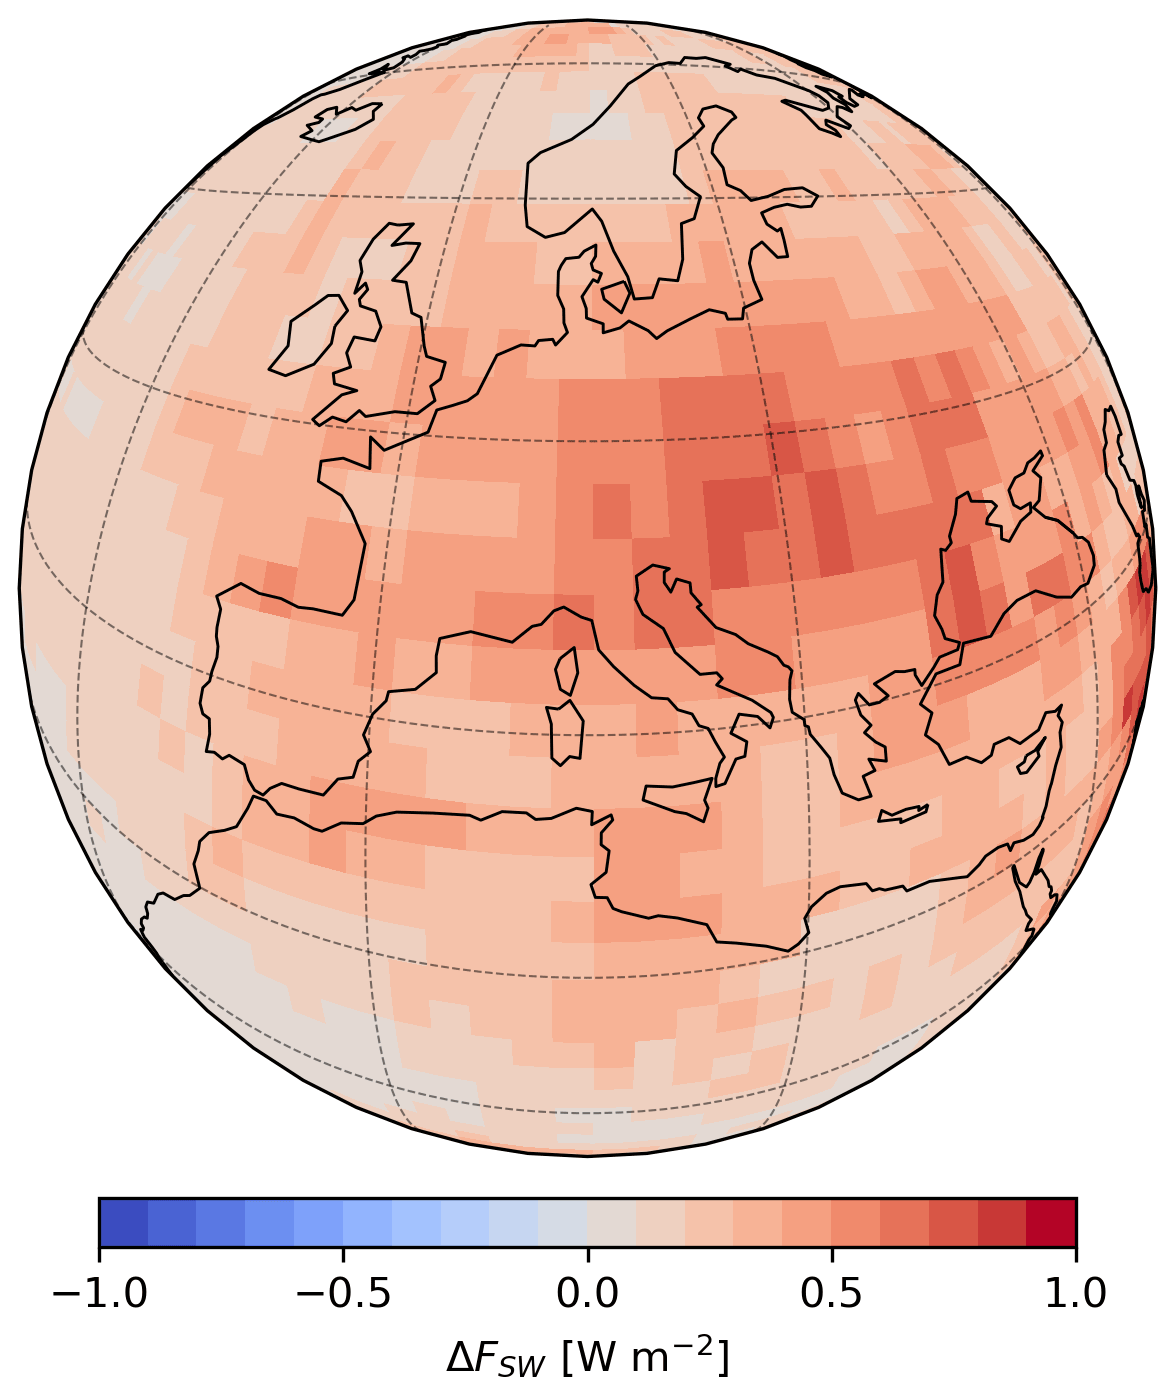
Figure 7Difference in monthly mean clear-sky shortwave radiation (May 2020) at the surface between RED and BASE simulation. Positive (red) values indicate more incoming radiation at the surface due to less absorption and backscattering in the “lockdown” atmosphere than in the baseline scenario. Note that we used a common reduction factor for emissions from countries outside Europe.

Figure 8Vertical profiles of the monthly mean ice crystal number concentration (ICNC), cloud droplet number concentration (CDNC), aerosol number concentration (N), and ice crystal effective radius (r) of the reduced-emission scenario REDCLOUD (red), the standard emission scenario BASECLOUD (blue), and their relative difference (grey line) for May 2020 over Europe. The grey area denotes the spatial and temporal standard deviation of the relative difference.
Reduced scattering by aerosol particles plays a larger role, as the “net” (i.e., the difference attributable to the lockdown) shortwave flux is positive in the whole air column; on the other hand, reduced absorption dominates the shortwave component of direct aerosol effects in the boundary layer, as clearly shown in Fig. 6. The heating of ambient air exhibits a local minimum in the upper troposphere, which is, however, small compared to that in the lower troposphere. We calculate the surface integral of the accumulated heating due to shortwave fluxes, only attributable to aerosols under clear-sky conditions: the difference in the atmospheric layer directly above the surface is −0.005 ± 0.001 K d−1, i.e., less heating of the boundary layer in the lockdown conditions compared to normal emissions. Based on a sensitivity simulation similar to RED but without any reduction in BC, we found that the decreased heating is by 40 % to the reduced absorption by BC during the lockdown conditions, causing a cooling of the atmosphere (through SW radiation) despite an increase of the incoming radiation. Both the changes in heating and shortwave flux are solely attributable to the different aerosol burden in the BASE and RED simulations.
We also estimated the RFari Myhre et al. (2013) due to COVID-19 lockdown against the baseline scenario, by also including the longwave radiation. We obtained an RFari equal to 0.08 ± 0.03 for all-sky measurements over Europe in May 2020 at the TOA. This value, despite only accounting for a limited amount of the anthropogenic aerosols (the lockdown did not remove all anthropogenic emissions) and only referring to Europe, is within the range suggested by Bellouin et al. (2020, see Table 5).
4.2.2 Aerosol–cloud interactions
In Fig. 8, the vertical distributions of the total aerosol number concentration (N, including all aerosol sizes), ice crystal number concentration (ICNC), cloud droplet number concentration (CDNC), and ice crystal radius (r) are shown for Europe for both simulations, BASECLOUD and REDCLOUD. Additionally, the SW flux at the TOA and the surface have been calculated from these coupled aerosol–cloud simulations (see Table 2) for both the total effect (i.e., direct plus indirect) and the indirect effect (i.e., neglecting any direct radiation influence of the aerosol particles). Due to the short simulation period, the difference between these simulations is much smaller than its variability, represented by its spatial and temporal standard deviation. Nevertheless, comparing the vertical distribution of number concentrations of aerosols, ice crystals, and cloud droplets, the largest relative difference between BASECLOUD and REDCLOUD (i.e., the two simulations where the aerosol–cloud feedback is activated) is found for the aerosol number concentration between 200 and 300 hPa. These are the cruise altitudes at which the largest aircraft emissions are injected in the model, and therefore these differences can be directly connected to the reduced air traffic present during the lockdown (REDCLOUD). As this altitude is somewhat higher than the typical (cold) cloud altitude, the effect on clouds is less pronounced. At the highest level of these clouds (see Fig. 8) the ICNC are reduced (by ≃30 % at 250 hPa, although with large variability), while no visible effect is found for CDNC. These results are in line with those obtained by Righi et al. (2021), who showed that aircraft emissions do increase ice crystal number concentration, although their results were not statistically significant. The ice crystal effective radius seems to be the least affected by the reduced emissions during the COVID-19 lockdown, with a negligible absolute and relative difference.
Table 2Aerosol direct and indirect effects on the shortwave radiation flux at the top of atmosphere (TOA) and surface (SRF) over Europe for May compared to baseline scenario. Note that direct effects are derived from BASE and RED simulations, and indirect and total (i.e., direct plus indirect) effects from BASECLOUD and REDCLOUD. The indirect effect of clear-sky estimation is obviously equal to zero, but it was included to confirm the validity of the calculations.
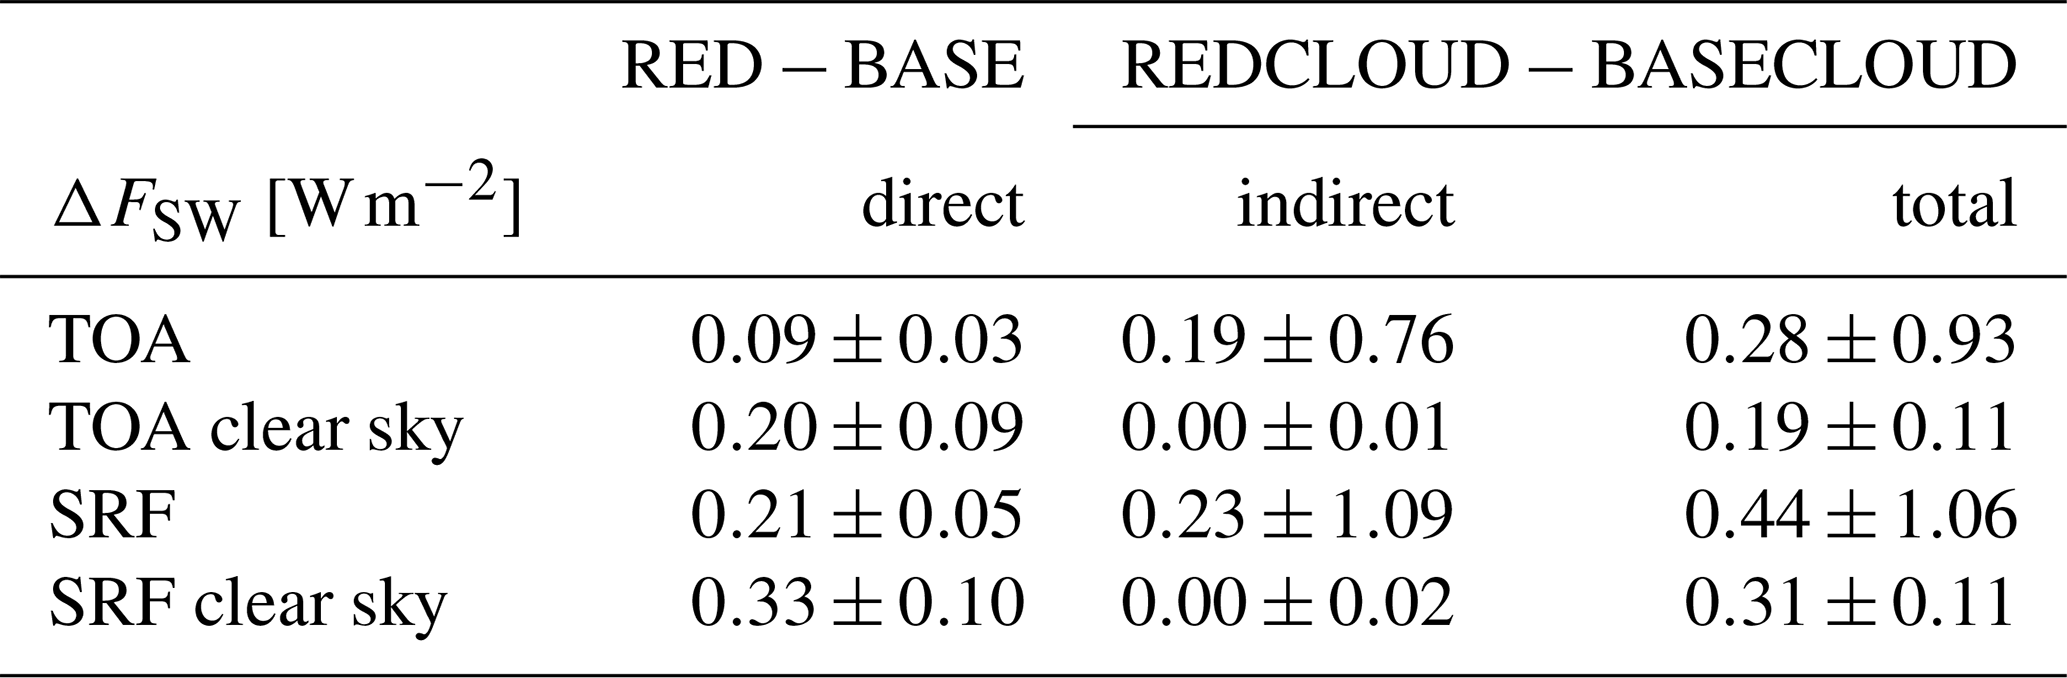
To investigate the effect of reduced aircraft emissions on the SW flux via the indirect aerosol effect at the TOA and surface (SRF), the mean differences in SW flux between REDCLOUD and BASECLOUD for May were calculated over Europe. Positive values indicate greater reflection of SW radiation back to space (for TOA) or more absorption through the troposphere (for surface values) in the BASECLOUD simulation compared to the REDCLOUD simulation. The mean surface differences are 0.31 ± 0.11 W m−2 for the clear-sky case and 0.44 ± 1.06 W m−2 for the all-sky case. At the TOA the mean differences in shortwave fluxes are 0.19 ± 0.11 W m−2 (clear sky) and 0.28 ± 0.93 W m−2 (all sky, Table 2). We should note that the clear-sky results agree with the direct effect estimated in Sect. 4.2.1 but with different simulations, confirming the consistency of the calculations. Thus, the indirect effect of aerosols enhances the direct effect on the SW radiation during the lockdown, even with larger intensity. However, those values are associated with large standard deviations related to the strong spatial variability of the upward shortwave radiation difference between the simulations.
The total RFaci due to COVID-19 lockdown against the baseline scenario was also estimated. We obtained a value of 0.19 ± 0.92 for all-sky measurements over Europe in May 2020 at the TOA. Similarly to RFari, this value is also in line with the range suggested by Bellouin et al. (2020, see Table 5), keeping in mind that only a partial reduction of anthropogenic aerosols took place during the COVID-19 lockdown. Although the average value agrees with the literature, a large standard deviation is associated to RFaci, and thus the estimate should be used with caution as it is not statistically significant.
We simulated the effects of drastically reduced anthropogenic emissions on the atmospheric composition in Europe during the COVID-19 lockdown in spring 2020. We evaluated the model simulations with observations obtained during the aircraft measurement campaign BLUESKY. The overall agreement between the observations and the simulated aerosol concentrations and trace gas mixing ratios is reasonable. Nevertheless, problems remain regarding stratosphere–troposphere transport, especially of volcanic influence, which resulted in systematically underestimated SO2 and of stratospheric origin and a consequent overestimation of (which substitutes the underestimated sulfate in ammonium salts; see Bauer et al., 2007; Seinfeld and Pandis, 2008; Xu and Penner, 2012) in the upper troposphere.
Focusing on the effects of aerosol particles on the shortwave radiation budget, we find that their reduction due to lockdown leads to a net clear-sky SW flux increase of 0.33 ± 0.10 and 0.20 ± 0.09 W m−2 at surface level and TOA over Europe, respectively. The increase of the SW radiation during the lockdown period is due to the decrease in both black carbon and inorganic aerosols, which made the atmosphere more transparent to the incoming solar radiation by reducing SW absorption and SW backscatter, with the latter dominating. It must be stressed that although this BC reduction causes an increase in the SW incoming radiation, the SW heating has also been reduced by up to 0.005 K d−1 due to the lowered BC absorption.
With reduced emissions, the model simulates a lower number concentration of aerosols between 300 and 50 hPa; this reduction is located at an altitude too high to influence the cloud droplet formation (Karydis et al., 2017) and heterogeneous ice nucleation from black carbon and dust; glassy organics freeze at these altitudes, but their contribution is totally negligible in comparison with homogeneous nucleation (Bacer et al., 2021). The analysis of the indirect aerosol effect did not give any conclusive results due to the large variability in the calculations caused by the short duration of the lockdown “experiment”.
Note that contrails and their contribution to radiative forcing are not considered in this study. Contrails are expected to reduce solar radiation reaching the Earth surface and to reduce outgoing longwave radiation. The mean changes induced by reduced air traffic in 2020 compared to 2019, computed in two model studies, were of the order of −0.1 to 0.5 W m−2 over Europe (Gettelman et al., 2021; Schumann et al., 2021b), with a magnitude comparable to what is found in this study. The differences between these studies can partly be attributed to the applied methodologies and general difficulties in discriminating anthropogenic effects from interannual variability. Hence, a study which considers contrail and aerosol effects simultaneously and covers a longer time period is recommended to better attribute the causes of the observed changes .
The Modular Earth Submodel System (MESSy) is continuously further developed and applied by a consortium of institutions. The usage of MESSy and access to the source code is licensed to all affiliates of institutions that are members of the MESSy Consortium. Institutions can become a member of the MESSy Consortium by signing the MESSy Memorandum of Understanding. More information can be found on the MESSy Consortium Website (http://www.messy-interface.org, last access: 22 July 2022; MESSy, 2022). The code presented here has been based on MESSy version 2.55 and is available as git commit #dcdc3ed8 in the MESSy repository.
The observational data and the model results are available on the HALO (High Altitude Long RAnge research aircraft) database (https://doi.org/10.17616/R39Q0T, DLR, 2022), upon signing the data protocol.
AP and SR planned the research. AP and SR collected and prepared the emission data. AM implemented code corrections for aerosol–cloud interactions. AP performed the model simulations. PJ contributed to the overall model development and helped with the preparation of the model setups. SB helped the interpretation of aerosol–cloud interactions. MK provided the script for the aerosol mass estimation in the model. ZH, IT, LR, DJC, and HF provided the data for CO, NO, and H2O2. JS and KK provided observational aerosol composition data. RD and JNC were responsible for the PAN measurements. CV, LT, and AM provided observational data of HNO3 and SO2. AZ provided the ozone data. OK, BH, CP, MP, and UP conducted, analyzed, and interpreted the BC data. BB contributed to the campaign. MD organized the field campaign logistically. JC planned the flight tracks during the campaign. HS coordinated the measurements on the FALCON. SR and AP performed the model evaluation and analysis of direct effects. AM and AP performed the analysis of indirect effects. US and AP discussed the results on the radiative forcing. SR, AM, and AP wrote the manuscript with the help of SB, JC, MK, and JW. AP and JL supervised the project. All authors discussed the results and contributed to the review and editing of the manuscript.
At least one of the (co-)authors is a member of the editorial board of Atmospheric Chemistry and Physics. The peer-review process was guided by an independent editor, and the authors also have no other competing interests to declare.
Publisher's note: Copernicus Publications remains neutral with regard to jurisdictional claims in published maps and institutional affiliations.
This article is part of the special issues “BLUESKY atmospheric composition measurements by aircraft during the COVID-19 lockdown in spring 2020” and “The Modular Earth Submodel System (MESSy) (ACP/GMD inter-journal SI)”. It is not associated with a conference.
Christiane Voigt, Laura Tomsche, and Andreas Marsing have been supported by the Helmholtz-Gemeinschaft (grant no. W2/W3-060) and the Deutsche Forschungsgemeinschaft (grant nos. TRR 301 – Project-ID 428312742 and SPP 1294 HALO – VO 1504/7-1).
Birger Bohn received funding from the grant BO 1580/5-1 within the HALO-SPP.
The article processing charges for this open-access publication were covered by the Max Planck Society.
This paper was edited by Pedro Jimenez-Guerrero and reviewed by two anonymous referees.
Bacer, S., Sullivan, S. C., Karydis, V. A., Barahona, D., Krämer, M., Nenes, A., Tost, H., Tsimpidi, A. P., Lelieveld, J., and Pozzer, A.: Implementation of a comprehensive ice crystal formation parameterization for cirrus and mixed-phase clouds in the EMAC model (based on MESSy 2.53), Geosci. Model Dev., 11, 4021–4041, https://doi.org/10.5194/gmd-11-4021-2018, 2018. a, b
Bacer, S., Sullivan, S. C., Sourdeval, O., Tost, H., Lelieveld, J., and Pozzer, A.: Cold cloud microphysical process rates in a global chemistry–climate model, Atmos. Chem. Phys., 21, 1485–1505, https://doi.org/10.5194/acp-21-1485-2021, 2021. a, b
Barahona, D. and Nenes, A.: Parameterizing the competition between homogeneous and heterogeneous freezing in ice cloud formation – polydisperse ice nuclei, Atmos. Chem. Phys., 9, 5933–5948, https://doi.org/10.5194/acp-9-5933-2009, 2009. a
Barré, J., Petetin, H., Colette, A., Guevara, M., Peuch, V.-H., Rouil, L., Engelen, R., Inness, A., Flemming, J., Pérez García-Pando, C., Bowdalo, D., Meleux, F., Geels, C., Christensen, J. H., Gauss, M., Benedictow, A., Tsyro, S., Friese, E., Struzewska, J., Kaminski, J. W., Douros, J., Timmermans, R., Robertson, L., Adani, M., Jorba, O., Joly, M., and Kouznetsov, R.: Estimating lockdown-induced European NO2 changes using satellite and surface observations and air quality models, Atmos. Chem. Phys., 21, 7373–7394, https://doi.org/10.5194/acp-21-7373-2021, 2021. a
Bauer, S. E., Koch, D., Unger, N., Metzger, S. M., Shindell, D. T., and Streets, D. G.: Nitrate aerosols today and in 2030: a global simulation including aerosols and tropospheric ozone, Atmos. Chem. Phys., 7, 5043–5059, https://doi.org/10.5194/acp-7-5043-2007, 2007. a
Bellouin, N., Quaas, J., Gryspeerdt, E., Kinne, S., Stier, P., Watson-Parris, D., Boucher, O., Carslaw, K. S., Christensen, M., Daniau, A.-L., Dufresne, J.-L., Feingold, G., Fiedler, S., Forster, P., Gettelman, A., Haywood, J. M., Lohmann, U., Malavelle, F., Mauritsen, T., McCoy, D. T., Myhre, G., Mülmenstädt, J., Neubauer, D., Possner, A., Rugenstein, M., Sato, Y., Schulz, M., Schwartz, S. E., Sourdeval, O., Storelvmo, T., Toll, V., Winker, D., and Stevens, B.: Bounding Global Aerosol Radiative Forcing of Climate Change, Rev. Geophys., 58, e2019RG000660, https://doi.org/10.1029/2019RG000660, 2020. a, b, c, d, e
Brinkop, S. and Roeckner, E.: Sensitivity of a general circulation model to parameterizations of cloud–turbulence interactions in the atmospheric boundary layer, Tellus A, 47, 197–220, 1995. a
Christensen, M. W., Jones, W. K., and Stier, P.: Aerosols enhance cloud lifetime and brightness along the stratus-to-cumulus transition, P. Natl. Acad. Sci. USA, 117, 17591–17598, https://doi.org/10.1073/pnas.1921231117, 2020. a
de Leeuw, J., Schmidt, A., Witham, C. S., Theys, N., Taylor, I. A., Grainger, R. G., Pope, R. J., Haywood, J., Osborne, M., and Kristiansen, N. I.: The 2019 Raikoke volcanic eruption – Part 1: Dispersion model simulations and satellite retrievals of volcanic sulfur dioxide, Atmos. Chem. Phys., 21, 10851–10879, https://doi.org/10.5194/acp-21-10851-2021, 2021. a
Deckert, R., Jöckel, P., Grewe, V., Gottschaldt, K.-D., and Hoor, P.: A quasi chemistry-transport model mode for EMAC, Geosci. Model Dev., 4, 195–206, https://doi.org/10.5194/gmd-4-195-2011, 2011. a
DLR: Mission: BLUESKY, HALO database [data set], https://doi.org/10.17616/R39Q0T, 2022. a
Ervens, B., Turpin, B. J., and Weber, R. J.: Secondary organic aerosol formation in cloud droplets and aqueous particles (aqSOA): a review of laboratory, field and model studies, Atmos. Chem. Phys., 11, 11069–11102, https://doi.org/10.5194/acp-11-11069-2011, 2011. a
Evangeliou, N., Platt, S. M., Eckhardt, S., Lund Myhre, C., Laj, P., Alados-Arboledas, L., Backman, J., Brem, B. T., Fiebig, M., Flentje, H., Marinoni, A., Pandolfi, M., Yus-Dìez, J., Prats, N., Putaud, J. P., Sellegri, K., Sorribas, M., Eleftheriadis, K., Vratolis, S., Wiedensohler, A., and Stohl, A.: Changes in black carbon emissions over Europe due to COVID-19 lockdowns, Atmos. Chem. Phys., 21, 2675–2692, https://doi.org/10.5194/acp-21-2675-2021, 2021. a
Forster, P. M., Forster, H. I., Evans, M. J., Gidden, M. J., Jones, C. D., Keller, C. A., Lamboll, R. D., Quéré, C. L., Rogelj, J., Rosen, D., Schleussner, C.-F., Richardson, T. B., Smith, C. J., and Turnock, S. T.: Current and future global climate impacts resulting from COVID–19, Nat. Clim. Change, 10, 913–919, https://doi.org/10.1038/s41558-020-0883-0, 2020. a, b, c
Fountoukis, C. and Nenes, A.: ISORROPIA II: a computationally efficient thermodynamic equilibrium model for K+–Ca2+–Mg2+––Na+–––Cl−–H2O aerosols, Atmos. Chem. Phys., 7, 4639–4659, https://doi.org/10.5194/acp-7-4639-2007, 2007. a
Gasparini, B. and Lohmann, U.: Why cirrus cloud seeding cannot substantially cool the planet, J. Geophys. Res.-Atmos., 121, 4877–4893, 2016. a
Gettelman, A., Lamboll, R., Bardeen, C. G., Forster, P. M., and Watson-Parris, D.: Climate Impacts of COVID–19 Induced Emission Changes, Geophys. Res. Lett., 48, e2020GL091805, https://doi.org/10.1029/2020GL091805, 2021. a, b, c, d
Gkatzelis, G. I., Gilman, J. B., Brown, S. S., Eskes, H., Gomes, A. R., Lange, A. C., McDonald, B. C., Peischl, J., Petzold, A., Thompson, C. R., and Kiendler-Scharr, A.: The global impacts of COVID–19 lockdowns on urban air pollution: A critical review and recommendations, Elementa: Science of the Anthropocene, 9, 00176, https://doi.org/10.1525/elementa.2021.00176, 2021. a, b
Granier, C., Darras, S., Denier van der Gon, H., Doubalova, J., Elguindi, N., Galle, B., Gauss, M., Guevara, M., Jalkanen, J.-P., Kuenen, J., Liousse, C., Quack, B., Simpson, D., and Sindelarova, K.: The Copernicus Atmosphere Monitoring Service global and regional emissions (April 2019 version), Copernicus Atmosphere Monitoring Service (CAMS) report, https://doi.org/10.24380/d0bn-kx16, 2019. a
Guevara, M., Jorba, O., Soret, A., Petetin, H., Bowdalo, D., Serradell, K., Tena, C., Denier van der Gon, H., Kuenen, J., Peuch, V.-H., and Pérez García-Pando, C.: Time-resolved emission reductions for atmospheric chemistry modelling in Europe during the COVID-19 lockdowns, Atmos. Chem. Phys., 21, 773–797, https://doi.org/10.5194/acp-21-773-2021, 2021. a, b
He, G., Pan, Y., and Tanaka, T.: The short-term impacts of COVID–19 lockdown on urban air pollution in China, Nature Sustainability, 3, 1005–1011, https://doi.org/10.1038/s41893-020-0581-y, 2020. a
Hersbach, H., Bell, B., Berrisford, P. et al.: The ERA5 global reanalysis, Q. J. Roy. Meteor. Soc., 146, 1999–2049, 2020. a
Hong, Y., Liu, G., and Li, J.-L.: Assessing the radiative effects of global ice clouds based on CloudSat and CALIPSO measurements, J. Climate, 29, 7651–7674, 2016. a
Jeuken, A., Siegmund, P., Heijboer, L., Feichter, J., and Bengtsson, L.: On the potential of assimilating meteorological analyses in a global climate model for the purpose of model validation, J. Geophys. Res.-Atmos., 101, 16939–16950, 1996. a
Jöckel, P., Tost, H., Pozzer, A., Brühl, C., Buchholz, J., Ganzeveld, L., Hoor, P., Kerkweg, A., Lawrence, M. G., Sander, R., Steil, B., Stiller, G., Tanarhte, M., Taraborrelli, D., van Aardenne, J., and Lelieveld, J.: The atmospheric chemistry general circulation model ECHAM5/MESSy1: consistent simulation of ozone from the surface to the mesosphere, Atmos. Chem. Phys., 6, 5067–5104, https://doi.org/10.5194/acp-6-5067-2006, 2006. a, b
Jöckel, P., Tost, H., Pozzer, A., Kunze, M., Kirner, O., Brenninkmeijer, C. A. M., Brinkop, S., Cai, D. S., Dyroff, C., Eckstein, J., Frank, F., Garny, H., Gottschaldt, K.-D., Graf, P., Grewe, V., Kerkweg, A., Kern, B., Matthes, S., Mertens, M., Meul, S., Neumaier, M., Nützel, M., Oberländer-Hayn, S., Ruhnke, R., Runde, T., Sander, R., Scharffe, D., and Zahn, A.: Earth System Chemistry integrated Modelling (ESCiMo) with the Modular Earth Submodel System (MESSy) version 2.51, Geosci. Model Dev., 9, 1153–1200, https://doi.org/10.5194/gmd-9-1153-2016, 2016. a, b, c, d, e, f
Jones, C. D., Hickman, J. E., Rumbold, S. T. et al.: The climate response to emissions reductions due to COVID-19: Initial results from CovidMIP, Geophys. Res. Lett., 48, e2020GL091883, https://doi.org/10.1029/2020GL091883, 2021. a
Karydis, V., Kumar, P., Barahona, D., Sokolik, I., and Nenes, A.: On the effect of dust particles on global cloud condensation nuclei and cloud droplet number, J. Geophys. Res.-Atmos., 116, D23204, https://doi.org/10.1029/2011JD016283, 2011. a
Karydis, V. A., Tsimpidi, A. P., Bacer, S., Pozzer, A., Nenes, A., and Lelieveld, J.: Global impact of mineral dust on cloud droplet number concentration, Atmos. Chem. Phys., 17, 5601–5621, https://doi.org/10.5194/acp-17-5601-2017, 2017. a
Kloss, C., Berthet, G., Sellitto, P., Ploeger, F., Taha, G., Tidiga, M., Eremenko, M., Bossolasco, A., Jégou, F., Renard, J.-B., and Legras, B.: Stratospheric aerosol layer perturbation caused by the 2019 Raikoke and Ulawun eruptions and their radiative forcing, Atmos. Chem. Phys., 21, 535–560, https://doi.org/10.5194/acp-21-535-2021, 2021. a
Kroll, J. H., Heald, C. L., Cappa, C. D., Farmer, D. K., Fry, J. L., Murphy, J. G., and Steiner, A. L.: The complex chemical effects of COVID–19 shutdowns on air quality, Nature Sustainability, 12, 777–779, https://doi.org/10.1038/s41557-020-0535-z, 2020. a
Krüger, O. O., Holanda, B. A., Chowdhury, S., Pozzer, A., Walter, D., Pöhlker, C., Andrés Hernández, M. D., Burrows, J. P., Voigt, C., Lelieveld, J., Quaas, J., Pöschl, U., and Pöhlker, M. L.: Black carbon aerosol reductions during COVID-19 confinement quantified by aircraft measurements over Europe, Atmos. Chem. Phys., 22, 8683–8699, https://doi.org/10.5194/acp-22-8683-2022, 2022. a
Kumar, P., Sokolik, I. N., and Nenes, A.: Parameterization of cloud droplet formation for global and regional models: including adsorption activation from insoluble CCN, Atmos. Chem. Phys., 9, 2517–2532, https://doi.org/10.5194/acp-9-2517-2009, 2009. a, b
Lamboll, R. D., Jones, C. D., Skeie, R. B., Fiedler, S., Samset, B. H., Gillett, N. P., Rogelj, J., and Forster, P. M.: Modifying emissions scenario projections to account for the effects of COVID-19: protocol for CovidMIP, Geosci. Model Dev., 14, 3683–3695, https://doi.org/10.5194/gmd-14-3683-2021, 2021. a
Larson, E. J. L. and Portmann, R. W.: Anthropogenic aerosol drives uncertainty in future climate mitigation efforts, Sci. Rep.-UK, 9, 16538, https://doi.org/10.1038/s41598-019-52901-3, 2019. a
Le Quéré, C., Jackson, R. B., Jones, M. W., Smith, A. J. P., Abernethy, S., Andrew, R. M., De-Gol, A. J., Willis, D. R., Shan, Y., Canadell, J. G., Friedlingstein, P., Creutzig, F., and Peters, G. P.: Temporary reduction in daily global CO2 emissions during the COVID–19 forced confinement, Nat. Clim. Change, 10, 647–653, https://doi.org/10.1038/s41558-020-0797-x, 2020. a
Lee, S.-S., Chu, J.-E., Timmermann, A., Chung, E.-S., and Lee, J.-Y.: East Asian climate response to COVID-19 lockdown measures in China, Sci. Rep.-UK, 11, 1–9, 2021. a
Lelieveld, J. and Heintzenberg, J.: Sulfate cooling effect on climate through in-cloud oxidation of anthropogenic SO2, Science, 258, 117–120, 1992. a
Lelieveld, J., Evans, J. S., Fnais, M., Giannadaki, D., and Pozzer, A.: The contribution of outdoor air pollution sources to premature mortality on a global scale, Nature, 525, 367–371, https://doi.org/10.1038/nature15371, 2015. a
Lelieveld, J., Klingmüller, K., Pozzer, A., Burnett, R. T., Haines, A., and Ramanathan, V.: Effects of fossil fuel and total anthropogenic emission removal on public health and climate, P. Natl. Acad. Sci. USA, 116, 7192–7197, https://doi.org/10.1073/pnas.1819989116, 2019. a
Lelieveld, J., Pozzer, A., Pöschl, U., Fnais, M., Haines, A., and Münzel, T.: Loss of life expectancy from air pollution compared to other risk factors: a worldwide perspective, Cardiovasc. Res., 116, 1910–1917, https://doi.org/10.1093/cvr/cvaa025, 2020. a
Liu, F., Page, A., Strode, S. A., Yoshida, Y., Choi, S., Zheng, B., Lamsal, L. N., Li, C., Krotkov, N. A., Eskes, H., van der A, R., Veefkind, P., Levelt, P. F., Hauser, O. P., and Joiner, J.: Abrupt decline in tropospheric nitrogen dioxide over China after the outbreak of COVID–19, Science Advances, 6, eabc2992, https://doi.org/10.1126/sciadv.abc2992, 2020. a
Löffler, M., Brinkop, S., and Jöckel, P.: Impact of major volcanic eruptions on stratospheric water vapour, Atmos. Chem. Phys., 16, 6547–6562, https://doi.org/10.5194/acp-16-6547-2016, 2016. a
Lohmann, U. and Feichter, J.: Global indirect aerosol effects: a review, Atmos. Chem. Phys., 5, 715–737, https://doi.org/10.5194/acp-5-715-2005, 2005. a
Lohmann, U. and Hoose, C.: Sensitivity studies of different aerosol indirect effects in mixed-phase clouds, Atmos. Chem. Phys., 9, 8917–8934, https://doi.org/10.5194/acp-9-8917-2009, 2009. a
Lohmann, U. and Kärcher, B.: First interactive simulations of cirrus clouds formed by homogeneous freezing in the ECHAM general circulation model, J. Geophys. Res.-Atmos., 107, AAC-8, 2002. a
Lohmann, U. and Roeckner, E.: Design and performance of a new cloud microphysics scheme developed for the ECHAM general circulation model, Clim. Dynam., 12, 557–572, 1996. a
Lohmann, U., Feichter, J., Chuang, C. C., and Penner, J. E.: Prediction of the number of cloud droplets in the ECHAM GCM, J. Geophys. Res.-Atmos., 104, 9169–9198, 1999. a
Lohmann, U., Stier, P., Hoose, C., Ferrachat, S., Kloster, S., Roeckner, E., and Zhang, J.: Cloud microphysics and aerosol indirect effects in the global climate model ECHAM5-HAM, Atmos. Chem. Phys., 7, 3425–3446, https://doi.org/10.5194/acp-7-3425-2007, 2007. a
McMurry, P. H. and Wilson, J. C.: Droplet phase (Heterogeneous) and gas phase (homogeneous) contributions to secondary ambient aerosol formation as functions of relative humidity, J. Geophys. Res.-Oceans, 88, 5101–5108, https://doi.org/10.1029/JC088iC09p05101, 1983. a
Mertens, M., Jöckel, P., Matthes, S., Nützel, M., Grewe, V., and Sausen, R.: COVID–19 induced lower-tropospheric ozone changes, Environ. Res. Lett., 16, 064005, https://doi.org/10.1088/1748-9326/abf191, 2021. a, b
MESSy: Modular Earth Submodel System, MESSy [code], http://www.messy-interface.org, last access: 22 July 2022. a
Myhre, G., Shindell, D., Bréon, F.-M., Collins, W., Fuglestvedt, J., Huang, J., Koch, D., Lamarque, J.-F., Lee, D., Mendoza, B., Nakajima, T., Robock, A., Stephens, G., Takemura, T., and Zhang, H.: IPCC AR5, WG1, Chapter 8: Anthropogenic and Natural Radiative Forcing, Cambridge University Press, Cambridge, United Kingdom and New York, NY, USA, https://archive.ipcc.ch/pdf/assessment-report/ar5/wg1/WG1AR5_Chapter08_FINAL.pdf (last access: 22 July 2022), 2013. a, b, c, d, e
Neubauer, D., Ferrachat, S., Siegenthaler-Le Drian, C., Stier, P., Partridge, D. G., Tegen, I., Bey, I., Stanelle, T., Kokkola, H., and Lohmann, U.: The global aerosol–climate model ECHAM6.3–HAM2.3 – Part 2: Cloud evaluation, aerosol radiative forcing, and climate sensitivity, Geosci. Model Dev., 12, 3609–3639, https://doi.org/10.5194/gmd-12-3609-2019, 2019. a
Nordeng, T. E.: Extended versions of the convective parametrization scheme at ECMWF and their impact on the mean and transient activity of the model in the tropics, ECMWF Tech. Memo., no. 206, 09/1994 https://doi.org/10.21957/e34xwhysw, 1994. a
Petetin, H., Bowdalo, D., Soret, A., Guevara, M., Jorba, O., Serradell, K., and Pérez García-Pando, C.: Meteorology-normalized impact of the COVID-19 lockdown upon NO2 pollution in Spain, Atmos. Chem. Phys., 20, 11119–11141, https://doi.org/10.5194/acp-20-11119-2020, 2020. a
Petters, M. D. and Kreidenweis, S. M.: A single parameter representation of hygroscopic growth and cloud condensation nucleus activity, Atmos. Chem. Phys., 7, 1961–1971, https://doi.org/10.5194/acp-7-1961-2007, 2007. a
Phillips, V. T., Demott, P. J., Andronache, C., Pratt, K. A., Prather, K. A., Subramanian, R., and Twohy, C.: Improvements to an empirical parameterization of heterogeneous ice nucleation and its comparison with observations, J. Atmos. Sci., 70, 378–409, 2013. a
Pozzer, A., Reifenberg, S. F., Kumar, V., Franco, B., Kohl, M., Taraborrelli, D., Gromov, S., Ehrhart, S., Jöckel, P., Sander, R., Fall, V., Rosanka, S., Karydis, V., Akritidis, D., Emmerichs, T., Crippa, M., Guizzardi, D., Kaiser, J. W., Clarisse, L., Kiendler-Scharr, A., Tost, H., and Tsimpidi, A.: Simulation of organics in the atmosphere: evaluation of EMACv2.54 with the Mainz Organic Mechanism (MOM) coupled to the ORACLE (v1.0) submodel, Geosci. Model Dev., 15, 2673–2710, https://doi.org/10.5194/gmd-15-2673-2022, 2022. a
Pringle, K. J., Tost, H., Message, S., Steil, B., Giannadaki, D., Nenes, A., Fountoukis, C., Stier, P., Vignati, E., and Lelieveld, J.: Description and evaluation of GMXe: a new aerosol submodel for global simulations (v1), Geosci. Model Dev., 3, 391–412, https://doi.org/10.5194/gmd-3-391-2010, 2010. a, b
Quaas, J., Gryspeerdt, E., Vautard, R., and Boucher, O.: Climate impact of aircraft-induced cirrus assessed from satellite observations before and during COVID–19, Environ. Res. Lett., 16, 061051, https://doi.org/10.1088/1748-9326/abf686, 2021. a
Righi, M., Hendricks, J., and Beer, C. G.: Exploring the uncertainties in the aviation soot–cirrus effect, Atmos. Chem. Phys., 21, 17267–17289, https://doi.org/10.5194/acp-21-17267-2021, 2021. a
Roeckner, E., Bäuml, G., Bonaventura, L., Brokopf, R., Esch, M., Giorgetta, M., Hagemann, S., Kirchner, I., Kornblueh, L., Manzini, E., Rhodin, A., Schlese, U., Schulzweida, U., and Tompkins, A.: The atmospheric general circulation model ECHAM 5. PART I: Model description, Max-Planck-Institut für Meteorologie Number, 340, http://hdl.handle.net/11858/00-001M-0000-0012-0144-5 (last access: 29 July 2022) 2003. a
Roeckner, E., Brokopf, R., Esch, M., Giorgetta, M., Hagemann, S., Kornblueh, L., Manzini, E., Schlese, U., and Schulzweida, U.: Sensitivity of simulated climate to horizontal and vertical resolution in the ECHAM5 atmosphere model, J. Climate, 19, 3771–3791, 2006. a
Schumann, U., Bugliaro, L., Dörnbrack, A., Baumann, R., and Voigt, C.: Aviation Contrail Cirrus and Radiative Forcing Over Europe During 6 Months of COVID-19, Geophys. Res. Lett., 48, e2021GL092771, https://doi.org/10.1029/2021GL092771, 2021a. a
Schumann, U., Poll, I., Teoh, R., Koelle, R., Spinielli, E., Molloy, J., Koudis, G. S., Baumann, R., Bugliaro, L., Stettler, M., and Voigt, C.: Air traffic and contrail changes over Europe during COVID-19: a model study, Atmos. Chem. Phys., 21, 7429–7450, https://doi.org/10.5194/acp-21-7429-2021, 2021b. a, b
Seinfeld, J. and Pandis, S.: Atmospheric Chemistry and Physics, 1997, Wiley, New York TS31, ISBN 978-1-118-94740-1, New York, 2008. a
Shindell, D. T., Lamarque, J.-F., Schulz, M., Flanner, M., Jiao, C., Chin, M., Young, P. J., Lee, Y. H., Rotstayn, L., Mahowald, N., Milly, G., Faluvegi, G., Balkanski, Y., Collins, W. J., Conley, A. J., Dalsoren, S., Easter, R., Ghan, S., Horowitz, L., Liu, X., Myhre, G., Nagashima, T., Naik, V., Rumbold, S. T., Skeie, R., Sudo, K., Szopa, S., Takemura, T., Voulgarakis, A., Yoon, J.-H., and Lo, F.: Radiative forcing in the ACCMIP historical and future climate simulations, Atmos. Chem. Phys., 13, 2939–2974, https://doi.org/10.5194/acp-13-2939-2013, 2013. a
Sicard, P., De Marco, A., Agathokleous, E., Feng, Z., Xu, X., Paoletti, E., Rodriguez, J. J. D., and Calatayud, V.: Amplified ozone pollution in cities during the COVID-19 lockdown, Sci. Total Environ., 735, 139542, https://doi.org/10.1016/j.scitotenv.2020.139542, 2020. a
Steinbrecht, W., Kubistin, D., Plass-Dülmer, C., Davies, J., Tarasick, D. W., v. d. Gathen, P., Deckelmann, H., Jepsen, N., Kivi, R., Lyall, N., Palm, M., Notholt, J., Kois, B., Oelsner, P., Allaart, M., Piters, A., Gill, M., Van Malderen, R., Delcloo, A. W., Sussmann, R., Mahieu, E., Servais, C., Romanens, G., Stübi, R., Ancellet, G., Godin-Beekmann, S., Yamanouchi, S., Strong, K., Johnson, B., Cullis, P., Petropavlovskikh, I., Hannigan, J. W., Hernandez, J.-L., Rodriguez, A. D., Nakano, T., Chouza, F., Leblanc, T., Torres, C., Garcia, O., Röhling, A. N., Schneider, M., Blumenstock, T., Tully, M., Paton-Walsh, C., Jones, N., Querel, R., Strahan, S., Stauffer, R. M., Thompson, A. M., Inness, A., Engelen, R., Chang, K.-L., and Cooper, O. R.: COVID–19 Crisis Reduces Free Tropospheric Ozone across the Northern Hemisphere, Geophys. Res. Lett., 48, e2020GL091987, https://doi.org/10.1029/2020GL091987, 2021. a
Sundqvist, H., Berge, E., and Kristjánsson, J. E.: Condensation and cloud parameterization studies with a mesoscale numerical weather prediction model, Mon. Weather Rev., 117, 1641–1657, 1989. a, b
Tiedtke, M.: A Comprehensive Mass Flux Scheme for Cumulus Parameterization in Large-Scale Models, Mon. Weather Rev., 117, 1779–1800, https://doi.org/10.1175/1520-0493(1989)117<1779:ACMFSF>2.0.CO;2, 1989. a
Tobías, A., Carnerero, C., Reche, C., Massagué, J., Via, M., Minguillón, M. C., Auey, A., and Querol, X.: Changes in air quality during the lockdown in Barcelona (Spain) one month into the SARS-CoV-2 epidemic, Sci. Total Environ., 726, 138540, https://doi.org/10.1016/j.scitotenv.2020.138540, 2020. a
Tost, H., Jöckel, P., and Lelieveld, J.: Influence of different convection parameterisations in a GCM, Atmos. Chem. Phys., 6, 5475–5493, https://doi.org/10.5194/acp-6-5475-2006, 2006. a
Tsimpidi, A. P., Karydis, V. A., Pozzer, A., Pandis, S. N., and Lelieveld, J.: ORACLE (v1.0): module to simulate the organic aerosol composition and evolution in the atmosphere, Geosci. Model Dev., 7, 3153–3172, https://doi.org/10.5194/gmd-7-3153-2014, 2014. a
Twomey, S.: The nuclei of natural cloud formation part II: The supersaturation in natural clouds and the variation of cloud droplet concentration, Geofisica pura e applicata, 43, 243–249, https://doi.org/10.1007/BF01993560, 1959. a
Venter, Z. S., Aunan, K., Chowdhury, S., and Lelieveld, J.: COVID-19 lockdowns cause global air pollution declines, P. Natl. Acad. Sci. USA, 117, 18984–18990, https://doi.org/10.1073/pnas.2006853117, 2020. a
Voigt, C., Lelieveld, J., Schlager, H., Schneider, J., Curtius, J., Meerkötter, R., Sauer, D., Bugliaro, L., Bohn, B., Crowley, J. N., Erbertseder, T., Groß, S., Hahn, V., Li, Q., Mertens, M., Pöhlker, M., Pozzer, A., Schumann, U., Tomsche, L., Williams, J., Zahn, A., Andreae, M., Borrmann, S., Bräuer, T., Dörich, R., Dörnbrack, A., Edtbauer, A., Ernle, L., Fischer, H., Giez, A., Granzin, M., Grewe, V., Harder, H., Heinritzi, M., Holanda, B., Jöckel, P., Kaiser, K., Krüger, O., Lucke, J., Marsing, A., Martin, A., Matthes, S., Pöhlker, C., Pöschl, U., Reifenberg, S., Ringsdorf, A., Scheibe, M., Tadic, I., Zauner-Wieczorek, M., Henke, R., and Rapp, M.: Cleaner skies during the COVID-19 lockdown, B. Am. Meteorol. Soc., Boston MA, USA, https://doi.org/10.1175/BAMS-D-21-0012.1, 2022. a, b, c
Xu, L. and Penner, J. E.: Global simulations of nitrate and ammonium aerosols and their radiative effects, Atmos. Chem. Phys., 12, 9479–9504, https://doi.org/10.5194/acp-12-9479-2012, 2012. a
Yoon, J., Chang, D., Lelieveld, J., Pozzer, A., Kim, J., and Yum, S.: Empirical evidence of a positive climate forcing of aerosols at elevated albedo, Atmos. Res., 229, 269–279, 2019. a